Cumulus Media Reports Operating Results for the First Quarter 2022
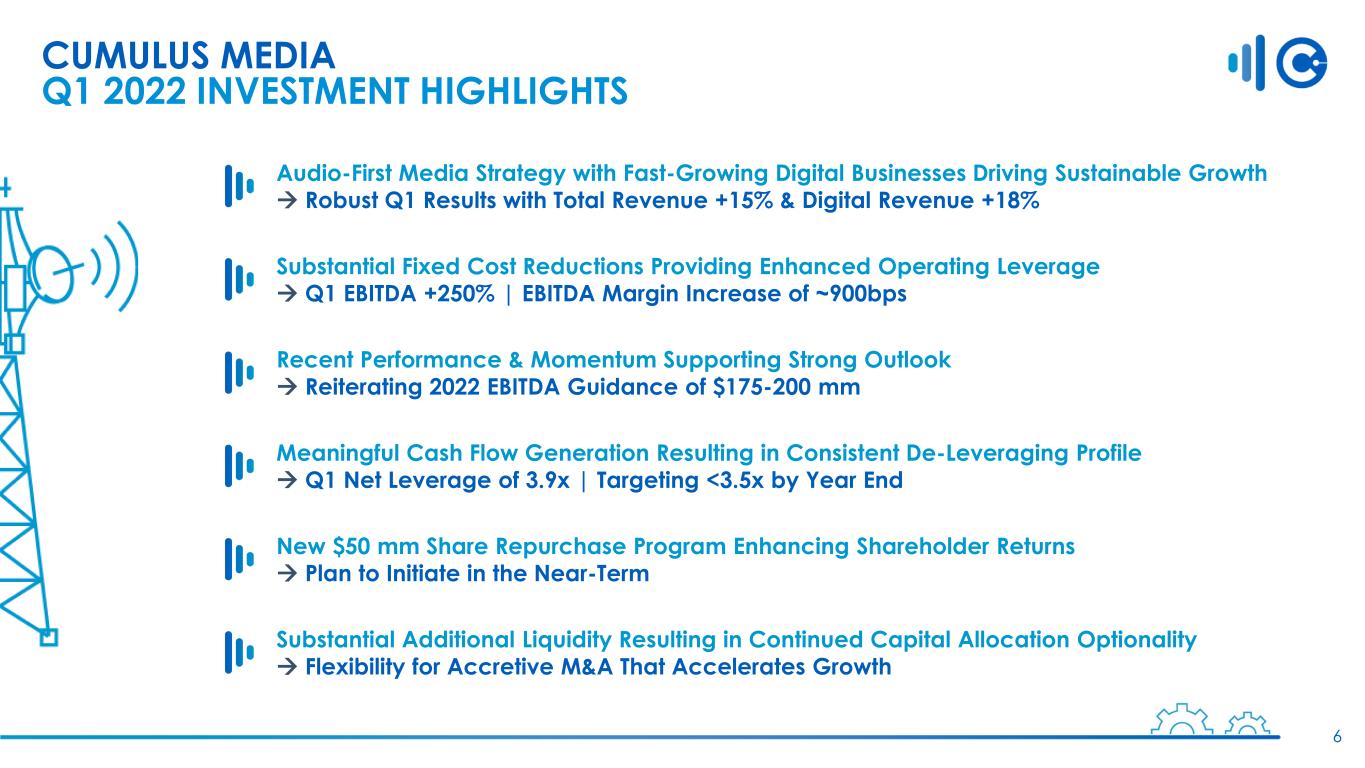
Delivers Strong Q1 Earnings Results with Total Revenue Up 15% Led by Digital Revenue Growth of 18%
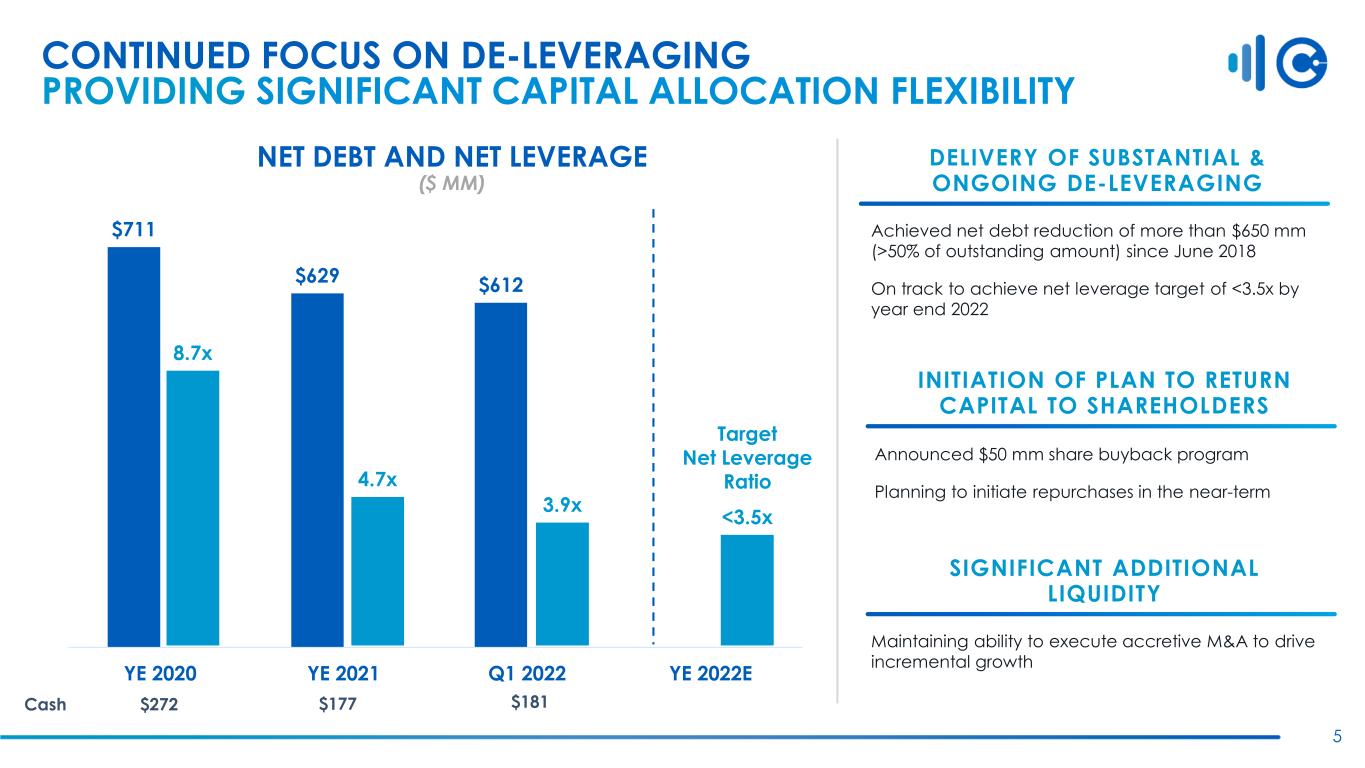
Achieves Lowest Net Leverage Ratio in More Than a Decade and Best Among Peers
Announcing $50 Million Share Repurchase Program
ATLANTA, GA — May 4, 2022: Cumulus Media Inc. (NASDAQ: CMLS) (the "Company," "Cumulus Media," "we," "us," or "our") today announced operating results for the three months ended March 31, 2022.
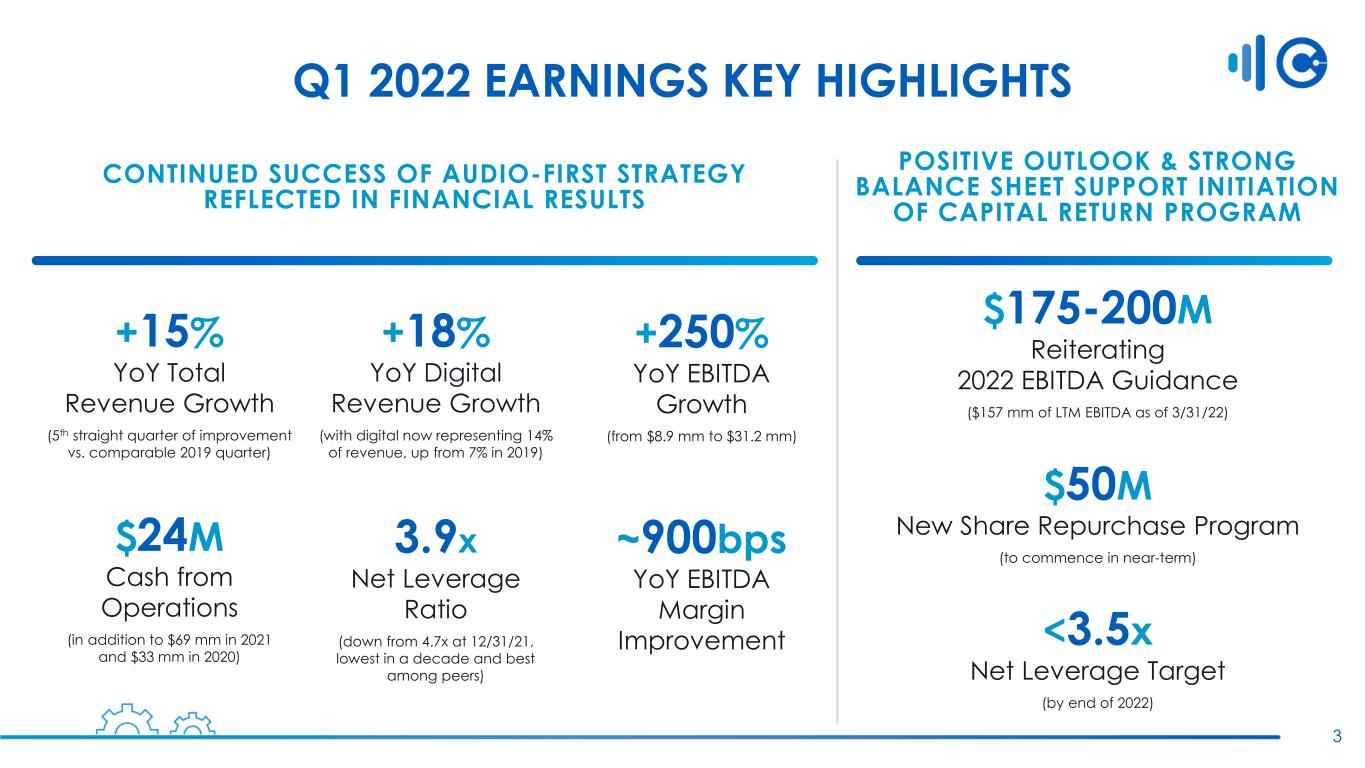
Mary G. Berner, President and Chief Executive Officer of Cumulus Media, said, "Our outstanding first quarter results once again demonstrate the positive impacts of our ‘audio-first’ strategy to transform the Company from a one-dimensional radio broadcaster to a multi-dimensional audio media company. Following a strong 2021 performance, this quarter’s results underscore our ability to deliver value to our shareholders through sustained profitable top- and bottom-line growth and balance sheet de-levering. We delivered sequential revenue improvement for the fifth straight quarter versus the comparable 2019 quarter, grew EBITDA by 250% year-over-year, and generated continued strong cash from operations, which collectively allowed us to achieve the Company’s lowest net leverage in over a decade."
Berner added, "Given our best-among-peers balance sheet, strong financial momentum and the Company’s positive 2022 outlook, we expect ongoing cash flow generation that will support a meaningful return of capital to shareholders now and in the future. Accordingly, as a first step, today we are announcing a $50 million share repurchase program with a plan to commence share repurchases in the near-term. This capital return program is underpinned by our continued belief that the Company is significantly undervalued."
Key Financial Highlights:
•Increased first quarter revenue by 15% year-over-year
◦Fifth straight quarter of sequential improvement in revenue performance vs. comparable quarter in 2019
◦Digital revenue up 18% led by digital marketing services, up 35%, and podcasting, up 22%
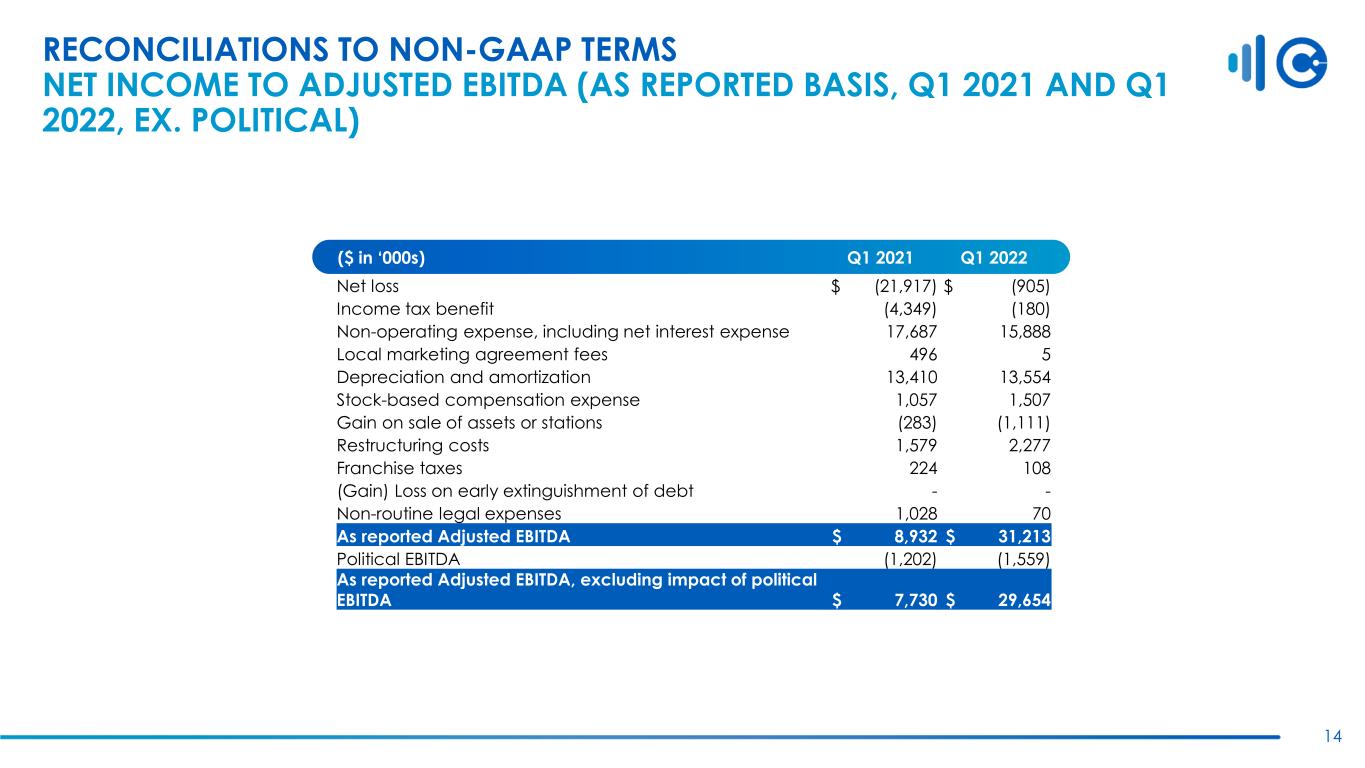
•Recorded first quarter net loss of $0.9 million compared to a net loss of $21.9 million in Q1 2021
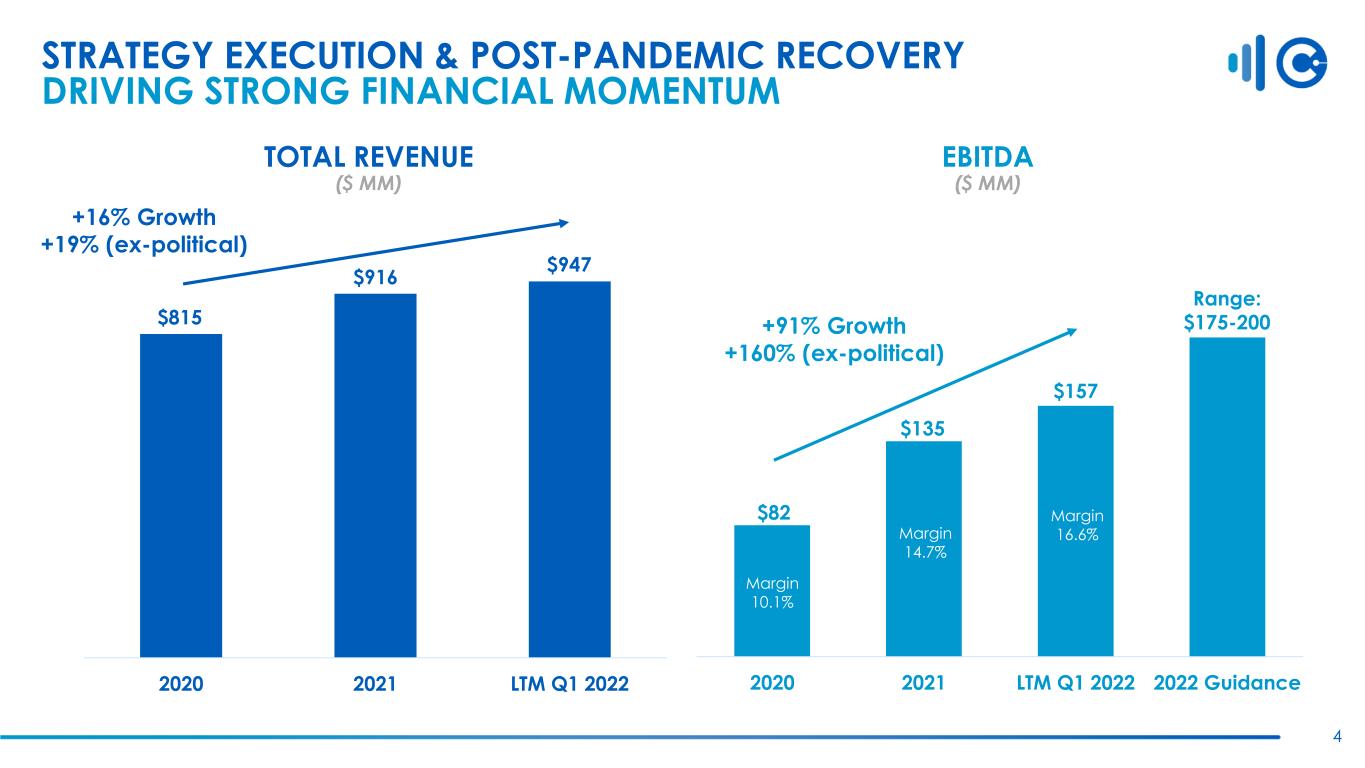
•Achieved first quarter EBITDA of $31.2 million, an increase of 250% year-over-year, with year-over-year EBITDA margin improvement of approximately 900 basis points, driven by permanent fixed cost reductions
•Reduced net leverage(1) to the lowest levels in more than a decade – best among peers
◦Generated $24.3 million of cash from operations and finished quarter with $181 million of cash
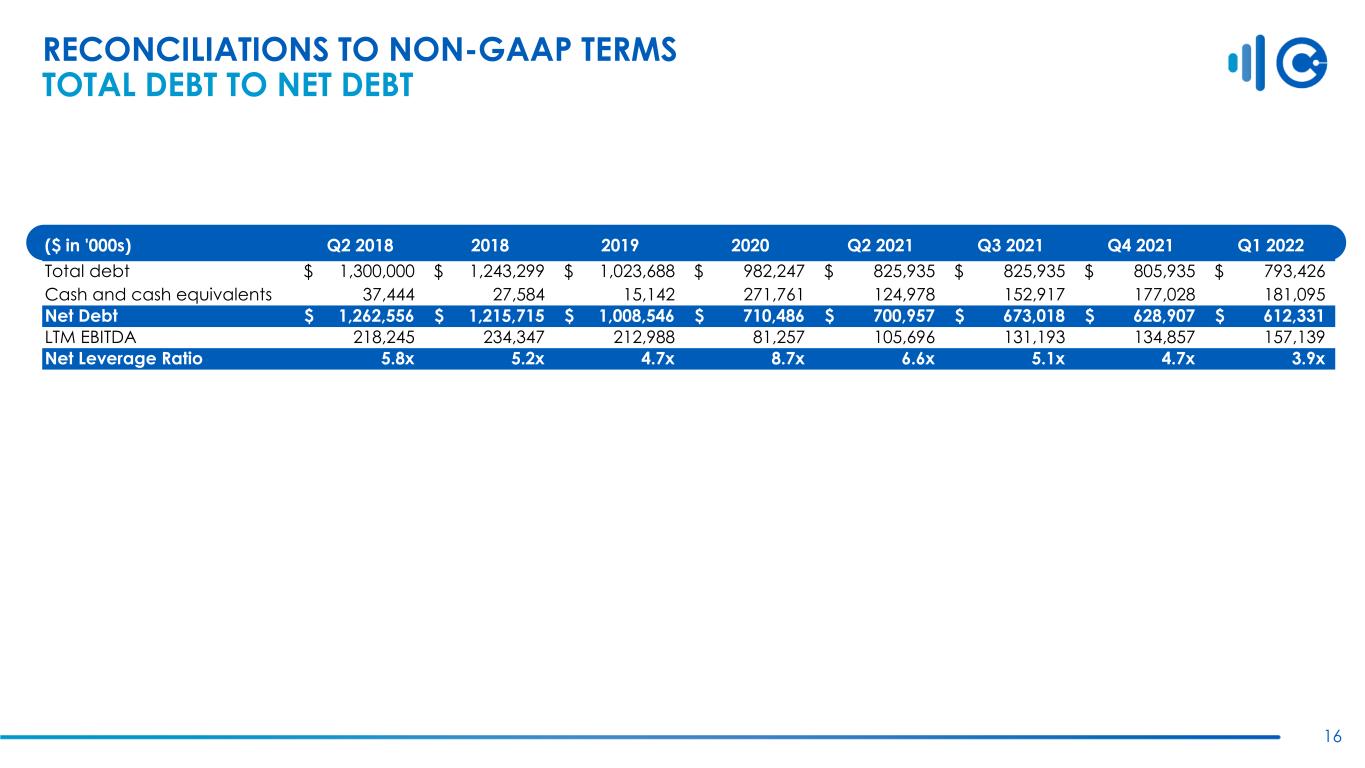
◦Reported total debt of $793 million at 3/31/22 and net debt(1) of $612 million
◦Reduced net leverage from 4.7x at 12/31/2021 to 3.9x at 3/31/22
•Reiterating full year EBITDA(1) guidance range of $175 to $200 million(2)
•Announcing $50 million share repurchase program with plan to commence repurchases in the near-term
Operating Summary (dollars in thousands, except percentages and per share data):
For the three months ended March 31, 2022, the Company reported net revenue of $232.0 million, an increase of 15.0% from the three months ended March 31, 2021, net loss of $0.9 million and Adjusted EBITDA of $31.2 million.
| As Reported | Three Months Ended March 31, 2022 | Three Months Ended March 31, 2021 | % Change | ||||||||||||||
| Net revenue | $ | 232,032 | $ | 201,728 | 15.0 | % | |||||||||||
| Net loss | $ | (905) | $ | (21,917) | (95.9) | % | |||||||||||
Adjusted EBITDA (1) | $ | 31,213 | $ | 8,932 | 249.5 | % | |||||||||||
| Basic loss per share | $ | (0.04) | $ | (1.07) | (96.3) | % | |||||||||||
| Diluted income loss per share | $ | (0.04) | $ | (1.07) | (96.3) | % | |||||||||||
Revenue Detail Summary (dollars in thousands):
| As Reported | Three Months Ended March 31, 2022 | Three Months Ended March 31, 2021 | % Change | ||||||||||||||
| Broadcast radio revenue: | |||||||||||||||||
| Spot | $ | 103,913 | $ | 92,896 | 11.9 | % | |||||||||||
| Network | 65,273 | 62,030 | 5.2 | % | |||||||||||||
| Total broadcast radio revenue | 169,186 | 154,926 | 9.2 | % | |||||||||||||
| Digital | 31,893 | 27,078 | 17.8 | % | |||||||||||||
| Other | 30,953 | 19,724 | 56.9 | % | |||||||||||||
Net revenue | $ | 232,032 | $ | 201,728 | 15.0 | % | |||||||||||
(1)Net leverage is as defined in our Senior Credit Facility. Net leverage, net debt and Adjusted EBITDA are not financial measures calculated or presented in accordance with accounting principles generally accepted in the United States of America (“GAAP”). For additional information, see “Non-GAAP Financial Measures.”
(2)With respect to our forward-looking guidance, no reconciliation between a non-GAAP measure to the closest corresponding GAAP measure is included because we are unable to quantify certain amounts that would be required to be included in the GAAP measure without unreasonable efforts, and we believe such reconciliations would imply a degree of precision that would be confusing or misleading to investors. In particular, a reconciliation of forward-looking Adjusted EBITDA to the closest corresponding GAAP measure is not available without unreasonable efforts on a forward-looking basis due to the high variability, complexity and low visibility with respect to the amounts required to reconcile such measure. The unavailable information could have a significant impact on the company's future financial results.
2
Balance Sheet Summary (dollars in thousands):
| March 31, 2022 | December 31, 2021 | |||||||||||||
| Cash and cash equivalents | $ | 181,095 | $ | 177,028 | ||||||||||
Term loan due 2026 (3) | $ | 343,731 | $ | 356,240 | ||||||||||
6.75% Senior notes (3) | $ | 449,695 | $ | 449,695 | ||||||||||
| Three Months Ended March 31, 2022 | Three Months Ended March 31, 2021 | ||||||||||
| Capital expenditures | $ | 5,269 | $ | 2,890 | |||||||
(3)Excludes unamortized debt issuance costs.
Share Repurchase Program
On May 3, 2022, the Board of Directors authorized a share repurchase program for up to $50 million of outstanding Class A common stock, with a plan to commence share repurchases in the near term. Purchases made pursuant to the program may be made from time to time, at the Company’s discretion, in the open market, through privately negotiated transactions or through other manners as permitted by federal securities laws including, but not limited to, 10b5-1 trading plans, accelerated stock repurchase programs and tender offers. The specific timing, manner, price and amount of any repurchases will be determined by the Company and may be subject to economic and market conditions, stock price, applicable legal requirements and other factors.
3
Earnings Conference Call Details
The Company will host a conference call today at 8:30 AM ET to discuss its first quarter operating results. NetRoadshow (NRS) is the service provider for this call. They will require email address verification (one-time only) and will provide registration confirmation. To participate in the conference call, please register in advance using the link on the Company's investor relations website at www.cumulusmedia.com/investors. Upon completing registration, a calendar invitation will follow with call access details, including a unique PIN, and replay details.
To join by phone with operator-assisted dial-in, domestic callers should dial 833-470-1428 and international callers should dial 404-975-4839. If prompted, the participant access code is 793501. Please call five to ten minutes in advance to ensure that you are connected prior to the call.
The conference call will also be broadcast live in listen-only mode through a link on the Company’s investor relations website at www.cumulusmedia.com/investors. This link can also be used to access a recording of the call, which will be available shortly following its completion.
Please see an update to the Company’s investor presentation on the Company's investor relations website at www.cumulusmedia.com/investors, which may be referenced on the conference call. Unless otherwise specified, information contained in the investor presentation or on our website is not incorporated into this press release or other documents we file with, or furnish to, the SEC.
Forward-Looking Statements
Certain statements in this release may constitute “forward-looking” statements within the meaning of the Private Securities Litigation Reform Act of 1995 and other federal securities laws. Such statements are statements other than historical fact and relate to our intent, belief or current expectations primarily with respect to our future operating, financial, and strategic performance and our plans and objectives, including with regard to returning capital to shareholders. Any such forward-looking statements are not guarantees of future performance and involve risks, uncertainties and other factors that may cause actual results, performance or achievements to differ from those contained in or implied by the forward-looking statements as a result of various factors. Such factors include, among others, risks and uncertainties related to the implementation of our strategic operating plans, the evolving and uncertain nature of the COVID-19 pandemic and its impact on the Company, the amount and frequency of our shareholder capital returns, future actions that may be taken in furtherance of the unsolicited indication of interest received by the Company, the rapidly changing and competitive media industry, the economy in general and other risk factors described under “Risk Factors” in the Company’s Form 10-K for the year ended December 31, 2021 as well as in the Company’s other filings with the Securities and Exchange Commission. You should not rely on forward-looking statements since they involve known and unknown risks, uncertainties and other factors that are, in some cases, beyond the Company’s control, and the unexpected occurrence or failure to occur of any such events or matters could cause our actual results, performance, financial condition or achievements to differ materially from those expressed or implied by such forward-looking statements. Cumulus Media assumes no responsibility to update any forward-looking statements, which are based upon expectations as of the date hereof, as a result of new information, future events or otherwise.
About Cumulus Media
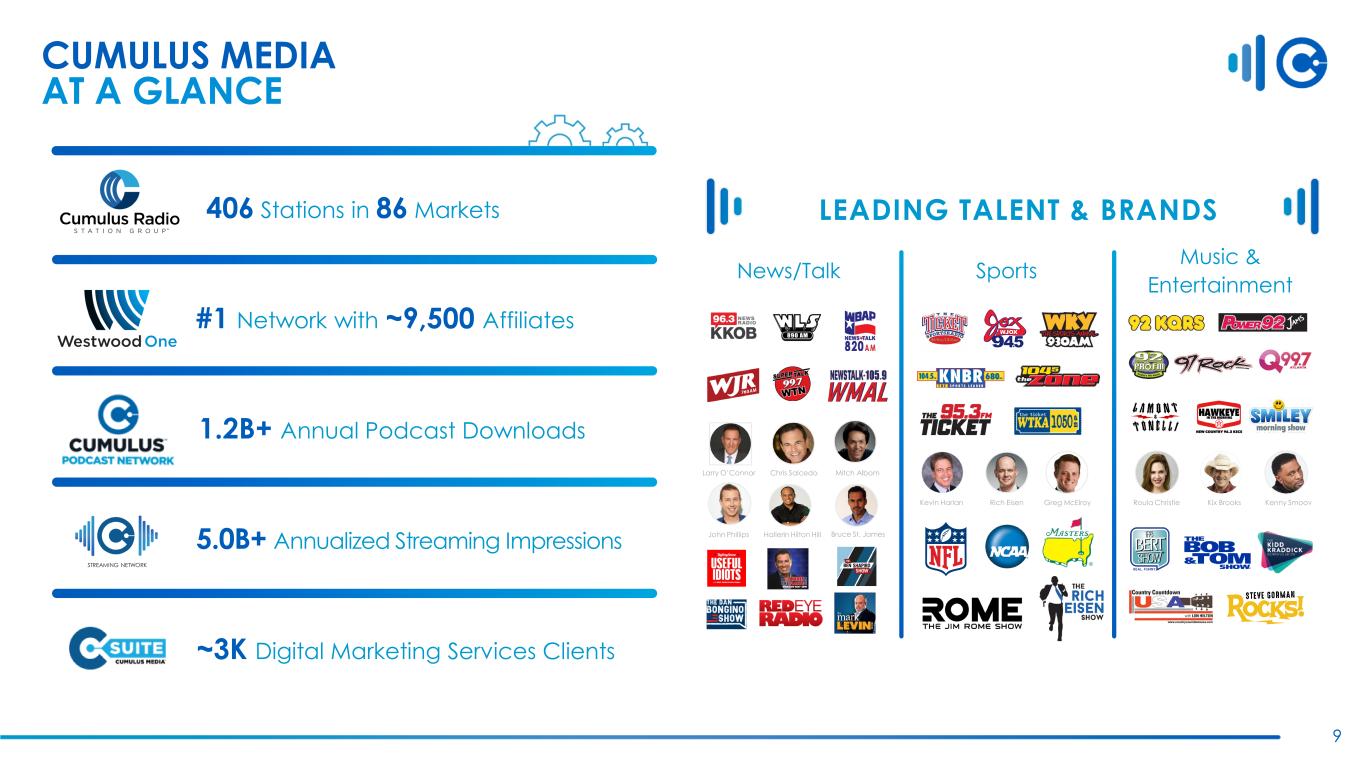
Cumulus Media (NASDAQ: CMLS) is an audio-first media company delivering premium content to over a quarter billion people every month — wherever and whenever they want it. Cumulus Media engages listeners with high-quality local programming through 406 owned-and-operated radio stations across 86 markets; delivers nationally-syndicated sports, news, talk, and entertainment programming from iconic brands including the NFL, the NCAA, the Masters, CNN, the AP, the Academy of Country Music Awards, and many other world-class partners across more than 9,500 affiliated stations through Westwood One, the largest audio network in America; and inspires listeners through the Cumulus Podcast Network, its rapidly growing network of original podcasts that are smart, entertaining and thought-provoking. Cumulus Media provides advertisers with personal connections, local impact and national reach through broadcast and on-demand digital, mobile, social, and voice-activated platforms, as well as integrated digital marketing services, powerful influencers, full-service audio solutions, industry-leading research and insights, and live event experiences. Cumulus Media is the only audio media company to provide marketers with local and national advertising performance guarantees. For more information visit www.cumulusmedia.com.
4
Non-GAAP Financial Measures
From time to time, we utilize certain financial measures that are not prepared or calculated in accordance with GAAP to assess our financial performance and profitability. Consolidated adjusted earnings before interest, taxes, depreciation, and amortization ("Adjusted EBITDA" or "EBITDA") is the financial metric by which management and the chief operating decision maker allocate resources of the Company and analyze the performance of the Company as a whole. Management also uses this measure to determine the contribution of our core operations to the funding of our corporate resources utilized to manage our operations and the funding of our non-operating expenses including debt service and acquisitions. In addition, consolidated Adjusted EBITDA is a key metric for purposes of calculating and determining our compliance with certain covenants contained in our Refinanced Credit Agreement.
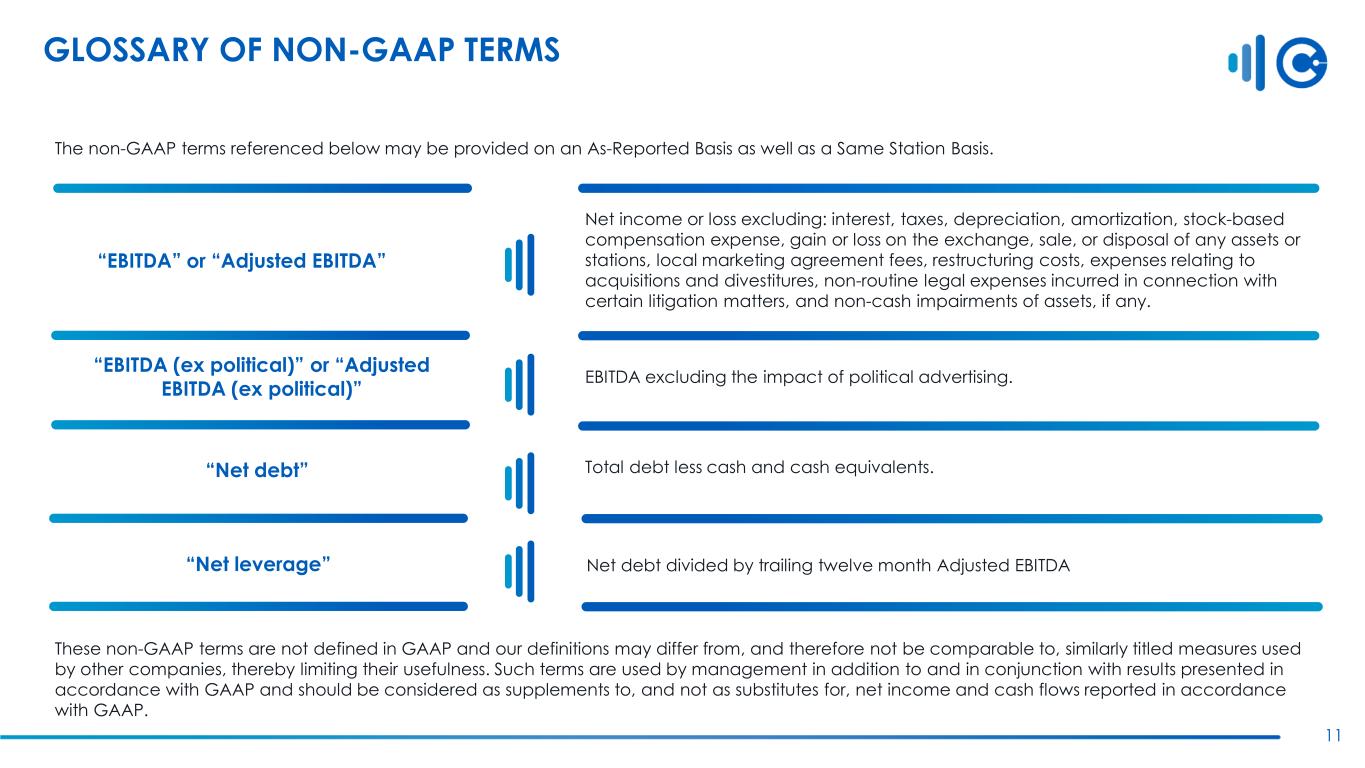
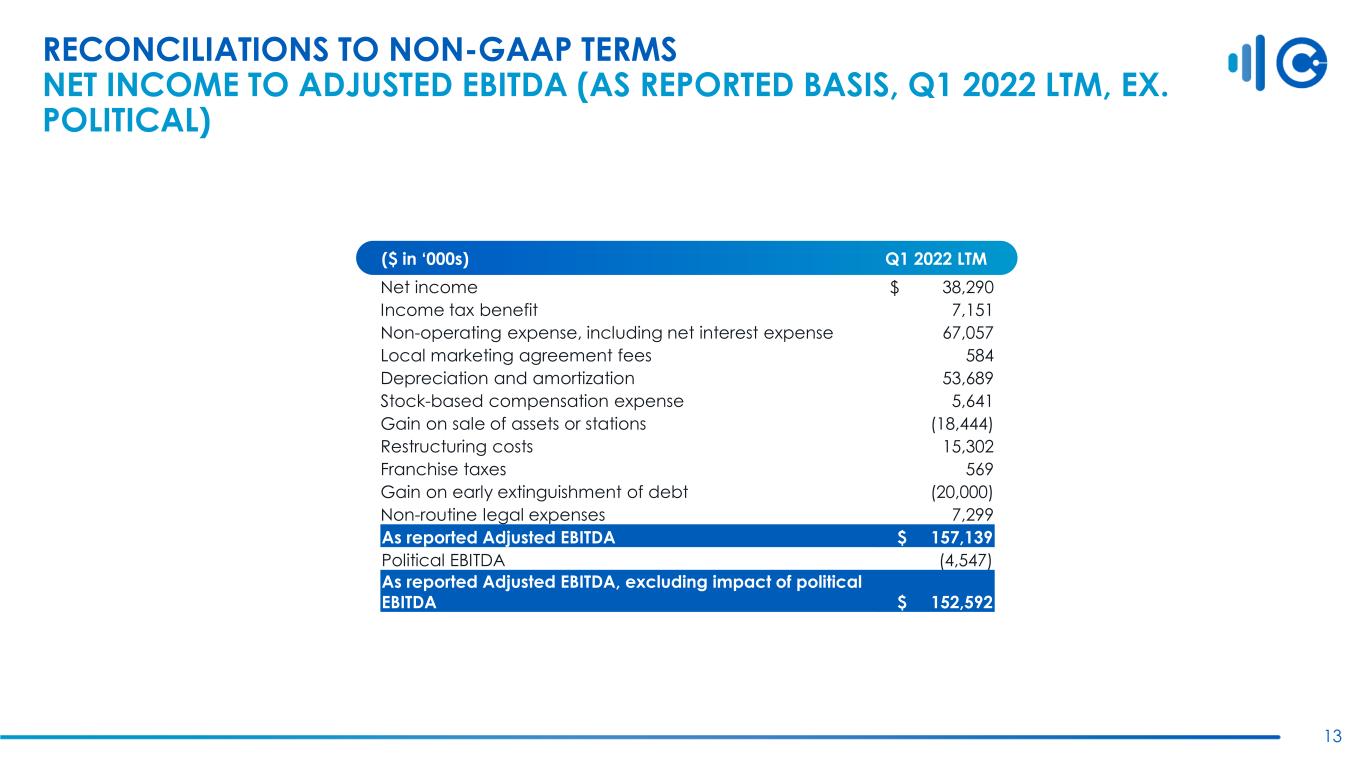
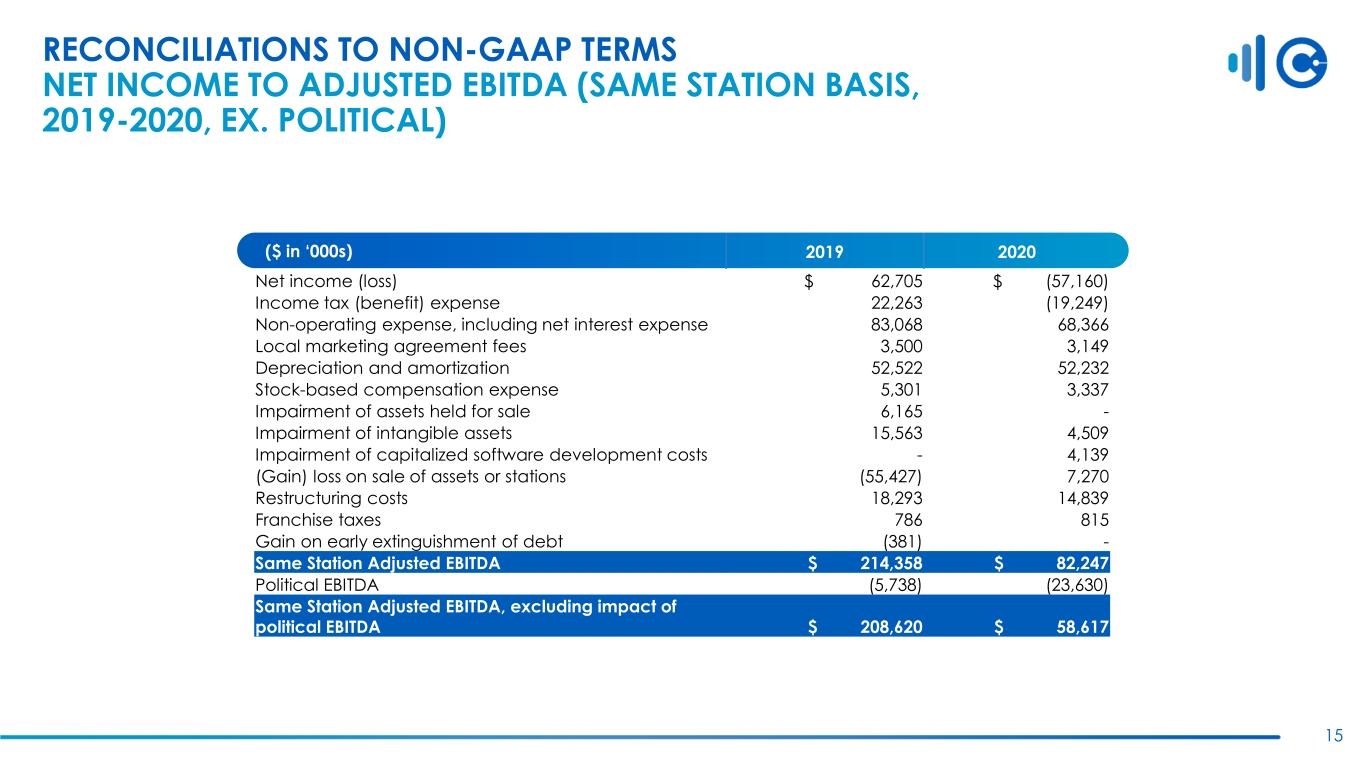
In determining Adjusted EBITDA, we exclude the following from net loss: interest, taxes, depreciation, amortization, stock-based compensation expense, gain or loss on the exchange, sale, or disposal of any assets or stations or early extinguishment of debt, local marketing agreement fees, restructuring costs, expenses relating to acquisitions and divestitures, non-routine legal expenses incurred in connection with certain litigation matters, and non-cash impairments of assets, if any.
Management believes that Adjusted EBITDA, with and excluding impact of political advertising, although not a measure that is calculated in accordance with GAAP, is commonly employed by the investment community as a measure for determining the market value of a media company and comparing the operational and financial performance among media companies. Management has also observed that Adjusted EBITDA, with and excluding impact of political advertising, is routinely utilized to evaluate and negotiate the potential purchase price for media companies. Given the relevance to our overall value, management believes that investors consider the metric to be extremely useful.
The Company presents revenue, excluding impact of political revenue. As a result of the cyclical nature of the electoral system and the seasonality of the related political revenue, management believes presenting net revenue, excluding impact of political revenue, provides useful information to investors about the Company’s revenue growth comparable from period to period.
The Company presents the non-GAAP financial measure net debt which is total debt principal, gross, less cash and cash equivalents. The Company also presents the non-GAAP financial measure net leverage, which is defined in our Senior Credit Facility as net debt divided by Adjusted EBITDA. Management believes that net leverage and net debt are important measures to monitor leverage and evaluate the balance sheet. Additionally, net leverage is required for complying with certain covenants under the Company's credit agreements.
We refer to Adjusted EBITDA, with and excluding the impact of political advertising, net revenue, excluding impact of political revenue, net debt and net leverage as the "Non-GAAP Financial Measures." Non-GAAP Financial Measures should not be considered in isolation or as a substitute for net income, net revenue, operating income, cash flows from operating activities or any other measure for determining the Company’s operating performance or liquidity that is calculated in accordance with GAAP. In addition, Non-GAAP Financial Measures may be defined or calculated differently by other companies and, therefore, comparability may be limited.
For further information, please contact:
Cumulus Media Inc.
Investor Relations Department
404-260-6600
5
Supplemental Financial Data and Reconciliations
Cumulus Media Inc.
Unaudited Condensed Consolidated Statements of Operations
(Dollars in thousands)
| Three Months Ended March 31, | ||||||||||||||
| 2022 | 2021 | |||||||||||||
| Net revenue | $ | 232,032 | $ | 201,728 | ||||||||||
| Operating expenses: | ||||||||||||||
| Content costs | 91,325 | 90,148 | ||||||||||||
| Selling, general & administrative expenses | 95,292 | 90,098 | ||||||||||||
| Depreciation and amortization | 13,554 | 13,410 | ||||||||||||
| Local marketing agreement fees | 5 | 496 | ||||||||||||
| Corporate expenses | 14,430 | 13,802 | ||||||||||||
| Stock-based compensation expense | 1,507 | 1,057 | ||||||||||||
| Restructuring costs | 2,227 | 1,579 | ||||||||||||
| Gain on sale of assets or stations | (1,111) | (283) | ||||||||||||
| Total operating expenses | 217,229 | 210,307 | ||||||||||||
| Operating income (loss) | 14,803 | (8,579) | ||||||||||||
| Non-operating expense: | ||||||||||||||
| Interest expense | (15,865) | (17,549) | ||||||||||||
| Other expense, net | (23) | (138) | ||||||||||||
| Total non-operating expense, net | (15,888) | (17,687) | ||||||||||||
| Loss before income taxes | (1,085) | (26,266) | ||||||||||||
| Income tax benefit | 180 | 4,349 | ||||||||||||
| Net loss | $ | (905) | $ | (21,917) | ||||||||||
6
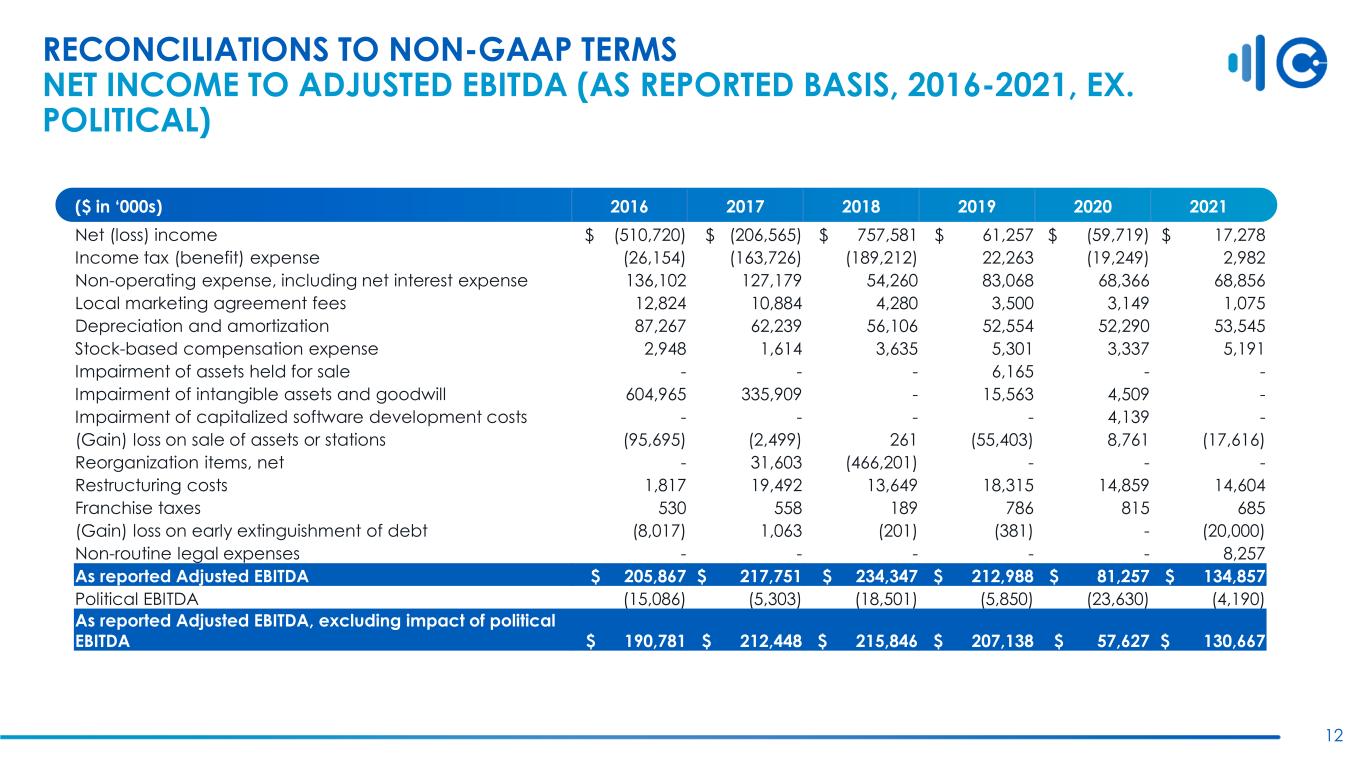
The following tables reconcile net loss, the most directly comparable financial measure calculated and presented in accordance with GAAP, to Adjusted EBITDA for the periods presented herein (dollars in thousands):
| As Reported | Three Months Ended March 31, 2022 | Three Months Ended March 31, 2021 | ||||||||||||
| GAAP net loss | $ | (905) | $ | (21,917) | ||||||||||
| Income tax benefit | (180) | (4,349) | ||||||||||||
| Non-operating expense, including net interest expense | 15,888 | 17,687 | ||||||||||||
| Local marketing agreement fees | 5 | 496 | ||||||||||||
| Depreciation and amortization | 13,554 | 13,410 | ||||||||||||
| Stock-based compensation expense | 1,507 | 1,057 | ||||||||||||
| Gain on sale or disposal of assets or stations | (1,111) | (283) | ||||||||||||
| Restructuring costs | 2,277 | 1,579 | ||||||||||||
| Non-routine legal expenses | 70 | 1,028 | ||||||||||||
| Franchise taxes | 108 | 224 | ||||||||||||
| Adjusted EBITDA | $ | 31,213 | $ | 8,932 | ||||||||||
The following tables reconcile the as reported net revenue and as reported Adjusted EBITDA, both including and excluding the impact of political, for the periods presented herein (dollars in thousands):
| Three Months Ended March 31, 2022 | Three Months Ended March 31, 2021 | |||||||||||||
| As reported net revenue | $ | 232,032 | $ | 201,728 | ||||||||||
Political revenue | (1,732) | (1,336) | ||||||||||||
| As reported net revenue, excluding impact of political revenue | $ | 230,300 | $ | 200,392 | ||||||||||
| Three Months Ended March 31, 2022 | Three Months Ended March 31, 2021 | |||||||||||||
| As reported Adjusted EBITDA | $ | 31,213 | $ | 8,932 | ||||||||||
Political EBITDA | (1,559) | (1,202) | ||||||||||||
| As reported Adjusted EBITDA, excluding impact of political EBITDA | $ | 29,654 | $ | 7,730 | ||||||||||
The following table sets forth a reconciliation of our total debt principal, gross, cash and cash equivalents, and Adjusted EBITDA to net leverage for the periods presented herein (dollars in thousands):
| As of March 31, | ||||||||||||||
| 2022 | 2021 | |||||||||||||
| Total debt principal, gross | $ | 793,426 | $ | 982,616 | ||||||||||
| Less: Cash and cash equivalents | (181,095) | (293,806) | ||||||||||||
| Total debt principal, net | $ | 612,331 | $ | 688,810 | ||||||||||
| Trailing Twelve Months Ending March 31, | ||||||||||||||
| 2022 | 2021 | |||||||||||||
| Adjusted EBITDA | $ | 157,138 | $ | 62,464 | ||||||||||
| Net leverage | 3.9x | 11.0x | ||||||||||||
7