Core & Main Announces Fiscal 2021 Third Quarter Results
ST. LOUIS, Dec. 7, 2021 — Core & Main, Inc. (NYSE: CNM) (together with its subsidiaries, “Core & Main”), a leading specialized distributor of water, wastewater, storm drainage and fire protection products, and related services, today announced unaudited financial results for the third fiscal quarter and nine months ended Oct. 31, 2021.
Fiscal 2021 Third Quarter Highlights (Compared with Fiscal 2020 Third Quarter)
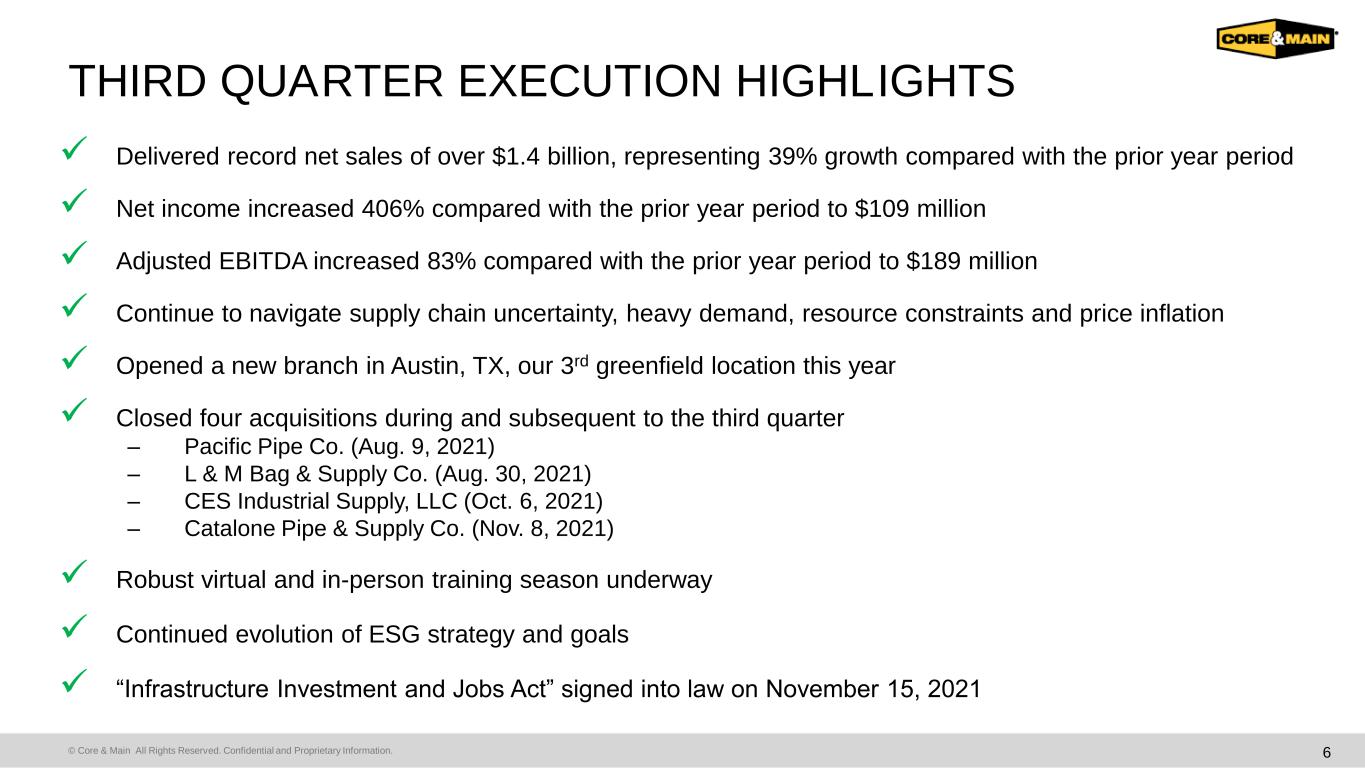
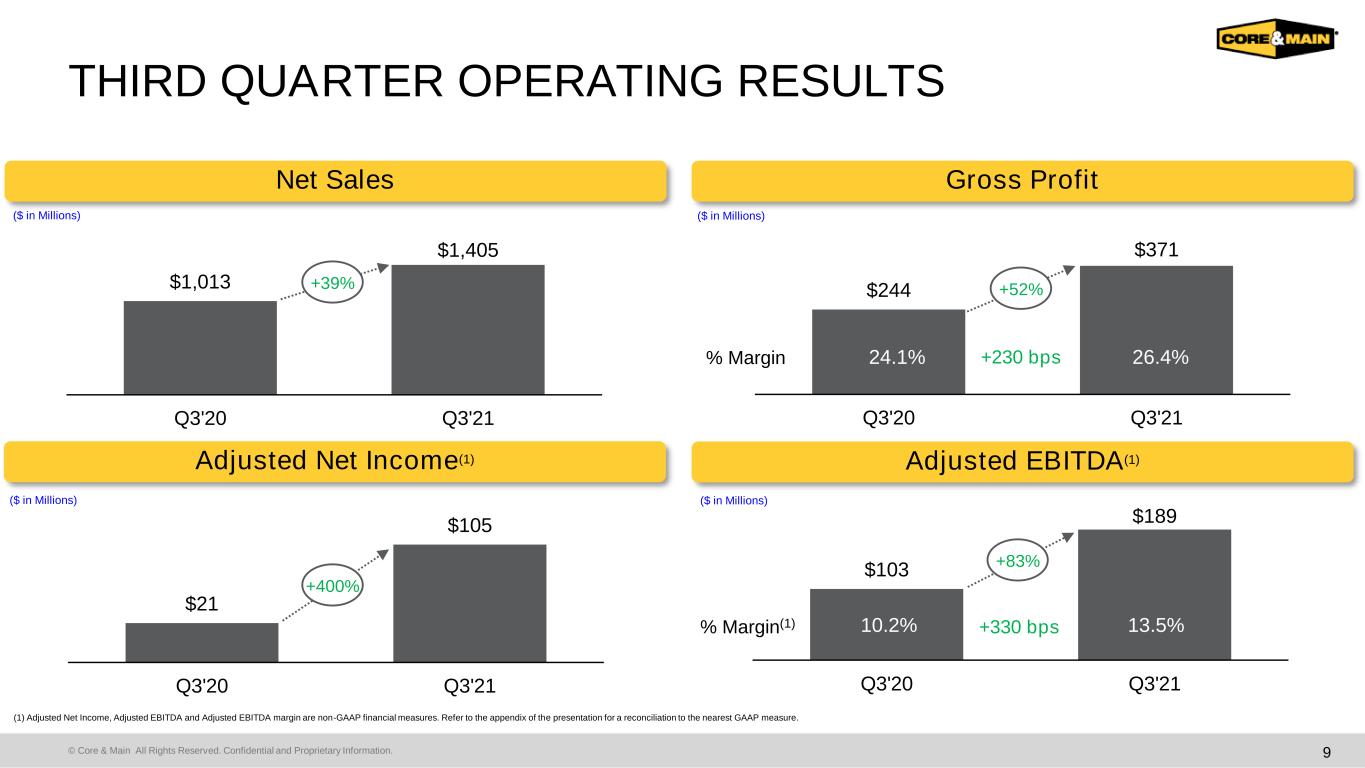
•Net sales increased 38.7% to $1,404.8 million
•Gross profit margin increased 230 basis points to 26.4%
•Net income increased 406.0% to $109.3 million
•Adjusted EBITDA (Non-GAAP) increased 83.4% to $189.1 million
•Adjusted EBITDA margin (Non-GAAP) increased 330 basis points to 13.5%
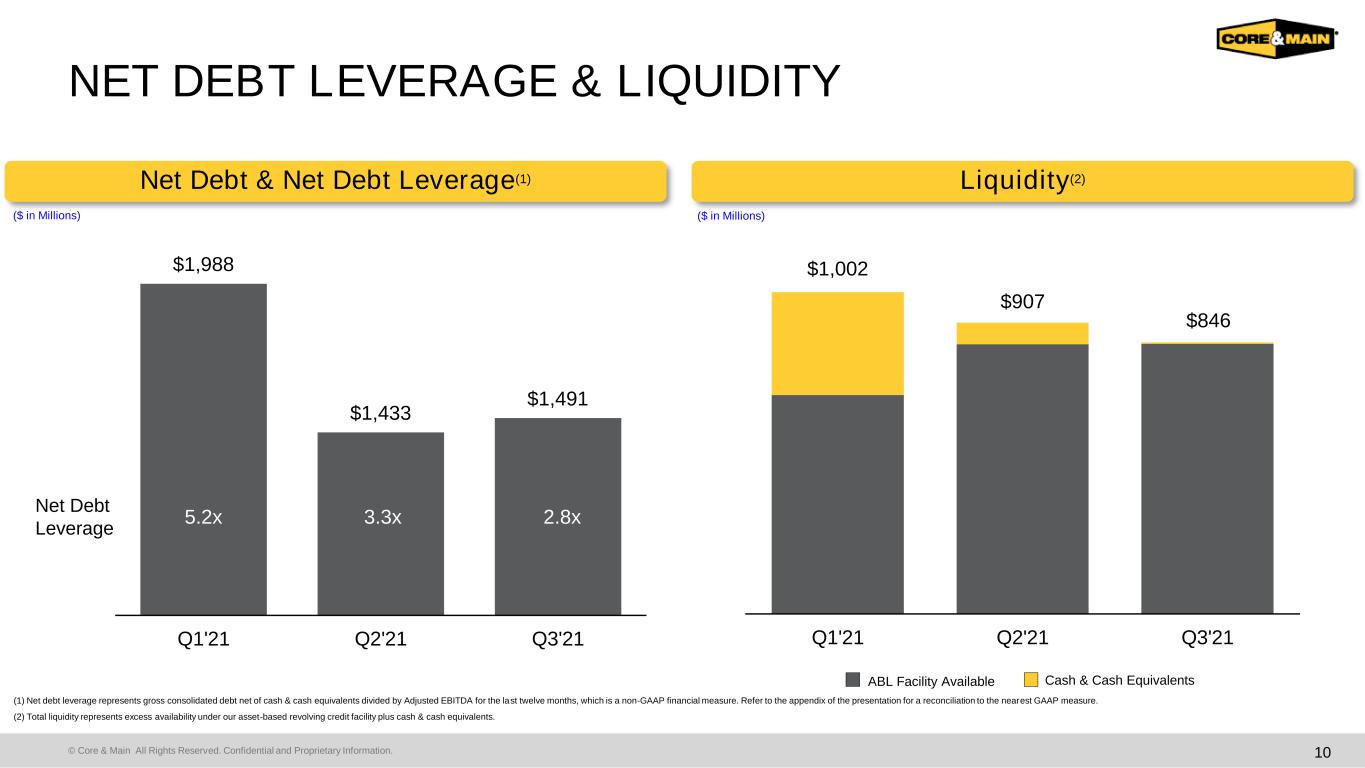
•Net Debt Leverage (Non-GAAP) (using Adjusted EBITDA on a trailing twelve-month basis) decreased to 2.8x as of October 31, 2021 compared with 3.3x as of August 1, 2021
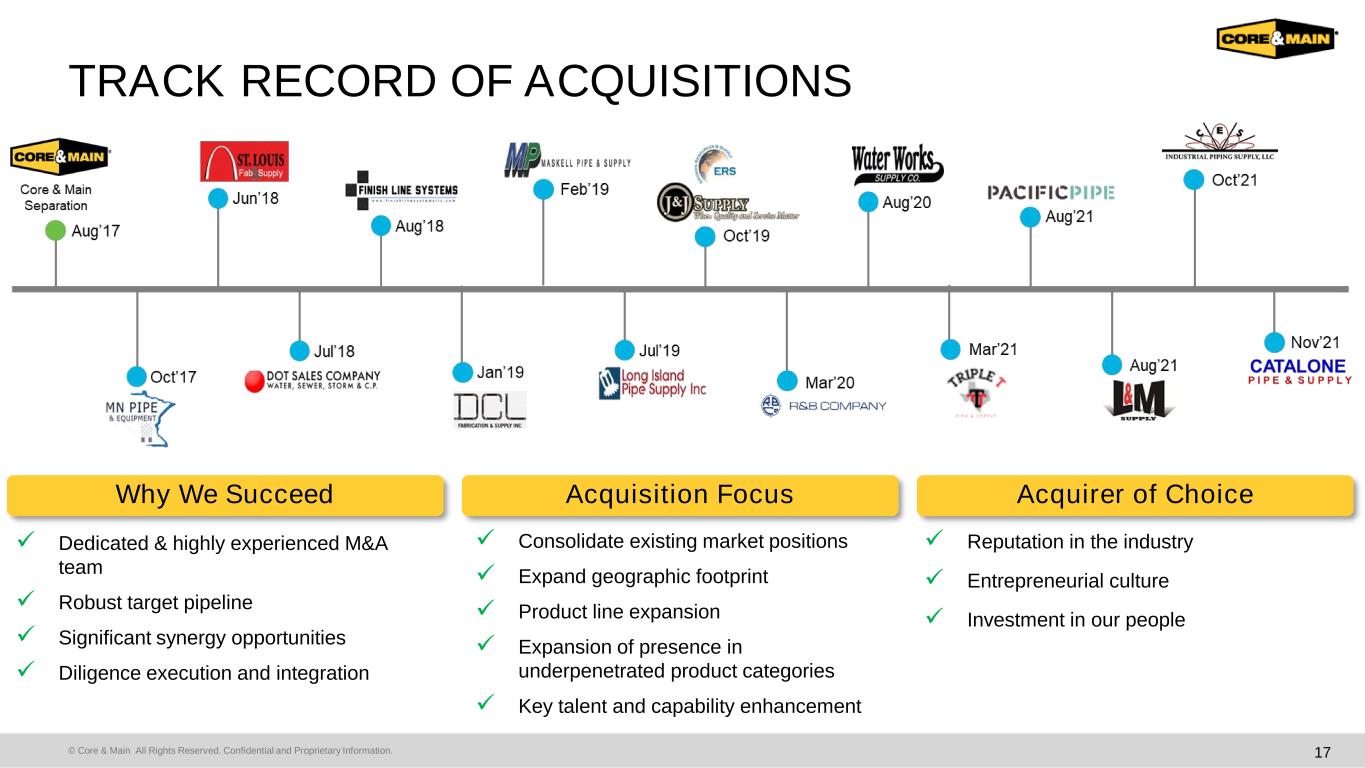
•Closed four acquisitions during and subsequent to the quarter: Pacific Pipe Company, Inc., L & M Bag & Supply Co., Inc., CES Industrial Piping Supply, LLC and Catalone Pipe & Supply Co.
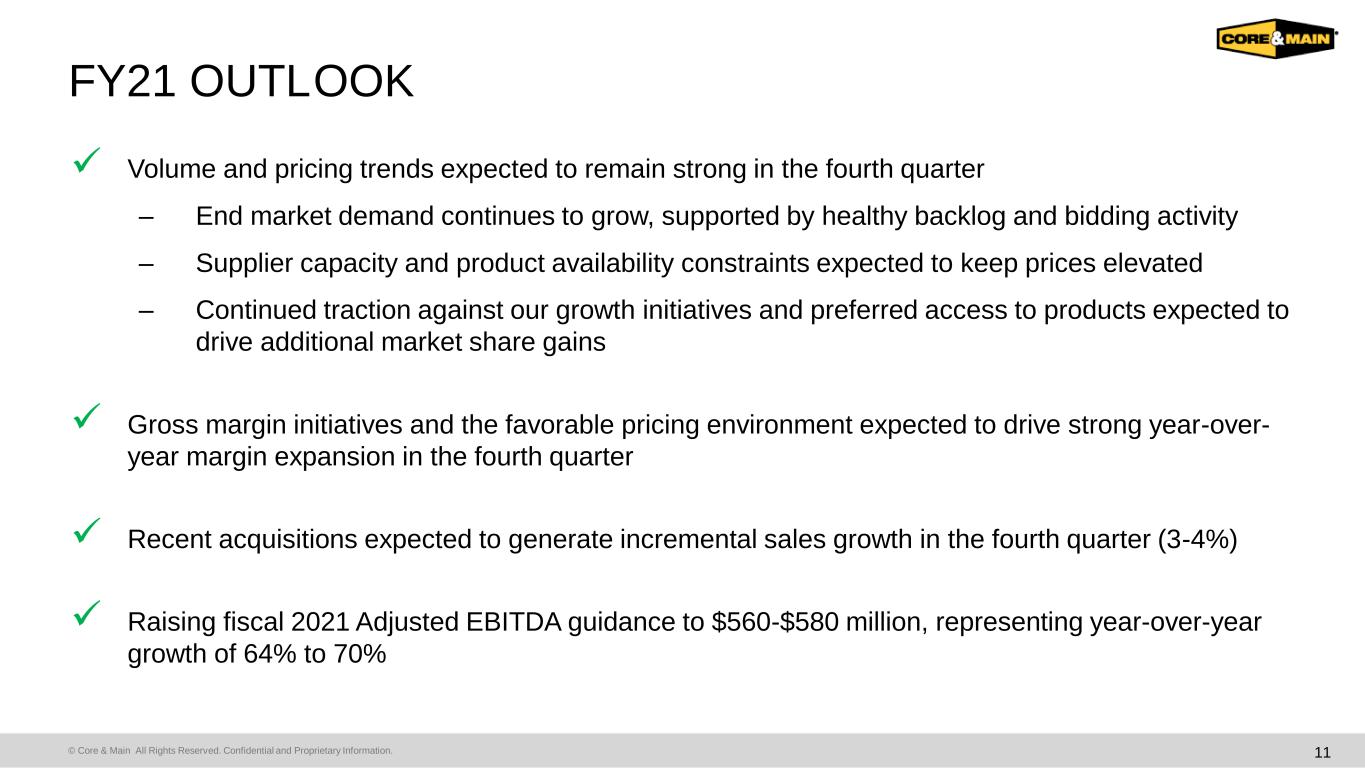
•Fiscal year 2021 Adjusted EBITDA guidance increased to $560 - $580 million, representing year-over-year growth of 64% to 70%
“Core & Main delivered exceptional performance in the third quarter by capitalizing on strong end-market trends, proactively managing inflation and executing on our margin initiatives,” said Steve LeClair, Chief Executive Officer of Core & Main.
“We benefited from strong demand across each of our end markets, attributable to continued growth in municipal water infrastructure spending, growth in land and lot development due to continued housing demand, and recovery in the non-residential construction market. Despite ongoing inflationary trends across many of our product lines due to supply chain constraints and product availability challenges, our field and functional teams have done a fantastic job navigating the environment to provide consistent, reliable products and services to our customers. Our teams continue to execute at a very high level, leveraging our market leadership position and operational capabilities to gain market share and deliver EBITDA margin expansion during the quarter."
"We remained active in M&A during and subsequent to the third quarter, closing on the Pacific Pipe, L & M Bag & Supply, CES Industrial Piping Supply and Catalone Pipe & Supply acquisitions. Each of these acquisitions fits well within our core M&A strategy, offering expansion into new geographies, access to new product lines, consolidation of existing market positions and the addition of key talent. We will continue to pursue and expand our acquisition pipeline, positioning ourselves for continued growth."
LeClair concluded, "Overall, I am very proud of the entire Core & Main team as we continue to execute on our strategies to grow the business. With positive market tailwinds, a growing acquisition pipeline and steady momentum across our margin initiatives, we are confident in our ability to deliver strong results to our stakeholders for the remainder of 2021 and beyond."
Three Months Ended October 31, 2021
Net sales for the three months ended October 31, 2021 increased $392.3 million, or 38.7%, to $1,404.8 million compared with $1,012.5 million in the prior year period. The increase in net sales was primarily attributable to price inflation, representing approximately two-thirds of the net sales increase, strong market volume growth and share gains resulting from preferred access to products during a period of material shortages, which helped drive growth across all product lines. Net sales growth for pipes, valves & fittings products and storm drainage products benefited from end-market growth, acquisitions and price inflation across most product lines. Net sales growth for fire protection products also benefited from end-market growth and price inflation across most product lines. Net sales of meter products grew at a slower pace primarily due to shortages of semi-conductor chips that are components of certain smart meter products.
Gross profit for the three months ended October 31, 2021 increased $126.2 million, or 51.6%, to $370.6 million compared with $244.4 million in the prior year period. Gross profit as a percentage of net sales for the three months ended October 31, 2021 was 26.4% compared with 24.1% in the prior year period, an improvement of 230 basis points. The increase in gross profit as a percentage of net sales was primarily attributable to strategic inventory investments ahead of announced price increases, a favorable pricing environment, the execution of our gross margin initiatives and accretive acquisitions.
Selling, general and administrative (“SG&A”) expenses for the three months ended October 31, 2021 increased $43.1 million, or 29.8%, to $187.9 million compared with $144.8 million in the prior year period. The increase was primarily attributable to an increase of $30.8 million in personnel expenses, which was primarily driven by higher variable compensation costs and headcount from acquisitions, a volume driven increase in distribution costs and lower discretionary spending in the prior year period in response to COVID-19. SG&A as a percentage of net sales for the three months ended October 31, 2021 was 13.4% compared with 14.3% in the prior year period, an improvement of approximately 90 basis points.
Net income for the three months ended October 31, 2021 increased $87.7 million, or 406.0%, to $109.3 million compared with $21.6 million in the prior year period. The increase in net income was primarily attributable to higher operating income and lower interest expense due to the Refinancing Transactions (as defined in our Quarterly Report on Form 10-Q for the quarterly period ended October 31, 2021), partially offset by an increase in income taxes.
Adjusted EBITDA (Non-GAAP) for the three months ended October 31, 2021 increased $86.0 million, or 83.4%, to $189.1 million compared with $103.1 million in the prior year period. Growth in Adjusted EBITDA was primarily attributable to higher net sales, improved gross profit margins, and leveraging our cost structure on the increase in net sales and gross profit. Adjusted EBITDA margin increased 330 basis points to 13.5% from 10.2% in the prior year period.
Nine Months Ended October 31, 2021
Net sales for the nine months ended October 31, 2021 increased $947.0 million, or 33.7%, to $3,757.5 million compared with $2,810.5 million in the prior year period. The increase in net sales was primarily attributable to price inflation, representing approximately half of the net sales increase, strong market volume growth and share gains resulting from preferred access to products during a period of material shortages, which helped drive growth across all product lines. Net sales growth for pipes, valves & fittings products and storm drainage products benefited from end-market growth, acquisitions and price inflation across most product lines. Net sales growth for fire protection products also benefited from end-market growth and price inflation across most product lines. Net sales of meter products grew at a slower pace primarily due to shortages of semi-conductor chips that are components of certain smart meter products.
Gross profit for the nine months ended October 31, 2021 increased $278.4 million, or 41.3%, to $952.6 million compared with $674.2 million in the prior year period. Gross profit as a percentage of net sales for the nine months ended October 31, 2021 was 25.4% compared with 24.0% in the prior year period, an improvement of 140 basis points. The increase in gross profit as a percentage of net sales was primarily attributable to strategic inventory investments ahead of announced price increases, a favorable pricing environment, the execution of our gross margin initiatives and accretive acquisitions.
SG&A expenses for the nine months ended October 31, 2021 increased $115.0 million, or 27.5%, to $533.6 million compared with $418.6 million in the prior year period. The increase was primarily attributable to an increase of $71.3 million in personnel expenses, which was primarily driven by higher variable compensation costs and increased headcount, lower discretionary spending in response to COVID-19 in the prior year period, a volume driven increase in distribution costs and incremental costs from acquisitions. In addition, during the nine months ended October 31, 2021, SG&A expenses increased by $19.1 million related to higher equity-based compensation expense due to accounting for equity awards and $3.6 million related to one-time costs in connection with our initial public offering (the "IPO"). SG&A as a percentage of net sales for the nine months ended October 31, 2021 was 14.2% compared with 14.9% in the prior year period, an improvement of approximately 70 basis points.
Net income for the nine months ended October 31, 2021 increased $109.7 million, or 300.5%, to $146.2 million compared with $36.5 million in the prior year period. The increase in net income was primarily attributable to higher operating income and lower interest expense related to the Refinancing Transactions, partially offset by the $50.7 million loss on debt modification.
Adjusted EBITDA (Non-GAAP) for the nine months ended October 31, 2021 increased $182.6 million, or 67.4%, to $453.4 million compared with $270.8 million in the prior year period. Growth in Adjusted EBITDA was primarily attributable to higher net sales, improved gross profit margins, and leveraging our cost structure on the increase in net sales and gross profit. Adjusted EBITDA margin increased 250 basis points to 12.1% from 9.6% in the prior year period.
Capital Structure and Liquidity
Net debt, calculated as gross consolidated debt net of cash and cash equivalents, as of October 31, 2021 was $1,491.4 million. Net Debt Leverage (defined as the ratio of net debt to Adjusted EBITDA for the last twelve months) was 2.8x, an improvement of 0.5x from August 1, 2021. The improvement was attributable to an increase in Adjusted EBITDA.
As of October 31, 2021, Core & Main had total liquidity of $845.9 million, consisting of $4.9 million of cash and cash equivalents and approximately $841.0 million of excess availability under our asset-based revolving credit facility, which is net of approximately $9.0 million of outstanding letters of credit.
Fiscal 2021 Outlook
"Our performance in the third quarter continued to be very strong despite ongoing supply chain constraints and product availability challenges," LeClair continued. "Demand and pricing trends remain favorable across each of our end markets, and now look more positive than what we expected three months ago. Based on current visibility, backlog of existing orders and business trends, we now expect full year fiscal 2021 Adjusted EBITDA to be in the range of $560 million to $580 million, representing year-over-year growth of 64% to 70%."
Conference Call & Webcast Information
Core & Main management will host a conference call and webcast on December 7, 2021 at 8:30 a.m. EST to discuss Core & Main’s financial results. The live webcast will be accessible via the Events Calendar at https://ir.coreandmain.com. The conference call also may be accessed by dialing (844) 200-6205 or +1 (929) 526-1599 (international). The passcode for the live call is 169286. To ensure participants are connected for the full call, please dial-in at least 10 minutes prior to the start of the call. An archived version of the webcast will be available following the call and a slide presentation highlighting Core & Main’s results and key performance indicators will also be made available on the Investor Relations section of Core & Main’s website prior to the call.
About Core & Main
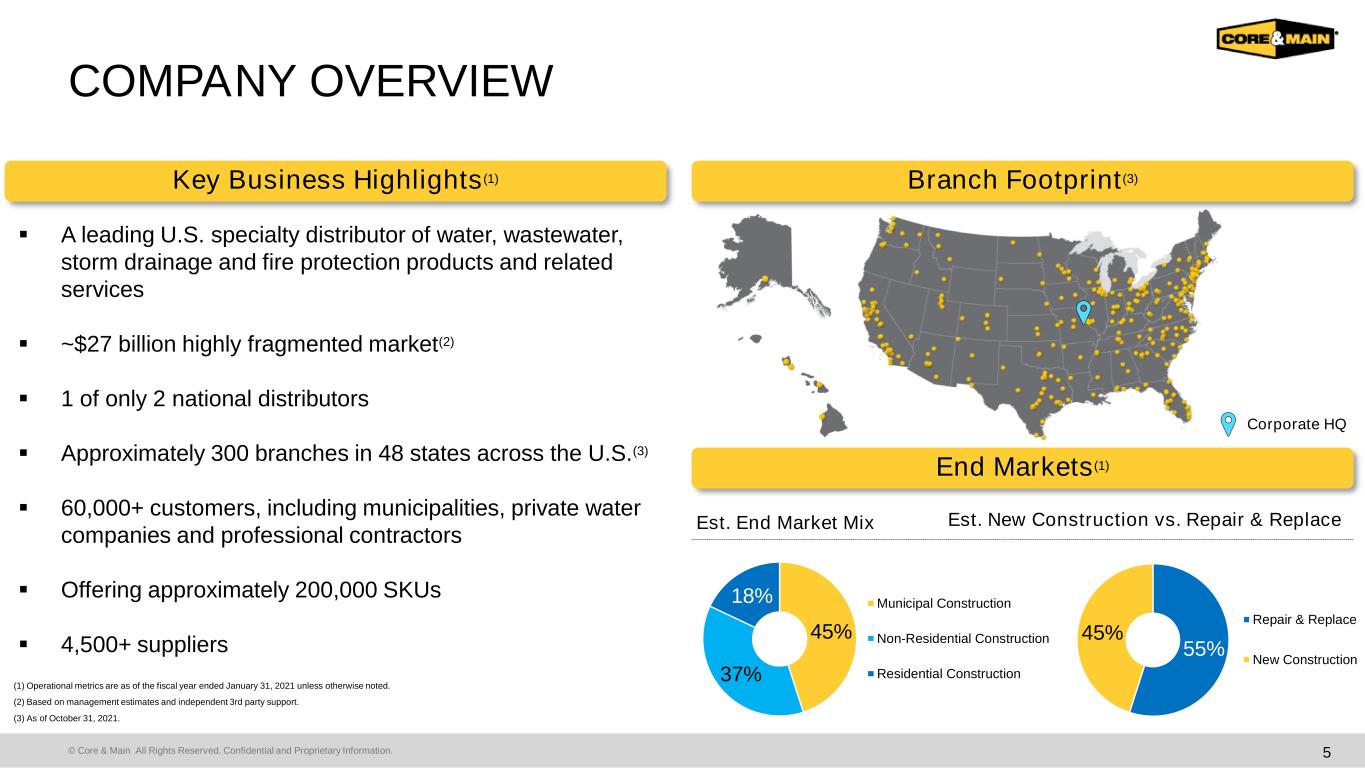
Based in St. Louis, Core & Main is a leading specialized distributor of water, wastewater, storm drainage and fire protection products, and related services, to municipalities, private water companies and professional contractors across municipal, non-residential and residential end markets nationwide. With approximately 300 locations, the company provides its customers local expertise backed by a national supply chain. Core & Main’s 3,700 associates are committed to helping their communities thrive with safe and sustainable infrastructure. Visit https://coreandmain.com to learn more.
Cautionary Note Regarding Forward-Looking Statements
Certain statements contained in this press release include “forward-looking statements” within the meaning of the Private Securities Litigation Reform Act of 1995. Examples of forward-looking statements include information concerning Core & Main’s financial and operating outlook, as well as any other statement that does not directly relate to any historical or current fact. In some cases, you can identify forward-looking statements by terminology such as “may,” “will,” “could,” “should,” “forecasts,” “expects,” “intends,” “plans,” “anticipates,” “projects,” “outlook,” “believes,” “estimates,” “predicts,” “potential,” “continue,” “preliminary,” or the negative of these terms or other comparable terminology. Although we believe that the expectations reflected in the forward-looking statements are reasonable, we can give you no assurance these expectations will prove to have been correct. These forward-looking statements relate to future events or our future financial performance and involve known and unknown risks, uncertainties and other factors that may cause our actual results, levels of activity, performance, or achievements to differ materially from any future results, levels of activity, performance, or achievements expressed or implied by these forward-looking statements.
Factors that could cause actual results and outcomes to differ from those reflected in forward-looking statements include, without limitation, declines, volatility and cyclicality in the U.S. residential and non-residential construction markets; slowdowns in municipal infrastructure spending and delays in appropriations of federal funds; price fluctuations in our product costs, particularly with respect to the commodity-based products that we sell; the spread of, and response to, COVID-19, and the inability to predict the ultimate impact on us; general business and economic conditions; risks involved with acquisitions and other strategic transactions, including our ability to identify, acquire, close or integrate acquisition targets successfully; the impact of seasonality and weather-related impacts, including natural disasters or similar extreme weather events; the fragmented and highly competitive markets in which we compete and consolidation within our industry; our ability to competitively bid for municipal contracts; the development of alternatives to distributors of our products in the supply chain; our ability to hire, engage and retain key personnel, including sales representatives, qualified branch, district and region managers and senior management; our ability to identify, develop and maintain relationships with a sufficient number of qualified suppliers and the potential that our exclusive or restrictive supplier distribution rights are terminated; the availability and cost of freight and energy, such as fuel; the ability of our customers to make payments on credit sales; our ability to identify and introduce new products and product lines effectively; our ability to manage our inventory effectively, including during periods of supply chain disruptions; costs and potential liabilities or obligations imposed by environmental, health and safety laws and requirements; regulatory change and the costs of compliance with regulation; exposure to product liability, construction defect and warranty claims and other litigation and legal proceedings; potential harm to our reputation; difficulties with or interruptions of our fabrication services; safety and labor risks associated with the distribution of our products as well as work stoppages and other disruptions due to labor disputes; impairment in the carrying value of goodwill, intangible assets or other long-lived assets; the domestic and international political environment with regard to trade relationships and tariffs, as well as difficulty sourcing products as a result of import constraints; our ability to operate our business consistently through highly dispersed locations across the United States; interruptions in the proper functioning of our IT systems, including from cybersecurity threats; risks associated with raising capital; our ability to continue our customer relationships with short-term contracts; changes in vendor rebates or other terms of our vendor agreements; risks associated with exporting our products internationally; our ability to renew or replace our existing leases on favorable terms or at all; our ability to maintain effective internal controls over financial reporting and remediate any material weaknesses; our substantial indebtedness and the potential that we may incur additional indebtedness; the limitations and restrictions in the agreements governing our indebtedness, the Second Amended and Restated Agreement of Limited Partnership of Core & Main Holdings, LP and the Tax Receivable Agreements (each as defined in our Quarterly Report on Form 10-Q for the quarterly period ended October 31, 2021); increases in interest rates and the impact of transitioning from LIBOR as the benchmark rate in contracts; changes in our credit ratings and outlook; our ability to generate the significant amount of cash needed to service our indebtedness; our organizational structure, including our payment obligations under the Tax Receivable Agreements, which may be significant; the significant influence that Clayton, Dubilier & Rice, LLC (“CD&R”) has over us and potential conflicts between the interests of CD&R and other stockholders; and risks related to other factors discussed under “Risk Factors” in the prospectus (File No. 333-256382), dated July 22, 2021, filed with the Securities and Exchange Commission pursuant to Rule 424(b) under the Securities Act of 1933, as amended, on July 26, 2021.
Additional information concerning these and other factors can be found in our filings with the Securities and Exchange Commission. All forward-looking statements attributable to us or persons acting on our behalf are expressly qualified in their entirety by the foregoing cautionary statements. All such statements speak only as of the date made and, except as required by law, we undertake no obligation to update or revise publicly any forward-looking statements, whether as a result of new information, future events, or otherwise.
Contact:
Robyn Bradbury
VP, Investor Relations and FP&A
(314) 995-9116
CORE & MAIN, INC.
CONDENSED CONSOLIDATED STATEMENTS OF OPERATIONS
Amounts in millions (except share and per share data), unaudited
| Three Months Ended | Nine Months Ended | ||||||||||||||||||||||
| October 31, 2021 | November 1, 2020 | October 31, 2021 | November 1, 2020 | ||||||||||||||||||||
| Net sales | $ | 1,404.8 | $ | 1,012.5 | $ | 3,757.5 | $ | 2,810.5 | |||||||||||||||
| Cost of sales | 1,034.2 | 768.1 | 2,804.9 | 2,136.3 | |||||||||||||||||||
| Gross profit | 370.6 | 244.4 | 952.6 | 674.2 | |||||||||||||||||||
| Operating expenses: | |||||||||||||||||||||||
| Selling, general and administrative | 187.9 | 144.8 | 533.6 | 418.6 | |||||||||||||||||||
| Depreciation and amortization | 35.2 | 34.9 | 102.6 | 102.7 | |||||||||||||||||||
| Total operating expenses | 223.1 | 179.7 | 636.2 | 521.3 | |||||||||||||||||||
| Operating income | 147.5 | 64.7 | 316.4 | 152.9 | |||||||||||||||||||
| Interest expense | 13.0 | 35.6 | 85.3 | 103.8 | |||||||||||||||||||
| Loss on debt modification and extinguishment | 0.3 | — | 50.7 | — | |||||||||||||||||||
| Income before provision for income taxes | 134.2 | 29.1 | 180.4 | 49.1 | |||||||||||||||||||
| Provision for income taxes | 24.9 | 7.5 | 34.2 | 12.6 | |||||||||||||||||||
| Net income | 109.3 | $ | 21.6 | 146.2 | $ | 36.5 | |||||||||||||||||
Less: net income attributable to non-controlling interests (1) | 44.9 | 27.9 | |||||||||||||||||||||
Net income attributable to Core & Main, Inc. (1) | $ | 64.4 | $ | 118.3 | |||||||||||||||||||
Earnings per share (2) | |||||||||||||||||||||||
| Basic | $ | 0.41 | $ | 0.27 | |||||||||||||||||||
| Diluted | $ | 0.39 | $ | 0.26 | |||||||||||||||||||
Number of shares used in computing EPS (2) | |||||||||||||||||||||||
| Basic | 158,986,524 | 156,869,487 | |||||||||||||||||||||
| Diluted | 244,582,116 | 243,080,600 | |||||||||||||||||||||
(1)Prior to the Reorganization Transactions (as defined in our Quarterly Report on Form 10-Q for the quarterly period ended October 31, 2021), there was no income attributable to Core & Main, Inc.
(2)Represents basic and diluted earnings per share of Class A common stock and weighted average shares of Class A common stock outstanding for the three months ended October 31, 2021 and the period from July 23, 2021 through October 31, 2021, which is the period following the Reorganization Transactions. The Company analyzed the calculation of earnings per share for the periods prior to the Reorganization Transactions and determined that it resulted in values that would not be meaningful to the users of the condensed consolidated financial statements. Therefore, there is no earnings per share attributable to Core & Main, Inc. for the periods prior to the Reorganization Transactions on July 22, 2021.
CORE & MAIN, INC.
CONDENSED CONSOLIDATED BALANCE SHEETS
Amounts in millions (except share and per share data), unaudited
| October 31, 2021 | January 31, 2021 | ||||||||||
| ASSETS | |||||||||||
| Current assets: | |||||||||||
| Cash and cash equivalents | $ | 4.9 | $ | 380.9 | |||||||
| Receivables, net of allowance for credit losses of $5.4 and $4.6 | 946.1 | 556.8 | |||||||||
| Inventories | 721.2 | 383.8 | |||||||||
| Prepaid expenses and other current assets | 24.7 | 15.6 | |||||||||
| Total current assets | 1,696.9 | 1,337.1 | |||||||||
| Property, plant and equipment, net | 90.7 | 86.2 | |||||||||
| Operating lease right-of-use assets | 158.7 | 128.5 | |||||||||
| Intangible assets, net | 899.3 | 919.2 | |||||||||
| Goodwill | 1,515.4 | 1,452.7 | |||||||||
| Other assets | 19.8 | — | |||||||||
| Total assets | $ | 4,380.8 | $ | 3,923.7 | |||||||
| LIABILITIES AND PARTNERS’ CAPITAL/STOCKHOLDERS’ EQUITY | |||||||||||
| Current liabilities: | |||||||||||
| Current maturities of long-term debt | $ | 15.0 | $ | 13.0 | |||||||
| Accounts payable | 613.3 | 325.7 | |||||||||
| Accrued compensation and benefits | 97.6 | 70.7 | |||||||||
| Current operating lease liabilities | 48.7 | 42.8 | |||||||||
| Other current liabilities | 68.0 | 70.1 | |||||||||
| Total current liabilities | 842.6 | 522.3 | |||||||||
| Long-term debt | 1,459.0 | 2,251.7 | |||||||||
| Non-current operating lease liabilities | 110.1 | 85.9 | |||||||||
| Deferred income taxes | 97.7 | 232.1 | |||||||||
| Payable to related parties pursuant to Tax Receivable Agreements | 91.8 | — | |||||||||
| Other liabilities | 20.9 | 31.0 | |||||||||
| Total liabilities | 2,622.1 | 3,123.0 | |||||||||
| Commitments and contingencies | |||||||||||
| Partners’ capital | — | 800.7 | |||||||||
| Class A common stock, par value $0.01 per share, 1,000,000,000 shares authorized, 160,067,161 shares issued and outstanding as of October 31, 2021 | 1.6 | — | |||||||||
| Class B common stock, par value $0.01 per share, 500,000,000 shares authorized, 85,853,383 shares issued and outstanding as of October 31, 2021 | 0.9 | — | |||||||||
| Additional paid-in capital | 1,168.7 | — | |||||||||
| Retained earnings | 44.4 | — | |||||||||
| Accumulated other comprehensive income | 7.7 | — | |||||||||
| Total partners’ capital/stockholders’ equity attributable to Core & Main, Inc. | 1,223.3 | 800.7 | |||||||||
| Non-controlling interests | 535.4 | — | |||||||||
| Total partners’ capital/stockholders’ equity | 1,758.7 | 800.7 | |||||||||
| Total liabilities and partners’ capital/stockholders’ equity | $ | 4,380.8 | $ | 3,923.7 | |||||||
CORE & MAIN, INC.
CONDENSED CONSOLIDATED STATEMENTS OF CASH FLOWS
Amounts in millions, unaudited
| Nine Months Ended | |||||||||||
| October 31, 2021 | November 1, 2020 | ||||||||||
| Cash Flows From Operating Activities: | |||||||||||
| Net income | $ | 146.2 | $ | 36.5 | |||||||
| Adjustments to reconcile net cash from operating activities: | |||||||||||
| Depreciation and amortization | 112.3 | 114.3 | |||||||||
| Provision for bad debt | 1.4 | 2.1 | |||||||||
| Non-cash inventory charge | 0.8 | 0.6 | |||||||||
| Equity-based compensation expense | 22.2 | 3.1 | |||||||||
| Loss on debt modification and extinguishment | 48.7 | — | |||||||||
| Other | (8.2) | (0.5) | |||||||||
| Changes in assets and liabilities: | |||||||||||
| (Increase) decrease in receivables | (373.8) | (107.0) | |||||||||
| (Increase) decrease in inventories | (304.7) | (34.0) | |||||||||
| (Increase) decrease in other assets | (8.2) | 3.4 | |||||||||
| Increase (decrease) in accounts payable | 278.9 | 121.1 | |||||||||
| Increase (decrease) in accrued liabilities | 18.9 | 0.7 | |||||||||
| Increase (decrease) in other liabilities | (0.7) | 13.9 | |||||||||
| Net cash (used in) provided by operating activities | (66.2) | 154.2 | |||||||||
| Cash Flows From Investing Activities: | |||||||||||
| Capital expenditures | (12.0) | (8.3) | |||||||||
| Acquisitions of businesses, net of cash acquired | (172.2) | (217.2) | |||||||||
| Settlement of interest rate swap | (5.2) | — | |||||||||
| Proceeds from the sale of property and equipment | 0.5 | 0.2 | |||||||||
| Net cash used in investing activities | (188.9) | (225.3) | |||||||||
| Cash Flows From Financing Activities: | |||||||||||
| IPO proceeds, net of underwriting discounts and commissions | 663.7 | — | |||||||||
| Offering proceeds from underwriters’ option, net of underwriting discounts and commissions | 99.5 | — | |||||||||
| Payments for offering costs | (7.8) | — | |||||||||
| Investments from non-controlling interest holders | 0.3 | 0.8 | |||||||||
| Distributions to non-controlling interest holders | (30.9) | (9.8) | |||||||||
| Borrowings on asset-based revolving credit facility | — | 460.0 | |||||||||
| Repayments on asset-based revolving credit facility | — | (460.0) | |||||||||
| Issuance of long-term debt | 1,500.0 | 250.0 | |||||||||
| Repayments of long-term debt | (2,314.8) | (9.8) | |||||||||
| Payment of contingent consideration | (0.3) | — | |||||||||
| Payment of debt redemption premiums | (17.5) | — | |||||||||
| Debt issuance costs | (13.1) | (8.1) | |||||||||
| Net cash (used in) provided by financing activities | (120.9) | 223.1 | |||||||||
| (Decrease) increase in cash and cash equivalents | (376.0) | 152.0 | |||||||||
| Cash and cash equivalents at the beginning of the period | 380.9 | 180.9 | |||||||||
| Cash and cash equivalents at the end of the period | $ | 4.9 | $ | 332.9 | |||||||
Non-GAAP Financial Measures
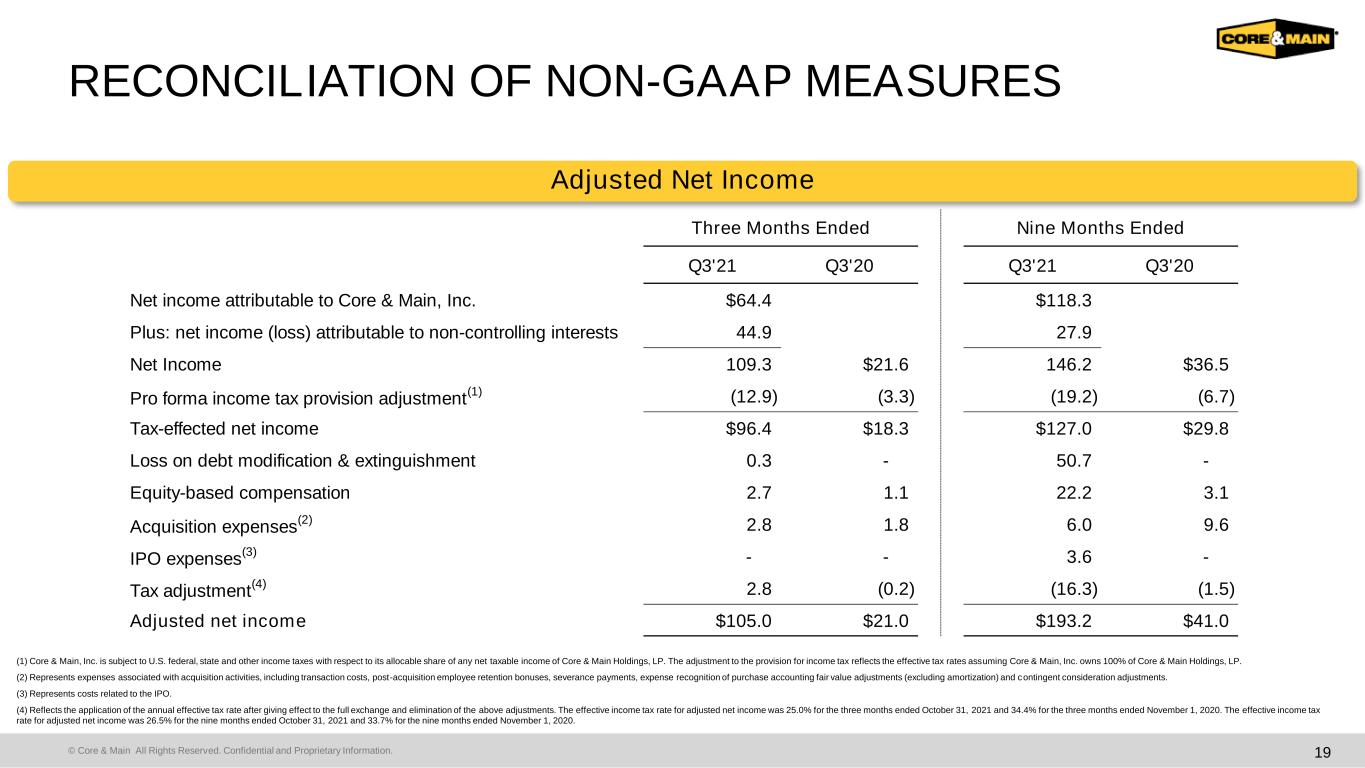
In addition to providing results that are determined in accordance with GAAP, we present EBITDA, Adjusted EBITDA, Adjusted EBITDA margin and Net Debt Leverage, which are non-GAAP financial measures. These measures are not considered measures of financial performance or liquidity under GAAP and the items excluded therefrom are significant components in understanding and assessing our financial performance or liquidity. These measures should not be considered in isolation or as alternatives to GAAP measures such as net income, net income attributable to Core & Main, Inc., cash provided by or used in operating, investing or financing activities or other financial statement data presented in our financial statements as an indicator of our financial performance or liquidity.
We define EBITDA as net income attributable to Core & Main, Inc. adjusted for non-controlling interest, depreciation and amortization, provision for income taxes and interest expense. We define Adjusted EBITDA as EBITDA as further adjusted for certain items management believes are not reflective of the underlying operations of our business, including (a) loss on debt modification and extinguishment, (b) equity-based compensation, (c) expenses associated with the IPO and (d) expenses associated with acquisition activities. Net income attributable to Core & Main, Inc. is the most directly comparable GAAP measure to EBITDA and Adjusted EBITDA. We define Adjusted EBITDA margin as Adjusted EBITDA divided by net sales. We define Net Debt Leverage as total consolidated debt (gross of unamortized discounts and debt issuance costs), net of cash and cash equivalents, divided by Adjusted EBITDA for the last twelve months.
We use EBITDA, Adjusted EBITDA, Adjusted EBITDA margin and Net Debt Leverage to assess the operating results and effectiveness and efficiency of our business. Adjusted EBITDA includes amounts otherwise attributable to non-controlling interests as we manage the consolidated company and evaluate operating performance in a similar manner. We present these non-GAAP financial measures because we believe that investors consider them to be important supplemental measures of performance, and we believe that these measures are frequently used by securities analysts, investors and other interested parties in the evaluation of companies in our industry. Non-GAAP financial measures as reported by us may not be comparable to similarly titled metrics reported by other companies and may not be calculated in the same manner. These measures have limitations as analytical tools, and you should not consider them in isolation or as substitutes for analysis of our results as reported under GAAP. For example, EBITDA and Adjusted EBITDA:
•do not reflect the significant interest expense or the cash requirements necessary to service interest or principal payments on debt;
•do not reflect income tax expenses, the cash requirements to pay taxes or related distributions;
•do not reflect cash requirements to replace in the future any assets being depreciated and amortized; and
•exclude certain transactions or expenses as allowed by the various agreements governing our indebtedness.
EBITDA, Adjusted EBITDA, Adjusted EBITDA margin and Net Debt Leverage are not alternative measures of financial performance or liquidity under GAAP and therefore should be considered in conjunction with net income attributable to Core & Main, Inc. and other performance measures such as gross profit or net cash provided by or used in operating, investing or financing activities and not as alternatives to such GAAP measures. In evaluating Adjusted EBITDA, you should be aware that, in the future, we may incur expenses similar to those eliminated in this presentation.
No reconciliation of the estimated range for Adjusted EBITDA for fiscal 2021 is included herein because we are unable to quantify certain amounts that would be required to be included in net income attributable to Core & Main, Inc., the most directly comparable GAAP measure, without unreasonable efforts due to the high variability and difficulty to predict certain items excluded from Adjusted EBITDA. Consequently, we believe such reconciliation would imply a degree of precision that would be misleading to investors. In particular, the effects of acquisition expenses and associated taxes cannot be reasonably predicted in light of the inherent difficulty in quantifying such items on a forward-looking basis. We expect the variability of these excluded items may have an unpredictable, and potentially significant, impact on our future GAAP financial results.
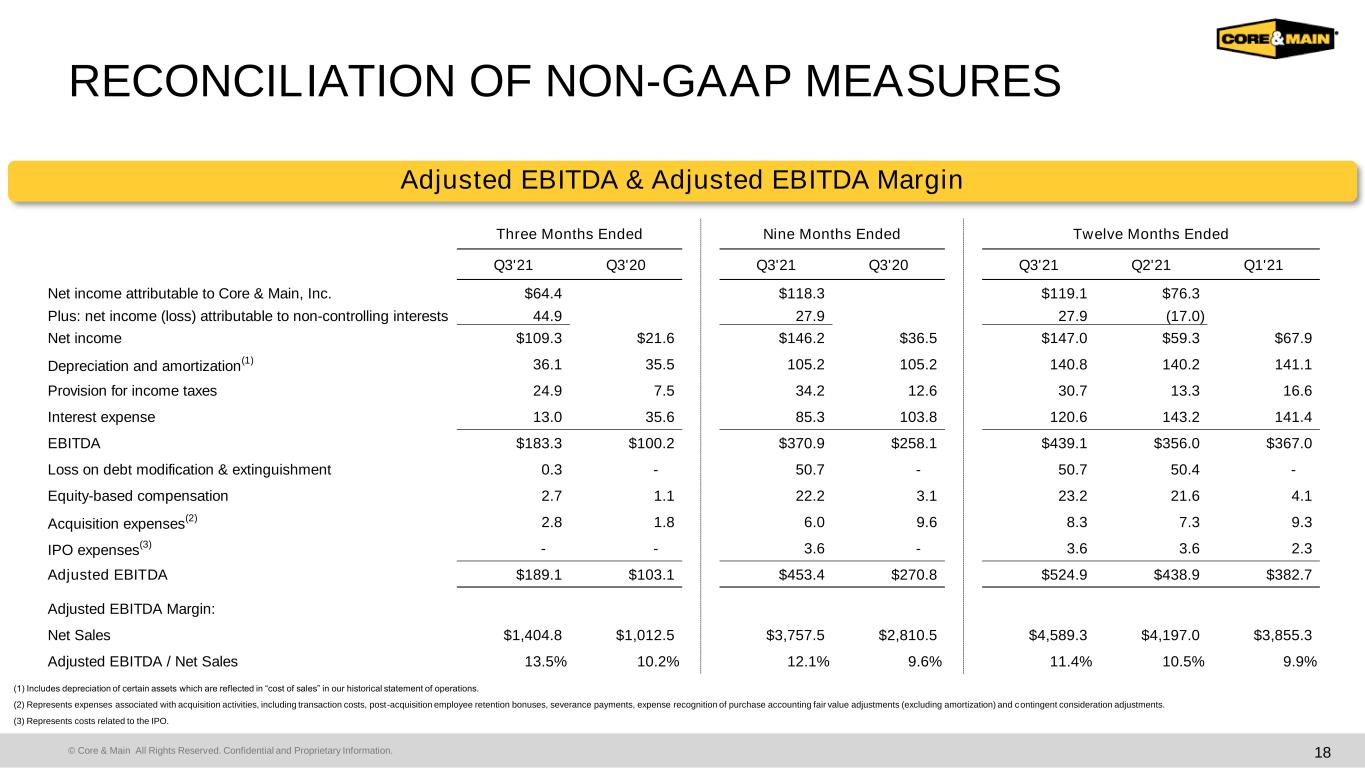
The following tables set forth a reconciliation of net income or net income attributable to Core & Main, Inc. to EBITDA and Adjusted EBITDA, as applicable, for the periods presented, as well as a calculation of Adjusted EBITDA margin for the periods presented:
| (Amounts in millions, unaudited) | Three Months Ended | Nine Months Ended | ||||||||||||||||||||||||
| October 31, 2021 | November 1, 2020 | October 31, 2021 | November 1, 2020 | |||||||||||||||||||||||
| Net income attributable to Core & Main, Inc. | $ | 64.4 | $ | 118.3 | ||||||||||||||||||||||
| Plus: net income attributable to non-controlling interests | 44.9 | 27.9 | ||||||||||||||||||||||||
| Net income | $ | 109.3 | $ | 21.6 | $ | 146.2 | $ | 36.5 | ||||||||||||||||||
Depreciation and amortization (1) | 36.1 | 35.5 | 105.2 | 105.2 | ||||||||||||||||||||||
| Provision for income taxes | 24.9 | 7.5 | 34.2 | 12.6 | ||||||||||||||||||||||
| Interest expense | 13.0 | 35.6 | 85.3 | 103.8 | ||||||||||||||||||||||
| EBITDA | $ | 183.3 | $ | 100.2 | $ | 370.9 | $ | 258.1 | ||||||||||||||||||
| Loss on debt modification and extinguishment | 0.3 | — | 50.7 | — | ||||||||||||||||||||||
| Equity-based compensation | 2.7 | 1.1 | 22.2 | 3.1 | ||||||||||||||||||||||
Acquisition expenses (2) | 2.8 | 1.8 | 6.0 | 9.6 | ||||||||||||||||||||||
IPO expenses (3) | — | — | 3.6 | — | ||||||||||||||||||||||
| Adjusted EBITDA | $ | 189.1 | $ | 103.1 | $ | 453.4 | $ | 270.8 | ||||||||||||||||||
| Adjusted EBITDA Margin: | ||||||||||||||||||||||||||
| Net Sales | $ | 1,404.8 | $ | 1,012.5 | $ | 3,757.5 | $ | 2,810.5 | ||||||||||||||||||
| Adjusted EBITDA / Net Sales | 13.5 | % | 10.2 | % | 12.1 | % | 9.6 | % | ||||||||||||||||||
| (Amounts in millions, unaudited) | Twelve Months Ended | |||||||||||||
| October 31, 2021 | August 1, 2021 | |||||||||||||
| Net income attributable to Core & Main, Inc. | $ | 119.1 | $ | 76.3 | ||||||||||
| Plus: net income (loss) attributable to non-controlling interests | 27.9 | (17.0) | ||||||||||||
| Net income | $ | 147.0 | $ | 59.3 | ||||||||||
Depreciation and amortization (1) | 140.8 | 140.2 | ||||||||||||
| Provision for income taxes | 30.7 | 13.3 | ||||||||||||
| Interest expense | 120.6 | 143.2 | ||||||||||||
| EBITDA | $ | 439.1 | $ | 356.0 | ||||||||||
| Loss on debt modification and extinguishment | 50.7 | 50.4 | ||||||||||||
| Equity-based compensation | 23.2 | 21.6 | ||||||||||||
Acquisition expenses (2) | 8.3 | 7.3 | ||||||||||||
IPO expenses (3) | 3.6 | 3.6 | ||||||||||||
| Adjusted EBITDA | $ | 524.9 | $ | 438.9 | ||||||||||
(1)Includes depreciation of certain assets which are reflected in “cost of sales” in our historical statement of operations.
(2)Represents expenses associated with acquisition activities, including transaction costs, post-acquisition employee retention bonuses, severance payments, expense recognition of purchase accounting fair value adjustments (excluding amortization) and contingent consideration adjustments.
(3)Represents costs related to the IPO.
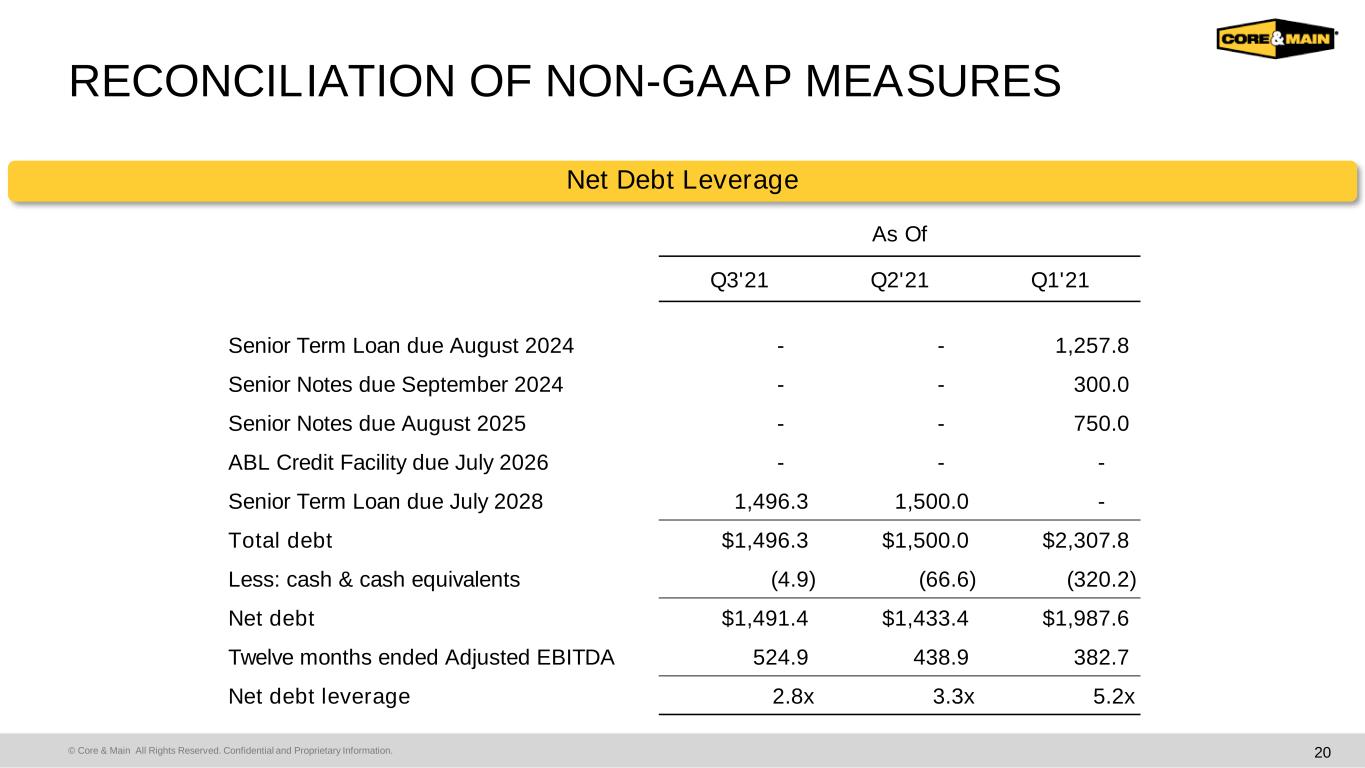
The following table sets forth a calculation of Net Debt Leverage for the periods presented:
| (Amounts in millions, unaudited) | As Of | |||||||||||||
| October 31, 2021 | August 1, 2021 | |||||||||||||
| ABL Facility | $ | — | $ | — | ||||||||||
| Senior Term Loan due 2028 | 1,496.3 | 1,500.0 | ||||||||||||
| Total Debt | $ | 1,496.3 | $ | 1,500.0 | ||||||||||
| Less: Cash & Cash Equivalents | (4.9) | (66.6) | ||||||||||||
| Net Debt | $ | 1,491.4 | $ | 1,433.4 | ||||||||||
| Twelve Months Ended Adjusted EBITDA | 524.9 | 438.9 | ||||||||||||
| Net Debt Leverage | 2.8x | 3.3x | ||||||||||||