cnm-20220330
0001856525false00018565252022-03-302022-03-30

UNITED STATES
SECURITIES AND EXCHANGE COMMISSION
Washington, D.C. 20549
___________________________
FORM 8-K
___________________________

CURRENT REPORT
Pursuant to Section 13 or 15(d)
of the Securities Exchange Act of 1934

Date of Report (Date of earliest event reported): March 30, 2022

___________________________

Core & Main, Inc.
(Exact name of registrant as specified in its charter)
___________________________
Delaware001-4065086-3149194
(State or other jurisdiction
of incorporation)
(Commission
File Number
(IRS Employer
Identification No.)


1830 Craig Park Court
St. Louis, Missouri
63146
(Address of principal executive offices) (Zip Code)

(314) 432-4700
(Registrant’s telephone number, including area code)

N/A
(Former name or former address, if changed since last report)
___________________________

Check the appropriate box below if the Form 8-K filing is intended to simultaneously satisfy the filing obligation of the registrant under any of the following provisions:
    Written communications pursuant to Rule 425 under the Securities Act (17 CFR 230.425)
    Soliciting material pursuant to Rule 14a-12 under the Exchange Act (17 CFR 240.14a-12)
    Pre-commencement communications pursuant to Rule 14d-2(b) under the Exchange Act (17 CFR 240.14d-2(b))
    Pre-commencement communications pursuant to Rule 13e-4(c) under the Exchange Act (17 CFR 240.13e-4(c))

Securities registered pursuant to Section 12(b) of the Act:

Title of ClassTrading SymbolName of Each Exchange
on Which Registered
Class A common stock, par value $0.01 per shareCNMNew York Stock Exchange

Indicate by check mark whether the registrant is an emerging growth company as defined in Rule 405 of the Securities Act of 1933 (§230.405 of this chapter) or Rule 12b-2 of the Securities Exchange Act of 1934 (§240.12b-2 of this chapter).

Emerging growth company

If an emerging growth company, indicate by check mark if the registrant has elected not to use the extended transition period for complying with any new or revised financial accounting standards provided pursuant to Section 13(a) of the Exchange Act. ☐


Item 2.02. Results of Operations and Financial Conditions.

On March 30, 2022, Core & Main, Inc. (“Core & Main”) issued a press release announcing its results of operations for the fiscal fourth quarter and the fiscal year ended January 30, 2022. A copy of the press release is attached hereto as Exhibit 99.1.

On March 30, 2022, Core & Main posted to the “Investor Relations” section of its website the presentation that accompanied the earnings conference call. A copy of the investor presentation is attached hereto as Exhibit 99.2.

The information provided pursuant to this Item 2.02 and in Exhibit 99.1 and Exhibit 99.2 is being “furnished” herewith and shall not be deemed to be “filed” for purposes of Section 18 of the Securities Exchange Act of 1934, as amended (the “Exchange Act”), or otherwise subject to the liabilities of that section, nor shall it be deemed incorporated by reference in any filing made by Core & Main under the Exchange Act or the Securities Act of 1933, as amended, regardless of any general incorporation language in such filings, except as shall be expressly set forth by specific reference in any such filings.


Item 9.01. Financial Statements and Exhibits

(d)    Exhibits

Exhibit No.Description
99.1
99.2
104
Cover Page Interactive Data File (embedded within the Inline XBRL document)*

* Filed herewith.
** Furnished herewith.


SIGNATURES

Pursuant to the requirements of the Securities Exchange Act of 1934, the registrant has duly caused this report to be signed on its behalf by the undersigned hereunto duly authorized.

Core & Main, Inc.
By:/s/ Stephen O. LeClair
Name:Stephen O. LeClair
Title:Chief Executive Officer

Date: March 30, 2022


Core & Main Announces Fiscal 2021 Fourth Quarter and Full-Year Results

ST. LOUIS, March 30, 2022 — Core & Main, Inc. (NYSE: CNM), a leading specialized distributor of water, wastewater, storm drainage and fire protection products, and related services, today announced financial results for the fourth quarter and fiscal year ended January 30, 2022.

Fiscal 2021 Fourth Quarter Highlights (Compared with Fiscal 2020 Fourth Quarter)
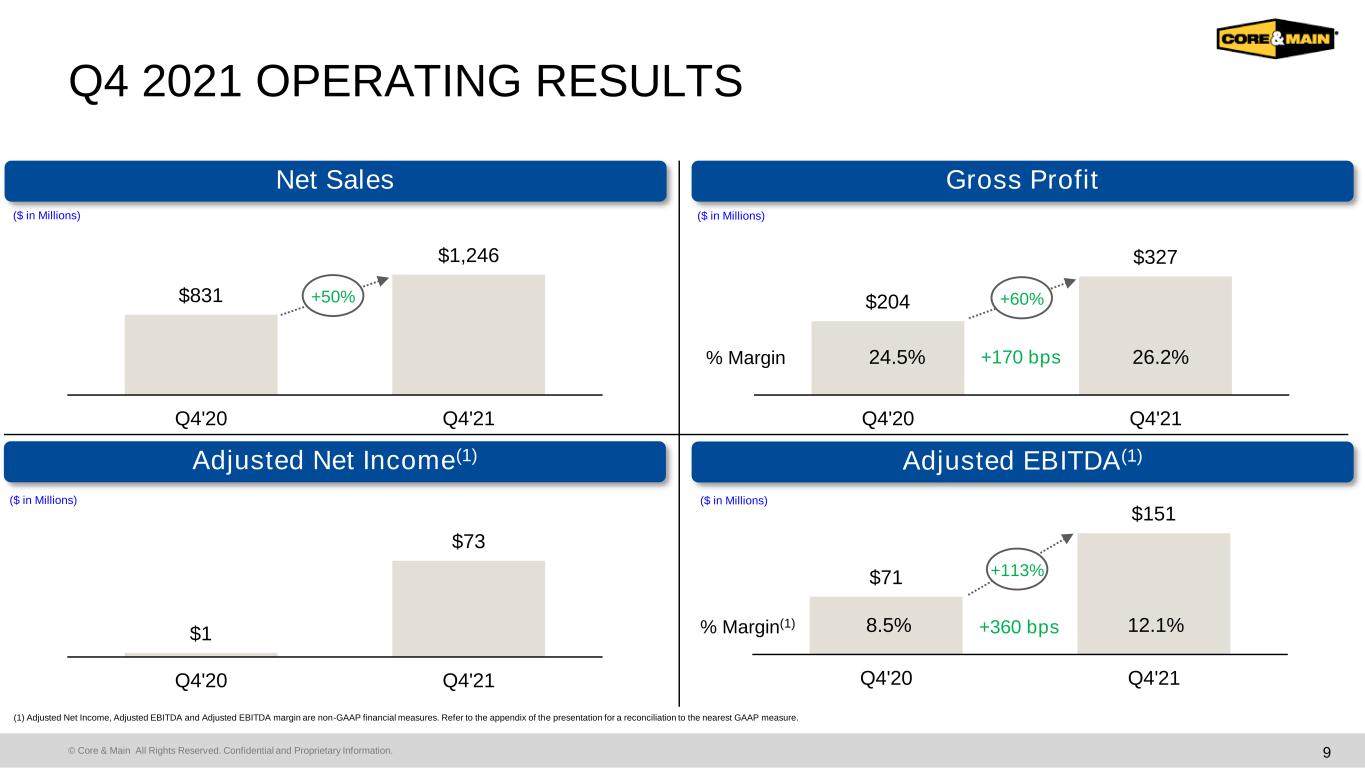
Net sales increased 50% to $1,246 million
Gross profit margin increased 170 basis points to 26.2%
Net income increased to $79 million from zero in the prior year
Adjusted EBITDA (Non-GAAP) increased 113% to $151 million
Adjusted EBITDA margin (Non-GAAP) increased 360 basis points to 12.1%
Closed the Catalone Pipe & Supply Co. acquisition in the fourth quarter and acquired Dodson Engineered Products, Inc. subsequent to year-end

Fiscal Year 2021 Highlights (Compared with Fiscal 2020)
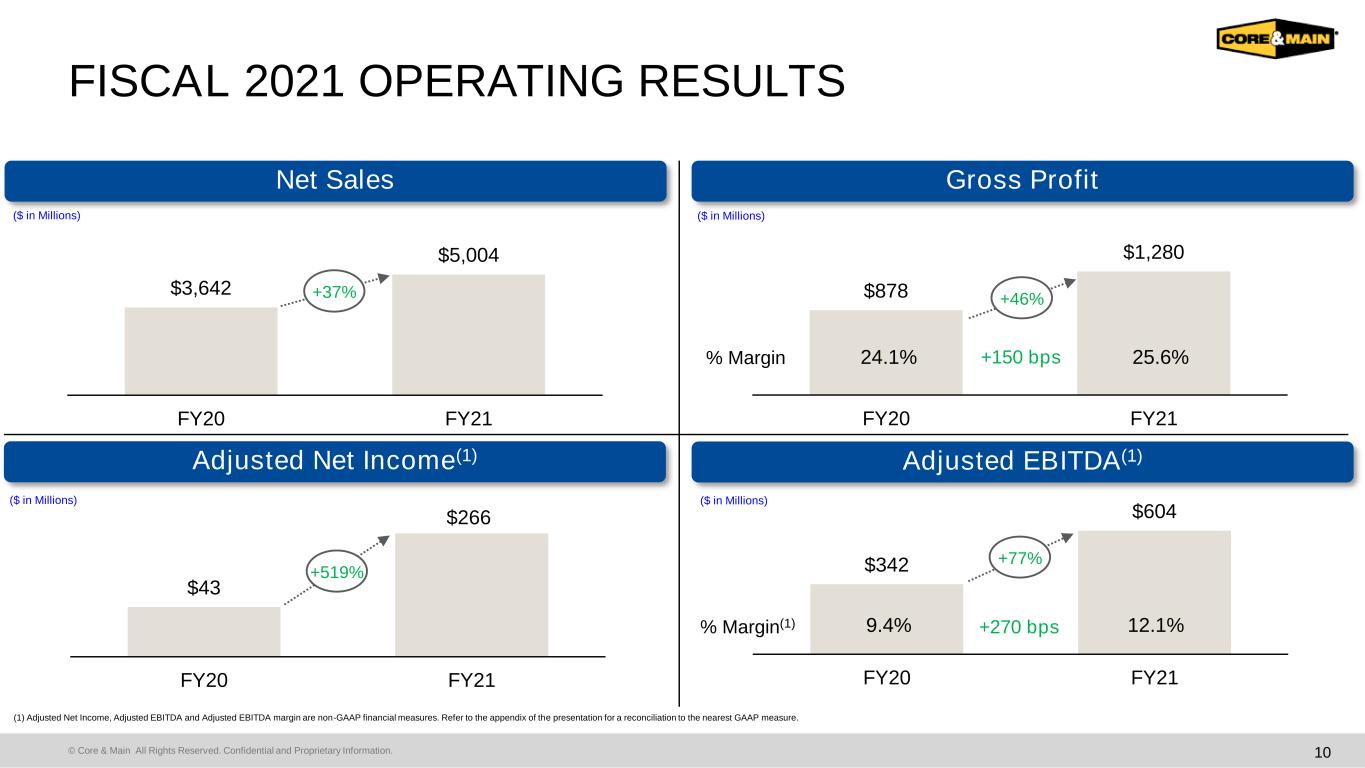
Net sales increased 37% to $5,004 million
Gross profit margin increased 150 basis points to 25.6%
Net income increased $188 million to $225 million
Adjusted EBITDA (Non-GAAP) increased 77% to $604 million
Adjusted EBITDA margin (Non-GAAP) increased 270 basis points to 12.1%
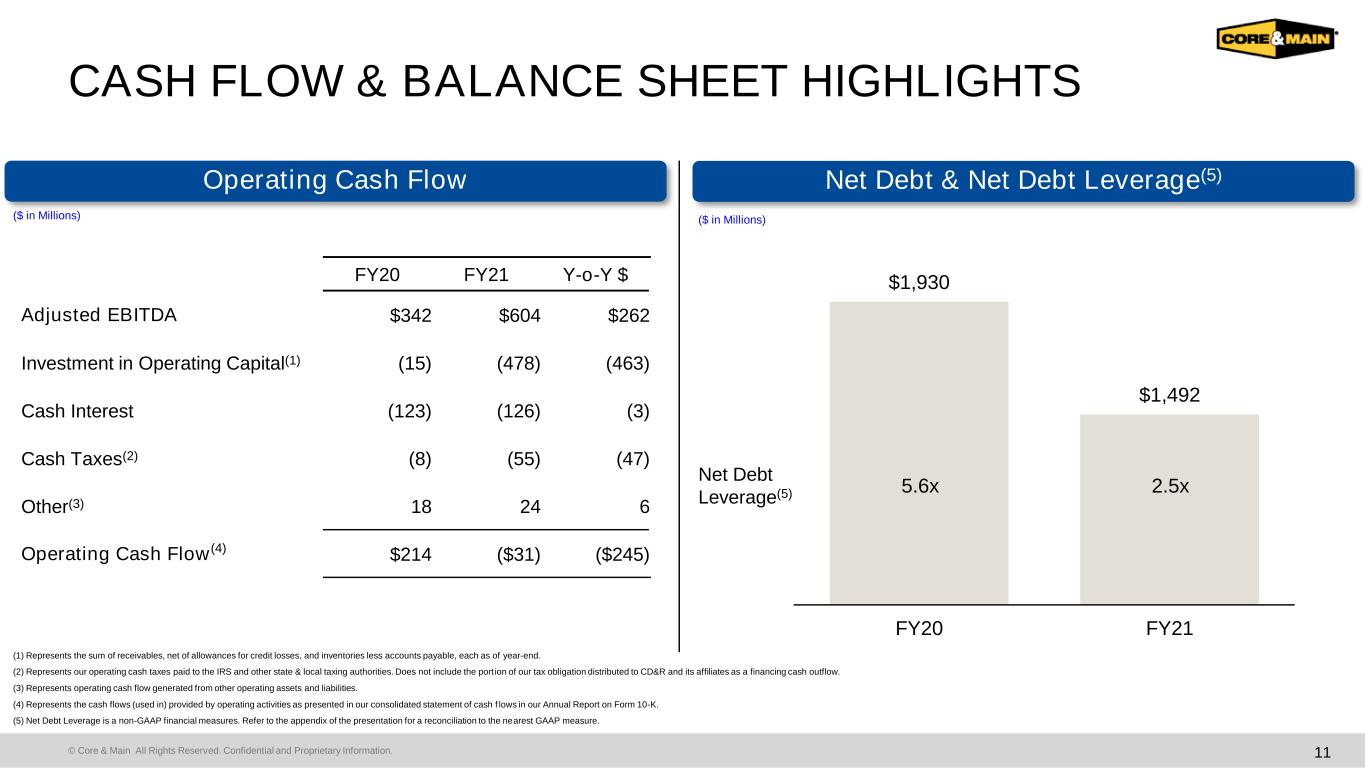
Net Debt Leverage (Non-GAAP) (using Adjusted EBITDA on a trailing 12-month basis) decreased to 2.5x as of January 30, 2022 compared with 5.6x as of January 31, 2021

“Core & Main continued to deliver exceptional results in the fourth quarter, allowing us to achieve record financial and operational performance in fiscal 2021,” said Steve LeClair, chief executive officer of Core & Main.

“Net sales grew 37% in fiscal 2021 driven by strong demand across each of our end markets, higher average selling prices as we passed along rising materials costs, solid performance across our sales initiatives to deliver market share gains and acquisitions. Our teams leveraged the strong sales growth through the expansion of our margin enhancement initiatives and disciplined cost management to achieve record profitability in fiscal 2021. We did this while serving our customers better than ever before, which is reflected by our outperformance in a challenging year.

We finished the year strong from an M&A standpoint, adding five extraordinary businesses to our team throughout the year and acquiring Dodson Engineered Products, Inc. subsequent to year-end. Each of these acquisitions fits well within our M&A strategy, offering expansion into new geographies, access to new product lines, consolidation of existing market positions and the addition of key talent.”

LeClair concluded, "I’m proud of all we achieved in fiscal 2021 and want to thank our associates for their unwavering dedication and commitment to superior customer service. When confronted with a challenging operating environment, our associates adapted and continued delivering on our promise of providing our customers with local knowledge, local experience and local service, nationwide. I also want to thank our customers and suppliers for their great partnership through these challenging times. As I look ahead, I am confident that Core & Main is investing in the right areas, at the right time. We intend to continue investing in value-creating growth opportunities as we move forward, including M&A. We are deepening our competitive advantage and building on our foundation of long-term, profitable growth. We have gained significant market share, built robust capabilities, and are in an excellent position to deliver strong performance in fiscal 2022 and for years to come.”


Three Months Ended January 30, 2022

Net sales for the three months ended January 30, 2022 increased $415 million, or 50%, to $1,246 million compared with $831 million in the prior year period. The increase in net sales was primarily attributable to higher average selling prices, representing approximately two-thirds of the net sales increase, strong market volume growth, share gains from sales initiatives and having preferred access to products during a period of material shortages, and acquisitions.

Gross profit for the three months ended January 30, 2022 increased $123 million, or 60%, to $327 million compared with $204 million in the prior year period. Gross profit as a percentage of net sales for the three months ended January 30, 2022 was 26.2% compared with 24.5% in the prior year period, an improvement of 170 basis points. The increase in gross profit as a percentage of net sales was primarily attributable to strategic inventory investments ahead of announced price increases, a favorable pricing environment, the execution of our gross margin initiatives, achievement of growth-based supplier incentives and accretive acquisitions.

Selling, general and administrative (“SG&A”) expenses for the three months ended January 30, 2022 increased $45 million, or 33%, to $183 million compared with $138 million in the prior year period. The increase was primarily driven by higher variable compensation costs, increased headcount, volume driven increases in other distribution costs and incremental costs from acquisitions. SG&A as a percentage of net sales for the three months ended January 30, 2022 was 14.7% compared with 16.6% in the prior year period, an improvement of approximately 190 basis points due to our ability to leverage our fixed costs.

Net income for the three months ended January 30, 2022 increased $79 million to $79 million. The increase in net income was primarily attributable to higher operating income and lower interest expense due to lower debt levels, partially offset by an increase in income taxes.

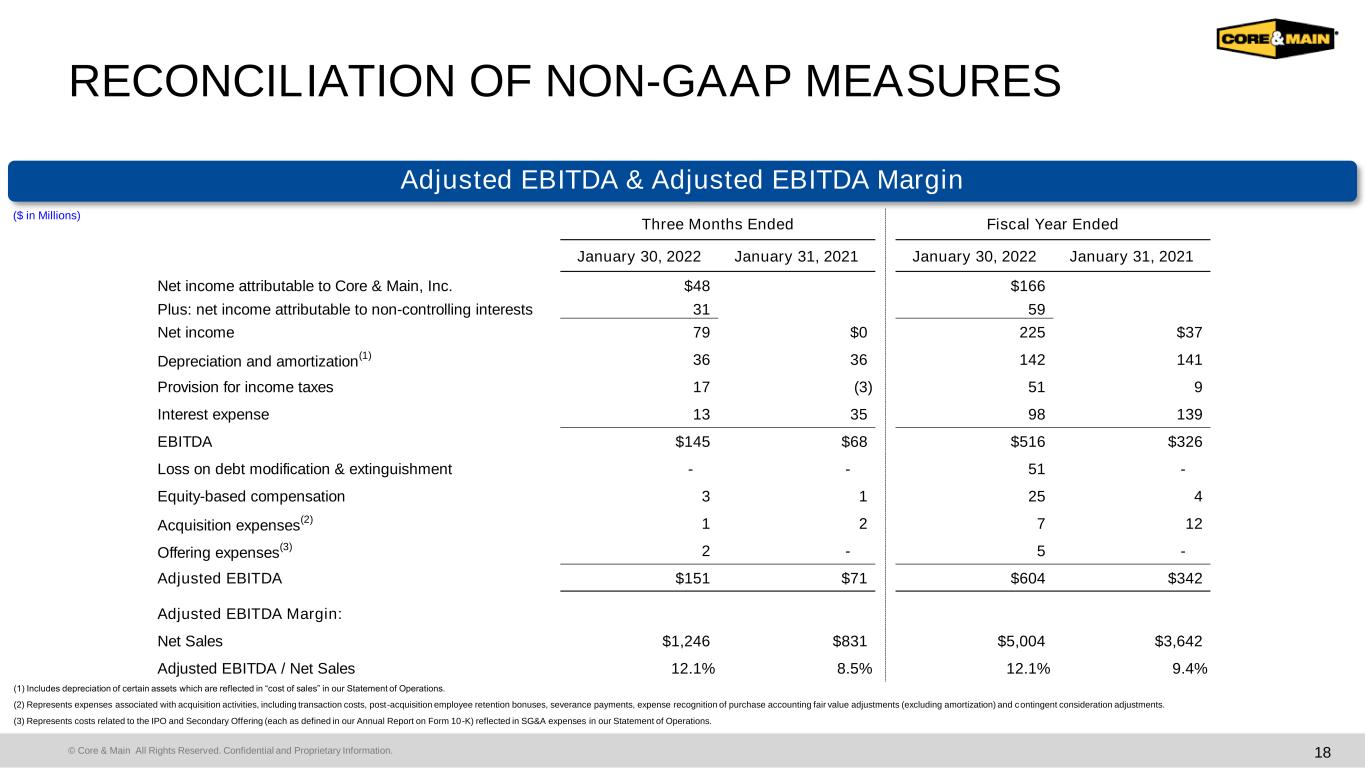
Adjusted EBITDA (Non-GAAP) for the three months ended January 30, 2022 increased $80 million, or 113%, to $151 million compared with $71 million in the prior year period. Growth in Adjusted EBITDA was primarily attributable to higher net sales, improved gross profit margins, and leveraging our cost structure on the increase in net sales and gross profit. Adjusted EBITDA margin increased 360 basis points to 12.1% from 8.5% in the prior year period.

Fiscal Year Ended January 30, 2022

Net sales for fiscal 2021 increased $1,362 million, or 37%, to $5,004 million compared with $3,642 million for fiscal 2020. The increase in net sales was primarily attributable to higher average selling prices, representing approximately half of the net sales increase, strong market volume growth, share gains from sales initiatives and from having preferred access to products during a period of material shortages, and acquisitions.

Gross profit for fiscal 2021 increased $402 million, or 46%, to $1,280 million compared with $878 million for fiscal 2020. Gross profit as a percentage of net sales for fiscal 2021 was 25.6% compared with 24.1% for fiscal 2020, an improvement of 150 basis points. The increase in gross profit as a percentage of net sales was primarily attributable to strategic inventory investments ahead of announced price increases, a favorable pricing environment, the execution of our gross margin initiatives, achievement of growth-based supplier incentives and accretive acquisitions.

SG&A expenses for fiscal 2021 increased $161 million, or 29%, to $717 million compared with $556 million for fiscal 2020. The increase was primarily driven by higher variable compensation costs and increased headcount, lower discretionary spending in response to COVID-19 in fiscal 2020, volume driven increases in other distribution costs and incremental costs from acquisitions. In addition, during fiscal 2021, SG&A expenses increased by $21 million related to higher equity-based compensation expense due to accounting for equity awards and $5 million of other one-time costs in connection with our initial public offering of shares of Class A common stock in July 2021 (the "IPO") and the secondary offering of shares of Class A common stock by certain shareholders in January 2022 (the "Secondary Offering"). SG&A expenses as a percentage of net sales for fiscal 2021 was 14.3% compared with 15.3% for fiscal 2020, an improvement of approximately 100 basis points due to our ability to leverage our fixed costs, partially offset by higher equity-based compensation.

Net income for fiscal 2021 increased $188 million to $225 million compared with $37 million for fiscal 2020. The increase in net income was primarily attributable to higher operating income and lower interest expense related to the refinancing transactions completed in connection with the IPO in July 2021 (the "Refinancing Transactions"), partially offset by the $51 million loss on debt modification and an increase in income taxes.


Adjusted EBITDA (Non-GAAP) for fiscal 2021 increased $262 million, or 77%, to $604 million compared with $342 million for fiscal 2020. Growth in Adjusted EBITDA was primarily attributable to higher net sales, improved gross profit margins, and leveraging our cost structure on the increase in net sales and gross profit. Adjusted EBITDA margin increased 270 basis points to 12.1% from 9.4% for fiscal 2020.

Capital Structure and Liquidity

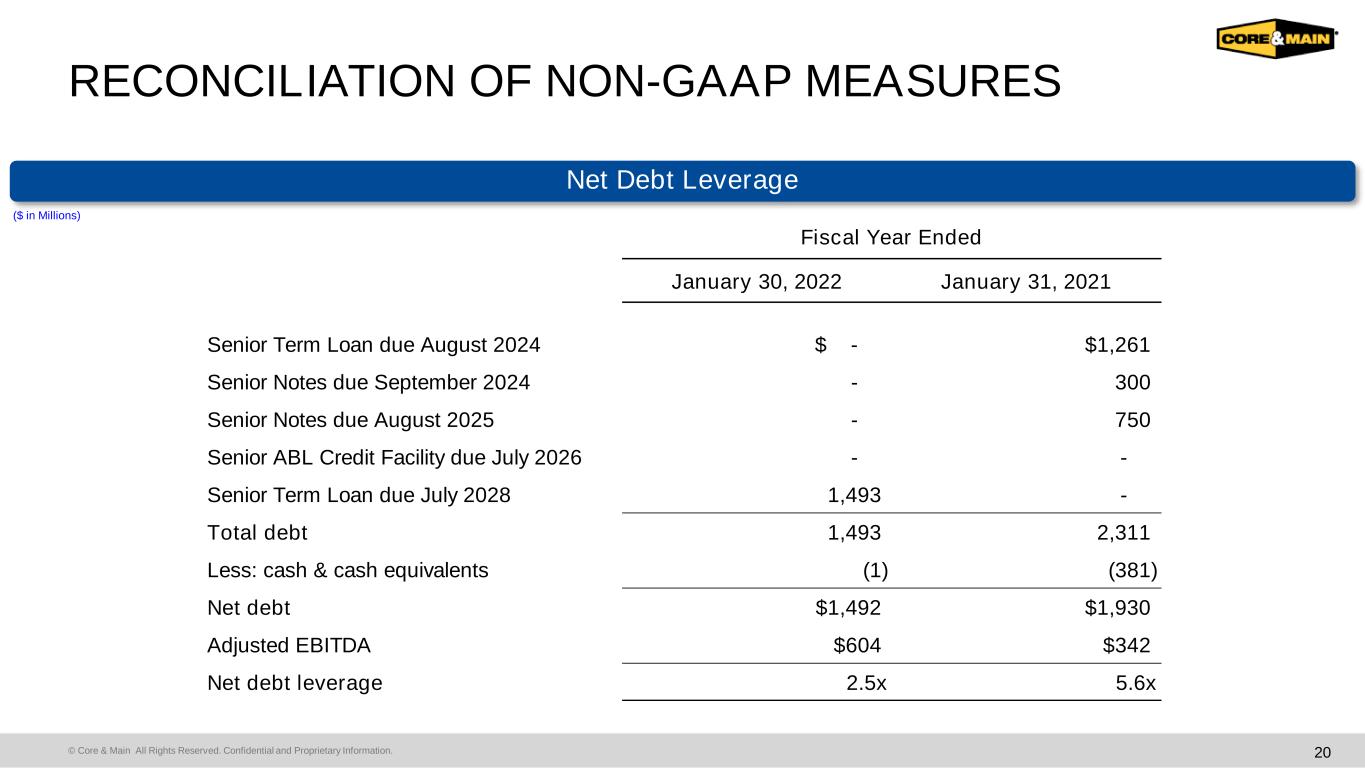
Net debt, calculated as gross consolidated debt net of cash and cash equivalents, as of January 30, 2022 was $1,492 million. Net Debt Leverage (defined as the ratio of net debt to Adjusted EBITDA for the last 12 months) was 2.5x, an improvement of 3.1x from January 31, 2021. The improvement was attributable to debt repayment from the proceeds of the IPO and the subsequent Refinancing Transactions, in addition to an increase in Adjusted EBITDA.

As of January 30, 2022, Core & Main had total liquidity of $842 million, consisting of $1 million of cash and cash equivalents and approximately $841 million of excess availability under our asset-based revolving credit facility, which is net of approximately $9 million of outstanding letters of credit.

Fiscal 2022 Outlook

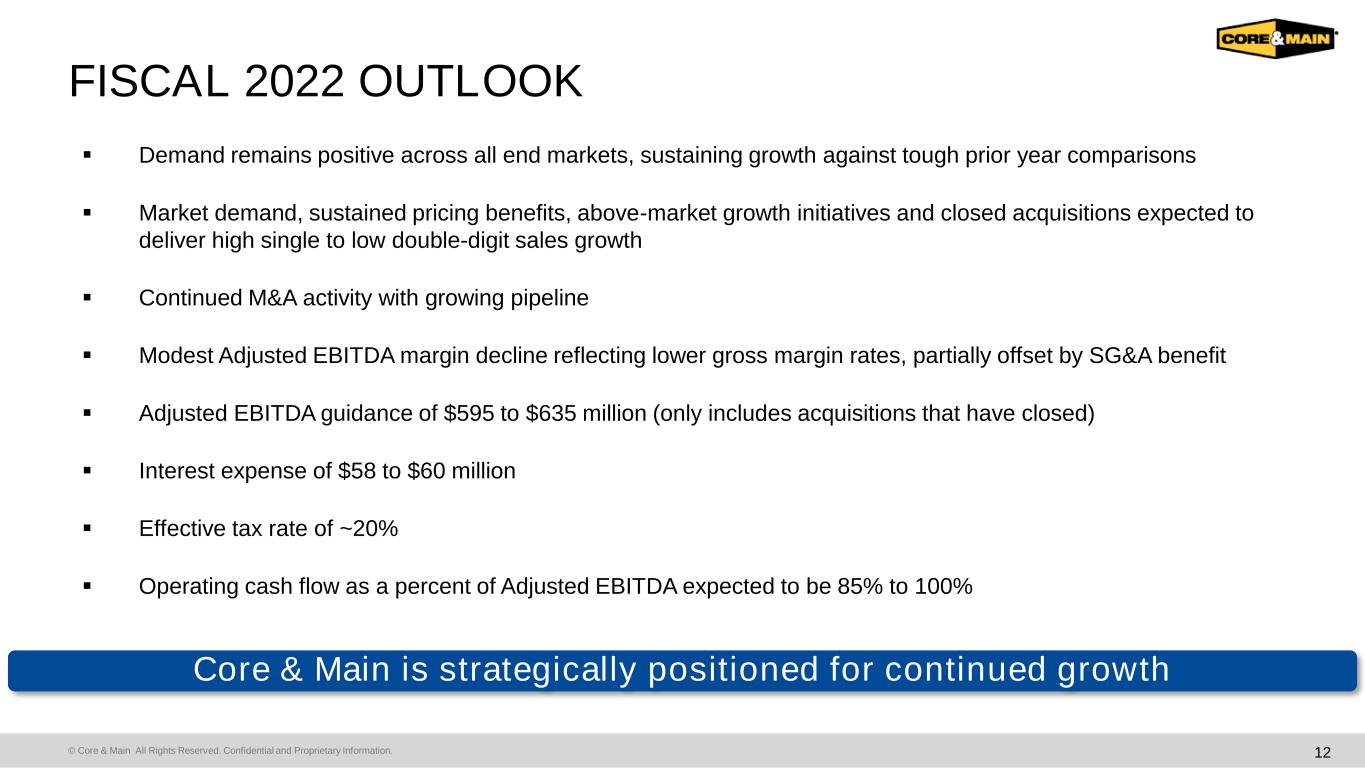
"We are very pleased with the momentum in our business and the positive underlying market tailwinds,” LeClair continued. “As we look across fiscal 2022, we expect net sales to grow in the high single to low double-digit range, with strong growth in the first half of the year but moderating in the second half with more difficult comparisons. We expect Adjusted EBITDA to be in the range of $595 million to $635 million. Our outlook includes only the acquisitions that have already closed.”

Conference Call & Webcast Information

Core & Main will host a conference call and webcast on March 30, 2022 at 8:30 a.m. EDT to discuss the Company's financial results. The live webcast will be accessible via the events calendar at ir.coreandmain.com. The conference call also may be accessed by dialing (844) 200-6205 or +1 (929) 526-1599 (international). The passcode for the live call is 677202. To ensure participants are connected for the full call, please dial in at least 10 minutes prior to the start of the call.

An archived version of the webcast will be available immediately following the call. A slide presentation highlighting Core & Main’s results and key performance indicators will also be made available on the Investor Relations section of Core & Main’s website prior to the call.

About Core & Main

Based in St. Louis, Core & Main is a leading specialized distributor of water, wastewater, storm drainage and fire protection products, and related services, to municipalities, private water companies and professional contractors across municipal, non-residential and residential end markets nationwide. With approximately 300 locations, the company provides its customers local expertise backed by a national supply chain. Core & Main’s 4,100 associates are committed to helping their communities thrive with safe and sustainable infrastructure. Visit coreandmain.com to learn more.

Cautionary Note Regarding Forward-Looking Statements

Certain statements contained in this press release include “forward-looking statements” within the meaning of the Private Securities Litigation Reform Act of 1995. Examples of forward-looking statements include information concerning Core & Main’s financial and operating outlook, as well as any other statement that does not directly relate to any historical or current fact. In some cases, you can identify forward-looking statements by terminology such as “may,” “will,” “could,” “should,” “forecasts,” “expects,” “intends,” “plans,” “anticipates,” “projects,” “outlook,” “believes,” “estimates,” “predicts,” “potential,” “continue,” “preliminary,” or the negative of these terms or other comparable terminology. Although we believe that the expectations reflected in the forward-looking statements are reasonable, we can give you no assurance these expectations will prove to have been correct. These forward-looking statements relate to future events or our future financial performance and involve known and unknown risks, uncertainties and other factors that may cause our actual results, levels of activity, performance, or achievements to differ materially from any future results, levels of activity, performance, or achievements expressed or implied by these forward-looking statements.


Factors that could cause actual results and outcomes to differ from those reflected in forward-looking statements include, without limitation, declines, volatility and cyclicality in the U.S. residential and non-residential construction markets; slowdowns in municipal infrastructure spending and delays in appropriations of federal funds; price fluctuations in our product costs, particularly with respect to the commodity-based products that we sell; our ability to manage our inventory effectively, including during periods of supply chain disruptions; our ability to obtain product; general business and economic conditions; risks involved with acquisitions and other strategic transactions, including our ability to identify, acquire, close or integrate acquisition targets successfully; the impact of seasonality and weather-related impacts, including natural disasters or similar extreme weather events; the fragmented and highly competitive markets in which we compete and consolidation within our industry; our ability to competitively bid for municipal and private contracts; the development of alternatives to distributors of our products in the supply chain; our ability to hire, engage and retain key personnel, including sales representatives, qualified branch, district and region managers and senior management; our ability to identify, develop and maintain relationships with a sufficient number of qualified suppliers and the potential that our exclusive or restrictive supplier distribution rights are terminated; the availability and cost of freight and energy, such as fuel; the ability of our customers to make payments on credit sales; changes in supplier rebates or other terms of our supplier agreements; our ability to identify and introduce new products and product lines effectively; the spread of, and response to, COVID-19, and the inability to predict the ultimate impact on us; costs and potential liabilities or obligations imposed by environmental, health and safety laws and requirements; regulatory change and the costs of compliance with regulation; exposure to product liability, construction defect and warranty claims and other litigation and legal proceedings; potential harm to our reputation; difficulties with or interruptions of our fabrication services; safety and labor risks associated with the distribution of our products as well as work stoppages and other disruptions due to labor disputes; impairment in the carrying value of goodwill, intangible assets or other long-lived assets; the domestic and international political environment with regard to trade relationships and tariffs, as well as difficulty sourcing products as a result of import constraints; our ability to operate our business consistently through highly dispersed locations across the United States; interruptions in the proper functioning of our information technology systems, including from cybersecurity threats; risks associated with raising capital; risks associated with raising capital; our ability to continue our customer relationships with short-term contracts; risks associated with exporting our products internationally; our ability to renew or replace our existing leases on favorable terms or at all; our ability to maintain effective internal controls over financial reporting and remediate any material weaknesses; our substantial indebtedness and the potential that we may incur additional indebtedness; the limitations and restrictions in the agreements governing our indebtedness, the Second Amended and Restated Agreement of Limited Partnership of Holdings and the Tax Receivable Agreements (each as defined in our Annual Report on Form 10-K for the annual period ended January 30, 2022); increases in interest rates and the impact of transitioning from LIBOR as the benchmark rate in contracts; changes in our credit ratings and outlook; our ability to generate the significant amount of cash needed to service our indebtedness; our organizational structure, including our payment obligations under the Tax Receivable Agreements, which may be significant; our ability to sustain an active, liquid trading market for our Class A common stock; the significant influence that CD&R has over us and potential conflicts between the interests of CD&R and other stockholders; and risks related to other factors discussed under “Risk Factors” in our Annual Report on Form 10-K.

Additional information concerning these and other factors can be found in our filings with the Securities and Exchange Commission. All forward-looking statements attributable to us or persons acting on our behalf are expressly qualified in their entirety by the foregoing cautionary statements. All such statements speak only as of the date made and, except as required by law, we undertake no obligation to update or revise publicly any forward-looking statements, whether as a result of new information, future events, or otherwise.

Contact:
Robyn Bradbury
VP, Investor Relations and FP&A
(314) 995-9116
[email protected]


CORE & MAIN, INC.
CONSOLIDATED STATEMENTS OF OPERATIONS
Amounts in millions (except share and per share data)

Three Months EndedFiscal Year Ended
January 30, 2022January 31, 2021January 30, 2022January 31, 2021
Net sales$1,246 $831 $5,004 $3,642 
Cost of sales919 627 3,724 2,764 
Gross profit327 204 1,280 878 
Operating expenses:
Selling, general and administrative183 138 717 556 
Depreciation and amortization35 34 138 137 
Total operating expenses218 172 855 693 
Operating income109 32 425 185 
Interest expense13 35 98 139 
Loss on debt modification and extinguishment— — 51 — 
Income (loss) before provision for income taxes96 (3)276 46 
Provision for (benefit from) income taxes17 (3)51 
Net income79 $— 225 $37 
Less: net income attributable to non-controlling interests (1)
31 59 
Net income attributable to Core & Main, Inc. (1)
$48 $166 
Earnings per share (2)
Basic$0.29 $0.57 
Diluted$0.28 $0.55 
Number of shares used in computing EPS (2)
Basic161,768,901 159,188,391 
Diluted245,775,819 244,451,678 

(1)For the fiscal year ended January 30, 2022, the net income attributable to Core & Main, Inc. includes net income prior to the Reorganization Transactions (as described in Note 1 to the consolidated financial statements included in our Annual Report on Form 10-K for the annual period ended January 30, 2022) of $74 million and net income subsequent to the Reorganization Transactions of $92 million. Refer to the Statements of Changes in Stockholders' Equity/Partners' Capital for a summary of net income attributable to Core & Main, Inc. subsequent to the Reorganization Transactions. See Note 1 for a description of the Basis of Presentation of the consolidated financial statements.

(2)Represents basic and diluted earnings per share of Class A common stock and weighted average shares of Class A common stock outstanding for the period from July 23, 2021 through January 30, 2022, which is the period following the Reorganization Transactions. The Company analyzed the calculation of earnings per share for the periods prior to the Reorganization Transactions and determined that it resulted in values that would not be meaningful to the users of the consolidated financial statements. Therefore, there is no earnings per share attributable to Core & Main, Inc. for the periods prior to the Reorganization Transactions on July 22, 2021.


CORE & MAIN, INC.
CONSOLIDATED BALANCE SHEETS
Amounts in millions (except share and per share data)

January 30, 2022January 31, 2021
ASSETS
Current assets:
Cash and cash equivalents$$381 
Receivables, net of allowance for credit losses of $5 and $5884 557 
Inventories856 384 
Prepaid expenses and other current assets26 15 
Total current assets1,767 1,337 
Property, plant and equipment, net94 86 
Operating lease right-of-use assets152 129 
Intangible assets, net871 919 
Goodwill1,515 1,453 
Other assets35 — 
Total assets$4,434 $3,924 
LIABILITIES AND STOCKHOLDERS’ EQUITY/PARTNERS’ CAPITAL
Current liabilities:
Current maturities of long-term debt$15 $13 
Accounts payable608 326 
Accrued compensation and benefits109 71 
Current operating lease liabilities49 43 
Other current liabilities58 69 
Total current liabilities839 522 
Long-term debt1,456 2,252 
Non-current operating lease liabilities103 86 
Deferred income taxes35 232 
Payable to related parties pursuant to Tax Receivable Agreements153 — 
Other liabilities17 31 
Total liabilities2,603 3,123 
Commitments and contingencies
Partners’ capital— 801 
Class A common stock, par value $0.01 per share, 1,000,000,000 shares authorized, 167,522,403 shares issued and outstanding as of January 30, 2022— 
Class B common stock, par value $0.01 per share, 500,000,000 shares authorized, 78,398,141 shares issued and outstanding as of January 30, 2022— 
Additional paid-in capital1,214 — 
Retained earnings92 — 
Accumulated other comprehensive income16 — 
Total stockholders’ equity/partners’ capital attributable to Core & Main, Inc.1,325 801 
Non-controlling interests506 — 
Total stockholders’ equity/partners’ capital1,831 801 
Total liabilities and stockholders’ equity/partners’ capital$4,434 $3,924 


CORE & MAIN, INC.
CONSOLIDATED STATEMENTS OF CASH FLOWS
Amounts in millions

Fiscal Year Ended
January 30, 2022January 31, 2021
Cash Flows From Operating Activities:
Net income$225 $37 
Adjustments to reconcile net cash from operating activities:
Depreciation and amortization150 153 
Provision for bad debt
Non-cash inventory charge
Equity-based compensation expense25 
Loss on debt modification and extinguishment 49 — 
Other(17)(2)
Changes in assets and liabilities:
(Increase) decrease in receivables(312)(28)
(Increase) decrease in inventories(440)(27)
(Increase) decrease in other assets(7)
Increase (decrease) in accounts payable274 40 
Increase (decrease) in accrued liabilities24 15 
Increase (decrease) in other liabilities(5)11 
Net cash (used in) provided by operating activities(31)214 
Cash Flows From Investing Activities:
Capital expenditures(20)(12)
Acquisitions of businesses, net of cash acquired(179)(217)
Settlement of interest rate swap(5)— 
Proceeds from the sale of property and equipment— 
Net cash used in investing activities(203)(229)
Cash Flows From Financing Activities:
IPO proceeds, net of underwriting discounts and commissions664 — 
Offering proceeds from underwriters’ option, net of underwriting discounts and commissions100 — 
Payments for offering costs(8)— 
Investments from non-controlling interest holders— 
Distributions to non-controlling interest holders(52)(15)
Borrowings on asset-based revolving credit facility18 460 
Repayments on asset-based revolving credit facility(18)(460)
Issuance of long-term debt1,500 250 
Repayments of long-term debt(2,319)(13)
Payment of debt redemption premiums(18)— 
Debt issuance costs(13)(8)
Net cash (used in) provided by financing activities(146)215 
(Decrease) increase in cash and cash equivalents(380)200 
Cash and cash equivalents at the beginning of the period381 181 
Cash and cash equivalents at the end of the period$$381 
Cash paid for interest$126 $123 
Cash paid for taxes$55 $


Non-GAAP Financial Measures
In addition to providing results that are determined in accordance with GAAP, we present EBITDA, Adjusted EBITDA, Adjusted EBITDA margin and Net Debt Leverage, which are non-GAAP financial measures. These measures are not considered measures of financial performance or liquidity under GAAP and the items excluded therefrom are significant components in understanding and assessing our financial performance or liquidity. These measures should not be considered in isolation or as alternatives to GAAP measures such as net income or net income attributable to Core & Main, Inc., as applicable, cash provided by or used in operating, investing or financing activities or other financial statement data presented in our financial statements as an indicator of our financial performance or liquidity.
We define EBITDA as net income or net income attributable to Core & Main, Inc., as applicable, adjusted for non-controlling interests, depreciation and amortization, provision for income taxes and interest expense. We define Adjusted EBITDA as EBITDA as further adjusted for certain items management believes are not reflective of the underlying operations of our business, including (a) loss on debt modification and extinguishment, (b) equity-based compensation, (c) expenses associated with the IPO and subsequent secondary offering and (d) expenses associated with acquisition activities. Net income attributable to Core & Main, Inc. is the most directly comparable GAAP measure to EBITDA and Adjusted EBITDA. We define Adjusted EBITDA margin as Adjusted EBITDA divided by net sales. We define Net Debt Leverage as total consolidated debt (gross of unamortized discounts and debt issuance costs), net of cash and cash equivalents, divided by Adjusted EBITDA for the last twelve months.
We use EBITDA, Adjusted EBITDA, Adjusted EBITDA margin and Net Debt Leverage to assess the operating results and effectiveness and efficiency of our business, Adjusted EBITDA includes amounts otherwise attributable to non-controlling interests as we manage the consolidated company and evaluate operating performance in a similar manner. We present these non-GAAP financial measures because we believe that investors consider them to be important supplemental measures of performance, and we believe that these measures are frequently used by securities analysts, investors and other interested parties in the evaluation of companies in our industry. Non-GAAP financial measures as reported by us may not be comparable to similarly titled metrics reported by other companies and may not be calculated in the same manner. These measures have limitations as analytical tools, and you should not consider them in isolation or as substitutes for analysis of our results as reported under GAAP. For example, EBITDA and Adjusted EBITDA:

• do not reflect the significant interest expense or the cash requirements necessary to service interest or principal payments on debt;

• do not reflect income tax expenses, the cash requirements to pay taxes or related distributions;

• do not reflect cash requirements to replace in the future any assets being depreciated and amortized; and

• exclude certain transactions or expenses as allowed by the various agreements governing our indebtedness.

EBITDA, Adjusted EBITDA, Adjusted EBITDA margin and Net Debt Leverage are not alternative measures of financial performance or liquidity under GAAP and therefore should be considered in conjunction with net income, net income attributable to Core & Main, Inc. and other performance measures such as gross profit or net cash provided by or used in operating, investing or financing activities and not as alternatives to such GAAP measures. In evaluating Adjusted EBITDA, you should be aware that, in the future, we may incur expenses similar to those eliminated in this presentation.
No reconciliation of the estimated range for Adjusted EBITDA for fiscal 2022 is included herein because we are unable to quantify certain amounts that would be required to be included in net income attributable to Core & Main, Inc., the most directly comparable GAAP measure, without unreasonable efforts due to the high variability and difficulty to predict certain items excluded from Adjusted EBITDA. Consequently, we believe such reconciliation would imply a degree of precision that would be misleading to investors. In particular, the effects of acquisition expenses and associated taxes cannot be reasonably predicted in light of the inherent difficulty in quantifying such items on a forward-looking basis. We expect the variability of these excluded items may have an unpredictable, and potentially significant, impact on our future GAAP financial results.


The following tables set forth a reconciliation of net income or net income attributable to Core & Main, Inc. to EBITDA and Adjusted EBITDA, as applicable, for the periods presented, as well as a calculation of Adjusted EBITDA margin for the periods presented:

(Amounts in millions)Three Months EndedFiscal Year Ended
January 30, 2022January 31, 2021January 30, 2022January 31, 2021
Net income attributable to Core & Main, Inc.$48 $166 
Plus: net income attributable to non-controlling interests31 59 
Net income79 $— 225 $37 
Depreciation and amortization (1)
36 36 142 141 
Provision for (benefit from) income taxes17 (3)51 
Interest expense13 35 98 139 
EBITDA$145 $68 $516 $326 
Loss on debt modification and extinguishment— — 51 — 
Equity-based compensation25 
Acquisition expenses (2)
12 
Offering expenses (3)
— — 
Adjusted EBITDA$151 $71 $604 $342 
Adjusted EBITDA Margin:
Net Sales$1,246 $831 $5,004 $3,642 
Adjusted EBITDA / Net Sales12.1 %8.5 %12.1 %9.4 %

(1)Includes depreciation of certain assets which are reflected in “cost of sales” in our Statement of Operations in the consolidated financial statements included in our Annual Report on Form 10-K.

(2)Represents expenses associated with acquisition activities, including transaction costs, post-acquisition employee retention bonuses, severance payments, expense recognition of purchase accounting fair value adjustments (excluding amortization) and contingent consideration adjustments.

(3)Represents costs related to the IPO and Secondary Offering reflected in SG&A expenses in our Statement of Operations in the consolidated financial statements included in our Annual Report on Form 10-K.


The following table sets forth a calculation of Net Debt Leverage for the periods presented:

(Amounts in millions)As Of
January 30, 2022January 31, 2021
Senior ABL Credit Facility due July 2026$— $— 
Senior Term Loan due August 2024— 1,261 
Senior Notes due September 2024— 300 
Senior Notes due August 2025— 750 
Senior Term Loan due 20281,493 — 
Total Debt1,493 2,311 
Less: Cash & Cash Equivalents(1)(381)
Net Debt$1,492 $1,930 
Twelve Months Ended Adjusted EBITDA$604 $342 
Net Debt Leverage2.5x5.6x

Fiscal 2021 Fourth Quarter and Full-Year Results MARCH 30, 2022

 
© Core & Main All Rights Reserved. Confidential and Proprietary Information. CAUTIONARY STATEMENTS 2 Cautionary Note Regarding Forward-Looking Statements This presentation and accompanying discussion may include “forward-looking statements” within the meaning of the Private Securities Litigation Reform Act of 1995. Some of the forward-looking statements can be identified by the use of forward-looking terms such as “believes,” “expects,” “may,” “will,” “shall,” “should,” “would,” “could,” “seeks,” “aims,” “projects,” “is optimistic,” “intends,” “plans,” “estimates,” “anticipates” or the negative versions of these words or other comparable terms. Forward-looking statements include, without limitation, all matters that are not historical facts. They include, without limitation, statements regarding our intentions, beliefs, assumptions or current expectations concerning, among other things, our financial position, results of operations, cash flows, prospects and growth strategies. Forward-looking statements are subject to known and unknown risks and uncertainties, many of which may be outside our control. We caution you that forward-looking statements are not guarantees of future performance or outcomes and that actual performance and outcomes, including, without limitation, our actual results of operations, financial condition and liquidity, and the development of the market in which we operate, may differ materially from those made in or suggested by the forward-looking statements contained in this presentation. In addition, even if our results of operations, financial condition and cash flows, and the development of the market in which we operate, are consistent with the forward-looking statements contained in this presentation, those results or developments may not be indicative of results or developments in subsequent periods. Furthermore, new risks and uncertainties emerge from time to time, and it is not possible for us to predict all risks and uncertainties that could have an impact on the forward-looking statements contained in this presentation. Factors that could cause actual results and outcomes to differ from those reflected in forward- looking statements include, without limitation: declines, volatility and cyclicality in the U.S. residential and non-residential construction markets; slowdowns in municipal infrastructure spending and delays in appropriations of federal funds; price fluctuations in our product costs, particularly with respect to the commodity-based products that we sell; our ability to manage our inventory effectively, including during periods of supply chain disruptions; our ability to obtain product; general business and economic conditions; risks involved with acquisitions and other strategic transactions, including our ability to identify, acquire, close or integrate acquisition targets successfully; the impact of seasonality and weather-related impacts, including natural disasters or similar extreme weather events; the fragmented and highly competitive markets in which we compete and consolidation within our industry; our ability to competitively bid for municipal and private contracts; the development of alternatives to distributors of our products in the supply chain; our ability to hire, engage and retain key personnel, including sales representatives, qualified branch, district and region managers and senior management; our ability to identify, develop and maintain relationships with a sufficient number of qualified suppliers and the potential that our exclusive or restrictive supplier distribution rights are terminated; the availability and cost of freight and energy, such as fuel; the ability of our customers to make payments on credit sales; changes in supplier rebates or other terms of our supplier agreements; our ability to identify and introduce new products and product lines effectively; the spread of, and response to, COVID-19, and the inability to predict the ultimate impact on us; costs and potential liabilities or obligations imposed by environmental, health and safety laws and requirements; regulatory change and the costs of compliance with regulation; exposure to product liability, construction defect and warranty claims and other litigation and legal proceedings; potential harm to our reputation; difficulties with or interruptions of our fabrication services; safety and labor risks associated with the distribution of our products as well as work stoppages and other disruptions due to labor disputes; impairment in the carrying value of goodwill, intangible assets or other long-lived assets; the domestic and international political environment with regard to trade relationships and tariffs, as well as difficulty sourcing products as a result of import constraints; our ability to operate our business consistently through highly dispersed locations across the United States; interruptions in the proper functioning of our information technology systems, including from cybersecurity threats; risks associated with raising capital; our ability to continue our customer relationships with short-term contracts; risks associated with exporting our products internationally; our ability to renew or replace our existing leases on favorable terms or at all; our ability to maintain effective internal controls over financial reporting and remediate any material weaknesses; our substantial indebtedness and the potential that we may incur additional indebtedness; the limitations and restrictions in the agreements governing our indebtedness, the Second Amended and Restated Agreement of Limited Partnership of Holdings and the Tax Receivable Agreements (each as defined herein);increases in interest rates and the impact of transitioning from LIBOR (as defined herein) as the benchmark rate in contracts; changes in our credit ratings and outlook; our ability to generate the significant amount of cash needed to service our indebtedness; our organizational structure, including our payment obligations under the Tax Receivable Agreements, which may be significant; our ability to sustain an active, liquid trading market for our Class A common stock; the significant influence that CD&R (as defined herein) has over us and potential conflicts between the interests of CD&R and other stockholders; and risks related to other factors described under “Risk Factors” in the prospectus (File No. 333-261978), dated January 5, 2022, filed with the Securities and Exchange Commission pursuant to Rule 424(b) under the Securities Act of 1933. These factors are not exhaustive, and new factors may emerge or changes to the foregoing factors may occur that could impact our business. Except to the extent required by law, we undertake no obligation to update or revise any forward-looking statements, whether as a result of new information, future events or otherwise, which speak only as of the date of this presentation. Use of Non-GAAP Financial Measures In addition to providing results that are determined in accordance with U.S. GAAP, we present EBITDA, Adjusted EBITDA, Adjusted EBITDA margin, Adjusted Net Income and Net Debt Leverage, all of which are non-GAAP financial measures. These measures are not considered measures of financial performance or liquidity under GAAP and the items excluded therefrom are significant components in understanding and assessing our financial performance or liquidity. These measures should not be considered in isolation or as alternatives to GAAP measures such as net income or net income attributable to Core & Main, Inc., as applicable, cash provided by or used in operating, investing or financing activities, or other financial statement data presented in the financial statements as an indicator of our financial performance or liquidity. We use EBITDA, Adjusted EBITDA, Adjusted EBITDA margin, Adjusted Net Income and Net Debt Leverage to assess the operating results and effectiveness and efficiency of our business. We present these non-GAAP financial measures because we believe investors consider them to be important supplemental measures of performance, and we believe that these measures are frequently used by securities analysts, investors and other interested parties in the evaluation of companies in our industry. Non-GAAP financial measures as reported by us may not be comparable to similarly titled metrics reported by other companies and may not be calculated in the same manner. These measures have limitations as analytical tools, and you should not consider them in isolation or as substitutes for analysis of our results as reported under GAAP. Reconciliations of such non-GAAP measures to the most directly comparable GAAP measure and calculations of the non-GAAP measures are set forth in the appendix of this presentation. No reconciliation of the estimated range for Adjusted EBITDA for fiscal 2022 is included herein because we are unable to quantify certain amounts that would be required to be included in net income or net income attributable to Core & Main, Inc., as applicable, the most directly comparable GAAP measure, without unreasonable efforts due to the high variability and difficulty to predict certain items excluded from Adjusted EBITDA. Consequently, we believe such reconciliation would imply a degree of precision that would be misleading to investors. In particular, the effects of acquisition expenses and other one-time charges cannot be reasonably predicted in light of the inherent difficulty in quantifying such items on a forward-looking basis. We expect the variability of these excluded items may have an unpredictable, and potentially significant, impact on our future GAAP results. Presentation of Financial Information The accompanying financial information presents the results of operations, financial position and cash flows of Core & Main, Inc. (“Core & Main” or the “Company”) and its subsidiaries, which includes the consolidated financial information of Holdings and its consolidated subsidiary, Core & Main LP, as the legal entity that conducts the operations of the Company. Core & Main is the primary beneficiary and general partner of Holdings and has decision making authority that significantly affects the economic performance of the entity. As a result, Core & Main consolidates the consolidated financial statements of Holdings. All intercompany balances and transactions have been eliminated in consolidation. The Company records non-controlling interests related to Partnership Interests (as defined in our Annual Report on Form 10-K) held by the Continuing Limited Partners (as defined in our Annual Report on Form 10-K) in Holdings. The Company’s fiscal year is a 52 or 53 week period ending on the Sunday nearest to January 31st. Quarters within the fiscal year include 13-week periods, unless a fiscal year includes a 53rd week, in which case the fourth quarter of the fiscal year will be a 14-week period. Both the three months ended January 30, 2022 and three months ended January 31, 2020 included 13 weeks, and both the fiscal year ended January 30, 2022 and the fiscal year ended January 31, 2020 included 52 weeks.
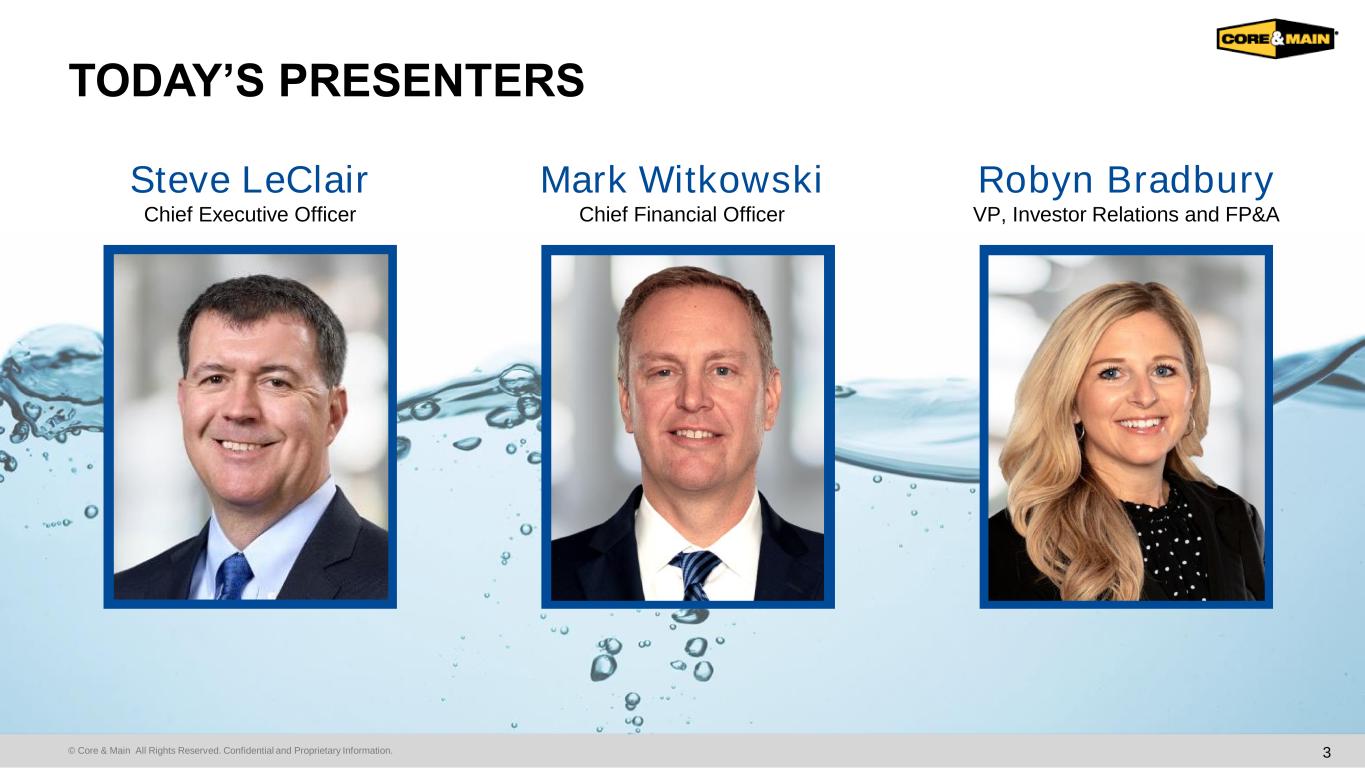

 
© Core & Main All Rights Reserved. Confidential and Proprietary Information. TODAY’S PRESENTERS 3 000 Steve LeClair Chief Executive Officer Mark Witkowski Chief Financial Officer Robyn Bradbury VP, Investor Relations and FP&A

 
© Core & Main All Rights Reserved. Confidential and Proprietary Information. BUSINESS UPDATE 4
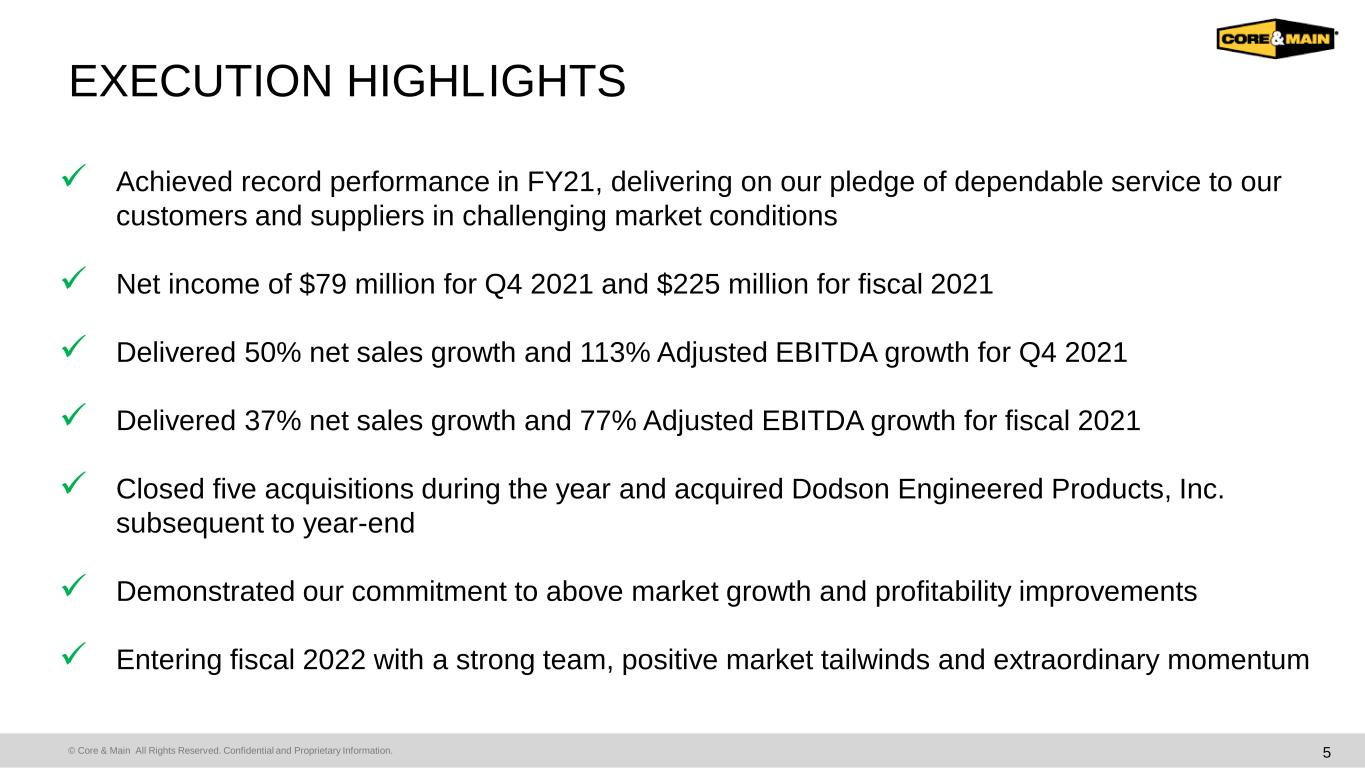

 
© Core & Main All Rights Reserved. Confidential and Proprietary Information. EXECUTION HIGHLIGHTS 5 ✓ Achieved record performance in FY21, delivering on our pledge of dependable service to our customers and suppliers in challenging market conditions ✓ Net income of $79 million for Q4 2021 and $225 million for fiscal 2021 ✓ Delivered 50% net sales growth and 113% Adjusted EBITDA growth for Q4 2021 ✓ Delivered 37% net sales growth and 77% Adjusted EBITDA growth for fiscal 2021 ✓ Closed five acquisitions during the year and acquired Dodson Engineered Products, Inc. subsequent to year-end ✓ Demonstrated our commitment to above market growth and profitability improvements ✓ Entering fiscal 2022 with a strong team, positive market tailwinds and extraordinary momentum
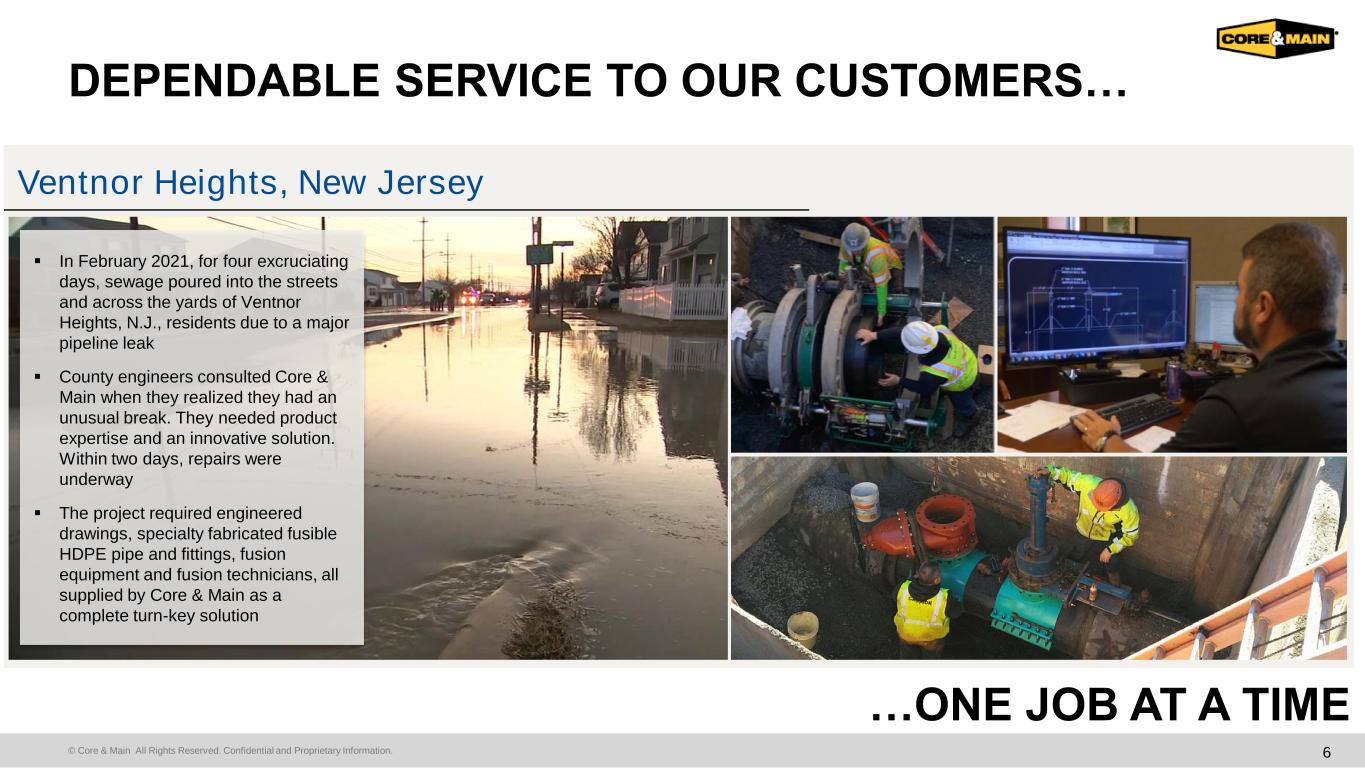

 
© Core & Main All Rights Reserved. Confidential and Proprietary Information. 6 DEPENDABLE SERVICE TO OUR CUSTOMERS… …ONE JOB AT A TIME Ventnor Heights, New Jersey ▪ In February 2021, for four excruciating days, sewage poured into the streets and across the yards of Ventnor Heights, N.J., residents due to a major pipeline leak ▪ County engineers consulted Core & Main when they realized they had an unusual break. They needed product expertise and an innovative solution. Within two days, repairs were underway ▪ The project required engineered drawings, specialty fabricated fusible HDPE pipe and fittings, fusion equipment and fusion technicians, all supplied by Core & Main as a complete turn-key solution
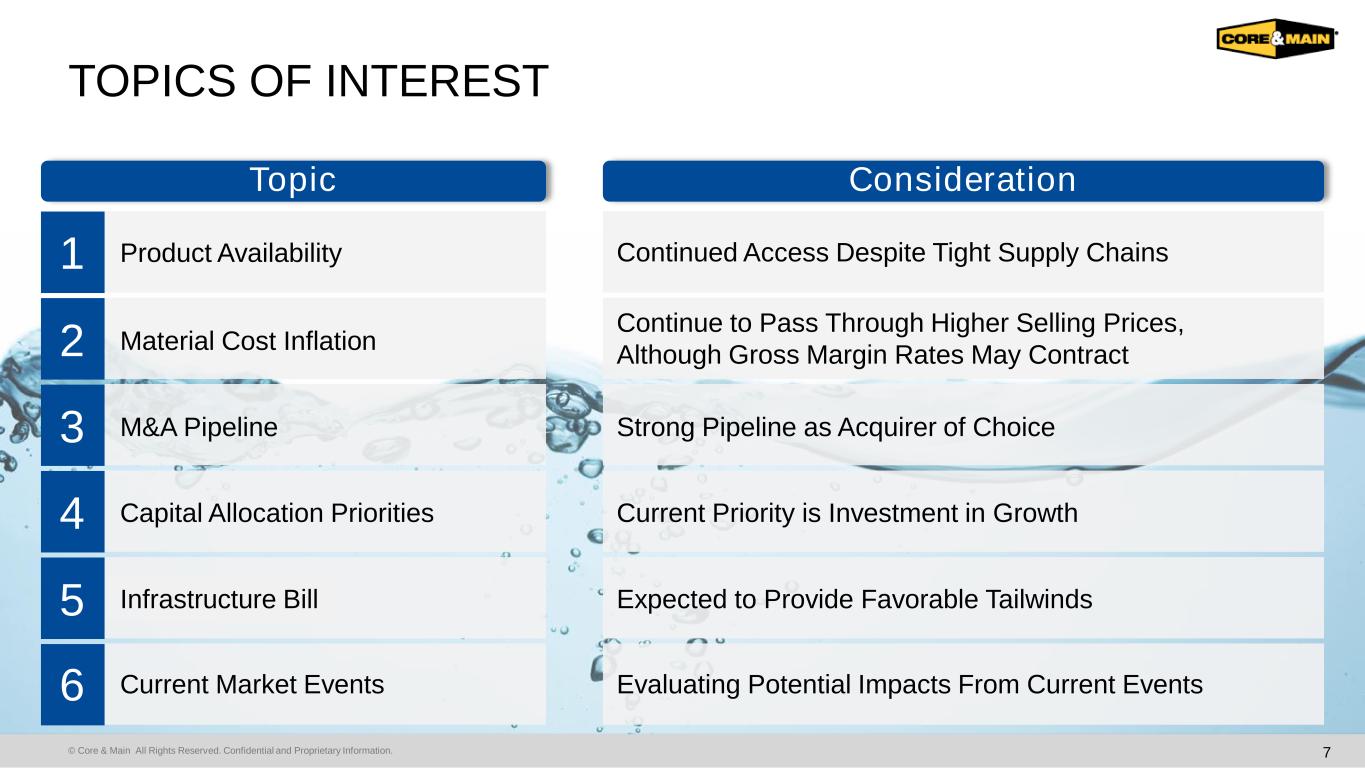

 
© Core & Main All Rights Reserved. Confidential and Proprietary Information. 7 TOPICS OF INTEREST Topic Consideration 1 Product Availability Continued Access Despite Tight Supply Chains 2 Material Cost Inflation Continue to Pass Through Higher Selling Prices, Although Gross Margin Rates May Contract 3 4 5 6 Current Market Events Evaluating Potential Impacts From Current Events Infrastructure Bill Expected to Provide Favorable Tailwinds Capital Allocation Priorities Current Priority is Investment in Growth M&A Pipeline Strong Pipeline as Acquirer of Choice

 
© Core & Main All Rights Reserved. Confidential and Proprietary Information. FINANCIAL HIGHLIGHTS 8

 
© Core & Main All Rights Reserved. Confidential and Proprietary Information. $71 $151 Q4'20 Q4'21 $204 $327 Q4'20 Q4'21 $831 $1,246 Q4'20 Q4'21 Q4 2021 OPERATING RESULTS 9 Net Sales Gross Profit Adjusted Net Income(1) Adjusted EBITDA(1) (1) Adjusted Net Income, Adjusted EBITDA and Adjusted EBITDA margin are non-GAAP financial measures. Refer to the appendix of the presentation for a reconciliation to the nearest GAAP measure. +50% ($ in Millions) ($ in Millions) ($ in Millions)($ in Millions) % Margin(1) 8.5% 12.1%+360 bps % Margin 24.5% 26.2%+170 bps +113% +60% $1 $73 Q4'20 Q4'21

 
© Core & Main All Rights Reserved. Confidential and Proprietary Information. $342 $604 FY20 FY21 $878 $1,280 FY20 FY21 $3,642 $5,004 FY20 FY21 FISCAL 2021 OPERATING RESULTS 10 Net Sales Gross Profit Adjusted Net Income(1) Adjusted EBITDA(1) (1) Adjusted Net Income, Adjusted EBITDA and Adjusted EBITDA margin are non-GAAP financial measures. Refer to the appendix of the presentation for a reconciliation to the nearest GAAP measure. +37% ($ in Millions) ($ in Millions) ($ in Millions)($ in Millions) % Margin(1) 9.4% 12.1%+270 bps % Margin 24.1% 25.6%+150 bps +77% +46% $43 FY20 FY21 $266 +519%

 
© Core & Main All Rights Reserved. Confidential and Proprietary Information. CASH FLOW & BALANCE SHEET HIGHLIGHTS 11 Operating Cash Flow Net Debt & Net Debt Leverage(5) ($ in Millions) ($ in Millions) FY20 FY21 Y-o-Y $ Adjusted EBITDA $342 $604 $262 Investment in Operating Capital(1) (15) (478) (463) Cash Interest (123) (126) (3) Cash Taxes(2) (8) (55) (47) Other(3) 18 24 6 Operating Cash Flow(4) $214 ($31) ($245) $1,930 $1,492 FY20 FY21 5.6x 2.5x Net Debt Leverage(5) (1) Represents the sum of receivables, net of allowances for credit losses, and inventories less accounts payable, each as of year-end. (2) Represents our operating cash taxes paid to the IRS and other state & local taxing authorities. Does not include the port ion of our tax obligation distributed to CD&R and its affiliates as a financing cash outflow. (3) Represents operating cash flow generated from other operating assets and liabilities. (4) Represents the cash flows (used in) provided by operating activities as presented in our consolidated statement of cash f lows in our Annual Report on Form 10-K. (5) Net Debt Leverage is a non-GAAP financial measures. Refer to the appendix of the presentation for a reconciliation to the nearest GAAP measure.

 
© Core & Main All Rights Reserved. Confidential and Proprietary Information. FISCAL 2022 OUTLOOK 12 ▪ Demand remains positive across all end markets, sustaining growth against tough prior year comparisons ▪ Market demand, sustained pricing benefits, above-market growth initiatives and closed acquisitions expected to deliver high single to low double-digit sales growth ▪ Continued M&A activity with growing pipeline ▪ Modest Adjusted EBITDA margin decline reflecting lower gross margin rates, partially offset by SG&A benefit ▪ Adjusted EBITDA guidance of $595 to $635 million (only includes acquisitions that have closed) ▪ Interest expense of $58 to $60 million ▪ Effective tax rate of ~20% ▪ Operating cash flow as a percent of Adjusted EBITDA expected to be 85% to 100% Core & Main is strategically positioned for continued growth


 
© Core & Main All Rights Reserved. Confidential and Proprietary Information. APPENDIX 13
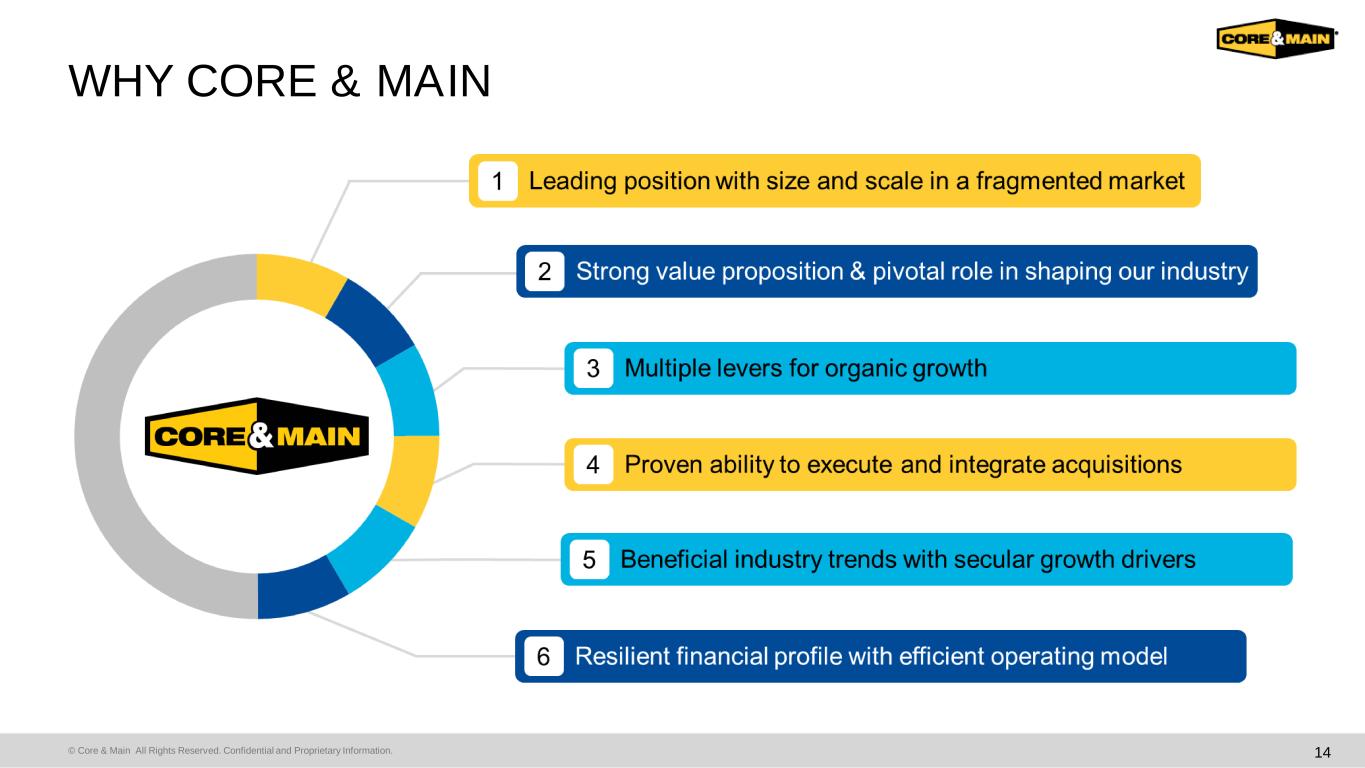

 
© Core & Main All Rights Reserved. Confidential and Proprietary Information. WHY CORE & MAIN 14
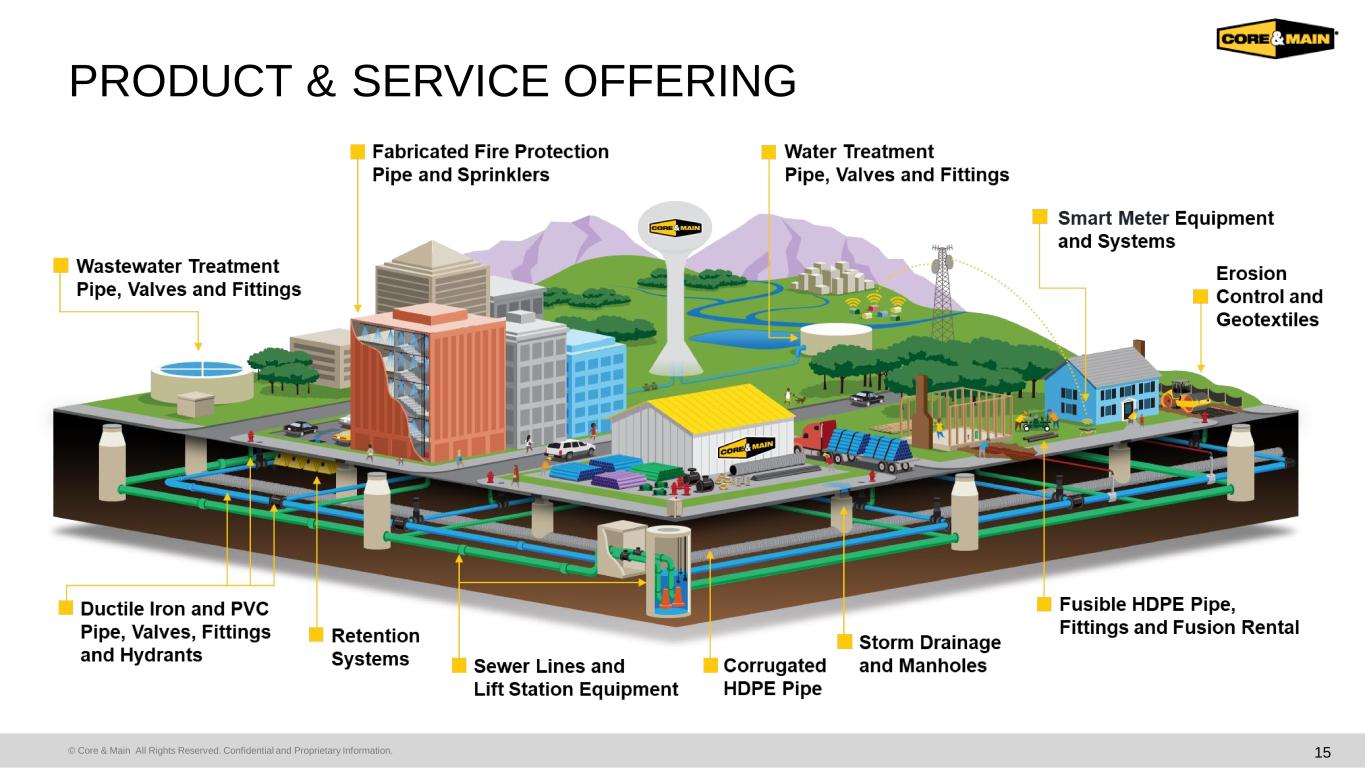

 
© Core & Main All Rights Reserved. Confidential and Proprietary Information. PRODUCT & SERVICE OFFERING 15
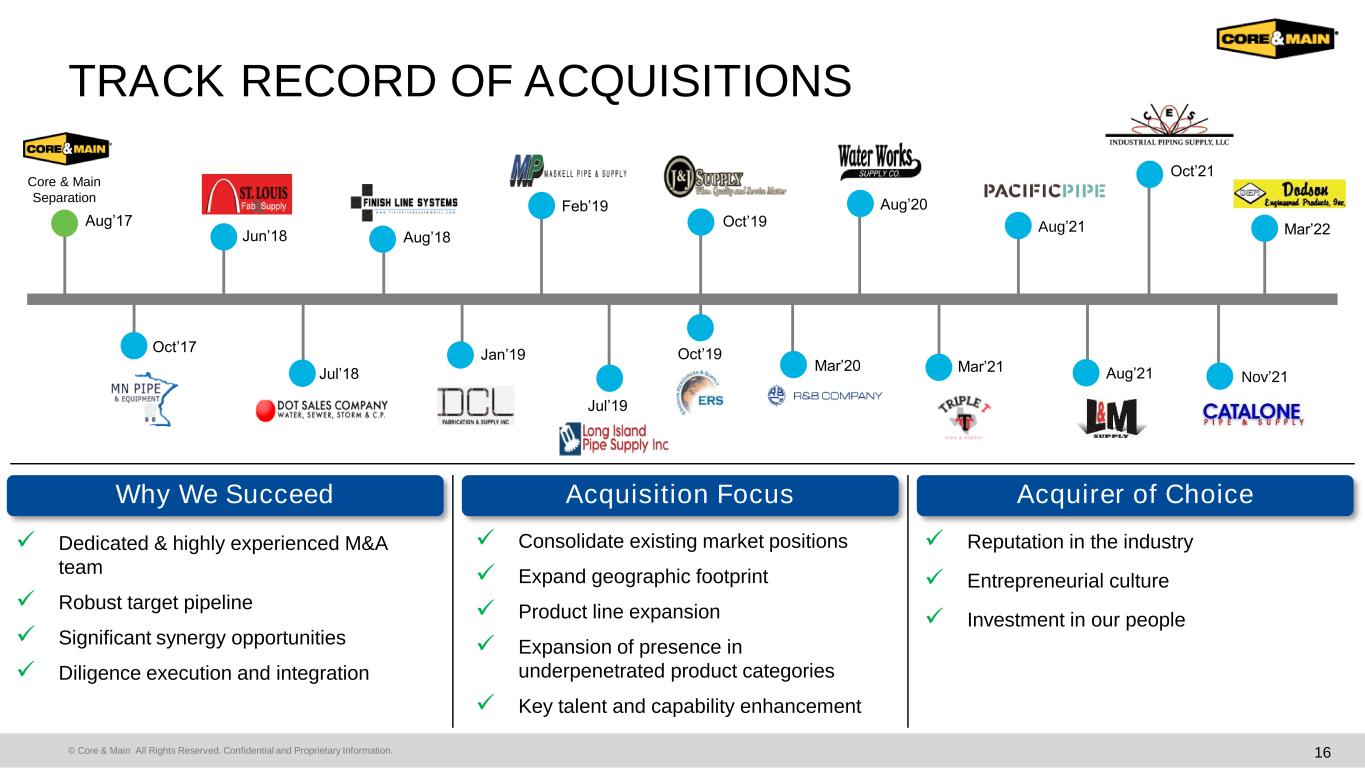

 
© Core & Main All Rights Reserved. Confidential and Proprietary Information. TRACK RECORD OF ACQUISITIONS 16 Organic Growth Why We Succeed Acquisition Focus Acquirer of Choice ✓ Reputation in the industry ✓ Entrepreneurial culture ✓ Investment in our people ✓ Consolidate existing market positions ✓ Expand geographic footprint ✓ Product line expansion ✓ Expansion of presence in underpenetrated product categories ✓ Key talent and capability enhancement ✓ Dedicated & highly experienced M&A team ✓ Robust target pipeline ✓ Significant synergy opportunities ✓ Diligence execution and integration Aug’17 Core & Main Separation Oct’17 Jun’18 Jul’18 Aug’18 Jan’19 Feb’19 Jul’19 Oct’19 Oct’19 Mar’20 Aug’20 Mar’21 Aug’21 Aug’21 Oct’21 Nov’21 Mar’22
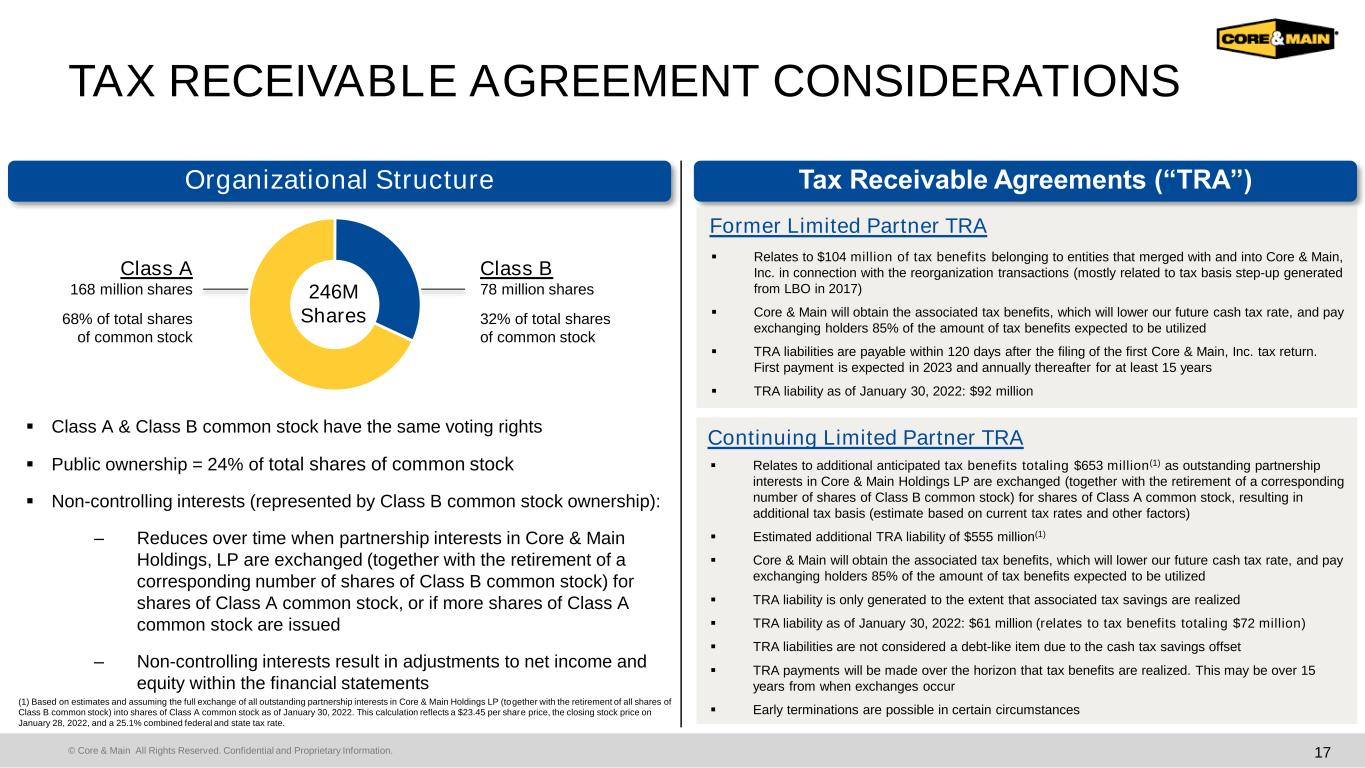

 
© Core & Main All Rights Reserved. Confidential and Proprietary Information. TAX RECEIVABLE AGREEMENT CONSIDERATIONS 17 Organizational Structure Tax Receivable Agreements (“TRA”) ▪ Class A & Class B common stock have the same voting rights ▪ Public ownership = 24% of total shares of common stock ▪ Non-controlling interests (represented by Class B common stock ownership): – Reduces over time when partnership interests in Core & Main Holdings, LP are exchanged (together with the retirement of a corresponding number of shares of Class B common stock) for shares of Class A common stock, or if more shares of Class A common stock are issued – Non-controlling interests result in adjustments to net income and equity within the financial statements Total 246M Share Count (1) Based on estimates and assuming the full exchange of all outstanding partnership interests in Core & Main Holdings LP (together with the retirement of all shares of Class B common stock) into shares of Class A common stock as of January 30, 2022. This calculation reflects a $23.45 per share price, the closing stock price on January 28, 2022, and a 25.1% combined federal and state tax rate. Former Limited Partner TRA ▪ Relates to $104 million of tax benefits belonging to entities that merged with and into Core & Main, Inc. in connection with the reorganization transactions (mostly related to tax basis step-up generated from LBO in 2017) ▪ Core & Main will obtain the associated tax benefits, which will lower our future cash tax rate, and pay exchanging holders 85% of the amount of tax benefits expected to be utilized ▪ TRA liabilities are payable within 120 days after the filing of the first Core & Main, Inc. tax return. First payment is expected in 2023 and annually thereafter for at least 15 years ▪ TRA liability as of January 30, 2022: $92 million ▪ Relates to additional anticipated tax benefits totaling $653 million(1) as outstanding partnership interests in Core & Main Holdings LP are exchanged (together with the retirement of a corresponding number of shares of Class B common stock) for shares of Class A common stock, resulting in additional tax basis (estimate based on current tax rates and other factors) ▪ Estimated additional TRA liability of $555 million(1) ▪ Core & Main will obtain the associated tax benefits, which will lower our future cash tax rate, and pay exchanging holders 85% of the amount of tax benefits expected to be utilized ▪ TRA liability is only generated to the extent that associated tax savings are realized ▪ TRA liability as of January 30, 2022: $61 million (relates to tax benefits totaling $72 million) ▪ TRA liabilities are not considered a debt-like item due to the cash tax savings offset ▪ TRA payments will be made over the horizon that tax benefits are realized. This may be over 15 years from when exchanges occur ▪ Early terminations are possible in certain circumstances Continuing Limited Partner TRA Class B 78 million shares 32% of total shares of common stock 246M Shares Class A 168 million shares 68% of total shares of common stock

 
© Core & Main All Rights Reserved. Confidential and Proprietary Information. January 30, 2022 January 31, 2021 January 30, 2022 January 31, 2021 Net income attributable to Core & Main, Inc. $48 $166 Plus: net income attributable to non-controlling interests 31 59 Net income 79 $0 225 $37 Depreciation and amortization (1) 36 36 142 141 Provision for income taxes 17 (3) 51 9 Interest expense 13 35 98 139 EBITDA $145 $68 $516 $326 Loss on debt modification & extinguishment - - 51 - Equity-based compensation 3 1 25 4 Acquisition expenses (2) 1 2 7 12 Offering expenses (3) 2 - 5 - Adjusted EBITDA $151 $71 $604 $342 Adjusted EBITDA Margin: Net Sales $1,246 $831 $5,004 $3,642 Adjusted EBITDA / Net Sales 12.1% 8.5% 12.1% 9.4% Three Months Ended Fiscal Year Ended RECONCILIATION OF NON-GAAP MEASURES 18 Adjusted EBITDA & Adjusted EBITDA Margin (1) Includes depreciation of certain assets which are reflected in “cost of sales” in our Statement of Operations. (2) Represents expenses associated with acquisition activities, including transaction costs, post-acquisition employee retention bonuses, severance payments, expense recognition of purchase accounting fair value adjustments (excluding amortization) and contingent consideration adjustments. (3) Represents costs related to the IPO and Secondary Offering (each as defined in our Annual Report on Form 10-K) reflected in SG&A expenses in our Statement of Operations. ($ in Millions)
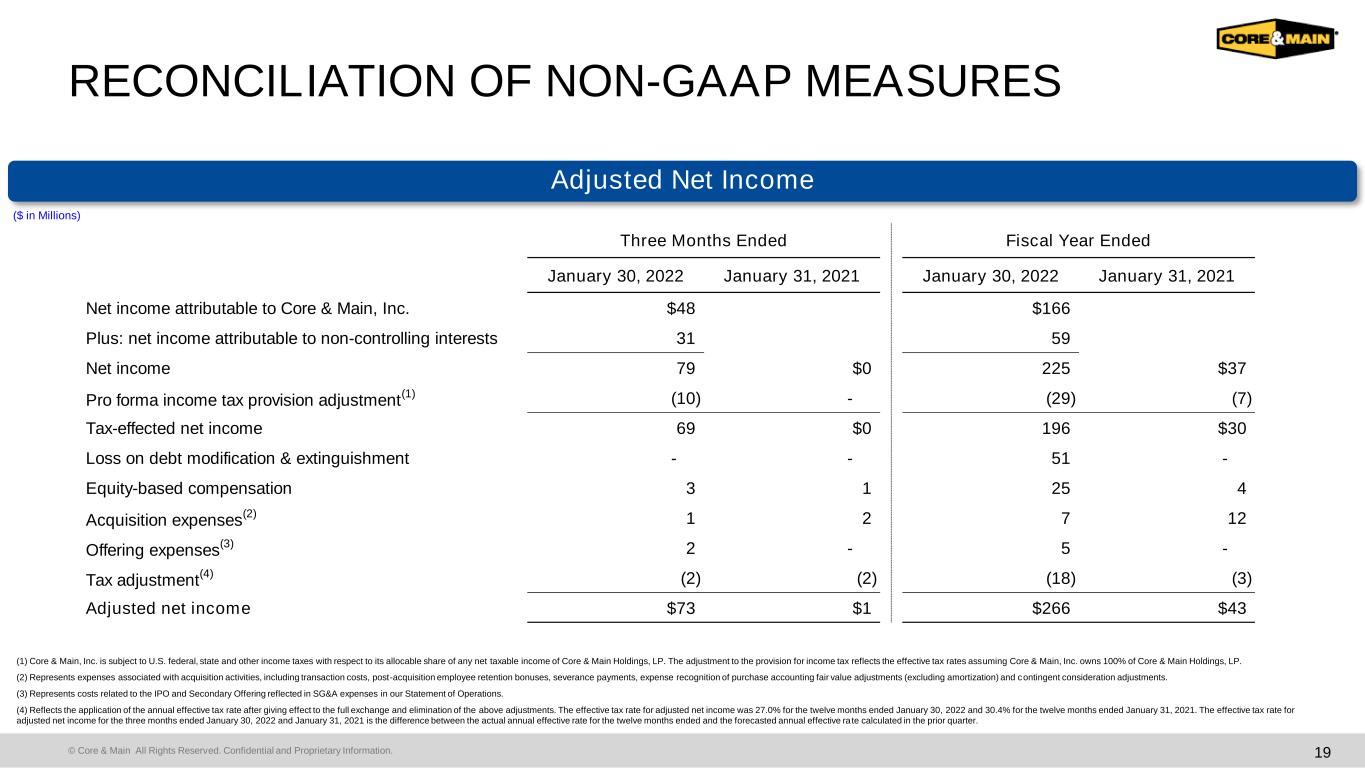

 
© Core & Main All Rights Reserved. Confidential and Proprietary Information. January 30, 2022 January 31, 2021 January 30, 2022 January 31, 2021 Net income attributable to Core & Main, Inc. $48 $166 Plus: net income attributable to non-controlling interests 31 59 Net income 79 $0 225 $37 Pro forma income tax provision adjustment (1) (10) - (29) (7) Tax-effected net income 69 $0 196 $30 Loss on debt modification & extinguishment - - 51 - Equity-based compensation 3 1 25 4 Acquisition expenses (2) 1 2 7 12 Offering expenses (3) 2 - 5 - Tax adjustment (4) (2) (2) (18) (3) Adjusted net income $73 $1 $266 $43 Three Months Ended Fiscal Year Ended RECONCILIATION OF NON-GAAP MEASURES 19 Adjusted Net Income (1) Core & Main, Inc. is subject to U.S. federal, state and other income taxes with respect to its allocable share of any net taxable income of Core & Main Holdings, LP. The adjustment to the provision for income tax reflects the effective tax rates assuming Core & Main, Inc. owns 100% of Core & Main Holdings, LP. (2) Represents expenses associated with acquisition activities, including transaction costs, post-acquisition employee retention bonuses, severance payments, expense recognition of purchase accounting fair value adjustments (excluding amortization) and contingent consideration adjustments. (3) Represents costs related to the IPO and Secondary Offering reflected in SG&A expenses in our Statement of Operations. (4) Reflects the application of the annual effective tax rate after giving effect to the full exchange and elimination of the above adjustments. The effective tax rate for adjusted net income was 27.0% for the twelve months ended January 30, 2022 and 30.4% for the twelve months ended January 31, 2021. The effective tax rate for adjusted net income for the three months ended January 30, 2022 and January 31, 2021 is the difference between the actual annual effective rate for the twelve months ended and the forecasted annual effective ra te calculated in the prior quarter. ($ in Millions)

 
© Core & Main All Rights Reserved. Confidential and Proprietary Information. January 30, 2022 January 31, 2021 Senior Term Loan due August 2024 $ - $1,261 Senior Notes due September 2024 - 300 Senior Notes due August 2025 - 750 Senior ABL Credit Facility due July 2026 - - Senior Term Loan due July 2028 1,493 - Total debt 1,493 2,311 Less: cash & cash equivalents (1) (381) Net debt $1,492 $1,930 Adjusted EBITDA $604 $342 Net debt leverage 2.5x 5.6x Fiscal Year Ended RECONCILIATION OF NON-GAAP MEASURES 20 Net Debt Leverage ($ in Millions)