Contact:
Matthew S. Stadler
Executive Vice President
Chief Financial Officer
Cohen & Steers, Inc.
Tel (212) 446-9168
COHEN & STEERS REPORTS RESULTS FOR THE FOURTH QUARTER AND YEAR ENDED DECEMBER 31, 2020
•Diluted EPS of ($0.09) for the fourth quarter; $1.57 for the full year
•Diluted EPS, as adjusted, of $0.76 for the fourth quarter; $2.57 for the full year
•Operating margin of (10.2%) for the fourth quarter; 22.2% for the full year
•Operating margin, as adjusted, of 42.4% for the fourth quarter; 39.6% for the full year
•Ending AUM of $79.9 billion; average AUM of $75.4 billion for the fourth quarter
•Net inflows of $3.9 billion for the fourth quarter, of which $2.1 billion was from the initial public offering of the
Cohen & Steers Tax-Advantaged Preferred Securities and Income Fund (PTA), a closed-end fund
NEW YORK, NY, January 27, 2021—Cohen & Steers, Inc. (NYSE: CNS) reported its operating results for the fourth quarter and year ended December 31, 2020.
Financial Highlights
| | | | | | | | | | | | | | | | | | | | | | | | | | | | | | | | |
| (in thousands, except percentages and per share data) | Three Months Ended | | Year Ended | |
| December 31, 2020 | | September 30, 2020 | | December 31, 2019 | | December 31, 2020 | | December 31, 2019 | |
| U.S. GAAP | | | | | | | | | | |
| Revenue | $ | 116,460 | | | $ | 111,159 | | | $ | 109,847 | | | $ | 427,536 | | | $ | 410,830 | | |
Expenses (1) | $ | 128,374 | | | $ | 67,852 | | | $ | 63,385 | | | $ | 332,479 | | | $ | 250,696 | | |
| Operating income (loss) | $ | (11,914) | | | $ | 43,307 | | | $ | 46,462 | | | $ | 95,057 | | | $ | 160,134 | | |
| Non-operating income (loss) | $ | 6,989 | | | $ | 3,231 | | | $ | 1,352 | | | $ | (1,670) | | | $ | 27,415 | | |
| Net income (loss) attributable to common stockholders | $ | (4,412) | | | $ | 31,904 | | | $ | 36,728 | | | $ | 76,584 | | | $ | 134,621 | | |
| Diluted earnings (loss) per share | $ | (0.09) | | | $ | 0.66 | | | $ | 0.75 | | | $ | 1.57 | | | $ | 2.79 | | |
| Operating margin | (10.2) | % | | 39.0 | % | | 42.3 | % | | 22.2 | % | | 39.0 | % | |
| | | | | | | | | | |
As Adjusted (2) | | | | | | | | | | |
| Net income attributable to common stockholders | $ | 37,082 | | | $ | 32,616 | | | $ | 35,997 | | | $ | 125,291 | | | $ | 124,360 | | |
| Diluted earnings per share | $ | 0.76 | | | $ | 0.67 | | | $ | 0.74 | | | $ | 2.57 | | | $ | 2.57 | | |
| Operating margin | 42.4 | % | | 39.6 | % | | 43.1 | % | | 39.6 | % | | 39.6 | % | |
_________________________
(1) Includes expenses of $60.2 million associated with the initial public offering of PTA in the fourth quarter of 2020. (2) The “As Adjusted” amounts represent non-GAAP financial measures. Refer to pages 19-20 for reconciliations to the most directly comparable U.S. GAAP financial measures. | |
U.S. GAAP
This section discusses the financial results of the Company as presented in accordance with U.S. GAAP.
Revenue
Revenue for the fourth quarter of 2020 was $116.5 million, an increase of $5.3 million, or 4.8% from $111.2 million for the third quarter of 2020. The change was primarily due to an increase in investment advisory and administration fees of $8.6 million attributable to higher average assets under management in all three investment vehicles, partially offset by lower performance fees from certain institutional accounts of $3.8 million. Changes to investment advisory and administration fee revenue by investment vehicle were as follows:
•Institutional account revenue decreased $2.2 million to $30.6 million;
•Open-end fund revenue increased $3.5 million to $55.1 million; and
•Closed-end fund revenue increased $3.5 million to $22.2 million.
Revenue for the year ended December 31, 2020 was $427.5 million, an increase of $16.7 million, or 4.1% from $410.8 million for the year ended December 31, 2019.
Expenses
Expenses for the fourth quarter of 2020 were $128.4 million, an increase of $60.5 million, or 89.2% from $67.9 million for the third quarter of 2020. The change was primarily due to:
•Higher employee compensation and benefits of $1.4 million, primarily due to higher commissions of $1.3 million associated with the initial public offering of PTA; and
•Higher distribution and service fees of $59.2 million, primarily due to $57.8 million of costs associated with the initial public offering of PTA.
Expenses for the year ended December 31, 2020 were $332.5 million, an increase of $81.8 million, or 32.6% from $250.7 million for the year ended December 31, 2019.
Operating Margin
Operating margin was (10.2%) for the fourth quarter of 2020, compared with 39.0% for the third quarter of 2020. Operating margin was 22.2% for the year ended December 31, 2020, compared with 39.0% for the year ended December 31, 2019. In the fourth quarter of 2020, expenses included costs of $60.2 million associated with the initial public offering of PTA. Operating margin represents the ratio of operating income to revenue.
Non-operating Income (Loss)
| | | | | | | | | | | | | | | | | | | | | | | | | | | | | | | | | | | | | | |
| (in thousands) | Three Months Ended | |
| December 31, 2020 | | September 30, 2020 | |
| Seed Investments | | Other | | Total | | Seed Investments | | Other | | Total | |
| Interest and dividend income—net | $ | 573 | | | $ | 53 | | | $ | 626 | | | $ | 574 | | | $ | 120 | | | $ | 694 | | |
| Gain (loss) from investments—net | 7,315 | | | — | | | 7,315 | | | 3,279 | | | — | | | 3,279 | | |
| Foreign currency gains (losses)—net | 191 | | | (1,143) | | | (952) | | | 108 | | | (850) | | | (742) | | |
| Total non-operating income (loss) | $ | 8,079 | | (1) | $ | (1,090) | | | $ | 6,989 | | | $ | 3,961 | | (1) | $ | (730) | | | $ | 3,231 | | |
_________________________
(1) Seed investments included net income of $5.3 million and $2.1 million attributable to third-party interests for the three months ended December 31, 2020 and September 30, 2020, respectively. | |
| | | | | | | | | | | | |
| | |
| | | | |
| | | | | | | | | | | | |
| | | | | | | | | | | | |
| | | | | | | | | | | | |
| | | | | | | | | | | | |
| |
| | | | | | | | | | | | |
| | | | | | | | | | | | | | | | | | | | | | | | | | | | | | | | | | | | | | |
| (in thousands) | Year Ended | |
| December 31, 2020 | | December 31, 2019 | |
| Seed Investments | | Other | | Total | | Seed Investments | | Other | | Total | |
| Interest and dividend income—net | $ | 2,358 | | | $ | 1,004 | | | $ | 3,362 | | | $ | 3,052 | | | $ | 3,664 | | | $ | 6,716 | | |
| Gain (loss) from investments—net | (4,116) | | | — | | | (4,116) | | | 21,673 | | | — | | | 21,673 | | |
| Foreign currency gains (losses)—net | (399) | | | (517) | | | (916) | | | 381 | | | (1,355) | | | (974) | | |
| Total non-operating income (loss) | $ | (2,157) | | (1) | $ | 487 | | | $ | (1,670) | | | $ | 25,106 | | (1) | $ | 2,309 | | | $ | 27,415 | | |
_________________________
(1) Seed investments included net loss of $1.4 million and net income of $12.4 million attributable to third-party interests for the years ended December 31, 2020 and 2019, respectively. | |
| | | | | | | | | | | | |
| | |
| | | | |
| | | | | | | | | | | | |
| | | | | | | | | | | | |
| | | | | | | | | | | | |
| | | | | | | | | | | | |
| |
| | | | | | | | | | | | |
Income Taxes
The effective tax rate for the fourth quarter of 2020 was 57.0%, compared with 28.2% for the third quarter of 2020. The effective tax rate for the fourth quarter of 2020 differed from the U.S. federal statutory rate of 21% primarily due to state and local taxes as well as the effect of certain permanent differences, the most significant of which related to limitations on the deductibility of executive compensation, and discrete tax items, primarily related to the reversal of certain liabilities associated with unrecognized tax benefits. The effective tax rate for the third quarter of 2020 differed from the U.S. federal statutory rate of 21% primarily due to state, local and foreign taxes as well as the effect of certain permanent differences, the most significant of which related to limitations on the deductibility of executive compensation.
The effective tax rate for the year ended December 31, 2020 was 19.2%, compared with 23.2% for the year ended December 31, 2019. The effective tax rate for the year ended December 31, 2020 differed from the U.S. federal statutory rate of 21.0% primarily due to state, local and foreign taxes as well as the effect of certain permanent differences, the most significant of which related to limitations on the deductibility of executive compensation. These were more than offset by discrete tax items, primarily related to the appreciated value of restricted stock units delivered in January 2020. The effective tax rate for the year ended December 31, 2019 differed from the U.S. federal statutory rate of 21.0% primarily due to state, local and foreign taxes, partially offset by the reversal of certain liabilities associated with unrecognized tax benefits, the release of a portion of the valuation allowance associated with unrealized gains on the Company's seed investments and a discrete item related to the appreciated value of restricted stock units delivered in January 2019.
As Adjusted
The term “As Adjusted” is used to identify non-GAAP financial information in the discussion below. Refer to pages 19-20 for reconciliations to the most directly comparable U.S. GAAP financial measures.
Revenue
Revenue, as adjusted, for the fourth quarter of 2020 was $116.6 million, compared with $111.4 million for the third quarter of 2020. Revenue, as adjusted, for the year ended December 31, 2020 was $427.8 million, compared with $410.4 million for the year ended December 31, 2019.
Revenue, as adjusted, excluded the consolidation of certain of the Company's seed investments for all periods.
Expenses
Expenses, as adjusted, for the fourth quarter of 2020 were $67.2 million, compared with $67.3 million for the third quarter of 2020. Expenses, as adjusted, for the year ended December 31, 2020 were $258.4 million, compared with $247.7 million for the year ended December 31, 2019.
Expenses, as adjusted, excluded the following:
•The consolidation of certain of the Company's seed investments for all periods;
•Amounts related to the accelerated vesting of certain restricted stock units for all periods;
•Costs associated with the initial public offering of PTA for both the fourth and third quarters and full year 2020;
•Costs associated with the Cohen & Steers Quality Income Realty Fund, Inc. rights offering for the first quarter of 2020 and fourth quarter of 2019; and
•Other non-recurring expenses for the fourth quarter of 2020.
Operating Margin
Operating margin, as adjusted, for the fourth quarter of 2020 was 42.4%, compared with 39.6% for the third quarter of 2020. Operating margin, as adjusted, for both the years ended December 31, 2020 and 2019 was 39.6%.
Non-operating Income
Non-operating income, as adjusted, for the fourth quarter of 2020 was $593,000, compared with $502,000 for the third quarter of 2020. Non-operating income, as adjusted, for the year ended December 31, 2020 was $1.4 million, compared with $4.2 million for the year ended December 31, 2019.
Non-operating income, as adjusted, excluded the following for all periods:
•Results from the Company's seed investments; and
•Net foreign currency exchange gains and losses associated with U.S. dollar-denominated assets held by certain foreign subsidiaries.
Income Taxes
The effective tax rate, as adjusted, for the fourth quarter of 2020 was 25.8%, compared with 27.0% for the third quarter of 2020. The effective tax rate, as adjusted, for the year ended December 31, 2020 was 26.7%, compared with 25.5% for the year ended December 31, 2019.
The effective tax rate, as adjusted, excluded the tax effects associated with non-GAAP adjustments as well as discrete items for all periods.
Assets Under Management
| | | | | | | | | | | | | | | | | | | | | | |
| (in millions) | As of | | | | | |
| By Investment Vehicle | December 31, 2020 | | September 30, 2020 | | | | % Change | |
| Institutional accounts | $ | 33,255 | | | $ | 30,380 | | | | | 9.5 | % | |
| Open-end funds | 35,160 | | | 31,404 | | | | | 12.0 | % | |
| Closed-end funds | 11,493 | | | 8,719 | | | | | 31.8 | % | |
| Total | $ | 79,908 | | | $ | 70,503 | | | | | 13.3 | % | |
| | | | | | | | |
| By Investment Strategy | | | | | | | | |
| U.S. real estate | $ | 32,827 | | | $ | 29,610 | | | | | 10.9 | % | |
| Preferred securities | 23,185 | | | 19,010 | | | | | 22.0 | % | |
| Global/international real estate | 15,214 | | | 13,863 | | | | | 9.7 | % | |
| Global listed infrastructure | 6,729 | | | 6,299 | | | | | 6.8 | % | |
| Other | 1,953 | | | 1,721 | | | | | 13.5 | % | |
| Total | $ | 79,908 | | | $ | 70,503 | | | | | 13.3 | % | |
| | | | | | | | |
Assets under management at December 31, 2020 were $79.9 billion, an increase of 13.3% from $70.5 billion at September 30, 2020. The increase was driven by net inflows of $3.9 billion and market appreciation of $6.4 billion, partially offset by distributions of $859 million.
Institutional Accounts
Assets under management in institutional accounts at December 31, 2020 were $33.3 billion, an increase of 9.5% from $30.4 billion at September 30, 2020. The change was primarily due to the following:
•Advisory:
◦Net outflows of $101 million, including $214 million from global/international real estate and $96 million from global listed infrastructure, partially offset by net inflows of $173 million into U.S. real estate; and
◦Market appreciation of $1.6 billion, including $779 million from global/international real estate and $420 million from U.S. real estate.
•Japan subadvisory:
◦Net inflows of $83 million;
◦Market appreciation of $997 million, including $763 million from U.S. real estate and $219 million from global/international real estate; and
◦Distributions of $376 million, including $368 million from U.S. real estate.
•Subadvisory excluding Japan:
◦Net inflows of $10 million; and
◦Market appreciation of $626 million, including $430 million from global/international real estate and $124 million from global listed infrastructure.
Open-end Funds
Assets under management in open-end funds at December 31, 2020 were $35.2 billion, an increase of 12.0% from $31.4 billion at September 30, 2020. The change was primarily due to the following:
•Net inflows of $1.7 billion, including $1.2 billion into preferred securities and $484 million into U.S. real estate;
•Market appreciation of $2.4 billion, including $1.4 billion from U.S. real estate and $730 million from preferred securities; and
•Distributions of $348 million, including $157 million each from preferred securities and U.S. real estate.
Closed-end Funds
Assets under management in closed-end funds at December 31, 2020 were $11.5 billion, an increase of 31.8% from $8.7 billion at September 30, 2020. The increase was due to net inflows of $2.2 billion, including $2.1 billion from the Company's initial public offering of PTA, and market appreciation of $711 million, partially offset by distributions of $135 million.
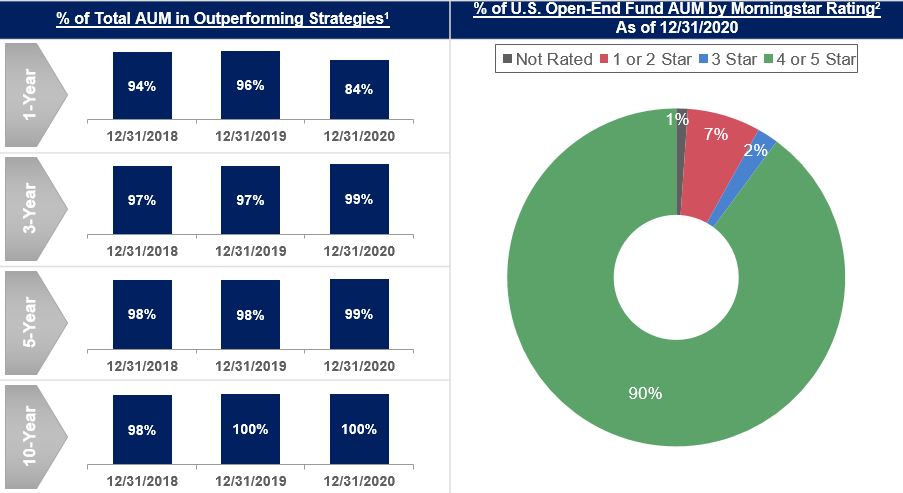
Investment Performance as of December 31, 2020
_________________________
(1) Past performance is no guarantee of future results. Outperformance is determined by comparing the annualized investment performance of each investment strategy to the performance of specified reference benchmarks. Investment performance in excess of the performance of the benchmark is considered outperformance. The investment performance calculation of each investment strategy is based on all active accounts and investment models pursuing similar investment objectives. For accounts, actual investment performance is measured gross of fees and net of withholding taxes. For investment models, for which actual investment performance does not exist, the investment performance of a composite of accounts pursuing comparable investment objectives is used as a proxy for actual investment performance. The performance of the specified reference benchmark for each account and investment model is measured net of withholding taxes, where applicable. This is not investment advice and may not be construed as sales or marketing material for any financial product or service sponsored or provided by Cohen & Steers.
(2) © 2021 Morningstar, Inc. All Rights Reserved. The information contained herein: (1) is proprietary to Morningstar and/or its content providers; (2) may not be copied or distributed; and (3) is not warranted to be accurate, complete, or timely. Neither Morningstar nor its content providers are responsible for any damages or losses arising from any use of this information. Morningstar calculates its ratings based on a risk-adjusted return measure that accounts for variation in a fund's monthly performance (including the effects of sales charges, loads, and redemption fees), placing more emphasis on downward variations and rewarding consistent performance. The top 10% of funds in each category receive five stars, the next 22.5% receive four stars, the next 35% receive three stars, the next 22.5% receive two stars and the bottom 10% receive one star. Past performance is no guarantee of future results. Based on independent rating by Morningstar, Inc. of investment performance of each Cohen & Steers-sponsored open-end U.S.-registered mutual fund for all share classes for the overall period at December 31, 2020. Overall Morningstar rating is a weighted average based on the 3-year, 5-year and 10-year Morningstar rating. Each share class is counted as a fraction of one fund within this scale and rated separately, which may cause slight variations in the distribution percentages. This is not investment advice and may not be construed as sales or marketing material for any financial product or service sponsored or provided by Cohen & Steers.
Balance Sheet Information
As of December 31, 2020, cash, cash equivalents, U.S. Treasury securities and seed investments were $143.0 million compared to $201.9 million as of September 30, 2020. The change was primarily due to the payment of $60.2 million for expenses associated with the initial public offering of PTA and the special dividend of $47.8 million, partially offset by funds from operations. As of December 31, 2020, stockholders' equity was $174.2 million and the Company had no debt.
Conference Call Information
Cohen & Steers will host a conference call tomorrow January 28, 2021 at 10:00 a.m. (ET) to discuss the Company’s fourth quarter and full year results. Investors and analysts can access the live conference call by dialing 800-895-8003 (U.S.) or +1-212-231-2901 (international); passcode: 21989586. Participants should plan to register at least 10 minutes before the conference call begins. The accompanying presentation will be available on the Company’s website at www.cohenandsteers.com under “Company—Investor Relations—Press Releases.”
A replay of the call will be available for two weeks starting at approximately 12:00 p.m. (ET) on January 28, 2021 and can be accessed at 800-633-8284 (U.S.) or +1-402-977-9140 (international); passcode: 21989586. Internet access to the webcast, which includes audio (listen-only), will be available on the Company's website at www.cohenandsteers.com under “Company—Investor Relations—Overview.” The webcast will be archived on the website for one month.
About Cohen & Steers
Cohen & Steers is a global investment manager specializing in liquid real assets, including real estate securities, listed infrastructure and natural resource equities, as well as preferred securities and other income solutions. Founded in 1986, the firm is headquartered in New York City, with offices in London, Dublin, Hong Kong and Tokyo.
Forward-Looking Statements
This press release and other statements that Cohen & Steers may make may contain forward-looking statements within the meaning of Section 27A of the Securities Act of 1933, as amended, and Section 21E of the Securities Exchange Act of 1934, as amended, which reflect the Company's current views with respect to, among other things, the Company's operations and financial performance. You can identify these forward-looking statements by the use of words such as “outlook,” “believes,” “expects,” “potential,” “may,” “should,” “seeks,” “predicts,” “intends,” “plans,” “estimates,” “anticipates” or the negative versions of these words or other comparable words. Such forward-looking statements are subject to various risks and uncertainties. Accordingly, there are or will be important factors that could cause actual outcomes or results to differ materially from those indicated in these forward-looking statements. The Company believes that these factors include, but are not limited to, the risks described in the Risk Factors section of the Company's Annual Report on Form 10-K for the year ended December 31, 2019 (the Form 10-K) and Quarterly Reports on Form 10-Q for the quarters ended March 31, 2020, June 30, 2020 and September 30, 2020 (the First, Second and Third Quarter 10-Qs), each of which is accessible on the Securities and Exchange Commission's website at www.sec.gov and on the Company's website at www.cohenandsteers.com. These factors are not exhaustive and should be read in conjunction with the other cautionary statements that are included in the Company's Form 10-K, First, Second and Third Quarter 10-Qs, and other filings with the Securities and Exchange Commission. The Company undertakes no obligation to publicly update or review any forward-looking statement, whether as a result of new information, future developments or otherwise.
# # # #
| | | | | | | | | | | | | | | | | | | | | | | | | | | | | | | | |
| Cohen & Steers, Inc. and Subsidiaries | | | | | | | | | | |
| Condensed Consolidated Statements of Operations (Unaudited) | | | | | | | |
| (in thousands, except per share data) | | | | | | | | | | |
| | | | | | | | | | |
| Three Months Ended | | % Change From | |
| December 31, 2020 | | September 30, 2020 | | December 31, 2019 | | September 30, 2020 | | December 31, 2019 | |
| Revenue | | | | | | | | | | |
| Investment advisory and administration fees | $ | 107,940 | | | $ | 103,160 | | | $ | 101,157 | | | | | | |
| Distribution and service fees | 7,849 | | | 7,572 | | | 7,976 | | | | | | |
| Other | 671 | | | 427 | | | 714 | | | | | | |
| Total revenue | 116,460 | | | 111,159 | | | 109,847 | | | 4.8 | % | | 6.0 | % | |
| Expenses | | | | | | | | | | |
| Employee compensation and benefits | 42,460 | | | 41,060 | | | 34,993 | | | | | | |
| Distribution and service fees | 73,820 | | | 14,642 | | | 14,371 | | | | | | |
| General and administrative | 10,966 | | | 11,006 | | | 12,942 | | | | | | |
| Depreciation and amortization | 1,128 | | | 1,144 | | | 1,079 | | | | | | |
| Total expenses | 128,374 | | | 67,852 | | | 63,385 | | | 89.2 | % | | 102.5 | % | |
| Operating income (loss) | (11,914) | | | 43,307 | | | 46,462 | | | * | | * | |
| Non-operating income (loss) | | | | | | | | | | |
| Interest and dividend income—net | 626 | | | 694 | | | 1,542 | | | | | | |
| Gain (loss) from investments—net | 7,315 | | | 3,279 | | | 1,463 | | | | | | |
| Foreign currency gains (losses)—net | (952) | | | (742) | | | (1,653) | | | | | | |
| Total non-operating income (loss) | 6,989 | | | 3,231 | | | 1,352 | | | * | | * | |
| Income (loss) before provision for income taxes | (4,925) | | | 46,538 | | | 47,814 | | | * | | * | |
| Provision (benefit) for income taxes | (5,854) | | | 12,532 | | | 9,854 | | | | | | |
| Net income | 929 | | | 34,006 | | | 37,960 | | | (97.3 | %) | | (97.6 | %) | |
Less: Net (income) loss attributable to redeemable noncontrolling interests | (5,341) | | | (2,102) | | | (1,232) | | | | | | |
| Net income (loss) attributable to common stockholders | $ | (4,412) | | | $ | 31,904 | | | $ | 36,728 | | | * | | * | |
| | | | | | | | | | |
| Earnings (loss) per share attributable to common stockholders | | | | | | | | | | |
| Basic | $ | (0.09) | | | $ | 0.67 | | | $ | 0.78 | | | * | | * | |
| Diluted | $ | (0.09) | | | $ | 0.66 | | | $ | 0.75 | | | * | | * | |
| | | | | | | | | | |
| Dividends declared per share | | | | | | | | | | |
| Quarterly | $ | 0.39 | | | $ | 0.39 | | | $ | 0.36 | | | — | % | | 8.3 | % | |
| Special | $ | 1.00 | | | $ | — | | | $ | 2.00 | | | * | | (50.0 | %) | |
| | | | | | | | | | |
| Weighted average shares outstanding | | | | | | | | | | |
| Basic | 47,867 | | | 47,855 | | | 47,324 | | | | | | |
| Diluted | 48,857 | | | 48,681 | | | 48,703 | | | | | | |
_________________________
* Not meaningful. |
| | | | | | | | | | | | | | | | | | | | |
| Cohen & Steers, Inc. and Subsidiaries | | | | | | |
| Condensed Consolidated Statements of Operations (Unaudited) | | | | |
| (in thousands, except per share data) | | | | | | |
| | | | | | |
| Year Ended | | | |
| December 31, 2020 | | December 31, 2019 | | % Change | |
| Revenue | | | | | | |
| Investment advisory and administration fees | $ | 395,037 | | | $ | 378,578 | | | | |
| Distribution and service fees | 30,134 | | | 30,048 | | | | |
| Other | 2,365 | | | 2,204 | | | | |
| Total revenue | 427,536 | | | 410,830 | | | 4.1 | % | |
| Expenses | | | | | | |
| Employee compensation and benefits | 156,457 | | | 143,431 | | | | |
| Distribution and service fees | 115,084 | | | 55,237 | | | | |
| General and administrative | 56,286 | | | 47,632 | | | | |
| Depreciation and amortization | 4,652 | | | 4,396 | | | | |
| Total expenses | 332,479 | | | 250,696 | | | 32.6 | % | |
| Operating income (loss) | 95,057 | | | 160,134 | | | (40.6 | %) | |
| Non-operating income (loss) | | | | | | |
| Interest and dividend income—net | 3,362 | | | 6,716 | | | | |
| Gain (loss) from investments—net | (4,116) | | | 21,673 | | | | |
| Foreign currency gains (losses)—net | (916) | | | (974) | | | | |
| Total non-operating income (loss) | (1,670) | | | 27,415 | | | * | |
| Income before provision for income taxes | 93,387 | | | 187,549 | | | (50.2 | %) | |
| Provision for income taxes | 18,222 | | | 40,565 | | | | |
| Net income | 75,165 | | | 146,984 | | | (48.9 | %) | |
Less: Net (income) loss attributable to redeemable noncontrolling interests | 1,419 | | | (12,363) | | | | |
| Net income attributable to common stockholders | $ | 76,584 | | | $ | 134,621 | | | (43.1 | %) | |
| | | | | | |
Earnings per share attributable to common stockholders | | | | | | |
| Basic | $ | 1.60 | | | $ | 2.85 | | | (43.7 | %) | |
| Diluted | $ | 1.57 | | | $ | 2.79 | | | (43.6 | %) | |
| | | | | | |
| Dividends declared per share | | | | | | |
| Quarterly | $ | 1.56 | | | $ | 1.44 | | | 8.3 | % | |
| Special | $ | 1.00 | | | $ | 2.00 | | | (50.0 | %) | |
| | | | | | |
| Weighted average shares outstanding | | | | | | |
| Basic | 47,800 | | | 47,273 | | | | |
| Diluted | 48,676 | | | 48,297 | | | | |
_________________________
* Not meaningful. |
| | | | | | | | | | | | | | | | | | | | | | | | | | | | | | | | |
| Cohen & Steers, Inc. and Subsidiaries | | | | | | | | | | |
| Assets Under Management | | | | | | | | | | |
| By Investment Vehicle | | | | | | | | | | |
| (in millions) | | | | | | | | | | |
| Three Months Ended | | % Change From | |
| December 31, 2020 | | September 30, 2020 | | December 31, 2019 | | September 30, 2020 | | December 31, 2019 | |
| Institutional Accounts | | | | | | | | | | |
| Assets under management, beginning of period | $ | 30,380 | | | $ | 28,867 | | | $ | 31,533 | | | | | | |
| Inflows | 1,089 | | | 1,936 | | | 1,031 | | | | | | |
| Outflows | (1,097) | | | (1,337) | | | (901) | | | | | | |
| Net inflows (outflows) | (8) | | | 599 | | | 130 | | | | | | |
| Market appreciation (depreciation) | 3,259 | | | 1,273 | | | 450 | | | | | | |
| Distributions | (376) | | | (359) | | | (308) | | | | | | |
| Transfers | — | | | — | | | 8 | | | | | | |
| Total increase (decrease) | 2,875 | | | 1,513 | | | 280 | | | | | | |
| Assets under management, end of period | $ | 33,255 | | | $ | 30,380 | | | $ | 31,813 | | | 9.5 | % | | 4.5 | % | |
| Percentage of total assets under management | 41.6 | % | | 43.1 | % | | 44.1 | % | | | | | |
| Average assets under management | $ | 32,071 | | | $ | 30,325 | | | $ | 31,347 | | | 5.8 | % | | 2.3 | % | |
| | | | | | | | | | |
| Open-end Funds | | | | | | | | | | |
| Assets under management, beginning of period | $ | 31,404 | | | $ | 28,921 | | | $ | 29,598 | | | | | | |
| Inflows | 3,996 | | | 4,020 | | | 3,588 | | | | | | |
| Outflows | (2,303) | | | (2,398) | | | (2,038) | | | | | | |
| Net inflows (outflows) | 1,693 | | | 1,622 | | | 1,550 | | | | | | |
| Market appreciation (depreciation) | 2,411 | | | 1,100 | | | 532 | | | | | | |
| Distributions | (348) | | | (239) | | | (947) | | | | | | |
| Transfers | — | | | — | | | (8) | | | | | | |
| Total increase (decrease) | 3,756 | | | 2,483 | | | 1,127 | | | | | | |
| Assets under management, end of period | $ | 35,160 | | | $ | 31,404 | | | $ | 30,725 | | | 12.0 | % | | 14.4 | % | |
| Percentage of total assets under management | 44.0 | % | | 44.5 | % | | 42.6 | % | | | | | |
| Average assets under management | $ | 33,175 | | | $ | 30,694 | | | $ | 30,050 | | | 8.1 | % | | 10.4 | % | |
| | | | | | | | | | |
| Closed-end Funds | | | | | | | | | | |
| Assets under management, beginning of period | $ | 8,719 | | | $ | 8,539 | | | $ | 9,707 | | | | | | |
| Inflows | 2,198 | | | 50 | | | 3 | | | | | | |
| Outflows | — | | | (1) | | | (80) | | | | | | |
| Net inflows (outflows) | 2,198 | | | 49 | | | (77) | | | | | | |
| Market appreciation (depreciation) | 711 | | | 257 | | | 147 | | | | | | |
| Distributions | (135) | | | (126) | | | (133) | | | | | | |
| Total increase (decrease) | 2,774 | | | 180 | | | (63) | | | | | | |
| Assets under management, end of period | $ | 11,493 | | | $ | 8,719 | | | $ | 9,644 | | | 31.8 | % | | 19.2 | % | |
| Percentage of total assets under management | 14.4 | % | | 12.4 | % | | 13.4 | % | | | | | |
| Average assets under management | $ | 10,169 | | | $ | 8,777 | | | $ | 9,616 | | | 15.9 | % | | 5.8 | % | |
| | | | | | | | | | |
| Total | | | | | | | | | | |
| Assets under management, beginning of period | $ | 70,503 | | | $ | 66,327 | | | $ | 70,838 | | | | | | |
| Inflows | 7,283 | | | 6,006 | | | 4,622 | | | | | | |
| Outflows | (3,400) | | | (3,736) | | | (3,019) | | | | | | |
| Net inflows (outflows) | 3,883 | | | 2,270 | | | 1,603 | | | | | | |
| Market appreciation (depreciation) | 6,381 | | | 2,630 | | | 1,129 | | | | | | |
| Distributions | (859) | | | (724) | | | (1,388) | | | | | | |
| Total increase (decrease) | 9,405 | | | 4,176 | | | 1,344 | | | | | | |
| Assets under management, end of period | $ | 79,908 | | | $ | 70,503 | | | $ | 72,182 | | | 13.3 | % | | 10.7 | % | |
| Average assets under management | $ | 75,415 | | | $ | 69,796 | | | $ | 71,013 | | | 8.1 | % | | 6.2 | % | |
| |
| | | | | | | | | | | | | | | | | | | | |
| Cohen & Steers, Inc. and Subsidiaries | | | | | | |
| Assets Under Management | | | | | | |
| By Investment Vehicle | | | | | | |
| (in millions) | | | | | | |
| Year Ended | | | |
| December 31, 2020 | | December 31, 2019 | | % Change | |
| Institutional Accounts | | | | | | |
| Assets under management, beginning of period | $ | 31,813 | | | $ | 27,148 | | | | |
| Inflows | 7,192 | | | 3,993 | | | | |
| Outflows | (4,418) | | | (4,908) | | | | |
| Net inflows (outflows) | 2,774 | | | (915) | | | | |
| Market appreciation (depreciation) | 53 | | | 6,873 | | | | |
| Distributions | (1,385) | | | (1,306) | | | | |
| Transfers | — | | | 13 | | | | |
| Total increase (decrease) | 1,442 | | | 4,665 | | | | |
| Assets under management, end of period | $ | 33,255 | | | $ | 31,813 | | | 4.5 | % | |
| Percentage of total assets under management | 41.6 | % | | 44.1 | % | | | |
| Average assets under management | $ | 29,883 | | | $ | 30,301 | | | (1.4 | %) | |
| | | | | | |
| Open-end Funds | | | | | | |
| Assets under management, beginning of period | $ | 30,725 | | | $ | 22,295 | | | | |
| Inflows | 17,556 | | | 12,484 | | | | |
| Outflows | (12,135) | | | (7,745) | | | | |
| Net inflows (outflows) | 5,421 | | | 4,739 | | | | |
| Market appreciation (depreciation) | 405 | | | 5,881 | | | | |
| Distributions | (1,391) | | | (2,177) | | | | |
| Transfers | — | | | (13) | | | | |
| Total increase (decrease) | 4,435 | | | 8,430 | | | | |
| Assets under management, end of period | $ | 35,160 | | | $ | 30,725 | | | 14.4 | % | |
| Percentage of total assets under management | 44.0 | % | | 42.6 | % | | | |
| Average assets under management | $ | 30,152 | | | $ | 27,595 | | | 9.3 | % | |
| | | | | | |
| Closed-end Funds | | | | | | |
| Assets under management, beginning of period | $ | 9,644 | | | $ | 8,410 | | | | |
| Inflows | 2,652 | | | 5 | | | | |
| Outflows | (89) | | | (80) | | | | |
| Net inflows (outflows) | 2,563 | | | (75) | | | | |
| Market appreciation (depreciation) | (197) | | | 1,823 | | | | |
| Distributions | (517) | | | (514) | | | | |
| Total increase (decrease) | 1,849 | | | 1,234 | | | | |
| Assets under management, end of period | $ | 11,493 | | | $ | 9,644 | | | 19.2 | % | |
| Percentage of total assets under management | 14.4 | % | | 13.4 | % | | | |
| Average assets under management | $ | 9,140 | | | $ | 9,381 | | | (2.6 | %) | |
| | | | | | |
| Total | | | | | | |
| Assets under management, beginning of period | $ | 72,182 | | | $ | 57,853 | | | | |
| Inflows | 27,400 | | | 16,482 | | | | |
| Outflows | (16,642) | | | (12,733) | | | | |
| Net inflows (outflows) | 10,758 | | | 3,749 | | | | |
| Market appreciation (depreciation) | 261 | | | 14,577 | | | | |
| Distributions | (3,293) | | | (3,997) | | | | |
| Total increase (decrease) | 7,726 | | | 14,329 | | | | |
| Assets under management, end of period | $ | 79,908 | | | $ | 72,182 | | | 10.7 | % | |
| Average assets under management | $ | 69,175 | | | $ | 67,277 | | | 2.8 | % | |
| |
| | | | | | | | | | | | | | | | | | | | | | | | | | | | | | | | |
| Cohen & Steers, Inc. and Subsidiaries | | | | | | | | | | |
| Assets Under Management - Institutional Accounts | | | | | | | |
| By Account Type | | | | | | | | | | |
| (in millions) | | | | | | | | | | |
| Three Months Ended | | % Change From | |
| December 31, 2020 | | September 30, 2020 | | December 31, 2019 | | September 30, 2020 | | December 31, 2019 | |
| Advisory | | | | | | | | | | |
| Assets under management, beginning of period | $ | 16,093 | | | $ | 15,251 | | | $ | 15,243 | | | | | | |
| Inflows | 645 | | | 1,142 | | | 338 | | | | | | |
| Outflows | (746) | | | (1,036) | | | (247) | | | | | | |
| Net inflows (outflows) | (101) | | | 106 | | | 91 | | | | | | |
| Market appreciation (depreciation) | 1,636 | | | 736 | | | 335 | | | | | | |
| | | | | | | | | | |
| Total increase (decrease) | 1,535 | | | 842 | | | 426 | | | | | | |
| Assets under management, end of period | $ | 17,628 | | | $ | 16,093 | | | $ | 15,669 | | | 9.5 | % | | 12.5 | % | |
| Percentage of institutional assets under management | 53.0 | % | | 53.0 | % | | 49.3 | % | | | | | |
| Average assets under management | $ | 17,167 | | | $ | 16,209 | | | $ | 15,380 | | | 5.9 | % | | 11.6 | % | |
| | | | | | | | | | |
| Japan Subadvisory | | | | | | | | | | |
| Assets under management, beginning of period | $ | 9,016 | | | $ | 8,736 | | | $ | 10,305 | | | | | | |
| Inflows | 235 | | | 390 | | | 554 | | | | | | |
| Outflows | (152) | | | (96) | | | (213) | | | | | | |
| Net inflows (outflows) | 83 | | | 294 | | | 341 | | | | | | |
| Market appreciation (depreciation) | 997 | | | 345 | | | (15) | | | | | | |
| Distributions | (376) | | | (359) | | | (308) | | | | | | |
| Total increase (decrease) | 704 | | | 280 | | | 18 | | | | | | |
| Assets under management, end of period | $ | 9,720 | | | $ | 9,016 | | | $ | 10,323 | | | 7.8 | % | | (5.8 | %) | |
| Percentage of institutional assets under management | 29.2 | % | | 29.7 | % | | 32.4 | % | | | | | |
| Average assets under management | $ | 9,337 | | | $ | 8,968 | | | $ | 10,142 | | | 4.1 | % | | (7.9 | %) | |
| | | | | | | | | | |
| Subadvisory Excluding Japan | | | | | | | | | | |
| Assets under management, beginning of period | $ | 5,271 | | | $ | 4,880 | | | $ | 5,985 | | | | | | |
| Inflows | 209 | | | 404 | | | 139 | | | | | | |
| Outflows | (199) | | | (205) | | | (441) | | | | | | |
| Net inflows (outflows) | 10 | | | 199 | | | (302) | | | | | | |
| Market appreciation (depreciation) | 626 | | | 192 | | | 130 | | | | | | |
| Transfers | — | | | — | | | 8 | | | | | | |
| Total increase (decrease) | 636 | | | 391 | | | (164) | | | | | | |
| Assets under management, end of period | $ | 5,907 | | | $ | 5,271 | | | $ | 5,821 | | | 12.1 | % | | 1.5 | % | |
| Percentage of institutional assets under management | 17.8 | % | | 17.4 | % | | 18.3 | % | | | | | |
| Average assets under management | $ | 5,567 | | | $ | 5,148 | | | $ | 5,825 | | | 8.1 | % | | (4.4 | %) | |
| | | | | | | | | | |
| Total Institutional Accounts | | | | | | | | | | |
| Assets under management, beginning of period | $ | 30,380 | | | $ | 28,867 | | | $ | 31,533 | | | | | | |
| Inflows | 1,089 | | | 1,936 | | | 1,031 | | | | | | |
| Outflows | (1,097) | | | (1,337) | | | (901) | | | | | | |
| Net inflows (outflows) | (8) | | | 599 | | | 130 | | | | | | |
| Market appreciation (depreciation) | 3,259 | | | 1,273 | | | 450 | | | | | | |
| Distributions | (376) | | | (359) | | | (308) | | | | | | |
| Transfers | — | | | — | | | 8 | | | | | | |
| Total increase (decrease) | 2,875 | | | 1,513 | | | 280 | | | | | | |
| Assets under management, end of period | $ | 33,255 | | | $ | 30,380 | | | $ | 31,813 | | | 9.5 | % | | 4.5 | % | |
| Average assets under management | $ | 32,071 | | | $ | 30,325 | | | $ | 31,347 | | | 5.8 | % | | 2.3 | % | |
| |
| | | | | | | | | | | | | | | | | | | | |
| Cohen & Steers, Inc. and Subsidiaries | | | | | | |
| Assets Under Management - Institutional Accounts | | | |
| By Account Type | | | | | | |
| (in millions) | | | | | | |
| Year Ended | | | |
| December 31, 2020 | | December 31, 2019 | | % Change | |
| Advisory | | | | | | |
| Assets under management, beginning of period | $ | 15,669 | | | $ | 12,065 | | | | |
| Inflows | 4,324 | | | 1,918 | | | | |
| Outflows | (2,771) | | | (1,351) | | | | |
| Net inflows (outflows) | 1,553 | | | 567 | | | | |
| Market appreciation (depreciation) | 406 | | | 3,032 | | | | |
| Transfers | — | | | 5 | | | | |
| Total increase (decrease) | 1,959 | | | 3,604 | | | | |
| Assets under management, end of period | $ | 17,628 | | | $ | 15,669 | | | 12.5 | % | |
| Percentage of institutional assets under management | 53.0 | % | | 49.3 | % | | | |
| Average assets under management | $ | 15,650 | | | $ | 14,752 | | | 6.1 | % | |
| | | | | | |
| Japan Subadvisory | | | | | | |
| Assets under management, beginning of period | $ | 10,323 | | | $ | 9,288 | | | | |
| Inflows | 1,601 | | | 942 | | | | |
| Outflows | (626) | | | (1,076) | | | | |
| Net inflows (outflows) | 975 | | | (134) | | | | |
| Market appreciation (depreciation) | (193) | | | 2,475 | | | | |
| Distributions | (1,385) | | | (1,306) | | | | |
| Total increase (decrease) | (603) | | | 1,035 | | | | |
| Assets under management, end of period | $ | 9,720 | | | $ | 10,323 | | | (5.8 | %) | |
| Percentage of institutional assets under management | 29.2 | % | | 32.4 | % | | | |
| Average assets under management | $ | 9,014 | | | $ | 9,954 | | | (9.4 | %) | |
| | | | | | |
| Subadvisory Excluding Japan | | | | | | |
| Assets under management, beginning of period | $ | 5,821 | | | $ | 5,795 | | | | |
| Inflows | 1,267 | | | 1,133 | | | | |
| Outflows | (1,021) | | | (2,481) | | | | |
| Net inflows (outflows) | 246 | | | (1,348) | | | | |
| Market appreciation (depreciation) | (160) | | | 1,366 | | | | |
| Transfers | — | | | 8 | | | | |
| Total increase (decrease) | 86 | | | 26 | | | | |
| Assets under management, end of period | $ | 5,907 | | | $ | 5,821 | | | 1.5 | % | |
| Percentage of institutional assets under management | 17.8 | % | | 18.3 | % | | | |
| Average assets under management | $ | 5,219 | | | $ | 5,595 | | | (6.7 | %) | |
| | | | | | |
| Total Institutional Accounts | | | | | | |
| Assets under management, beginning of period | $ | 31,813 | | | $ | 27,148 | | | | |
| Inflows | 7,192 | | | 3,993 | | | | |
| Outflows | (4,418) | | | (4,908) | | | | |
| Net inflows (outflows) | 2,774 | | | (915) | | | | |
| Market appreciation (depreciation) | 53 | | | 6,873 | | | | |
| Distributions | (1,385) | | | (1,306) | | | | |
| Transfers | — | | | 13 | | | | |
| Total increase (decrease) | 1,442 | | | 4,665 | | | | |
| Assets under management, end of period | $ | 33,255 | | | $ | 31,813 | | | 4.5 | % | |
| Average assets under management | $ | 29,883 | | | $ | 30,301 | | | (1.4 | %) | |
| |
| | | | | | | | | | | | | | | | | | | | | | | | | | | | | | | | |
| Cohen & Steers, Inc. and Subsidiaries | | | | | | | | | | |
| Assets Under Management | | | | | | | | | | |
| By Investment Strategy | | | | | | | | | | |
| (in millions) | | | | | | | | | | |
| Three Months Ended | | % Change From | |
| December 31, 2020 | | September 30, 2020 | | December 31, 2019 | | September 30, 2020 | | December 31, 2019 | |
| U.S. Real Estate | | | | | | | | | | |
| Assets under management, beginning of period | $ | 29,610 | | | $ | 28,119 | | | $ | 30,964 | | | | | | |
| Inflows | 2,204 | | | 2,827 | | | 2,405 | | | | | | |
| Outflows | (1,292) | | | (1,733) | | | (1,355) | | | | | | |
| Net inflows (outflows) | 912 | | | 1,094 | | | 1,050 | | | | | | |
| Market appreciation (depreciation) | 2,886 | | | 882 | | | 11 | | | | | | |
| Distributions | (573) | | | (485) | | | (1,001) | | | | | | |
| Transfers | (8) | | | — | | | — | | | | | | |
| Total increase (decrease) | 3,217 | | | 1,491 | | | 60 | | | | | | |
| Assets under management, end of period | $ | 32,827 | | | $ | 29,610 | | | $ | 31,024 | | | 10.9 | % | | 5.8 | % | |
| Percentage of total assets under management | 41.1 | % | | 42.0 | % | | 43.0 | % | | | | | |
| Average assets under management | $ | 31,203 | | | $ | 29,442 | | | $ | 30,694 | | | 6.0 | % | | 1.7 | % | |
| | | | | | | | | | |
| Preferred Securities | | | | | | | | | | |
| Assets under management, beginning of period | $ | 19,010 | | | $ | 17,116 | | | $ | 16,749 | | | | | | |
| Inflows | 4,281 | | | 2,167 | | | 1,320 | | | | | | |
| Outflows | (992) | | | (941) | | | (767) | | | | | | |
| Net inflows (outflows) | 3,289 | | | 1,226 | | | 553 | | | | | | |
| Market appreciation (depreciation) | 1,070 | | | 844 | | | 440 | | | | | | |
| Distributions | (192) | | | (176) | | | (161) | | | | | | |
| Transfers | 8 | | | — | | | — | | | | | | |
| Total increase (decrease) | 4,175 | | | 1,894 | | | 832 | | | | | | |
| Assets under management, end of period | $ | 23,185 | | | $ | 19,010 | | | $ | 17,581 | | | 22.0 | % | | 31.9 | % | |
| Percentage of total assets under management | 29.0 | % | | 27.0 | % | | 24.4 | % | | | | | |
| Average assets under management | $ | 21,096 | | | $ | 18,255 | | | $ | 17,112 | | | 15.6 | % | | 23.3 | % | |
| | | | | | | | | | |
| Global/International Real Estate | | | | | | | | | | |
| Assets under management, beginning of period | $ | 13,863 | | | $ | 12,659 | | | $ | 13,141 | | | | | | |
| Inflows | 416 | | | 851 | | | 629 | | | | | | |
| Outflows | (677) | | | (379) | | | (488) | | | | | | |
| Net inflows (outflows) | (261) | | | 472 | | | 141 | | | | | | |
| Market appreciation (depreciation) | 1,648 | | | 740 | | | 385 | | | | | | |
| Distributions | (36) | | | (8) | | | (158) | | | | | | |
| | | | | | | | | | |
| Total increase (decrease) | 1,351 | | | 1,204 | | | 368 | | | | | | |
| Assets under management, end of period | $ | 15,214 | | | $ | 13,863 | | | $ | 13,509 | | | 9.7 | % | | 12.6 | % | |
| Percentage of total assets under management | 19.0 | % | | 19.7 | % | | 18.7 | % | | | | | |
| Average assets under management | $ | 14,612 | | | $ | 13,520 | | | $ | 13,330 | | | 8.1 | % | | 9.6 | % | |
| |
| | | | | | | | | | | | | | | | | | | | | | | | | | | | | | | | |
| Cohen & Steers, Inc. and Subsidiaries | | | | | | | | | | |
| Assets Under Management | | | | | | | | | | |
| By Investment Strategy - continued | | | | | | | | | | |
| (in millions) | | | | | | | | | | |
| Three Months Ended | | % Change From | |
| December 31, 2020 | | September 30, 2020 | | December 31, 2019 | | September 30, 2020 | | December 31, 2019 | |
| Global Listed Infrastructure | | | | | | | | | | |
| Assets under management, beginning of period | $ | 6,299 | | | $ | 6,768 | | | $ | 7,774 | | | | | | |
| Inflows | 316 | | | 139 | | | 219 | | | | | | |
| Outflows | (399) | | | (655) | | | (285) | | | | | | |
| Net inflows (outflows) | (83) | | | (516) | | | (66) | | | | | | |
| Market appreciation (depreciation) | 562 | | | 93 | | | 194 | | | | | | |
| Distributions | (49) | | | (46) | | | (52) | | | | | | |
| Transfers | — | | | — | | | 226 | | | | | | |
| Total increase (decrease) | 430 | | | (469) | | | 302 | | | | | | |
| Assets under management, end of period | $ | 6,729 | | | $ | 6,299 | | | $ | 8,076 | | | 6.8 | % | | (16.7 | %) | |
| Percentage of total assets under management | 8.4 | % | | 8.9 | % | | 11.2 | % | | | | | |
| Average assets under management | $ | 6,665 | | | $ | 6,839 | | | $ | 7,671 | | | (2.5 | %) | | (13.1 | %) | |
| | | | | | | | | | |
| Other | | | | | | | | | | |
| Assets under management, beginning of period | $ | 1,721 | | | $ | 1,665 | | | $ | 2,210 | | | | | | |
| Inflows | 66 | | | 22 | | | 49 | | | | | | |
| Outflows | (40) | | | (28) | | | (124) | | | | | | |
| Net inflows (outflows) | 26 | | | (6) | | | (75) | | | | | | |
| Market appreciation (depreciation) | 215 | | | 71 | | | 99 | | | | | | |
| Distributions | (9) | | | (9) | | | (16) | | | | | | |
| Transfers | — | | | — | | | (226) | | | | | | |
| Total increase (decrease) | 232 | | | 56 | | | (218) | | | | | | |
| Assets under management, end of period | $ | 1,953 | | | $ | 1,721 | | | $ | 1,992 | | | 13.5 | % | | (2.0 | %) | |
| Percentage of total assets under management | 2.4 | % | | 2.4 | % | | 2.8 | % | | | | | |
| Average assets under management | $ | 1,839 | | | $ | 1,740 | | | $ | 2,206 | | | 5.7 | % | | (16.6 | %) | |
| | | | | | | | | | |
| Total | | | | | | | | | | |
| Assets under management, beginning of period | $ | 70,503 | | | $ | 66,327 | | | $ | 70,838 | | | | | | |
| Inflows | 7,283 | | | 6,006 | | | 4,622 | | | | | | |
| Outflows | (3,400) | | | (3,736) | | | (3,019) | | | | | | |
| Net inflows (outflows) | 3,883 | | | 2,270 | | | 1,603 | | | | | | |
| Market appreciation (depreciation) | 6,381 | | | 2,630 | | | 1,129 | | | | | | |
| Distributions | (859) | | | (724) | | | (1,388) | | | | | | |
| | | | | | | | | | |
| Total increase (decrease) | 9,405 | | | 4,176 | | | 1,344 | | | | | | |
| Assets under management, end of period | $ | 79,908 | | | $ | 70,503 | | | $ | 72,182 | | | 13.3 | % | | 10.7 | % | |
| Average assets under management | $ | 75,415 | | | $ | 69,796 | | | $ | 71,013 | | | 8.1 | % | | 6.2 | % | |
| |
| | | | | | | | | | | | | | | | | | | | |
| Cohen & Steers, Inc. and Subsidiaries | | | | | | |
| Assets Under Management | | | | | | |
| By Investment Strategy | | | | | | |
| (in millions) | | | | | | |
| Year Ended | | | |
| December 31, 2020 | | December 31, 2019 | | % Change | |
| U.S. Real Estate | | | | | | |
| Assets under management, beginning of period | $ | 31,024 | | | $ | 24,627 | | | | |
| Inflows | 11,114 | | | 7,298 | | | | |
| Outflows | (6,478) | | | (5,363) | | | | |
| Net inflows (outflows) | 4,636 | | | 1,935 | | | | |
| Market appreciation (depreciation) | (574) | | | 7,346 | | | | |
| Distributions | (2,282) | | | (2,886) | | | | |
| Transfers | 23 | | | 2 | | | | |
| Total increase (decrease) | 1,803 | | | 6,397 | | | | |
| Assets under management, end of period | $ | 32,827 | | | $ | 31,024 | | | 5.8 | % | |
| Percentage of total assets under management | 41.1 | % | | 43.0 | % | | | |
| Average assets under management | $ | 28,972 | | | $ | 29,117 | | | (0.5 | %) | |
| | | | | | |
| Preferred Securities | | | | | | |
| Assets under management, beginning of period | $ | 17,581 | | | $ | 13,068 | | | | |
| Inflows | 10,979 | | | 5,726 | | | | |
| Outflows | (5,828) | | | (3,041) | | | | |
| Net inflows (outflows) | 5,151 | | | 2,685 | | | | |
| Market appreciation (depreciation) | 1,172 | | | 2,406 | | | | |
| Distributions | (696) | | | (597) | | | | |
| Transfers | (23) | | | 19 | | | | |
| Total increase (decrease) | 5,604 | | | 4,513 | | | | |
| Assets under management, end of period | $ | 23,185 | | | $ | 17,581 | | | 31.9 | % | |
| Percentage of total assets under management | 29.0 | % | | 24.4 | % | | | |
| Average assets under management | $ | 18,278 | | | $ | 15,702 | | | 16.4 | % | |
| | | | | | |
| Global/International Real Estate | | | | | | |
| Assets under management, beginning of period | $ | 13,509 | | | $ | 11,047 | | | | |
| Inflows | 4,122 | | | 2,541 | | | | |
| Outflows | (2,436) | | | (2,714) | | | | |
| Net inflows (outflows) | 1,686 | | | (173) | | | | |
| Market appreciation (depreciation) | 102 | | | 2,887 | | | | |
| Distributions | (83) | | | (252) | | | | |
| | | | | | |
| Total increase (decrease) | 1,705 | | | 2,462 | | | | |
| Assets under management, end of period | $ | 15,214 | | | $ | 13,509 | | | 12.6 | % | |
| Percentage of total assets under management | 19.0 | % | | 18.7 | % | | | |
| Average assets under management | $ | 13,193 | | | $ | 12,718 | | | 3.7 | % | |
| |
| | | | | | | | | | | | | | | | | | | | |
| Cohen & Steers, Inc. and Subsidiaries | | | | | | |
| Assets Under Management | | | | | | |
| By Investment Strategy - continued | | | | | | |
| (in millions) | | | | | | |
| Year Ended | | | |
| December 31, 2020 | | December 31, 2019 | | % Change | |
| Global Listed Infrastructure | | | | | | |
| Assets under management, beginning of period | $ | 8,076 | | | $ | 6,517 | | | | |
| Inflows | 997 | | | 713 | | | | |
| Outflows | (1,722) | | | (699) | | | | |
| Net inflows (outflows) | (725) | | | 14 | | | | |
| Market appreciation (depreciation) | (423) | | | 1,520 | | | | |
| Distributions | (199) | | | (201) | | | | |
| Transfers | — | | | 226 | | | | |
| Total increase (decrease) | (1,347) | | | 1,559 | | | | |
| Assets under management, end of period | $ | 6,729 | | | $ | 8,076 | | | (16.7 | %) | |
| Percentage of total assets under management | 8.4 | % | | 11.2 | % | | | |
| Average assets under management | $ | 6,972 | | | $ | 7,455 | | | (6.5 | %) | |
| | | | | | |
| Other | | | | | | |
| Assets under management, beginning of period | $ | 1,992 | | | $ | 2,594 | | | | |
| Inflows | 188 | | | 204 | | | | |
| Outflows | (178) | | | (916) | | | | |
| Net inflows (outflows) | 10 | | | (712) | | | | |
| Market appreciation (depreciation) | (16) | | | 418 | | | | |
| Distributions | (33) | | | (61) | | | | |
| Transfers | — | | | (247) | | | | |
| Total increase (decrease) | (39) | | | (602) | | | | |
| Assets under management, end of period | $ | 1,953 | | | $ | 1,992 | | | (2.0 | %) | |
| Percentage of total assets under management | 2.4 | % | | 2.8 | % | | | |
| Average assets under management | $ | 1,760 | | | $ | 2,285 | | | (23.0 | %) | |
| | | | | | |
| Total | | | | | | |
| Assets under management, beginning of period | $ | 72,182 | | | $ | 57,853 | | | | |
| Inflows | 27,400 | | | 16,482 | | | | |
| Outflows | (16,642) | | | (12,733) | | | | |
| Net inflows (outflows) | 10,758 | | | 3,749 | | | | |
| Market appreciation (depreciation) | 261 | | | 14,577 | | | | |
| Distributions | (3,293) | | | (3,997) | | | | |
| | | | | | |
| Total increase (decrease) | 7,726 | | | 14,329 | | | | |
| Assets under management, end of period | $ | 79,908 | | | $ | 72,182 | | | 10.7 | % | |
| Average assets under management | $ | 69,175 | | | $ | 67,277 | | | 2.8 | % | |
| |
Non-GAAP Reconciliations
Management believes that use of the following non-GAAP financial measures enhances the evaluation of the Company's results, as they provide greater transparency into the Company's operating performance. In addition, these non-GAAP financial measures are used to prepare the Company's internal management reports and are used by management in evaluating the Company's business.
While management believes that this non-GAAP financial information is useful in evaluating the Company's results and operating performance, this information should be considered as supplemental in nature and not as a substitute for the related financial information prepared in accordance with U.S. GAAP.
| | | | | | | | | | | | | | | | | | | | | | | | | | | | | | | | |
| Reconciliation of U.S. GAAP Net Income (Loss) Attributable to Common Stockholders and U.S. GAAP Earnings per Share to Net Income Attributable to Common Stockholders, As Adjusted, and Earnings per Share, As Adjusted | |
| (in thousands, except per share data) | Three Months Ended | | Year Ended | |
| December 31, 2020 | | September 30, 2020 | | December 31, 2019 | | December 31, 2020 | | December 31, 2019 | |
| Net income (loss) attributable to common stockholders, U.S. GAAP | $ | (4,412) | | | $ | 31,904 | | | $ | 36,728 | | | $ | 76,584 | | | $ | 134,621 | | |
Seed investments (1) | (2,574) | | | (1,686) | | | (1,393) | | | 1,443 | | | (11,858) | | |
Accelerated vesting of restricted stock units | 387 | | | 387 | | | 358 | | | 774 | | | 1,344 | | |
Initial public offering costs (2) | 60,249 | | | 310 | | | — | | | 60,559 | | | — | | |
Rights offering costs (3) | — | | | — | | | 346 | | | 11,859 | | | 346 | | |
Other non-recurring expenses (4) | 500 | | | — | | | — | | | 500 | | | — | | |
Foreign currency exchange (gains) losses—net (5) | 1,683 | | | 1,232 | | | 2,822 | | | 871 | | | 1,909 | | |
Tax adjustments (6) | (18,751) | | | 469 | | | (2,864) | | | (27,299) | | | (2,002) | | |
| Net income attributable to common stockholders, as adjusted | $ | 37,082 | | | $ | 32,616 | | | $ | 35,997 | | | $ | 125,291 | | | $ | 124,360 | | |
| | | | | | | | | | |
| Diluted weighted average shares outstanding | 48,857 | | | 48,681 | | | 48,703 | | | 48,676 | | | 48,297 | | |
| Diluted earnings (loss) per share, U.S. GAAP | $ | (0.09) | | | $ | 0.66 | | | $ | 0.75 | | | $ | 1.57 | | | $ | 2.79 | | |
Seed investments | (0.05) | | | (0.04) | | | (0.03) | | | 0.03 | | | (0.25) | | |
Accelerated vesting of restricted stock units | 0.01 | | | 0.01 | | | 0.01 | | | 0.02 | | | 0.02 | | |
| Initial public offering costs | 1.23 | | | 0.01 | | | — | | | 1.24 | | | — | | |
Rights offering costs | — | | | — | | | 0.01 | | | 0.24 | | | 0.01 | | |
| Other non-recurring expenses | 0.01 | | | — | | | — | | | 0.01 | | | — | | |
Foreign currency exchange (gains) losses—net | 0.03 | | | 0.02 | | | 0.06 | | | 0.02 | | | 0.04 | | |
Tax adjustments | (0.38) | | | 0.01 | | | (0.06) | | | (0.56) | | | (0.04) | | |
| Diluted earnings per share, as adjusted | $ | 0.76 | | | $ | 0.67 | | | $ | 0.74 | | | $ | 2.57 | | | $ | 2.57 | | |
_________________________ (1) Represents amounts related to the deconsolidation of seed investments in Company-sponsored funds as well as non-operating (income) loss from seed investments that were not consolidated. (2) Represents costs associated with the initial public offering of PTA. Costs are summarized in the following table: | |
| | | | |
| | | | | | | | | | |
Employee compensation and benefits | $ | 1,317 | | | $ | — | | | $ | — | | | $ | 1,317 | | | $ | — | | |
Distribution and service fees | 57,818 | | | — | | | — | | | 57,818 | | | — | | |
| General and administrative | 1,114 | | | 310 | | | — | | | 1,424 | | | — | | |
Initial public offering costs | $ | 60,249 | | | $ | 310 | | | $ | — | | | $ | 60,559 | | | $ | — | | |
(3) Represents costs associated with the Cohen & Steers Quality Income Realty Fund, Inc. (RQI) rights offering which were recorded in general and administrative expense in the first quarter of 2020 and fourth quarter of 2019. (4) Represents other non-recurring expenses which were recorded in distribution and service fees. (5) Represents net foreign currency exchange (gains) losses associated with U.S. dollar-denominated assets held by certain foreign subsidiaries. (6) Tax adjustments are summarized in the following table: | |
| | | | |
| | | | | | | | | | |
| | | | | | | | | | |
Discrete tax items | $ | (4,435) | | | $ | 62 | | | $ | (1,837) | | | $ | (10,180) | | | $ | (2,040) | | |
Tax effect of non-GAAP adjustments | (14,316) | | | 407 | | | (1,027) | | | (17,119) | | | 38 | | |
Total tax adjustments | $ | (18,751) | | | $ | 469 | | | $ | (2,864) | | | $ | (27,299) | | | $ | (2,002) | | |
| | | | | | | | | | |
| | | | | | | | | | | | | | | | | | | | | | | | | | | | | | | | |
| Reconciliation of U.S. GAAP Operating Income and U.S. GAAP Operating Margin to Operating Income, As Adjusted, and Operating Margin, As Adjusted |
| | | | | | | | | | |
| (in thousands, except percentages) | Three Months Ended | | Year Ended | |
| December 31, 2020 | | September 30, 2020 | | December 31, 2019 | | December 31, 2020 | | December 31, 2019 | |
| Revenue, U.S. GAAP | $ | 116,460 | | | $ | 111,159 | | | $ | 109,847 | | | $ | 427,536 | | | $ | 410,830 | | |
Seed investments (1) | 95 | | | 275 | | | (19) | | | 281 | | | (438) | | |
| Revenue, as adjusted | $ | 116,555 | | | $ | 111,434 | | | $ | 109,828 | | | $ | 427,817 | | | $ | 410,392 | | |
| | | | | | | | | | |
| Expenses, U.S. GAAP | $ | 128,374 | | | $ | 67,852 | | | $ | 63,385 | | | $ | 332,479 | | | $ | 250,696 | | |
Seed investments (1) | (69) | | | 102 | | | (224) | | | (424) | | | (1,323) | | |
Accelerated vesting of restricted stock units | (387) | | | (387) | | | (358) | | | (774) | | | (1,344) | | |
Initial public offering costs (2) | (60,249) | | | (310) | | | — | | | (60,559) | | | — | | |
Rights offering costs (3) | — | | | — | | | (346) | | | (11,859) | | | (346) | | |
Other non-recurring expenses (4) | (500) | | | — | | | — | | | (500) | | | — | | |
| Expenses, as adjusted | $ | 67,169 | | | $ | 67,257 | | | $ | 62,457 | | | $ | 258,363 | | | $ | 247,683 | | |
| | | | | | | | | | |
| Operating income (loss), U.S. GAAP | $ | (11,914) | | | $ | 43,307 | | | $ | 46,462 | | | $ | 95,057 | | | $ | 160,134 | | |
Seed investments (1) | 164 | | | 173 | | | 205 | | | 705 | | | 885 | | |
Accelerated vesting of restricted stock units | 387 | | | 387 | | | 358 | | | 774 | | | 1,344 | | |
Initial public offering costs (2) | 60,249 | | | 310 | | | — | | | 60,559 | | | — | | |
Rights offering costs (3) | — | | | — | | | 346 | | | 11,859 | | | 346 | | |
Other non-recurring expenses (4) | 500 | | | — | | | — | | | 500 | | | — | | |
| Operating income, as adjusted | $ | 49,386 | | | $ | 44,177 | | | $ | 47,371 | | | $ | 169,454 | | | $ | 162,709 | | |
| | | | | | | | | | |
| Operating margin, U.S. GAAP | (10.2) | % | | 39.0 | % | | 42.3 | % | | 22.2 | % | | 39.0 | % | |
| Operating margin, as adjusted | 42.4 | % | | 39.6 | % | | 43.1 | % | | 39.6 | % | | 39.6 | % | |
_________________________
(1) Represents amounts related to the deconsolidation of seed investments in Company-sponsored funds as well as non-operating (income) loss from seed investments that were not consolidated. (2) Represents costs associated with the initial public offering of PTA. Costs are summarized in the following table: |
Employee compensation and benefits | $ | 1,317 | | | $ | — | | | $ | — | | | $ | 1,317 | | | $ | — | | |
Distribution and service fees | 57,818 | | | — | | | — | | | 57,818 | | | — | | |
| General and administrative | 1,114 | | | 310 | | | — | | | 1,424 | | | — | | |
Initial public offering costs | $ | 60,249 | | | $ | 310 | | | $ | — | | | $ | 60,559 | | | $ | — | | |
(3) Represents costs associated with RQI rights offering which were recorded in general and administrative expense in the first quarter of 2020 and fourth quarter of 2019. (4) Represents other non-recurring expenses which were recorded in distribution and service fees. |
| | | | | | | | | | |
| | | | | | | | | | | | | | | | | | | | | | | | | | | | | | | | |
| Reconciliation of U.S. GAAP Non-operating Income (Loss) to Non-operating Income (Loss), As Adjusted | |
| | | | | | | | | | |
| (in thousands) | Three Months Ended | | Year Ended | |
| December 31, 2020 | | September 30, 2020 | | December 31, 2019 | | December 31, 2020 | | December 31, 2019 | |
| Non-operating income (loss), U.S. GAAP | $ | 6,989 | | | $ | 3,231 | | | $ | 1,352 | | | $ | (1,670) | | | $ | 27,415 | | |
Seed investments (1) | (8,079) | | | (3,961) | | | (2,830) | | | 2,157 | | | (25,106) | | |
Foreign currency exchange (gain) loss—net (2) | 1,683 | | | 1,232 | | | 2,822 | | | 871 | | | 1,909 | | |
| Non-operating income (loss), as adjusted | $ | 593 | | | $ | 502 | | | $ | 1,344 | | | $ | 1,358 | | | $ | 4,218 | | |
_________________________
(1) Represents amounts related to the deconsolidation of seed investments in Company-sponsored funds as well as non-operating (income) loss from seed investments that were not consolidated. (2) Represents net foreign currency exchange (gains) losses associated with U.S. dollar-denominated assets held by certain foreign subsidiaries. |