| QUARTERLY REPORT SEPTEMBER 2025 Comments from Managing Director and CEO, Douglas Thompson “Following the record ROM production in June to end Q2, our operations continued the positive momentum and had another strong quarter. Q3 delivered material increases in all production and sales metrics. Saleable production was our highest since Q1 2021 and we again improved costs for another quarter. The quarter’s increased operational performance was driven by the continued ramp up of our Mammoth and Buchanan Expansion projects, coupled with the positive productivity of our base operations. Our performance is expected to continue to improve into Q4, with our expansion projects scheduled to hit planned run rates by the end of year and the continuation of benefits from our cost reduction programs. The Buchanan expansion project and Mammoth are forecasted to generate an additional ~3 Mt (annualised) of Saleable production. These projects are also expected to result in lower unit cost and drive significantly improved earnings and cash generation. Our business initiatives to preserve cash and enhance near-term liquidity continue to deliver, although market conditions for metallurgical coal remain challenging, with persistently low pricing. These initiatives included reductions in both operating and capital expenditures, rephasing of project timelines, and optimisation of working capital. These actions HIGHLIGHTS ➢ Growth across all key production and sales metrics: 21% increase in Saleable production (highest since Q1 2021) 9% increase in Sales volumes 6% increase in ROM production ➢ Investments in new operations progressing to steady state: +3.2Mt (annualised) production Q2 v Q3, demonstrated step change in operations Mammoth doubled production in the quarter to be at 65% of nameplate Sustained cost below lower end of guidance $90/t ➢ Second quarter in a row of below guidance unit cost with September month well below guidance at $80/t. ➢ Recently announced transaction with Stanwell, once completed, to add to near-term liquidity with $265 million ABL Facility, 2026 rebate waiver ~$110 million and ongoing financial support when liquidity is under $250 million. This transaction in combination with the on-going production and productivity improvements is expected to secure long-term supply to Stanwell notwithstanding the extremely challenging market conditions. ➢ Expected continued further positive momentum from increased production in Q4. ➢ The market remains subdued for a prolonged period, presently a challenge to producers and is impacting the industry as a whole. |
| QUARTERLY REPORT SEPTEMBER 2025 2 continue progressing well to deliver liquidity improvements of approximately $80 million over the course of 2025, with ~$25 million delivered in the quarter. We have made further meaningful progress on near-term funding initiatives with a proposed ~$265 million asset based loan facility with Stanwell which will, on closing of the recently announced transaction, replace the existing ABL Facility; and further liquidity support through FY26 amounting to a maximum of nominated tonnes at full market price if our cash balance is lower than $250 million. The arrangement with Stanwell, which is currently non-binding and subject to completion of due diligence, long form documents and approvals during November, is expected to support our liquidity needs through the sustained low pricing cycle, has flexible covenants, removes the rebate obligations to Stanwell from 2026 and also only requires repayment when we have more than $300 million in available liquidity. We value our relationship with Stanwell; and the announced transaction provides long term benefits to both Stanwell and Coronado that should underwrite long term security of supply, notwithstanding the very challenging market environment. The Company is proud to be an important supplier to Queensland’s power supply. Looking ahead, we remain confident in the strength of our asset base. Our high-quality, long-life coal reserves, strategically located operations, highly sought-after products and well-established relationships with customers in high-growth markets provide a solid foundation for long-term value creation. Our strategic priorities remain unchanged: to operate efficiently and safely, protect cash, secure liquidity and preserve optionality through the current market downturn. We will also stay focused on any options to improve value, including potential minority asset sales, and expect to be ready to grow when the cycle improves. Coronado is a business with strong fundamentals, a clear direction, and a leadership team focused on navigating current challenges while building for the future. We expect our continued uplift in demonstrated operating performance in Q3 and new liquidity runway will see our business in a stronger position.” OPERATIONS AND SALES Quarterly Segment Production, Sales volumes, and Realised pricing Summary Information (unaudited) Sep Q25 Jun Q25 Change Sep 2025 YTD Sep 2024 YTD Change ROM production Mt 7.4 7.0 6.0% 20.3 19.7 3.1% Australia Mt 3.7 3.4 8.4% 9.6 9.2 4.6% USA Mt 3.7 3.6 3.7% 10.7 10.5 1.7% Saleable production Mt 4.5 3.7 21.0% 11.7 11.3 3.1% Australia Mt 3.1 2.3 32.2% 7.5 7.1 6.3% USA Mt 1.4 1.4 2.5% 4.1 4.2 (2.3%) % Met Coal % 72.3% 79.6% (7.3%) 77.8% 80.9% (3.1%) Sales volumes Mt 4.0 3.7 8.9% 11.1 11.7 (5.1%) Australia Mt 2.8 2.2 23.8% 7.2 7.6 (5.2%) USA Mt 1.2 1.4 (13.9%) 3.9 4.1 (4.9%) Sales Mix Met Coal % 72.5% 78.4% (5.9%) 77.0% 80.3% (3.3%) Thermal Coal % 27.5% 21.6% 5.9% 23.0% 19.7% 3.3% Export Sales % 69.8% 71.0% (1.2%) 70.2% 70.1% 0.1% Domestic Sales % 30.2% 29.0% 1.2% 29.8% 29.9% (0.1%) Avg Mining Cost / Tonne Sold $/t 89.7 92.0 (2.5%) 97.6 111.0 (12.1%) Australia 87.3 80.6 8.3% 91.5 109.6 (16.5%) USA 95.0 109.6 (13.3%) 108.9 113.7 (4.2%) Realised Pricing ($/t) AU- Realised Met Price (FOB) US $/t 145.1 147.5 (1.6%) 148.4 212.2 (30.1%) PLV HCC FOB AUS Index Price US $/t 183.5 184.2 (0.4%) 184.2 253.2 (27.2%) % of PLV HCC FOB AUS Index % 79.1% 80.1% (1.0%) 80.5% 83.8% (3.3%) US - Realised Met Price (FOR) US $/t 154.2 149.6 3.1% 150.8 164.8 (8.5%) % of PLV HCC FOB AUS Index % 84.0% 81.2% 2.8% 81.8% 65.1% 16.7% Group - Realised Met Price (combined FOB/FOR) US 148.6 148.4 0.1% 149.4 192.6 (22.4%) % of PLV HCC FOB AUS Index % 81.0% 80.6% 0.3% 81.1% 76.1% 5.0% Note: Coronado reports its production and financial information on a geographical segment basis. Please refer to production and sales data by mine. Some numerical figures in the above table have been subject to rounding adjustments. Accordingly, numerical figures shown as totals may not equal the sum of the figures that follow them. |
| QUARTERLY REPORT SEPTEMBER 2025 3 Group Production Overview The September quarter delivered the highest quarterly Saleable production we have achieved since the first quarter of 2021. Met coal Sales volumes were 0.8% higher than prior quarter and thermal Sales volumes were 38.5% higher than prior quarter due to catch up on contracted volumes. Total inventory was ~1.7 Mt, 0.3 Mt higher than the Q2 closing balance, with slightly more held at port due to shipping congestion in Australia and vessel schedule changes in the U.S. towards the end of the quarter. Production is expected to continue to ramp-up in the fourth quarter, with our Buchanan expansion project and Mammoth underground mine producing coal and on track to deliver increased production run rates in the second half of the year equivalent to ~+3 Mt (annualised). The increased production is expected to have a significant favourable impact on earnings and operating cashflow. Australian Operations (Curragh Complex) The September quarter was a strong quarter for Sales volumes, Saleable production and ROM production. The September quarter broke a record standing since Q1 FY22 for Sales volume, demonstrating the results of the improvements made and the ability to increase production volumes. Cost reductions continued to be realised, with Average Mining Costs Per Tonne Sold in Q3 remaining well below the low end of guidance levels and improved on prior quarter excluding inventory movements. At Mammoth, all continuous miners are fully operational after the third continuous miner commenced production in late June. Mammoth now has three production panels in operation performing at 65% of nameplate in September. Mammoth is expected to deliver an additional 2 Mt incremental Saleable production per year and is expected to achieve this in 2026. U.S. Operations (Logan and Buchanan) In the September quarter, Coronado’s U.S. operations focused on the commissioning of the Buchanan expansion project, which we expect to result in increased volumes through Q4. ROM production and Saleable production were higher than the prior quarter but slightly behind plan due to hoist and shaft maintenance, this maintenance was brought forward for the original shaft post commissioning the new shaft. Sales volumes were marginally lower than the prior quarter due to a delayed vessel in the last week of September which pushed back the remaining shipments for the month. Buchanan continues to benefit from the operational flexibility afforded by the two longwalls yielding increased skip counts, now at record levels of 1,115 skips per day, an increase of ~25% on prior quarter. The Buchanan expansion project has added additional intermediate raw and product stockpiles and a second set of skips, providing further capacity. First coal was delivered from the Buchanan expansion project during the June quarter, with ~+1 Mt annual run rates expected to be achieved in steady state. Rail and port operations associated with Coronado’s U.S. operations performed as expected during the quarter despite the vessel delays at port towards end of September. The expansion is expected to reduce costs, increase production above levels that were achieved at the time Coronado acquired Buchanan; and ensure a long (20+ years) life. Safety and Health The Group TRIR as of 30 September 2025 was 1.16 compared to 1.22 in the same period in the prior year. In Australia, the 12-month rolling average TRIR as of 30 September 2025 was 2.88. In the U.S., the 12-month rolling average TRIR as of 30 September 2025 was 1.95, both well below the industry averages. Sales volumes, Realisations and Mix Sales volumes were up 9% on the prior quarter, attributable to improved performance from both the Australian and U.S. operations. Met coal realisation was similar to the prior quarter, as the market continued to prefer 2 nd tier lower cost products. Sales mix consisted of ~73% Met coal and ~28% thermal coal due to catching up on contracted thermal Sales volumes. |
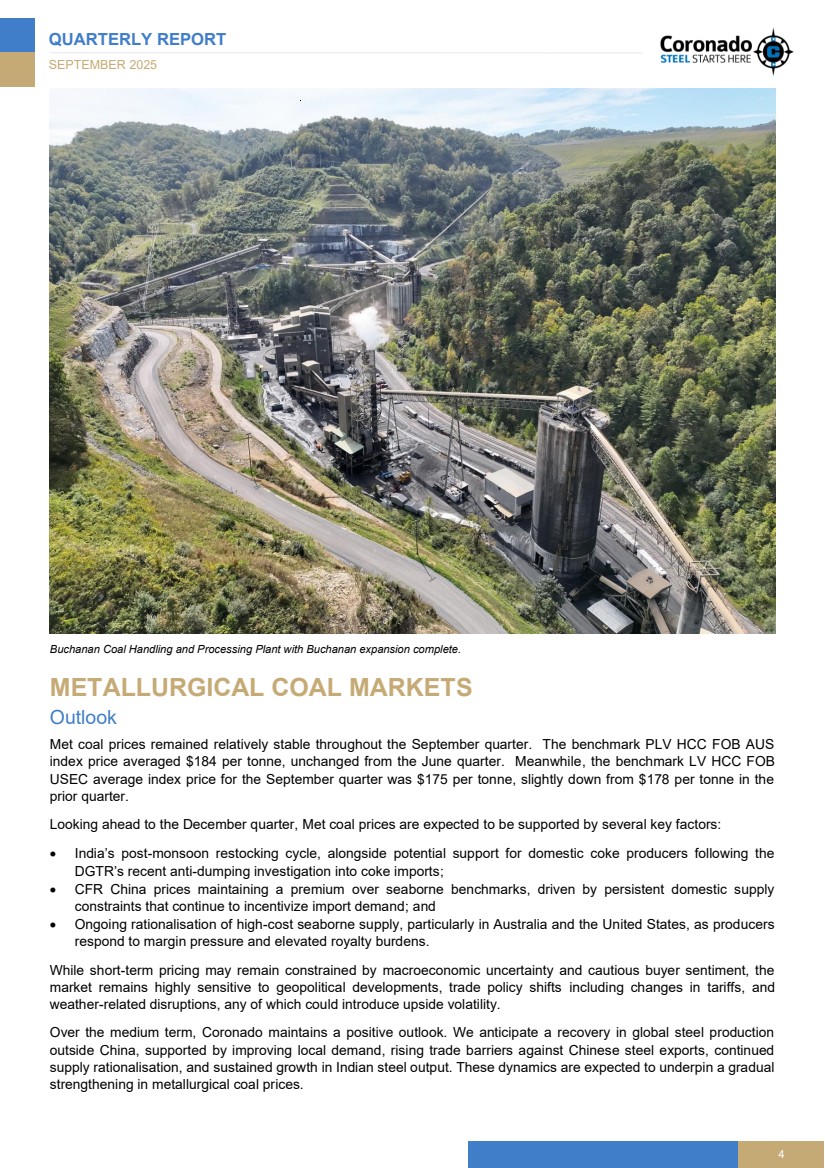
| QUARTERLY REPORT SEPTEMBER 2025 4 Buchanan Coal Handling and Processing Plant with Buchanan expansion complete. METALLURGICAL COAL MARKETS Outlook Met coal prices remained relatively stable throughout the September quarter. The benchmark PLV HCC FOB AUS index price averaged $184 per tonne, unchanged from the June quarter. Meanwhile, the benchmark LV HCC FOB USEC average index price for the September quarter was $175 per tonne, slightly down from $178 per tonne in the prior quarter. Looking ahead to the December quarter, Met coal prices are expected to be supported by several key factors: • India’s post-monsoon restocking cycle, alongside potential support for domestic coke producers following the DGTR’s recent anti-dumping investigation into coke imports; • CFR China prices maintaining a premium over seaborne benchmarks, driven by persistent domestic supply constraints that continue to incentivize import demand; and • Ongoing rationalisation of high-cost seaborne supply, particularly in Australia and the United States, as producers respond to margin pressure and elevated royalty burdens. While short-term pricing may remain constrained by macroeconomic uncertainty and cautious buyer sentiment, the market remains highly sensitive to geopolitical developments, trade policy shifts including changes in tariffs, and weather-related disruptions, any of which could introduce upside volatility. Over the medium term, Coronado maintains a positive outlook. We anticipate a recovery in global steel production outside China, supported by improving local demand, rising trade barriers against Chinese steel exports, continued supply rationalisation, and sustained growth in Indian steel output. These dynamics are expected to underpin a gradual strengthening in metallurgical coal prices. |
| QUARTERLY REPORT SEPTEMBER 2025 5 FINANCIAL PERFORMANCE Coronado again achieved further improvement in production and unit cost in the September quarter. The unit cost was below the bottom-end of guidance at $89.7/t and September month was $80.1/t with 2.7 Mt of ROM tonnes mined. We expect the full year unit cost position to be around the mid-point of guidance. Cash capital expenditure reduced as expected and was $16 million lower than the June quarter at $75 million and cash capital expenditure is expected to be at the bottom-end of guidance of $230 million. Despite rail availability and shipping delays in September resulting in a 560kt build of product inventory that will be sold in the December quarter and contribute towards cash, Sales volumes were up 329kt, 9% on the June quarter, predominantly comprising thermal coal. Earnings, before the Stanwell rebate that is deferred, were ~$4 million. The working capital outflows outlined in our first half year results presentation, materialised as expected; and that, together with the increase in product inventory, was offset by compensating working capital initiatives at the end of September instead of using the ABL Facility to fund the outflow. Other cash outflows comprised capital expenditure of $59 million, interest payments of $26 million mainly relating to the coupon on the Company’s high-yield senior secured notes; and the need to cash back a further $29 million in guarantees, mainly U.S. workers’ compensation obligations. The quarter-end cash balance was $172 million and $16 million was available on the ABL Facility that was $75 million drawn. With earnings adversely impacted by a PLV index that remained flat on the first half of the year, build-up of product inventory as well as a lower realised price due to the sales mix, a pre-emptive covenant waiver was obtained during September and the ABL Facility remains available, subject to the borrowing base. The recently announced transaction with Stanwell, once completed, is expected to address both Coronado’s near- and longer-term funding needs in a depressed Met coal market. Subject to completion of due diligence, long-form agreements and approval, financial close is expected towards the end of November with the proposed asset based loan facility adding ~$165 million to available liquidity after settling the outstanding amount to Oaktree under the current ABL Facility. The waiver of the remaining rebate under the Amended Coal Supply Agreement (ACSA) together with the prepayment mechanism that applies when Coronado’s liquidity is under $250 million could add a further ~$250 million to cash flow over the course of FY26 at current market prices, noting that the amount depends on Stanwell’s nominated tonnages; and cash flows occur monthly, not upfront at the start of the year. As our recently commissioned expansion projects ramp up and reach nameplate performance, this will further contribute to lower unit cost and improved cash generation. While the arrangement with Stanwell provides immediate liquidity relief and longer-term support we will continue to evaluate other available options to ensure that we can improve value in the current low-price environment. Coronado intends to release its quarterly financial statements for the September quarter (SEC Form 10-Q) to the market on 11 November 2025 (AEST). Coronado quotes all numbers in U.S. dollars. This Quarterly Report was authorised for release by the Board of Coronado Global Resources Inc. Contacts Coronado Global Resources Inc. ARBN: 628 199 468 Registered Office: Level 33, Central Plaza One, 345 Queen Street, Brisbane QLD 4000 Australia. T: +61 7 3031 7777 | E: [email protected] | www.coronadoglobal.com Investors Media Chantelle Essa Helen McCombie Vice President Investor Relations Sodali & Co T: +61 477 949 261 T: +61 411 756 248 E: [email protected] E: [email protected] |

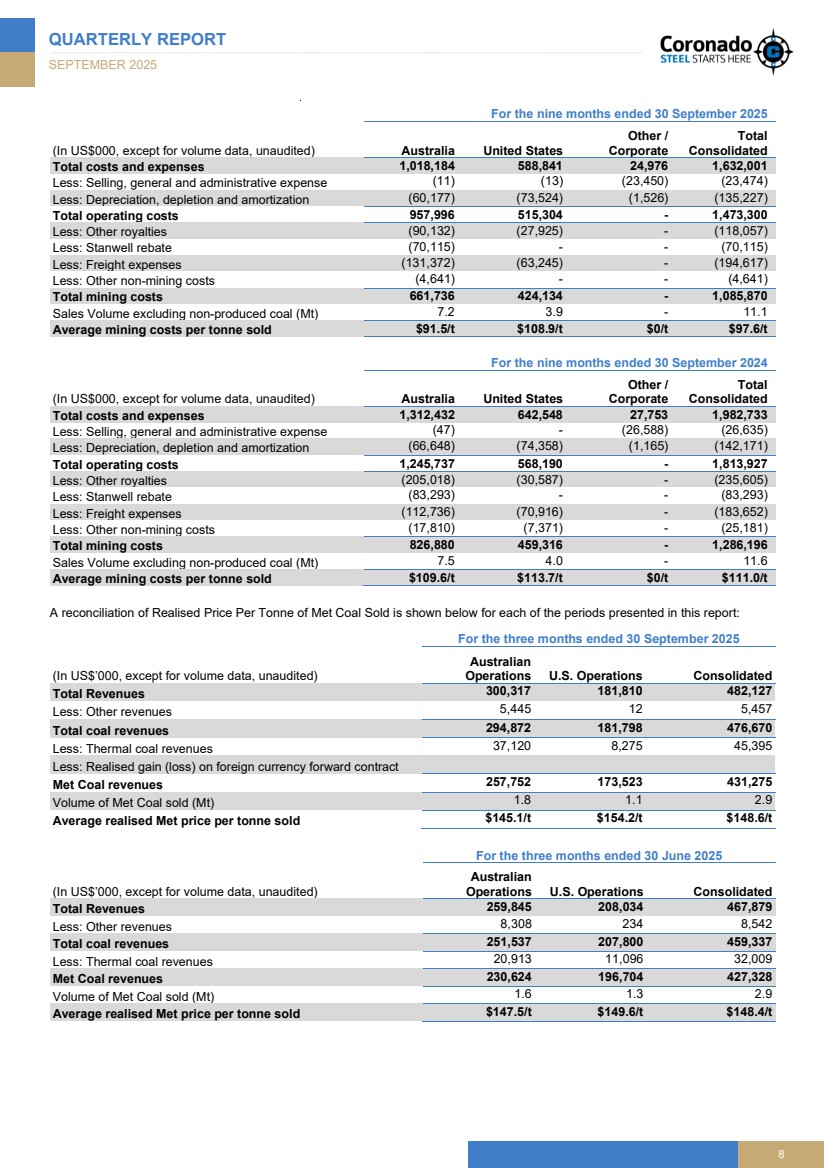
| QUARTERLY REPORT SEPTEMBER 2025 6 APPENDIX Quarterly Production and Sales Volumes by Mine Summary Information (unaudited) Sep Q25 Jun Q25 Change Sep 2025 YTD Sep 2024 YTD Change ROM production Mt 7.4 7.0 6.0% 20.3 19.7 3.1% Curragh Mt 3.7 3.4 8.4% 9.6 9.2 4.6% Buchanan Mt 2.2 1.9 14.4% 5.9 5.6 6.2% Logan Mt 1.5 1.7 (8.6%) 4.8 5.0 (3.3%) Saleable production Mt 4.5 3.7 21.0% 11.7 11.3 3.1% Curragh Mt 3.1 2.3 32.2% 7.5 7.1 6.3% Buchanan Mt 1.0 0.9 16.1% 2.7 2.6 3.8% Logan Mt 0.4 0.5 (21.3%) 1.4 1.6 (12.4%) Sales volumes Mt 4.0 3.7 8.9% 11.1 11.7 (5.1%) Curragh Mt 2.8 2.2 23.8% 7.2 7.6 (5.2%) Buchanan Mt 0.8 0.9 (7.6%) 2.6 2.5 0.6% Logan Mt 0.4 0.5 (24.3%) 1.3 1.5 (13.5%) Some numerical figures in the above table have been subject to rounding adjustments. Accordingly, numerical figures shown as totals may not equal the sum of the figures that follow them. CAUTIONARY NOTICE REGARDING FORWARD-LOOKING STATEMENTS This report contains forward-looking statements concerning our business, operations, financial performance and condition, the coal, steel and other industries, and our plans, objectives and expectations for our business, operations, financial performance and condition. Forward-looking statements may be identified by words such as "may", "could", "believes", "estimates", "expects", "intends", “plans”, "considers", “forecasts”, “anticipates”, “targets” and other similar words that involve risk and uncertainties. Forward-looking statements provide management's current expectations or predictions of future conditions, events or results. All statements that address operating performance, events or developments that we expect or anticipate will occur in the future are forward-looking statements. They may include estimates of revenues, income, earnings per share, cost savings, capital expenditures, dividend payments, share repurchases, liquidity, capital structure, including the proposed refinancing and/or replacement of our current asset-based loan, market share, industry volume, or other financial items, descriptions of management’s plans or objectives for future operations, including the proposed entry into binding arrangements with Stanwell (of which there is no guarantee), risk inherent to mining operations, such as adverse weather conditions, or descriptions or assumptions underlying any of the above. All forward-looking statements speak only as of the date they are made and reflect the Company's good faith beliefs, assumptions and expectations, but they are not a guarantee of future performance or events. Furthermore, the Company disclaims any obligation to publicly update or revise any forward-looking statement, except as required by law. By their nature, forward-looking statements are subject to risks and uncertainties that could cause actual results to differ materially from those suggested by the forward-looking statements. Factors that might cause such differences include, but are not limited to, a variety of economic, competitive and regulatory factors, many of which are beyond the Company's control, that are described in our Annual Report on Form 10-K for the fiscal year ended 31 December 2024 filed with the ASX and SEC on 20 February 2025 (SEC 19 February 2025) (referred to in this report as the FY24 Form 10-K), as well as additional factors we may describe from time to time in other filings with the ASX and SEC. You may get such filings for free at our website at www.coronadoglobal.com. You should understand that it is not possible to predict or identify all such factors and, consequently, you should not consider any such list to be a complete set of all potential risks or uncertainties. RECONCILIATION OF NON-GAAP FINANCIAL MEASURES This report includes a discussion of results of operations and references to and analysis of certain non-GAAP measures (as described below) which are financial measures not recognised in accordance with U.S. GAAP. Non-GAAP financial measures are used by the Company and investors to measure operating performance. Non-GAAP financial measures used in this report include (i) Realised Price Per Tonne of Met Coal Sold, which we define as Met Coal revenues divided by metallurgical sales volume; (ii) Average Mining Costs Per Tonne Sold, which we define as mining costs divided by Sales volumes; and (iii) Net (Debt) / Cash, which we define as cash and cash equivalents (excluding restricted cash), less the outstanding aggregate principal amount of interest bearing liabilities. We evaluate our mining cost on a cost per metric tonne basis. Mining costs is based on reported cost of coal revenues, which is shown on our statement of operations and comprehensive income exclusive of freight expense, Stanwell rebate, other royalties, depreciation, depletion and amortization and selling, general and administrative expenses, adjusted for other items that do not relate directly to the costs incurred to produce coal at the mine. |
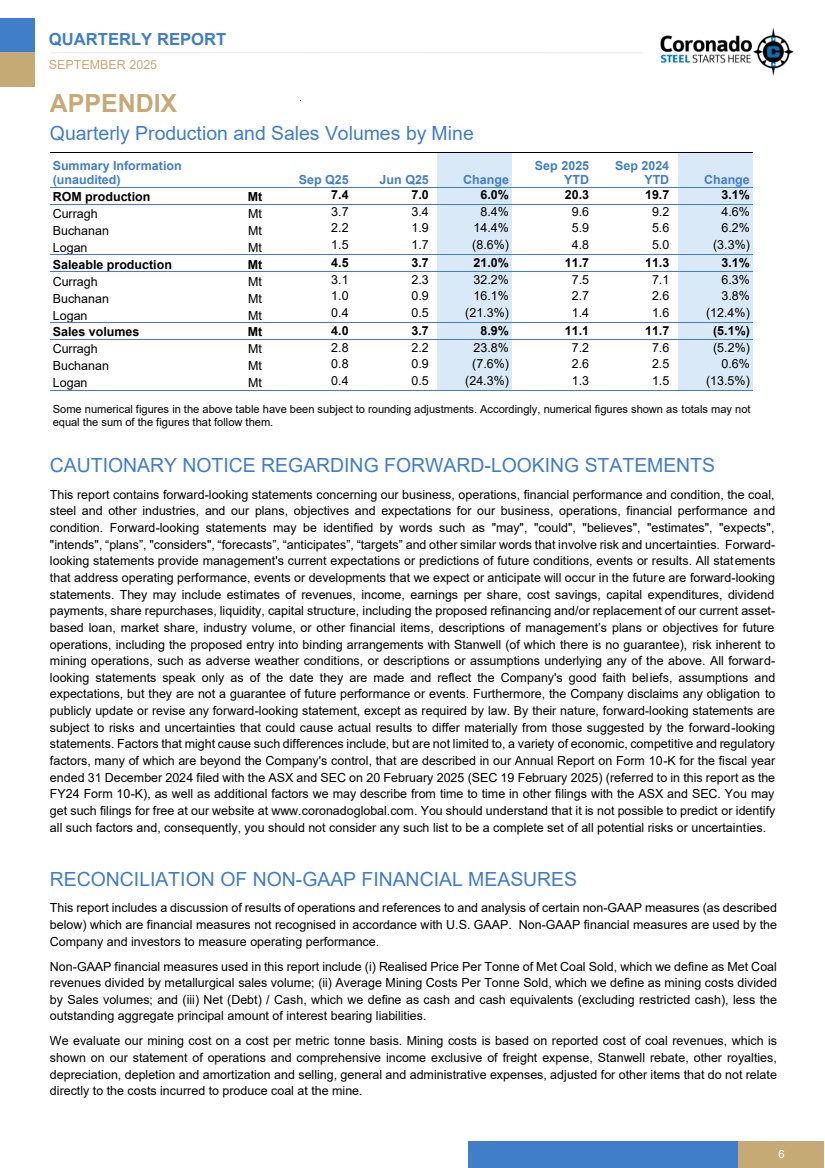
| QUARTERLY REPORT SEPTEMBER 2025 7 Reconciliations of certain forward-looking non-GAAP financial measures, including market guidance, to the most directly comparable GAAP financial measures are not provided because the Company is unable to provide such reconciliations without unreasonable effort, due to the uncertainty and inherent difficulty of predicting the occurrence and the financial impact of items impacting comparability and the periods in which such items may be recognised. For the same reasons, the Company is unable to address the probable significance of the unavailable information, which could be material to future results. A reconciliation of Net (Debt) / Cash is shown below for each of the periods presented in this report: 30 September 2025 30 June 2025 (In US$000, except for volume data, unaudited) Total Consolidated Total Consolidated Cash and cash equivalents 172,089 261,836 Less: Restricted cash (252) (251) Cash and cash equivalents (excluding restricted cash) 171,837 261,585 Less: Aggregate principal amount of 9.250% Notes (400,000) (400,000) Less: Aggregate principal amount of the ABL Facility (75,000) (75,000) Less: Loan – Curragh housing transaction – current (1,717) (1,652) Less: Loan – Curragh housing transaction – noncurrent (23,100) (23,360) Net Debt (327,980) (238,427) A reconciliation of consolidated costs and expenses, consolidated operating costs, and consolidated mining costs are shown below: For the three months ended 30 September 2025 (In US$000, except for volume data, unaudited) Australia United States Other / Corporate Total Consolidated Total costs and expenses 370,733 175,232 8,106 554,071 Less: Selling, general and administrative expense (4) - (7,537) (7,541) Less: Depreciation, depletion and amortization (22,573) (26,056) (569) (49,198) Total operating costs 348,156 149,176 - 497,332 Less: Other royalties (30,035) (8,655) - (38,690) Less: Stanwell rebate (26,331) - - (26,331) Less: Freight expenses (49,717) (22,006) - (71,723) Less: Other non-mining costs (1,603) - - (1,603) Total mining costs 240,470 118,515 - 358,985 Sales Volume excluding non-produced coal (Mt) 2.8 1.2 - 4.0 Average mining costs per tonne sold $87.3/t $95.0/t $0/t $89.7/t 30 September 2025 (In US$000, except for volume data, unaudited) Australia United States Other / Corporate Total Consolidated Total costs and expenses 158,289 Less: Selling, general and administrative expense (1,594) Less: Depreciation, depletion and amortization (18,571) Total operating costs 138,124 Less: Other royalties (11,696) Less: Stanwell rebate (9,416) Less: Freight expenses (21,180) Less: Other non-mining costs (538) Total mining costs 95,294 Sales Volume excluding non-produced coal (Mt) 1.2 Average mining costs per tonne sold $80.1/t |
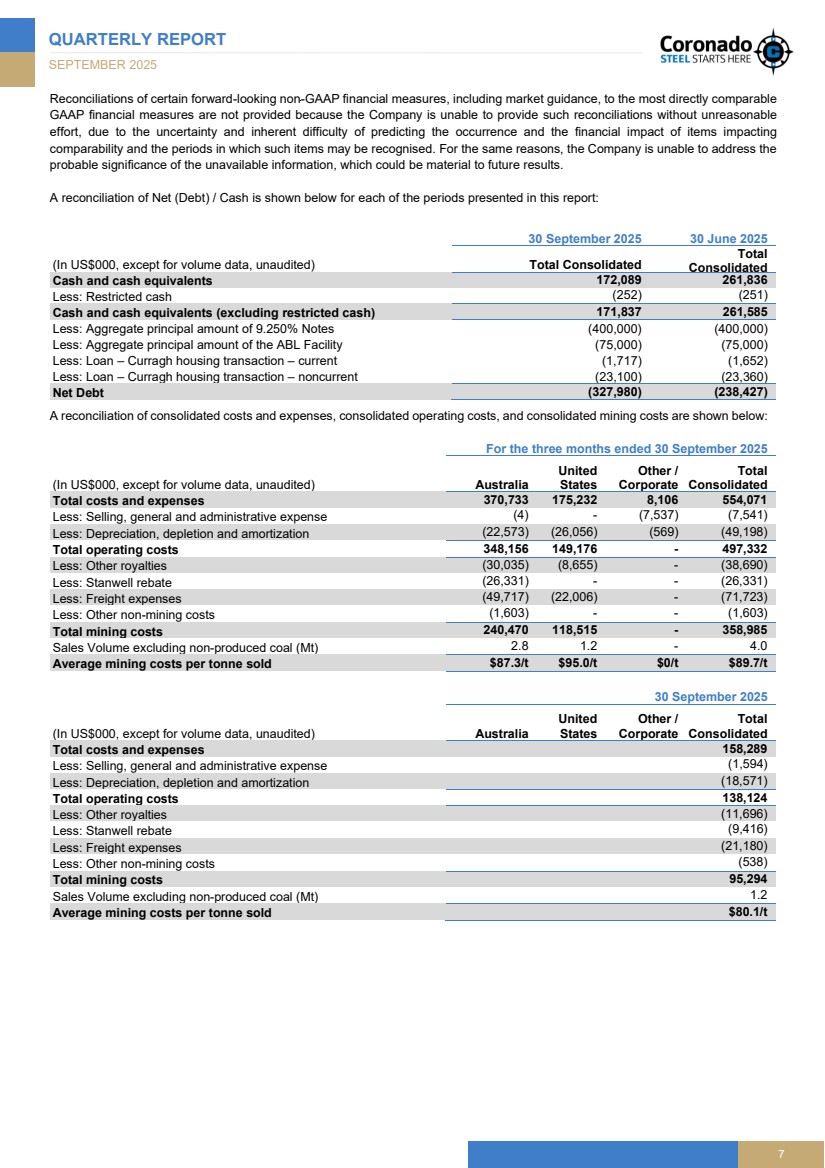
| QUARTERLY REPORT SEPTEMBER 2025 8 For the nine months ended 30 September 2025 (In US$000, except for volume data, unaudited) Australia United States Other / Corporate Total Consolidated Total costs and expenses 1,018,184 588,841 24,976 1,632,001 Less: Selling, general and administrative expense (11) (13) (23,450) (23,474) Less: Depreciation, depletion and amortization (60,177) (73,524) (1,526) (135,227) Total operating costs 957,996 515,304 - 1,473,300 Less: Other royalties (90,132) (27,925) - (118,057) Less: Stanwell rebate (70,115) - - (70,115) Less: Freight expenses (131,372) (63,245) - (194,617) Less: Other non-mining costs (4,641) - - (4,641) Total mining costs 661,736 424,134 - 1,085,870 Sales Volume excluding non-produced coal (Mt) 7.2 3.9 - 11.1 Average mining costs per tonne sold $91.5/t $108.9/t $0/t $97.6/t For the nine months ended 30 September 2024 (In US$000, except for volume data, unaudited) Australia United States Other / Corporate Total Consolidated Total costs and expenses 1,312,432 642,548 27,753 1,982,733 Less: Selling, general and administrative expense (47) - (26,588) (26,635) Less: Depreciation, depletion and amortization (66,648) (74,358) (1,165) (142,171) Total operating costs 1,245,737 568,190 - 1,813,927 Less: Other royalties (205,018) (30,587) - (235,605) Less: Stanwell rebate (83,293) - - (83,293) Less: Freight expenses (112,736) (70,916) - (183,652) Less: Other non-mining costs (17,810) (7,371) - (25,181) Total mining costs 826,880 459,316 - 1,286,196 Sales Volume excluding non-produced coal (Mt) 7.5 4.0 - 11.6 Average mining costs per tonne sold $109.6/t $113.7/t $0/t $111.0/t A reconciliation of Realised Price Per Tonne of Met Coal Sold is shown below for each of the periods presented in this report: For the three months ended 30 September 2025 (In US$’000, except for volume data, unaudited) Australian Operations U.S. Operations Consolidated Total Revenues 300,317 181,810 482,127 Less: Other revenues 5,445 12 5,457 Total coal revenues 294,872 181,798 476,670 Less: Thermal coal revenues 37,120 8,275 45,395 Less: Realised gain (loss) on foreign currency forward contract Met Coal revenues 257,752 173,523 431,275 Volume of Met Coal sold (Mt) 1.8 1.1 2.9 Average realised Met price per tonne sold $145.1/t $154.2/t $148.6/t For the three months ended 30 June 2025 (In US$’000, except for volume data, unaudited) Australian Operations U.S. Operations Consolidated Total Revenues 259,845 208,034 467,879 Less: Other revenues 8,308 234 8,542 Total coal revenues 251,537 207,800 459,337 Less: Thermal coal revenues 20,913 11,096 32,009 Met Coal revenues 230,624 196,704 427,328 Volume of Met Coal sold (Mt) 1.6 1.3 2.9 Average realised Met price per tonne sold $147.5/t $149.6/t $148.4/t |
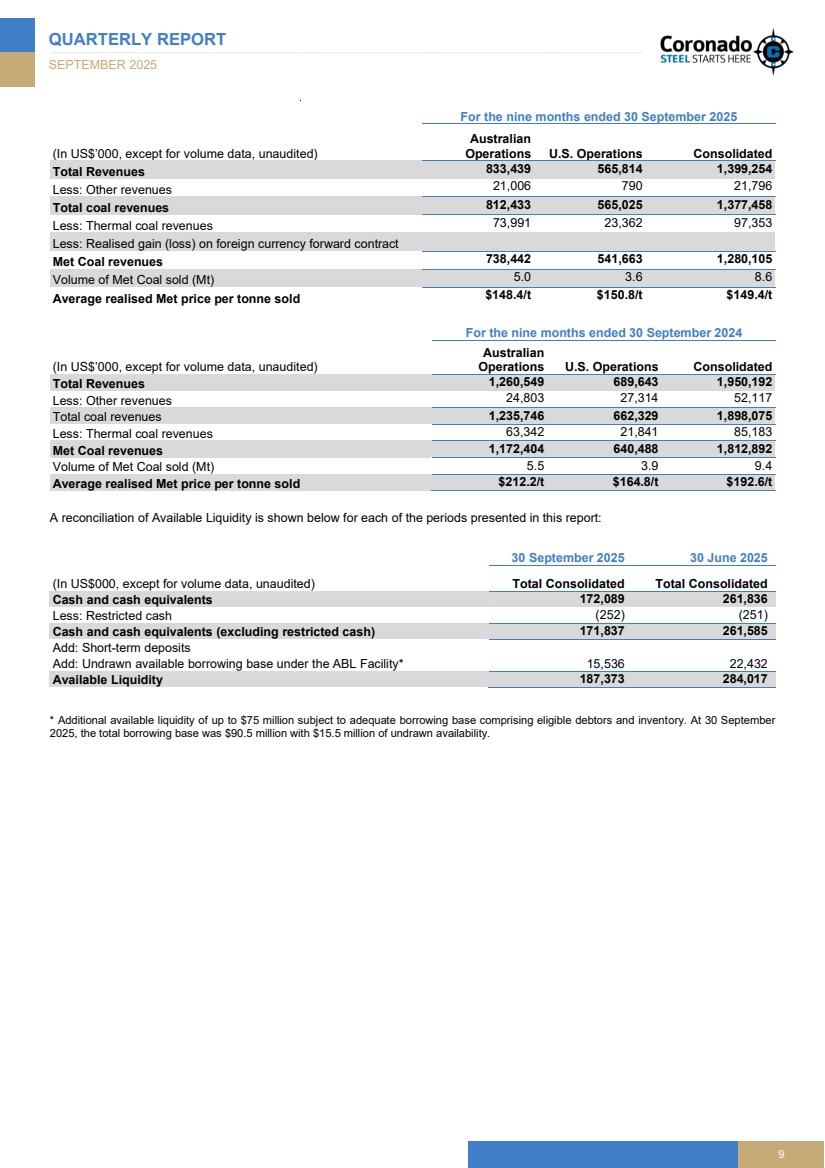
| QUARTERLY REPORT SEPTEMBER 2025 9 For the nine months ended 30 September 2025 (In US$’000, except for volume data, unaudited) Australian Operations U.S. Operations Consolidated Total Revenues 833,439 565,814 1,399,254 Less: Other revenues 21,006 790 21,796 Total coal revenues 812,433 565,025 1,377,458 Less: Thermal coal revenues 73,991 23,362 97,353 Less: Realised gain (loss) on foreign currency forward contract Met Coal revenues 738,442 541,663 1,280,105 Volume of Met Coal sold (Mt) 5.0 3.6 8.6 Average realised Met price per tonne sold $148.4/t $150.8/t $149.4/t For the nine months ended 30 September 2024 (In US$’000, except for volume data, unaudited) Australian Operations U.S. Operations Consolidated Total Revenues 1,260,549 689,643 1,950,192 Less: Other revenues 24,803 27,314 52,117 Total coal revenues 1,235,746 662,329 1,898,075 Less: Thermal coal revenues 63,342 21,841 85,183 Met Coal revenues 1,172,404 640,488 1,812,892 Volume of Met Coal sold (Mt) 5.5 3.9 9.4 Average realised Met price per tonne sold $212.2/t $164.8/t $192.6/t A reconciliation of Available Liquidity is shown below for each of the periods presented in this report: 30 September 2025 30 June 2025 (In US$000, except for volume data, unaudited) Total Consolidated Total Consolidated Cash and cash equivalents 172,089 261,836 Less: Restricted cash (252) (251) Cash and cash equivalents (excluding restricted cash) 171,837 261,585 Add: Short-term deposits Add: Undrawn available borrowing base under the ABL Facility* 15,536 22,432 Available Liquidity 187,373 284,017 * Additional available liquidity of up to $75 million subject to adequate borrowing base comprising eligible debtors and inventory. At 30 September 2025, the total borrowing base was $90.5 million with $15.5 million of undrawn availability. |
| QUARTERLY REPORT SEPTEMBER 2025 10 GLOSSARY A$ Australian dollar currency Met Coal Metallurgical quality coal ABL Facility Asset Based Lending facility Mt Million tonnes, metric AEST Australian Eastern Standard Time Net (Debt) / Cash Refer Non-GAAP Financial Measures section AU / AUS Australia NEWC Thermal index price Thermal Coal Free On Board Newcastle (Australia) benchmark index price ASX Australian Securities Exchange One Curragh Plan The planned improvement initiatives at the Company’s Curragh Mine Complex in Australia. Available Liquidity Refer Non-GAAP Financial Measures section PCI Pulverised Coal Injection PLV HCC FOB AUS index price Premium Low-Volatile Hard Coking Coal Free On Board Australian benchmark index price Average Mining Costs Per Tonne Sold Refer Non-GAAP Financial Measures section (also referred to in this document as ‘unit cost’) PLV HCC CFR China index price Premium Low-Volatile Hard Coking Coal (including cost of freight) to China benchmark index price Prime Waste Overburden removed (excluding rehandled waste) to gain access to the ore body Capital Expenditure Expenditure included as a component of Investing Activities within the Coronado Consolidated Statement of Cash Flows Realised pricing Average realised Met price per tonne sold Actual price received Refer Non-GAAP Financial Measures section CDI Chess Depositary Interest ROM Run of Mine, coal mined unwashed CHPP Coal Handling Preparation Plant Saleable production Coal available to sell, either washed or bypassed Closing Cash Cash and Cash Equivalents (excluding restricted cash) at the end of the quarter Sales volumes Sales to third parties EBITDA Earnings before interest, tax, depreciation, and amortization SGX Forward Curve Singapore Exchange Australian Coking Coal futures quotes FOB Free On Board in the vessel at the port Strip Ratio Ratio of overburden removed to coal mined (ROM) FOR Free on Rail in the railcar at the mine tCO2e Tonnes of Carbon Dioxide equivalent emissions Free Cash Flow Net Cash from Operating Activities less cash taxes, Capital Expenditure, Acquisition Expenditure, amounts reserved for Capital / Acquisition Expenditure and amounts required for Fixed Dividends and Debt Servicing. Total Waste Overburden removed (including rehandled waste) to gain access to the ore body FY Full Year 1 January to 31 December TRIFR TRIR Total Reportable Injury Frequency Rate, is the number of fatalities, lost time injuries, cases or substitute work and other injuries requiring medical treatment per Million hours worked on a rolling 12-month basis (used in Australia) Total Reportable Incident Rate, is a mathematical computation that takes into account how many Mine Safety and Health Administration (MSHA) recordable incidents our Company has per 200,000 hours worked on a rolling 12-month basis (used in the U.S. and for the Group) Group Result for all Coronado Global Resources entities in Australia and the United States H1 First six months of calendar year HCC Hard coking coal HVA High Vol A HVB High Vol B US$ United States dollar currency Kt Thousand tonnes, metric U.S. United States of America LTI Lost Time Injury VWAP Volume Weighted Average Realised Price LV HCC FOB USEC index price Low-Volatile Hard Coking Coal Free On Board United States East Coast benchmark index price YTD Year-to-date for the calendar year Mammoth Mammoth Underground Mine, in the Curragh Complex Mbcms Million Bank Cubic Metres of waste movement |