| Ad Hoc Group Investor Presentation Douglas Thompson CEO Barrie Van der Merwe CFO September 2025 |
| 2 Important Notices and Disclaimer You acknowledge that neither Coronado Global Resources Inc. (“Coronado”) nor any of its subsidiaries (the "Relevant Parties") shall have any liability to you or any other person for furnishing this presentation and the information contained herein (the “Presentation”) or for any action taken or decision made by you in purported reliance on such information. No Relevant Party is making any representation or warranty as to the accuracy or completeness of the information contained in this document, and no Relevant Party shall have any liability to you or any other person for failing to furnish any other information now or in the future known to or in possession of any Relevant Party or have any obligation to update or supplement any information previously provided to you with any additional information. The furnishing of the information contained in this document shall not, under any circumstances, create any implication that there has been no change in the information set forth herein or in the affairs of Coronado and its subsidiaries and affiliates since the date of such information or the date it was furnished. This Presentation does not constitute an offer to sell or the solicitation of an offer to buy any securities. Any offer or sale of such securities will only be made (i) within the United States, or to or for the account or benefit of U.S. persons, only to qualified institutional buyers (“QIBs”) and (ii) outside the United States in offshore transactions in accordance with Regulation S. Any purchaser of such securities in the United States, or to or for the account of U.S. persons, will be deemed to have made certain representations and acknowledgments, including, without limitation, that the purchaser is a QIB. This Presentation is intended for the recipient hereof and is for informational purposes only. By accepting this Presentation, each recipient expressly agrees to treat this Presentation and the information contained herein or accompanying it in a confidential manner and each recipient shall ensure that any person to whom it discloses any of this information complies with this paragraph. This Presentation does not constitute or form part of, and should not be construed as, an offer to sell or issue or the solicitation of an offer to buy or acquire securities of Coronado, nor shall there be any sale of securities in any state or other jurisdiction to any person or entity to which it is unlawful to make such offer, solicitation or sale in such state or jurisdiction. This Presentation is only intended to be distributed in circumstances where disclosure is not required under Chapter 6D.2 or Chapter 7 of the Corporations Act 2001 (Cth) of Australia (“Corporations Act”) and in such other circumstances as may be permitted by applicable law. This Presentation should not be distributed to, and is not intended for, any other person (including any “retail client” for the purposes of sections 761G and 761GA of the Corporations Act). This Presentation contains forward-looking statements and forward-looking information (collectively referred to as “forward-looking statements”) within the meaning of applicable United States Private Securities Legislation Reform Act of 1995, Section 27A of the Securities Act and 21E of the U.S. Securities Exchange Act of 1934, as amended, which may not be based on historical fact, including without limitation, statements regarding Coronado’s business, operations, financial performance and condition, the coal, steel and other industries, as well as our plans, objectives and expectations for our business, operations, financial performance and condition. All information contained in this Presentation, other than statements of current and historical fact, is forward-looking information. Often, but not always, forward-looking information can be identified by the use of words such as “may,” “could,” “believes,” “estimates,” “expects,” “intends,” “plans,” “anticipate,” “forecast,” “outlook,” “target,” “likely,” “considers” and similar expressions. All of the forward-looking information in this Presentation is qualified by this cautionary note. |
| 3 Important Notices and Disclaimer (Cont’d) All statements in this Presentation, other than statements of historical facts, that address estimated mineral resource and reserve quantities, grades and contained metal, and possible future mining, exploration and development activities, are forward-looking statements. Although Coronado believes the expectations expressed in such forward-looking statements are based on reasonable assumptions, such statements should not be in any way construed as guarantees of future performance and actual results or developments may differ materially from those in the forward-looking statements. Factors that could cause actual results to differ materially from those in forward-looking statements include market prices for metals, the conclusions of detailed feasibility and technical analyses, lower than expected grades and quantities of resources, mining rates and recovery rates and the lack of availability of necessary capital, which may not be available to Coronado on terms acceptable to it or at all. Coronado is subject to the specific risks inherent in the mining business as well as general economic and business conditions. For more information on Coronado, investors should review Coronado’s annual Form 10-K filing with the United States Securities and Exchange Commission (“SEC”) at www.sec.gov and with the Australian Securities Exchange (“ASX”) at www.asx.com.au. Market data and industry information used throughout this Presentation are based on Coronado’s management’s knowledge of the industry and the good faith estimates of management. Management also relied, to the extent available, upon management’s review of independent industry surveys and publications and other publicly available information prepared by a number of third party sources. All of the market data and industry information used in this Presentation involves a number of assumptions and limitations, and you are cautioned not to give undue weight to such estimates. Although Coronado’s management believes that these sources are reliable, we cannot guarantee the accuracy or completeness of this information, and we have not independently verified this information. While we believe the estimated market position, market opportunity and market size information included in this Presentation are generally reliable, such information, which is derived in part from management’s estimates and beliefs, is inherently uncertain and imprecise. No representations or warranties are made by the Relevant Parties as to the accuracy of any such statements or projections. Projections, assumptions and estimates of Coronado’s future performance and the future performance of the industry in which it operates are necessarily subject to a high degree of uncertainty and risk due to a variety of factors, including those described above. These and other factors could cause results to differ materially from those expressed in management’s estimates and beliefs and in the estimates prepared by independent parties. This Presentation contains certain “non-GAAP” financial measures, including Adjusted EBITDA. The non-GAAP financial measures contained in this Presentation are not measures of financial performance calculated in accordance with generally accepted accounting principles (“GAAP”) and should not be considered as replacements or alternatives determined in accordance with GAAP. Please refer to the Appendix of this Presentation for reconciliations of non-GAAP financial measures to their most directly comparable financial measures calculated in accordance with GAAP. Non-GAAP measures should be viewed in addition to, and not as substitute for, analysis of Coronado’s results reported in accordance with GAAP or otherwise. Notwithstanding these limitations, and in conjunction with other accounting and financial information available, Coronado’s management considers the non-GAAP financial measurers contained in this Presentation to be reasonable indicators for comparisons between Coronado and Coronado’s principal competitors in the market. These non-GAAP measures are used by market participants for comparative analysis, albeit with certain limitations, of the results of businesses in the sector. Nevertheless, non-GAAP financial measures do not have any standardized meaning and therefore may not be comparable to similar measures presented by other companies. Adjusted EBITDA is a non-GAAP performance measure and is presented as a supplemental measure. Adjusted EBITDA does not have any standardized meaning under GAAP and therefore may not be comparable to similar measures presented by other companies. Adjusted EBITDA is determined and presented on a consistent basis from period to period. In this Presentation, references to ore resources and reserves are compliant with the Australasian Code for Reporting of Exploration Results, Mineral Resources and Ore Reserves 2012 (“JORC Code”) and are measured in accordance with the JORC Code. Information in this Presentation relating to Coal Reserves and Coal Resources is extracted from information published by Coronado and available on the Coronado and ASX websites (2024 JORC Statement also released to the ASX on February 20, 2025). For details of the Coal Reserves and Coal Resources estimates and the Competent Persons statements, refer to relevant Australian and U.S. Operations sections in the 2024 JORC Statement. Our disclosures of resources and reserves are subject to the requirements of subpart 1300 of Regulation S-K under the U.S. Securities Exchange Act of 1934, as amended. Accordingly, Coronado’s estimates of resources and reserves in this Presentation and in its other ASX disclosures may be different than the estimates of resources and reserves as reported in our annual Form 10-K filing and in other reports that Coronado is required to file with the SEC. This presentation contains information extracted from previous ASX releases (including the 2024 JORC Statement) which are referenced in this presentation. The Company is not aware of any new information or data that materially affects the information included in the original releases. All material assumptions and technical parameters underpinning estimates of mineral resources and ore reserves in the original releases continue to apply and have not materially changed. |
| 4 Table of Contents 1 Executive Summary 5 2 Company Overview 7 3 Financial Performance 18 4 Appendix 22 |
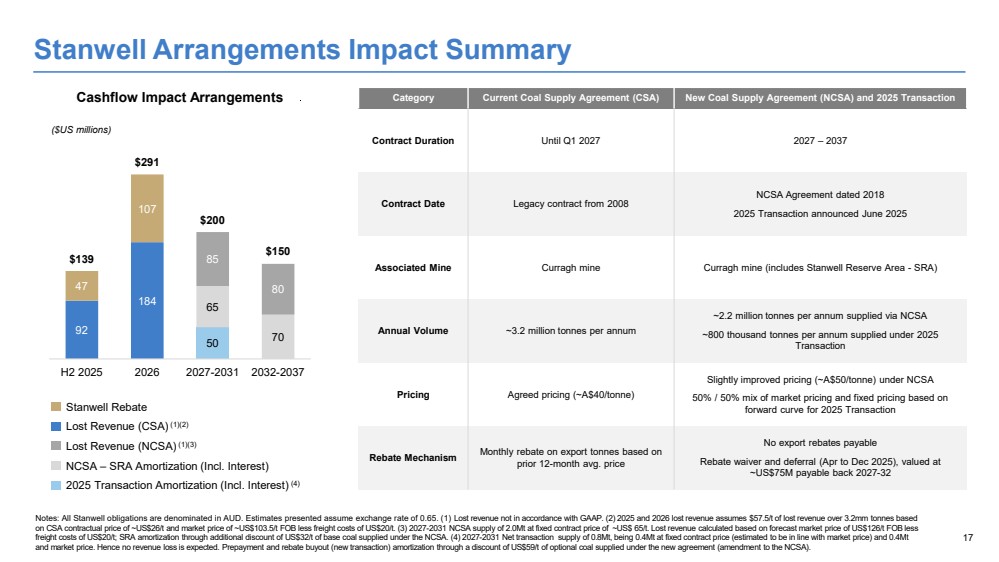
| 5 ➢ Coronado Global Resources (“Coronado” or the “Company”) is a leading global producer of a full range of metallurgical coals, headquartered in Brisbane, Australia ➢ The Company (ASX: CRN) has a market capitalization of USD $398 million(1) ➢ Coronado’s investment case is strong and differentiated: — Portfolio of three high-quality metallurgical coal mines in Australia and the United States, with 22-32 years of implied mine life(2) — Exposed to the very attractive seaborne met coal market, with leverage to the fastest growing steel market in India — Diversified customer and product market exposure, supporting customers on five continents — Significant focus on improving productivity and cost profile since 2022, particularly at Curragh, Coronado’s largest mine by production volumes ➢ Coronado issued $400 million of 9.25% Senior Secured Notes due 2029 in October 2024 (the “Notes”) ➢ In June 2025, Stanwell provided Coronado with ~$150 million in liquidity through a USD $75 million prepayment and waiver/deferral of rebates, accruing 13% interest, to be repaid via coal delivery over five years starting in 2027 — Stanwell gets the right to nominate an additional 800,000 tonnes of coal annually from 2027 to 2031—half at market price, half at a fixed 10% price above current market— beyond the existing 2 Mtpa agreement (less discount for implied payment of principal and interest totaling $50mm per year) ➢ In addition to the ABL refinancing and relief provided under the Stanwell agreement, given coal prices have continued to remain at depressed levels, Coronado is seeking additional liquidity to support its business plan until the Stanwell agreement arrangement resets in 2027 Notes: Market data as of September 16, 2025, per CapIQ. Implied mine life calculated as 2023 marketable reserves divided by 2023 total saleable production. Executive Summary |

| 6 Investment Highlights Operates in two of the world’s largest and most productive metallurgical coal basins in Tier 1 jurisdictions (U.S. and 2 Australia) 4 Strong financial track record with meaningful through-the-cycle earnings potential Clear pathway to earnings and cash flow uplift via completed organic expansions at Curragh and Buchanan mines and 3 roll-off of Stanwell rebate in 2027 5 Compelling industry tailwinds supported by steel’s role as a critical material for energy transition 6 Highly experienced management team with prudent capital management framework 1 High quality, long-life seaborne metallurgical coal producer with global customer reach |
| 7 Company Overview |
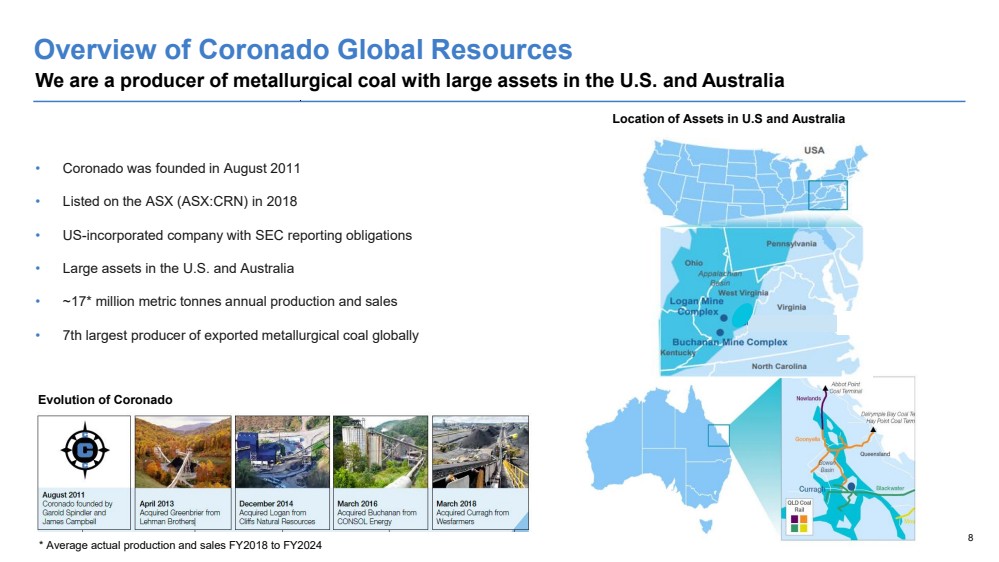
| 8 Overview of Coronado Global Resources We are a producer of metallurgical coal with large assets in the U.S. and Australia • Coronado was founded in August 2011 • Listed on the ASX (ASX:CRN) in 2018 • US-incorporated company with SEC reporting obligations • Large assets in the U.S. and Australia • ~17* million metric tonnes annual production and sales • 7th largest producer of exported metallurgical coal globally Location of Assets in U.S and Australia Evolution of Coronado * Average actual production and sales FY2018 to FY2024 |
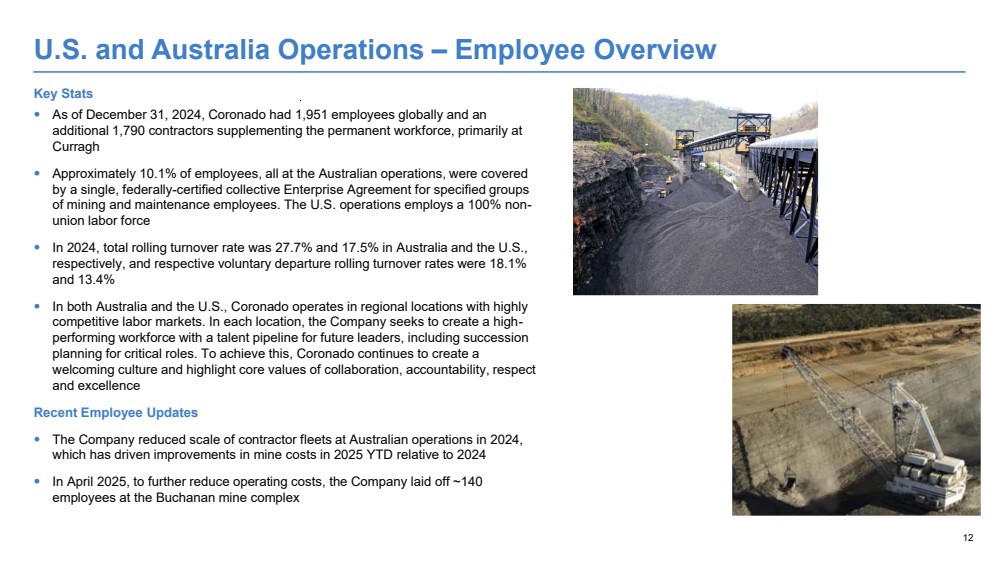
| 9 High Quality, Long-Life Seaborne Met Coal Producer Recent investments paying off, future options & significant economic contributor • Large metallurgical coal assets in Tier 1 jurisdictions (U.S. and Australia) • Meaningful cash generation through-the-cycle, with ~$1.4 billion in cumulative cash flow(1) 2018-2024 after A$1.9 billion in QLD state royalties and A$3.8 billion of rebates and discounted coal to Stanwell • Long life assets with ~20* years • ~17** Mt annual saleable production currently, with plan to increase saleable production to ~20 Mt*** • A suite of high-quality products that command near premium pricing • Recently completed brownfield expansions expected to generate cash • Future optionality for underground and open pit expansions in both jurisdictions • Terms of Stanwell arrangement reset in 2027 providing an opportunity for meaningful increases in cash flow resulting from expiration of rebates and increased volumes subject to spot or higher fixed prices • U.S. assets are firmly in the second cost quartile, Australian assets achieved same in H1 and positioned well to achieve consistently by 2026 • No major debt maturing in next three years Notes: (1) Calculated as Cash Flow from Operations less Capital Expenditures. *Lower end of implied mine life, see slide 5 **Average actual production and sales FY2018 to FY2024 ***Includes Mammoth Underground Mine and Buchanan Expansion ~3mt per year, not to be used as guidance |
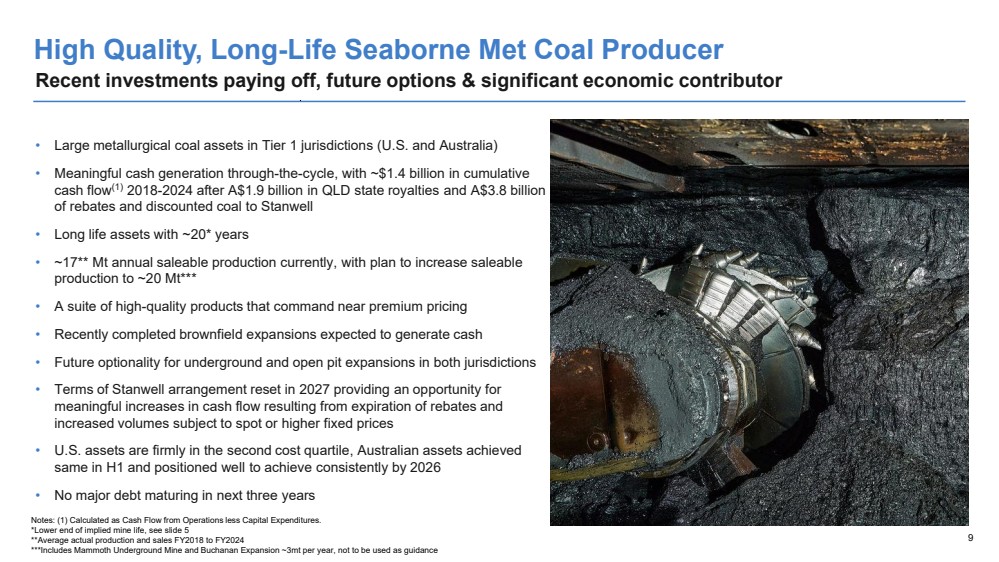
| 10 Europe Japan India Brazil USA China Geographically Diverse Customer Base With long standing customer relationships in Japan, India, Brazil, and Europe Region Mines Coal Product Type Primary Customers AU Curragh Complex (QLD) + Mammoth Low & mid-vol met coal Asian steelmakers (Japan, India, Korea) U.S. Buchanan (VA), Logan (WV/PA) High & low-vol met coal Domestic steel mills and global buyers Key Highlights: • Operating in two major met coal basins provides balance with Australia (Curragh/Mammoth) supporting Asian markets and the U.S. (Buchanan/Logan) supporting North American and Atlantic-facing exports • High-quality, low-vol met coal product commands premium pricing in global steel markets • Contracts and sales across multiple geographies reduce reliance on any single market or regional price fluctuations • Decades-long partnerships with global customers, some over 40 years • Product suite is well-regarded due to its low ash, low phosphorous and coking characteristics • Secured access to port and rail across all assets Australia South Korea Canada Asia Americas Europe Australia Other Geographical Coal Revenue Earned (1) Notes: (1) Group full year 2024 sales revenues split by geographic region, “Other” reflects direct sales to other destinations. The company uses shipping destinations as the basis for attributing revenue to individual countries. Instances of broker sales rely on broker disclosure of destination. |
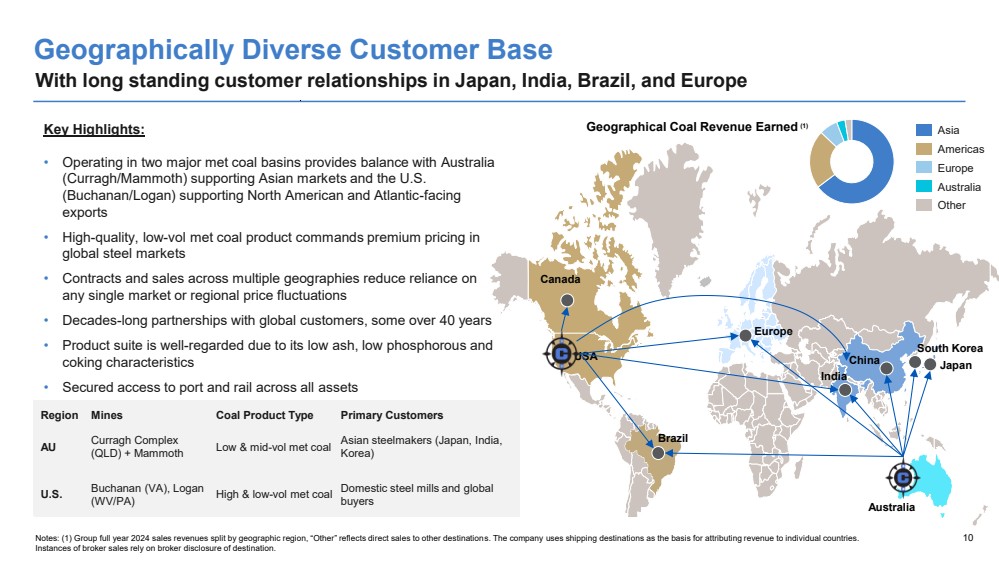
| 11 Health and Safety across Australian and US Operations Our People, Our Highest Priority 11 Paramedic training at Curragh Complex Australian Operations (TRIFR) US Operations (TRIR) 0 2 4 6 8 10 Jan-21 Jul-21 Jan-22 Jul-22 Jan-23 Jul-23 Jan-24 Jul-24 Jan-25 Jul-25 -68% Australian Operations Industry Average 0 1 2 3 4 Jan-21 Jul-21 Jan-22 Jul-22 Jan-23 Jul-23 Jan-24 Jul-24 Jan-25 Jul-25 -49% U.S. Operations Industry Average Notes: Total Recordable Injury Frequency Rate (TRIFR), is the number of fatalities, lost time injuries, cases or substitute work and other injuries requiring medical treatment per million-man hours worked on a rolling 12-month basis. Total Recordable Incident Rate (TRIR) is a mathematical computation that takes into account how many Mine Safety and Health Administration (MSHA) recordable incidents our company has per 200,000 hours worked on a rolling 12-month basis. Our People, Our Highest Priority |
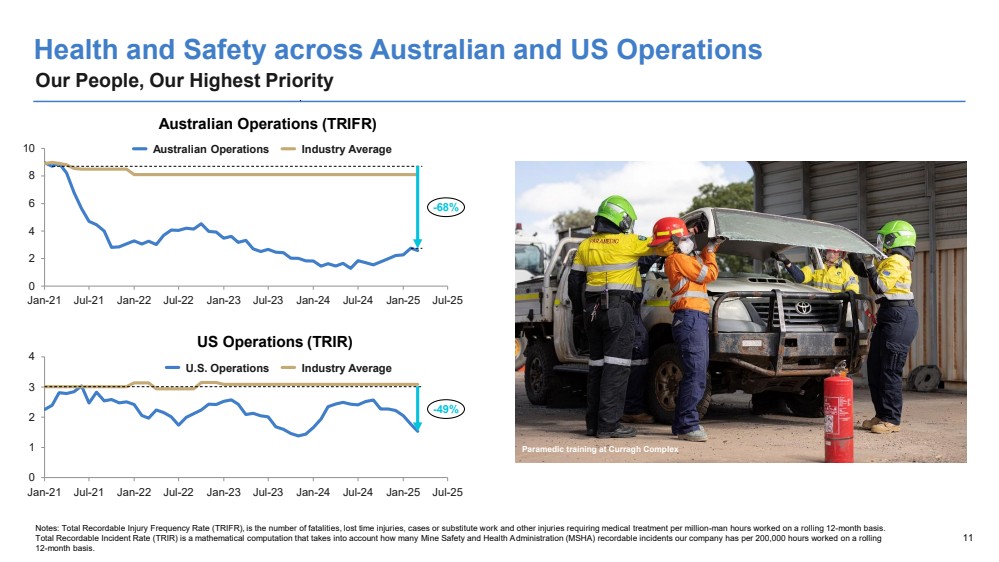
| 12 U.S. and Australia Operations – Employee Overview Key Stats • As of December 31, 2024, Coronado had 1,951 employees globally and an additional 1,790 contractors supplementing the permanent workforce, primarily at Curragh • Approximately 10.1% of employees, all at the Australian operations, were covered by a single, federally-certified collective Enterprise Agreement for specified groups of mining and maintenance employees. The U.S. operations employs a 100% non-union labor force • In 2024, total rolling turnover rate was 27.7% and 17.5% in Australia and the U.S., respectively, and respective voluntary departure rolling turnover rates were 18.1% and 13.4% • In both Australia and the U.S., Coronado operates in regional locations with highly competitive labor markets. In each location, the Company seeks to create a high-performing workforce with a talent pipeline for future leaders, including succession planning for critical roles. To achieve this, Coronado continues to create a welcoming culture and highlight core values of collaboration, accountability, respect and excellence Recent Employee Updates • The Company reduced scale of contractor fleets at Australian operations in 2024, which has driven improvements in mine costs in 2025 YTD relative to 2024 • In April 2025, to further reduce operating costs, the Company laid off ~140 employees at the Buchanan mine complex |
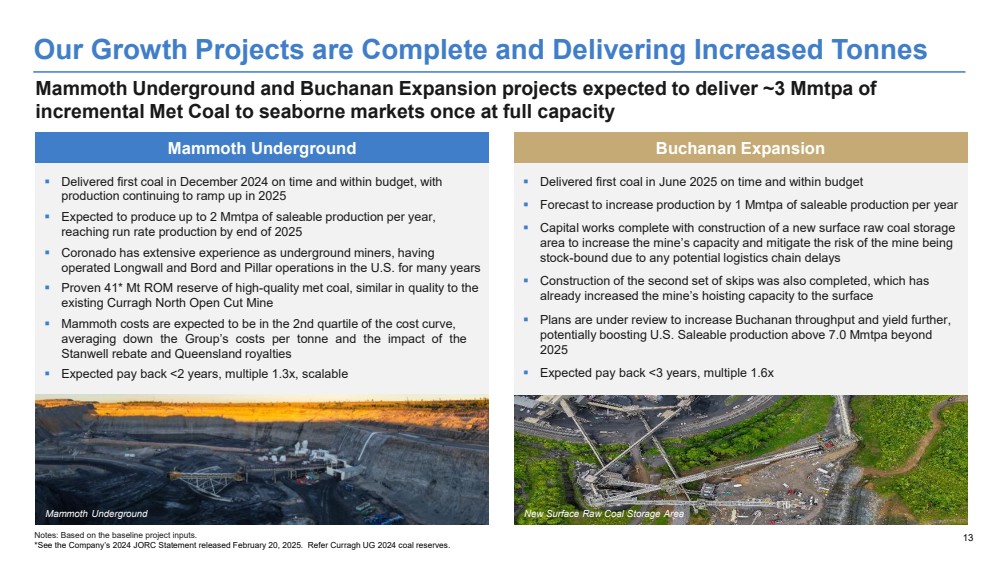
| 13 Our Growth Projects are Complete and Delivering Increased Tonnes Mammoth Underground and Buchanan Expansion projects expected to deliver ~3 Mmtpa of incremental Met Coal to seaborne markets once at full capacity Mammoth Underground Buchanan Expansion ▪ Delivered first coal in December 2024 on time and within budget, with production continuing to ramp up in 2025 ▪ Expected to produce up to 2 Mmtpa of saleable production per year, reaching run rate production by end of 2025 ▪ Coronado has extensive experience as underground miners, having operated Longwall and Bord and Pillar operations in the U.S. for many years ▪ Proven 41* Mt ROM reserve of high-quality met coal, similar in quality to the existing Curragh North Open Cut Mine ▪ Mammoth costs are expected to be in the 2nd quartile of the cost curve, averaging down the Group’s costs per tonne and the impact of the Stanwell rebate and Queensland royalties ▪ Expected pay back <2 years, multiple 1.3x, scalable Mammoth Underground New Surface Raw Coal Storage Area ▪ Delivered first coal in June 2025 on time and within budget ▪ Forecast to increase production by 1 Mmtpa of saleable production per year ▪ Capital works complete with construction of a new surface raw coal storage area to increase the mine’s capacity and mitigate the risk of the mine being stock-bound due to any potential logistics chain delays ▪ Construction of the second set of skips was also completed, which has already increased the mine’s hoisting capacity to the surface ▪ Plans are under review to increase Buchanan throughput and yield further, potentially boosting U.S. Saleable production above 7.0 Mmtpa beyond 2025 ▪ Expected pay back <3 years, multiple 1.6x Notes: Based on the baseline project inputs. *See the Company’s 2024 JORC Statement released February 20, 2025. Refer Curragh UG 2024 coal reserves. |
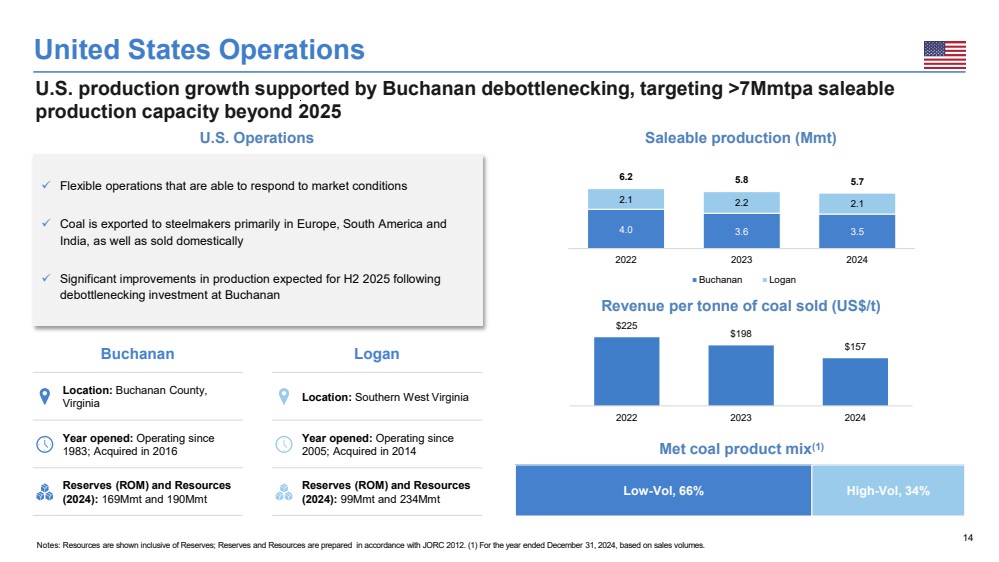
| 14 Logan Location: Southern West Virginia Year opened: Operating since 2005; Acquired in 2014 Reserves (ROM) and Resources (2024): 99Mmt and 234Mmt United States Operations Notes: Resources are shown inclusive of Reserves; Reserves and Resources are prepared in accordance with JORC 2012. (1) For the year ended December 31, 2024, based on sales volumes. U.S. production growth supported by Buchanan debottlenecking, targeting >7Mmtpa saleable production capacity beyond 2025 U.S. Operations Saleable production (Mmt) Revenue per tonne of coal sold (US$/t) Low-Vol, 66% High-Vol, 34% Buchanan Location: Buchanan County, Virginia Year opened: Operating since 1983; Acquired in 2016 Reserves (ROM) and Resources (2024): 169Mmt and 190Mmt ✓ Flexible operations that are able to respond to market conditions ✓ Coal is exported to steelmakers primarily in Europe, South America and India, as well as sold domestically ✓ Significant improvements in production expected for H2 2025 following debottlenecking investment at Buchanan 4.0 3.6 3.5 2.1 2.2 2.1 6.2 5.8 5.7 2022 2023 2024 Buchanan Logan $225 $198 $157 2022 2023 2024 Met coal product mix(1) |
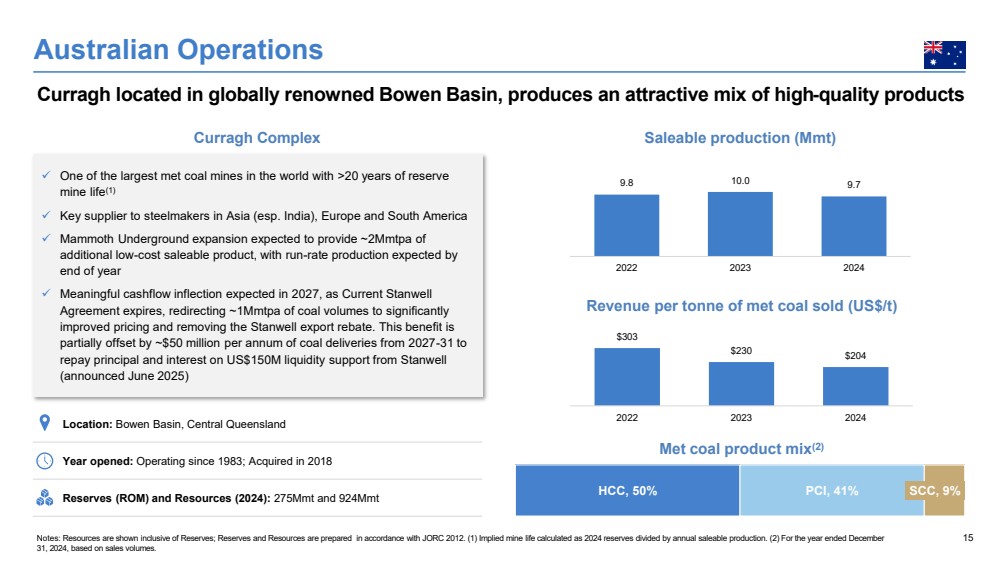
| 15 Location: Bowen Basin, Central Queensland Year opened: Operating since 1983; Acquired in 2018 Reserves (ROM) and Resources (2024): 275Mmt and 924Mmt Australian Operations Notes: Resources are shown inclusive of Reserves; Reserves and Resources are prepared in accordance with JORC 2012. (1) Implied mine life calculated as 2024 reserves divided by annual saleable production. (2) For the year ended December 31, 2024, based on sales volumes. Met coal product mix(2) ✓ One of the largest met coal mines in the world with >20 years of reserve mine life(1) ✓ Key supplier to steelmakers in Asia (esp. India), Europe and South America ✓ Mammoth Underground expansion expected to provide ~2Mmtpa of additional low-cost saleable product, with run-rate production expected by end of year ✓ Meaningful cashflow inflection expected in 2027, as Current Stanwell Agreement expires, redirecting ~1Mmtpa of coal volumes to significantly improved pricing and removing the Stanwell export rebate. This benefit is partially offset by ~$50 million per annum of coal deliveries from 2027-31 to repay principal and interest on US$150M liquidity support from Stanwell (announced June 2025) Curragh located in globally renowned Bowen Basin, produces an attractive mix of high-quality products HCC, 50% PCI, 41% SCC, 9% $303 $230 $204 2022 2023 2024 9.8 10.0 9.7 2022 2023 2024 Saleable production (Mmt) Revenue per tonne of met coal sold (US$/t) Curragh Complex |
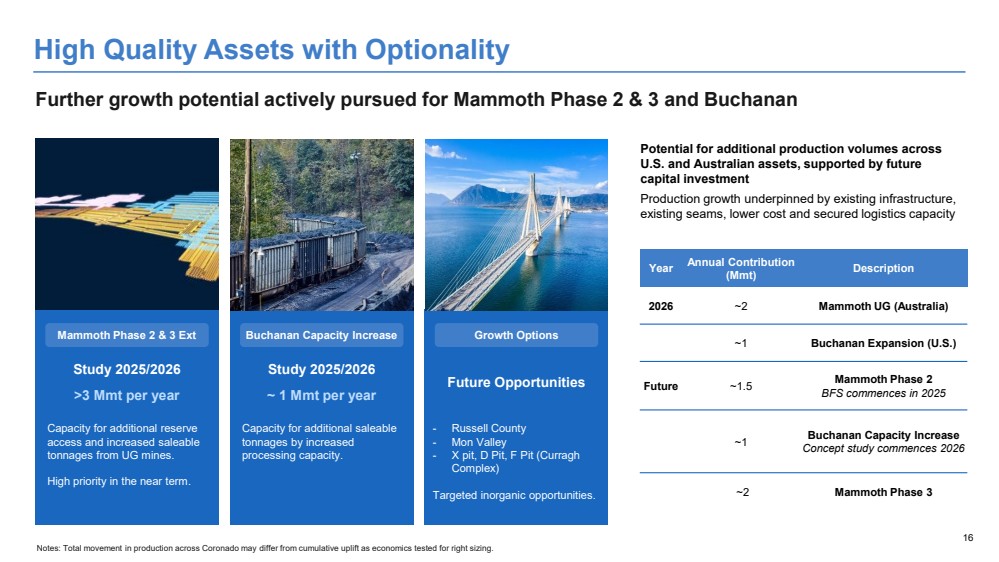
| 16 High Quality Assets with Optionality Further growth potential actively pursued for Mammoth Phase 2 & 3 and Buchanan Capacity for additional saleable tonnages by increased processing capacity. Buchanan Capacity Increase - Russell County - Mon Valley - X pit, D Pit, F Pit (Curragh Complex) Targeted inorganic opportunities. Mammoth Phase 2 & 3 Ext Study 2025/2026 ~ 1 Mmt per year Study 2025/2026 >3 Mmt per year Capacity for additional reserve access and increased saleable tonnages from UG mines. High priority in the near term. Growth Options Future Opportunities Year Annual Contribution (Mmt) Description 2026 ~2 Mammoth UG (Australia) ~1 Buchanan Expansion (U.S.) Future ~1.5 Mammoth Phase 2 BFS commences in 2025 ~1 Buchanan Capacity Increase Concept study commences 2026 ~2 Mammoth Phase 3 Potential for additional production volumes across U.S. and Australian assets, supported by future capital investment Production growth underpinned by existing infrastructure, existing seams, lower cost and secured logistics capacity Notes: Total movement in production across Coronado may differ from cumulative uplift as economics tested for right sizing. |
| 17 Stanwell Arrangements Impact Summary 92 184 47 107 50 65 70 85 80 $139 $291 $200 $150 H2 2025 2026 2027-2031 2032-2037 Stanwell Rebate 2025 Transaction Amortization (Incl. Interest) (4) Lost Revenue (CSA) (1)(2) NCSA – SRA Amortization (Incl. Interest) Lost Revenue (NCSA) (1)(3) ($US millions) Cashflow Impact Arrangements Category Current Coal Supply Agreement (CSA) New Coal Supply Agreement (NCSA) and 2025 Transaction Contract Duration Until Q1 2027 2027 – 2037 Contract Date Legacy contract from 2008 NCSA Agreement dated 2018 2025 Transaction announced June 2025 Associated Mine Curragh mine Curragh mine (includes Stanwell Reserve Area - SRA) Annual Volume ~3.2 million tonnes per annum ~2.2 million tonnes per annum supplied via NCSA ~800 thousand tonnes per annum supplied under 2025 Transaction Pricing Agreed pricing (~A$40/tonne) Slightly improved pricing (~A$50/tonne) under NCSA 50% / 50% mix of market pricing and fixed pricing based on forward curve for 2025 Transaction Rebate Mechanism Monthly rebate on export tonnes based on prior 12-month avg. price No export rebates payable Rebate waiver and deferral (Apr to Dec 2025), valued at ~US$75M payable back 2027-32 Notes: All Stanwell obligations are denominated in AUD. Estimates presented assume exchange rate of 0.65. (1) Lost revenue not in accordance with GAAP. (2) 2025 and 2026 lost revenue assumes $57.5/t of lost revenue over 3.2mm tonnes based on CSA contractual price of ~US$26/t and market price of ~US$103.5/t FOB less freight costs of US$20/t. (3) 2027-2031 NCSA supply of 2.0Mt at fixed contract price of ~US$ 65/t. Lost revenue calculated based on forecast market price of US$126/t FOB less freight costs of US$20/t; SRA amortization through additional discount of US$32/t of base coal supplied under the NCSA. (4) 2027-2031 Net transaction supply of 0.8Mt, being 0.4Mt at fixed contract price (estimated to be in line with market price) and 0.4Mt and market price. Hence no revenue loss is expected. Prepayment and rebate buyout (new transaction) amortization through a discount of US$59/t of optional coal supplied under the new agreement (amendment to the NCSA). |
| 18 Financial Performance |
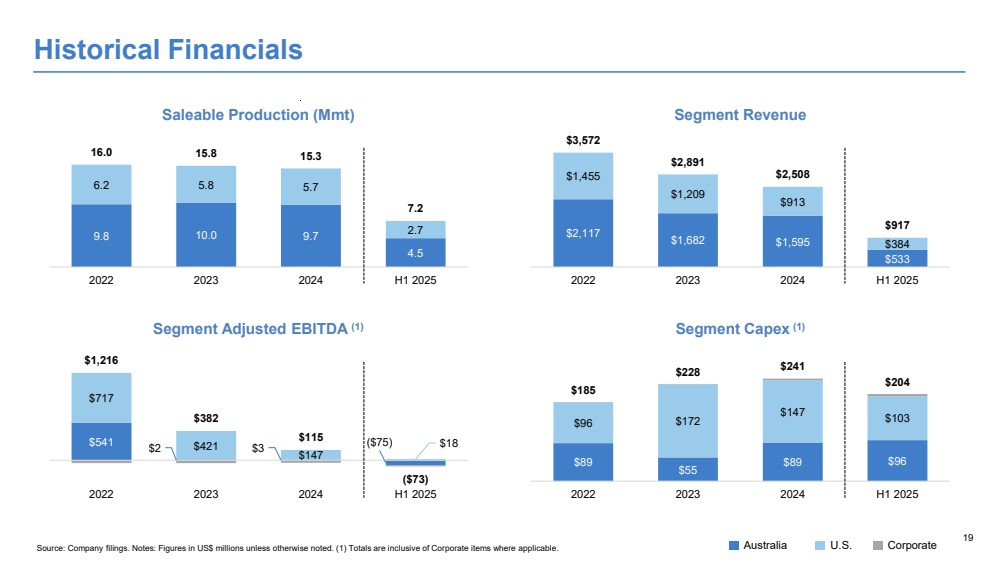
| 19 Historical Financials Source: Company filings. Notes: Figures in US$ millions unless otherwise noted. (1) Totals are inclusive of Corporate items where applicable. Saleable Production (Mmt) Segment Revenue 9.8 10.0 9.7 4.5 6.2 5.8 5.7 2.7 16.0 15.8 15.3 7.2 2022 2023 2024 H1 2025 $2,117 $1,682 $1,595 $533 $1,455 $1,209 $913 $384 $3,572 $2,891 $2,508 $917 2022 2023 2024 H1 2025 Segment Adjusted EBITDA (1) Segment Capex (1) $541 $2 $3 ($75) $717 $421 $147 $18 $1,216 $382 $115 ($73) 2022 2023 2024 H1 2025 $89 $55 $89 $96 $96 $172 $147 $103 $185 $228 $241 $204 2022 2023 2024 H1 2025 Australia U.S. Corporate |
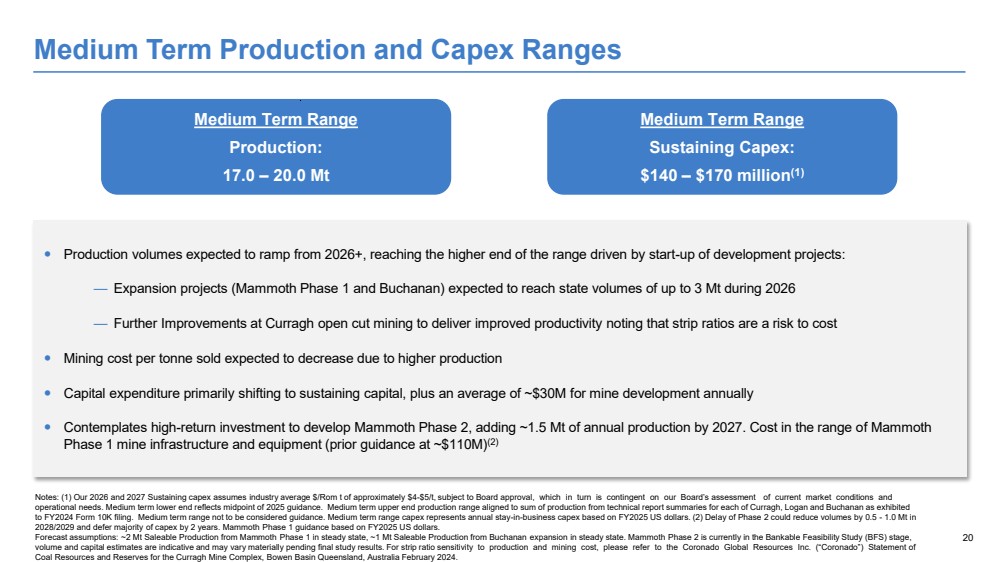
| 20 Medium Term Production and Capex Ranges Medium Term Range Production: 17.0 – 20.0 Mt Medium Term Range Sustaining Capex: $140 – $170 million(1) Production volumes expected to ramp from 2026+, reaching the higher end of the range driven by start-up of development projects: — Expansion projects (Mammoth Phase 1 and Buchanan) expected to reach state volumes of up to 3 Mt during 2026 — Further Improvements at Curragh open cut mining to deliver improved productivity noting that strip ratios are a risk to cost Mining cost per tonne sold expected to decrease due to higher production Capital expenditure primarily shifting to sustaining capital, plus an average of ~$30M for mine development annually Contemplates high-return investment to develop Mammoth Phase 2, adding ~1.5 Mt of annual production by 2027. Cost in the range of Mammoth Phase 1 mine infrastructure and equipment (prior guidance at ~$110M)(2) Notes: (1) Our 2026 and 2027 Sustaining capex assumes industry average $/Rom t of approximately $4-$5/t, subject to Board approval, which in turn is contingent on our Board’s assessment of current market conditions and operational needs. Medium term lower end reflects midpoint of 2025 guidance. Medium term upper end production range aligned to sum of production from technical report summaries for each of Curragh, Logan and Buchanan as exhibited to FY2024 Form 10K filing. Medium term range not to be considered guidance. Medium term range capex represents annual stay-in-business capex based on FY2025 US dollars. (2) Delay of Phase 2 could reduce volumes by 0.5 - 1.0 Mt in 2028/2029 and defer majority of capex by 2 years. Mammoth Phase 1 guidance based on FY2025 US dollars. Forecast assumptions: ~2 Mt Saleable Production from Mammoth Phase 1 in steady state, ~1 Mt Saleable Production from Buchanan expansion in steady state. Mammoth Phase 2 is currently in the Bankable Feasibility Study (BFS) stage, volume and capital estimates are indicative and may vary materially pending final study results. For strip ratio sensitivity to production and mining cost, please refer to the Coronado Global Resources Inc. (“Coronado”) Statement of Coal Resources and Reserves for the Curragh Mine Complex, Bowen Basin Queensland, Australia February 2024. |
| 21 Investment Highlights Operates in two of the world’s largest and most productive metallurgical coal basins in Tier 1 jurisdictions (U.S. and 2 Australia) 4 Strong financial track record with meaningful through-the-cycle earnings potential Clear pathway to earnings and cash flow uplift via completed organic expansions at Curragh and Buchanan mines and 3 roll-off of Stanwell rebate in 2027 5 Compelling industry tailwinds supported by steel’s role as a critical material for energy transition 6 Highly experienced management team with prudent capital management framework 1 High quality, long-life seaborne metallurgical coal producer with global customer reach |
| 22 Appendix |
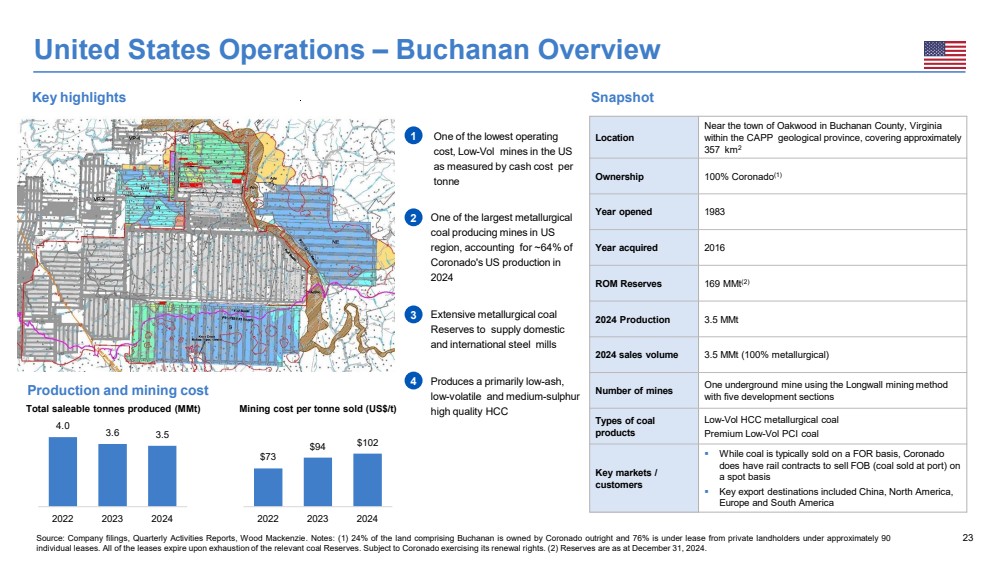
| 23 Key highlights Snapshot One of the lowest operating cost, Low-Vol mines in the US as measured by cash cost per tonne One of the largest metallurgical coal producing mines in US region, accounting for ~64% of Coronado's US production in 2024 Extensive metallurgical coal Reserves to supply domestic and international steel mills Produces a primarily low-ash, low-volatile and medium-sulphur high quality HCC Production and mining cost Location Near the town of Oakwood in Buchanan County, Virginia within the CAPP geological province, covering approximately 357 km2 Ownership 100% Coronado(1) Year opened 1983 Year acquired 2016 ROM Reserves 169 MMt(2) 2024 Production 3.5 MMt 2024 sales volume 3.5 MMt (100% metallurgical) Number of mines One underground mine using the Longwall mining method with five development sections Types of coal products Low-Vol HCC metallurgical coal Premium Low-Vol PCI coal Key markets / customers ▪ While coal is typically sold on a FOR basis, Coronado does have rail contracts to sell FOB (coal sold at port) on a spot basis ▪ Key export destinations included China, North America, Europe and South America Source: Company filings, Quarterly Activities Reports, Wood Mackenzie. Notes: (1) 24% of the land comprising Buchanan is owned by Coronado outright and 76% is under lease from private landholders under approximately 90 individual leases. All of the leases expire upon exhaustion of the relevant coal Reserves. Subject to Coronado exercising its renewal rights. (2) Reserves are as at December 31, 2024. United States Operations – Buchanan Overview 1 2 3 4 Total saleable tonnes produced (MMt) Mining cost per tonne sold (US$/t) 4.0 3.6 3.5 2022 2023 2024 $73 $94 $102 2022 2023 2024 |
| 24 Snapshot Location Boone, Logan and Wyoming Counties in southern West Virginia, within the CAPP geological province. Covers a 104 km2 area Ownership holdings 100% Coronado(1), Pardee/Penn Va Lease, KYMAC Lease, Ark Land Lease Year opened 2005 Year acquired 2014 ROM Reserves 99 MMt(2) 2024 production 2.1 MMt 2024 sales volume 2.1 MMt Number of mines Four underground mines: Powellton No. 1 (1 available section), Eagle No. 1 (3 working super sections), Muddy Bridge (two operating super sections) and Lower War Eagle (two operating super sections); One surface mine: Elklick Surface (Toney Fork Surface Mine - reclamation) Types of coal products High quality High-Vol A HCC and High-Vol B HCC met coals 12,300 British Thermal Units (BTU) thermal coal Key markets / customers ▪ Key domestic customers include all major US steel makers ▪ Key export destinations included Europe, South America, China and India; Coal is primarily sold FOR at loadout Source: Company filings, Quarterly Activities Reports, Wood Mackenzie. Notes: (1) Coronado accesses the Logan mine complex through six subleases making up 80% of the entire complex along with 9 additional individual leases and subleases. All leases have expiry dates ranging from 2032 (at the earliest) to exhaustion of the coal mined (for the majority of the leases). For those leases expiring prior to exhaustion, the level of Reserves that would be impacted by non-renewal are not considered by Coronado to be material (approximately 0.2 MMt). (2) Reserves are as of December 31, 2024. Production and mining cost Total saleable tonnes produced (MMt) Long history of high-quality production with a large reserve of premium quality high-volatile met coal High-vol, low-ash coal has attractive blending properties Ability to serve a diverse customer base Multiple transportation options, via rail and truck, reducing the risk of disruptions to supply for customers Scalable operation with a number of opportunities to increase production United States Operations – Logan Overview Key highlights 1 2 3 4 5 Mining cost per tonne sold (US$/t) 2.1 2.2 2.1 2022 2023 2024 $101 $116 $125 2022 2023 2024 |

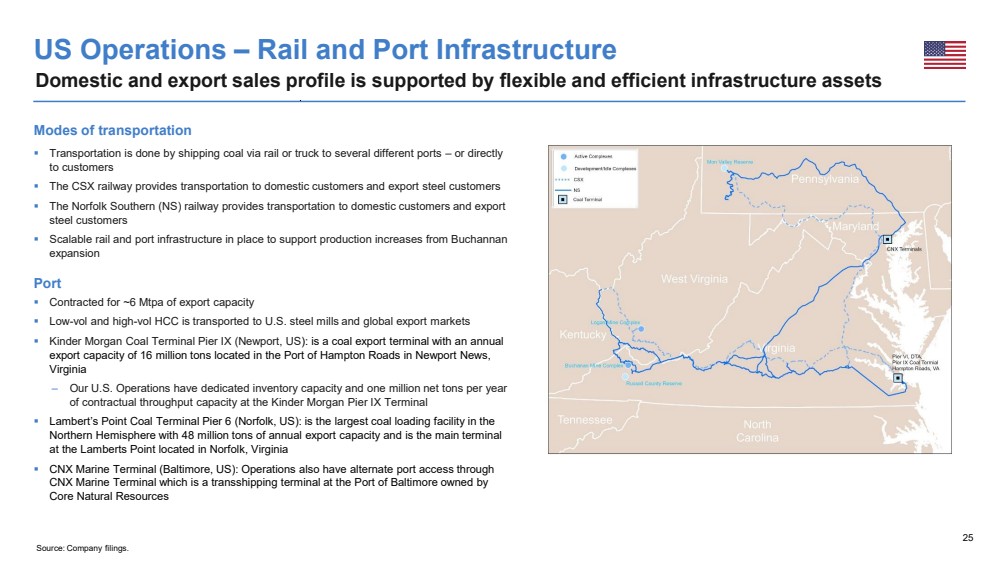
| 25 US Operations – Rail and Port Infrastructure Source: Company filings. Modes of transportation ▪ Transportation is done by shipping coal via rail or truck to several different ports – or directly to customers ▪ The CSX railway provides transportation to domestic customers and export steel customers ▪ The Norfolk Southern (NS) railway provides transportation to domestic customers and export steel customers ▪ Scalable rail and port infrastructure in place to support production increases from Buchannan expansion Port ▪ Contracted for ~6 Mtpa of export capacity ▪ Low-vol and high-vol HCC is transported to U.S. steel mills and global export markets ▪ Kinder Morgan Coal Terminal Pier IX (Newport, US): is a coal export terminal with an annual export capacity of 16 million tons located in the Port of Hampton Roads in Newport News, Virginia – Our U.S. Operations have dedicated inventory capacity and one million net tons per year of contractual throughput capacity at the Kinder Morgan Pier IX Terminal ▪ Lambert’s Point Coal Terminal Pier 6 (Norfolk, US): is the largest coal loading facility in the Northern Hemisphere with 48 million tons of annual export capacity and is the main terminal at the Lamberts Point located in Norfolk, Virginia ▪ CNX Marine Terminal (Baltimore, US): Operations also have alternate port access through CNX Marine Terminal which is a transshipping terminal at the Port of Baltimore owned by Core Natural Resources Domestic and export sales profile is supported by flexible and efficient infrastructure assets |
| 26 Australian Operations – Curragh Overview Key highlights Location Bowen Basin in central Queensland Ownership of Curragh 100% Coronado Ownership of MDL 162 100% Coronado. MDL 162 is situated between and adjacent to the Curragh East Mining Area and Curragh North Mining Area Curragh Year opened 1983 Year acquired 2018 ROM Reserves(2) 275 MMt 2024 production 9.7 MMt 2024 sales volume 10.2 MMt (comprising 7.2 MMt metallurgical coal) Number of mines Two open-pit mines (Curragh North and Curragh South) and Mammoth Underground (first mined December 2024) Types of coal products High quality Low-Vol HCC, SCC, PCI and thermal coal(1) Key markets / customers Metallurgical coal: International steel mills in Asia and globally Thermal coal: Australian domestic sold to Stanwell Total saleable tonnes produced (MMt) Snapshot Production and mining cost 1 One of the world’s largest coking coal mines producing 6.6 MMt of high-quality met saleable coal in 2024, in addition to 3.1 MMt of thermal coal 2 Produces HCC, SCC and PCI(1), recognized globally and with loyal customer base 3 The consistent low-volatile, low-ash characteristics of Curragh’s coal mean it benefits from strong demand globally from steel mills, and particularly from steel mills located in Asia 4 ROM Reserves of 275 MMt(2), which is expected to provide multiple opportunities to extend mine life and / or increase production 5 Globally competitive cash cost 6 Secured port and rail under long-term agreements with additional surge capacity 7 Mammoth Expansion will provide meaningful uplift to Curragh’s annual saleable production capacity Mining cost per tonne sold (US$/t) Source: Company filings, Investor Presentations, Quarterly Activities Reports. Notes: (1) HCC: Hard Coking Coal; SCC: Semi Coking Coal; PCI: Pulverized Coal Injection. (2) Reserves are as of December 31, 2024. 9.8 10.0 9.7 2022 2023 2024 $90 $109 $105 2022 2023 2024 |
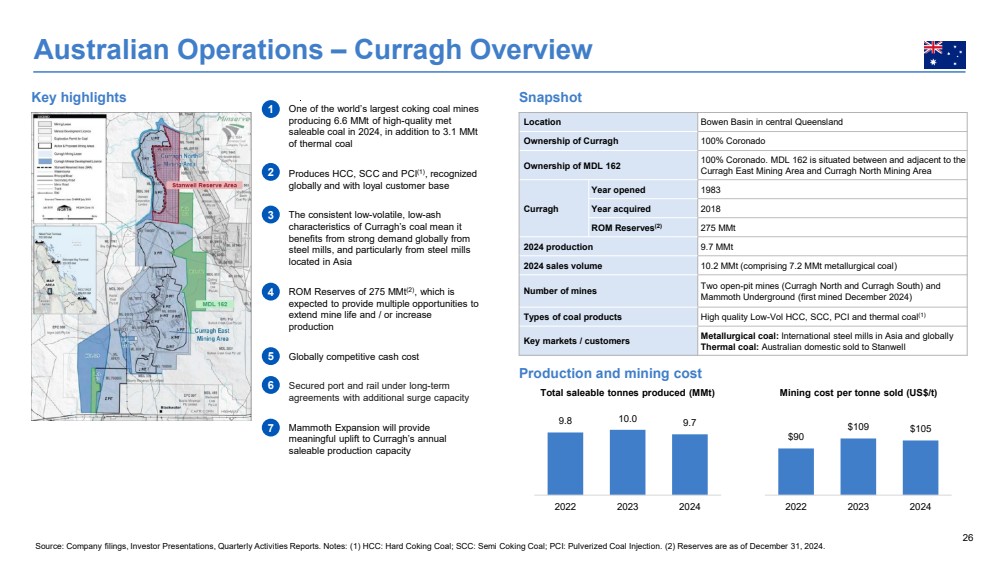
| 27 Curragh Infrastructure and Equipment Curragh is a well-capitalised mine with substantial infrastructure and equipment Infrastructure Equipment Curragh Complex has four electric Draglines, one being amongst the largest electric Draglines in the world with 114m3 bucket 22km connecting Curragh North and Mammoth to the CHPPs Two CHPPs provide extensive coal washing capacity and flexibility Draglines Overland Conveyor (OLC) Coal Handling Preparation Plant (CHPP) 11 x Large Excavators Up to ~100 Large Haul Trucks 6-8 Blast Hole Drills ~50 Dozers Dozer Push, Mining & Dragline support Truck Shovel Drill and Blast Dozing |
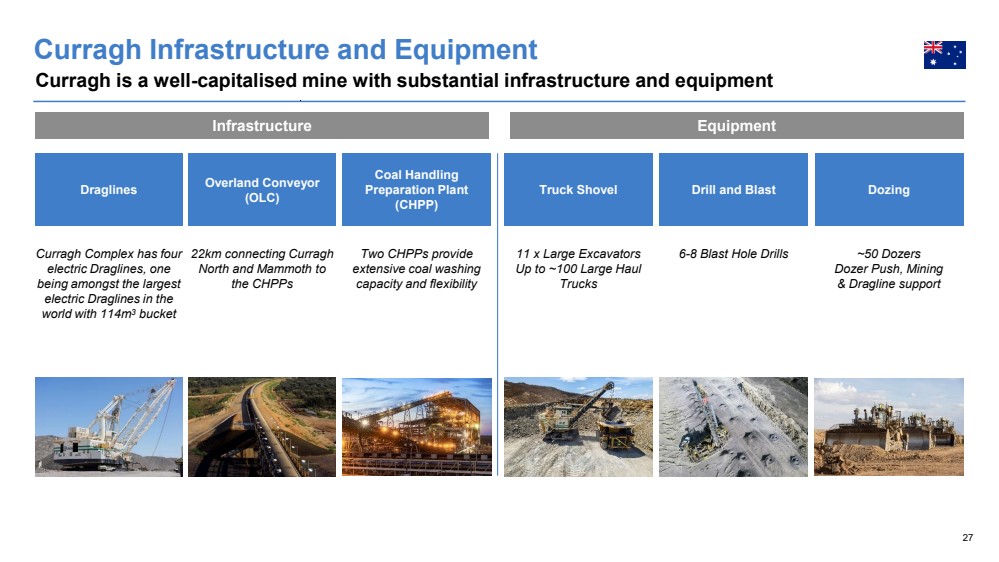
| 28 Australian Operations – Rail and Port Infrastructure Strategically located with access to key transportation infrastructure Rail ▪ Curragh is linked to the Blackwater rail line of the Central Queensland Coal Network, an integrated coal haulage system owned and operated by the Aurizon Network ▪ Curragh has secured annual rail haulage capacity for up to 11.5 Mmtpa (plus surge capacity) under long term rail haulage agreements with Aurizon and Pacific National – Aurizon Network: Agreements secured for 8.5 Mmtpa of haulage capacity to RG Tanna Coal Terminal and 2.0 Mmtpa to Wiggins Island Coal Export Terminal – Pacific National: Agreement secured for 1.0 Mmtpa of haulage capacity to RG Tanna Coal Terminal Port ▪ Owned and operated by Gladstone Ports Corporation (State Government owned) ▪ Commenced operations in 1980 ▪ Coronado has executed a Coal Handling Agreement for exporting 7.7 to 8.7 Mmtpa, with dedicated stockpile capacity enhanced blending capabilities 1. RG Tanna Coal Terminal 2. Wiggins Island Coal Export Terminal ▪ Commenced operations in 2018 with annual throughput capacity of 27 Mmtpa ▪ Coronado annual contracted capacity of 1.5 Mmtpa ▪ Agreed a Substitute Shipper Deed with another WICET shipper for 1.6 MMt of additional port capacity to support the expansion of Curragh to 2022 ▪ Dedicated stockpile area provided to Coronado to facilitate blending higher margin products Source: Company filings, Gladstone Ports Corporation Annual Report 2017/18, Wiggins Island Coal Export Terminal Company Website. ▪ Mid- to low-vol HCC (semi-soft) is transported to Asian steelmakers (Japan, Korea, India) ▪ Curragh has direct access to two export Coal Terminals in Gladstone: |
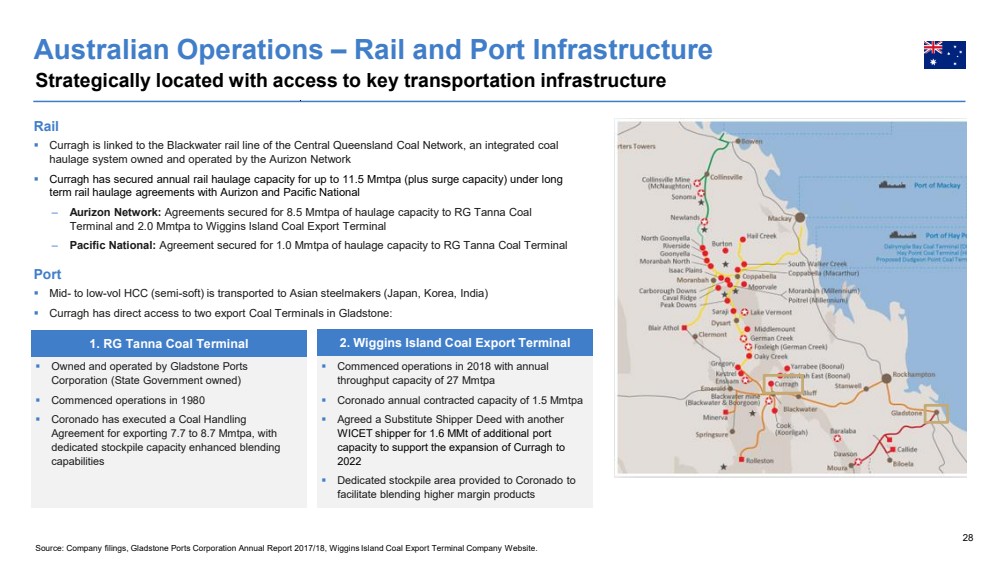
| 29 Geothermal Hydro Nuclear Bioenergy Electricity networks Concentrated solar Hydrogen Wind power Solar photovoltaic Electric vehicles Steel (Iron ore/met coal) Copper Aluminium Nickel Zinc Silicon Cobalt Graphite Manganese Silver Lithium Platinum Uranium Low to None High Source: McKinsey article “The raw-materials challenge” published 10 January 2022 (https://www.mckinsey.com/industries/metals-and-mining/our-insights/the-raw-materials-challenge-how-the-metals-and-mining-sector-will-be-at-the-core-of-enabling-the-energy-transition). Minerals excluded: Dysprosium, Neodymium, Praseodymium, Terbium, Cadmium, Gallium, Iridium and Tellurium. Metallurgical Coal has a Long-Term Future Steel is the No. 1 critical commodity to the development of a low carbon future |
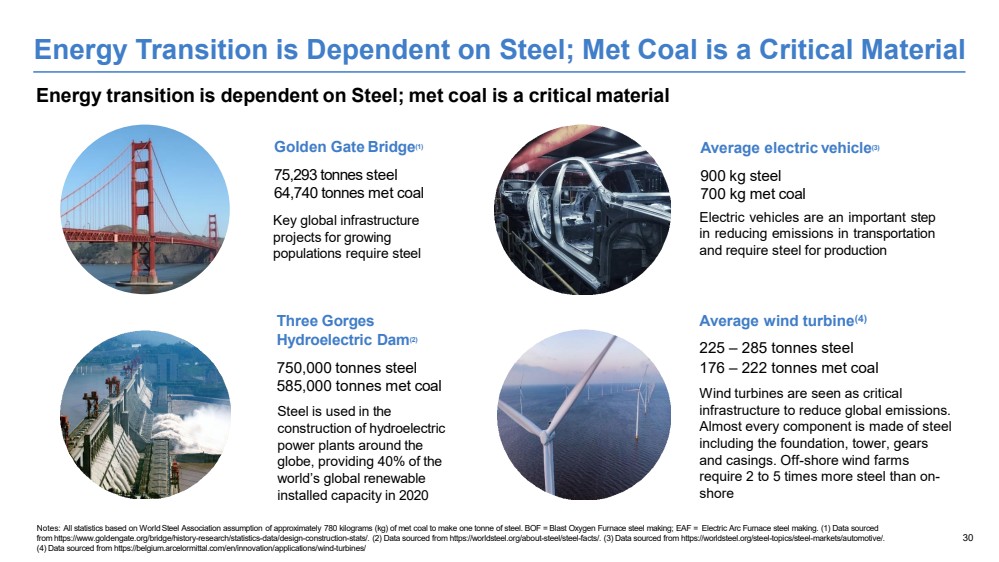
| 30 Notes: All statistics based on World Steel Association assumption of approximately 780 kilograms (kg) of met coal to make one tonne of steel. BOF = Blast Oxygen Furnace steel making; EAF = Electric Arc Furnace steel making. (1) Data sourced from https://www.goldengate.org/bridge/history-research/statistics-data/design-construction-stats/. (2) Data sourced from https://worldsteel.org/about-steel/steel-facts/. (3) Data sourced from https://worldsteel.org/steel-topics/steel-markets/automotive/. (4) Data sourced from https://belgium.arcelormittal.com/en/innovation/applications/wind-turbines/ Golden Gate Bridge(1) 75,293 tonnes steel 64,740 tonnes met coal Key global infrastructure projects for growing populations require steel Three Gorges Hydroelectric Dam(2) 750,000 tonnes steel 585,000 tonnes met coal Steel is used in the construction of hydroelectric power plants around the globe, providing 40% of the world’s global renewable installed capacity in 2020 Average electric vehicle(3) 900 kg steel 700 kg met coal Electric vehicles are an important step in reducing emissions in transportation and require steel for production Energy Transition is Dependent on Steel; Met Coal is a Critical Material Energy transition is dependent on Steel; met coal is a critical material Average wind turbine(4) 225 – 285 tonnes steel 176 – 222 tonnes met coal Wind turbines are seen as critical infrastructure to reduce global emissions. Almost every component is made of steel including the foundation, tower, gears and casings. Off-shore wind farms require 2 to 5 times more steel than on-shore |
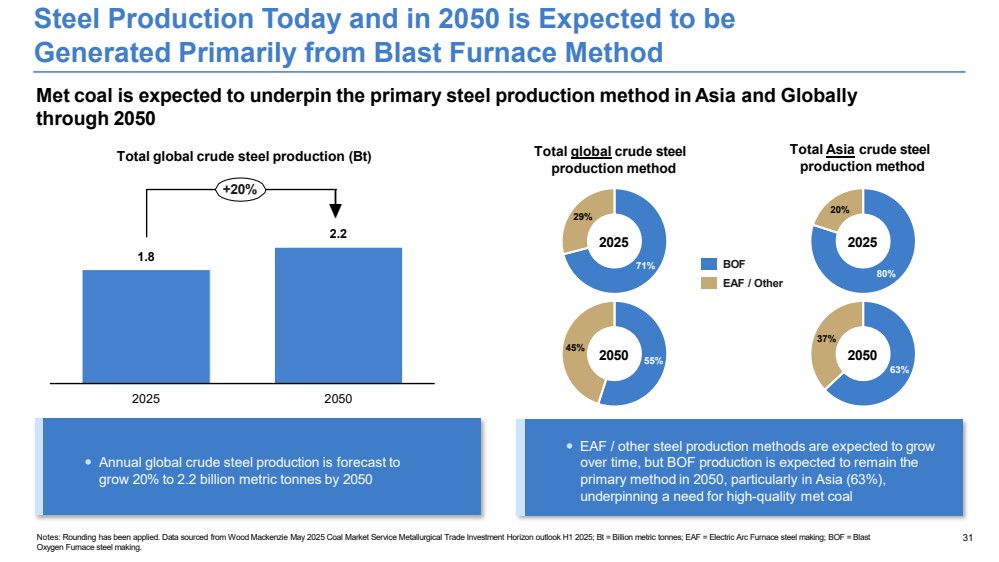
| 31 EAF / other steel production methods are expected to grow over time, but BOF production is expected to remain the primary method in 2050, particularly in Asia (63%), underpinning a need for high-quality met coal Annual global crude steel production is forecast to grow 20% to 2.2 billion metric tonnes by 2050 Notes: Rounding has been applied. Data sourced from Wood Mackenzie May 2025 Coal Market Service Metallurgical Trade Investment Horizon outlook H1 2025; Bt = Billion metric tonnes; EAF = Electric Arc Furnace steel making; BOF = Blast Oxygen Furnace steel making. Total global crude steel production (Bt) Total Asia crude steel production method +20% Total global crude steel production method BOF EAF / Other 2025 2050 2025 2050 Met coal is expected to underpin the primary steel production method in Asia and Globally through 2050 1 Steel Production Today and in 2050 is Expected to be Generated Primarily from Blast Furnace Method 1.8 2.2 2025 2050 71% 29% 63% 37% 80% 20% 55% 45% |
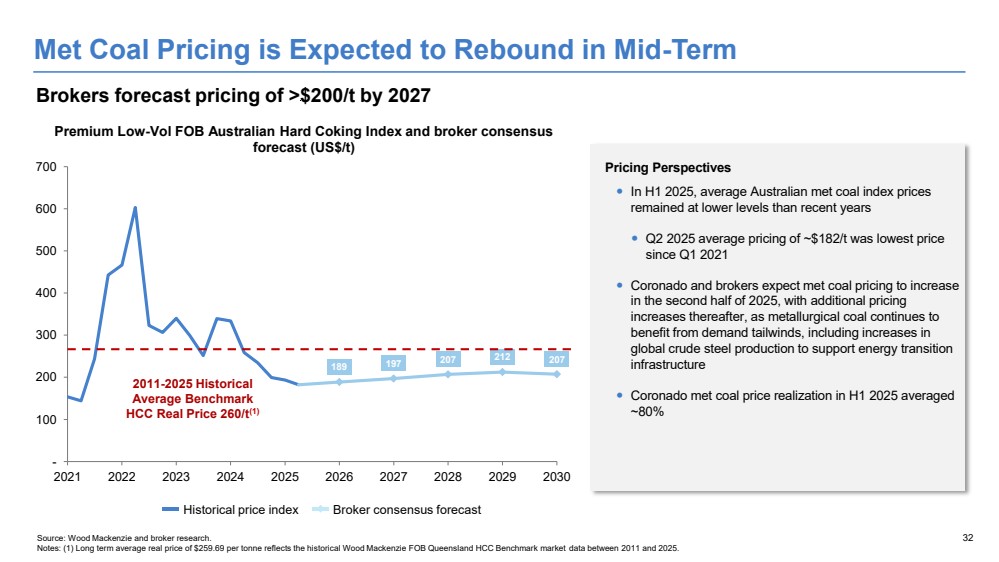
| 32 Premium Low-Vol FOB Australian Hard Coking Index and broker consensus forecast (US$/t) Source: Wood Mackenzie and broker research. Notes: (1) Long term average real price of $259.69 per tonne reflects the historical Wood Mackenzie FOB Queensland HCC Benchmark market data between 2011 and 2025. Pricing Perspectives In H1 2025, average Australian met coal index prices remained at lower levels than recent years Q2 2025 average pricing of ~$182/t was lowest price since Q1 2021 Coronado and brokers expect met coal pricing to increase in the second half of 2025, with additional pricing increases thereafter, as metallurgical coal continues to benefit from demand tailwinds, including increases in global crude steel production to support energy transition infrastructure Coronado met coal price realization in H1 2025 averaged ~80% Historical price index Broker consensus forecast Brokers forecast pricing of >$200/t by 2027 189 197 207 212 207 - 100 200 300 400 500 600 700 2021 2022 2023 2024 2025 2026 2027 2028 2029 2030 2011-2025 Historical Average Benchmark HCC Real Price 260/t(1) Met Coal Pricing is Expected to Rebound in Mid-Term |
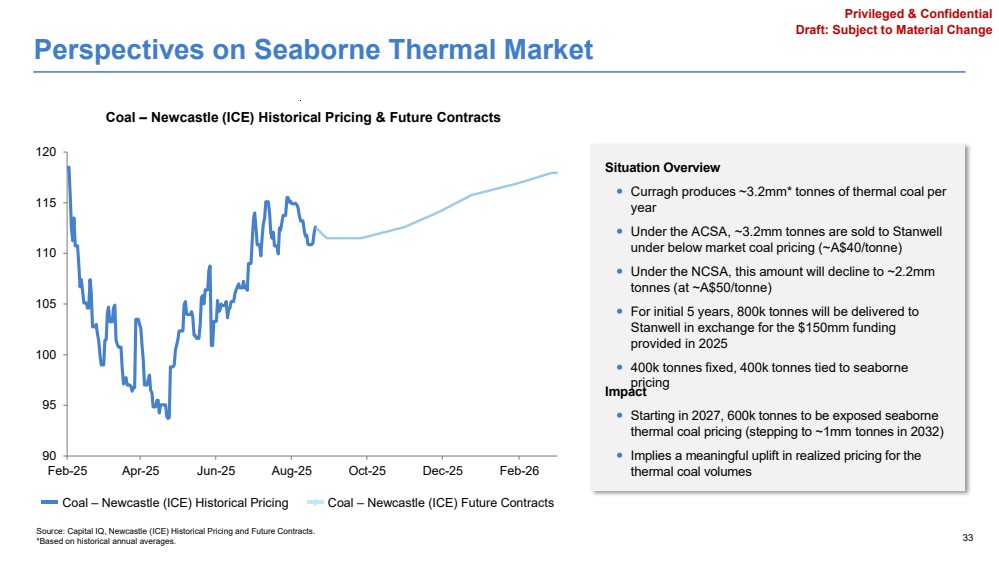
| 33 Perspectives on Seaborne Thermal Market 90 95 100 105 110 115 120 Feb-25 Apr-25 Jun-25 Aug-25 Oct-25 Dec-25 Feb-26 Coal – Newcastle (ICE) Historical Pricing & Future Contracts Coal – Newcastle (ICE) Future Contracts Situation Overview Curragh produces ~3.2mm* tonnes of thermal coal per year Under the ACSA, ~3.2mm tonnes are sold to Stanwell under below market coal pricing (~A$40/tonne) Under the NCSA, this amount will decline to ~2.2mm tonnes (at ~A$50/tonne) For initial 5 years, 800k tonnes will be delivered to Stanwell in exchange for the $150mm funding provided in 2025 400k tonnes fixed, 400k tonnes tied to seaborne pricing Impact Starting in 2027, 600k tonnes to be exposed seaborne thermal coal pricing (stepping to ~1mm tonnes in 2032) Implies a meaningful uplift in realized pricing for the thermal coal volumes Coal – Newcastle (ICE) Historical Pricing Source: Capital IQ, Newcastle (ICE) Historical Pricing and Future Contracts. *Based on historical annual averages. Privileged & Confidential Draft: Subject to Material Change |
| 34 Organizational Structure Coronado Mgmt. Coronado Group LLC (Delaware LLC) ASX Investors Coronado Global Resources Inc.(1) (Delaware Corporation) Coronado Coal Corporation (Delaware Corp.) Coronado Australia HoldingsPty Ltd (Aust Pty Ltd) Coronado II LLC (Delaware LLC) Coronado Coal II LLC (Delaware LLC) Mon Valley Minerals LLC (Delaware LLC) Greenbrier Minerals, LLC (Delaware LLC) Coronado Coal LLC (Delaware LLC) Coronado IV LLC (Delaware LLC) Coronado Finance Pty Ltd (Aust Pty Ltd) Coronado Curragh Pty Ltd (Aust Pty Ltd) Coronado Curragh LLC (Delaware LLC) Metallurgical Mineral Holdings Pty Ltd (Aust Pty Ltd) Buchanan Minerals, LLC (Delaware LLC) Powhatan Mid-Vol Coal Sales, LLC (Delaware LLC) Coronado VA, LLC (Delaware LLC) Buchanan Mining Company LLC (Delaware LLC) Curragh Coal Sales Co Pty Ltd (Aust Pty Ltd) Curragh Queensland Mining Pty Ltd (Aust Pty Ltd) Company B Virginia LLC (Virginia LLC) EMG CC HC LLC (DE) 17.98% EMG Coronado II HC LLC (DE) 23.90% EMG Coronado IV Holdings LLC (DE) 48.22% 1.32% EMG Coronado Strategic LP (DE) 8.59% 50.41% 49.59% Notes: (1) Coronado Global Resources Inc. holds 100% ownership interest in its subsidiaries, unless otherwise stated. |

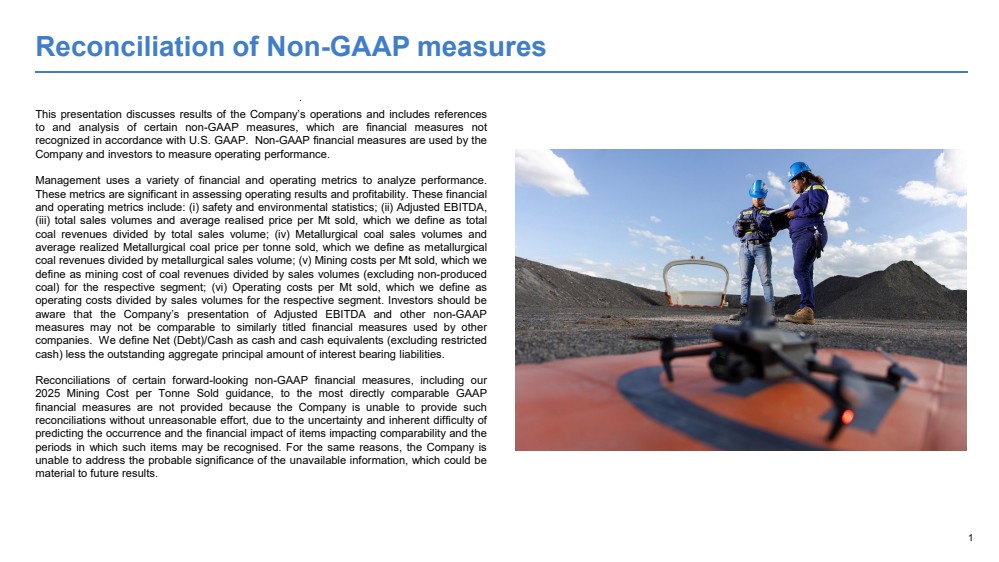
| 1 Reconciliation of Non-GAAP measures This presentation discusses results of the Company’s operations and includes references to and analysis of certain non-GAAP measures, which are financial measures not recognized in accordance with U.S. GAAP. Non-GAAP financial measures are used by the Company and investors to measure operating performance. Management uses a variety of financial and operating metrics to analyze performance. These metrics are significant in assessing operating results and profitability. These financial and operating metrics include: (i) safety and environmental statistics; (ii) Adjusted EBITDA, (iii) total sales volumes and average realised price per Mt sold, which we define as total coal revenues divided by total sales volume; (iv) Metallurgical coal sales volumes and average realized Metallurgical coal price per tonne sold, which we define as metallurgical coal revenues divided by metallurgical sales volume; (v) Mining costs per Mt sold, which we define as mining cost of coal revenues divided by sales volumes (excluding non-produced coal) for the respective segment; (vi) Operating costs per Mt sold, which we define as operating costs divided by sales volumes for the respective segment. Investors should be aware that the Company’s presentation of Adjusted EBITDA and other non-GAAP measures may not be comparable to similarly titled financial measures used by other companies. We define Net (Debt)/Cash as cash and cash equivalents (excluding restricted cash) less the outstanding aggregate principal amount of interest bearing liabilities. Reconciliations of certain forward-looking non-GAAP financial measures, including our 2025 Mining Cost per Tonne Sold guidance, to the most directly comparable GAAP financial measures are not provided because the Company is unable to provide such reconciliations without unreasonable effort, due to the uncertainty and inherent difficulty of predicting the occurrence and the financial impact of items impacting comparability and the periods in which such items may be recognised. For the same reasons, the Company is unable to address the probable significance of the unavailable information, which could be material to future results. Caption: Curragh Complex |
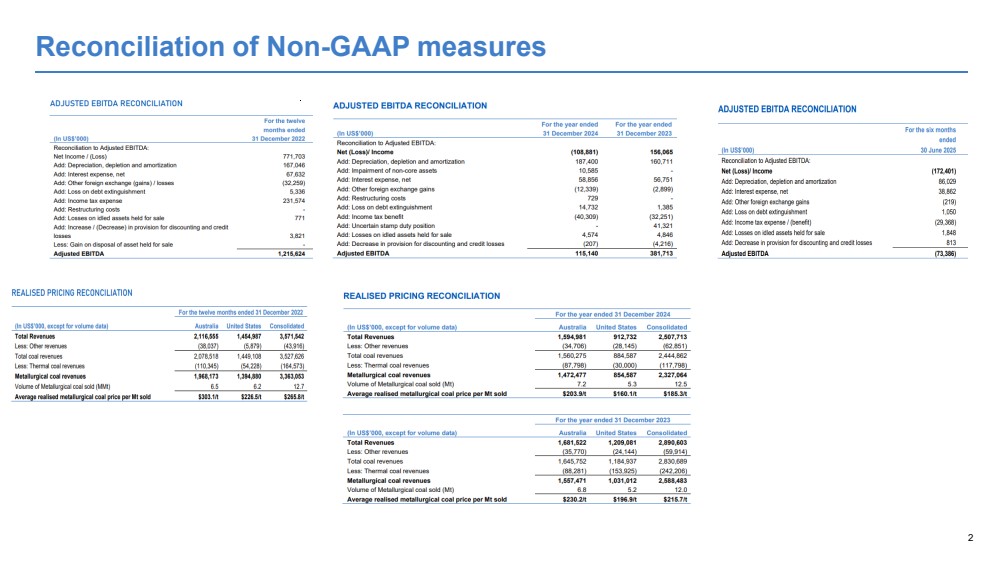
| 2 Reconciliation of Non-GAAP measures Caption: Curragh Complex |
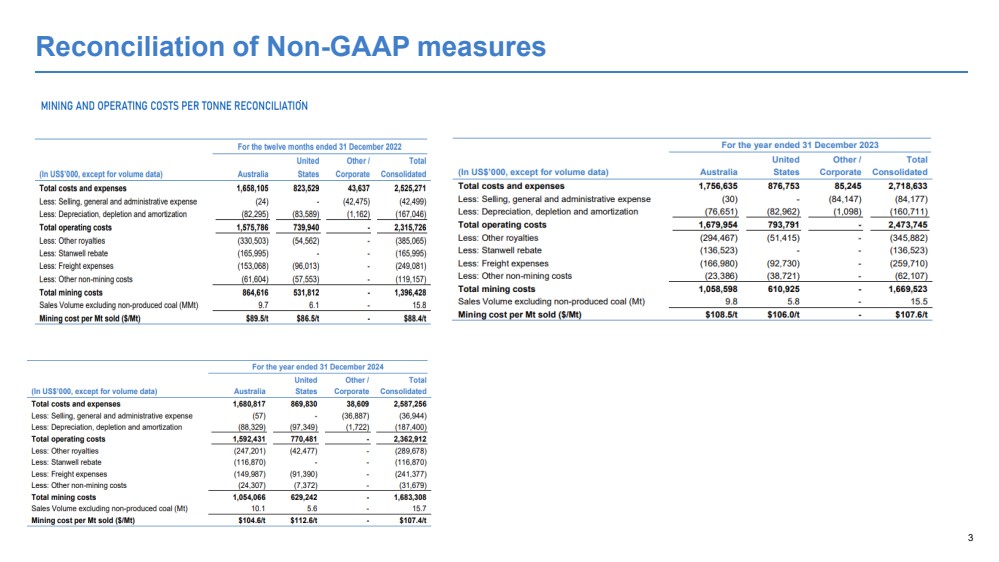
| 3 Reconciliation of Non-GAAP measures Caption: Curragh Complex |
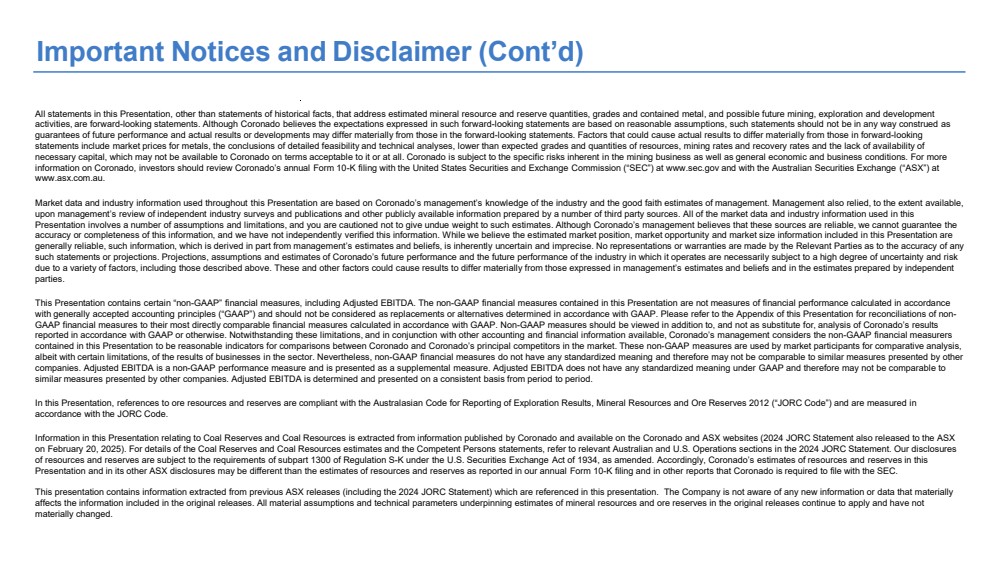
| 4 Other Information: The following information was also provided to the Ad Hoc Group during the discussions. These items are included for illustrative purposes only, cannot be relied upon and should not be considered guidance by Coronado. They also exclude any transactions currently contemplated by Coronado: • Cash and cash equivalents US$90 million • 2026 Estimated EBITDA US$67 million • 2027 Estimated EBITDA US$415 million |