EXHIBIT 99.1
II-VI Incorporated Reports Fiscal 2021 First Quarter Results
- Quarterly Revenue of $728.1 million
- Quarterly GAAP Operating Income of $101.1 million
- Quarterly Non-GAAP Operating Income of $138.9 million
- Quarterly GAAP EPS of $0.38
- Quarterly Non-GAAP EPS of $0.84
- September 30, 2020 net debt leverage ratio was 1.3x, reduced from 3.8x at June 30, 20201
PITTSBURGH, Nov. 05, 2020 (GLOBE NEWSWIRE) -- II-VI Incorporated (Nasdaq:IIVI) ("II-VI," “We” or the "Company") today reported results for its fiscal 2021 first quarter ended September 30, 2020.
“We delivered many highlights in the first quarter of FY21 while we continued our relentless focus on risk management and employee safety in the face of Covid-19. The sustained leadership of our diversified and broad product portfolio, strong results that reflected expanding trends in all of our end markets, navigation of the new trade restrictions and the achievement of greater share of the 3D Sensing market, were only a few of the tremendous accomplishments this quarter. September 24th, 2020 was the 12-month anniversary of the largest acquisition in our history, allowing us to demonstrate our ability to identify and scale our merger integration skills. I am pleased that we have achieved increased revenues, delivered synergies ahead of schedule, increased gross margins 330 basis points, and reengaged a number of customers that were on the sidelines before the transaction was approved. Given the demand we are seeing for our datacom and telecom products, this timely acquisition was and continues to be consistent with our strategy to count on some of the world’s greatest mega trends such as 5G and Cloud Computing to deliver a sustainable growth,” said Dr. Vincent D. (Chuck) Mattera, Jr.
Dr. Mattera continued, “Our greater 3D sensing share is demonstrated by the 200% year over year growth, and we were able to deliver strong results in the quarter for the entire business, despite the new trade restrictions. We strengthened our balance sheet through a successful capital raise of $920M with the enthusiastic support of our shareholders, moving our net debt leverage ratio1 down to 1.3x and increasing our cash balance to $684M. In the midst of the Finisar integration, we continued to position II-VI for incremental growth opportunities as we closed both the Ascatron and Innovion acquisitions, to expand our SiC materials expertise into modules and devices to serve the anticipated growth in demand of the power market as the electrification of transportation accelerates.”
____________
1 The net debt leverage ratio is calculated in accordance with the terms of the Credit Agreement.
| Table 1 | |
| Financial Metrics | | | | | |
| $ Millions, except per share amounts and % | | |
| (Unaudited) | Three Months Ended |
| | Sept 30, | | Jun 30, | | Sept 30, |
| | 2020 | | 2020 | | 2019 |
| | | | | | |
| Revenues | $ | 728.1 | | | $ | 746.2 | | | $ | 340.4 | |
| | | | | | |
| GAAP Gross Profit | $ | 286.6 | | | $ | 302.2 | | | $ | 123.1 | |
| Non-GAAP Gross Profit (2) | $ | 288.4 | | | $ | 315.7 | | | $ | 123.7 | |
| | | | | | |
| GAAP Operating Income (Loss) (1) | $ | 101.1 | | | $ | 67.4 | | | $ | (18.5 | ) |
| Non-GAAP Operating Income (2) | $ | 138.9 | | | $ | 124.6 | | | $ | 49.0 | |
| | | | | | |
| GAAP Net Earnings (Loss) | $ | 46.3 | | | $ | 51.3 | | | $ | (26.0 | ) |
| Non-GAAP Net Earnings (2) | $ | 100.4 | | | $ | 117.8 | | | $ | 35.8 | |
| | | | | | |
| GAAP Diluted Earnings (Loss) Per Share | $ | 0.38 | | | $ | 0.53 | | | $ | (0.39 | ) |
| Non-GAAP Diluted Earnings Per Share (2)(3) | $ | 0.84 | | | $ | 1.18 | | | $ | 0.53 | |
| | | | | | |
| Other Selected Financial Metrics | | | | | |
| GAAP Gross margin | | 39.4% | | | | 40.5% | | | | 36.2% | |
| Non-GAAP gross margin (2) | | 39.6% | | | | 42.3% | | | | 36.3% | |
| GAAP Operating margin | | 13.9% | | | | 9.0% | | | | (5.4)% | |
| Non-GAAP operating margin (2) | | 19.1% | | | | 16.7% | | | | 14.4% | |
| GAAP Return on sales | | 6.4% | | | | 6.9% | | | | (7.6)% | |
| Non-GAAP return on sales (2) | | 13.8% | | | | 15.8% | | | | 10.5% | |
| (1) | GAAP Operating income (loss) is defined as earnings (loss) before income taxes, interest expense and other expense or income, net. |
| (2) | All non-GAAP amounts exclude certain adjustments for share-based compensation, acquired intangible amortization expense, certain one-time transaction expenses, fair value measurement period adjustments, and restructuring and related items. See Table 4 for the Reconciliation of GAAP measures to non-GAAP measures. |
| (3) | Diluted earnings per common share on non-GAAP basis for the September 30, 2019 period have been updated from $0.56, to include the dilutive impact of our outstanding 0.25% convertible senior notes due 2022 (the “2022 convertible senior notes”). |
Outlook
The outlook for the second fiscal quarter ending December 31, 2020 is revenue of $750.0 million to $780.0 million and earnings per diluted share on a non-GAAP basis of $0.86 to $0.95. This is at today’s exchange rate and today’s estimated tax impact of 24%. Both of these are subject to variability. For the non-GAAP earnings per share, we added back to the GAAP earnings pre-tax amounts of $21 million in amortization, $17 million in share-based compensation, and $2 million in transaction costs. Non-GAAP adjustments are by their nature highly volatile and we have low visibility as to the range that may be incurred in the future.
Conference Call & Webcast Information
The Company will host a conference call at 9:00 a.m. Eastern Time on Thursday, November 5, 2020 to discuss these results. Individuals wishing to participate in the webcast can access the event at the Company’s web site by visiting www.ii-vi.com or via https://tinyurl.com/IIVIQ1FY21Earnings. If you wish to participate in the conference call, please dial +1 (877) 316-5288 for calls from the U.S. and +1 (734) 385-4977 for calls from outside the U.S. To join the conference call, please enter ID# 4349251, then provide your name and company affiliation.
The conference call will be recorded, and a replay will be available to interested parties who are unable to attend the live call. This service will be available until 11:59 p.m. Eastern Time on Monday, November 9, 2020, by dialing +1 (855) 859-2056 for calls from the U.S. and +1 (404) 537-3406 for calls from outside the U.S., and entering ID# 4349251.
About II-VI Incorporated
II-VI Incorporated, a global leader in engineered materials and optoelectronic components, is a vertically integrated manufacturing company that develops innovative products for diversified applications in communications, materials processing, aerospace & defense, semiconductor capital equipment, life sciences, consumer electronics, and automotive markets. Headquartered in Saxonburg, Pennsylvania, the Company has research and development, manufacturing, sales, service, and distribution facilities worldwide. The Company produces a wide variety of application-specific photonic and electronic materials and components, and deploys them in various forms, including integrated with advanced software to support our customers. For more information, please visit us at www.ii-vi.com.
Forward-looking Statements
This press release contains forward-looking statements relating to future events and expectations that are based on certain assumptions and contingencies. The forward-looking statements are made pursuant to the safe harbor provisions of the U.S. Private Securities Litigation Reform Act of 1995 and relate to the Company’s performance on a going-forward basis. The forward-looking statements in this press release involve risks and uncertainties, which could cause actual results, performance or trends to differ materially from those expressed in the forward-looking statements herein or in previous disclosures.
The Company believes that all forward-looking statements made by it in this release have a reasonable basis, but there can be no assurance that management’s expectations, beliefs or projections as expressed in the forward-looking statements will actually occur or prove to be correct. In addition to general industry and global economic conditions, factors that could cause actual results to differ materially from those discussed in the forward-looking statements in this press release include, but are not limited to: (i) the failure of any one or more of the assumptions stated above to prove to be correct; (ii) the risks relating to forward-looking statements and other “Risk Factors” discussed in the Company’s Annual Report on Form 10-K for the fiscal year ended June 30, 2020; (iii) the purchasing patterns of customers and end-users; (iv) the timely release of new products, and acceptance of such new products by the market; (v) the introduction of new products by competitors and other competitive responses; (vi) the Company’s ability to assimilate recently acquired businesses, and risks, costs and uncertainties associated with such acquisitions; (vii) the Company’s ability to devise and execute strategies to respond to market conditions; and/or (viii) the risks of business and economic disruption related to the currently ongoing COVID-19 outbreak and any other worldwide health epidemics and outbreaks that may arise. The Company disclaims any obligation to update information contained in these forward-looking statements whether as a result of new information, future events or developments, or otherwise.
Use of Non-GAAP Financial Measures
The Company has disclosed financial measurements in this press release that present financial information considered to be non-GAAP financial measures. These measurements are not a substitute for GAAP measurements, although the Company's management uses these measurements as an aid in monitoring the Company's on-going financial performance. The non-GAAP net earnings, the non-GAAP earnings per share, the non-GAAP operating income, the non-GAAP gross profit, the non-GAAP internal research and development, the non-GAAP selling, general and administration, the non-GAAP interest and other (income) expense, and the non-GAAP income tax (benefit), measure earnings and operating income (loss), respectively, excluding non-recurring or unusual items that are considered by management to be outside the Company’s standard operation and excluding certain non-cash items. EBITDA is an adjusted non-GAAP financial measurement that is considered by management to be useful in measuring the profitability between companies within the industry by reflecting operating results of the Company excluding non-operating factors. There are limitations associated with the use of non-GAAP financial measures, including that such measures may not be entirely comparable to similarly titled measures used by other companies, due to potential differences among calculation methodologies. Thus, there can be no assurance whether (i) items excluded from the non-GAAP financial measures will occur in the future or (ii) there will be cash costs associated with items excluded from the non-GAAP financial measures. The Company compensates for these limitations by using these non-GAAP financial measures as supplements to GAAP financial measures and by providing the reconciliations of the non-GAAP financial measures to their most comparable GAAP financial measures. Investors should consider adjusted measures in addition to, and not as a substitute for, or superior to, financial performance measures prepared in accordance with GAAP.
| II-VI Incorporated and Subsidiaries |
| Condensed Consolidated Statement of Earnings (Loss) (Unaudited) |
| ($000 except per share data) |
| | | | | | |
| | Three Months Ended |
| | Sept 30, | | Jun 30, | | Sept 30, |
| | 2020 | | 2020 | | 2019 |
| | | | | | |
| Revenues | $ | 728,084 | | | $ | 746,290 | | | $ | 340,409 | |
| | | | | | |
| Costs, Expenses & Other Expense (Income) | | | | | |
| Cost of goods sold | 441,520 | | | 444,153 | | | 217,269 | |
| Internal research and development | 78,248 | | | 100,489 | | | 36,120 | |
| Selling, general and administrative | 107,186 | | | 134,152 | | | 105,495 | |
| Interest expense | 17,214 | | | 25,521 | | | 6,968 | |
| Other expense (income), net | 24,339 | | | 1,264 | | | 5,079 | |
| Total Costs, Expenses, & Other Expense (Income) | 668,507 | | | 705,579 | | | 370,931 | |
| | | | | | |
| Earnings (Loss) Before Income Taxes | 59,577 | | | 40,711 | | | (30,522 | ) |
| | | | | | |
| Income Taxes | 13,311 | | | (10,550 | ) | | (4,524 | ) |
| | | | | | |
| Net Earnings (Loss) | $ | 46,266 | | | $ | 51,261 | | | $ | (25,998 | ) |
| | | | | | |
| Series A Mandatory Convertible Preferred Stock Dividends | 6,440 | | | — | | | — | |
| Net Earnings (Loss) available to the Common Shareholders | 39,826 | | | 51,261 | | | (25,998 | ) |
| | | | | | |
| Diluted Earnings (Loss) Per Share | $ | 0.38 | | | $ | 0.53 | | | $ | (0.39 | ) |
| | | | | | |
| Basic Earnings (Loss) Per Share | $ | 0.39 | | | $ | 0.56 | | | $ | (0.39 | ) |
| | | | | | |
| Average Shares Outstanding - Diluted | 105,247 | | | 102,142 | | | 65,969 | |
| Average Shares Outstanding - Basic | 102,809 | | | 91,517 | | | 65,969 | |
| II-VI Incorporated and Subsidiaries | | | |
| Condensed Consolidated Balance Sheets (Unaudited) | | | |
| ($000) | | | |
| | | | |
| | September 30, | | June 30, |
| | 2020 | | 2020 |
| Assets | | | |
| Current Assets | | | |
| Cash and cash equivalents | $ | 683,985 | | | $ | 493,046 | |
| Accounts receivable | 577,127 | | | 598,124 | |
| Inventories | 639,833 | | | 619,810 | |
| Prepaid and refundable income taxes | 12,794 | | | 12,279 | |
| Prepaid and other current assets | 78,003 | | | 65,710 | |
| Total Current Assets | 1,991,742 | | | 1,788,969 | |
| Property, plant & equipment, net | 1,218,575 | | | 1,214,772 | |
| Goodwill | 1,254,338 | | | 1,239,009 | |
| Other intangible assets, net | 757,770 | | | 758,368 | |
| Investments | 75,188 | | | 73,767 | |
| Deferred income taxes | 27,940 | | | 22,938 | |
| Other assets | 145,066 | | | 136,891 | |
| Total Assets | $ | 5,470,619 | | | $ | 5,234,714 | |
| | | | |
| Liabilities and Shareholders’ Equity | | | |
| Current Liabilities | | | |
| Current portion of long-term debt | $ | 62,050 | | | $ | 69,250 | |
| Accounts payable | 256,029 | | | 268,773 | |
| Operating lease current liabilities | 24,142 | | | 24,634 | |
| Accruals and other current liabilities | 302,672 | | | 310,236 | |
| Total Current Liabilities | 644,893 | | | 672,893 | |
| Long-term debt | 1,468,096 | | | 2,186,092 | |
| Deferred income taxes | 55,031 | | | 45,551 | |
| Operating lease liabilities | 99,566 | | | 94,701 | |
| Other liabilities | 156,356 | | | 158,674 | |
| Total Liabilities | 2,423,942 | | | 3,157,911 | |
| Total Shareholders' Equity | 3,046,677 | | | 2,076,803 | |
| Total Liabilities and Shareholders’ Equity | $ | 5,470,619 | | | $ | 5,234,714 | |
| II-VI Incorporated and Subsidiaries | | | |
| Condensed Consolidated Statements of Cash Flows (Unaudited) | | | |
| | Three Months Ended |
| | September 30, |
| | 2020 | | 2019 |
| Cash Flows from Operating Activities | | | |
| Net cash provided by (used in) operating activities | $ | 134,327 | | | $ | (25,615 | ) |
| | | | |
| Cash Flows from Investing Activities | | | |
| Additions to property, plant & equipment | (33,792 | ) | | (25,636 | ) |
| Purchases of businesses, net of cash acquired | (36,064 | ) | | (1,036,609 | ) |
| Other investing activities | — | | | (1,940 | ) |
| Net cash used in investing activities | (69,856 | ) | | (1,064,185 | ) |
| | | | |
| Cash Flows from Financing Activities | | | |
| Proceeds from issuance of common shares | 460,000 | | | — | |
| Proceeds from issuance of preferred shares | 460,000 | | | — | |
| Proceeds from borrowings of Term A Facility | — | | | 680,000 | |
| Proceeds from borrowings of Term B Facility | — | | | 720,000 | |
| Proceeds from borrowings of Revolving Credit Facility | — | | | 160,000 | |
| Proceeds from borrowings under prior Credit Facility | — | | | 10,000 | |
| Payments on borrowings under prior Term Loan, Credit Facility and other loans | — | | | (172,780 | ) |
| Payments on borrowings under Term A Facility | (15,513 | ) | | — | |
| Payments on borrowings under Term B Facility | (714,600 | ) | | — | |
| Payments on borrowings under Revolving Credit Facility | (25,000 | ) | | — | |
| Debt issuance costs | — | | | (63,510 | ) |
| Equity issuance costs | (36,092 | ) | | — | |
| Proceeds from exercises of stock options | 1,083 | | | 2,975 | |
| Payments in satisfaction of employees' minimum tax obligations | (5,574 | ) | | (9,418 | ) |
| Other financing activities | (1,329 | ) | | (660 | ) |
| Net cash provided by financing activities | 122,975 | | | 1,326,607 | |
| | | | |
| Effect of exchange rate changes on cash and cash equivalents | 3,493 | | | (2,128 | ) |
| | | | |
| Net increase in cash and cash equivalents | 190,939 | | | 234,679 | |
| | | | |
| Cash and Cash Equivalents at Beginning of Period | 493,046 | | | 204,872 | |
| Cash and Cash Equivalents at End of Period | $ | 683,985 | | | $ | 439,551 | |
| Table 2 | | | | | |
| Segment Revenues, GAAP Operating Income (Loss) & Margins, and | | |
| Non-GAAP Operating Income (Loss) & Margins* | | |
| $ Millions, except % | | | | | |
| (Unaudited) | Three Months Ended |
| | Sept 30, | | Jun 30, | | Sept 30, |
| | 2020 | | 2020 | | 2019 |
| Revenues: | | | | | |
| Photonic Solutions | $ | 497.7 | | | $ | 517.2 | | | $ | 141.4 | |
| Compound Semiconductors | 230.4 | | | 229.0 | | | 177.0 | |
| Unallocated and Other | — | | | — | | | 22.1 | |
| Consolidated | $ | 728.1 | | | $ | 746.2 | | | $ | 340.4 | |
| | | | | | |
| GAAP Operating Income (Loss): | | | | | |
| Photonic Solutions | $ | 50.4 | | | $ | 49.1 | | | $ | 13.0 | |
| Compound Semiconductors | 50.7 | | | 19.6 | | | 26.5 | |
| Unallocated and Other | — | | | (1.3 | ) | | (58.0 | ) |
| Consolidated | $ | 101.1 | | | $ | 67.4 | | | $ | (18.5 | ) |
| | | | | | |
| Non-GAAP Operating Income (Loss): | | | | | |
| Photonic Solutions | $ | 78.2 | | | $ | 88.8 | | | $ | 17.9 | |
| Compound Semiconductors | 60.7 | | | 35.8 | | | 31.2 | |
| Unallocated and Other | — | | | — | | | (0.2 | ) |
| Consolidated | $ | 138.9 | | | $ | 124.6 | | | $ | 49.0 | |
| | | | | | |
| GAAP Operating Margin: | | | | | |
| Photonic Solutions | 10.1% | | 9.5% | | 9.2% |
| Compound Semiconductors | 22.0% | | 8.6% | | 15.0% |
| Unallocated and Other | NA | | NA | | NA |
| Consolidated | 13.9% | | 9.0% | | -5.4% |
| | | | | | |
| Non-GAAP Operating Margin: | | | | | |
| Photonic Solutions | 15.7% | | 17.2% | | 12.7% |
| Compound Semiconductors | 26.4% | | 15.6% | | 17.6% |
| Unallocated and Other | NA | | NA | | NA |
| Consolidated | 19.1% | | 16.7% | | 14.4% |
| Table 3 | | | | | |
| Reconciliation of Segment Non-GAAP Operating Income (Loss) to | | |
| GAAP Segment Operating Income (Loss) | | | | | |
| $ Millions | | | | | |
| (Unaudited) | Three Months Ended |
| | Sept 30, | | Jun 30, | | Sept 30, |
| | 2020 | | 2020 | | 2019 |
| Non-GAAP Photonic Solutions Operating Income | $ | 78.2 | | | $ | 88.8 | | | $ | 17.9 | |
| Measurement period adjustment on long-lived assets | — | | | (1.9 | ) | | — | |
| Share-based compensation | (10.5 | ) | | (17.9 | ) | | (2.7 | ) |
| Amortization of acquired intangibles | (17.3 | ) | | (15.9 | ) | | (2.1 | ) |
| Restructuring and related expenses | — | | | (4.0 | ) | | — | |
| Photonic Solutions GAAP Operating Income (Loss) | $ | 50.4 | | | $ | 49.1 | | | $ | 13.0 | |
| | | | | | |
| Non-GAAP Compound Semiconductors Operating Income | $ | 60.7 | | | $ | 35.8 | | | $ | 31.2 | |
| Measurement period adjustment on long-lived assets | — | | | (7.2 | ) | | — | |
| Share-based compensation | (5.0 | ) | | (6.1 | ) | | (2.7 | ) |
| Amortization of acquired intangibles | (2.9 | ) | | (2.9 | ) | | (2.0 | ) |
| Transaction expenses related to acquisitions | (2.1 | ) | | — | | | — | |
| Compound Semiconductors GAAP Operating Income (Loss) | $ | 50.7 | | | $ | 19.6 | | | $ | 26.5 | |
| | | | | | |
| Non-GAAP Unallocated and Other Operating Income (Loss) | $ | — | | | $ | — | | | $ | (0.2 | ) |
| Finisar results | — | | | — | | | 1.9 | |
| Transaction expenses related to acquisitions | — | | | (1.3 | ) | | (5.4 | ) |
| Severance and related - Share-based compensation | — | | | — | | | (10.7 | ) |
| Severance and related - Other compensation | — | | | — | | | (7.7 | ) |
| Amortization of acquired intangibles | — | | | — | | | (2.0 | ) |
| Preliminary fair value adjustment on acquired inventory | — | | | — | | | (7.1 | ) |
| One-time costs related to the Finisar acquisition | — | | | — | | | (26.8 | ) |
| Unallocated and Other GAAP Operating Income (Loss) | $ | — | | | $ | (1.3 | ) | | $ | (58.0 | ) |
| | | | | | |
| Total GAAP Operating Income (Loss) | $ | 101.1 | | | $ | 67.4 | | | $ | (18.5 | ) |
| | | | | | |
| Non-GAAP Operating Income | $ | 138.9 | | | $ | 124.6 | | | $ | 48.9 | |
*Amounts may not recalculate due to rounding.
| Table 4 | | | | | |
| Reconciliation of GAAP Measures to non-GAAP Measures | | | | | |
| $ Millions | | | | | |
| (Unaudited) | Three Months Ended |
| | Sept 30, | | Jun 30, | | Sept 30, |
| | 2020 | | 2020 | | 2019 (8) |
| Gross profit on GAAP basis | $ | 286.6 | | | $ | 302.2 | | | $ | 123.1 | |
| Finisar results (1) | — | | | — | | | (6.5 | ) |
| Share-based compensation | 1.8 | | | 4.4 | | | — | |
| Fair value adjustment on acquired inventory (2) | — | | | — | | | 7.1 | |
| Measurement period adjustment on long-lived assets (3) | — | | | 9.1 | | | — | |
| Gross profit on non-GAAP basis | $ | 288.4 | | | $ | 315.7 | | | $ | 123.7 | |
| | | | | | |
| Internal research and development on GAAP basis | $ | 78.2 | | | $ | 100.5 | | | $ | 36.1 | |
| Share-based compensation (4) | (2.6 | ) | | (6.1 | ) | | (0.6 | ) |
| Finisar results (1) | — | | | — | | | (2.9 | ) |
| Severance, restructuring and related costs (5) | — | | | (3.5 | ) | | — | |
| Internal research and development on non-GAAP basis | $ | 75.6 | | | $ | 90.9 | | | $ | 32.6 | |
| | | | | | |
| Selling, general and administrative on GAAP basis | $ | 107.2 | | | $ | 134.2 | | | $ | 105.5 | |
| Share-based compensation (4) | (11.1 | ) | | (13.5 | ) | | (4.8 | ) |
| Transaction expenses related to acquisitions (3) | (2.1 | ) | | (1.3 | ) | | (32.4 | ) |
| Finisar results (1) | — | | | — | | | (1.7 | ) |
| Severance, restructuring and related costs (5) | — | | | (0.5 | ) | | (18.4 | ) |
| Amortization of acquired intangibles | (20.2 | ) | | (18.8 | ) | | (6.1 | ) |
| Selling, general and administrative on non-GAAP basis | $ | 73.8 | | | $ | 100.2 | | | $ | 42.1 | |
| | | | | | |
| Operating income (loss) on GAAP basis | $ | 101.1 | | | $ | 67.5 | | | $ | (18.5 | ) |
| Finisar results (1) | — | | | — | | | (1.9 | ) |
| Share-based compensation (4) | 15.5 | | | 24.0 | | | 5.4 | |
| Fair value adjustment on acquired inventory (2) | — | | | — | | | 7.1 | |
| Amortization of acquired intangibles | 20.2 | | | 18.8 | | | 6.1 | |
| Measurement period adjustment on long-lived assets (3) | — | | | 9.1 | | | — | |
| Severance, restructuring and related costs (5) | — | | | 4.0 | | | 18.4 | |
| Transaction expenses related to acquisitions (6) | 2.1 | | | 1.3 | | | 32.4 | |
| Operating income on non-GAAP basis | $ | 138.9 | | | $ | 124.6 | | | $ | 49.0 | |
| | | | | | |
| Table 4 | | | | | |
| Reconciliation of GAAP Measures to non-GAAP Measures (Continued) | | |
| $ Millions | | | | | |
| (Unaudited) | Three Months Ended |
| | Sept 30, | | Jun 30, | | Sept 30, |
| | 2020 | | 2020 | | 2019 (8) |
| Interest and other (income) expense, net on GAAP basis | $ | 41.5 | | | $ | 26.8 | | | $ | 12.0 | |
| Finisar results (1) | — | | | — | | | 0.3 | |
| Foreign currency exchange gains (losses), net | (4.7 | ) | | (6.3 | ) | | (1.1 | ) |
| Additional interest expense related to Finisar acquisition (1) | — | | | — | | | (1.7 | ) |
| Debt extinguishment expense (5) (7) | (24.7 | ) | | — | | | (3.9 | ) |
| Interest and other (income) expense, net on non-GAAP basis | $ | 12.1 | | | $ | 20.5 | | | $ | 5.6 | |
| | | | | | |
| Income taxes (benefit) on GAAP basis | $ | 13.3 | | | $ | (10.6 | ) | | $ | (4.5 | ) |
| Tax impact of non-GAAP measures(8) | 13.1 | | | (2.6 | ) | | 12.8 | |
| Tax impact of fair value adjustments | — | | | (0.4 | ) | | — | |
| Income taxes (benefit) on non-GAAP basis | $ | 26.4 | | | $ | (13.6 | ) | | $ | 8.3 | |
| | | | | | |
| Net earnings (loss) on GAAP basis | $ | 46.3 | | | $ | 51.3 | | | $ | (26.0 | ) |
| Finisar results (1) | — | | | — | | | (1.6 | ) |
| Share-based compensation (4) | 15.5 | | | 24.0 | | | 5.4 | |
| Fair value adjustment on acquired inventory (2) | — | | | — | | | 7.1 | |
| Amortization of acquired intangibles | 20.2 | | | 18.8 | | | 6.2 | |
| Measurement period adjustment on long-lived assets (3) | — | | | 9.1 | | | — | |
| Transaction expenses related to acquisitions (6) | 2.1 | | | 1.3 | | | 32.4 | |
| Severance, restructuring and related costs (5) | — | | | 4.0 | | | 18.4 | |
| Foreign currency exchange (gains) losses, net | 4.7 | | | 6.3 | | | 1.1 | |
| Additional interest expense related to Finisar acquisition (5) | — | | | — | | | 1.7 | |
| Debt extinguishment expense (7) | 24.7 | | | — | | | 3.9 | |
| Tax impact of non-GAAP measures and fair value adjustments(8) | (13.1 | ) | | 3.0 | | | (12.8 | ) |
| Net earnings on non-GAAP basis | $ | 100.4 | | | $ | 117.8 | | | $ | 35.8 | |
| | | | | | |
| Per share data: | | | | | |
| Net earnings (loss) on GAAP basis | | | | | |
| Diluted Earnings (Loss) Per Share | $ | 0.38 | | | $ | 0.53 | | | $ | (0.39 | ) |
| Basic Earnings (Loss) Per Share | $ | 0.39 | | | $ | 0.56 | | | $ | (0.39 | ) |
| | | | | | |
| Net earnings on non-GAAP basis | | | | | |
| Diluted Earnings Per Share (9) | $ | 0.84 | | | $ | 1.18 | | | $ | 0.53 | |
| Basic Earnings Per Share | $ | 0.91 | | | $ | 1.29 | | | $ | 0.54 | |
*Amounts may not recalculate due to rounding.
- “Finisar results” includes the consolidated Finisar operations for the period between the acquisition date of September 24, 2019 and September 30, 2019, which includes additional interest expense and debt extinguishment expense as a result of the acquisition financing. Finisar results have been consolidated into the Photonics Solutions and Compound Semiconductors segments in periods subsequent to the three months ended September 30, 2019.
- The fair value adjustment of $7.1 million represents the step up value adjustment of acquired inventory from the Finisar acquisition.
- Represents the depreciation impact of measurement period adjustments to the fair value of long-lived assets acquired in the Finisar acquisition.
- Total share-based compensation expense for the three months ended September 30, 2019 includes $10.7 million incurred in relation to severance related expenses as described below in note 5.
- Restructuring and related costs include expenses to achieve the Company’s cost synergy strategy. In connection with the acquisition of Finisar, the Company recorded severance and retention expense of $18.4 million for the three months ended September 30, 2019. Included in this amount is $10.7 million of share-based compensation.
- During fiscal year 2020, transaction costs primarily represent acquisition and integration costs related to the Finisar acquisition.
- The Company recorded debt extinguishment expense of $24.7 million in connection with the extinguishment of the Term B Loan Facility during the three months ended September 30, 2020.
- The non-GAAP financial measures for the three months ended September 30, 2019 have been adjusted to conform to the current period presentation.
- Diluted earnings per common share on non-GAAP basis for the September 30, 2019 period have been updated from $0.56, to include the dilutive impact of our outstanding 0.25% convertible senior notes due 2022 (the “2022 convertible senior notes”).
| Table 5 | | | | | |
| Reconciliation of GAAP Net Income (Loss), EBITDA and Adjusted EBITDA | | |
| $ Millions | | | | | |
| (Unaudited) | Three Months Ended |
| | Sept 30, | | Jun 30, | | Sept 30, |
| | 2020 | | 2020 | | 2019 |
| Net earnings (loss) on GAAP basis | $ | 46.3 | | | $ | 51.3 | | | $ | (26.0 | ) |
| Income taxes (benefit) | 13.3 | | | (10.6 | ) | | (4.5 | ) |
| Depreciation and amortization | 64.7 | | | 73.8 | | | 26.9 | |
| Interest expense | 17.2 | | | 25.5 | | | 7.0 | |
| EBITDA (1) | $ | 141.5 | | | $ | 140.0 | | | $ | 3.5 | |
| EBITDA margin | 19.4 | % | | 18.8 | % | | 1.0 | % |
| | | | | | |
| Fair value adjustment on acquired inventory | — | | | — | | | 7.1 | |
| Share-based compensation | 15.5 | | | 24.0 | | | 5.4 | |
| Transaction expenses related to other acquisitions | 2.1 | | | 1.3 | | | 32.4 | |
| Foreign currency exchange (gains) losses, net | 4.7 | | | 6.3 | | | 1.1 | |
| Severance, restructuring and related costs | — | | | 4.0 | | | 18.4 | |
| Debt extinguishment expense | 24.7 | | | — | | | 3.9 | |
| Special items - Other income (expense), net | — | | | — | | | 4.3 | |
| Adjusted EBITDA (2) | $ | 188.5 | | | $ | 175.6 | | | $ | 75.9 | |
| Adjusted EBITDA margin | 25.9 | % | | 23.5 | % | | 22.3 | % |
| *Amounts may not recalculate due to rounding. |
| | |
| (1) | EBITDA is defined as earnings before interest, income taxes, depreciation and amortization. |
| (2) | Adjusted EBITDA excludes non-GAAP adjustments for share-based compensation, acquired intangibles amortization expense, certain one-time transaction expense, the impact of restructuring and related items, debt extinguishment charge and the impact of foreign currency exchange gains and losses. |
| Table 6 | | | | | |
| GAAP Earnings Per Share Calculation | | | | | |
| $ Millions | | | | | |
| (Unaudited) | Three Months Ended |
| | Sept 30, | | Jun 30, | | Sept 30, |
| | 2020 | | 2020 | | 2019 |
| Numerator | | | | | |
| Net earnings (loss) | $ | 46.3 | | | $ | 51.3 | | | $ | (26.0 | ) |
| Series A Mandatory Convertible Preferred Stock dividends | (6.4 | ) | | — | | | — | |
| Basic earnings available to common shareholders | $ | 39.8 | | | $ | 51.3 | | | $ | (26.0 | ) |
| | | | | | |
| Effect of dilutive securities: | | | | | |
| Add back interest on Convertible Senior Notes Due 2022 | $ | — | | | $ | 2.8 | | | $ | — | |
| Diluted earnings available to common shareholders | $ | 39.8 | | | $ | 54.1 | | | $ | (26.0 | ) |
| | | | | | |
| Denominator | | | | | |
| Weighted average shares (1) | | 102.8 | | | | 91.5 | | | | 66.0 | |
| Effect of dilutive securities: | | | | | | | | | | | |
| Common stock equivalents | | 2.4 | | | | 3.2 | | | | — | |
| 0.25% Convertible Senior Notes due 2022 | | — | | | | 7.3 | | | | — | |
| Diluted weighted average common shares | | 105.2 | | | 102.0 | | | 66.0 | |
| | | | | | |
| Basic earnings (loss) per common share | $ | 0.39 | | | $ | 0.56 | | | $ | (0.39 | ) |
| | | | | | |
| Diluted earnings (loss) per common share | $ | 0.38 | | | $ | 0.53 | | | $ | (0.39 | ) |
| *Amounts may not recalculate due to rounding. |
| | |
| (1) | Weighted average shares for the three months ended September 30, 2020 include 10.7 million common shares issued in July 2020 as a result of the underwritten public offering. |
| Table 7 | | | | | |
| Non-GAAP Earnings Per Share Calculation | | | | | |
| $ Millions | | | | | |
| (Unaudited) | Three Months Ended |
| | Sept 30, | | Jun 30, | | Sept 30, |
| | 2020 | | 2020 | | 2019 |
| Numerator | | | | | |
| Net earnings on non-GAAP basis | $ | 100.4 | | | $ | 117.8 | | | $ | 35.8 | |
| Series A Mandatory Convertible Preferred Stock dividends | (6.4 | ) | | — | | | — | |
| Basic earnings available to common shareholders | $ | 94.0 | | | $ | 117.8 | | | $ | 35.8 | |
| | | | | | |
| Effect of dilutive securities: | | | | | |
| Add back interest on Convertible Senior Notes Due 2022 | $ | 3.1 | | | $ | 2.8 | | | $ | 2.7 | |
| Add back Series A preferred stock dividends | 6.4 | | | — | | | — | |
| Diluted earnings available to common shareholders | $ | 103.5 | | | $ | 120.6 | | | $ | 38.5 | |
| | | | | | |
| Denominator | | | | | |
| Weighted average shares (2) | | 102.8 | | | | 91.5 | | | | 66.0 | |
| Effect of dilutive securities: | | | | | | | | | | | |
| Common stock equivalents | | 2.4 | | | | 3.2 | | | | — | |
| 0.25% Convertible Senior Notes due 2022 | | 7.3 | | | | 7.3 | | | | 7.3 | |
| Series A Mandatory Convertible Preferred Stock | | 10.4 | | | | — | | | | — | |
| Diluted weighted average common shares | | 123.0 | | | | 102.0 | | | | 73.3 | |
| | | | | | |
| Basic earnings (loss) per common share on non-GAAP basis | $ | 0.91 | | | $ | 1.29 | | | $ | 0.54 | |
| | | | | | |
| Diluted earnings (loss) per common share on non-GAAP basis(1) | $ | 0.84 | | | $ | 1.18 | | | $ | 0.53 | |
| *Amounts may not recalculate due to rounding. |
| | |
| (1) | Diluted earnings per common share on non-GAAP basis for the September 30, 2019 period have been updated from $0.56, to include the dilutive impact of our outstanding 0.25% convertible senior notes due 2022 (the “2022 convertible senior notes”). |
| (2) | Weighted average shares for the three months ended September 30, 2020 include 10.7 million common shares issued in July 2020 as a result of the underwritten public offering. |
| (3) | Non-GAAP earnings per share for the three months ended September 30, 2019 has been revised to include the tax impact from Finisar purchase accounting adjustments, and conform with current period presentation. |
CONTACT:
Mary Jane Raymond
Treasurer and Chief Financial Officer
[email protected]
www.ii-vi.com/contact-us
EXHIBIT 99.2

Copyright 2020, II - VI Incorporated. All rights reserved. November 2020 Investor Presentation
Page 2 Copyright 2020, II - VI Incorporated. All rights reserved. Safe Harbor Statement This presentation contains forward - looking statements relating to future events and expectations that are based on certain assum ptions and contingencies. The forward - looking statements are made pursuant to the safe harbor provisions of the U.S. Private Securities Litigation Reform Act of 1995 and relate to the Company’s perfor man ce on a going - forward basis. The forward - looking statements in this presentation involve risks and uncertainties, which could cause actual results, performance or trends to differ materially from those expr ess ed in the forward - looking statements herein or in previous disclosures. The Company believes that all forward - looking statements made by it in this presentation have a reasonable basis, but there can be no assurance that management’s expectations, beliefs or projections (including the Company's updated guidance for the second quarter of fiscal 2021 set forth in this presentation) as expressed in the forward - looking statements will actually occur or prove to be correct. In addition to general industry and global economic conditions, factors that could cause actual results to differ materially fro m t hose discussed in the forward - looking statements in this presentation include, but are not limited to: (i) the failure of any one or more of the assumptions stated above to prove to be correct; (ii) the risks re lating to forward - looking statements and other “Risk Factors” discussed in the Company’s Annual Report on Form 10 - K for the fiscal year ended June 30, 2020 and the Company’s other reports filed with the U.S. Securities and Exchange Commission ("SEC"); (iii) the purchasing patterns of customers and end - users; (iv) the timely release of new products, and acceptance of such new products by the market; (v) the int roduction of new products by competitors and other competitive responses; (vi) the Company’s ability to assimilate recently acquired businesses, and risks, costs and uncertainties associated with such acq uis itions; (vii) the Company’s ability to devise and execute strategies to respond to market conditions; (viii) the anticipated use of the net proceeds from the proposed offerings; and/or (ix) the risks of busin ess and economic disruption related to the currently ongoing Coronavirus outbreak and any other worldwide health epidemics and outbreaks that may arise. The Company disclaims any obligation to update information c ontained in these forward - looking statements whether as a result of new information, future events or developments, or otherwise. This presentation contains non - GAAP financial measures and key metrics relating to the Company's past performance. These non - GAA P financial measures are in addition to, and not as a substitute for or superior to measures of financial performance prepared in accordance with U.S. GAAP. There are a number of limitations relate d t o the use of these non - GAAP financial measures versus their nearest GAAP equivalents. For example, other companies may calculate non - GAAP financial measures differently or may use other measures to eva luate their performance, all of which could reduce the usefulness of our non - GAAP financial measures as tools for comparison. As required by Regulation G, we have provided reconciliations of those meas ures to the most directly comparable GAAP measures, which are available in the Appendix.

Company Overview

Page 4 Copyright 2020, II - VI Incorporated. All rights reserved. II - VI at a Glance As of 6/30/2020 FY20 Revenue $2.6B Cash & Equivalents $493M FY20 Free Cash Flow $160M Vertically Integrated Model “TWO SIX” Refers to groups II and VI of the Periodic Table of Elements 18 Countries 75 Locations 22,000+ Employees Core Competency Engineered Materials 1971 Year Founded

Page 5 Copyright 2020, II - VI Incorporated. All rights reserved. Megatrends A world transformed through innovative materials vital to a better life today and the sustainability of future generations Adoption of 3D Sensing Increased Data and Video Consumption Deployment of 5G Wireless Growth in Electric & Autonomous Vehicles Intelligent Mobile Electric Proliferation of Cloud Services
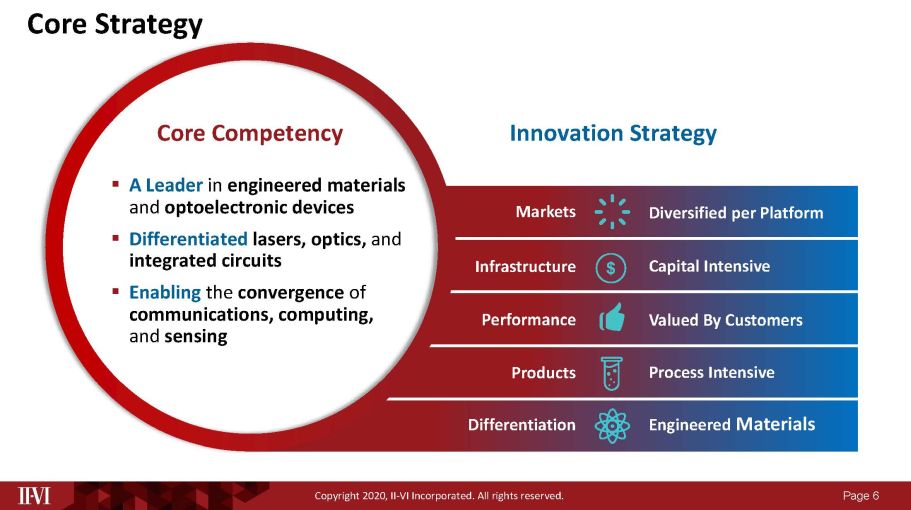
Page 6 Copyright 2020, II - VI Incorporated. All rights reserved. Diversified per Platform Capital Intensive Markets ▪ A Leader in engineered materials and optoelectronic devices ▪ Differentiated lasers, optics, and integrated circuits ▪ Enabling the convergence of communications, computing, and sensing Infrastructure Core Competency Innovation Strategy Engineered Materials Differentiation Valued By Customers Performance Process Intensive Products Core Strategy
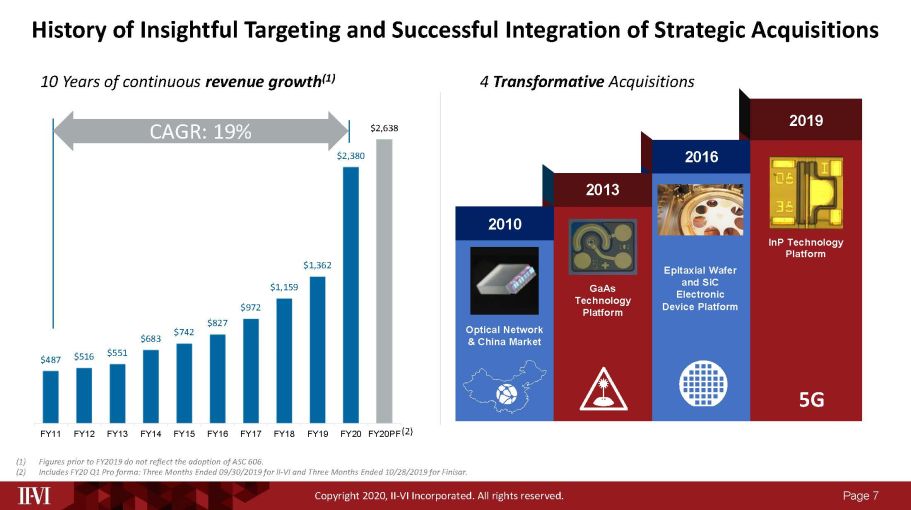
Page 7 Copyright 2020, II - VI Incorporated. All rights reserved. $487 $516 $551 $683 $742 $827 $972 $1,159 $1,362 $2,380 $2,638 FY11 FY12 FY13 FY14 FY15 FY16 FY17 FY18 FY19 FY20 FY20PF 10 Years of continuous revenue growth (1) 4 Transformative Acquisitions Optical Network & China Market InP Technology Platform Epitaxial Wafer and SiC Electronic Device Platform GaAs Technology Platform 2010 2013 2016 2019 History of Insightful Targeting and Successful Integration of Strategic Acquisitions 5G (1) Figures prior to FY2019 do not reflect the adoption of ASC 606. (2) Includes FY20 Q1 Pro forma: Three Months Ended 09/30/2019 for II - VI and Three Months Ended 10/28/2019 for Finisar. (2) CAGR: 19%

Page 8 Copyright 2020, II - VI Incorporated. All rights reserved. Sampling of representative customers based on approvals for public release Thousands of Market Leading Customers Across Diverse Markets

Page 9 Copyright 2020, II - VI Incorporated. All rights reserved. Q1 FY21 Overview $341 $599 $666 $627 $746 $728 Q120 Q1PF* Q220 Q320 Q420 Q121 * Pro Forma Revenue Three Months Ended 09/30/2019 for II - VI and Three Months Ended 10/28/2019 for Finisar. FY20 Revenue by Quarter ($M) 9% 70% Revenue by End Market 5% Semiconductor Capital Equipment 2% Life Science 7% Consumer Electronics 7% Aerospace & Defense 50% 22% 19% 6% 3% Q1 FY21 Revenue $728M Revenue by Region Q1 Guidance: $700 - 750M

Page 10 Copyright 2020, II - VI Incorporated. All rights reserved. $827 $972 $1,159 $1,362 FY2016 FY2017 FY2018 FY2019 Rapid Revenue Growth at Scale Strong Revenue Growth (1) (Pre - Finisar Acquisition) Q1FY21 Increased Efficiencies 11% 18% 19% 18% Note: Dollars in millions. (1) Figures prior to FY2019 do not reflect the adoption of ASC 606. (2) Prepared in accordance to ASC 805. Pro Forma includes the revenue of Finisar in Q1FY20 prior to the acquisition date of 9/2 4/2 0 (3) Estimated range for FY21. See Appendix for reconciliation to most comparable GAAP measures Finisar Acquisition Bolstered Scale Growth PF (2) Q1 FY20 Q1 FY21 $1,362 $2,638 FY2019 PF (2) FY2020 Q1FY21 OpEx as % of Revenue (Without amortization) 28% 22% 31% 40 % Q1FY21 Non - GAAP Gross Margins 38 - 42% (3) 22 - 25% (3) - 600 bps +900 bps

Page 11 Copyright 2020, II - VI Incorporated. All rights reserved. New U.S. Commerce Department Rulings Were Issued During August 2020 Restrictions on Huawei based on product and equipment technology ▪ Products expected to ship by 9/14 were shipped ▪ Effects of the Rule on Q1FY21 were not material based on strong backlog and other demand ▪ For Q2 - Q4 FY21, Huawei expected to be 3% or less of revenue Effects on II - VI:

Page 12 Copyright 2020, II - VI Incorporated. All rights reserved. Remote Radio Head Beam - forming Antenna 5G WIRELESS 4G WIRELESS Bi - Directional Converter/ Inverter/ Electric Motor DC - DC Converter Electric Charger / HV Battery EV/HEV GREEN ENERGY Solar & Wind Energy Smart Grid Power Switching Enabling Mobility & Electrification Ramping silicon carbide substrate capacity 5 - 10x including 200mm as well as qualifying a SiC epitaxial platform over the next 5 years ▪ 100 and 150 mm diameter conductive substrates ▪ 2015: Believed to be world’s first 200 mm conductive substrates ▪ For SiC MOSFET and other power devices ▪ About 10% more driving distance on the same charge POWER ELECTRONICS FOR ELECTRIC VEHICLES ▪ 100 and 150 mm diameter semi - insulating substrates ▪ 2019: Believed to be word’s first 200 mm semi - insulating substrates ▪ For SiC - based GaN HEMT devices ▪ GaN/SiC enables high - bandwidth 5G bands RF ELECTRONICS FOR WIRELESS BASE STATIONS AND RADAR

Page 13 Copyright 2020, II - VI Incorporated. All rights reserved. Advantages of Large Diameter Substrates ▪ Large diameter substrate fabrication cost (per unit area) is reduced significantly ▪ Large diameter wafer availability has helped move SiC - based devices from niche to mainstream ▪ Existing 200 mm silicon wafer fab lines can be used for SiC devices manufacturing 2’’ Wafer Manufacturing 3’’ Wafer Manufacturing 100 mm Wafer Demonstrated High Quality Wafer Manufacturing 150 mm Wafer Demonstrated Manufacturing 02 03 04 05 06 07 08 09 10 11 12 13 14 15 16 17 18 19 World First 200 mm Wafer Demonstrated 4H n - Type 6H SI Major Capacity Expansion Two Decades of SiC Materials Innovation

Page 14 Copyright 2020, II - VI Incorporated. All rights reserved. New Ventures & Wide - Bandgap Electronics Technology SiC Modules GE Technology SiC Epiwafers Ascatron SiC Chips GE Technology Ascatron INNOViON SiC Devices GE Technology Ascatron Vertical Integration SiC Substrates Legacy II - VI Significant SiC Market Opportunity (1) ($bn) (1) Internal company estimates. Includes module and device TAM. $0.5 $30+ 2020 2030 A vertically integrated SiC power electronics technology organization Announced on October 3, 2020:

Page 15 Copyright 2020, II - VI Incorporated. All rights reserved. Addressing Multiple and Strong Growing Markets Aerospace & Defense RF and Power Electronics Optical Communications 3D Sensing & LiDAR $7.5B CY25 Market For 3D sensing in consumer electronics & LiDAR in automotive For terrestrial, undersea, wireless optical infrastructure and datacenters 14% CY20 - 25 CAGR $6.2B For electric vehicles, smart power grids and 4G/5G RF antennas 24% For F35, contested space, directed energy and hypersonics $22B 24% GaAs | InP | LCoS GaAs | InP GaAs | Sapphire Source : Ovum, LightCounting, Cignal AI, Internal Estimates $14B 13% SiC | GaN/SiC | Diamond Source : Morgan Stanley, Forbes, Yole, IDC Source : Yole, Strategy Analytics, LightCounting (includes devices) Source : Internal estimates

Page 16 Copyright 2020, II - VI Incorporated. All rights reserved. 5G RADIO ACCESS 5G OPTICAL ACCESS Backbone Network Front - & Backhaul Network Base Stations Handsets Photonic Solutions Segment Compound Semiconductors Segments GaAs RF GaN/SiC RF Line Cards Amplifiers OCM/OTDR LPC WSS Subsystems Bidi DWDM TRx 100G BH TRx 25G FH TRx HPC WSS Coherent TRx DWDM Filters II - VI Finisar Growth Opportunities in 5G Mobile Infrastructure Mobile subscribers quickly migrating to 5G Carriers rearchitecting their networks for 5G Accelerated need to deploy new 5G infrastructure worldwide

Page 17 Copyright 2020, II - VI Incorporated. All rights reserved. Datacom Components Telecom Components ▪ 25G and 50G DFB Lasers ▪ 50G and 100G EML ▪ Lasers for Silicon Photonics Externally Modulated Laser (EML) Externally Modulated Tunable Laser ▪ 10G and 25G Tunable Lasers ▪ InP IQ Modulators ▪ Dual High - Speed Coherent Detectors ▪ Leveraging our existing sales channels in the transceiver market to drive InP component revenue ▪ Leveraging our proven ability to successfully market both components and modules ▪ Target the right mix of components and high speed modules to enhance gross margins MARKET STRATEGY Hyperscale Datacenters 5G Optical Infrastructure Coherent Transmission Indium Phosphide Devices: Upside to TAM Gross Margins

Page 18 Copyright 2020, II - VI Incorporated. All rights reserved. ▪ Market drivers • Face biometrics, auto - focus, augmented reality, automotive in - cabin & LiDAR, machine vision ▪ GaAs compound semiconductors technology platform on 6 - inch • Warren, NJ: Shipped hundreds of millions of 3D sensing VSCEL arrays since 2017 • Sherman, TX : Shipping 3D Sensing VCSEL arrays in high volume since early 2020 • Zurich, Switzerland : Edge emitters on 6 - inch in volume production in 2020 • Vertically integrated : Epitaxial growth, device fabrication and automated wafer testing ▪ Broad portfolio of products: Lasers, detectors, optics & integrated circuits • Integration and miniaturization capabilities WIDE INCIDENCE ANGLE MIRRORS GaAs VCSEL ARRAYS 940 GaAs EDGE - EMITTING LASERS 3D Sensing & LiDAR DIFFRACTIVE OPTICAL ELEMENTS (DOE) DIFFRACTIVE OPTICS - FLAT LENSES DIFFRACTIVE OPTICS - DIFFUSERS

Page 19 Copyright 2020, II - VI Incorporated. All rights reserved. CO2 LASER OPTICS FUSED SILICA LASER OPTICS SAPPHIRE LASER OPTICS DEFORMABLE MIRORS LASER MODULES LASER BARS DIRECT DIODE LASERS LASER LIGHT CABLES CUTTING HEADS WELDING HEADS Lasers for Materials Processing & EUV Strong demand for laser processing heads and EUV lithography ELECTRIC VEHICLE BATTERY MANUFACTURING Remote laser welding heads assisted by machine vision software AUTOMATION Laser processes adapted to most joining tasks on the cell, module, pack, and frame levels FULL LINE SUPPLIER OF MATERIALS, COMPONENTS AND SUBSYSTEMS FOR HIGH POWER LASERS

Page 20 Copyright 2020, II - VI Incorporated. All rights reserved. Significant new opportunities ahead with strong channels to the market STRONG ABILITY TO DIFFERENTIATE THE END SOLUTION Advanced Materials Semiconductor Lasers Electro - Optic Subsystems MARKETS PRODUCTS DIFFERENTIATORS Intelligence Surveillance & Reconnaissance ▪ IR sensors ▪ Windows and lenses ▪ Sapphire enclosures Dedicated vertically integrated facilities Contested Space ▪ Telescopes ▪ Imaging lenses 30+ year of design, fabrication, and launch of products Directed Energy ▪ Laser subsystems ▪ Beam directors ▪ Fiber amplifiers Supplier of key laser weapons components and subsystems Hypersonics ▪ Nose cones ▪ Seeker optics Qualified proprietary coatings and patterning Phased Array Laser Optics Aerospace & Defense

Page 21 Copyright 2020, II - VI Incorporated. All rights reserved. Life Sciences Gene Sequencing and Testing for COVID - 19 with Lasers, Optics, and Thermoelectrics II - VI plays an important role in the supply chain for Polymerase Chain Reaction (PCR) Instruments that can determine the outcome of patient testing for COVID - 19 . We are expanding capacity for key components BIOTECHNOLOGY MEDICAL SCIENTIFIC

Page 22 Copyright 2020, II - VI Incorporated. All rights reserved. COVID - 19 Has Accelerated II - VI’s Secular Tailwinds Driving Increasing Demand for Connectivity and High - Performance Infrastructure Video Conferencing Life Sciences / Diagnostics Content Streaming 5G Smart Power Energy Efficiency Work - From - Home II - VI is enabling the convergence of communications, computing, and sensing

Financial Overview

Page 24 Copyright 2020, II - VI Incorporated. All rights reserved. Attractive and Increasing Gross and Operating Margins (1) All non - GAAP amounts exclude certain adjustments for share - based compensation, acquired intangible amortization expense, certain one - time transaction expenses, debt extinguishment expense, fair value measurement period adjustments and restructuring and related items. See Appendix for reconciliation to most comparable GAAP measures (2) II - VI figures are for the three months ended September 30, 2019 and Finisar figures are for the three months ended July 28, 2019 . Strong Execution and Synergy Realization Post Finisar Transaction Close Driving Margins Non - GAAP Gross Margin (1) Non - GAAP Operating Margin (1) 38% 31% 38% Last Quarter Before Close (2) Q3 FY20 Q4 FY20 42% Q1 FY21 40 % 16 % 9 % 13 % Last Quarter Before Close (2) Q3 FY20 Q4 FY20 17 % Q1 FY21 19%

Page 25 Copyright 2020, II - VI Incorporated. All rights reserved. Significant Value Creation Potential from Synergies Original Est. Synergies Within 36 months 12 month Annual Run Rate Synergies Achieved Cost of Goods Sold ▪ Supply chain management - Procurement ▪ Infeed - Internal supply of enabling materials and components ~$85 M ~$42 M Research & Development ▪ More efficient R&D with scale ▪ Complementary engineering and design teams ~$65 M ~$38 M General & Administration ▪ Consolidation of overlapping corporate costs ▪ Optimization of operating model Sales & Marketing ▪ Savings from scale TOTAL ~$150 M ~$80 M Annual Run Rate refers to total savings achieved in full 12 month period. As of 9/30/2020: Total estimated synergies of $150M achievable in 30 months instead of 36 months

Page 26 Copyright 2020, II - VI Incorporated. All rights reserved. Key Takeaways One of the Largest Photonics and Compound Semiconductor Companies 1 Materials Expertise Drives Differentiation in Multiple Growing Markets 2 Vertically Integrated, Diverse Global Manufacturing Footprint 3 History of Insightful Targeting and Successful Integration of Strategic Acquisitions 4 Strong Execution: Integration and Synergies Ahead of Plan; Resilient Growth 5

Page 27 Copyright 2020, II - VI Incorporated. All rights reserved. Transaction Overview Appendix
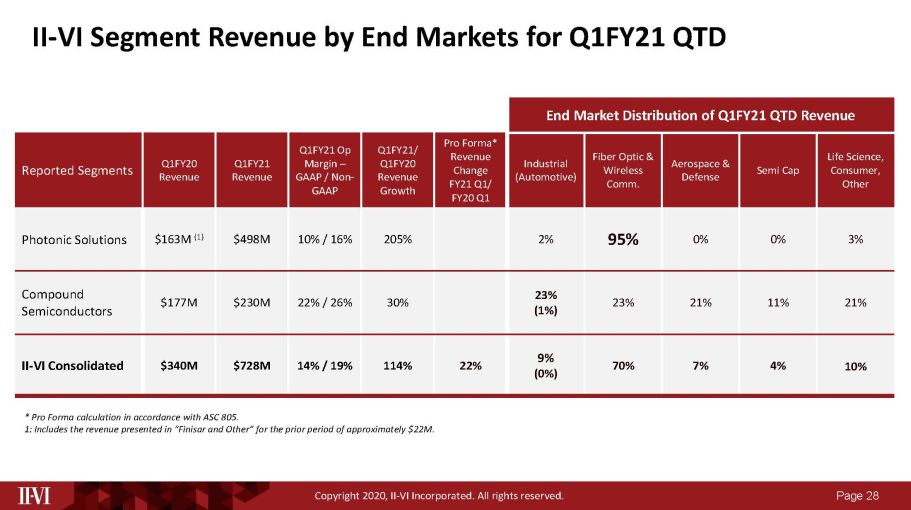
Page 28 Copyright 2020, II - VI Incorporated. All rights reserved. End Market Distribution of Q1FY21 QTD Revenue Reported Segments Q1FY20 Revenue Q1FY21 Revenue Q1FY21 Op Margin – GAAP / Non - GAAP Q1FY21/ Q1FY20 Revenue Growth Pro Forma* Revenue Change FY21 Q1/ FY20 Q1 Industrial (Automotive) Fiber O ptic & Wireless Comm. Aerospace & Defense Semi Cap Life Science, Consumer, Other Photonic Solutions $163M (1) $498M 10% / 16% 205% 2% 95% 0% 0% 3% Compound Semiconductors $177M $230M 22% / 26% 30% 23% (1%) 23% 21% 11% 21% II - VI Consolidated $340M $728M 14% / 19% 114% 22% 9% (0%) 70% 7% 4% 10% II - VI Segment Revenue by End Markets for Q1FY21 QTD * Pro Forma calculation in accordance with ASC 805. 1: Includes the revenue presented in “Finisar and Other” for the prior period of approximately $22M.

Page 29 Copyright 2020, II - VI Incorporated. All rights reserved. End Market Distribution of Full Year FY20 Revenue Reported Segments FY20 Revenue FYY20 Op Margin – GAAP / Non - GAAP FY20/FY19 Revenue Growth Industrial (Automotive) Fiber O ptic & Wireless Comm. Aerospace & Defense Semi Cap Life Science, Consumer, Other Photonic Solutions $1,537M 3% / 15% 141% 3% 94% 0% 1% 2% Compound Semiconductors $821M 8% / 12% 13% 29% (1%) 15% 21% 12% 23% Unallocated $22.1M N/A N/A 98% 2% II - VI Consolidated $2,380M 2% / 14% 75% 12% (0%) 67% 7% 5% 9% II - VI Segment Revenue by End Markets for Full Year FY20

Page 30 Copyright 2020, II - VI Incorporated. All rights reserved. Note: Dollars in millions. Q1 FY20 represents quarter ending October July 28, 2019. Reconciliation of GAAP Measures to Non - GAAP Measures Three Months Ended 7/28/19 (Last Finisar Stand Alone Report) Finisar Q1 FY20 Revenue 285.0$ GAAP Gross Profit 85.3$ Amortizationof required technology 0.5$ Stock compensation 2.9$ Impairment of long-lived/intangible assets 1.7$ Write off discontinued product inventory (1.8)$ Non-GAAP Gross Profit 88.6$ Non-GAAP Gross Margin 31% GAAP Operating Income (Loss) (9.5)$ Total cost of revenue adjustment 3.4$ Reduction in force costs and other restructuring 0.1$ Stock compensation 12.8$ Acquisition related costs 1.1$ Amortization of purchased intangibles 0.2$ Startup costs 17.1$ Non-GAAP Operating Income 25.1$ Non-GAAP Operating Margin 9%

Page 31 Copyright 2020, II - VI Incorporated. All rights reserved. Reconciliation of GAAP Measures to Non - GAAP Measures

Page 32 Copyright 2020, II - VI Incorporated. All rights reserved. Reconciliation of GAAP Measures to Non - GAAP Measures
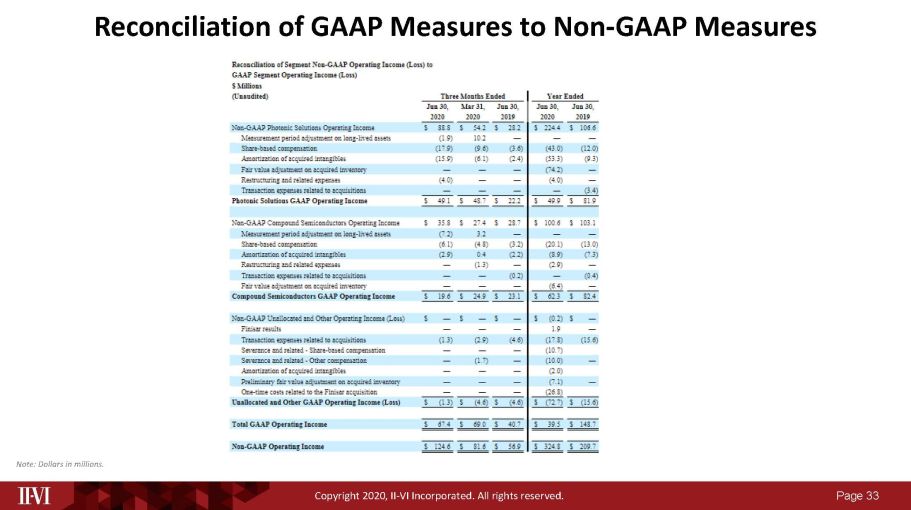
Page 33 Copyright 2020, II - VI Incorporated. All rights reserved. Note: Dollars in millions. Reconciliation of GAAP Measures to Non - GAAP Measures
