Exhibit 99.1


|
PRESS RELEASE | II-VI Incorporated | ||||||
| 375 Saxonburg Boulevard | ||||||||
| Saxonburg, PA 16056 | ||||||||
II-VI Incorporated Reports Fiscal 2022 First Quarter Results
Record Quarterly Bookings and Backlog Drive Organic Growth
Approaching $1B Quarterly Bookings While Investing for Increasing Market Demand
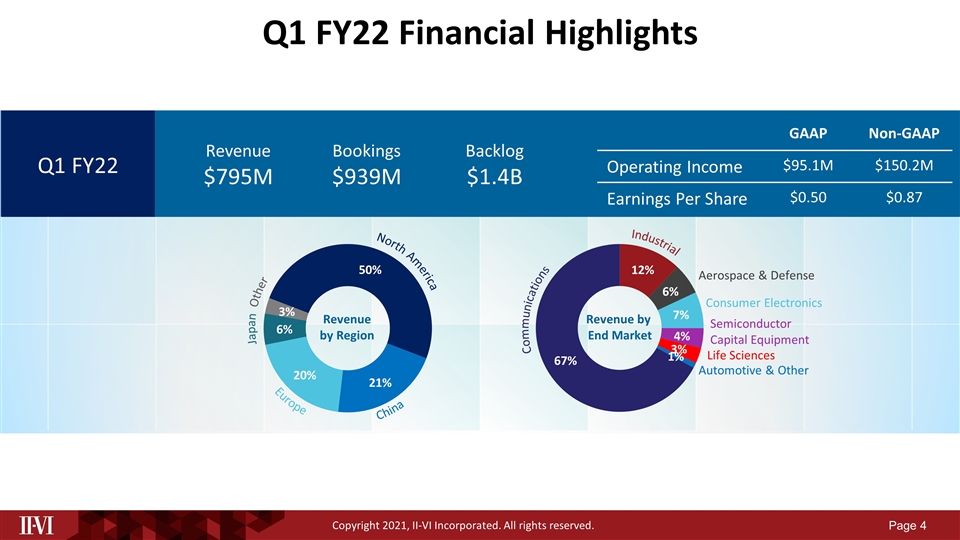
| • | Record Bookings of $939 million grew 43% year over year |
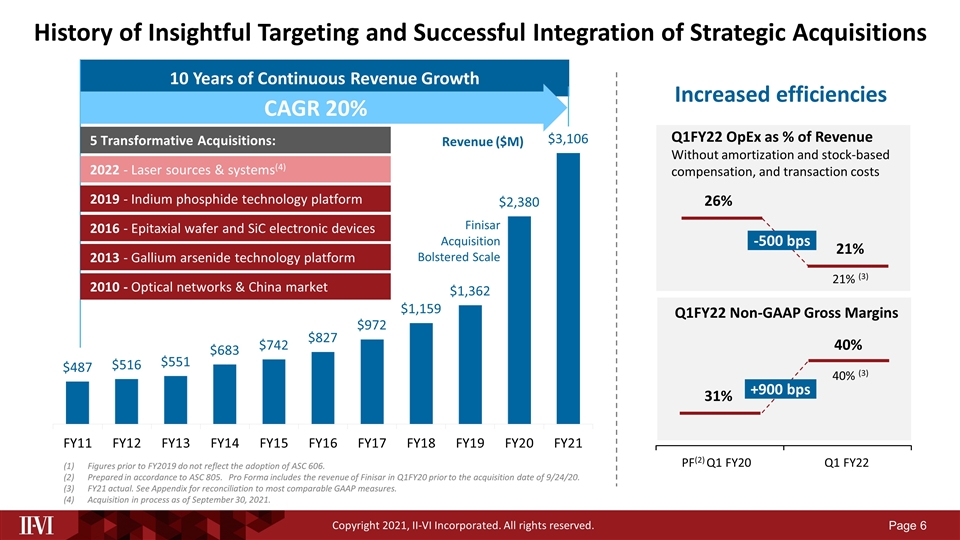
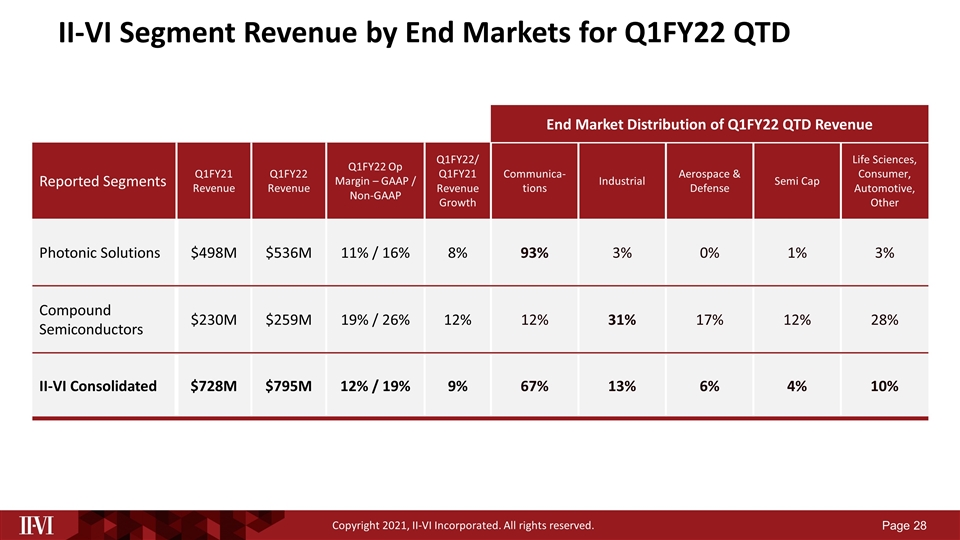
| • | Revenue of $795 million grew 9% year over year |
| • | Record Backlog of $1.4 billion |
| • | GAAP Net Earnings of $75 million |
| • | GAAP EPS of $0.50 grew 32% year over year |
| • | Non-GAAP EPS of $0.87 grew 4% year over year |
| • | Non-GAAP return on sales of 14.8% grew 7% year over year |
PITTSBURGH, November 9, 2021 (GLOBE NEWSWIRE) — II-VI Incorporated (Nasdaq:IIVI) (“II-VI,” “We” or the “Company”) today reported results for its fiscal 2022 first quarter ended September 30, 2021.
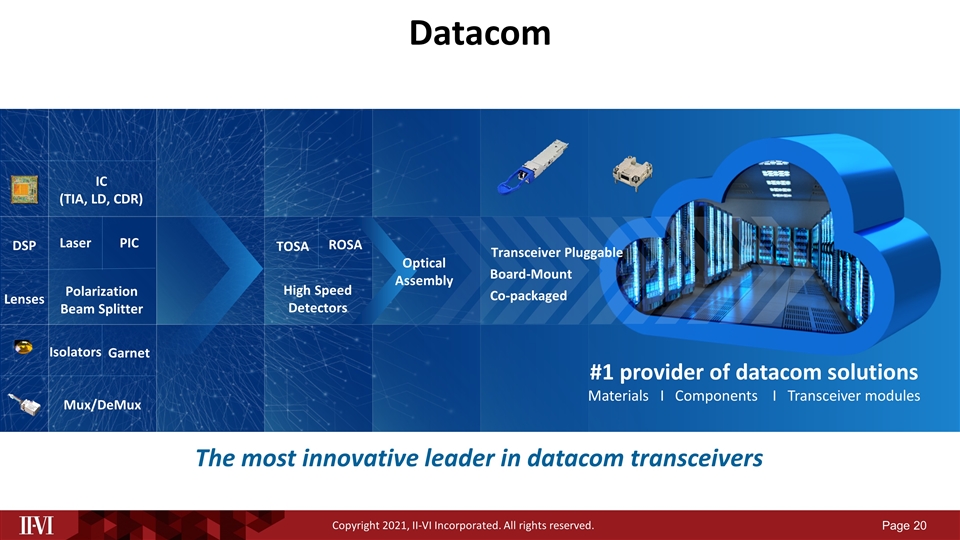
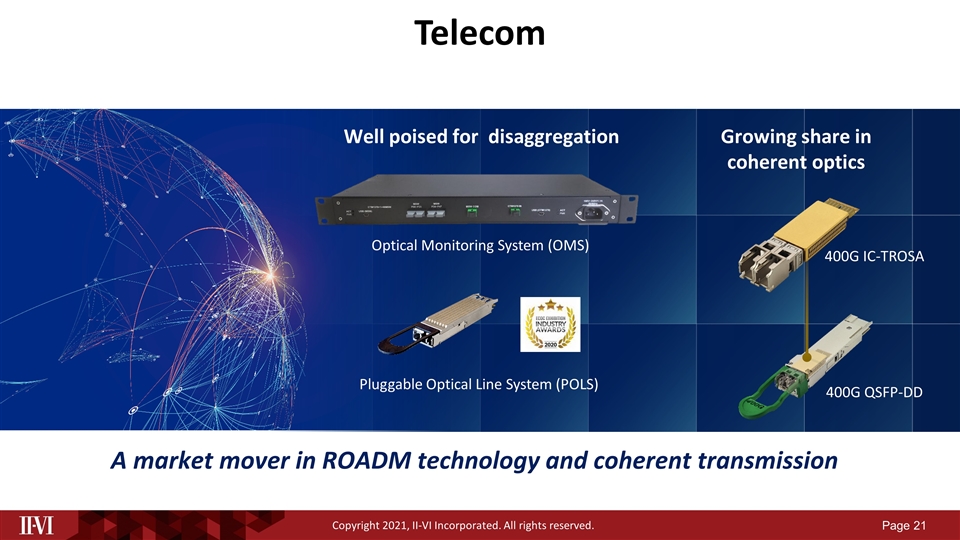
“Fiscal year 2022 is starting with very strong momentum and sustainable demand signals that translated into another quarterly bookings record of $939 million and record backlog of $1.4 billion. We achieved $795 million in revenue, driven by year-over-year growth in virtually all our end markets. The quarter saw very strong performance in our Industrial business, growing in excess of 50% compared to Q1FY21. Moreover, our high speed 200/400/800G datacom and telecom revenues have significantly accelerated, growing nearly 70% sequentially. This growth was underpinned by our industry leading laser diode technologies that enabled the highest output power 400G coherent pluggable transceivers available in the marketplace,” said Dr. Vincent D. Mattera, Jr., Chief Executive.
Dr. Mattera continued, “Our customers are growing and demanding much more from us as the end markets we serve and the mega-market trends driving them, continue to accelerate. We are looking ahead and aggressively investing to serve these transformative and sustainable market trends consistent with our strategic plan.
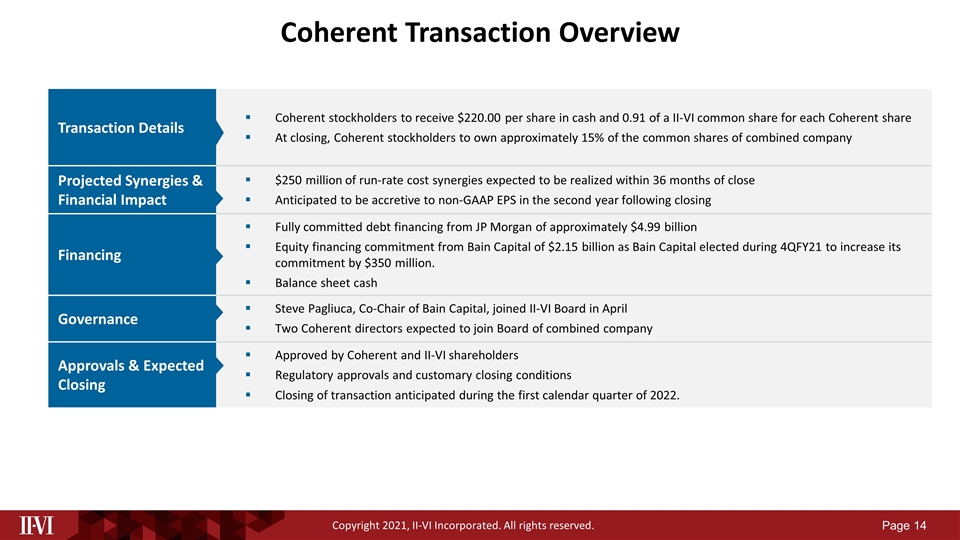
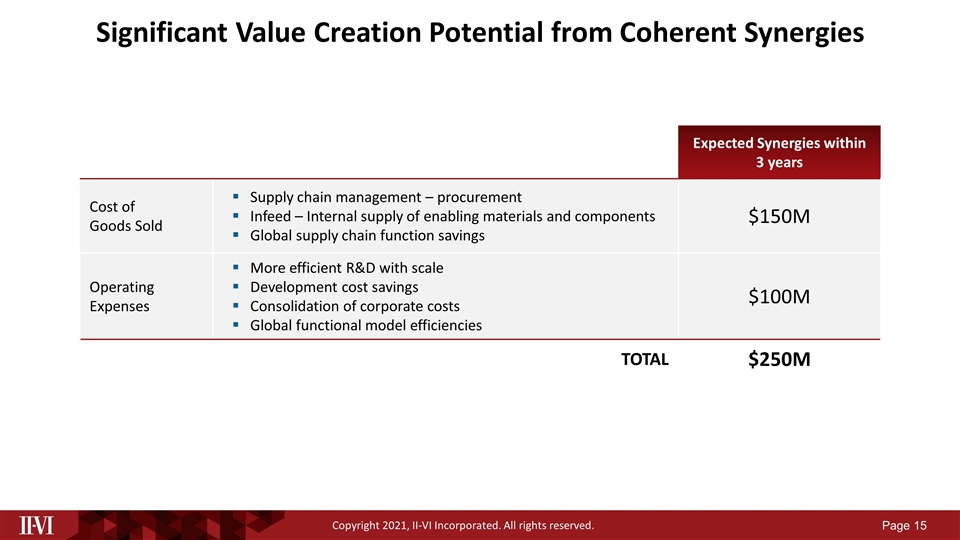
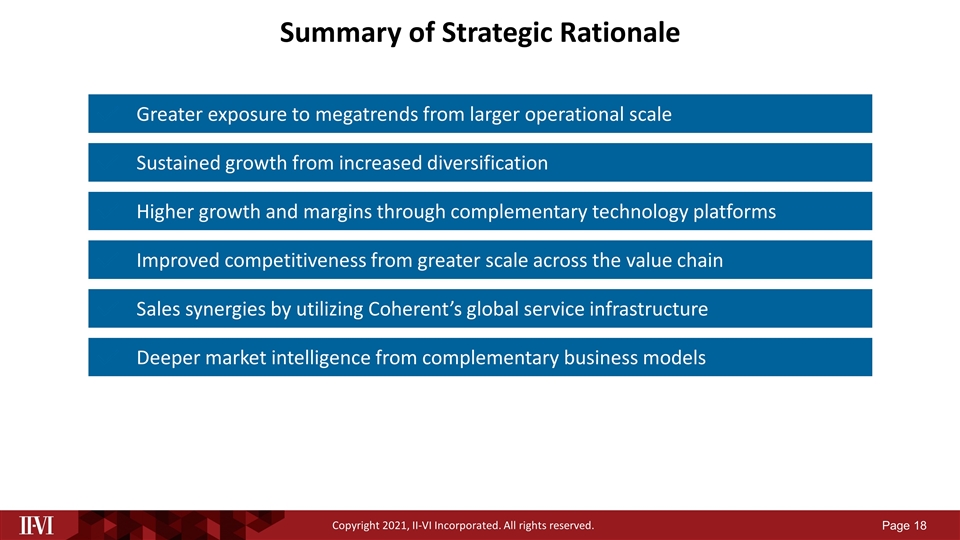
“Our integration planning with Coherent is well underway, and we are even more excited about this transaction than we were six months ago. All integration planning teams are fully engaged and excited about the prospect of combining our complementary talent, technology platforms, and scale across the value chain. All remaining regulatory reviews are progressing on track, with China having formally commenced its review process in September. We continue to expect the transaction to close during the first calendar quarter of 2022. Our synergies on the Finisar transaction now exceed $180M, which are well ahead of schedule,” concluded Dr. Mattera.
T. 724.352.4455 | ii-vi.com
Page 1
|
|
PRESS RELEASE | II-VI Incorporated | ||||||||
| 375 Saxonburg Boulevard | ||||||||||
| Saxonburg, PA 16056 | ||||||||||
Table 1
Financial Metrics
$ Millions, except per share amounts and %
(Unaudited)
| Three Months Ended | ||||||||||||
| Sept 30, 2021 |
Jun 30, 2021 |
Sept 30, 2020 |
||||||||||
| Revenues |
$ | 795.1 | $ | 808.0 | $ | 728.1 | ||||||
| GAAP Gross Profit |
$ | 316.2 | $ | 307.6 | $ | 286.6 | ||||||
| Non-GAAP Gross Profit (2) |
$ | 317.7 | $ | 311.7 | $ | 288.4 | ||||||
| GAAP Operating Income (1) |
$ | 95.1 | $ | 97.1 | $ | 101.1 | ||||||
| Non-GAAP Operating Income (2) |
$ | 150.2 | $ | 148.5 | $ | 138.9 | ||||||
| GAAP Net Earnings |
$ | 74.5 | $ | 82.3 | $ | 46.3 | ||||||
| Non-GAAP Net Earnings (2) |
$ | 117.7 | $ | 117.0 | $ | 100.4 | ||||||
| GAAP Diluted Earnings Per Share |
$ | 0.50 | $ | 0.59 | $ | 0.38 | ||||||
| Non-GAAP Diluted Earnings Per Share (2) |
$ | 0.87 | $ | 0.88 | $ | 0.84 | ||||||
| Other Selected Financial Metrics |
||||||||||||
| GAAP Gross margin |
39.8 | % | 38.1 | % | 39.4 | % | ||||||
| Non-GAAP gross margin (2) |
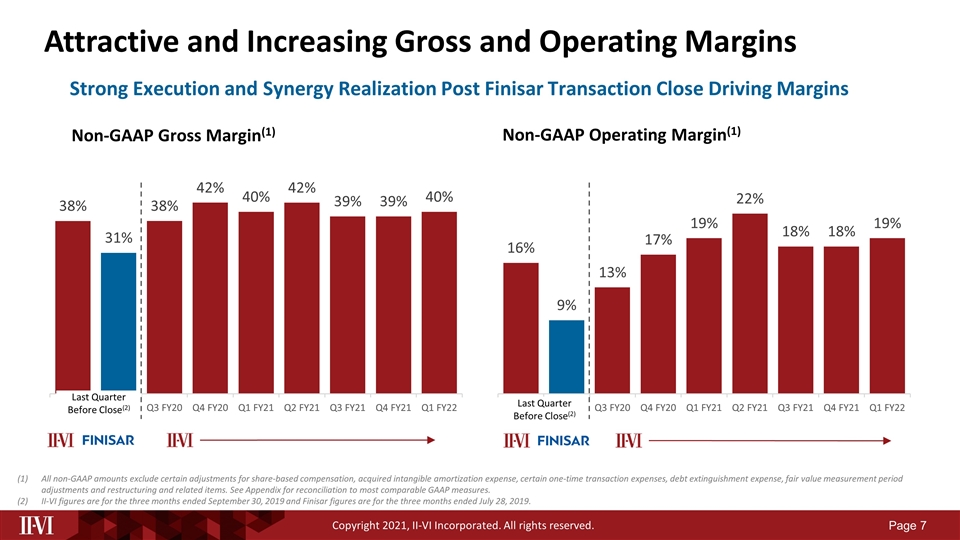
40.0 | % | 38.6 | % | 39.6 | % | ||||||
| GAAP Operating margin |
12.0 | % | 12.0 | % | 13.9 | % | ||||||
| Non-GAAP operating margin (2) |
18.9 | % | 18.4 | % | 19.1 | % | ||||||
| GAAP Return on sales |
9.4 | % | 10.2 | % | 6.4 | % | ||||||
| Non-GAAP return on sales (2) |
14.8 | % | 14.5 | % | 13.8 | % | ||||||
| (1) | GAAP Operating income is defined as earnings before income taxes, interest expense and other expense or income, net. |
| (2) | All non-GAAP amounts exclude certain adjustments for share-based compensation, acquired intangible amortization expense, certain one-time transaction expenses, and restructuring and related items. See Table 4 for the Reconciliation of GAAP measures to non-GAAP measures. |
T. 724.352.4455 | ii-vi.com
Page 2
|
|
PRESS RELEASE | II-VI Incorporated | ||||||
| 375 Saxonburg Boulevard | ||||||||
| Saxonburg, PA 16056 | ||||||||
Outlook
The outlook for the second fiscal quarter ending December 31, 2021 is revenue of $790 million to $840 million and earnings per diluted share on a non-GAAP basis of $0.75 to $0.95. This is at today’s exchange rate and today’s estimated tax impact of 19%. Both of these are subject to variability. For the non-GAAP earnings per share, we added back to the GAAP earnings pre-tax amounts of $21 million in amortization, $19 million in share-based compensation, and $21-26 million in transaction, integration and other related costs. Refer to page 16 for the share count range for the aforementioned outlook. Non-GAAP adjustments are by their nature highly volatile and we have low visibility as to the range that may be incurred in the future.
Conference Call & Webcast Information
The Company will host a conference call at 9:00 a.m. Eastern Time on Tuesday November 9, 2021 to discuss these results. Individuals wishing to participate in the webcast can access the event at the Company’s web site by visiting www.ii-vi.com or via https://tinyurl.com/IIVIQ1FY22EarningsRelease. If you wish to participate in the call, please dial +1 734-385-4977 or 877-316-5288. When you call, please enter Confirmation Code 1150469 and provide your name and company affiliation.
The call will be recorded, and a replay will be available to interested parties who are unable to attend the live event. This service will be available up to 11:59 p.m. EST on Friday, November 12, 2021, by dialing +1 734-385-4977 or 877-316-5288 and entering the ID number 1150469.
About II-VI Incorporated
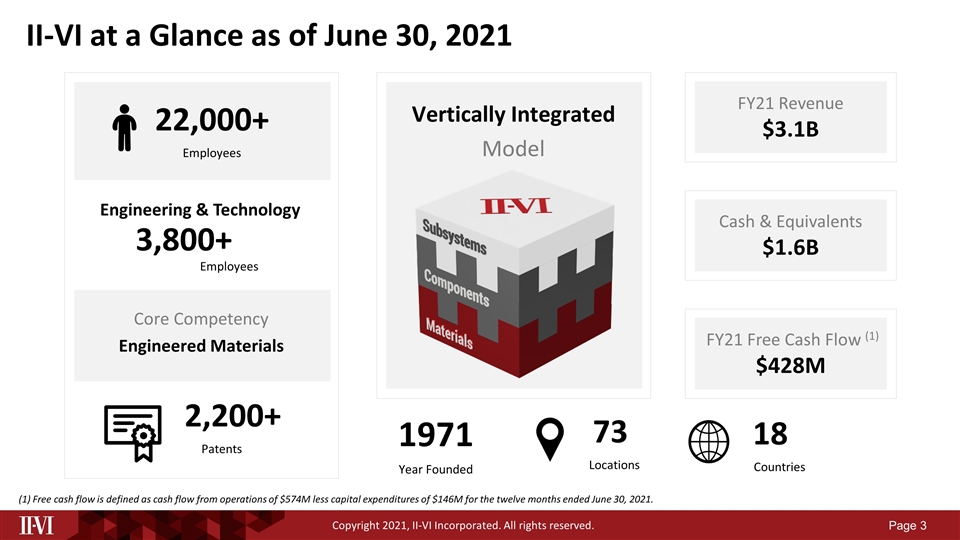
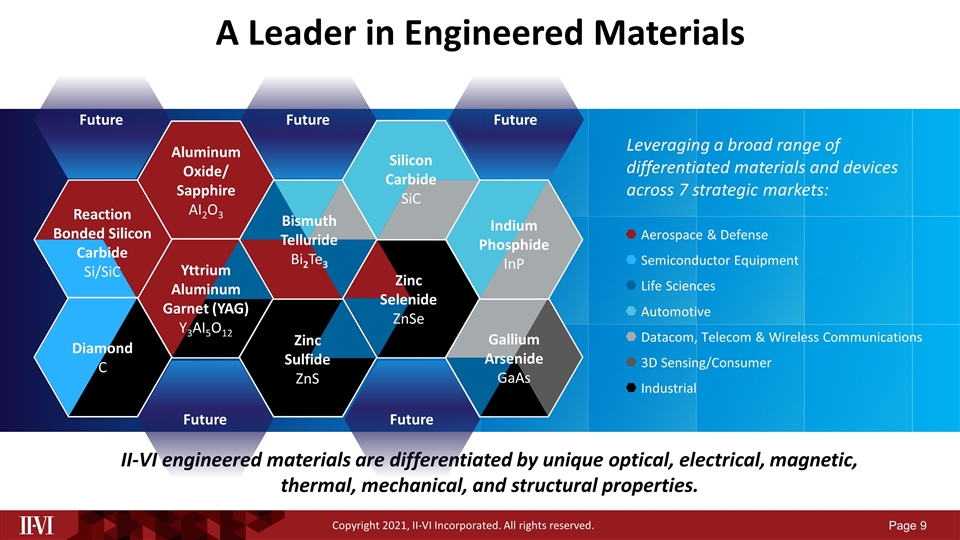
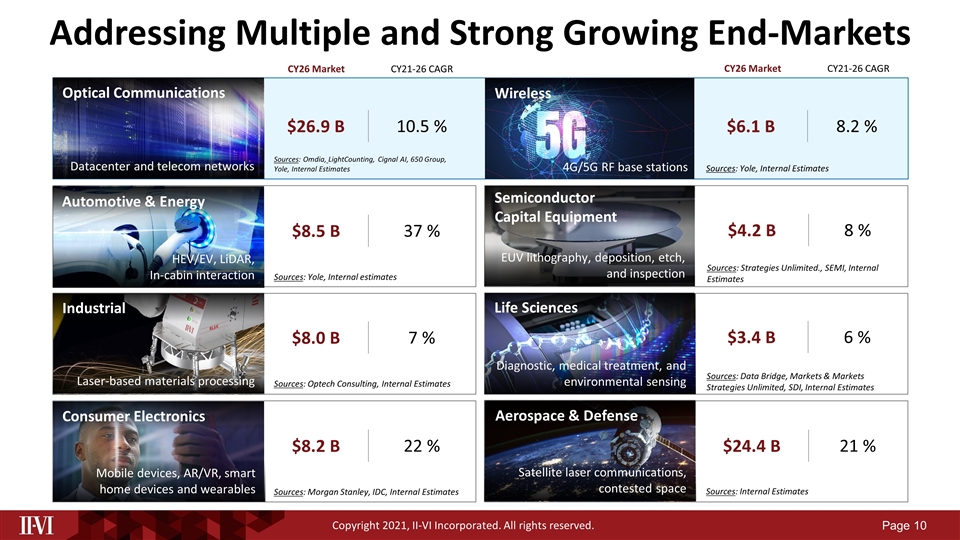
II-VI Incorporated, a global leader in engineered materials and optoelectronic components, is a vertically integrated manufacturing company that develops innovative products for diversified applications in communications, industrial, aerospace & defense, semiconductor capital equipment, life sciences, consumer electronics, and automotive markets. Headquartered in Saxonburg, Pennsylvania, the Company has research and development, manufacturing, sales, service, and distribution facilities worldwide. The Company produces a wide variety of application-specific photonic and electronic materials and components, and deploys them in various forms, including integrated with advanced software to support our customers. For more information, please visit us at www.ii-vi.com.
Forward-looking Statements
This press release contains forward-looking statements relating to future events and expectations that are based on certain assumptions and contingencies. The forward-looking statements are made pursuant to the safe harbor provisions of the U.S. Private Securities Litigation Reform Act of 1995 and relate to the Company’s performance on a going-forward basis. The forward-looking statements in this press release involve risks and uncertainties, which could cause actual results, performance, or trends to differ materially from those expressed in the forward-looking statements herein or in previous disclosures.
The Company believes that all forward-looking statements made by it in this press release have a reasonable basis, but there can be no assurance that management’s expectations, beliefs, or projections as expressed in the forward-looking statements will actually occur or prove to be correct. In addition to general industry and global economic conditions, factors that could cause actual results to differ materially from those discussed in the forward-looking statements in this press release include but are not limited to: (i) the failure of any one or more of the assumptions
T. 724.352.4455 | ii-vi.com
Page 3
|
|
PRESS RELEASE | II-VI Incorporated | ||||||
| 375 Saxonburg Boulevard | ||||||||
| Saxonburg, PA 16056 | ||||||||
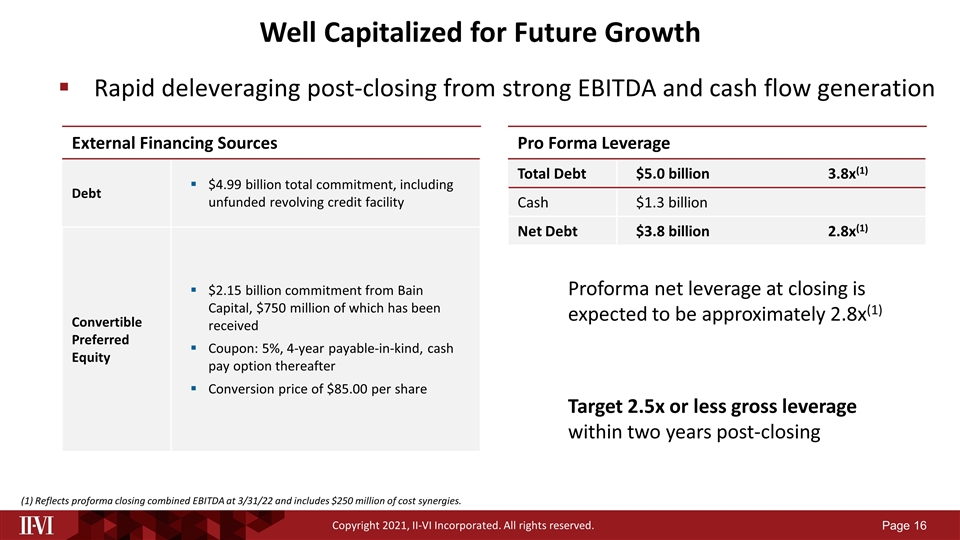
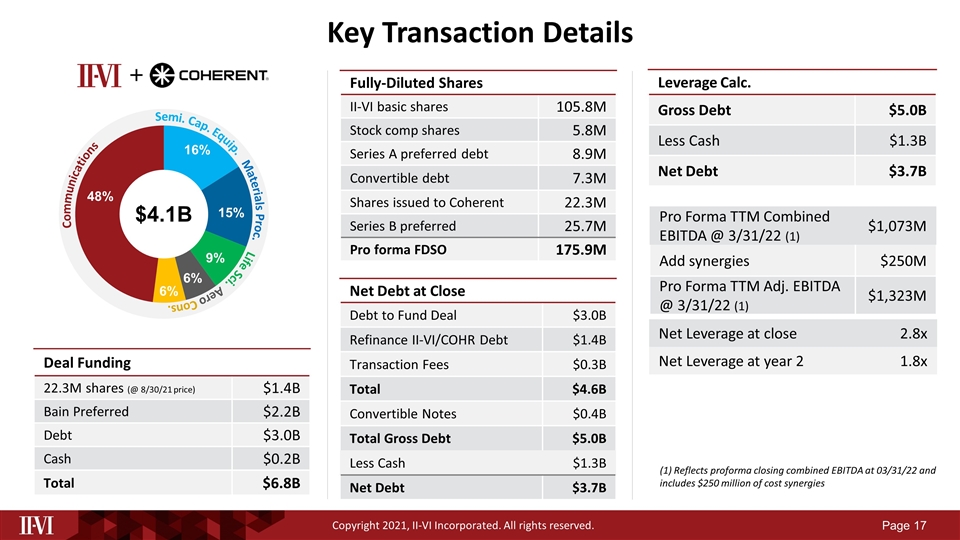
stated above to prove to be correct; (ii) the risks relating to forward-looking statements and other “Risk Factors” discussed in the Company’s Annual Report on Form 10-K for the fiscal year ended June 30, 2021 and additional risk factors that may be identified from time to time in future filings of the Company; (iii) the conditions to the completion of the Company’s pending business combination transaction with Coherent, Inc. (the “Transaction”) and the remaining equity investment by Bain Capital, LP, including the receipt of any required shareholder and regulatory approvals, and the risks that those conditions will not be satisfied in a timely manner or at all; (iv) the occurrence of any event, change or other circumstances that could give rise to an amendment or termination of the merger agreement relating to the Transaction, including the receipt by Coherent, Inc. (“Coherent”) of an unsolicited proposal from a third party; (v) the Company’s ability to finance the Transaction, the substantial indebtedness the Company expects to incur in connection with the Transaction and the need to generate sufficient cash flows to service and repay such debt; (vi) the possibility that the Company may be unable to achieve expected synergies, operating efficiencies and other benefits within the expected time-frames or at all and to successfully integrate Coherent’s operations with those of the Company; (vii) the possibility that such integration may be more difficult, time-consuming or costly than expected or that operating costs and business disruption (including, without limitation, disruptions in relationships with employees, customers or suppliers) may be greater than expected in connection with the Transaction; (viii) litigation and any unexpected costs, charges or expenses resulting from the Transaction; (ix) the risk that disruption from the Transaction materially and adversely affects the respective businesses and operations of the Company and Coherent; (x) potential adverse reactions or changes to business relationships resulting from the announcement, pendency or completion of the Transaction; (xi) the ability of the Company to retain and hire key employees; (xii) the purchasing patterns of customers and end users; (xiii) the timely release of new products, and acceptance of such new products by the market; (xiv) the introduction of new products by competitors and other competitive responses; (xv) the Company’s ability to assimilate recently acquired businesses, and realize synergies, cost savings, and opportunities for growth in connection therewith, together with the risks, costs, and uncertainties associated with such acquisitions; (xvi) the Company’s ability to devise and execute strategies to respond to market conditions; (xviii) the risks to realizing the benefits of investments in R&D and commercialization of innovations; (xix) the risks that the Company’s stock price will not trade in line with industrial technology leaders; and/or (xx) the risks of business and economic disruption related to the currently ongoing COVID-19 outbreak and any other worldwide health epidemics or outbreaks that may arise. The Company disclaims any obligation to update information contained in these forward-looking statements, whether as a result of new information, future events or developments, or otherwise.
These risks, as well as other risks associated with the proposed transaction, are more fully discussed in the joint proxy statement/prospectus included in the registration statement on Form S-4 (File No. 333-255547) filed with the SEC in connection with the Transaction (the “Form S-4”). While the list of factors discussed above and the list of factors presented in the Form S-4 are considered representative, no such list should be considered to be a complete statement of all potential risks and uncertainties. Unlisted factors may present significant additional obstacles to the realization of forward looking statements. Neither the Company nor Coherent assumes any obligation to publicly provide revisions or updates to any forward looking statements, whether as a result of new information, future developments or otherwise, should circumstances change, except as otherwise required by securities and other applicable laws.
Use of Non-GAAP Financial Measures
The Company has disclosed financial measurements in this press release that present financial information considered to be non-GAAP financial measures. These measurements are not a substitute for GAAP measurements, although the Company’s management uses these measurements as an aid in monitoring the Company’s on-going financial performance. The non-GAAP net earnings, the non-GAAP earnings per share, the non-GAAP operating income, the non-GAAP gross profit, the non-GAAP internal research and development, the non-GAAP selling, general and administration, the non-GAAP interest and other (income) expense, and the non-GAAP income tax (benefit), measure earnings and operating income (loss), respectively, excluding non-recurring or unusual items that
T. 724.352.4455 | ii-vi.com
Page 4
|
|
PRESS RELEASE | II-VI Incorporated | ||||||
| 375 Saxonburg Boulevard | ||||||||
| Saxonburg, PA 16056 | ||||||||
are considered by management to be outside the Company’s standard operation and excluding certain non-cash items. EBITDA is an adjusted non-GAAP financial measurement that is considered by management to be useful in measuring the profitability between companies within the industry by reflecting operating results of the Company excluding non-operating factors. There are limitations associated with the use of non-GAAP financial measures, including that such measures may not be entirely comparable to similarly titled measures used by other companies, due to potential differences among calculation methodologies. Thus, there can be no assurance whether (i) items excluded from the non-GAAP financial measures will occur in the future or (ii) there will be cash costs associated with items excluded from the non-GAAP financial measures. The Company compensates for these limitations by using these non-GAAP financial measures as supplements to GAAP financial measures and by providing the reconciliations of the non-GAAP financial measures to their most comparable GAAP financial measures. Investors should consider adjusted measures in addition to, and not as a substitute for, or superior to, financial performance measures prepared in accordance with GAAP.
T. 724.352.4455 | ii-vi.com
Page 5
II-VI Incorporated and Subsidiaries
Condensed Consolidated Statements of Earnings (Unaudited)
($000 except per share data)
| Three Months Ended | ||||||||
| September 30, 2021 |
September 30, 2020 |
|||||||
| Revenues |
$ | 795,111 | $ | 728,084 | ||||
| Costs, Expenses & Other Expense |
||||||||
| Cost of goods sold |
478,921 | 441,520 | ||||||
| Internal research and development |
88,966 | 78,248 | ||||||
| Selling, general and administrative |
132,174 | 107,186 | ||||||
| Interest expense |
12,191 | 17,214 | ||||||
| Other expense (income), net |
(7,582 | ) | 24,339 | |||||
|
|
|
|
|
|||||
| Total Costs, Expenses, & Other Expense |
704,670 | 668,507 | ||||||
|
|
|
|
|
|||||
| Earnings Before Income Taxes |
90,441 | 59,577 | ||||||
| Income Taxes |
15,977 | 13,311 | ||||||
|
|
|
|
|
|||||
| Net Earnings |
$ | 74,464 | $ | 46,266 | ||||
|
|
|
|
|
|||||
| Less: Dividends on Preferred Stock |
17,082 | 6,440 | ||||||
|
|
|
|
|
|||||
| Net Earnings available to the Common Shareholders |
$ | 57,382 | $ | 39,826 | ||||
|
|
|
|
|
|||||
| Basic Earnings Per Share |
$ | 0.54 | $ | 0.39 | ||||
|
|
|
|
|
|||||
| Diluted Earnings Per Share |
$ | 0.50 | $ | 0.38 | ||||
|
|
|
|
|
|||||
| Average Shares Outstanding —Basic |
105,761 | 102,809 | ||||||
| Average Shares Outstanding —Diluted |
115,849 | 105,247 | ||||||
T. 724.352.4455 | ii-vi.com
Page 6
II-VI Incorporated and Subsidiaries
Condensed Consolidated Balance Sheets (Unaudited)
($000)
| September 30, 2021 |
June 30, 2021 |
|||||||
| Assets |
||||||||
| Current Assets |
||||||||
| Cash and cash equivalents |
$ | 1,560,175 | $ | 1,591,892 | ||||
| Accounts receivable |
663,940 | 658,962 | ||||||
| Inventories |
747,413 | 695,828 | ||||||
| Prepaid and refundable income taxes |
14,652 | 13,095 | ||||||
| Prepaid and other current assets |
64,771 | 67,617 | ||||||
|
|
|
|
|
|||||
| Total Current Assets |
3,050,951 | 3,027,394 | ||||||
| Property, plant & equipment, net |
1,242,093 | 1,242,906 | ||||||
| Goodwill |
1,294,748 | 1,296,727 | ||||||
| Other intangible assets, net |
697,209 | 718,460 | ||||||
| Deferred income taxes |
33,495 | 33,498 | ||||||
| Other assets |
197,366 | 193,665 | ||||||
|
|
|
|
|
|||||
| Total Assets |
$ | 6,515,862 | $ | 6,512,650 | ||||
|
|
|
|
|
|||||
| Liabilities, Mezzanine Equity and Shareholders’ Equity |
||||||||
| Current Liabilities |
||||||||
| Current portion of long-term debt |
$ | 420,029 | $ | 62,050 | ||||
| Accounts payable |
295,003 | 294,486 | ||||||
| Operating lease current liabilities |
27,087 | 25,358 | ||||||
| Accruals and other current liabilities |
286,538 | 347,695 | ||||||
|
|
|
|
|
|||||
| Total Current Liabilities |
1,028,657 | 729,589 | ||||||
| Long-term debt |
956,377 | 1,313,091 | ||||||
| Deferred income taxes |
81,173 | 73,962 | ||||||
| Operating lease liabilities |
125,145 | 125,541 | ||||||
| Other liabilities |
130,138 | 138,119 | ||||||
|
|
|
|
|
|||||
| Total Liabilities |
2,321,490 | 2,380,302 | ||||||
| Total Mezzanine Equity |
736,360 | 726,178 | ||||||
| Total Shareholders’ Equity |
3,458,012 | 3,406,170 | ||||||
|
|
|
|
|
|||||
| Total Liabilities, Mezzanine Equity and Shareholders’ Equity |
$ | 6,515,862 | $ | 6,512,650 | ||||
|
|
|
|
|
|||||
T. 724.352.4455 | ii-vi.com
Page 7
II-VI Incorporated and Subsidiaries
Condensed Consolidated Statements of Cash Flows (Unaudited)
($000)
| Three Months Ended | ||||||||
| September 30, | ||||||||
| 2021 | 2020 | |||||||
| Cash Flows from Operating Activities |
||||||||
| Net cash provided by operating activities |
$ | 52,336 | $ | 134,327 | ||||
|
|
|
|
|
|||||
| Cash Flows from Investing Activities |
||||||||
| Additions to property, plant & equipment |
(47,565 | ) | (33,792 | ) | ||||
| Purchases of businesses, net of cash acquired |
— | (36,064 | ) | |||||
|
|
|
|
|
|||||
| Net cash used in investing activities |
(47,565 | ) | (69,856 | ) | ||||
|
|
|
|
|
|||||
| Cash Flows from Financing Activities |
||||||||
| Proceeds from issuance of common shares |
— | 460,000 | ||||||
| Proceeds from issuance of preferred shares |
— | 460,000 | ||||||
| Payments on borrowings under Term A Facility |
(15,513 | ) | (15,513 | ) | ||||
| Payments on borrowings under Term B Facility |
— | (714,600 | ) | |||||
| Payments on borrowings under Revolving Credit Facility |
— | (25,000 | ) | |||||
| Equity issuance costs |
— | (36,092 | ) | |||||
| Proceeds from exercises of stock options |
7,481 | 1,083 | ||||||
| Payments in satisfaction of employees’ minimum tax obligations |
(13,017 | ) | (5,574 | ) | ||||
| Payment of dividends |
(13,808 | ) | — | |||||
| Other financing activities |
(1,109 | ) | (1,329 | ) | ||||
|
|
|
|
|
|||||
| Net cash provided by (used in) financing activities |
(35,966 | ) | 122,975 | |||||
|
|
|
|
|
|||||
| Effect of exchange rate changes on cash and cash equivalents |
(522 | ) | 3,493 | |||||
| Net increase (decrease) in cash and cash equivalents |
(31,717 | ) | 190,939 | |||||
| Cash and Cash Equivalents at Beginning of Period |
1,591,892 | 493,046 | ||||||
|
|
|
|
|
|||||
| Cash and Cash Equivalents at End of Period |
$ | 1,560,175 | $ | 683,985 | ||||
|
|
|
|
|
|||||
T. 724.352.4455 | ii-vi.com
Page 8
Table 2
Segment Revenues, GAAP Operating Income (Loss) & Margins, and
Non-GAAP Operating Income (Loss) & Margins*
$ Millions, except %
(Unaudited)
| Three Months Ended | ||||||||||||
| Sept 30, 2021 |
Jun 30, 2021 |
Sept 30, 2020 |
||||||||||
| Revenues: |
||||||||||||
| Photonic Solutions |
$ | 536.0 | $ | 549.7 | $ | 497.7 | ||||||
| Compound Semiconductors |
259.1 | 258.3 | 230.4 | |||||||||
|
|
|
|
|
|
|
|||||||
| Consolidated |
$ | 795.1 | $ | 808.0 | $ | 728.1 | ||||||
|
|
|
|
|
|
|
|||||||
| GAAP Operating Income (Loss): |
||||||||||||
| Photonic Solutions |
$ | 56.5 | $ | 60.5 | $ | 50.4 | ||||||
| Compound Semiconductors |
49.7 | 47.7 | 50.7 | |||||||||
| Unallocated and Other |
(11.2 | ) | (11.1 | ) | — | |||||||
|
|
|
|
|
|
|
|||||||
| Consolidated |
$ | 95.1 | $ | 97.1 | $ | 101.1 | ||||||
|
|
|
|
|
|
|
|||||||
| Non-GAAP Operating Income: |
||||||||||||
| Photonic Solutions |
$ | 84.0 | $ | 87.4 | $ | 78.2 | ||||||
| Compound Semiconductors |
66.3 | 61.1 | 60.7 | |||||||||
|
|
|
|
|
|
|
|||||||
| Consolidated |
$ | 150.2 | $ | 148.5 | $ | 138.9 | ||||||
|
|
|
|
|
|
|
|||||||
| GAAP Operating Margin: |
||||||||||||
| Photonic Solutions |
10.5 | % | 11.0 | % | 10.1 | % | ||||||
| Compound Semiconductors |
19.2 | % | 18.5 | % | 22.0 | % | ||||||
| Consolidated |
12.0 | % | 12.0 | % | 13.9 | % | ||||||
| Non-GAAP Operating Margin: |
||||||||||||
| Photonic Solutions |
15.7 | % | 15.9 | % | 15.7 | % | ||||||
| Compound Semiconductors |
25.6 | % | 23.7 | % | 26.4 | % | ||||||
| Consolidated |
18.9 | % | 18.4 | % | 19.1 | % | ||||||
| * | Amounts may not recalculate due to rounding. |
T. 724.352.4455 | ii-vi.com
Page 9
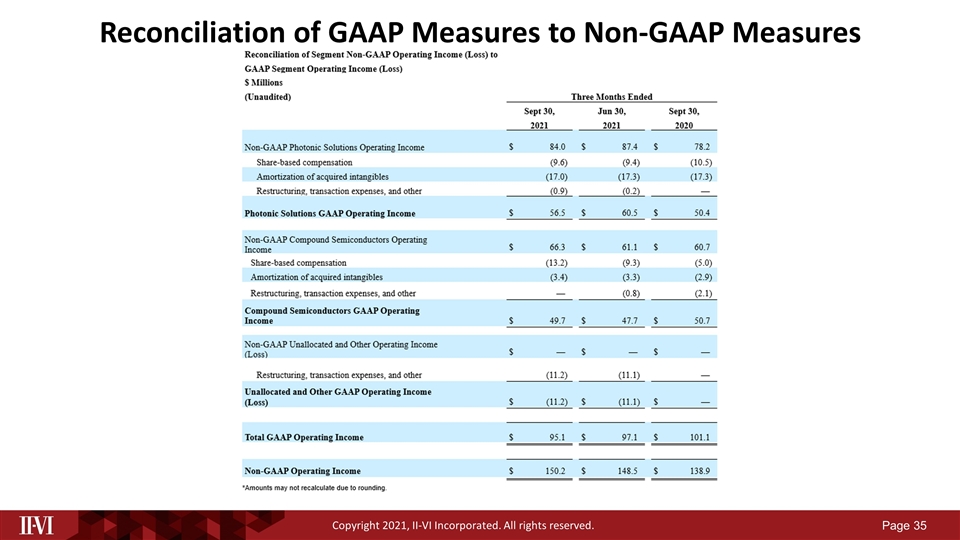
Table 3
Reconciliation of Segment Non-GAAP Operating Income (Loss) to
GAAP Segment Operating Income (Loss)
$ Millions
(Unaudited)
| Three Months Ended | ||||||||||||
| Sept 30, 2021 |
Jun 30, 2021 |
Sept 30, 2020 |
||||||||||
| Non-GAAP Photonic Solutions Operating Income |
$ | 84.0 | $ | 87.4 | $ | 78.2 | ||||||
| Share-based compensation |
(9.6 | ) | (9.4 | ) | (10.5 | ) | ||||||
| Amortization of acquired intangibles |
(17.0 | ) | (17.3 | ) | (17.3 | ) | ||||||
| Restructuring, transaction expenses, and other |
(0.9 | ) | (0.2 | ) | — | |||||||
|
|
|
|
|
|
|
|||||||
| Photonic Solutions GAAP Operating Income |
$ | 56.5 | $ | 60.5 | $ | 50.4 | ||||||
|
|
|
|
|
|
|
|||||||
| Non-GAAP Compound Semiconductors Operating Income |
$ | 66.3 | $ | 61.1 | $ | 60.7 | ||||||
| Share-based compensation |
(13.2 | ) | (9.3 | ) | (5.0 | ) | ||||||
| Amortization of acquired intangibles |
(3.4 | ) | (3.3 | ) | (2.9 | ) | ||||||
| Restructuring, transaction expenses, and other |
— | (0.8 | ) | (2.1 | ) | |||||||
|
|
|
|
|
|
|
|||||||
| Compound Semiconductors GAAP Operating Income |
$ | 49.7 | $ | 47.7 | $ | 50.7 | ||||||
|
|
|
|
|
|
|
|||||||
| Non-GAAP Unallocated and Other Operating Income (Loss) |
$ | — | $ | — | $ | — | ||||||
| Restructuring, transaction expenses, and other |
(11.2 | ) | (11.1 | ) | — | |||||||
|
|
|
|
|
|
|
|||||||
| Unallocated and Other GAAP Operating Income (Loss) |
$ | (11.2 | ) | $ | (11.1 | ) | $ | — | ||||
|
|
|
|
|
|
|
|||||||
|
|
|
|
|
|
|
|||||||
| Total GAAP Operating Income |
$ | 95.1 | $ | 97.1 | $ | 101.1 | ||||||
|
|
|
|
|
|
|
|||||||
|
|
|
|
|
|
|
|||||||
| Non-GAAP Operating Income |
$ | 150.2 | $ | 148.5 | $ | 138.9 | ||||||
|
|
|
|
|
|
|
|||||||
| * | Amounts may not recalculate due to rounding. |
T. 724.352.4455 | ii-vi.com
Page 10
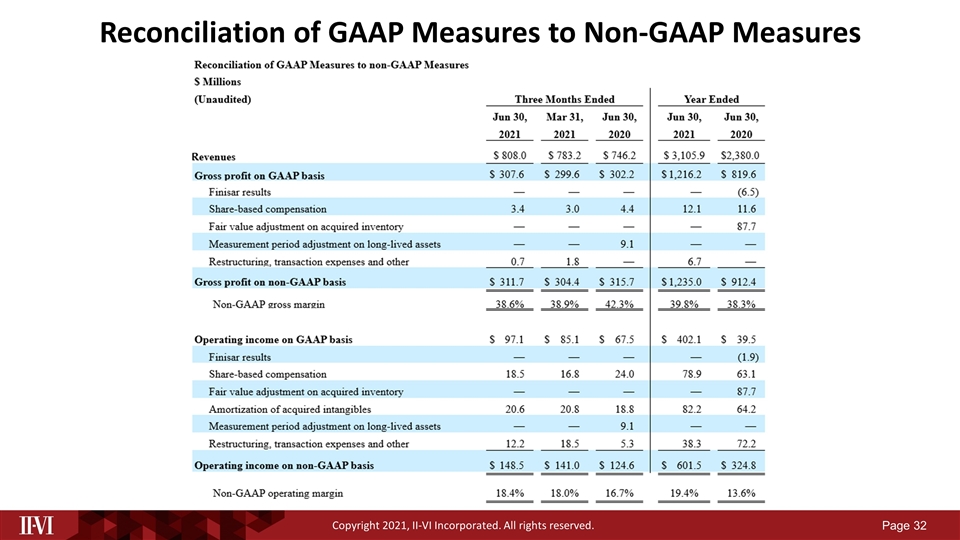
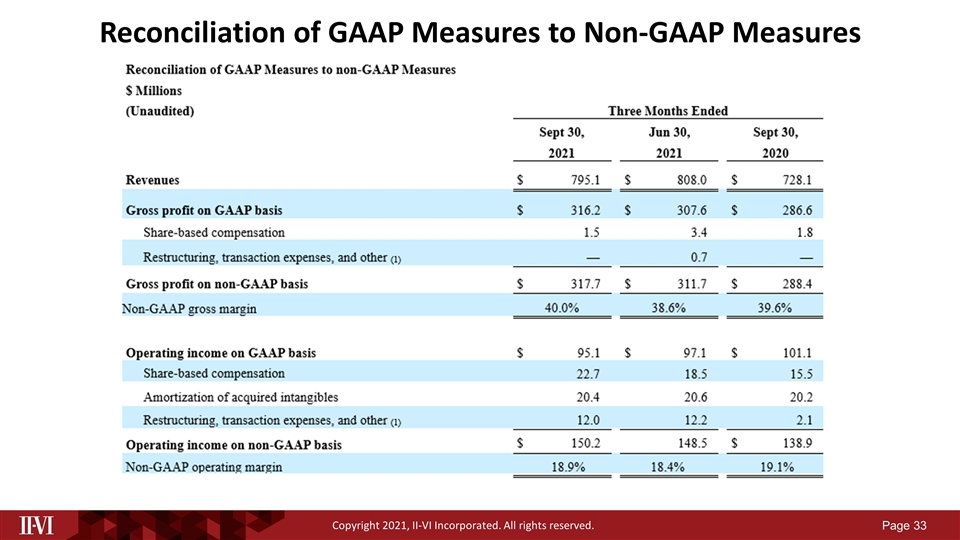
Table 4
Reconciliation of GAAP Measures to non-GAAP Measures
$ Millions
(Unaudited)
| Three Months Ended | ||||||||||||
| Sept 30, 2021 |
Jun 30, 2021 |
Sept 30, 2020 |
||||||||||
| Gross profit on GAAP basis |
$ | 316.2 | $ | 307.6 | $ | 286.6 | ||||||
| Share-based compensation |
1.5 | 3.4 | 1.8 | |||||||||
| Restructuring, transaction expenses, and other (1) |
— | 0.7 | — | |||||||||
|
|
|
|
|
|
|
|||||||
| Gross profit on non-GAAP basis |
$ | 317.7 | $ | 311.7 | $ | 288.4 | ||||||
|
|
|
|
|
|
|
|||||||
| Internal research and development on GAAP basis |
$ | 89.0 | $ | 83.8 | $ | 78.2 | ||||||
| Share-based compensation |
(2.3 | ) | (4.8 | ) | (2.6 | ) | ||||||
|
|
|
|
|
|
|
|||||||
| Internal research and development on non-GAAP basis |
$ | 86.7 | $ | 79.0 | $ | 75.6 | ||||||
|
|
|
|
|
|
|
|||||||
| Selling, general and administrative on GAAP basis |
$ | 132.2 | $ | 126.7 | $ | 107.2 | ||||||
| Share-based compensation |
(18.9 | ) | (10.3 | ) | (11.1 | ) | ||||||
| Amortization of acquired intangibles |
(20.4 | ) | (20.6 | ) | (20.2 | ) | ||||||
| Restructuring, transaction expenses, and other (1) |
(12.0 | ) | (11.5 | ) | (2.1 | ) | ||||||
|
|
|
|
|
|
|
|||||||
| Selling, general and administrative on non-GAAP basis |
$ | 80.9 | $ | 84.3 | $ | 73.8 | ||||||
|
|
|
|
|
|
|
|||||||
| Operating income on GAAP basis |
$ | 95.1 | $ | 97.1 | $ | 101.1 | ||||||
| Share-based compensation |
22.7 | 18.5 | 15.5 | |||||||||
| Amortization of acquired intangibles |
20.4 | 20.6 | 20.2 | |||||||||
| Restructuring, transaction expenses, and other (1) |
12.0 | 12.2 | 2.1 | |||||||||
|
|
|
|
|
|
|
|||||||
| Operating income on non-GAAP basis |
$ | 150.2 | $ | 148.5 | $ | 138.9 | ||||||
|
|
|
|
|
|
|
|||||||
T. 724.352.4455 | ii-vi.com
Page 11
Table 4
Reconciliation of GAAP Measures to non-GAAP Measures (Continued)
$ Millions
(Unaudited)
| Three Months Ended | ||||||||||||
| Sept 30, 2021 |
Jun 30, 2021 |
Sept 30, 2020 |
||||||||||
| Interest and other (income) expense, net on GAAP basis |
$ | 4.6 | $ | 3.9 | $ | 41.5 | ||||||
| Foreign currency exchange gains (losses), net |
4.9 | (1.2 | ) | (4.7 | ) | |||||||
| Gain on investment |
— | 10.9 | — | |||||||||
| Debt extinguishment expense (2) |
— | — | (24.7 | ) | ||||||||
|
|
|
|
|
|
|
|||||||
| Interest and other (income) expense, net on non-GAAP basis |
$ | 9.5 | $ | 13.6 | $ | 12.1 | ||||||
|
|
|
|
|
|
|
|||||||
| Income taxes on GAAP basis |
$ | 16.0 | $ | 11.0 | $ | 13.3 | ||||||
| Tax impact of non-GAAP measures |
7.1 | 6.8 | 13.1 | |||||||||
|
|
|
|
|
|
|
|||||||
| Income taxes on non-GAAP basis |
$ | 23.1 | $ | 17.8 | $ | 26.4 | ||||||
|
|
|
|
|
|
|
|||||||
| Net earnings on GAAP basis |
$ | 74.5 | $ | 82.3 | $ | 46.3 | ||||||
| Share-based compensation |
22.7 | 18.5 | 15.5 | |||||||||
| Amortization of acquired intangibles |
20.4 | 20.6 | 20.2 | |||||||||
| Foreign currency exchange (gains) losses |
(4.9 | ) | 1.2 | 4.7 | ||||||||
| Debt extinguishment expense (2) |
— | — | 24.7 | |||||||||
| Other Gains |
— | (10.9 | ) | — | ||||||||
| Tax impact of non-GAAP measures and fair value adjustments |
(7.1 | ) | (6.8 | ) | (13.1 | ) | ||||||
| Restructuring, transaction expenses, and other(1) |
12.0 | 12.2 | 2.1 | |||||||||
|
|
|
|
|
|
|
|||||||
| Net earnings on non-GAAP basis |
$ | 117.7 | $ | 117.0 | $ | 100.4 | ||||||
|
|
|
|
|
|
|
|||||||
| Per share data: | ||||||||||||
| Net earnings on GAAP basis |
||||||||||||
| Basic Earnings Per Share |
$ | 0.54 | $ | 0.62 | $ | 0.39 | ||||||
| Diluted Earnings Per Share |
$ | 0.50 | $ | 0.59 | $ | 0.38 | ||||||
| Net earnings on non-GAAP basis |
||||||||||||
| Basic Earnings Per Share |
$ | 0.95 | $ | 0.95 | $ | 0.91 | ||||||
| Diluted Earnings Per Share |
$ | 0.87 | $ | 0.88 | $ | 0.84 | ||||||
| * | Amounts may not recalculate due to rounding. |
| (1) | During fiscal year 2022, transaction costs primarily represent fees incurred in relation to the pending Coherent acquisition and customer settlements from acquired liabilities of previous acquisitions. During fiscal year 2021, transaction costs primarily represent transaction expenses related to the Ascatron acquisition. |
| (2) | The Company recorded debt extinguishment expense of $24.7 million in connection with the extinguishment of the Term B Loan Facility during the three months ended September 30, 2020. |
T. 724.352.4455 | ii-vi.com
Page 12
Table 5
Reconciliation of GAAP Net Income (Loss), EBITDA and Adjusted EBITDA
$ Millions
(Unaudited)
| Three Months Ended | ||||||||||||
| Sept 30, 2021 |
Jun 30, 2021 |
Sept 30, 2020 |
||||||||||
| Net earnings on GAAP basis |
$ | 74.5 | $ | 82.3 | $ | 46.3 | ||||||
| Income taxes |
16.0 | 10.9 | 13.3 | |||||||||
| Depreciation and amortization |
69.7 | 70.2 | 64.7 | |||||||||
| Interest expense |
12.2 | 14.1 | 17.2 | |||||||||
|
|
|
|
|
|
|
|||||||
| EBITDA (1) |
$ | 172.4 | $ | 177.5 | $ | 141.5 | ||||||
|
|
|
|
|
|
|
|||||||
| EBITDA margin |
21.7 | % | 22.0 | % | 19.4 | % | ||||||
| Stock based compensation |
22.7 | 18.5 | 15.5 | |||||||||
| Foreign currency exchange (gains) losses |
(4.9 | ) | 1.2 | 4.7 | ||||||||
| Debt extinguishment expense |
— | — | 24.7 | |||||||||
| Restructuring expenses, transaction expenses, and other |
$ | 12.0 | $ | 2.8 | $ | 2.1 | ||||||
|
|
|
|
|
|
|
|||||||
| Adjusted EBITDA (2) |
$ | 202.2 | $ | 200.0 | $ | 188.5 | ||||||
|
|
|
|
|
|
|
|||||||
| Adjusted EBITDA margin |
25.4 | % | 24.8 | % | 25.9 | % | ||||||
| * | Amounts may not recalculate due to rounding. |
| (1) | EBITDA is defined as earnings before interest, income taxes, depreciation and amortization. |
| (2) | Adjusted EBITDA excludes non-GAAP adjustments for share-based compensation, certain one-time transaction expenses, the impact of restructuring and related items, debt extinguishment charges, expenses incurred for asset retirement obligations and the impact of foreign currency exchange gains and losses and COVID related costs incurred during fiscal year 2021. |
T. 724.352.4455 | ii-vi.com
Page 13
Table 6
GAAP Earnings Per Share Calculation
$ Millions
(Unaudited)
| Three Months Ended | ||||||||||||
| Sept 30, 2021 |
Jun 30, 2021 |
Sept 30, 2020 |
||||||||||
| Numerator |
||||||||||||
| Net earnings |
$ | 74.5 | $ | 82.3 | $ | 46.3 | ||||||
| Deduct Series A preferred stock dividends |
(6.9 | ) | (6.9 | ) | (6.4 | ) | ||||||
| Deduct Series B redeemable preferred dividends |
(10.2 | ) | (10.0 | ) | — | |||||||
|
|
|
|
|
|
|
|||||||
| Basic earnings available to common shareholders |
$ | 57.4 | $ | 65.4 | $ | 39.8 | ||||||
|
|
|
|
|
|
|
|||||||
| Effect of dilutive securities: |
||||||||||||
| Add back interest on Convertible Senior Notes Due 2022 |
$ | 0.5 | $ | 3.1 | $ | — | ||||||
|
|
|
|
|
|
|
|||||||
| Diluted earnings available to common shareholders |
$ | 57.9 | 68.5 | $ | 39.8 | |||||||
|
|
|
|
|
|
|
|||||||
| Denominator |
||||||||||||
| Weighted average shares |
105.8 | 105.0 | 102.8 | |||||||||
| Effect of dilutive securities: |
||||||||||||
| Common stock equivalents |
2.8 | 3.9 | 2.4 | |||||||||
| 0.25% Convertible Senior Notes due 2022 |
7.3 | 7.3 | — | |||||||||
|
|
|
|
|
|
|
|||||||
| Diluted weighted average common shares |
115.8 | 116.2 | 105.2 | |||||||||
|
|
|
|
|
|
|
|||||||
| Basic earnings per common share |
$ | 0.54 | $ | 0.62 | $ | 0.39 | ||||||
|
|
|
|
|
|
|
|||||||
| Diluted earnings per common share |
$ | 0.50 | $ | 0.59 | $ | 0.38 | ||||||
|
|
|
|
|
|
|
|||||||
| * | Amounts may not recalculate due to rounding. |
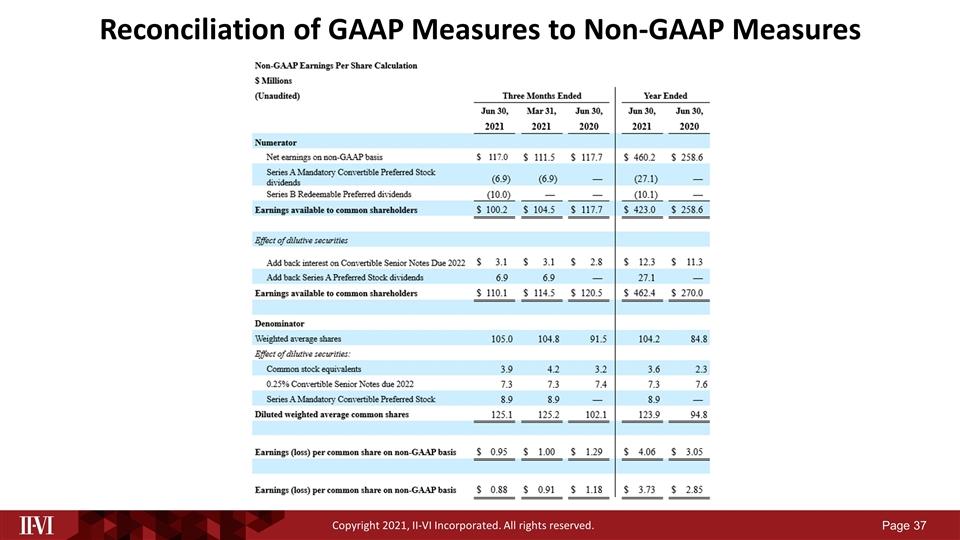
T. 724.352.4455 | ii-vi.com
Page 14
Table 7
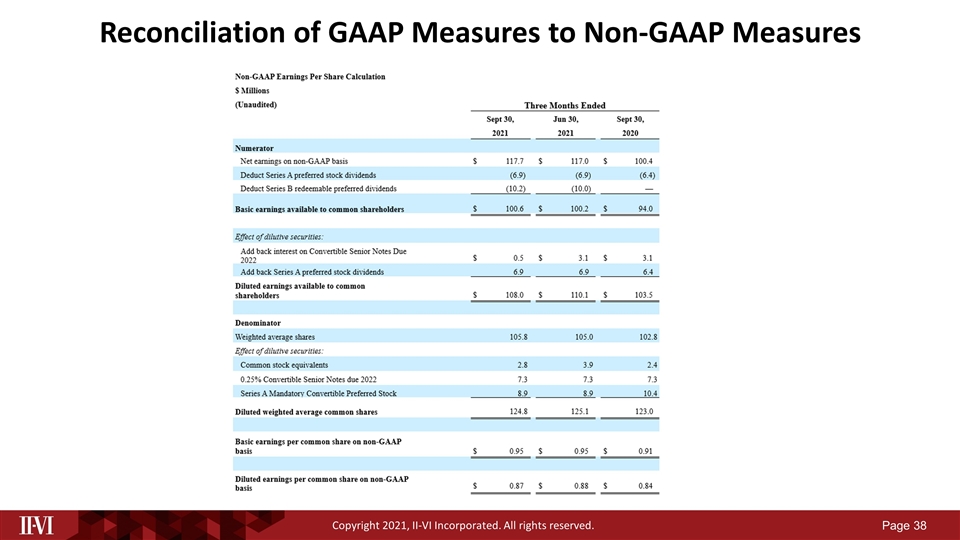
Non-GAAP Earnings Per Share Calculation
$ Millions
(Unaudited)
| Three Months Ended | ||||||||||||
| Sept 30, 2021 |
Jun 30, 2021 |
Sept 30, 2020 |
||||||||||
| Numerator |
||||||||||||
| Net earnings on non-GAAP basis |
$ | 117.7 | $ | 117.0 | $ | 100.4 | ||||||
| Deduct Series A preferred stock dividends |
(6.9 | ) | (6.9 | ) | (6.4 | ) | ||||||
| Deduct Series B redeemable preferred dividends |
(10.2 | ) | (10.0 | ) | — | |||||||
|
|
|
|
|
|
|
|||||||
| Basic earnings available to common shareholders |
$ | 100.6 | $ | 100.2 | $ | 94.0 | ||||||
|
|
|
|
|
|
|
|||||||
| Effect of dilutive securities: |
||||||||||||
| Add back interest on Convertible Senior Notes Due 2022 |
$ | 0.5 | $ | 3.1 | $ | 3.1 | ||||||
| Add back Series A preferred stock dividends |
6.9 | 6.9 | 6.4 | |||||||||
|
|
|
|
|
|
|
|||||||
| Diluted earnings available to common shareholders |
$ | 108.0 | $ | 110.1 | $ | 103.5 | ||||||
|
|
|
|
|
|
|
|||||||
| Denominator | ||||||||||||
| Weighted average shares |
105.8 | 105.0 | 102.8 | |||||||||
| Effect of dilutive securities: |
||||||||||||
| Common stock equivalents |
2.8 | 3.9 | 2.4 | |||||||||
| 0.25% Convertible Senior Notes due 2022 |
7.3 | 7.3 | 7.3 | |||||||||
| Series A Mandatory Convertible Preferred Stock |
8.9 | 8.9 | 10.4 | |||||||||
|
|
|
|
|
|
|
|||||||
| Diluted weighted average common shares |
124.8 | 125.1 | 123.0 | |||||||||
|
|
|
|
|
|
|
|||||||
| Basic earnings per common share on non-GAAP basis |
$ | 0.95 | $ | 0.95 | $ | 0.91 | ||||||
|
|
|
|
|
|
|
|||||||
| Diluted earnings per common share on non-GAAP basis |
$ | 0.87 | $ | 0.88 | $ | 0.84 | ||||||
|
|
|
|
|
|
|
|||||||
| * | Amounts may not recalculate due to rounding. |
T. 724.352.4455 | ii-vi.com
Page 15
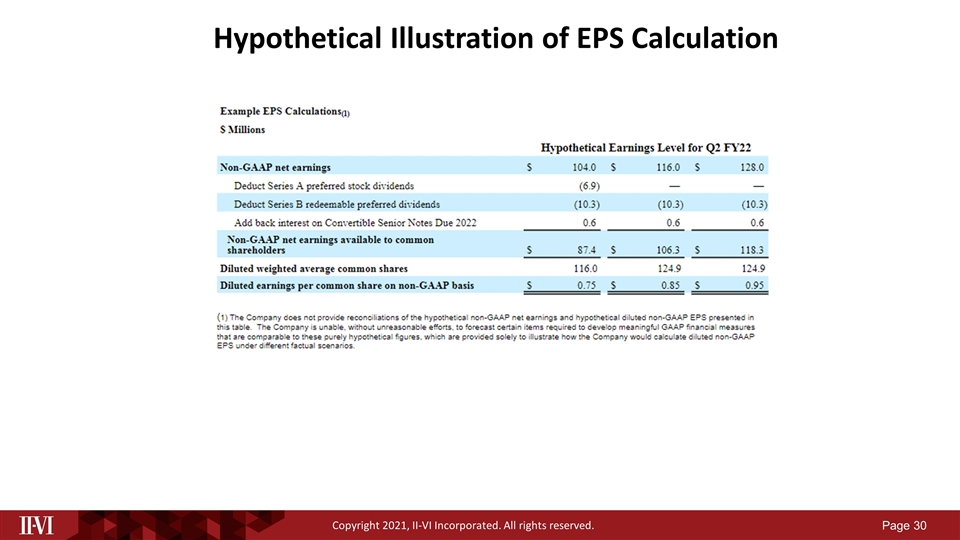
Table 8
Example EPS Calculations(1)
$ Millions
| Hypothetical Earnings Level for Q2 FY22 | ||||||||||||
| Non-GAAP net earnings |
$ | 104.0 | $ | 116.0 | $ | 128.0 | ||||||
| Deduct Series A preferred stock dividends |
(6.9 | ) | — | — | ||||||||
| Deduct Series B redeemable preferred dividends |
(10.3 | ) | (10.3 | ) | (10.3 | ) | ||||||
| Add back interest on Convertible Senior Notes Due 2022 |
0.6 | 0.6 | 0.6 | |||||||||
|
|
|
|
|
|
|
|||||||
| Non-GAAP net earnings available to common shareholders |
$ | 87.4 | $ | 106.3 | $ | 118.3 | ||||||
|
|
|
|
|
|
|
|||||||
| Diluted weighted average common shares |
116.0 | 124.9 | 124.9 | |||||||||
| Diluted earnings per common share on non-GAAP basis |
$ | 0.75 | $ | 0.85 | $ | 0.95 | ||||||
|
|
|
|
|
|
|
|||||||
| (1) | The Company does not provide reconciliations of the hypothetical non-GAAP net earnings and hypothetical diluted non-GAAP EPS presented in this table. The Company is unable, without unreasonable efforts, to forecast certain items required to develop meaningful GAAP financial measures that are comparable to these purely hypothetical figures, which are provided solely to illustrate how the Company would calculate diluted non-GAAP EPS under different factual scenarios. |
CONTACT:
Mary Jane Raymond
Treasurer and Chief Financial Officer
www.ii-vi.com/contact-us
T. 724.352.4455 | ii-vi.com
Page 16