Exhibit 99.2

 | ||
Financial Supplement | First Quarter 2020 | |
Table of Contents | |
Overview | PAGE |
Corporate Profile | |
Earnings Release | |
Selected Quarterly Financial Data | |
Financial Information | |
Consolidated Balance Sheets | |
Consolidated Statements of Operations | |
Reconciliation of Net Income (Loss) to NAREIT FFO, Core FFO and AFFO | |
Reconciliation of Net Income (Loss) to EBITDA, NAREIT EBITDAre, and Core EBITDA | |
Acquisition, Litigation and Other | |
Debt Detail and Maturities | |
Operations Overview | |
Revenue and Contribution by Segment | |
Global Warehouse Economic and Physical Occupancy Trend | |
Global Warehouse Portfolio | |
Fixed Commitment and Lease Maturity Schedules | |
Recurring Maintenance Capital Expenditures, Repair and Maintenance Expenses and External Growth, Expansion and Development Capital Expenditures | |
Total Global Warehouse Segment Financial and Operating Performance | |
Global Warehouse Segment Financial Performance | |
Same-store Financial Performance | |
Same-store Key Operating Metrics | |
External Growth and Capital Deployment | |
2020 Guidance | |
Notes and Definitions | |
2
| ||
Financial Supplement | First Quarter 2020 | |
Corporate Profile
We are the world’s largest publicly traded REIT focused on the ownership, operation, acquisition and development of temperature-controlled warehouses. We are organized as a self-administered and self-managed REIT with proven operating, development and acquisition expertise. As of March 31, 2020, we operated a global network of 183 temperature-controlled warehouses encompassing over one billion cubic feet, with 161 warehouses in the United States, six warehouses in Australia, seven warehouses in New Zealand, two warehouses in Argentina and seven warehouses in Canada. In addition, we hold a minority interest in a Brazil joint venture, which owns or operates 19 temperature-controlled warehouses.
Corporate Headquarters
10 Glenlake Parkway South Tower, Suite 600
Atlanta, Georgia 30328
Telephone: (678) 441-1400
Website: www.americold.com
Senior Management
Fred W. Boehler: Chief Executive Officer, President and Trustee
Marc J. Smernoff: Chief Financial Officer and Executive Vice President
Carlos V. Rodriguez: Chief Operating Officer and Executive Vice President
Robert Chambers: Chief Commercial Officer and Executive Vice President
James A. Harron: Chief Investment Officer and Executive Vice President
James C. Snyder, Jr.: Chief Legal Officer and Executive Vice President
Sanjay Lall: Chief Information Officer and Executive Vice President
Khara Julien: Chief Human Resources Officer and Executive Vice President
David K. Stuver: Executive Vice President, Supply Chain Solutions
Thomas C. Novosel: Chief Accounting Officer and Senior Vice President
Board of Trustees
Mark R. Patterson: Chairman of the Board of Trustees
George J. Alburger, Jr.: Trustee
Kelly H. Barrett: Trustee
Fred W. Boehler: Chief Executive Officer, President and Trustee
Antonio F. Fernandez: Trustee
James R. Heistand: Trustee
Michelle M. MacKay: Trustee
David J. Neithercut: Trustee
Andrew P. Power: Trustee
Investor Relations
To request more information or to be added to our e-mail distribution list, please visit our website: www.americold.com
(Please proceed to the Investors section)
Analyst Coverage | ||
Firm | Analyst Name | Contact |
Baird Equity Research | David B. Rodgers | 216-737-7341 |
Bank of America Merrill Lynch | Joshua Dennerlein | 646-855-1681 |
Berenberg Capital Markets | Nate Crossett | 646-949-9030 |
Citi | Emmanuel Korchman | 212-816-1382 |
J.P. Morgan | Michael W. Mueller | 212-622-6689 |
Raymond James | William A. Crow | 727-567-2594 |
RBC | Michael Carroll | 440-715-2649 |
SunTrust Robinson Humphrey | Ki Bin Kim | 212-303-4124 |
3
| ||
Financial Supplement | First Quarter 2020 | |
Stock Listing Information
The shares of Americold Realty Trust are traded on the New York Stock Exchange under the symbol “COLD”.
Credit Ratings
DBRS Morningstar | ||
Credit Rating: | BBB | (Stable Outlook) |
Fitch | ||
Issuer Default Rating: | BBB | (Stable Outlook) |
Moody’s | ||
Issuer Rating: | Baa3 | (Stable Outlook) |
These credit ratings may not reflect the potential impact of risks relating to the structure or trading of the Company’s securities and are provided solely for informational purposes. Credit ratings are not recommendations to buy, hold or sell any security, and may be revised or withdrawn at any time by the issuing rating agency at its sole discretion. The Company does not undertake any obligation to maintain the ratings or to advise of any change in ratings. Each agency’s rating should be evaluated independently of any other agency’s rating. An explanation of the significance of the ratings may be obtained from each of the rating agencies.
4
| ||
Financial Supplement | First Quarter 2020 | |
AMERICOLD REALTY TRUST ANNOUNCES FIRST QUARTER 2020 RESULTS
Atlanta, GA, May 7, 2020 - Americold Realty Trust (NYSE: COLD) (the “Company”), the world’s largest publicly traded REIT focused on the ownership, operation, acquisition and development of temperature-controlled warehouses, today announced financial and operating results for the first quarter ended March 31, 2020.
Fred Boehler, President and Chief Executive Officer of Americold Realty Trust, stated, “The ongoing COVID-19 pandemic has highlighted the strength and resiliency of our mission-critical infrastructure, business and Associates. For the first quarter 2020, we delivered total company revenue growth and NOI growth of 23.1% and 37.2%, respectively. This growth was driven by our core warehouse segment, which demonstrated our important role in the food supply chain, the diversity of the food commodities and channels our network serves, the benefit of our strategic acquisitions, and our entire Americold team’s extraordinary efforts. Within our warehouse segment, we delivered same store revenue and NOI growth of 6.8% and 11.1%, highlighting our disciplined execution through the initial impact of the COVID-19 pandemic, where we saw higher occupancy and greater throughput across the network.”
Mr. Boehler continued, “Looking ahead, we believe we are well positioned, due to the stability of the demand drivers that underpin our business, the diversity of our customer base, and the flexibility of our network and people to respond to shifting consumer demand. Our 183 facilities serve as an indispensable part of the infrastructure that serves the food supply chain. However, we expect that the surge in demand we have seen will normalize, and given that the impacts from COVID-19 are not fully known, we remain supportive of our customers who are adapting to changing market conditions. Furthermore, our flexible balance sheet provides a foundation to support and finance Americold’s ongoing growth. Our recently completed refinancing expanded our total liquidity, including cash, revolver availability and equity forwards, to approximately $1.2 billion. Finally, we are focused on the health and safety of our team and their families, and would like to express our gratitude to all of our associates at our warehouses and behind the scenes who are committed each day to help ensure continuity in the food supply.”
First Quarter 2020 Highlights
• | Total revenue increased 23.1% to $484.1 million for the first quarter 2020. |
• | Total NOI increased 37.2% to $135.4 million for the first quarter 2020. |
• | Core EBITDA increased 46.5% to $104.1 million, or 47.8% on a constant currency basis, for the first quarter 2020. |
• | Net income of $23.5 million, or $0.11 per diluted common share for the first quarter 2020. |
• | Core FFO of $60.1 million, or $0.29 per diluted common share for the first quarter 2020. |
• | AFFO of $67.2 million, or $0.33 per diluted common share for the first quarter 2020. |
• | Global Warehouse segment revenue increased 31.6% to $381.1 million for the first quarter 2020. |
• | Global Warehouse segment NOI increased 39.6% to $126.8 million for the first quarter 2020. |
• | Global Warehouse segment same store revenue grew 5.0%, or 6.8% on a constant currency basis, with same store segment NOI improving 9.8%, or 11.1% on a constant currency basis for the first quarter 2020. |
• | Completed the acquisitions of Nova Cold for CAD $338.6 million and Newport for $57.1 million, both on January 2, 2020. |
• | Completed a minority investment in a joint venture with Brazil-based, Superfrio. |
• | Completed the refinancing of the Senior Unsecured Credit Facility during the first quarter of 2020, increasing capacity to approximately $1.4 billion, extending final maturity to 2025 and reducing the credit spread by five basis points. |
5
| ||
Financial Supplement | First Quarter 2020 | |
First Quarter 2020 Total Company Financial Results
Total revenue for the first quarter of 2020 was $484.1 million, a 23.1% increase from the same quarter of the prior year. This growth was driven by the incremental revenue from the 2019 and 2020 acquisitions, the initial increase in activity related to COVID-19, contractual rate escalations and growth in fixed commitment storage contracts. These factors were partially offset by the translation impact of the strengthening US dollar.
For the first quarter of 2020, the Company reported net income of $23.5 million, or $0.11 per diluted share, compared to net loss of $4.6 million, or $0.03 per diluted share, for the same quarter of the prior year.
Total NOI for the first quarter of 2020 was $135.4 million, an increase of 37.2% from the same quarter of the prior year.
Core EBITDA was $104.1 million for the first quarter of 2020, compared to $71.1 million for the same quarter of the prior year. This reflects a 46.5% increase over prior year, or 47.8% on a constant currency basis, largely impacted by increased Core EBITDA from acquisitions and organic growth. Core EBITDA margin increased by 343 basis points to 21.5%. This growth and margin improvement was driven by the previously discussed items combined with disciplined cost controls through the Americold Operating System of power and labor-related costs, partially offset by the translation impact of the strengthening US dollar, and incremental costs incurred in response to COVID-19 including sanitation, supplies and inefficiencies resulting from social distancing requirements.
For the first quarter of 2020, Core FFO was $60.1 million, or $0.29 per diluted share, compared to $39.9 million, or $0.26 per diluted share, for same quarter of the prior year. The year-over-year increase is driven primarily by increased FFO as a result of acquisitions and the operating performance described above.
For the first quarter of 2020, AFFO was $67.2 million, or $0.33 per diluted share, compared to $44.3 million, or $0.29 per diluted share, for same quarter of the prior year. AFFO excludes certain expenses and income items that do not represent core expenses and income streams.
Please see the Company’s supplemental financial information for the definitions and reconciliations of non-GAAP financial measures to the most comparable GAAP financial measures.
First Quarter 2020 Global Warehouse Segment Results
For the first quarter of 2020, Global Warehouse segment revenue was $381.1 million, an increase of $91.5 million, or 31.6%, compared to $289.6 million for the first quarter of 2019. This growth was driven by the incremental revenue from the 2019 and 2020 acquisitions as well as the same revenue growth factors mentioned above.
Warehouse segment NOI was $126.8 million for the first quarter of 2020, which reflects growth of 39.6%. Global Warehouse segment margin was 33.3% for the first quarter of 2020, an 191 basis point increase compared to the same quarter of the prior year. The year-over-year growth was driven by incremental NOI from the 2019 and 2020 acquisitions, the previously mentioned revenue trends, cost controls through the Americold Operating System of our power and labor-related costs, partially offset by the translation impact of the strengthening US dollar, the incremental costs incurred in response to COVID-19 including sanitation, supplies and inefficiencies resulting from social distancing requirements.
6
| ||
Financial Supplement | First Quarter 2020 | |
The following tables summarize the global warehouse and same store financial results and metrics for the quarter ended March 31, 2020 and 2019:
Three Months Ended March 31, | Change | ||||||||||||||||
Dollars in thousands | 2020 actual | 2020 constant currency(1) | 2019 actual | Actual | Constant currency | ||||||||||||
TOTAL WAREHOUSE SEGMENT | |||||||||||||||||
Number of total warehouses | 172 | 144 | n/a | n/a | |||||||||||||
Global Warehouse revenue: | |||||||||||||||||
Rent and storage | $ | 162,308 | $ | 163,990 | $ | 126,380 | 28.4 | % | 29.8 | % | |||||||
Warehouse services | 218,760 | 222,219 | 163,235 | 34.0 | % | 36.1 | % | ||||||||||
Total revenue | $ | 381,068 | $ | 386,209 | $ | 289,615 | 31.6 | % | 33.4 | % | |||||||
Global Warehouse contribution (NOI) | $ | 126,773 | $ | 127,958 | $ | 90,819 | 39.6 | % | 40.9 | % | |||||||
Global Warehouse margin | 33.3 | % | 33.1 | % | 31.4 | % | 191 bps | 177 bps | |||||||||
Units in thousands except per pallet data | |||||||||||||||||
Global Warehouse rent and storage metrics: | |||||||||||||||||
Average economic occupied pallets | 3,256 | n/a | 2,507 | 29.9 | % | n/a | |||||||||||
Average physical occupied pallets | 3,049 | n/a | 2,374 | 28.4 | % | n/a | |||||||||||
Average physical pallet positions | 4,007 | n/a | 3,182 | 25.9 | % | n/a | |||||||||||
Economic occupancy percentage | 81.3 | % | n/a | 78.8 | % | 247 bps | n/a | ||||||||||
Physical occupancy percentage | 76.1 | % | n/a | 74.6 | % | 148 bps | n/a | ||||||||||
Total rent and storage revenue per economic occupied pallet | $ | 49.84 | $ | 50.36 | $ | 50.41 | (1.1 | )% | (0.1 | )% | |||||||
Total rent and storage revenue per physical occupied pallet | $ | 53.24 | $ | 53.79 | $ | 53.24 | — | % | 1.0 | % | |||||||
Global Warehouse services metrics: | |||||||||||||||||
Throughput pallets | 8,199 | n/a | 6,522 | 25.7 | % | n/a | |||||||||||
Total warehouse services revenue per throughput pallet | $ | 26.68 | $ | 27.10 | $ | 25.03 | 6.6 | % | 8.3 | % | |||||||
SAME STORE WAREHOUSE | |||||||||||||||||
Number of same store warehouses | 136 | 136 | n/a | n/a | |||||||||||||
Global Warehouse same store revenue: | |||||||||||||||||
Rent and storage | $ | 125,875 | $ | 127,446 | $ | 120,550 | 4.4 | % | 5.7 | % | |||||||
Warehouse services | 165,988 | 169,390 | 157,507 | 5.4 | % | 7.5 | % | ||||||||||
Total same store revenue | $ | 291,863 | $ | 296,836 | $ | 278,057 | 5.0 | % | 6.8 | % | |||||||
Global Warehouse same store contribution (NOI) | $ | 97,248 | $ | 98,390 | $ | 88,565 | 9.8 | % | 11.1 | % | |||||||
Global Warehouse same store margin | 33.3 | % | 33.1 | % | 31.9 | % | 147 bps | 129 bps | |||||||||
Units in thousands except per pallet data | |||||||||||||||||
Global Warehouse same store rent and storage metrics: | |||||||||||||||||
Average economic occupied pallets | 2,490 | n/a | 2,391 | 4.1 | % | n/a | |||||||||||
Average physical occupied pallets | 2,305 | n/a | 2,266 | 1.7 | % | n/a | |||||||||||
Average physical pallet positions | 3,044 | n/a | 3,049 | (0.2 | )% | n/a | |||||||||||
Economic occupancy percentage | 81.8 | % | n/a | 78.4 | % | 337 bps | n/a | ||||||||||
Physical occupancy percentage | 75.7 | % | n/a | 74.3 | % | 140 bps | n/a | ||||||||||
Same store rent and storage revenue per economic occupied pallet | $ | 50.55 | $ | 51.18 | $ | 50.42 | 0.3 | % | 1.5 | % | |||||||
Same store rent and storage revenue per physical occupied pallet | $ | 54.60 | $ | 55.28 | $ | 53.20 | 2.6 | % | 3.9 | % | |||||||
Global Warehouse same store services metrics: | |||||||||||||||||
Throughput pallets | 6,467 | n/a | 6,296 | 2.7 | % | n/a | |||||||||||
Same store warehouse services revenue per throughput pallet | $ | 25.67 | $ | 26.19 | $ | 25.02 | 2.6 | % | 4.7 | % | |||||||
7
| ||
Financial Supplement | First Quarter 2020 | |
Three Months Ended March 31, | Change | ||||||||||||||||
Dollars in thousands | 2020 actual | 2020 constant currency(1) | 2019 actual | Actual | Constant currency | ||||||||||||
NON-SAME STORE WAREHOUSE | |||||||||||||||||
Number of non-same store warehouses | 36 | 8 | n/a | n/a | |||||||||||||
Global Warehouse non-same store revenue: | |||||||||||||||||
Rent and storage | $ | 36,433 | $ | 36,544 | $ | 5,830 | n/r | n/r | |||||||||
Warehouse services | 52,772 | 52,829 | 5,728 | n/r | n/r | ||||||||||||
Total non-same store revenue | $ | 89,205 | $ | 89,373 | $ | 11,558 | n/r | n/r | |||||||||
Global Warehouse non-same store contribution (NOI) | $ | 29,525 | $ | 29,568 | $ | 2,254 | n/r | n/r | |||||||||
Global Warehouse non-same store margin | 33.1 | % | 33.1 | % | 19.5 | % | n/r | n/r | |||||||||
Units in thousands except per pallet data | |||||||||||||||||
Global Warehouse non-same store rent and storage metrics: | |||||||||||||||||
Average economic occupied pallets | 766 | n/a | 116 | n/r | n/a | ||||||||||||
Average physical occupied pallets | 743 | n/a | 108 | n/r | n/a | ||||||||||||
Average physical pallet positions | 962 | n/a | 133 | n/r | n/a | ||||||||||||
Economic occupancy percentage | 79.6 | % | n/a | 87.2 | % | n/r | n/a | ||||||||||
Physical occupancy percentage | 77.2 | % | n/a | 81.2 | % | n/r | n/a | ||||||||||
Non-same store rent and storage revenue per economic occupied pallet | $ | 47.57 | $ | 47.71 | $ | 50.25 | (5.3 | )% | (5.1 | )% | |||||||
Non-same store rent and storage revenue per physical occupied pallet | $ | 49.01 | $ | 49.16 | $ | 54.00 | (9.2 | )% | (9.0 | )% | |||||||
Global Warehouse non-same store services metrics: | |||||||||||||||||
Throughput pallets | 1,732 | n/a | 225 | n/r | n/a | ||||||||||||
Non-same store warehouse services revenue per throughput pallet | $ | 30.47 | $ | 30.51 | $ | 25.45 | 19.7 | % | 19.9 | % | |||||||
(1) The adjustments from our U.S. GAAP operating results to calculate our operating results on a constant currency basis are the effect of changes in foreign currency exchange rates relative to the comparable prior period.
(n/a = not applicable)
(n/r = not relevant)
Fixed Commitment Rent and Storage Revenue
As of March 31, 2020, $258.5 million of the Company’s annualized rent and storage revenue were derived from customers with fixed commitment storage contracts. This compares to $251.1 million at the end of the fourth quarter of 2019 and $221.6 million at the end of the first quarter of 2019. The Company’s recent acquisitions had a lower percentage of fixed committed contracts as a percentage of rent and storage revenue. On a combined pro forma basis, assuming a full twelve months of acquisitions revenue, 40.1% of rent and storage revenue were generated from fixed commitment storage contracts.
Economic and Physical Occupancy
Contracts that contain fixed commitments are designed to ensure the Company’s customers have space available when needed. For the first quarter of 2020, economic occupancy for the total warehouse segment was 81.3% and warehouse segment same store pool was 81.8%, representing a 518 basis point and 607 basis point increase above physical occupancy, respectively. For the first quarter of 2020, physical occupancy for the total warehouse segment was 76.1% and warehouse segment same store pool was 75.7%.
8
| ||
Financial Supplement | First Quarter 2020 | |
Real Estate Portfolio
As of March 31, 2020, the Company’s portfolio consists of 183 facilities, five more than what was reported as of the year ended 2019. The Company ended the first quarter of 2020 with 172 facilities in its Global Warehouse segment portfolio and 11 facilities in its Third-party managed segment. During the first quarter, the Company acquired four sites from the Nova Cold acquisition and one site from the Newport acquisition, all of which were added to the non-same store category. The same store population consists of 136 facilities for the quarter ended March 31, 2020. The remaining 36 non-same store Warehouse facilities include the 31 facilities that were acquired since the beginning of 2019, and five legacy facilities.
Balance Sheet Activity and Liquidity
At March 31, 2020, the Company had total liquidity of approximately $1.2 billion, including cash and capacity on its revolving credit facility and $135.1 million of net proceeds available from its September 2018 equity forward. Total debt outstanding was $2.0 billion (inclusive of $177.2 million of financing leases/sale lease-backs and exclusive of unamortized deferred financing fees), of which 77% was in an unsecured structure. The Company has no material debt maturities until 2023. At quarter end, its net debt to pro forma Core EBITDA was approximately 4.2x. Of the Company’s total debt outstanding, $1.8 billion relates to real estate debt, which excludes sale-leaseback and capitalized lease obligations. The Company’s real estate debt has a remaining weighted average term of 6.5 years and carries a weighted average contractual interest rate of 3.89%. As of March 31, 2020, 86% of the Company’s total debt outstanding was at a fixed rate, inclusive of interest rate swaps.
Dividend
On March 5, 2020, the Company’s Board of Trustees declared a dividend of $0.21 per share for the first quarter of 2020, which was paid on April 15, 2020 to common shareholders of record as of March 31, 2020.
2020 Outlook
The Company is maintaining its AFFO per share guidance of $1.22 to $1.30 for 2020. However, certain components are updated as follows:
• | Current income tax expense of $8 to $10 million. |
• | Deferred income tax benefit of $2 to $3 million. |
• | Please refer to its supplemental for currency translation rates embedded in this guidance. |
The Company’s guidance is provided for informational purposes based on current plans and assumptions as is subject to change. The ranges for these metrics do not include the impact of acquisitions, dispositions, or capital markets activity beyond that which has been previously announced.
Investor Webcast and Conference Call
The Company will hold a webcast and conference call on Thursday, May 7, 2020 at 5:00 p.m. Eastern Time to discuss first quarter 2020 results. A live webcast of the call will be available via the Investors section of Americold Realty Trust’s website at www.americold.com. To listen to the live webcast, please go to the site at least five minutes prior to the scheduled start time in order to register, download and install any necessary audio software. Shortly after the call, a replay of the webcast will be available for 90 days on the Company’s website.
9
| ||
Financial Supplement | First Quarter 2020 | |
The conference call can also be accessed by dialing 1-877-407-3982 or 1-201-493-6780. The telephone replay can be accessed by dialing 1-844-512-2921 or 1-412-317-6671 and providing the conference ID# 13701724. The telephone replay will be available starting shortly after the call until May 21, 2020.
The Company’s supplemental package will be available prior to the conference call in the Investors section of the Company’s website at http://ir.americold.com.
About the Company
Americold is the world’s largest publicly traded REIT focused on the ownership, operation, acquisition and development of temperature-controlled warehouses. Based in Atlanta, Georgia, Americold owns and operates 183 temperature-controlled warehouses, with over 1 billion refrigerated cubic feet of storage, in the United States, Australia, New Zealand, Canada, and Argentina. Americold’s facilities are an integral component of the supply chain connecting food producers, processors, distributors and retailers to consumers.
Non-GAAP Financial Measures
This press release contains non-GAAP financial measures, including FFO, core FFO, AFFO, EBITDAre, Core EBITDA and same store segment revenue and contribution. A reconciliation from U.S. GAAP net income (loss) available to common shareholders to FFO, a reconciliation from FFO to core FFO and AFFO, and definitions of FFO, and core FFO are included within the supplemental. A reconciliation from U.S. GAAP net income (loss) available to common shareholders to EBITDAre and Core EBITDA, a definition of Core EBITDA and definitions of net debt to Core EBITDA are included within the supplemental.
Forward-Looking Statements
This document contains statements about future events and expectations that constitute forward-looking statements. Forward-looking statements are based on our beliefs, assumptions and expectations of our future financial and operating performance and growth plans, taking into account the information currently available to us. These statements are not statements of historical fact. Forward-looking statements involve risks and uncertainties that may cause our actual results to differ materially from the expectations of future results we express or imply in any forward-looking statements, and you should not place undue reliance on such statements. Factors that could contribute to these differences include the following: adverse economic or real estate developments in our geographic markets or the temperature-controlled warehouse industry; general economic conditions; uncertainties and risks related to natural disasters, global climate change and public health crises, including the recent and ongoing COVID-19 pandemic; risks associated with the ownership of real estate and temperature-controlled warehouses in particular; defaults or non-renewals of contracts with customers; potential bankruptcy or insolvency of our customers; or the inability of our customers to otherwise perform under their contracts, including as a result of the ongoing COVID-19 pandemic; uncertainty of revenues, given the nature of our customer contracts; increased interest rates and operating costs, including as a result of the recent and ongoing COVID-19 pandemic; our failure to obtain necessary outside financing; risks related to, or restrictions contained in, our debt financings; decreased storage rates or increased vacancy rates; risks related to current and potential international operations and properties; our failure to realize the intended benefits from our recent acquisitions including synergies, or disruptions to our plans and operations or unknown or contingent liabilities related to our recent acquisitions; our failure to successfully integrate and operate acquired properties or businesses, including but not limited to: Cloverleaf Cold Storage, Lanier Cold Storage, MHW Group, Inc., Nova Cold Logistics, Newport Cold Storage and PortFresh Holdings, LLC; acquisition risks, including the failure of such acquisitions to perform in accordance with projections; risks related to expansions of existing properties and developments of new properties, including failure to meet budgeted or stabilized returns within expected time
10
| ||
Financial Supplement | First Quarter 2020 | |
frames, or at all, in respect thereof; difficulties in expanding our operations into new markets, including international markets; risks related to the partial ownership of properties, including as a result of our lack of control over such investments and the failure of such entities to perform in accordance with projections; our failure to maintain our status as a REIT; our Operating Partnership’s failure to qualify as a partnership for federal income tax purposes; possible environmental liabilities, including costs, fines or penalties that may be incurred due to necessary remediation of contamination of properties presently or previously owned by us; financial market fluctuations; actions by our competitors and their increasing ability to compete with us; labor and power costs; changes in real estate and zoning laws and increases in real property tax rates; the competitive environment in which we operate; our relationship with our employees, including the occurrence of any work stoppages or any disputes under our collective bargaining agreements and employment related litigation; liabilities as a result of our participation in multi-employer pension plans; losses in excess of our insurance coverage; the cost and time requirements as a result of our operation as a publicly traded REIT; changes in foreign currency exchange rates; the impact of anti-takeover provisions in our constituent documents and under Maryland law, which could make an acquisition of us more difficult, limit attempts by our shareholders to replace our trustees and affect the price of our common shares of beneficial interest, $0.01 par value per share, of our common shares; the potential dilutive effect of our common share offerings; and risks related to any forward sale agreement, including the forward sale agreement we entered into with an affiliate of BofA Securities, Inc. in September 2018, as amended, or the 2018 forward sale agreement, including substantial dilution to our earnings per share or substantial cash payment obligations.
Words such as “anticipates,” “believes,” “continues,” “estimates,” “expects,” “goal,” “objectives,” “intends,” “may,” “opportunity,” “plans,” “potential,” “near-term,” “long-term,” “projections,” “assumptions,” “projects,” “guidance,” “forecasts,” “outlook,” “target,” “trends,” “should,” “could,” “would,” “will” and similar expressions are intended to identify such forward-looking statements. Examples of forward-looking statements included in this document include, among others, statements about our expected acquisition and expected expansion and development pipeline and our targeted return on invested capital on expansion and development opportunities. We qualify any forward-looking statements entirely by these cautionary factors. Other risks, uncertainties and factors, including those discussed under “Risk Factors” in our Annual Report on Form 10-K for the year ended December 31, 2019 and in our Form 8-K filed April 16, 2020, could cause our actual results to differ materially from those projected in any forward-looking statements we make. We assume no obligation to update or revise these forward-looking statements for any reason, or to update the reasons actual results could differ materially from those anticipated in these forward-looking statements, even if new information becomes available in the future.
Contacts:
Americold Realty Trust
Investor Relations
Telephone: 678-459-1959
Email: [email protected]
11
| ||
Financial Supplement | First Quarter 2020 | |
Selected Quarterly Financial Data
In thousands, except per share amounts - unaudited | As of | |||||||||
Capitalization: | Q1 20 | Q4 19 | Q3 19 | Q2 19 | Q1 19 | |||||
Fully diluted common shares outstanding at quarter end(1) | 205,161 | 197,784 | 198,641 | 197,231 | 153,840 | |||||
Common stock share price at quarter end | $34.04 | $35.06 | $37.07 | $32.42 | $30.51 | |||||
Market value of common equity | $6,983,680 | $6,934,307 | $7,363,622 | $6,394,229 | $4,693,658 | |||||
Gross debt (2) | $2,011,027 | $1,882,372 | $1,883,986 | $1,897,734 | $1,522,396 | |||||
Less: cash and cash equivalents | 262,955 | 234,303 | 310,116 | 320,805 | 172,838 | |||||
Net debt | $1,748,072 | $1,648,069 | $1,573,870 | $1,576,929 | $1,349,558 | |||||
Total enterprise value | $8,731,752 | $8,582,376 | $8,937,492 | $7,971,158 | $6,043,216 | |||||
Net debt / total enterprise value | 20.0 | % | 19.2 | % | 17.6 | % | 19.8 | % | 22.3 | % |
Net debt to pro forma Core EBITDA(2) | 4.15x | 4.18x | 4.12x | 4.14x | 4.41x | |||||
Three Months Ended | ||||||||||
Selected Operational Data: | Q1 20 | Q4 19 | Q3 19 | Q2 19 | Q1 19 | |||||
Warehouse segment revenue | $381,068 | $383,778 | $365.593 | $338,231 | $289,615 | |||||
Total revenue | 484,069 | 485,984 | 466,182 | 438,460 | 393,079 | |||||
Operating income (3) | 47,678 | 46,579 | 39,385 | 29,085 | 16,417 | |||||
Net income (loss) | 23,511 | 20,809 | 27,091 | 4,891 | (4,629) | |||||
Total warehouse segment contribution (NOI) (4) | 126,773 | 129,547 | 113,408 | 113,817 | 90,819 | |||||
Total segment contribution (NOI) (4) | 135,402 | 137,754 | 120,706 | 121,119 | 98,678 | |||||
Selected Other Data: | ||||||||||
Core EBITDA (5) | $104,110 | $109,086 | $93,369 | $93,617 | $71,057 | |||||
Core funds from operations (1) | 60,060 | 64,621 | 59,083 | 56,077 | 39,941 | |||||
Adjusted funds from operations (1) | 67,151 | 59,716 | 52,445 | 58,054 | 44,316 | |||||
Earnings Measurements: | ||||||||||
Net income (loss) per share - basic | $0.12 | $0.11 | $0.14 | $0.03 | $(0.03) | |||||
Net income (loss) per share - diluted | $0.11 | $0.10 | $0.14 | $0.03 | $(0.03) | |||||
Core FFO per diluted share (5) | $0.29 | $0.33 | $0.30 | $0.30 | $0.26 | |||||
AFFO per diluted share (5) | $0.33 | $0.30 | $0.27 | $0.31 | $0.29 | |||||
Dividend distributions declared per common share (6) | $0.21 | $0.20 | $0.20 | $0.20 | $0.20 | |||||
Diluted AFFO payout ratio (7) | 63.6 | % | 66.7 | % | 74.1 | % | 64.5 | % | 69.0 | % |
Portfolio Statistics: | ||||||||||
Total global warehouses | 183 | 178 | 176 | 178 | 155 | |||||
Ending economic occupancy | 81.3 | % | 83.1 | % | 79.0 | % | 76.8 | % | 78.8 | % |
Ending physical occupancy | 76.1 | % | 79.5 | % | 75.3 | % | 73.0 | % | 74.6 | % |
Total global same-store warehouses | 136 | 137 | 138 | 138 | 137 | |||||
12
| ||
Financial Supplement | First Quarter 2020 | |
(1) Assumes the exercise of all outstanding stock options using the treasury stock method, conversion of all outstanding restricted stock units, and incorporates forward contracts using the treasury stock method | ||||||||||||||||
As of | ||||||||||||||||
(2) Net Debt to Core EBITDA Computation | 03/31/2020 | 12/31/2019 | ||||||||||||||
Total debt | $ | 1,996,051 | $ | 1,869,376 | ||||||||||||
Deferred financing costs | 14,976 | 12,996 | ||||||||||||||
Gross debt | $2,011,027 | $1,882,372 | ||||||||||||||
Adjustments: | ||||||||||||||||
Less: cash and cash equivalents | 262,955 | 234,303 | ||||||||||||||
Net debt | $ | 1,748,072 | $ | 1,648,069 | ||||||||||||
Core EBITDA - last twelve months | $400,182 | $367,128 | ||||||||||||||
Core EBITDA from acquisitions (a) | 20,665 | 26,745 | ||||||||||||||
Pro forma Core EBITDA - last twelve months | $420,847 | $393,873 | ||||||||||||||
Net debt to pro forma Core EBITDA | 4.15x | 4.18x | ||||||||||||||
(a) Includes 1 months of Core EBITDA from Cloverleaf and Lanier acquisitions prior to Americold’s ownership, plus 7.5 months of Core EBITDA from the MHW acquisition prior to Americold’s ownership, plus 9 months of Core EBITDA from the Nova Cold and Newport acquisitions prior to Americold’s ownership. | ||||||||||||||||
(3) Certain prior period amounts have been reclassified to conform to the current period presentation. | ||||||||||||||||
(4) Reconciliation of segment contribution (NOI) | ||||||||||||||||
Three Months Ended | ||||||||||||||||
Q1 20 | Q4 19 | Q3 19 | Q2 19 | Q1 19 | ||||||||||||
Warehouse segment contribution (NOI) | $126,773 | $129,547 | $113,408 | $113,817 | $90,819 | |||||||||||
Third-party managed segment contribution (NOI) | 3,769 | 3,115 | 2,583 | 2,804 | 3,259 | |||||||||||
Transportation segment contribution (NOI) | 4,805 | 4,865 | 4,640 | 4,206 | 4,356 | |||||||||||
Quarry segment contribution (NOI) | 55 | 227 | 75 | 292 | 244 | |||||||||||
Total segment contribution (NOI) | $135,402 | $137,754 | $120,706 | $121,119 | $98,678 | |||||||||||
Depreciation, depletion and amortization | (51,604 | ) | (47,750 | ) | (45,065 | ) | (40,437 | ) | (30,096 | ) | ||||||
Selling, general and administrative (3) | (36,893 | ) | (33,048 | ) | (32,476 | ) | (32,669 | ) | (31,117 | ) | ||||||
Acquisition, litigation and other (3) | (1,688 | ) | (10,377 | ) | (3,780 | ) | (17,964 | ) | (8,493 | ) | ||||||
Gain (loss) from sale of real estate | 2,461 | — | — | (34 | ) | — | ||||||||||
Impairment of long-lived assets | — | — | — | (930 | ) | (12,555 | ) | |||||||||
U.S. GAAP operating income | $47,678 | $46,579 | $39,385 | $29,085 | $16,417 | |||||||||||
(5) See “Reconciliation of Net Income (Loss) to EBITDA, EBITDAre, and Core EBITDA” | ||||||||||||||||
(6) Distributions per common share | Three Months Ended | |||||||||||||||
Q1 20 | Q4 19 | Q3 19 | Q2 19 | Q1 19 | ||||||||||||
Distributions declared on common shares during the quarter | $42,568 | $38,796 | $38,795 | $38,764 | $30,235 | |||||||||||
Common shares outstanding at quarter end | 200,266 | 191,800 | 191,751 | 191,634 | 149,133 | |||||||||||
Distributions declared per common share of beneficial interest | $0.21 | $0.20 | $0.20 | $0.20 | $0.20 | |||||||||||
(7) Calculated as distributions declared on common shares divided by AFFO per fully diluted share | ||||||||||||||||
13
| ||
Financial Supplement | First Quarter 2020 | |
Financial Information
Americold Realty Trust and Subsidiaries | |||||||
Condensed Consolidated Balance Sheets (Unaudited) | |||||||
(In thousands, except shares and per share amounts) | |||||||
March 31, 2020 | December 31, 2019 | ||||||
Assets | |||||||
Property, buildings and equipment: | |||||||
Land | $ | 515,744 | $ | 526,226 | |||
Buildings and improvements | 2,835,697 | 2,696,732 | |||||
Machinery and equipment | 859,709 | 817,617 | |||||
Assets under construction | 102,919 | 108,639 | |||||
4,314,069 | 4,149,214 | ||||||
Accumulated depreciation and depletion | (1,251,666 | ) | (1,216,553 | ) | |||
Property, buildings and equipment – net | 3,062,403 | 2,932,661 | |||||
Operating lease right-of-use assets | 73,231 | 77,723 | |||||
Accumulated depreciation – operating leases | (20,805 | ) | (18,110 | ) | |||
Operating leases – net | 52,426 | 59,613 | |||||
Financing leases: | |||||||
Buildings and improvements | 15,885 | 11,227 | |||||
Machinery and equipment | 79,844 | 76,811 | |||||
95,729 | 88,038 | ||||||
Accumulated depreciation – financing leases | (32,809 | ) | (29,697 | ) | |||
Financing leases – net | 62,920 | 58,341 | |||||
Cash and cash equivalents | 262,955 | 234,303 | |||||
Restricted cash | 6,222 | 6,310 | |||||
Accounts receivable – net of allowance of $7,426 and $6,927 at March 31, 2020 and December 31, 2019, respectively | 216,819 | 214,842 | |||||
Identifiable intangible assets – net | 355,613 | 284,758 | |||||
Goodwill | 378,152 | 318,483 | |||||
Investments in partially owned entities | 23,041 | — | |||||
Other assets | 82,841 | 61,372 | |||||
Total assets | $ | 4,503,392 | $ | 4,170,683 | |||
Liabilities and shareholders’ equity | |||||||
Liabilities: | |||||||
Borrowings under revolving line of credit | $ | — | $ | — | |||
Accounts payable and accrued expenses | 341,113 | 350,963 | |||||
Mortgage notes, senior unsecured notes and term loans – net of unamortized deferred financing costs of $14,976 and $12,996, in the aggregate, at March 31, 2020 and December 31, 2019, respectively | 1,818,869 | 1,695,447 | |||||
Sale-leaseback financing obligations | 114,893 | 115,759 | |||||
Financing lease obligations | 62,289 | 58,170 | |||||
Operating lease obligations | 55,097 | 62,342 | |||||
Unearned revenue | 17,118 | 16,423 | |||||
Pension and postretirement benefits | 11,877 | 12,706 | |||||
Deferred tax liability – net | 52,776 | 17,119 | |||||
Multiemployer pension plan withdrawal liability | 8,684 | 8,736 | |||||
Total liabilities | 2,482,716 | 2,337,665 | |||||
Shareholders’ equity: | |||||||
Common shares of beneficial interest, $0.01 par value – authorized 325,000,000 and 250,000,000 shares; 200,265,965 and 191,799,909 shares issued and outstanding at March 31, 2020 and December 31, 2019, respectively | 2,003 | 1,918 | |||||
Paid-in capital | 2,818,389 | 2,582,087 | |||||
Accumulated deficit and distributions in excess of net earnings | (756,418 | ) | (736,861 | ) | |||
Accumulated other comprehensive loss | (43,298 | ) | (14,126 | ) | |||
Total shareholders’ equity | 2,020,676 | 1,833,018 | |||||
Total liabilities and shareholders’ equity | $ | 4,503,392 | $ | 4,170,683 | |||
14
| ||
Financial Supplement | First Quarter 2020 | |
Americold Realty Trust and Subsidiaries | |||||||
Condensed Consolidated Statements of Operations (Unaudited) | |||||||
(In thousands, except per share amounts) | |||||||
Three Months Ended March 31, | |||||||
2020 | 2019 | ||||||
Revenues: | |||||||
Rent, storage and warehouse services | $ | 381,068 | $ | 289,615 | |||
Third-party managed services | 64,921 | 64,136 | |||||
Transportation services | 35,917 | 37,096 | |||||
Other | 2,163 | 2,232 | |||||
Total revenues | 484,069 | 393,079 | |||||
Operating expenses: | |||||||
Rent, storage and warehouse services cost of operations | 254,295 | 198,796 | |||||
Third-party managed services cost of operations | 61,152 | 60,877 | |||||
Transportation services cost of operations | 31,112 | 32,740 | |||||
Cost of operations related to other revenues | 2,108 | 1,988 | |||||
Depreciation, depletion and amortization | 51,604 | 30,096 | |||||
Selling, general and administrative | 36,893 | 31,117 | |||||
Acquisition, litigation and other | 1,688 | 8,493 | |||||
Impairment of long-lived assets | — | 12,555 | |||||
Gain from sale of real estate | (2,461 | ) | — | ||||
Total operating expenses | 436,391 | 376,662 | |||||
Operating income | 47,678 | 16,417 | |||||
Other (expense) income: | |||||||
Interest expense | (23,870 | ) | (21,576 | ) | |||
Interest income | 587 | 1,003 | |||||
Loss on debt extinguishment and modifications | (781 | ) | — | ||||
Foreign currency exchange (loss) gain, net | (492 | ) | 60 | ||||
Other income (expense), net | 871 | (167 | ) | ||||
(Loss) income from investments in partially owned entities | (27 | ) | 122 | ||||
Income (loss) before income tax (expense) benefit | 23,966 | (4,141 | ) | ||||
Income tax (expense) benefit: | |||||||
Current | (2,557 | ) | (1,548 | ) | |||
Deferred | 2,102 | 1,060 | |||||
Total income tax expense | (455 | ) | (488 | ) | |||
Net income (loss) | $ | 23,511 | $ | (4,629 | ) | ||
Weighted average common shares outstanding – basic | 200,707 | 149,404 | |||||
Weighted average common shares outstanding – diluted | 203,783 | 149,404 | |||||
Net income (loss) per common share of beneficial interest - basic | $ | 0.12 | $ | (0.03 | ) | ||
Net income (loss) per common share of beneficial interest - diluted | $ | 0.11 | $ | (0.03 | ) | ||
15
| ||
Financial Supplement | First Quarter 2020 | |
Reconciliation of Net Income (Loss) to NAREIT FFO, Core FFO, and AFFO | |||||||||||||||
(In thousands, except per share amounts - unaudited) | |||||||||||||||
Three Months Ended | |||||||||||||||
Q1 20 | Q4 19 | Q3 19 | Q2 19 | Q1 19 | |||||||||||
Net income (loss) | $ | 23,511 | $ | 20,809 | $ | 27,091 | $ | 4,891 | $ | (4,629 | ) | ||||
Adjustments: | |||||||||||||||
Real estate related depreciation and depletion | 35,442 | 32,555 | 31,238 | 28,518 | 22,665 | ||||||||||
Net (gain) loss on sale of real estate, net of withholding taxes | (2,096 | ) | — | — | 34 | — | |||||||||
Net loss on asset disposals | — | 237 | 7 | — | 138 | ||||||||||
Impairment charges on certain real estate assets | — | — | — | — | 12,555 | ||||||||||
Real estate depreciation on partially owned entities | 34 | — | 232 | 269 | 289 | ||||||||||
NAREIT Funds from operations | $ | 56,891 | $ | 53,601 | $ | 58,568 | $ | 33,712 | $ | 31,018 | |||||
Adjustments: | |||||||||||||||
Net (gain) loss on sale of non-real estate assets | (165 | ) | 227 | 212 | 167 | (118 | ) | ||||||||
Non-real estate impairment | — | — | — | 930 | — | ||||||||||
Acquisition, litigation and other expenses | 1,688 | 10,377 | 3,780 | 17,964 | 8,493 | ||||||||||
Share-based compensation expense, IPO grants | 373 | 492 | 777 | 556 | 607 | ||||||||||
Bridge loan commitment fees | — | — | — | 2,665 | — | ||||||||||
Loss on debt extinguishment and modifications | 781 | — | — | — | — | ||||||||||
Foreign currency exchange loss (gain) | 492 | (76 | ) | 43 | 83 | (60 | ) | ||||||||
Gain from sale of partially owned entities | — | — | (4,297 | ) | — | — | |||||||||
Core FFO applicable to common shareholders | $ | 60,060 | $ | 64,621 | $ | 59,083 | $ | 56,077 | $ | 39,940 | |||||
Adjustments: | |||||||||||||||
Amortization of deferred financing costs and pension withdrawal liability | 1,546 | 1,524 | 1,526 | 1,522 | 1,456 | ||||||||||
Amortization of below/above market leases | 76 | 37 | 38 | 38 | 38 | ||||||||||
Straight-line net rent | (109 | ) | (83 | ) | (150 | ) | (151 | ) | (137 | ) | |||||
Deferred income tax (benefit) expense | (2,102 | ) | 1,520 | (7,809 | ) | (3,352 | ) | (1,060 | ) | ||||||
Share-based compensation expense, excluding IPO grants | 3,934 | 3,210 | 2,593 | 2,628 | 2,032 | ||||||||||
Non-real estate depreciation and amortization | 16,162 | 15,194 | 13,828 | 11,919 | 7,431 | ||||||||||
Non-real estate depreciation and amortization on partially owned entities | 22 | — | 108 | 107 | 102 | ||||||||||
Recurring maintenance capital expenditures (a) | (12,438 | ) | (26,307 | ) | (16,772 | ) | (10,734 | ) | (5,487 | ) | |||||
Adjusted FFO applicable to common shareholders | $ | 67,151 | $ | 59,716 | $ | 52,445 | $ | 58,054 | $ | 44,315 | |||||
16
| ||
Financial Supplement | First Quarter 2020 | |
Reconciliation of Net Income (Loss) to NAREIT FFO, Core FFO, and AFFO (continued) | |||||||||||||||
(In thousands except per share amounts - unaudited) | |||||||||||||||
Three Months Ended | |||||||||||||||
Q1 20 | Q4 19 | Q3 19 | Q2 19 | Q1 19 | |||||||||||
NAREIT Funds from operations | $ | 56,891 | $ | 53,601 | $ | 58,568 | $ | 33,712 | $ | 31,018 | |||||
Core FFO applicable to common shareholders | $ | 60,060 | $ | 64,621 | $ | 59,083 | $ | 56,077 | $ | 39,940 | |||||
Adjusted FFO applicable to common shareholders | $ | 67,151 | $ | 59,716 | $ | 52,445 | $ | 58,054 | $ | 44,315 | |||||
Reconciliation of weighted average shares: | |||||||||||||||
Weighted average basic shares for net income calculation | 200,707 | 192,393 | 192,325 | 182,325 | 149,404 | ||||||||||
Dilutive stock options, unvested restricted stock units, equity forward contract | 3,076 | 5,529 | 5,038 | 3,792 | 3,041 | ||||||||||
Weighted average dilutive shares | 203,783 | 197,922 | 197,363 | 186,117 | 152,445 | ||||||||||
NAREIT FFO - basic per share | $ | 0.28 | $ | 0.28 | $ | 0.30 | $ | 0.18 | $ | 0.21 | |||||
NAREIT FFO - diluted per share | $ | 0.28 | $ | 0.27 | $ | 0.30 | $ | 0.18 | $ | 0.20 | |||||
Core FFO - basic per share | $ | 0.30 | $ | 0.34 | $ | 0.31 | $ | 0.31 | $ | 0.27 | |||||
Core FFO - diluted per share | $ | 0.29 | $ | 0.33 | $ | 0.30 | $ | 0.30 | $ | 0.26 | |||||
Adjusted FFO - basic per share | $ | 0.33 | $ | 0.31 | $ | 0.27 | $ | 0.32 | $ | 0.30 | |||||
Adjusted FFO - diluted per share | $ | 0.33 | $ | 0.30 | 0.27 | $ | 0.31 | $ | 0.29 | ||||||
(a) | Recurring maintenance capital expenditures include capital expenditures made to extend the life of, and provide future economic benefit from, our existing temperature-controlled warehouse network and its existing supporting personal property and information technology. |
17
| ||
Financial Supplement | First Quarter 2020 | |
Reconciliation of Net Income (Loss) to EBITDA, NAREIT EBITDAre, and Core EBITDA | |||||||||||||||||||
(In thousands - unaudited) | |||||||||||||||||||
Three Months Ended | Trailing Twelve Months Ended | ||||||||||||||||||
Q1 20 | Q4 19 | Q3 19 | Q2 19 | Q1 19 | Q1 2020 | ||||||||||||||
Net income (loss) | $ | 23,511 | $ | 20,809 | $ | 27,091 | $ | 4,891 | $ | (4,629 | ) | $ | 76,302 | ||||||
Adjustments: | |||||||||||||||||||
Depreciation, depletion and amortization | 51,604 | 47,750 | 45,065 | 40,437 | 30,096 | 184,856 | |||||||||||||
Interest expense | 23,870 | 23,827 | 24,907 | 24,098 | 21,576 | 96,702 | |||||||||||||
Income tax expense (benefit) | 91 | 2,236 | (6,975 | ) | (906 | ) | 488 | (5,554 | ) | ||||||||||
EBITDA | $ | 99,076 | $ | 94,622 | $ | 90,088 | $ | 68,520 | $ | 47,531 | $ | 352,306 | |||||||
Adjustments: | |||||||||||||||||||
Net (gain) loss on sale of real estate, net of withholding taxes | (2,096 | ) | — | — | 34 | — | (2,062 | ) | |||||||||||
Adjustment to reflect share of EBITDAre of partially owned entities | 60 | — | 519 | 592 | 615 | 1,171 | |||||||||||||
NAREIT EBITDAre | $ | 97,040 | $ | 94,622 | $ | 90,607 | $ | 69,146 | $ | 48,146 | $ | 351,415 | |||||||
Adjustments: | |||||||||||||||||||
Acquisition, litigation and other expenses | 1,688 | 10,377 | 3,780 | 17,964 | 8,493 | 33,809 | |||||||||||||
Bridge loan commitment fees | — | — | — | 2,665 | — | 2,665 | |||||||||||||
Loss (income) from investments in partially owned entities | 27 | — | 165 | 68 | (122 | ) | 260 | ||||||||||||
Gain from sale of partially owned entities | — | — | (4,297 | ) | — | — | (4,297 | ) | |||||||||||
Asset impairment | — | — | — | 930 | 12,555 | 930 | |||||||||||||
Loss (gain) on foreign currency exchange | 492 | (76 | ) | 43 | 83 | (60 | ) | 542 | |||||||||||
Share-based compensation expense | 4,307 | 3,699 | 3,372 | 3,185 | 2,639 | 14,563 | |||||||||||||
Loss on debt extinguishment and modifications | 781 | — | — | — | — | 781 | |||||||||||||
(Gain) loss on real estate and other asset disposals | (165 | ) | 464 | 218 | 168 | 20 | 685 | ||||||||||||
Reduction in EBITDAre from partially owned entities | (60 | ) | — | (519 | ) | (592 | ) | (615 | ) | (1,171 | ) | ||||||||
Core EBITDA | $ | 104,110 | $ | 109,086 | $ | 93,369 | $ | 93,617 | $ | 71,056 | $ | 400,182 | |||||||
18
| ||
Financial Supplement | First Quarter 2020 | |
Acquisition, Litigation and Other
Dollars in thousands
The Company reported a new financial statement line referred to as “Acquisition, litigation and other” within our Statements of Operations during 2019 due to various charges incurred in the current period, and reclassified certain costs from SG&A in the comparable prior periods to conform with the new presentation. This caption represents certain corporate costs that are highly variable from period to period and will be further detailed in our Quarterly Report on Form 10-Q.
Three Months Ended March 31, | |||||||
Acquisition, litigation and other | 2020 | 2019 | |||||
Acquisition related costs | $ | 766 | $ | 1,441 | |||
Litigation | — | 910 | |||||
Other: | |||||||
Severance, equity award modifications and acceleration | 922 | 4,293 | |||||
Non-offering related equity issuance expenses | — | 1,511 | |||||
Terminated site operations costs | — | 338 | |||||
Total other | 922 | 6,142 | |||||
Total acquisition, litigation and other | $ | 1,688 | $ | 8,493 | |||
19
| ||
Financial Supplement | First Quarter 2020 | |
Debt Detail and Maturities | |||||||||
(In thousands - unaudited) | |||||||||
As of March 31, 2020 | |||||||||
Indebtedness: | Carrying Value | Contractual Interest Rate(3) | Effective Interest Rate(4) | Stated Maturity Date(5) | |||||
Unsecured Debt | |||||||||
2020 Senior Unsecured Revolving Credit Facility(1)(2) | $ | — | L+0.85% | 0.20% | 03/2025 | ||||
2020 Senior Unsecured Term Loan A Facility Tranche A-1(2)(6) | 425,000 | L+0.95% | 2.83% | 03/2025 | |||||
2020 Senior Unsecured Term Loan A Facility Tranche A-2(2)(7) | 177,075 | C+0.95% | 2.76% | 03/2025 | |||||
Series A notes | 200,000 | 4.68% | 4.77% | 1/2026 | |||||
Series B notes | 400,000 | 4.86% | 4.92% | 1/2029 | |||||
Series C notes | 350,000 | 4.10% | 4.15% | 1/2030 | |||||
Total Unsecured Debt | $ | 1,552,075 | 3.59% | 4.01% | 7.1 years | ||||
2013 Mortgage Loans (15 cross-collateralized warehouses) | |||||||||
Senior Note | 179,770 | 3.81% | 4.14% | 5/2023 | |||||
Mezzanine A | 70,000 | 7.38% | 7.55% | 5/2023 | |||||
Mezzanine B | 32,000 | 11.50% | 11.75% | 5/2023 | |||||
Total 2013 Mortgage Loans | $ | 281,770 | 5.57% | 5.85% | 3.1 years | ||||
Total Real Estate Debt | $ | 1,833,845 | 3.89% | 4.30% | 6.5 years | ||||
Sale-leaseback financing obligations | 114,893 | 11.64% | |||||||
Financing lease obligations | 62,289 | 4.48% | |||||||
Total Debt Outstanding | $ | 2,011,027 | 4.36% | ||||||
Less: deferred financing costs | (14,976 | ) | |||||||
Total Book Value of Debt | $ | 1,996,051 | |||||||
Rate Type | % of Total | ||||||||
Fixed | 1,733,952 | 86% | |||||||
Variable | 277,075 | 14% | |||||||
Total Debt Outstanding | $ | 2,011,027 | 100% | ||||||
Debt Type | % of Total | ||||||||
Unsecured | 1,552,075 | 77% | |||||||
Secured | 458,952 | 23% | |||||||
Total Debt Outstanding | $ | 2,011,027 | 100% | ||||||
(1) | Revolver maturity assumes two six-month extension options. The borrowing capacity as of March 31, 2020 is $800 million less $22.8 million of outstanding letters of credit. The effective interest rate shown represents deferred financing fees allocated over the $800 million committed. |
(2) | L = one-month LIBOR; C = one-month CDOR. |
(3) | Interest rates as of March 31, 2020. At March 31, 2020, the one-month LIBOR rate on our Senior Unsecured Term Loan Tranche A-1 was 0.92%. At March 31, 2020, the one-month CDOR rate on our Senior Unsecured Term Loan Tranche A-2 was 1.65%. Subtotals of stated contractual interest rates represent weighted average interest rates. Rates for sale-leasebacks and financing lease obligations represent weighted average interest rates. |
(4) | The effective interest rates presented include the amortization of loan costs. Subtotals of stated effective interest rates represent weighted average interest rates. |
(5) | Subtotals of stated maturity dates represent remaining weighted average life of the debt. |
(6) | On January 4, 2019, the Company entered into a swap agreement to set the LIBOR portion of interest expense on $100 million of the Senior Unsecured Term Loan principal at a rate of 2.48%. This results in a fixed interest rate of 3.43% (2.48% + 0.95%) on $100 million of the Senior Unsecured Term Loan principal. The swap is effective January 31, 2019 through January 31, 2024. On August 15, 2019, the Company entered into a swap agreement to set the LIBOR portion of interest expense on $225 million of the Senior Unsecured Term Loan principal at a rate of 1.30%. This results in a fixed interest rate of 2.25% (1.30% + 0.95%) on $225 million of the Senior Unsecured Term Loan principal. The swap is effective August 30, 2019 through August 30, 2024. |
(7) | On March 26, 2020, the Company entered into a refinance agreement whereby the Term Loan principal was reduced by $50 million USD and increased by $250 million CAD. In addition, margin on both facilities was decreased by 5 basis points. Assumes CAD/USD exchange rate of 0.70830. |
20
| ||
Financial Supplement | First Quarter 2020 | |
Operations Overview
Revenue and Contribution by Segment | |||||||
(In thousands - unaudited) | |||||||
Three Months Ended March 31, | |||||||
2020 | 2019 | ||||||
Segment revenues: | |||||||
Warehouse | $ | 381,068 | $ | 289,615 | |||
Third-party managed | 64,921 | 64,136 | |||||
Transportation | 35,917 | 37,096 | |||||
Other | 2,163 | 2,232 | |||||
Total revenues | 484,069 | 393,079 | |||||
Segment contribution: | |||||||
Warehouse | 126,773 | 90,819 | |||||
Third-party managed | 3,769 | 3,259 | |||||
Transportation | 4,805 | 4,356 | |||||
Other | 55 | 244 | |||||
Total segment contribution | 135,402 | 98,678 | |||||
Reconciling items: | |||||||
Depreciation, depletion and amortization | (51,604 | ) | (30,096 | ) | |||
Selling, general and administrative expense | (36,893 | ) | (31,117 | ) | |||
Acquisition, litigation and other | (1,688 | ) | (8,493 | ) | |||
Impairment of long-lived assets | — | (12,555 | ) | ||||
Gain from sale of real estate | 2,461 | — | |||||
Interest expense | (23,870 | ) | (21,576 | ) | |||
Interest income | 587 | 1,003 | |||||
Loss on debt extinguishment and modifications | (781 | ) | — | ||||
Foreign currency exchange (loss) gain | (492 | ) | 60 | ||||
Other income (expense), net | 871 | (167 | ) | ||||
(Loss) gain from investments in partially owned entities | (27 | ) | 122 | ||||
Income (loss) before income tax (expense) benefit | $ | 23,966 | $ | (4,141 | ) | ||
We view and manage our business through three primary business segments—warehouse, third-party managed and transportation. Our core business is our warehouse segment, where we provide temperature-controlled warehouse storage and related handling and other warehouse services. In our warehouse segment, we collect rent and storage fees from customers to store their frozen and perishable food and other products within our real estate portfolio. We also provide our customers with handling and other warehouse services related to the products stored in our buildings that are designed to optimize their movement through the cold chain, such as the placement of food products for storage and preservation, the retrieval of products from storage upon customer request, blast freezing, case-picking, kitting and repackaging and other recurring handling services.
Under our third-party managed segment, we manage warehouses on behalf of third parties and provide warehouse management services to several leading food retailers and manufacturers in customer-owned facilities, including some of our largest and longest-standing customers. We believe using our third-party management services allows our customers to increase efficiency, reduce costs, reduce supply-chain risks and focus on their core businesses. We also believe that providing third-party management services to many of our key customers underscores our ability to offer a complete and integrated suite of services across the cold chain.
In our transportation segment, we broker and manage transportation of frozen and perishable food and other products for our customers. Our transportation services include consolidation services (i.e., consolidating a customer’s products with those of other customers for more efficient shipment), freight under management services (i.e., arranging for and overseeing transportation of customer inventory) and dedicated transportation services, each designed to improve efficiency and reduce transportation and logistics costs to our customers. We provide these transportation services at cost plus a service fee or, in the case of our consolidation services, we charge a fixed fee.
We also operate a limestone quarry on the land we own around our Carthage, Missouri warehouse, which contains substantial limestone deposits. We do not view the operation of the quarry as an integral part of our business.
21
| ||
Financial Supplement | First Quarter 2020 | |
Global Warehouse Economic and Physical Occupancy Trend
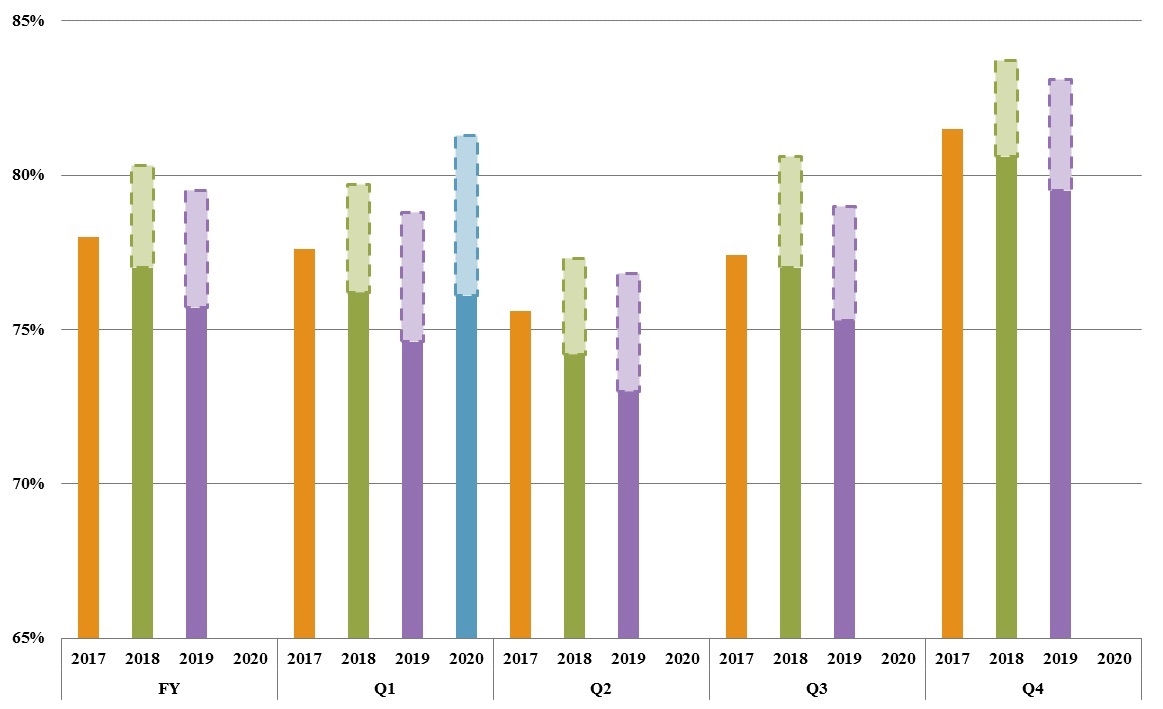
Note: Dotted lines represent incremental economic occupancy percentage.
We define average economic occupancy as the aggregate number of physically occupied pallets and any additional pallets otherwise contractually committed for a given period, without duplication. We estimate the number of contractually committed pallet positions by taking into account actual pallet commitments specified in each customer’s contract, and subtracting the physical pallet positions.
We define average physical occupancy as the average number of occupied pallets divided by the estimated number of average physical pallet positions in our warehouses for the applicable period. We estimate the number of physical pallet positions by taking into account actual racked space and by estimating unracked space on an as-if racked basis. We base this estimate on the total cubic feet of each room within the warehouse that is unracked divided by the volume of an assumed rack space that is consistent with the characteristics of the relevant warehouse. On a warehouse by warehouse basis, rack space generally ranges from three to four feet depending upon the type of facility and the nature of the customer goods stored therein. The number of our pallet positions is reviewed and updated quarterly, taking into account changes in racking configurations and room utilization.
Historically, providers of temperature-controlled warehouse space have offered storage services to customers on an as-utilized, on-demand basis. We have entered into fixed storage commitments with certain customers which give us, among other things, additional clarity around the expected occupancy of our warehouses. As of March 31, 2020, we had entered into contracts featuring fixed storage commitments or leases with 135 of our customers in our warehouse segment. Customers with fixed storage provisions commit to occupy a certain number of pallets at a designated storage rate for the applicable portion of their contractual term, whether the customer elects to physically store goods in a warehouse or not. As a result, certain pallets in our warehouses may generate storage revenue pursuant to fixed storage commitments despite not being physically occupied. We refer to economic occupancy as the aggregate number of physically occupied pallets and any additional pallets otherwise contractually committed for a given period. To the extent that a customer with a fixed storage provision elects not to utilize all of its committed pallets in a particular warehouse, we have the flexibility to deploy those pallets to facilitate shorter-term customers that desire space on an as-utilized, on demand basis.
22
| ||
Financial Supplement | First Quarter 2020 | |
Global Warehouse Portfolio
Unaudited
Country / Region | # of warehouses | Cubic feet (in millions) | % of total cubic feet | Pallet positions (in thousands) | Average economic occupancy (1) | Average physical occupancy (1) | Revenues (2) (in millions) | Applicable segment contribution (NOI) (2)(3) (in millions) | Total customers (4) | ||||||||||||||||||||
Owned / Leased (5) | |||||||||||||||||||||||||||||
United States | |||||||||||||||||||||||||||||
Central | 42 | 262.2 | 25 | % | 1,117.8 | 83 | % | 78 | % | $ | 94.7 | $ | 38.0 | 772 | |||||||||||||||
East | 28 | 216.0 | 20 | % | 787.4 | 77 | % | 71 | % | 76.0 | 20.5 | 822 | |||||||||||||||||
Southeast | 47 | 245.6 | 23 | % | 821.7 | 85 | % | 81 | % | 86.6 | 27.4 | 818 | |||||||||||||||||
West | 37 | 230.0 | 22 | % | 971.6 | 77 | % | 73 | % | 66.0 | 24.9 | 678 | |||||||||||||||||
United States Total / Average | 154 | 953.8 | 90 | % | 3,698.5 | 81 | % | 76 | % | $ | 323.3 | $ | 110.8 | 2,418 | |||||||||||||||
International | |||||||||||||||||||||||||||||
Australia | 5 | 47.6 | 5 | % | 143.1 | 92 | % | 80 | % | $ | 41.9 | $ | 10.5 | 51 | |||||||||||||||
Canada | 4 | 25.5 | 2 | % | 83.2 | 84 | % | 84 | % | 7.0 | 3.1 | 58 | |||||||||||||||||
New Zealand | 7 | 20.4 | 2 | % | 59.4 | 105 | % | 90 | % | 7.2 | 2.2 | 52 | |||||||||||||||||
Argentina | 2 | 9.7 | 1 | % | 22.6 | 58 | % | 58 | % | 1.7 | 0.2 | 48 | |||||||||||||||||
International Total / Average | 18 | 103.2 | 10 | % | 308.3 | 90 | % | 81 | % | $ | 57.8 | $ | 16.0 | 209 | |||||||||||||||
Owned / Leased Total / Average | 172 | 1,057.0 | 100 | % | 4,006.8 | 81 | % | 76 | % | $ | 381.1 | $ | 126.8 | 2,615 | |||||||||||||||
Third-Party Managed | |||||||||||||||||||||||||||||
United States | 7 | 38.5 | 73 | % | — | — | — | $ | 56.3 | $ | 2.8 | 4 | |||||||||||||||||
Australia (6) | 1 | — | — | % | — | — | — | 4.2 | 0.6 | 1 | |||||||||||||||||||
Canada | 3 | 14.3 | 27 | % | — | — | — | 4.4 | 0.4 | 2 | |||||||||||||||||||
Third-Party Managed Total / Average | 11 | 52.8 | 100 | % | — | — | — | $ | 64.9 | $ | 3.8 | 7 | |||||||||||||||||
Portfolio Total / Average | 183 | 1,109.8 | 100 | % | 4,006.8 | 81 | % | 76 | % | $ | 446.0 | $ | 130.6 | 2,616 | |||||||||||||||
(1) | Refer to the preceding section Global Warehouse Economic and Physical Occupancy Trend for our definitions of economic occupancy and physical occupancy. |
(2) | Three months ended March 31, 2020. |
(3) | We use the term “segment contribution (NOI)” to mean a segment’s revenues less its cost of operations (excluding any depreciation, depletion and amortization, impairment charges, corporate-level selling, general and administrative expenses, corporate-level acquisition, litigation and other expenses and gain or loss on sale of real estate). The applicable segment contribution (NOI) from our owned and leased warehouses and our third-party managed warehouses is included in our warehouse segment contribution (NOI) and third-party managed segment contribution (NOI), respectively. |
(4) | We serve some of our customers in multiple geographic regions and in multiple facilities within geographic regions. As a result, the total number of customers that we serve is less than the total number of customers reflected in the table above that we serve in each geographic region. |
(5) | As of March 31, 2020, we owned 134 of our U.S. warehouses and thirteen of our international warehouses, and we leased 20 of our U.S. warehouses and five of our international warehouses. As of March 31, 2020, seven of our owned facilities were located on land that we lease pursuant to long-term ground leases. |
(6) | Constitutes non-refrigerated, or “ambient,” warehouse space. This facility contains 330,527 square feet of ambient space. |
23
| ||
Financial Supplement | First Quarter 2020 | |
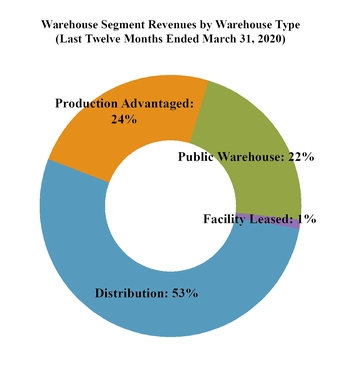


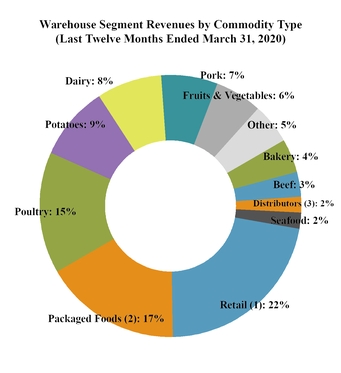
_______________________________________________
(1) | Retail reflects a broad variety of product types from retail customers. |
(2) | Packaged foods reflects a broad variety of temperature-controlled meals and foodstuffs. |
(3) | Distributors reflects a broad variety of product types from distributor customers. |
____________________
Note: March 31, 2020 LTM Revenue and NOI pro forma 2019 and 2020 acquisitions.
Totals may not foot due to rounding.
24
| ||
Financial Supplement | First Quarter 2020 | |
Fixed Commitment and Lease Maturity Schedules
Unaudited
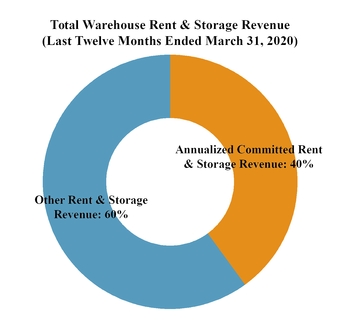
The following table sets forth a summary schedule of the expirations for any defined contracts featuring fixed storage commitments and leases in effect as of March 31, 2020. The information set forth in the table assumes no exercise of extension options under these contracts and leases.
Contract Expiration Year | Number of Contracts | Annualized Committed Rent & Storage Revenue (in thousands) | % of Total Warehouse Rent & Storage Segment Revenue for the Twelve Months Ended March 31, 2020 | Total Warehouse Segment Revenue Generated by Contracts with Fixed Commitments & Leases for the Twelve Months Ended March 31, 2020(1) (in thousands) | Annualized Committed Rent & Storage Revenue at Expiration(2) (in thousands) | |||||||||||||
Month-to-Month | 35 | $ | 34,004 | 5.3 | % | $ | 79,514 | $ | 34,004 | |||||||||
2020 | 48 | 35,019 | 5.4 | % | 95,645 | 35,059 | ||||||||||||
2021 | 43 | 43,446 | 6.7 | % | 188,316 | 44,073 | ||||||||||||
2022 | 33 | 54,518 | 8.5 | % | 122,545 | 56,448 | ||||||||||||
2023 | 24 | 39,596 | 6.1 | % | 86,978 | 42,195 | ||||||||||||
2024 | 18 | 21,914 | 3.4 | % | 55,378 | 23,402 | ||||||||||||
2025 | 4 | 2,069 | 0.3 | % | 3,794 | 2,401 | ||||||||||||
2026 | 4 | 9,849 | 1.5 | % | 10,851 | 10,342 | ||||||||||||
2027 | 3 | 4,645 | 0.7 | % | 7,746 | 4,992 | ||||||||||||
2028 | 1 | 1,099 | 0.2 | % | 3,543 | 1,099 | ||||||||||||
2029 and thereafter | 3 | 12,300 | 1.9 | % | 26,576 | 14,337 | ||||||||||||
Total | 216 | $ | 258,459 | 40.1 | % | $ | 680,886 | $ | 268,352 | |||||||||
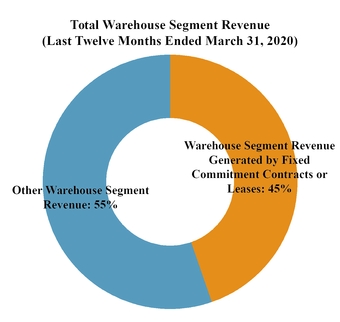
____________________
Note: March 31, 2020 LTM total revenue and rent and storage revenue pro forma 2019 and 2020 acquisitions.
(1) | Represents monthly fixed storage commitments and lease rental payments under the relevant expiring defined contract and lease as of March 31, 2020, plus the weighted average monthly warehouse services revenues attributable to these contracts and leases for the last twelve months ended March 31, 2020, multiplied by 12. |
(2) | Represents annualized monthly revenues from fixed storage commitments and lease rental payments under the defined contracts and relevant expiring leases as of March 31, 2020 based upon the monthly revenues attributable thereto in the last month prior to expiration, multiplied by 12. |
25
| ||
Financial Supplement | First Quarter 2020 | |
The following table sets forth a summary schedule of the expirations of our facility leased warehouses and other leases pursuant to which we lease space to third parties in our warehouse portfolio, in each case, in place as of March 31, 2020. These leases had a weighted average remaining term of 43 months as of March 31, 2020.
Lease Expiration Year | No. of Leases Expiring | Annualized Rent(1) (in thousands) | % of Total Warehouse Rent & Storage Segment Revenue for the Twelve Months Ended March 31, 2020 | Leased Square Footage (in thousands) | % Leased Square Footage | Annualized Rent at Expiration(2) (in thousands) | ||||||||||||||
Month-to-Month | 2 | $ | 259 | — | % | 22 | 0.9 | % | $ | 259 | ||||||||||
2020 | 16 | 3,909 | 0.6 | % | 470 | 19.3 | % | 3,909 | ||||||||||||
2021 | 13 | 2,298 | 0.4 | % | 532 | 21.8 | % | 2,470 | ||||||||||||
2022 | 5 | 1,350 | 0.2 | % | 141 | 5.8 | % | 1,382 | ||||||||||||
2023 | 4 | 2,921 | 0.5 | % | 441 | 18.1 | % | 2,997 | ||||||||||||
2024 | 5 | 1,641 | 0.3 | % | 349 | 14.3 | % | 1,825 | ||||||||||||
2025 | 4 | 2,069 | 0.3 | % | 156 | 6.4 | % | 2,401 | ||||||||||||
2026 and thereafter | 4 | 3,617 | 0.6 | % | 329 | 13.4 | % | 3,931 | ||||||||||||
Total | 53 | $ | 18,064 | 2.8 | % | 2,440 | 100 | % | $ | 19,174 | ||||||||||
____________________
Note: March 31, 2020 LTM rent and storage revenue pro forma 2019 and 2020 acquisitions.
(1) | Represents monthly rental payments under the relevant leases as of March 31, 2020, multiplied by 12. |
(2) | Represents monthly rental payments under the relevant leases in the calendar year of expiration, multiplied by 12. |
26
| ||
Financial Supplement | First Quarter 2020 | |
Recurring Maintenance Capital Expenditures, Repair and Maintenance Expenses and
External Growth, Expansion and Development Capital Expenditures
We utilize a strategic and preventative approach to recurring maintenance capital expenditures and repair and maintenance expenses to maintain the high quality and operational efficiency of our warehouses and ensure that our warehouses meet the “mission-critical” role they serve in the cold chain.
Recurring Maintenance Capital Expenditures
The following table sets forth our recurring maintenance capital expenditures for the three months ended March 31, 2020 and 2019.
2020 | 2019 | ||||||
(In thousands, except per cubic foot amounts) | |||||||
Real estate | $ | 9,390 | $ | 4,485 | |||
Personal property | 2,298 | 171 | |||||
Information technology | 750 | 831 | |||||
Total recurring maintenance capital expenditures | $ | 12,438 | $ | 5,487 | |||
Total recurring maintenance capital expenditures per cubic foot | $ | 0.011 | $ | 0.006 | |||
Repair and Maintenance Expenses
The following table sets forth our repair and maintenance expenses for the three months ended March 31, 2020 and 2019.
2020 | 2019 | ||||||
(In thousands, except per cubic foot amounts) | |||||||
Real estate | $ | 6,797 | $ | 5,309 | |||
Personal property | 8,184 | 7,896 | |||||
Total repair and maintenance expenses | $ | 14,981 | $ | 13,205 | |||
Repair and maintenance expenses per cubic foot | $ | 0.014 | $ | 0.014 | |||
External Growth, Expansion and Development Capital Expenditures
The following table sets forth our external growth, expansion and development capital expenditures for the three months ended March 31, 2020 and 2019.
2020 | 2019 | ||||||
(In thousands - unaudited) | |||||||
Acquisitions, net of cash acquired and adjustments | $ | 315,583 | $ | 23,623 | |||
Expansion and development initiatives | 29,586 | 26,315 | |||||
Information technology | 951 | 722 | |||||
Total growth and expansion capital expenditures | $ | 346,120 | $ | 50,660 | |||
27
| ||
Financial Supplement | First Quarter 2020 | |
Global Warehouse Segment Financial Performance
The following table presents the operating results of our warehouse segment for the three months ended March 31, 2020 and 2019.
Three Months Ended March 31, | Change | ||||||||||||||||
2020 actual | 2020 constant currency(1) | 2019 actual | Actual | Constant currency | |||||||||||||
(Dollars in thousands - unaudited) | |||||||||||||||||
Rent and storage | $ | 162,308 | $ | 163,990 | $ | 126,380 | 28.4 | % | 29.8 | % | |||||||
Warehouse services | 218,760 | 222,219 | 163,235 | 34.0 | % | 36.1 | % | ||||||||||
Total warehouse segment revenue | 381,068 | 386,209 | 289,615 | 31.6 | % | 33.4 | % | ||||||||||
Power | 19,704 | 19,977 | 15,071 | 30.7 | % | 32.6 | % | ||||||||||
Other facilities costs (2) | 32,102 | 32,544 | 26,389 | 21.6 | % | 23.3 | % | ||||||||||
Labor | 170,138 | 173,044 | 132,919 | 28.0 | % | 30.2 | % | ||||||||||
Other services costs (3) | 32,351 | 32,686 | 24,417 | 32.5 | % | 33.9 | % | ||||||||||
Total warehouse segment cost of operations | 254,295 | 258,251 | 198,796 | 27.9 | % | 29.9 | % | ||||||||||
Warehouse segment contribution (NOI) | $ | 126,773 | $ | 127,958 | $ | 90,819 | 39.6 | % | 40.9 | % | |||||||
Warehouse rent and storage contribution (NOI) (4) | $ | 110,502 | $ | 111,469 | $ | 84,920 | 30.1 | % | 31.3 | % | |||||||
Warehouse services contribution (NOI) (5) | $ | 16,271 | $ | 16,489 | $ | 5,899 | 175.8 | % | 179.5 | % | |||||||
Total warehouse segment margin | 33.3 | % | 33.1 | % | 31.4 | % | 191 bps | 177 bps | |||||||||
Rent and storage margin(6) | 68.1 | % | 68.0 | % | 67.2 | % | 89 bps | 78 bps | |||||||||
Warehouse services margin(7) | 7.4 | % | 7.4 | % | 3.6 | % | 382 bps | 381 bps | |||||||||
(1) | The adjustments from our U.S. GAAP operating results to calculate our operating results on a constant currency basis are the effect of changes in foreign currency exchange rates relative to the comparable prior period. |
(2) | Includes real estate rent expense of $2.8 million and $3.2 million for the first quarter 2020 and 2019, respectively. |
(3) | Includes non-real estate rent expense (equipment lease and rentals) of $2.8 million and $3.4 million for the first quarter of 2020 and 2019, respectively. |
(4) | Calculated as rent and storage revenues less power and other facilities costs. |
(5) | Calculated as warehouse services revenues less labor and other services costs. |
(6) | Calculated as warehouse rent and storage contribution (NOI) divided by warehouse rent and storage revenues. |
(7) | Calculated as warehouse services contribution (NOI) divided by warehouse services revenues. |
28
| ||
Financial Supplement | First Quarter 2020 | |
Same-store Financial Performance
The following table presents revenues, cost of operations, contribution (NOI) and margins for our same stores and non-same stores with a reconciliation to the total financial metrics of our warehouse segment for the three months ended March 31, 2020 and 2019.
Three Months Ended March 31, | Change | ||||||||||||||||
2020 actual | 2020 constant currency(1) | 2019 actual | Actual | Constant currency | |||||||||||||
Number of same store warehouses | 136 | 136 | n/a | n/a | |||||||||||||
Same store revenues: | (Dollars in thousands - unaudited) | ||||||||||||||||
Rent and storage | $ | 125,875 | $ | 127,446 | $ | 120,550 | 4.4 | % | 5.7 | % | |||||||
Warehouse services | 165,988 | 169,390 | 157,507 | 5.4 | % | 7.5 | % | ||||||||||
Total same store revenues | 291,863 | 296,836 | 278,057 | 5.0 | % | 6.8 | % | ||||||||||
Same store cost of operations: | |||||||||||||||||
Power | 14,112 | 14,370 | 14,483 | (2.6 | )% | (0.8 | )% | ||||||||||
Other facilities costs | 25,128 | 25,525 | 24,508 | 2.5 | % | 4.1 | % | ||||||||||
Labor | 133,072 | 135,931 | 127,352 | 4.5 | % | 6.7 | % | ||||||||||
Other services costs | 22,303 | 22,620 | 23,149 | (3.7 | )% | (2.3 | )% | ||||||||||
Total same store cost of operations | $ | 194,615 | $ | 198,446 | $ | 189,492 | 2.7 | % | 4.7 | % | |||||||
Same store contribution (NOI) | $ | 97,248 | $ | 98,390 | $ | 88,565 | 9.8 | % | 11.1 | % | |||||||
Same store rent and storage contribution (NOI)(2) | $ | 86,635 | $ | 87,551 | $ | 81,559 | 6.2 | % | 7.3 | % | |||||||
Same store services contribution (NOI)(3) | $ | 10,613 | $ | 10,839 | $ | 7,006 | 51.5 | % | 54.7 | % | |||||||
Total same store margin | 33.3 | % | 33.1 | % | 31.9 | % | 147 bps | 129 bps | |||||||||
Same store rent and storage margin(4) | 68.8 | % | 68.7 | % | 67.7 | % | 117 bps | 104 bps | |||||||||
Same store services margin(5) | 6.4 | % | 6.4 | % | 4.4 | % | 195 bps | 195 bps | |||||||||
Number of non-same store warehouses | 36 | 8 | n/a | n/a | |||||||||||||
Non-same store revenues: | |||||||||||||||||
Rent and storage | $ | 36,433 | $ | 36,544 | $ | 5,830 | n/r | n/r | |||||||||
Warehouse services | 52,772 | 52,829 | 5,728 | n/r | n/r | ||||||||||||
Total non-same store revenues | 89,205 | 89,373 | 11,558 | n/r | n/r | ||||||||||||
Non-same store cost of operations: | |||||||||||||||||
Power | 5,592 | 5,607 | 588 | n/r | n/r | ||||||||||||
Other facilities costs | 6,974 | 7,019 | 1,881 | n/r | n/r | ||||||||||||
Labor | 37,066 | 37,113 | 5,567 | n/r | n/r | ||||||||||||
Other services costs | 10,048 | 10,066 | 1,268 | n/r | n/r | ||||||||||||
Total non-same store cost of operations | $ | 59,680 | $ | 59,805 | $ | 9,304 | n/r | n/r | |||||||||
Non-same store contribution (NOI) | $ | 29,525 | $ | 29,568 | $ | 2,254 | n/r | n/r | |||||||||
Non-same store rent and storage contribution (NOI)(2) | $ | 23,867 | $ | 23,918 | $ | 3,361 | n/r | n/r | |||||||||
Non-same store services contribution (NOI)(3) | $ | 5,658 | $ | 5,650 | $ | (1,107 | ) | n/r | n/r | ||||||||
Total warehouse segment revenues | $ | 381,068 | $ | 386,209 | $ | 289,615 | 31.6 | % | 33.4 | % | |||||||
Total warehouse cost of operations | $ | 254,295 | $ | 258,251 | $ | 198,796 | 27.9 | % | 29.9 | % | |||||||
Total warehouse segment contribution | $ | 126,773 | $ | 127,958 | $ | 90,819 | 39.6 | % | 40.9 | % | |||||||
(1) | The adjustments from our U.S. GAAP operating results to calculate our operating results on a constant currency basis is the effect of changes in foreign currency exchange rates relative to the comparable prior period. |
(2) | Calculated as rent and storage revenues less power and other facilities costs. |
(3) | Calculated as warehouse services revenues less labor and other services costs. |
(4) | Calculated as same store rent and storage contribution (NOI) divided by same store rent and storage revenues. |
(5) | Calculated as same store warehouse services contribution (NOI) divided by same store warehouse services revenues. |
29
| ||
Financial Supplement | First Quarter 2020 | |
Same-store Key Operating Metrics
The following table provides certain operating metrics to explain the drivers of our same store performance for the three months ended March 31, 2020 and 2019.
Three Months Ended March 31, | Change | |||||||||
Units in thousands except per pallet and site data - unaudited | 2020 | 2019 | ||||||||
Number of same store warehouses | 136 | 136 | n/a | |||||||
Same store rent and storage: | ||||||||||
Economic occupancy(1) | ||||||||||
Average economic occupied pallets | 2,490 | 2,391 | 4.1 | % | ||||||
Economic occupancy percentage | 81.8 | % | 78.4 | % | 337 bps | |||||
Same store rent and storage revenues per economic occupied pallet | $ | 50.55 | $ | 50.42 | 0.3 | % | ||||
Constant currency same store rent and storage revenue per economic occupied pallet | $ | 51.18 | $ | 50.42 | 1.5 | % | ||||
Physical occupancy(2) | ||||||||||
Average physical occupied pallets | 2,305 | 2,266 | 1.7 | % | ||||||
Average physical pallet positions | 3,044 | 3,049 | (0.2 | )% | ||||||
Physical occupancy percentage | 75.7 | % | 74.3 | % | 140 bps | |||||
Same store rent and storage revenues per physical occupied pallet | $ | 54.60 | $ | 53.20 | 2.6 | % | ||||
Constant currency same store rent and storage revenues per physical occupied pallet | $ | 55.28 | $ | 53.20 | 3.9 | % | ||||
Same store warehouse services: | ||||||||||
Throughput pallets | 6,467 | 6,296 | 2.7 | % | ||||||
Same store warehouse services revenues per throughput pallet | $ | 25.67 | $ | 25.02 | 2.6 | % | ||||
Constant currency same store warehouse services revenues per throughput pallet | $ | 26.19 | $ | 25.02 | 4.7 | % | ||||
Number of non-same store warehouses | 36 | 8 | n/a | |||||||
Non-same store rent and storage: | ||||||||||
Economic occupancy(1) | ||||||||||
Average economic occupied pallets | 766 | 116 | n/r | |||||||
Economic occupancy percentage | 79.6 | % | 87.2 | % | ||||||
Physical occupancy(2) | ||||||||||
Average physical occupied pallets | 743 | 108 | n/r | |||||||
Average physical pallet positions | 962 | 133 | n/r | |||||||
Physical occupancy percentage | 77.2 | % | 81.2 | % | ||||||
Non-same store warehouse services: | ||||||||||
Throughput pallets | 1,732 | 225 | n/r | |||||||
(1) | We define average economic occupancy as the aggregate number of physically occupied pallets and any additional pallets otherwise contractually committed for a given period, without duplication. We estimate the number of contractually committed pallet positions by taking into account actual pallet commitments specified in each customer’s contract, and subtracting the physical pallet positions. |
(2) | We define average physical occupancy as the average number of occupied pallets divided by the estimated number of average physical pallet positions in our warehouses for the applicable period. We estimate the number of physical pallet positions by taking into account actual racked space and by estimating unracked space on an as-if racked basis. We base this estimate on a formula utilizing the total cubic feet of each room within the warehouse that is unracked divided by the volume of an assumed rack space that is consistent with the characteristics of the relevant warehouse. On a warehouse by warehouse basis, rack space generally ranges from three to four feet depending upon the type of facility and the nature of the customer goods stored therein. The number of our pallet positions is reviewed and updated quarterly, taking into account changes in racking configurations and room utilization. |
30
| ||
Financial Supplement | First Quarter 2020 | |
External Growth and Capital Deployment
Recently Completed Expansion and Development Projects | ||||||||||||||||||||
Opportunity Type | Facility Type | Tenant Opportunity | Cubic Feet (in millions) | Pallet Positions (in thousands) | Cost of Expansion / Development | Completion Date | Expected Full Stabilized Quarter | |||||||||||||
Facility | Total Cost (in millions) | NOI ROIC | ||||||||||||||||||
Middleboro, MA | Development | Production Advantaged | Build-to-suit | 4.4 | 27 | $23.5 | 8-12% | Q3 2018 | Q4 2018 | |||||||||||
Rochelle, IL (1) | Expansion | Distribution | Multi-tenant | 15.7 | 54 | $90.2 | 12-15% | Q2 2019 | Q1 2021 | |||||||||||
Chesapeake, VA (2) | Expansion | Public | Multi-tenant | 4.5 | 12 | $24.9 | 10-12% | Q4 2019 | Q1 2021 | |||||||||||
North Little Rock, AR (3) | Expansion | Public | Multi-tenant | 3.2 | 12 | $19.2 | 10-12% | Q4 2019 | Q1 2021 | |||||||||||
Columbus, OH (4) | Expansion | Public | Multi-tenant | 1.5 | 5 | $6.9 | 14-15% | Q1 2020 | Q2 2021 | |||||||||||
Expansion and Development Projects In Process and Announced | ||||||||||||||||||||||||
Under Construction | Investment in Expansion / Development (in millions) | Expected Stabilized NOI ROIC | Target Complete Date | Expected Full Stabilized Quarter | ||||||||||||||||||||
Facility | Opportunity Type | Facility Type | Tenant Opportunity | Cubic Feet (millions) (5) | Pallet Positions (thousands) (5) | Cost (6) | Estimate to Complete | Total Estimated Cost | ||||||||||||||||
Savannah, GA (7) | New Build | Distribution | Multi-tenant | 14.8 | 37 | $69.5 | $5.0-$6.0 | $70-$75 | 10-15% | Q2 2020 | Q3 2021 | |||||||||||||
Atlanta, GA | Expansion /Redevelopment | Distribution | Multi-tenant | 18.3 | 60 | $34.9 | $91.0-$101.0 | $126-$136 | 10-15% | Q2 2021 | Q1 2023 | |||||||||||||
Auckland, New Zealand(11) | Expansion | Distribution | Multi-tenant | 4.6 | 27 | NZD $0.0 | NZD $65.0 | NZD $65.0 | 12-14% | Q2 2021 | Q3 2022 | |||||||||||||
Recent Acquisitions | |||||||||||||||||||||
Facility | Metropolitan Area | No. of Facilities | Cubic Feet (in millions) | Pallet Positions (in thousands) | Acquisition Price (in millions) | Net Entry NOI Yield (8) | Expected Three Year Stabilized NOI ROIC | Date Purchased | Expected Full Stabilized Quarter | ||||||||||||
PortFresh Holdings, LLC | Savannah, GA | 1 | 4.3 | 6 | $20.0 | 6.7 | % | 9-12% | 1/31/2019 | Q2 2022 | |||||||||||
Cloverleaf Cold Storage (9) | 9 states | 22 | 132.0 | 602 | $1,242.9 | 6.5 | % | 7-8% | 5/1/2019 | Q3 2022 | |||||||||||
Lanier Cold Storage | Georgia | 2 | 14.4 | 51 | $82.6 | 7.6 | % | 9-10% | 5/1/2019 | Q3 2022 | |||||||||||
MHW Group Inc. (10) | MD and PA | 2 | 19.0 | 86 | $55.7 | 7.8 | % | 9-10% | 11/19/2019 | Q4 2022 | |||||||||||
Nova Cold Logistics (9) | Canada | 4 | 23.5 | 81 | CAD $338.6 | 6.1 | % | 6.5-7.0% | 1/2/2020 | Q2 2023 | |||||||||||
Newport Cold | St. Paul, MN | 1 | 6.1 | 26 | $57.1 | 7.5 | % | 9-10% | 1/2/2020 | Q2 2023 | |||||||||||
_________________________
(1) | Cost to date as of March 31, 2020. Total cost expected to be approximately $92 - $93 million. Remaining spend incurred reflects residual cost and retainage. |
(2) | Cost to date as of March 31, 2020. Total cost expected to be approximately $26 - $27 million. Remaining spend incurred reflects residual cost and retainage. |
(3) | Cost to date as of March 31, 2020. Total cost expected to be approximately $19 - $20 million. Remaining spend incurred reflects residual cost and retainage. |
(4) | Cost to date as of March 31, 2020. Total cost expected to be approximately $7 - $8 million. Remaining spend incurred reflects residual cost and retainage. |
(5) | Cubic feet and pallet positions are estimates while the facilities are under construction. |
(6) | Cost as of March 31, 2020. |
(7) | Cost includes $15.9 million as part of the PortFresh Holdings, LLC acquisition completed during January 2019. |
(8) | Inclusive of expenses required to integrate and reach stabilization. |
(9) | Net Entry NOI Yield metric is exclusive of SG&A expense. |
(10) | Acquisition price includes a $4.1 million option to purchase land under lease at date of acquisition, which was subsequently exercised during January 2020. |
(11) | Target completion date is subject to change due to ongoing delays in construction due to COVID-19 restrictions. |
31
| ||
Financial Supplement | First Quarter 2020 | |
2020 Guidance
The ranges for these metrics do not include the impact of acquisitions, dispositions, or capital markets activity beyond that which has been previously announced.
As of | As of | ||
May 7, 2020 | Feb. 20, 2020 | ||
Warehouse segment same store revenue growth (actual and constant currency) | 2.0% - 4.0% | 2.0% - 4.0% | |
Warehouse segment same store NOI growth (actual and constant currency) | 100 - 200 bps higher than associated revenue | 100 - 200 bps higher than associated revenue | |
Managed and Transportation segment NOI | $28M - $31M | $28M - $31M | |
Total selling, general and administrative expense | $135M - $140M | $135M - $140M | |
Current income tax expense | $8M - $10M | $11M - $13M | |
Deferred income tax benefit | $2M - $3M | $1M - $3M | |
Non real estate amortization and depreciation expense | $66M - $68M | $66M - $68M | |
Total recurring maintenance capital expenditures | $65M - $75M | $65M - $75M | |
Development starts (1) | $75M - $200M | $75M - $200M | |
AFFO per share | $1.22 - $1.30 | $1.22 - $1.30 | |
Assumed FX rates | 1 AUS = 0.64 USD 1 NZD = 0.62 USD 1 ARS = 0.016 USD 1 CAD = 0.72 USD 1 BRL = 0.18 USD | 1 AUS = 0.68 USD 1 NZD = 0.63 USD 1 ARS = 0.018 USD 1 CAD = 0.76 USD 1 BRL = 0.23 USD | |
(1) | Represents the aggregate invested capital for initiated development opportunities. |
32
| ||
Financial Supplement | First Quarter 2020 | |
Notes and Definitions |
We calculate funds from operations, or FFO, in accordance with the standards established by the Board of Governors of the National Association of Real Estate Investment Trusts, or NAREIT. NAREIT defines FFO as net income or loss determined in accordance with U.S. GAAP, excluding extraordinary items as defined under U.S. GAAP and gains or losses from sales of previously depreciated operating real estate assets, plus specified non-cash items, such as real estate asset depreciation and amortization, and after adjustments for unconsolidated partnerships and joint ventures. We believe that FFO is helpful to investors as a supplemental performance measure because it excludes the effect of depreciation, amortization and gains or losses from sales of real estate, all of which are based on historical costs, which implicitly assumes that the value of real estate diminishes predictably over time. Since real estate values instead have historically risen or fallen with market conditions, FFO can facilitate comparisons of operating performance between periods and among other equity REITs. |
We calculate core funds from operations, or Core FFO, as FFO adjusted for the effects of gain or loss on the sale of non-real estate assets, non-real estate asset impairment, acquisition, litigation and other expenses, excluding 2018 RSU modification expense, share-based compensation expense, IPO grants, bridge loan commitment fees, loss on debt extinguishment, modifications and termination of derivative instruments, foreign currency exchange gain or loss, gain from sale of partially owned entities, excise tax settlement and Alternative Minimum Tax receivable from TCJA. We believe that Core FFO is helpful to investors as a supplemental performance measure because it excludes the effects of certain items which can create significant earnings volatility, but which do not directly relate to our core business operations. We believe Core FFO can facilitate comparisons of operating performance between periods, while also providing a more meaningful predictor of future earnings potential. |
However, because FFO and Core FFO add back real estate depreciation and amortization and do not capture the level of recurring maintenance capital expenditures necessary to maintain the operating performance of our properties, both of which have material economic impacts on our results from operations, we believe the utility of FFO and Core FFO as a measure of our performance may be limited. |
We calculate adjusted funds from operations, or Adjusted FFO, as Core FFO adjusted for the effects of amortization of financing costs, pension withdrawal liability and above or below market leases, straight-line net rent, provision or benefit from deferred income taxes, stock-based compensation expense from grants of stock options and restricted stock units under our equity incentive plans, excluding IPO grants, non-real estate depreciation, depletion or amortization (including in respect of the China JV), and recurring maintenance capital expenditures. We believe that Adjusted FFO is helpful to investors as a meaningful supplemental comparative performance measure of our ability to make incremental capital investments in our business and to assess our ability to fund distribution requirements from our operating activities. |
FFO, Core FFO and Adjusted FFO are used by management, investors and industry analysts as supplemental measures of operating performance of equity REITs. FFO, Core FFO and Adjusted FFO should be evaluated along with U.S. GAAP net income and net income per diluted share (the most directly comparable U.S. GAAP measures) in evaluating our operating performance. FFO, Core FFO and Adjusted FFO do not represent net income or cash flows from operating activities in accordance with U.S. GAAP and are not indicative of our results of operations or cash flows from operating activities as disclosed in our consolidated statements of operations included in our annual and quarterly reports. FFO, Core FFO and Adjusted FFO should be considered as supplements, but not alternatives, to our net income or cash flows from operating activities as indicators of our operating performance. Moreover, other REITs may not calculate FFO in accordance with the NAREIT definition or may interpret the NAREIT definition differently than we do. Accordingly, our FFO may not be comparable to FFO as calculated by other REITs. In addition, there is no industry definition of Core FFO or Adjusted FFO and, as a result, other REITs may also calculate Core FFO or Adjusted FFO, or other similarly-captioned metrics, in a manner different than we do. The table above reconciles FFO, Core FFO and Adjusted FFO to net income, which is the most directly comparable financial measure calculated in accordance with U.S. GAAP. |
We calculate EBITDA for Real Estate, or EBITDAre, in accordance with the standards established by the Board of Governors of NAREIT, defined as, earnings before interest expense, taxes, depreciation, depletion and amortization, gains or losses on disposition of depreciated property, including gains or losses on change of control, impairment write-downs of depreciated property and of investments in unconsolidated affiliates caused by a decrease in value of depreciated property in the affiliate, and adjustment to reflect share of EBITDAre of unconsolidated affiliates. EBITDAre is a measure commonly used in our industry, and we present EBITDAre to enhance investor understanding of our operating performance. We believe that EBITDAre provides investors and analysts with a measure of operating results unaffected by differences in capital structures, capital investment cycles and useful life of related assets among otherwise comparable companies. |
We also calculate our Core EBITDA as EBITDAre further adjusted for impairment charges on intangible and long-lived assets, gain or loss on depreciable real property asset disposals, acquisition, litigation and other expenses, bridge loan commitment fees, loss on debt extinguishment and modifications, share-based compensation expense, foreign currency exchange gain or loss, loss on partially owned entities, gain on sale of partially owned entities, impairment of partially owned entities, and multi-employer pension plan withdrawal expense. We believe that the presentation of Core EBITDA provides a measurement of our operations that is meaningful to investors because it excludes the effects of certain items that are otherwise included in EBITDA but which we do not believe are indicative of our core business operations. EBITDA and Core EBITDA are not measurements of financial performance under U.S. GAAP, and our EBITDA and Core EBITDA may not be comparable to similarly titled measures of other companies. You should not consider our EBITDA and Core EBITDA as alternatives to net income or cash flows from operating activities determined in accordance with U.S. GAAP. Our calculations of EBITDA and Core EBITDA have limitations as analytical tools, including: |
• | these measures do not reflect our historical or future cash requirements for recurring maintenance capital expenditures or growth and expansion capital expenditures; |
• | these measures do not reflect changes in, or cash requirements for, our working capital needs; |
• | these measures do not reflect the interest expense, or the cash requirements necessary to service interest or principal payments, on our indebtedness; |
• | these measures do not reflect our tax expense or the cash requirements to pay our taxes; and |
• | although depreciation, depletion and amortization are non-cash charges, the assets being depreciated, depleted and amortized will often have to be replaced in the future and these measures do not reflect any cash requirements for such replacements. |
We use Core EBITDA and EBITDAre as measures of our operating performance and not as measures of liquidity. The table on page 18 reconciles EBITDA, EBITDAre and Core EBITDA to net income, which is the most directly comparable financial measure calculated in accordance with U.S. GAAP. |
All quarterly amounts and non-GAAP disclosures within this filing shall be deemed unaudited. |
33