 | Exhibit 99.1 | ||||||||||
Core Scientific Announces Fiscal First Quarter 2025 Results
First Quarter 2025 Highlights
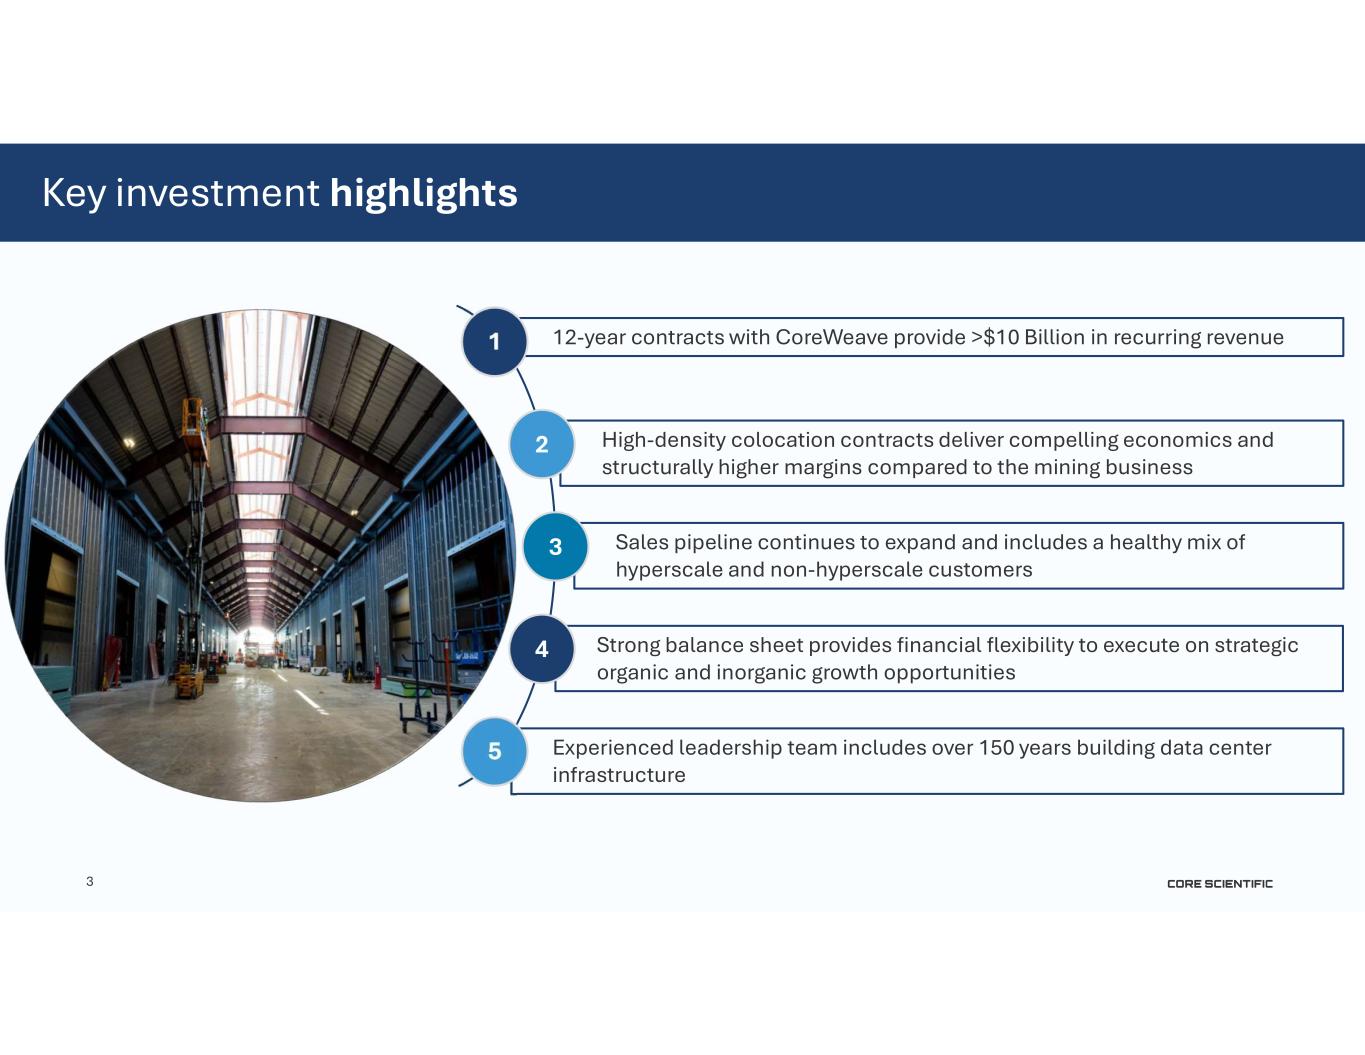
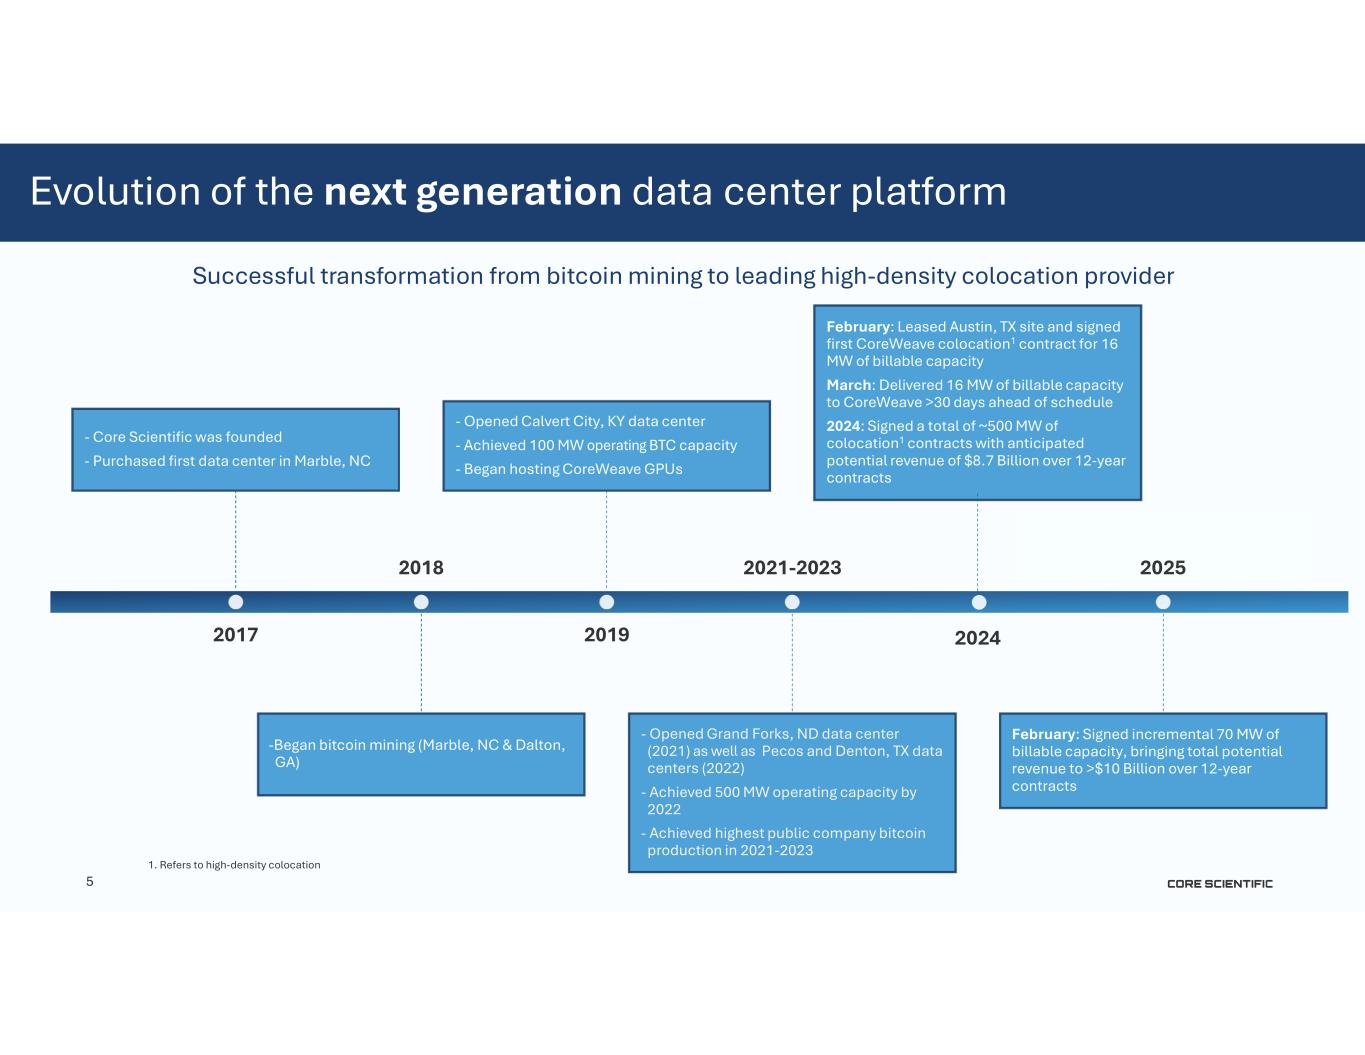
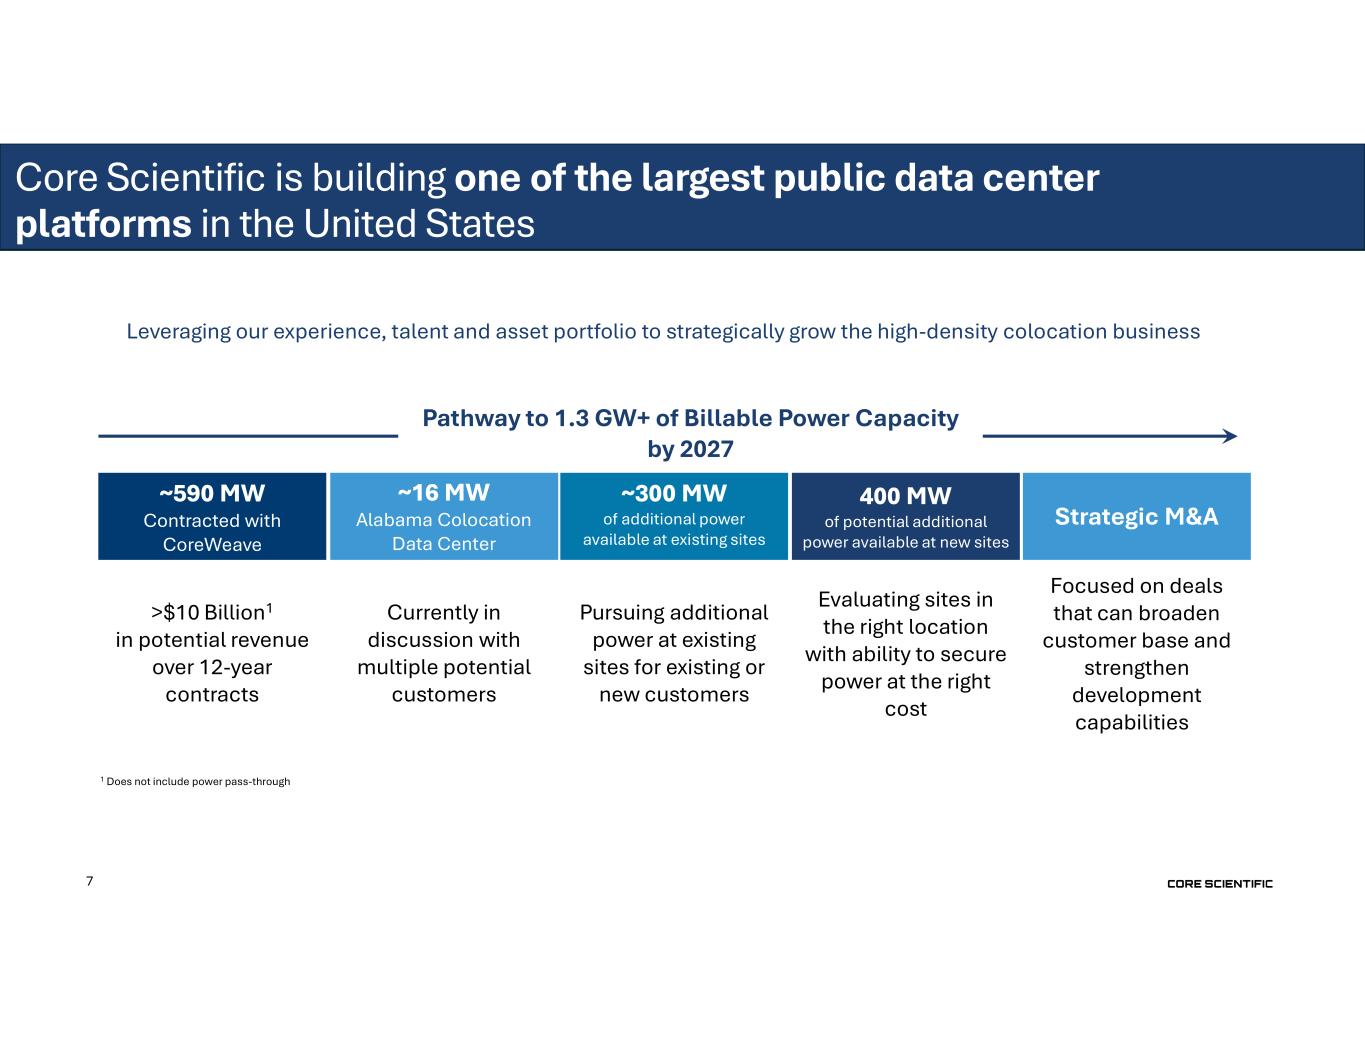
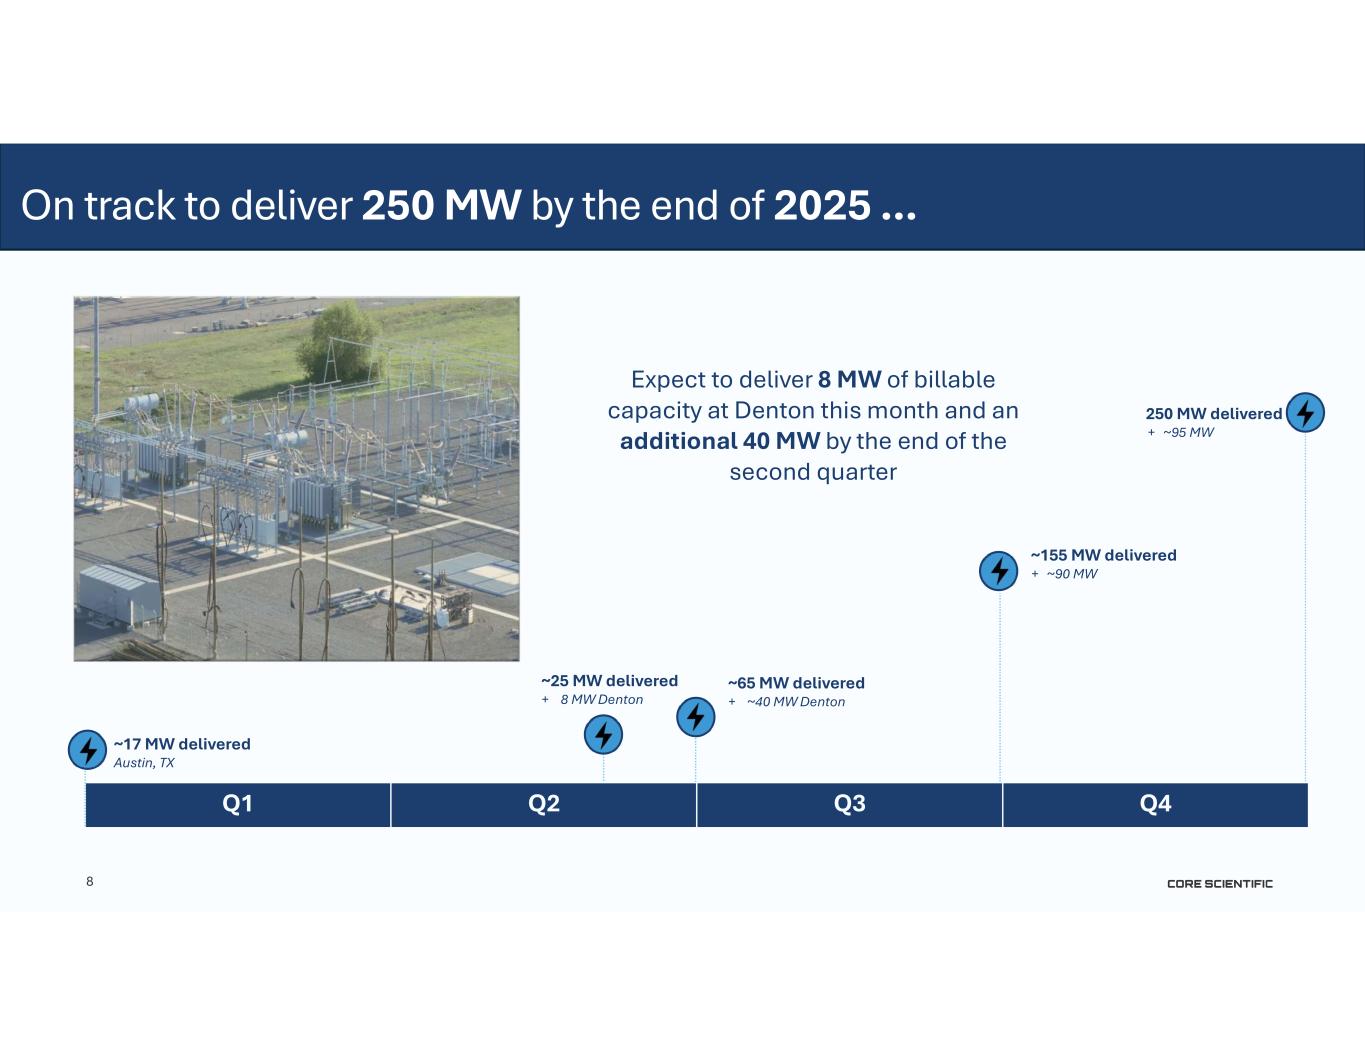
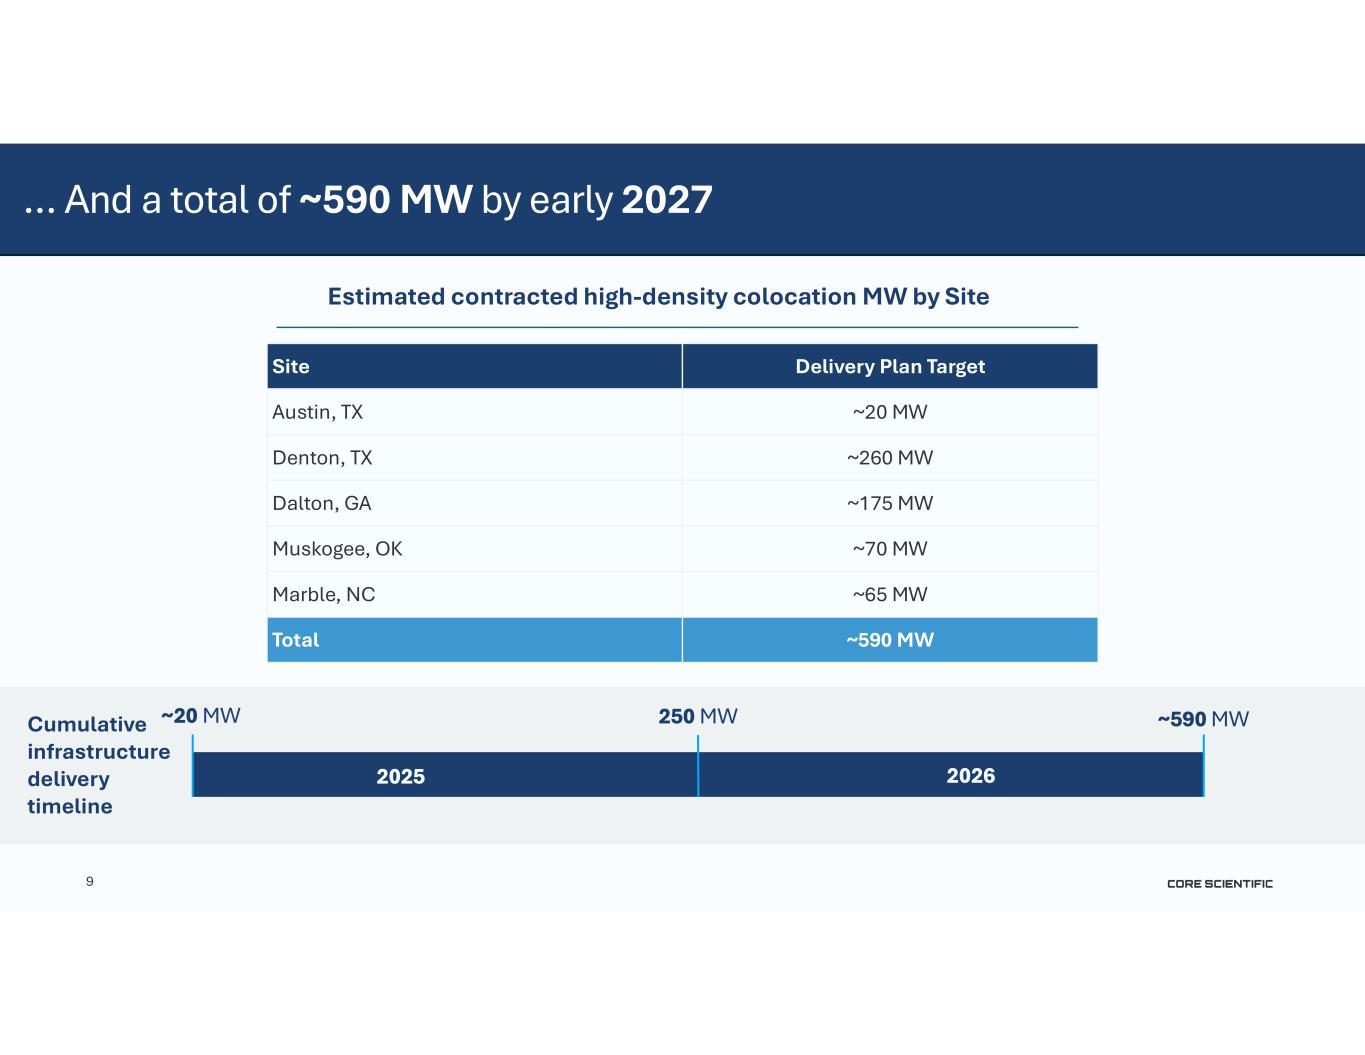
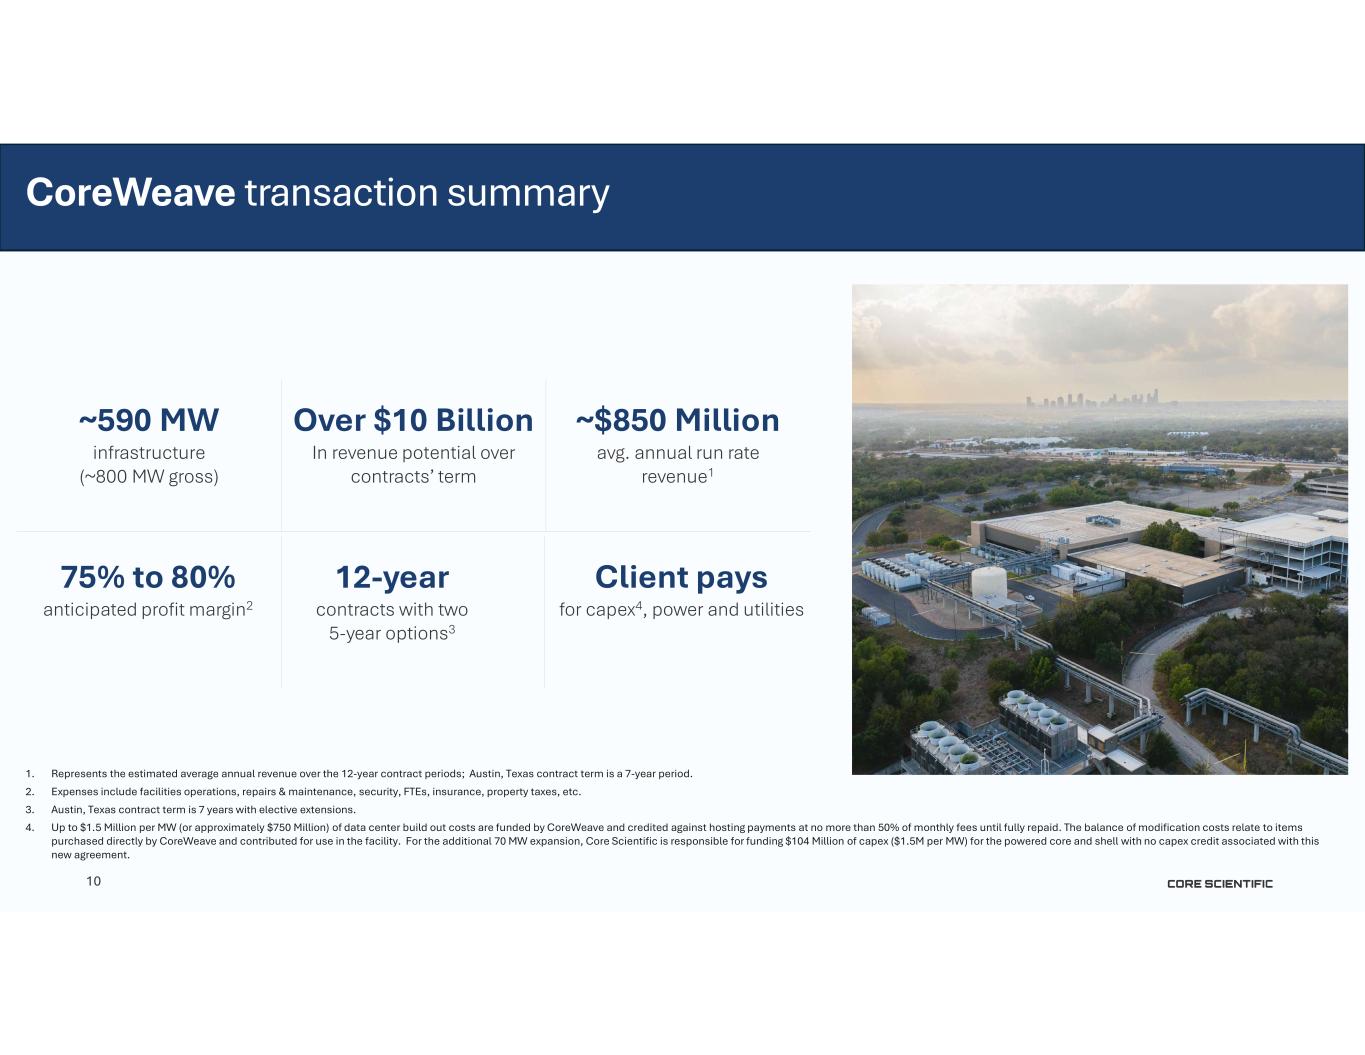
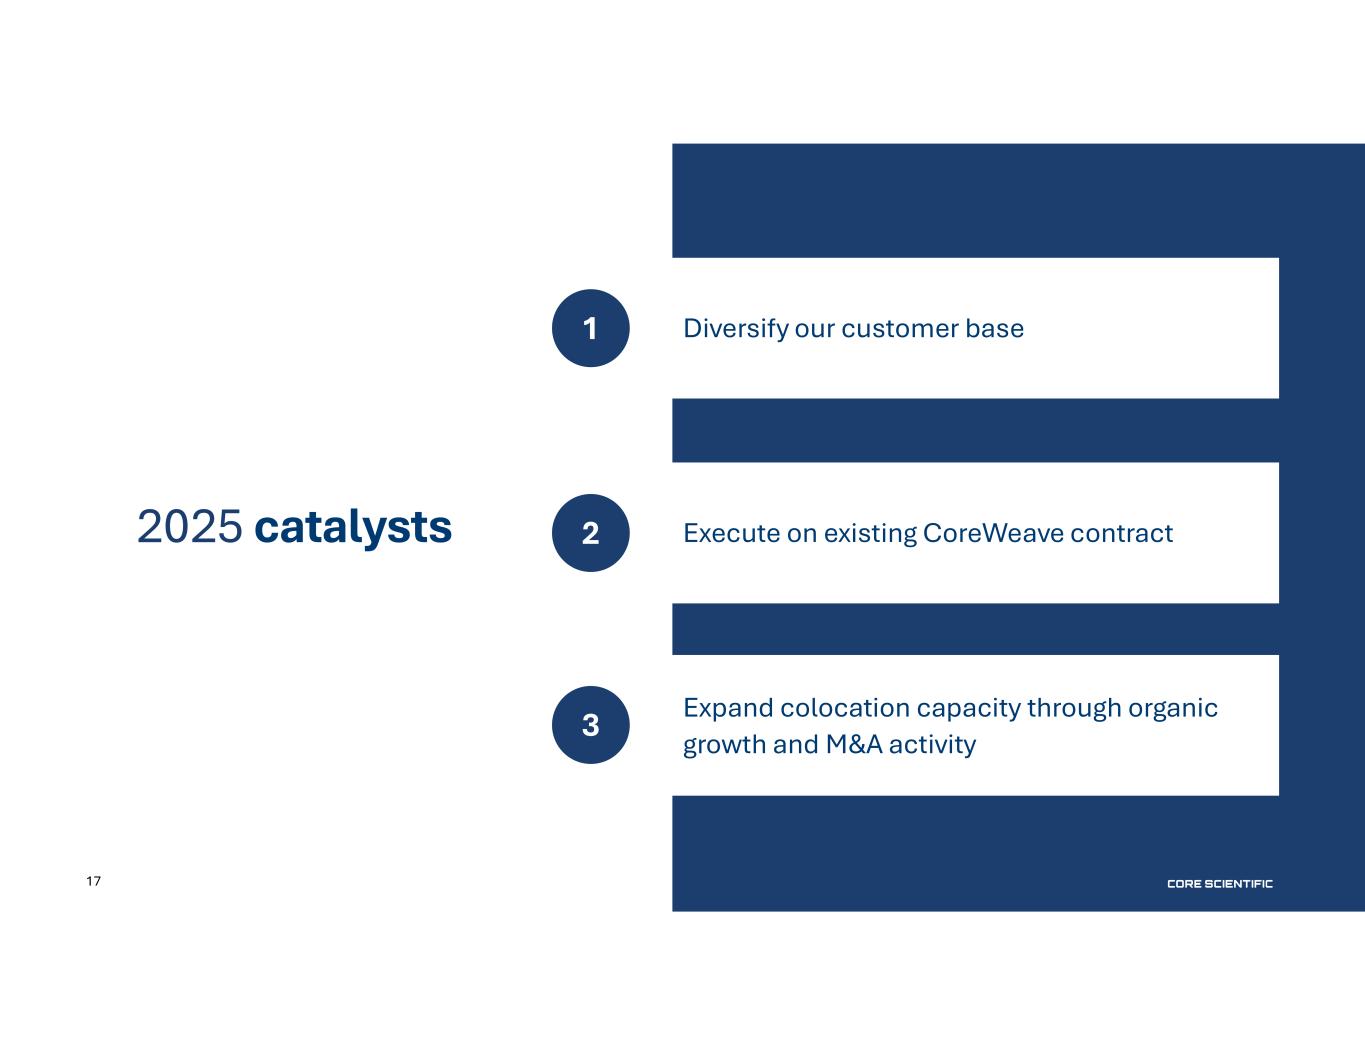
•On track to deliver 250MW of billable capacity to CoreWeave by the end of this year and anticipate entering 2026 with annualized colocation revenue of approximately $360 million.
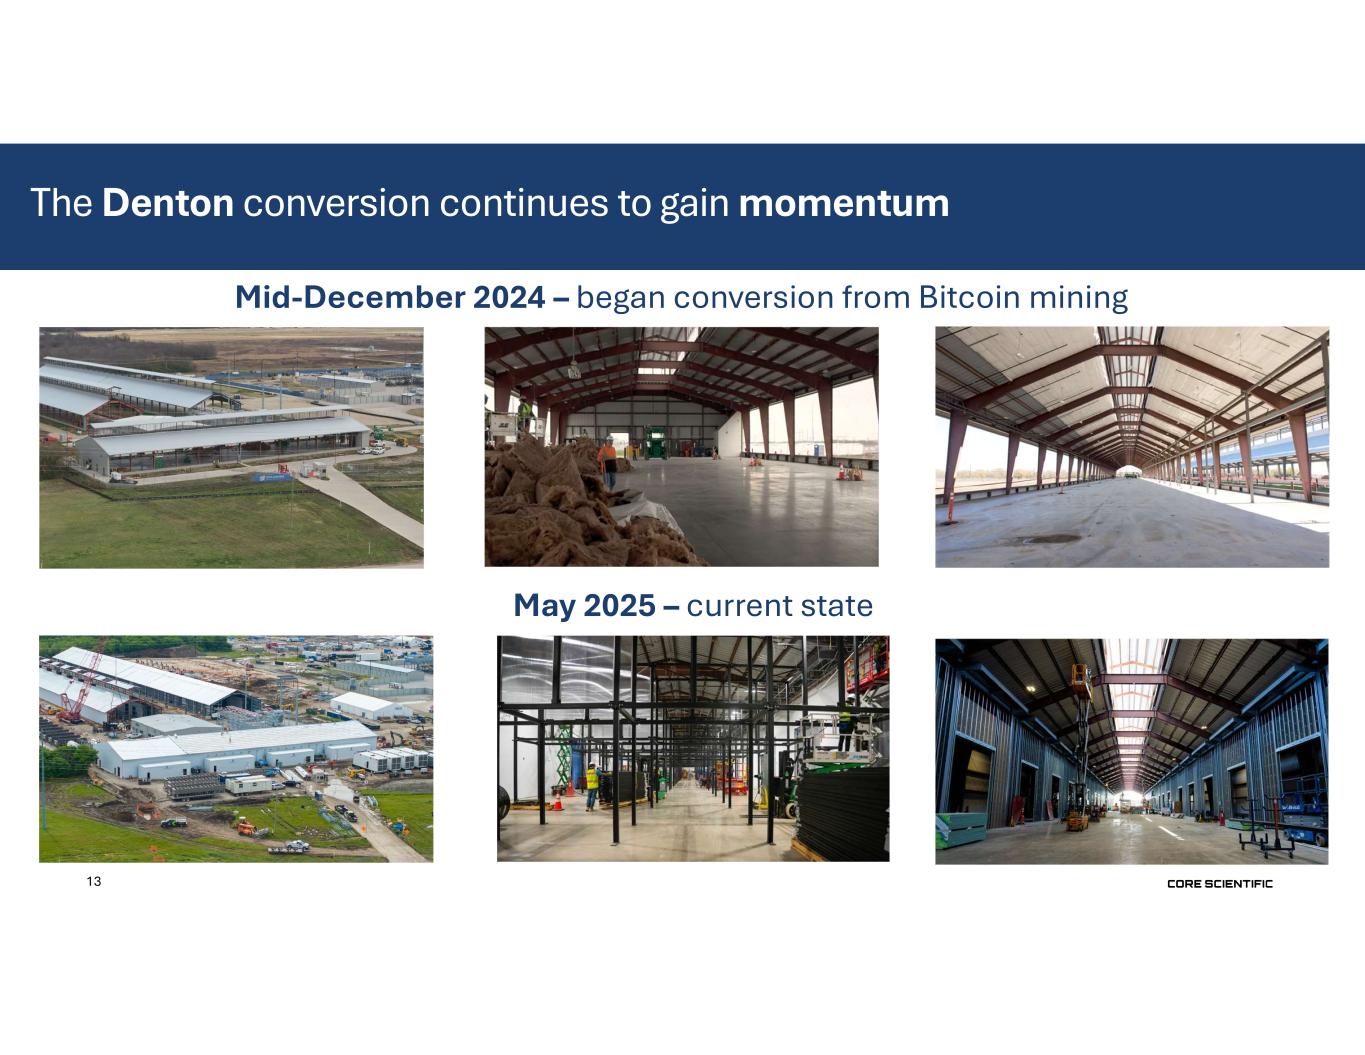
•First tranche of 8MW of billable capacity at Denton to be delivered to CoreWeave by the end of this month and an additional approximately 40MW by the end of this quarter.
•Ended the quarter with a strong liquidity position, including $778.6 million in cash and cash equivalents and digital assets, maintaining financial flexibility to execute on strategic organic and inorganic growth opportunities.
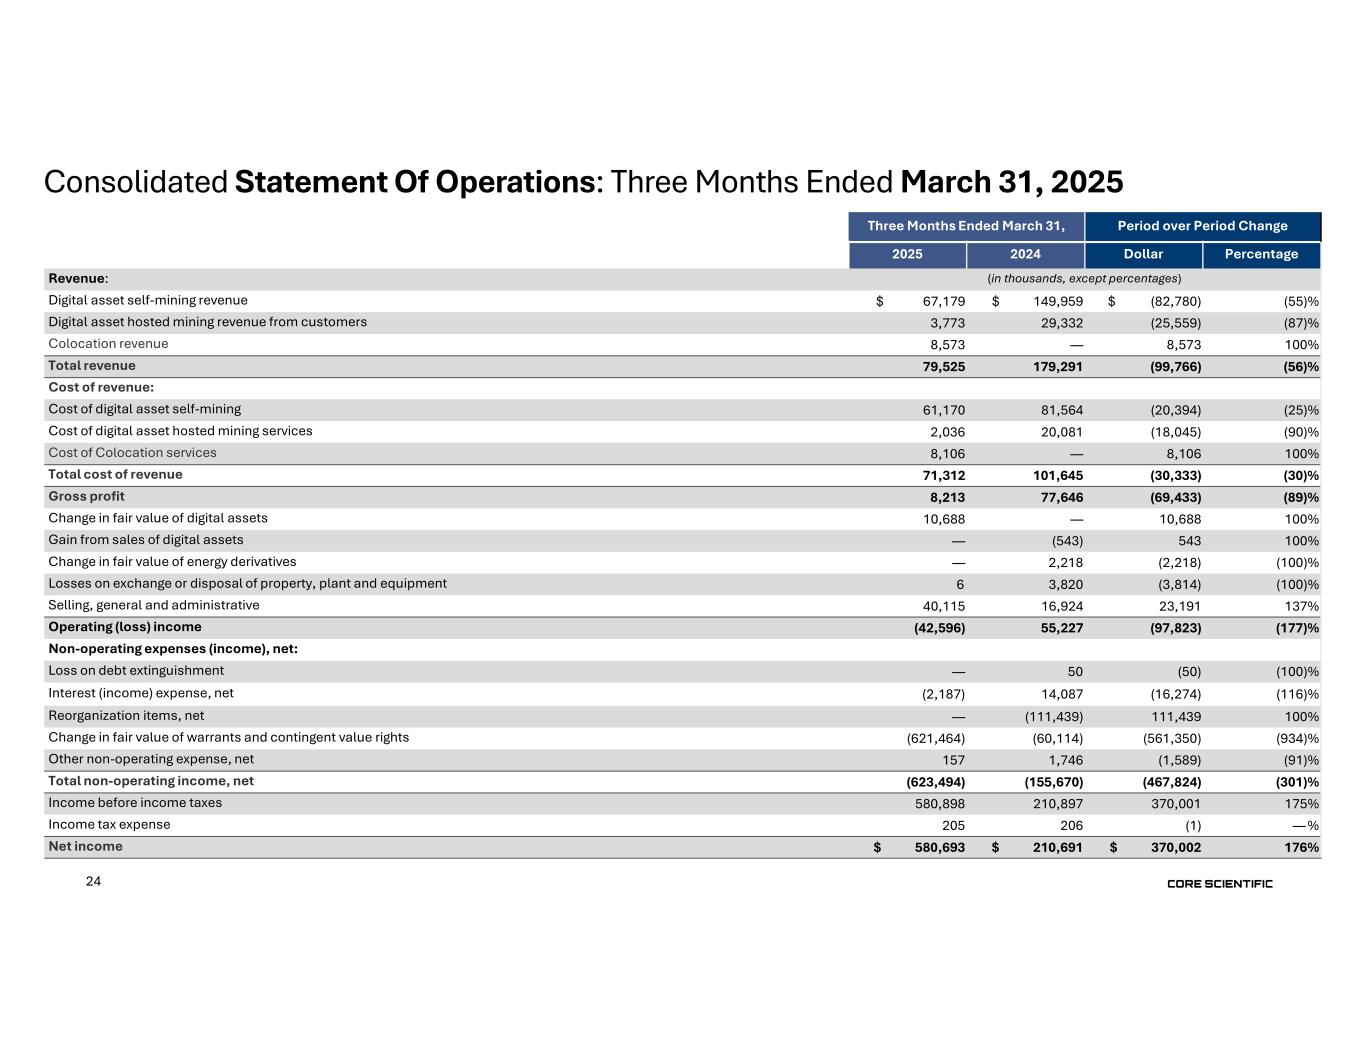
AUSTIN, Texas, May 7, 2025 - Core Scientific, Inc. (NASDAQ: CORZ), a leader in digital infrastructure for high-density colocation services and digital asset mining, today announced financial results for the fiscal first quarter of 2025. Net income was $580.7 million, as compared to $210.7 million for the same period in 2024. Total revenue was $79.5 million, as compared to $179.3 million for the same period last year. Operating loss was $42.6 million, as compared to Operating income of $55.2 million for the same period in 2024. Adjusted EBITDA was $(6.1) million, as compared to $88.0 million for the same period in the prior year. First quarter net income of $580.7 million resulted primarily from a net $621.5 million non-cash mark-to-market adjustment in the value of our tranche 1 and tranche 2 warrants and other contingent value rights required as a result of the significant quarter-over-quarter decrease in our share price.
“This quarter marks an inflection point for Core Scientific. In a matter of months, we have transformed vision into execution, delivering infrastructure at scale and positioning ourselves at the center of one of the most important shifts in modern computing. The pace of demand for high-performance data infrastructure is accelerating, and our ability to move with speed and precision is setting us apart. We are not just expanding capacity; we are shaping the foundation for the next era of data center infrastructure,” said Adam Sullivan, Core Scientific’s Chief Executive Officer.
Fiscal First Quarter 2025 Financial Results (Compared to Fiscal First Quarter 2024)
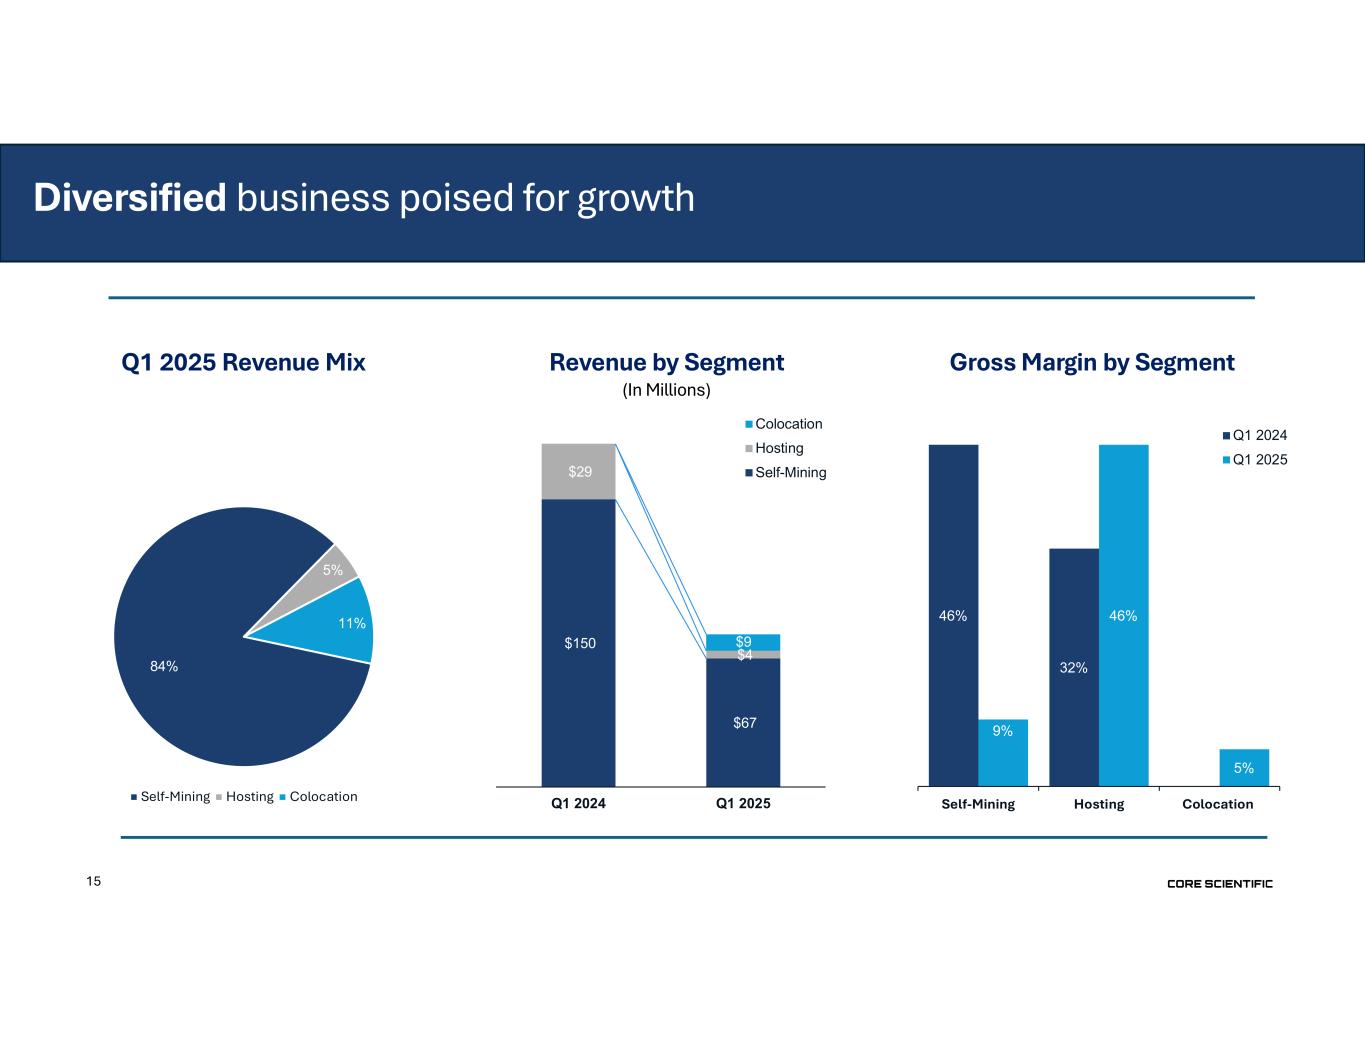
Total revenue for the fiscal first quarter of 2025 was $79.5 million, consisting of $67.2 million in Digital asset self-mining revenue, $3.8 million in Digital asset hosted mining revenue and $8.6 million in Colocation (formerly “HPC hosting”) revenue.
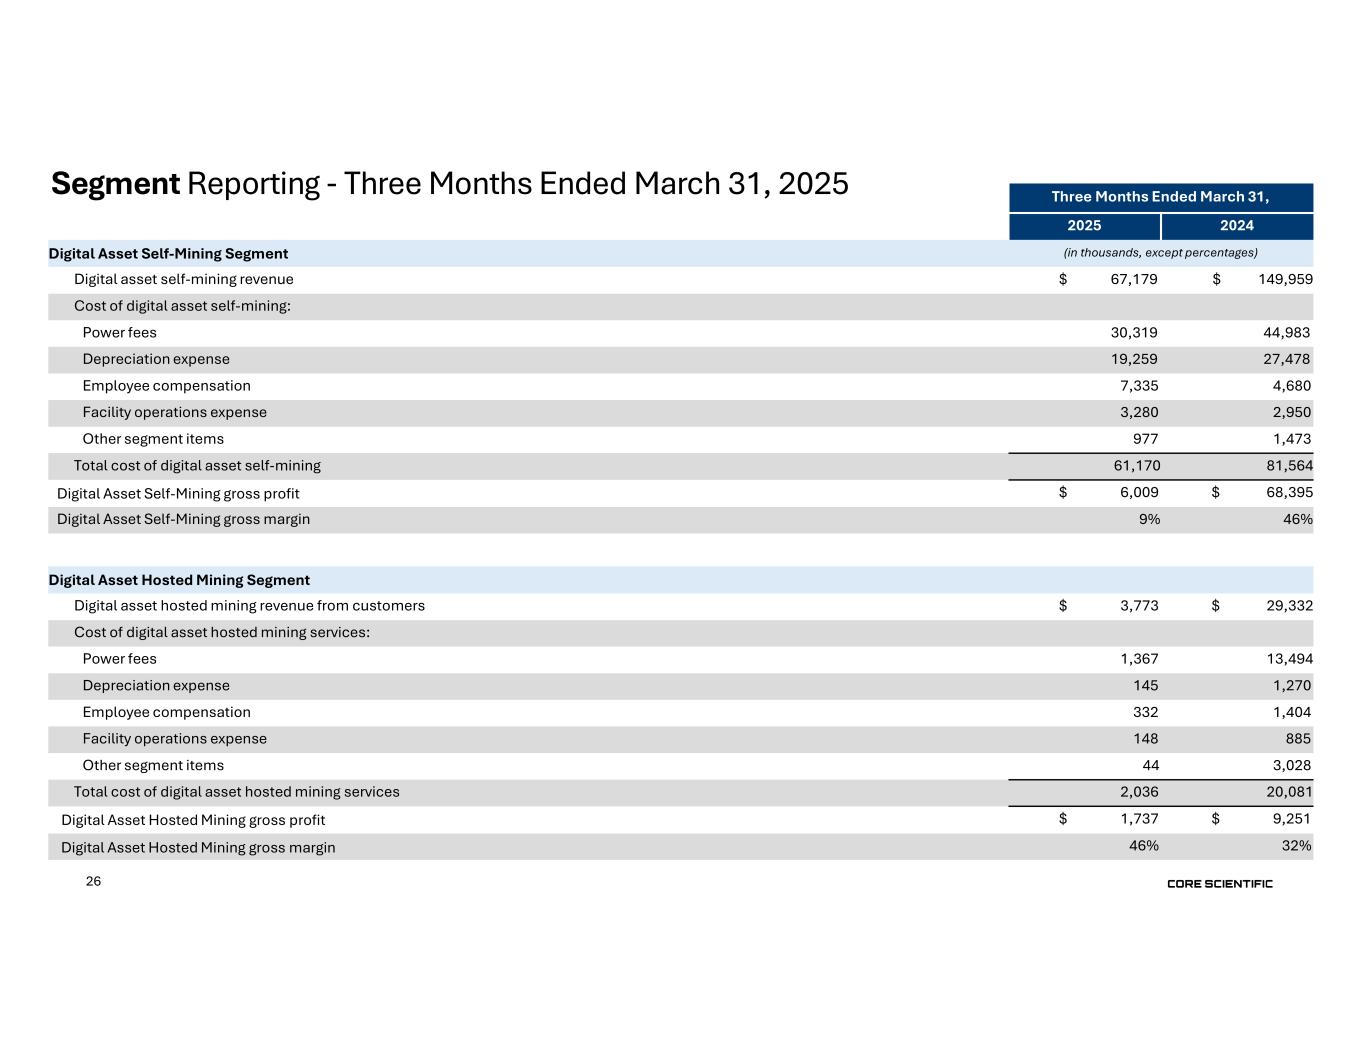
Digital asset self-mining gross profit for the fiscal first quarter of 2025 was $6.0 million (9% gross margin), compared to $68.4 million (46% gross margin) for the same period in the prior year, a decrease of $62.4 million. The decrease in Digital asset self-mining gross profit was primarily driven by a $82.8 million decrease in self-mining revenue, the result of a 75% decrease in bitcoin mined due to the halving and the operational shift to Colocation, partially offset by a 74% increase in the average price of bitcoin and a 33% decrease in power costs due to lower rates and usage.
Digital asset hosted mining gross profit for the fiscal first quarter of 2025 was $1.7 million (46% gross margin), as compared to $9.3 million (32% gross margin) for the same period in the prior year. The decrease in Digital asset hosted mining gross profit was primarily due to a $25.6 million decrease in hosted mining revenue driven
-more-
Core Scientific, Inc. Fiscal First Quarter 2025 Earnings Release - 2 | ||||||||
by our operational shift to Colocation, partially offset by a 90% decrease in power costs due to lower usage driven by our operational shift to Colocation and lower rates.
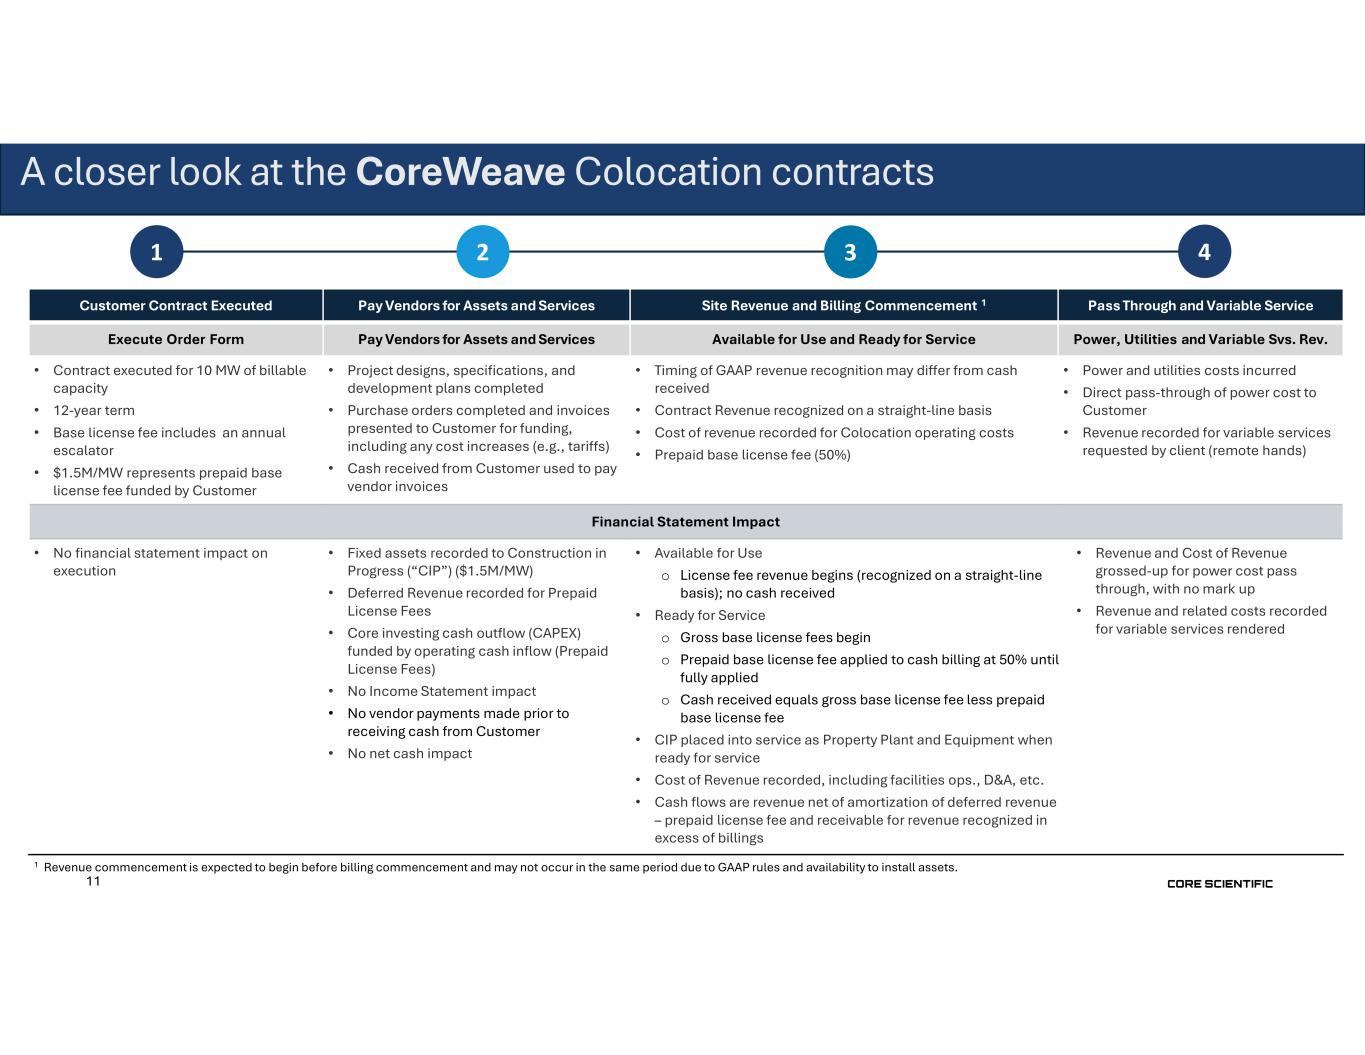
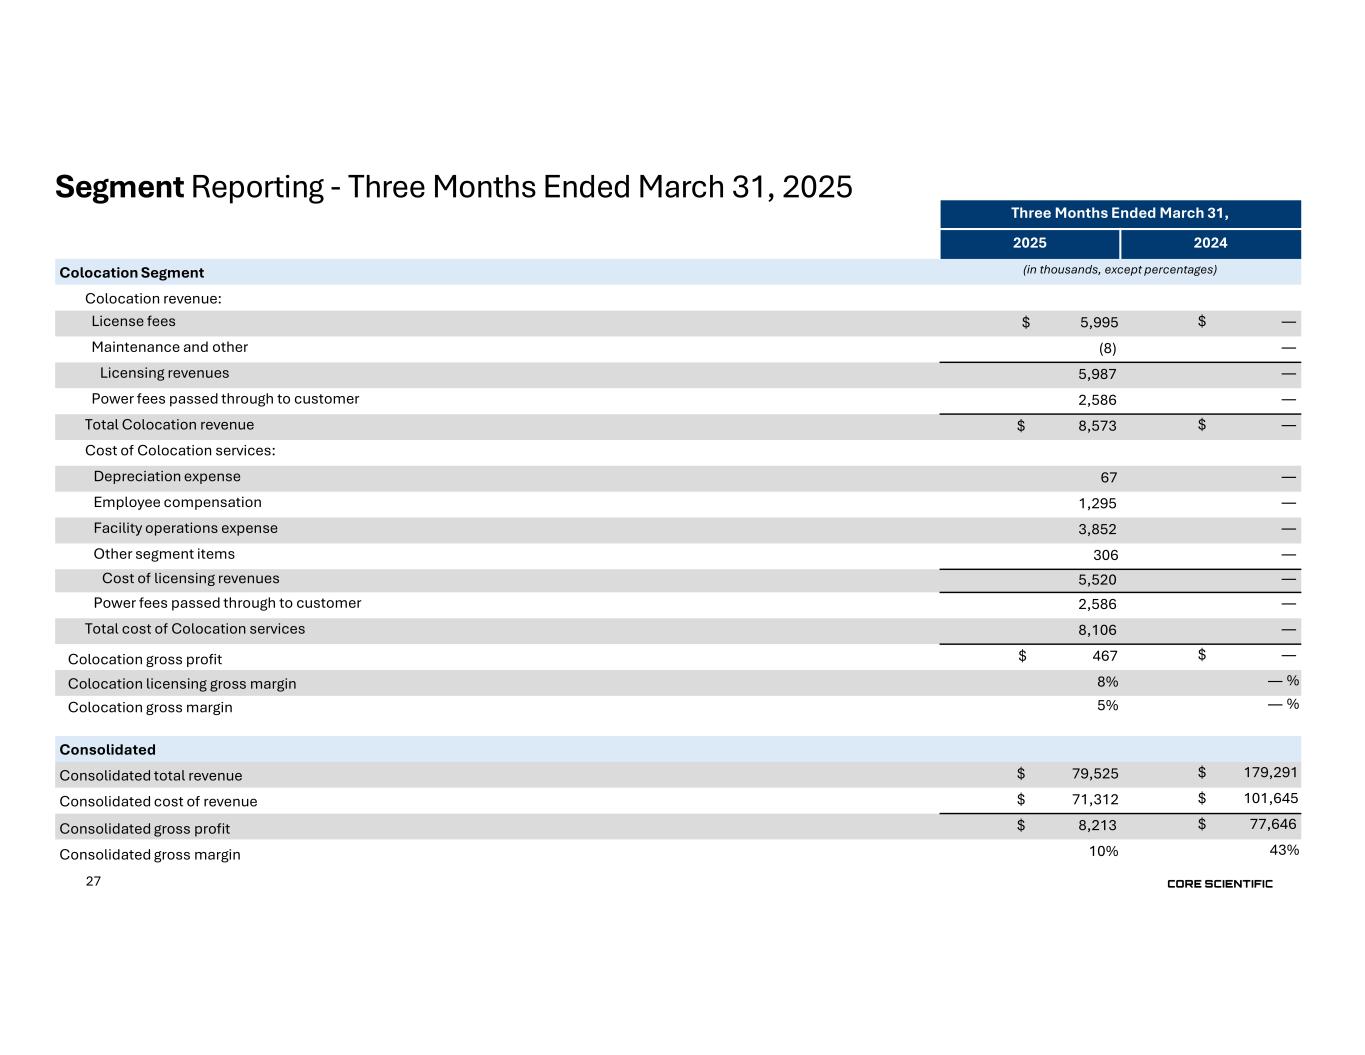
Colocation gross profit for the fiscal first quarter of 2025 was $0.5 million (5% gross margin). Colocation revenue includes a base license fee as well as the direct pass-through of power costs to our client, with no margin added. Colocation costs at our Austin, Texas data center consist primarily of lease expense, the direct pass-through of power costs, and direct and indirect facilities operations expenses, including personnel and benefit costs and stock-based compensation. The non-GAAP gross margin for the fiscal first quarter of 2025, which excludes the direct pass-through of power costs, was 8%.
Selling, general and administrative expenses for the fiscal first quarter of 2025 totaled $40.1 million, as compared to $16.9 million for the same period in the prior year. The increase of $23.2 million was primarily attributable to a $13.9 million increase in stock-based compensation, a $7.2 million increase in non-capitalizable Colocation site startup costs, and a $2.5 million increase in personnel and related expenses due to increased employee headcount to support our transition to Colocation operations.
Net income for the fiscal first quarter of 2025 was $580.7 million, as compared to $210.7 million for the same period in the prior year. Net income for the fiscal first quarter of 2025 increased by $370.0 million driven primarily by a net $621.5 million mark-to-market adjustment on our warrants and other contingent value rights comprising a $634.3 million decrease in the fair value of warrant liabilities, partially offset by a $12.8 million increase in fair value of contingent value rights. These mark-to-market adjustments were driven by the decrease in our stock price during the fiscal first quarter of 2025. Also contributing to the increase in net income was a $16.3 million decrease in interest expense, net due primarily by an $8.7 million decrease in interest expense due to lower interest rates compared to the same period in the prior year, and a $7.9 million increase in proceeds from money market funds. These increases to net income were partially offset by $111.4 million of Reorganization items, net, reflecting the Company’s emergence from bankruptcy during the first fiscal quarter of 2024, with no comparable activity in fiscal 2025 and a $99.8 million decrease in Total revenue, the result of a 75% decrease in bitcoin mined due to the halving and the operational shift to Colocation.
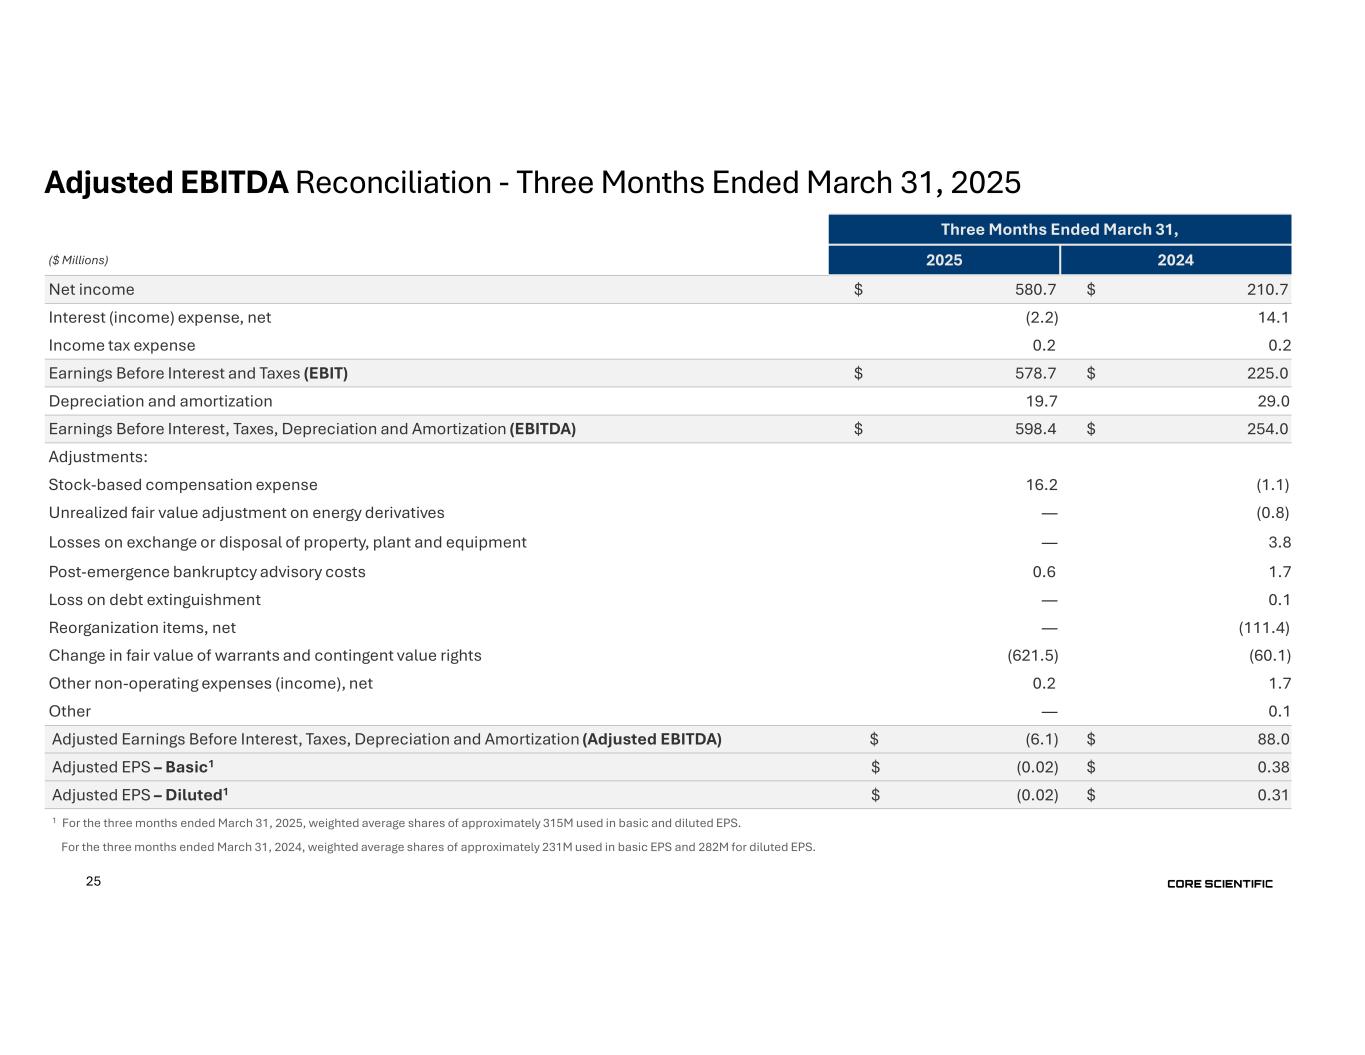
Non-GAAP Adjusted EBITDA for the fiscal first quarter 2025 was $(6.1) million, as compared to Non-GAAP Adjusted EBITDA of $88.0 million for the same period in the prior year. This $94.1 million decrease was driven by a $99.8 million decrease in total revenue, a $11.2 million decrease in the change in fair value of digital assets, and a $7.4 million increase in cash operating expenses, partially offset by a $21.4 million decrease in cash cost of revenue and a $3.0 million decrease in realized losses on energy derivatives.
-more-
Core Scientific, Inc. Fiscal First Quarter 2025 Earnings Release - 3 | ||||||||
CONFERENCE CALL AND LIVE WEBCAST
In conjunction with this release, Core Scientific, Inc. will host a conference call today, Wednesday, May 7, 2025, at 4:30 pm Eastern Time that will be webcast live. Adam Sullivan, Chief Executive Officer, Jim Nygaard, Chief Financial Officer and Jon Charbonneau,Vice President, Investor Relations, will host the call.
Investors may dial into the call by using the following telephone numbers: +1 (888) 428-7458 (U.S. toll free) or +1 (862) 298-0702 (U.S. local) five to ten minutes prior to the start time to allow for registration.
Investors with Internet access may listen to the live audio webcast via the Investor Relations page of the Core Scientific, Inc. website, http://investors.corescientific.com or by using the following link https://event.choruscall.com/mediaframe/webcast.html?webcastid=7cGzCf6F. Please allow 10 minutes prior to the call to download and install any necessary audio software. A replay of the audio webcast will be available for one year.
A supplementary investor presentation for the fiscal first quarter 2025 may be accessed at https://investors.corescientific.com/news-events/presentations.
AUDIO REPLAY
An audio replay of the event will be archived on the Investor Relations section of the Company's website at http://investors.corescientific.com and via telephone by dialing +1 (877) 660-6853 (U.S. toll free) or +1 (201) 612-7415 (U.S. local) and entering Access Code 13753188.
ABOUT CORE SCIENTIFIC
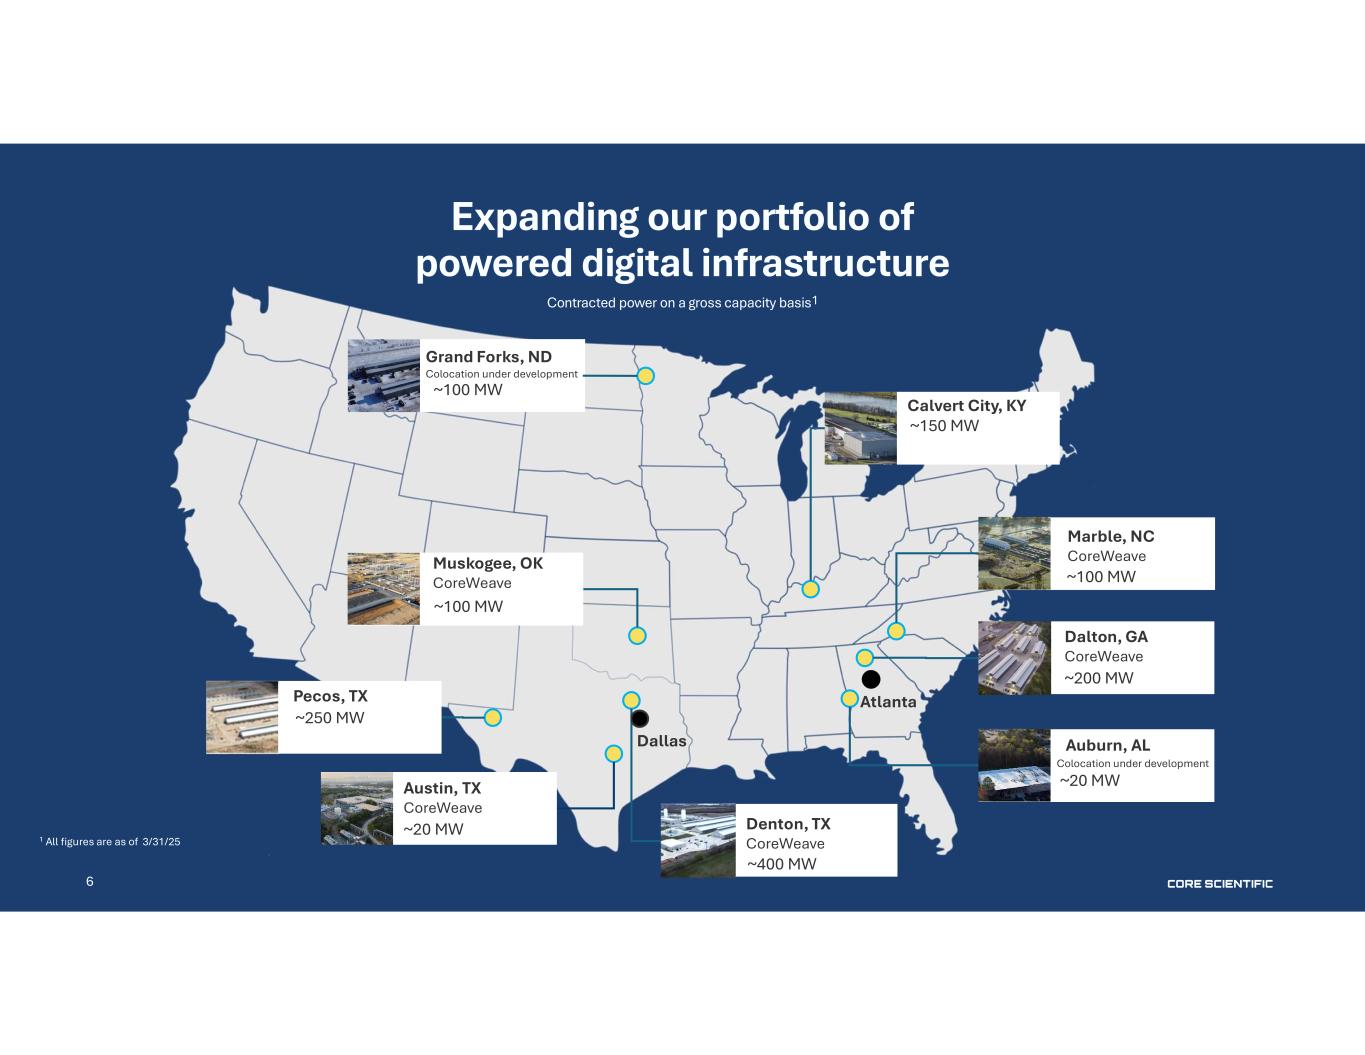
Core Scientific, Inc. (“Core Scientific” or the “Company”) is a leader in digital infrastructure for high-density colocation services and digital asset mining. We operate dedicated, purpose-built facilities for digital asset mining and are a premier provider of digital infrastructure, software solutions and services to our third-party customers. We employ our own large fleet of computers (“miners”) to earn digital assets for our own account and to provide hosting services for large digital asset mining customers and we are in the process of allocating and converting a significant portion of our ten facilities in Alabama (1), Georgia (2), Kentucky (1), North Carolina (1), North Dakota (1), Oklahoma (1) and Texas (3) to support artificial intelligence-related workloads under a series of contracts that entail the modification of certain of our data centers to deliver next generation colocation services. We derive the majority of our revenue from earning digital assets for our own account (“self-mining”). To learn more, visit www.corescientific.com.
SPECIAL NOTE REGARDING FORWARD-LOOKING STATEMENTS
This press release contains “forward-looking statements” within the meaning of the “safe harbor” provisions of the Private Securities Litigation Reform Act of 1995, including but not limited to, statements regarding projections, estimates and forecasts of revenue and other financial and performance metrics, projections of market opportunity and expectations, the Company’s ability to scale, grow its business and execute on its growth plans and hosting contracts, source energy at reasonable rates, the advantages, expected growth, and anticipated future revenue of the Company, and the Company’s ability to source and retain talent. You can identify forward-looking statements by the fact that they do not relate strictly to historical or current facts. These statements may include words such as “aim,” “estimate,” “plan,” “project,” “forecast,” “goal,” “intend,” “will,” “expect,” “anticipate,” “believe,” “seek,” “target” or other similar expressions that predict or indicate
-more-
Core Scientific, Inc. Fiscal First Quarter 2025 Earnings Release - 4 | ||||||||
future events or trends or that are not statements of historical matters. All forward-looking statements are subject to risks and uncertainties that may cause actual results to differ materially, including: our ability to earn digital assets profitably and to attract customers for our high density colocation capabilities; our ability to perform under our existing colocation agreements, our ability to maintain our competitive position in our existing operating segments, the impact of increases in total network hash rate; our ability to raise additional capital to continue our expansion efforts or other operations; our need for significant electric power and the limited availability of power resources; the potential failure in our critical systems, facilities or services we provide; the physical risks and regulatory changes relating to climate change; potential significant changes to the method of validating blockchain transactions; our vulnerability to physical security breaches, which could disrupt our operations; a potential slowdown in market and economic conditions, particularly those impacting high density computing, the blockchain industry and the blockchain hosting market; price volatility of digital assets and bitcoin in particular; potential changes in the interpretive positions of the SEC or its staff with respect to digital asset mining firms; the likelihood that U.S. federal and state legislatures and regulatory agencies will enact laws and regulations to regulate digital assets and digital asset intermediaries; changing expectations with respect to ESG policies; the effectiveness of our compliance and risk management methods; the adequacy of our sources of recovery if the digital assets held by us are lost, stolen or destroyed due to third-party digital asset services; Any such forward-looking statements represent management’s estimates and beliefs as of the date of this press release. While we may elect to update such forward-looking statements at some point in the future, we disclaim any obligation to do so, even if subsequent events cause our views to change.
Although the Company believes that in making such forward-looking statements its expectations are based upon reasonable assumptions, such statements may be influenced by factors that could cause actual outcomes and results to be materially different from those projected. The Company cannot assure you that the assumptions upon which these statements are based will prove to have been correct. Additional important factors that may affect the Company’s business, results of operations and financial position are described from time to time in the Company’s Annual Report on Form 10-K for the year ended December 31, 2024, Quarterly Reports on Form 10-Q and the Company’s other filings with the Securities and Exchange Commission. The Company does not undertake any obligation to update or revise any forward-looking statement, whether as a result of new information, future events or otherwise, except as may be required by applicable law.
-more-
Core Scientific, Inc. Fiscal First Quarter 2025 Earnings Release - 5 | ||||||||
Core Scientific, Inc.
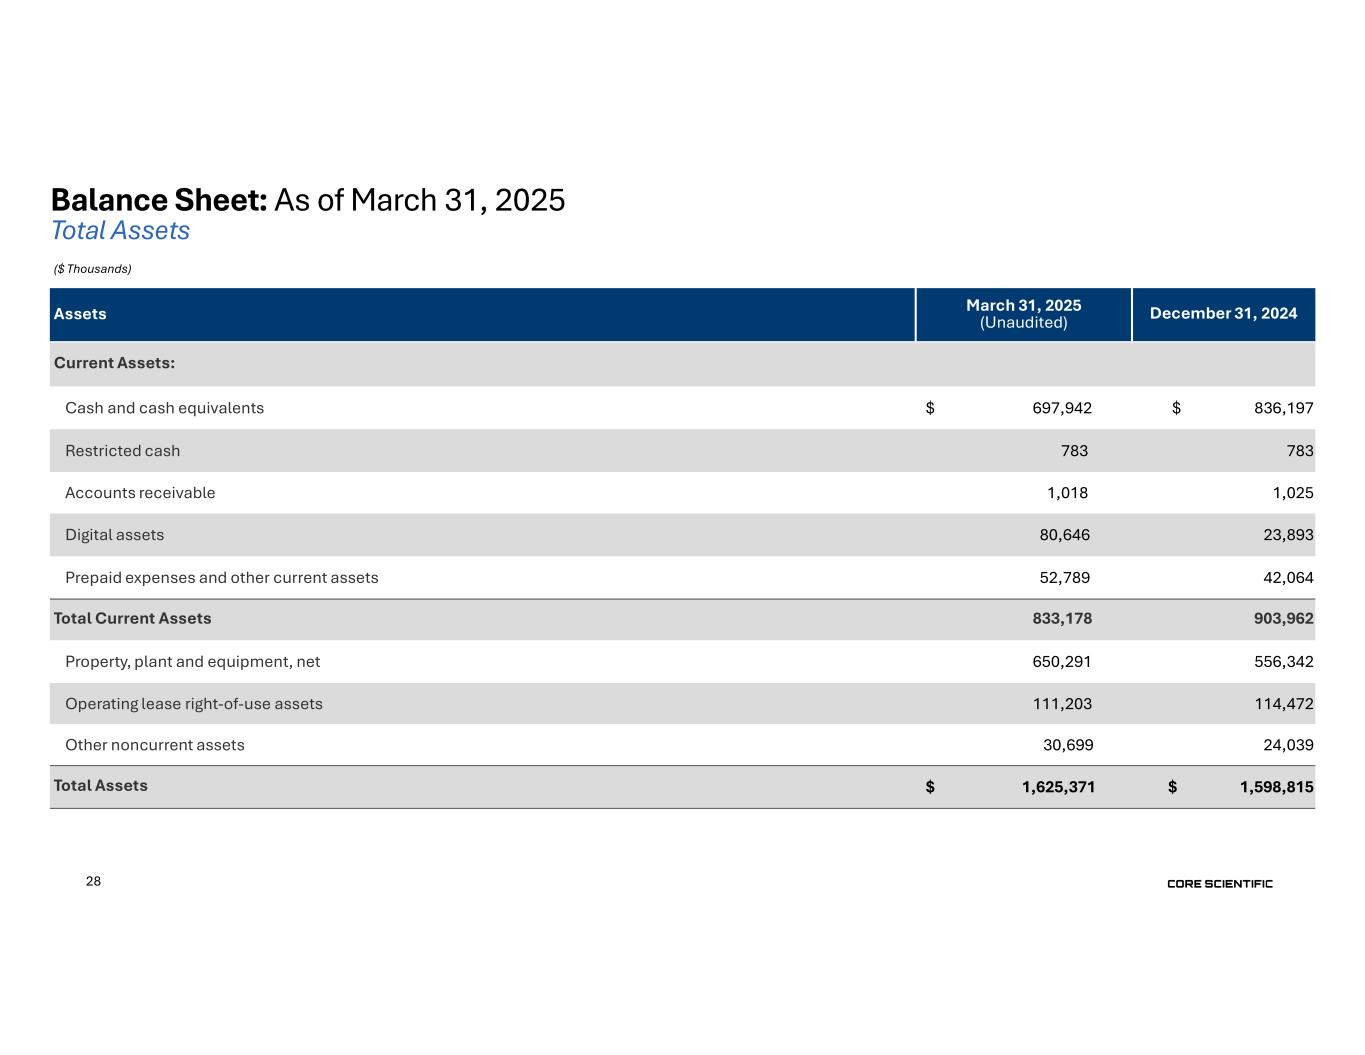
Condensed Consolidated Balance Sheets
(in thousands, except par value)
(Unaudited)
| March 31, 2025 | December 31, 2024 | ||||||||||
| Assets | |||||||||||
| Current Assets: | |||||||||||
| Cash and cash equivalents | $ | 697,942 | $ | 836,197 | |||||||
| Restricted cash | 783 | 783 | |||||||||
| Accounts receivable | 1,018 | 1,025 | |||||||||
| Digital assets | 80,646 | 23,893 | |||||||||
| Prepaid expenses and other current assets | 52,789 | 42,064 | |||||||||
| Total Current Assets | 833,178 | 903,962 | |||||||||
| Property, plant and equipment, net | 650,291 | 556,342 | |||||||||
| Operating lease right-of-use assets | 111,203 | 114,472 | |||||||||
| Other noncurrent assets | 30,699 | 24,039 | |||||||||
| Total Assets | $ | 1,625,371 | $ | 1,598,815 | |||||||
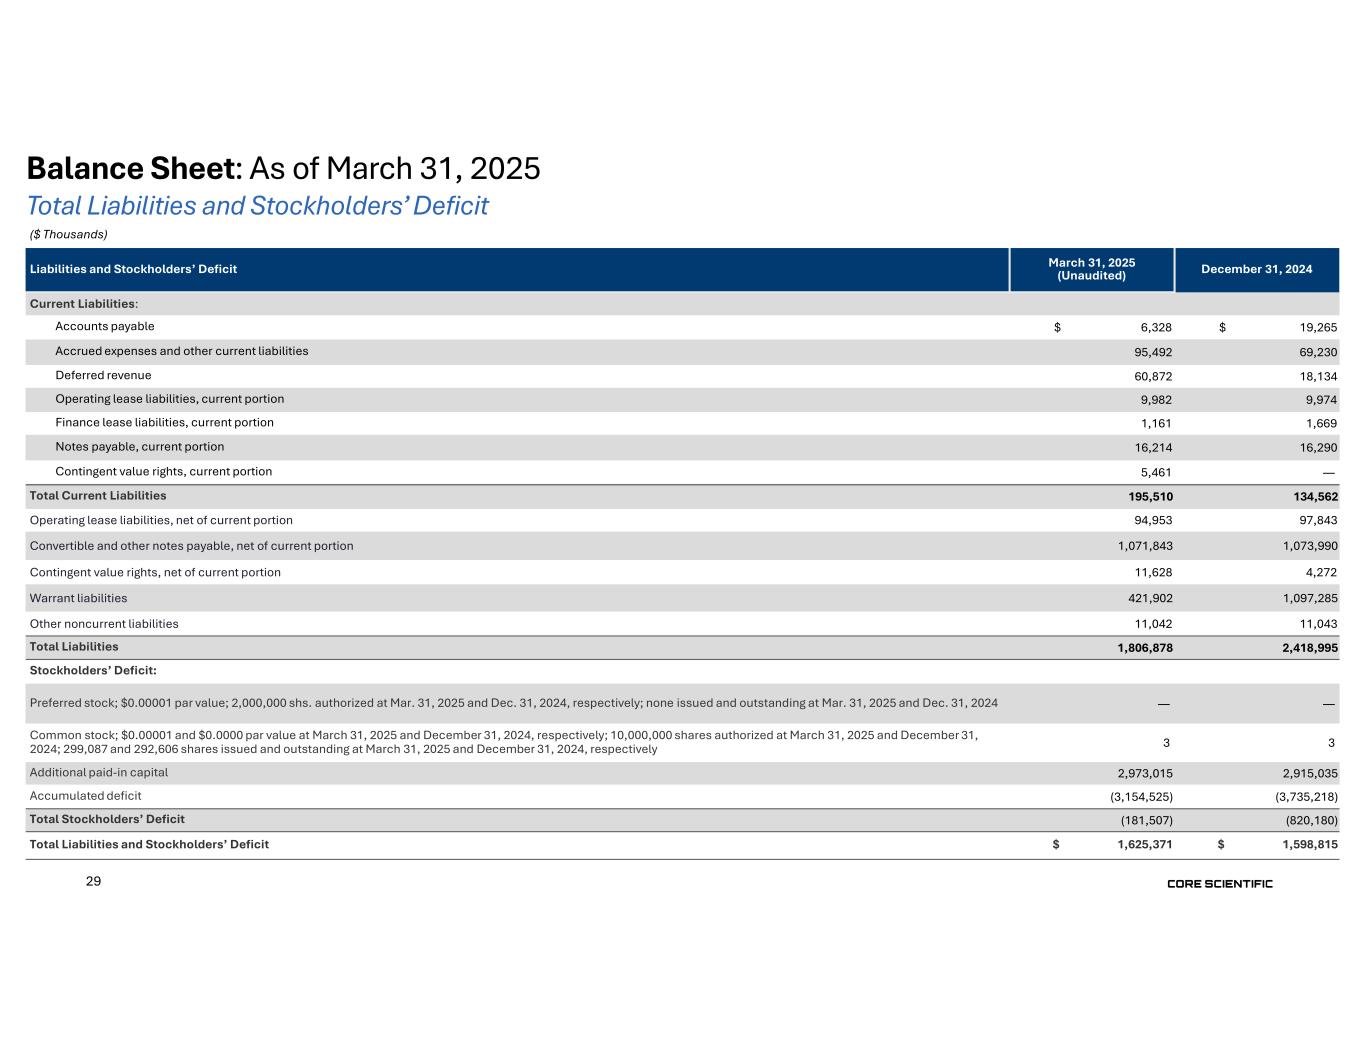
| Liabilities and Stockholders’ Deficit | |||||||||||
| Current Liabilities: | |||||||||||
| Accounts payable | $ | 6,328 | $ | 19,265 | |||||||
Accrued expenses and other current liabilities | 95,492 | 69,230 | |||||||||
| Deferred revenue | 60,872 | 18,134 | |||||||||
| Operating lease liabilities, current portion | 9,982 | 9,974 | |||||||||
| Finance lease liabilities, current portion | 1,161 | 1,669 | |||||||||
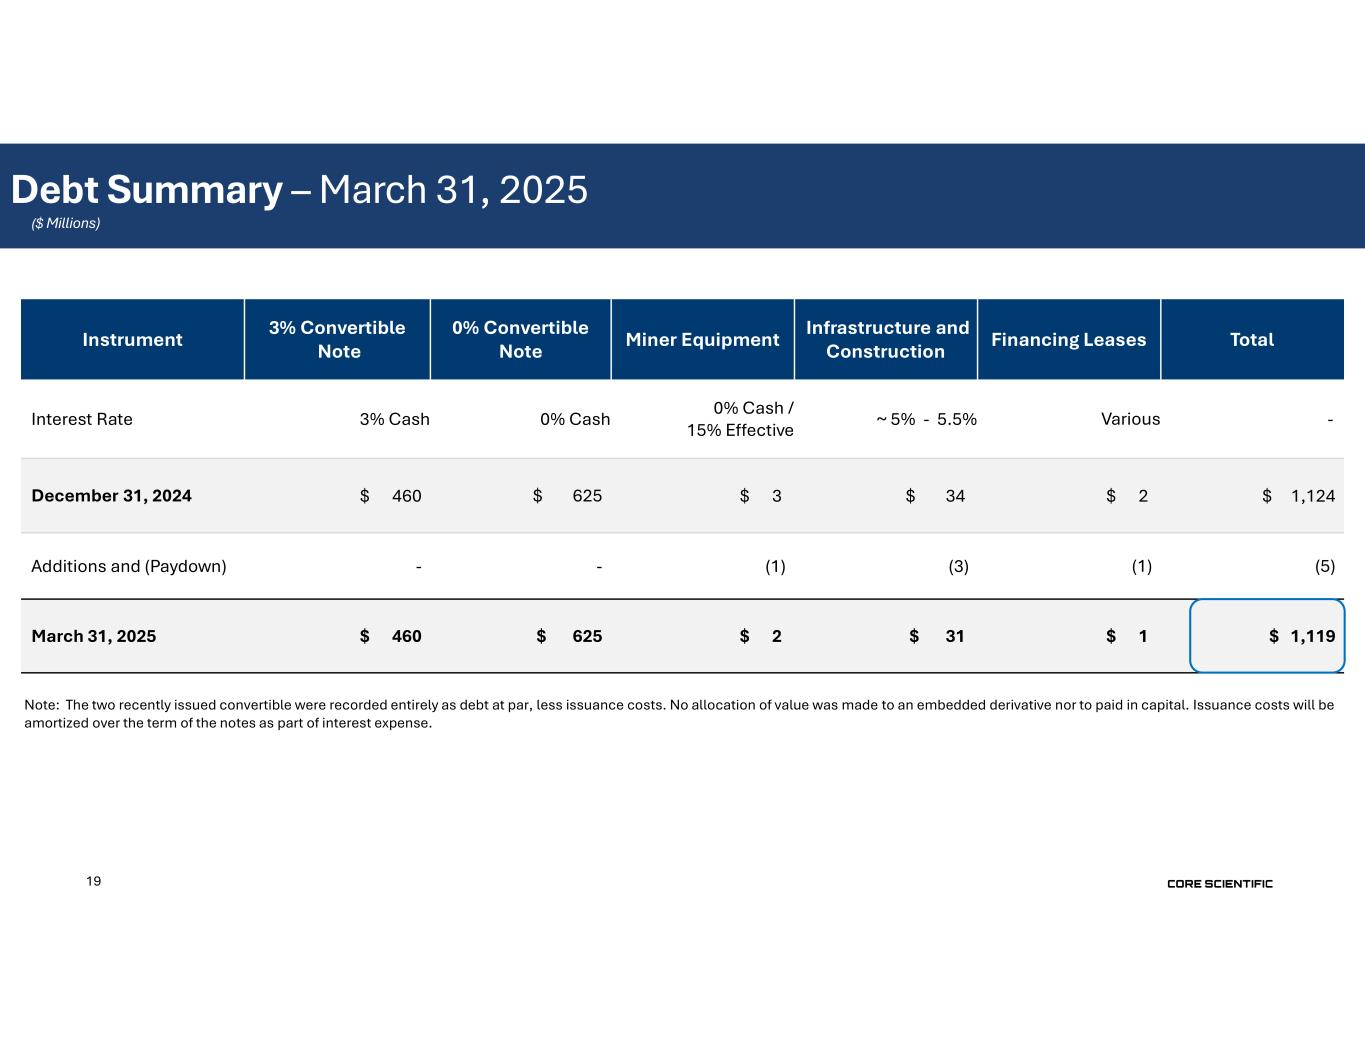
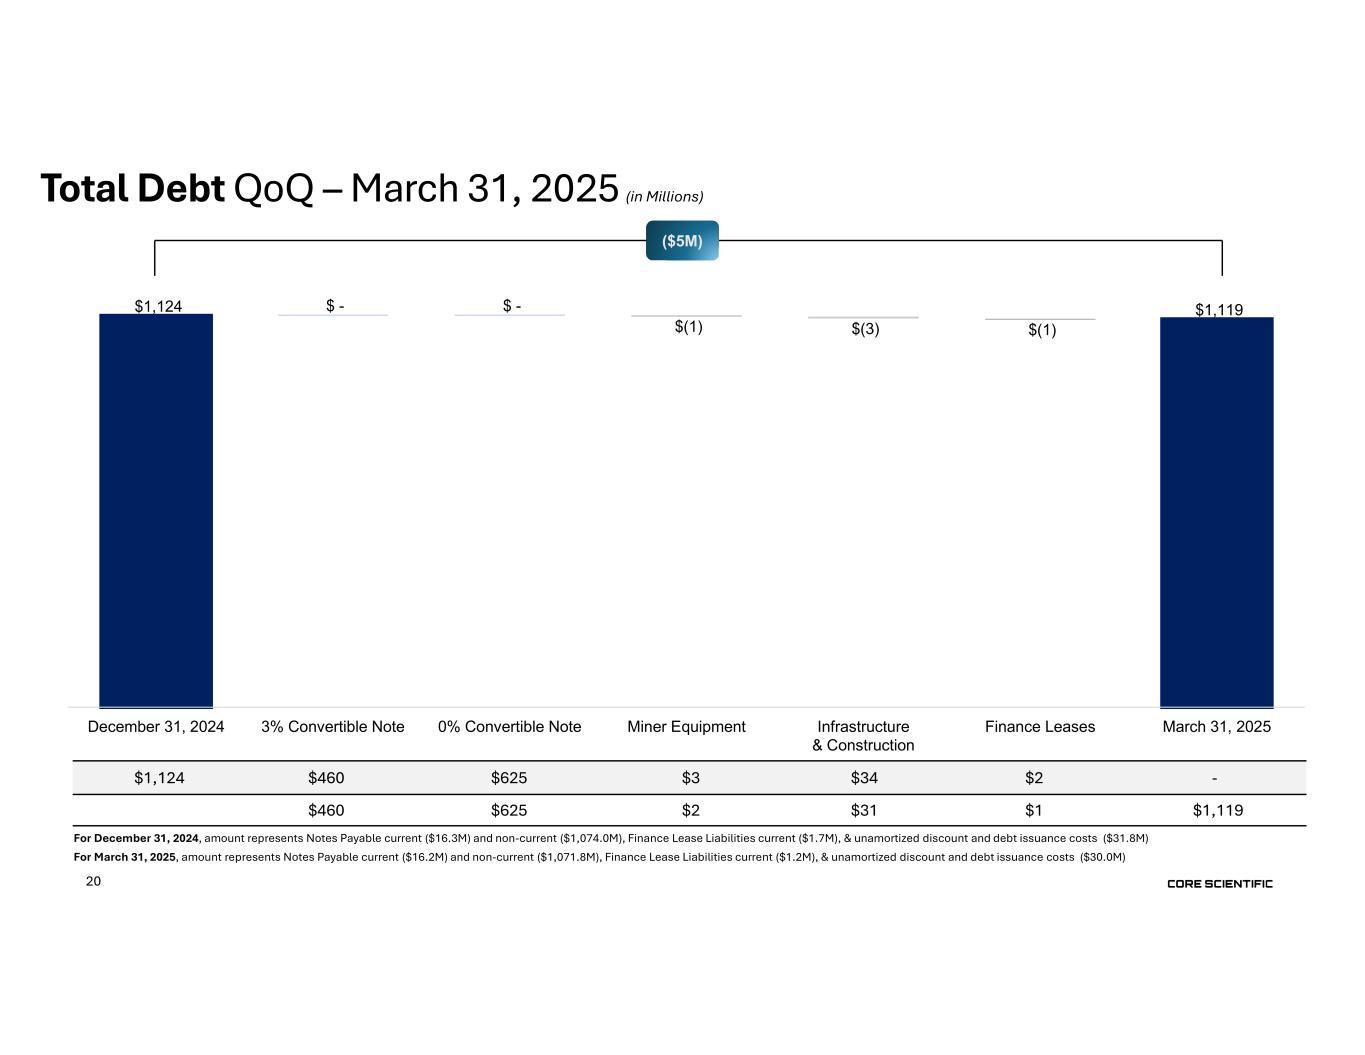
| Notes payable, current portion | 16,214 | 16,290 | |||||||||
Contingent value rights, current portion | 5,461 | — | |||||||||
| Total Current Liabilities | 195,510 | 134,562 | |||||||||
| Operating lease liabilities, net of current portion | 94,953 | 97,843 | |||||||||
| Convertible and other notes payable, net of current portion | 1,071,843 | 1,073,990 | |||||||||
| Contingent value rights, net of current portion | 11,628 | 4,272 | |||||||||
Warrant liabilities | 421,902 | 1,097,285 | |||||||||
| Other noncurrent liabilities | 11,042 | 11,043 | |||||||||
| Total Liabilities | 1,806,878 | 2,418,995 | |||||||||
| Commitments and contingencies | |||||||||||
| Stockholders’ Deficit: | |||||||||||
| Preferred stock; $0.00001 par value; 2,000,000 shares authorized; none issued and outstanding at March 31, 2025 and December 31, 2024 | — | — | |||||||||
| Common stock; $0.00001 par value; 10,000,000 shares authorized at March 31, 2025 and December 31, 2024; 299,087 and 292,606 shares issued and outstanding at March 31, 2025 and December 31, 2024, respectively | 3 | 3 | |||||||||
| Additional paid-in capital | 2,973,015 | 2,915,035 | |||||||||
| Accumulated deficit | (3,154,525) | (3,735,218) | |||||||||
| Total Stockholders’ Deficit | (181,507) | (820,180) | |||||||||
| Total Liabilities and Stockholders’ Deficit | $ | 1,625,371 | $ | 1,598,815 | |||||||
-more-
Core Scientific, Inc. Fiscal First Quarter 2025 Earnings Release - 6 | ||||||||
Core Scientific, Inc.
Condensed Consolidated Statements of Operations
(in thousands, except per share amounts)
(Unaudited)
| Three Months Ended March 31, | |||||||||||
| 2025 | 2024 | ||||||||||
| Revenue: | |||||||||||
Digital asset self-mining revenue | $ | 67,179 | $ | 149,959 | |||||||
Digital asset hosted mining revenue from customers | 3,773 | 29,332 | |||||||||
Colocation revenue | 8,573 | — | |||||||||
Total revenue | 79,525 | 179,291 | |||||||||
| Cost of revenue: | |||||||||||
Cost of digital asset self-mining | 61,170 | 81,564 | |||||||||
Cost of digital asset hosted mining services | 2,036 | 20,081 | |||||||||
Cost of Colocation services | 8,106 | — | |||||||||
Total cost of revenue | 71,312 | 101,645 | |||||||||
Gross profit | 8,213 | 77,646 | |||||||||
Change in fair value of digital assets | 10,688 | — | |||||||||
Gain from sales of digital assets | — | (543) | |||||||||
Change in fair value of energy derivatives | — | 2,218 | |||||||||
| Losses on exchange or disposal of property, plant and equipment | 6 | 3,820 | |||||||||
Selling, general and administrative | 40,115 | 16,924 | |||||||||
Operating (loss) income | (42,596) | 55,227 | |||||||||
Non-operating expenses (income), net: | |||||||||||
Loss on debt extinguishment | — | 50 | |||||||||
Interest (income) expense, net | (2,187) | 14,087 | |||||||||
Change in fair value of warrants and contingent value rights | (621,464) | (60,114) | |||||||||
| Reorganization items, net | — | (111,439) | |||||||||
Other non-operating expense, net | 157 | 1,746 | |||||||||
Total non-operating income, net | (623,494) | (155,670) | |||||||||
Income before income taxes | 580,898 | 210,897 | |||||||||
| Income tax expense | 205 | 206 | |||||||||
Net income | $ | 580,693 | $ | 210,691 | |||||||
Net income per share | |||||||||||
Basic | $ | 1.44 | $ | 0.91 | |||||||
Diluted | $ | 1.25 | $ | 0.78 | |||||||
Weighted average shares outstanding | |||||||||||
Basic | 315,186 | 230,954 | |||||||||
Diluted | 363,314 | 282,531 | |||||||||
Certain prior year amounts have been reclassified for consistency with the current year presentation.
-more-
Core Scientific, Inc. Fiscal First Quarter 2025 Earnings Release - 7 | ||||||||
Core Scientific, Inc.
Condensed Consolidated Statements of Cash Flows
(in thousands)
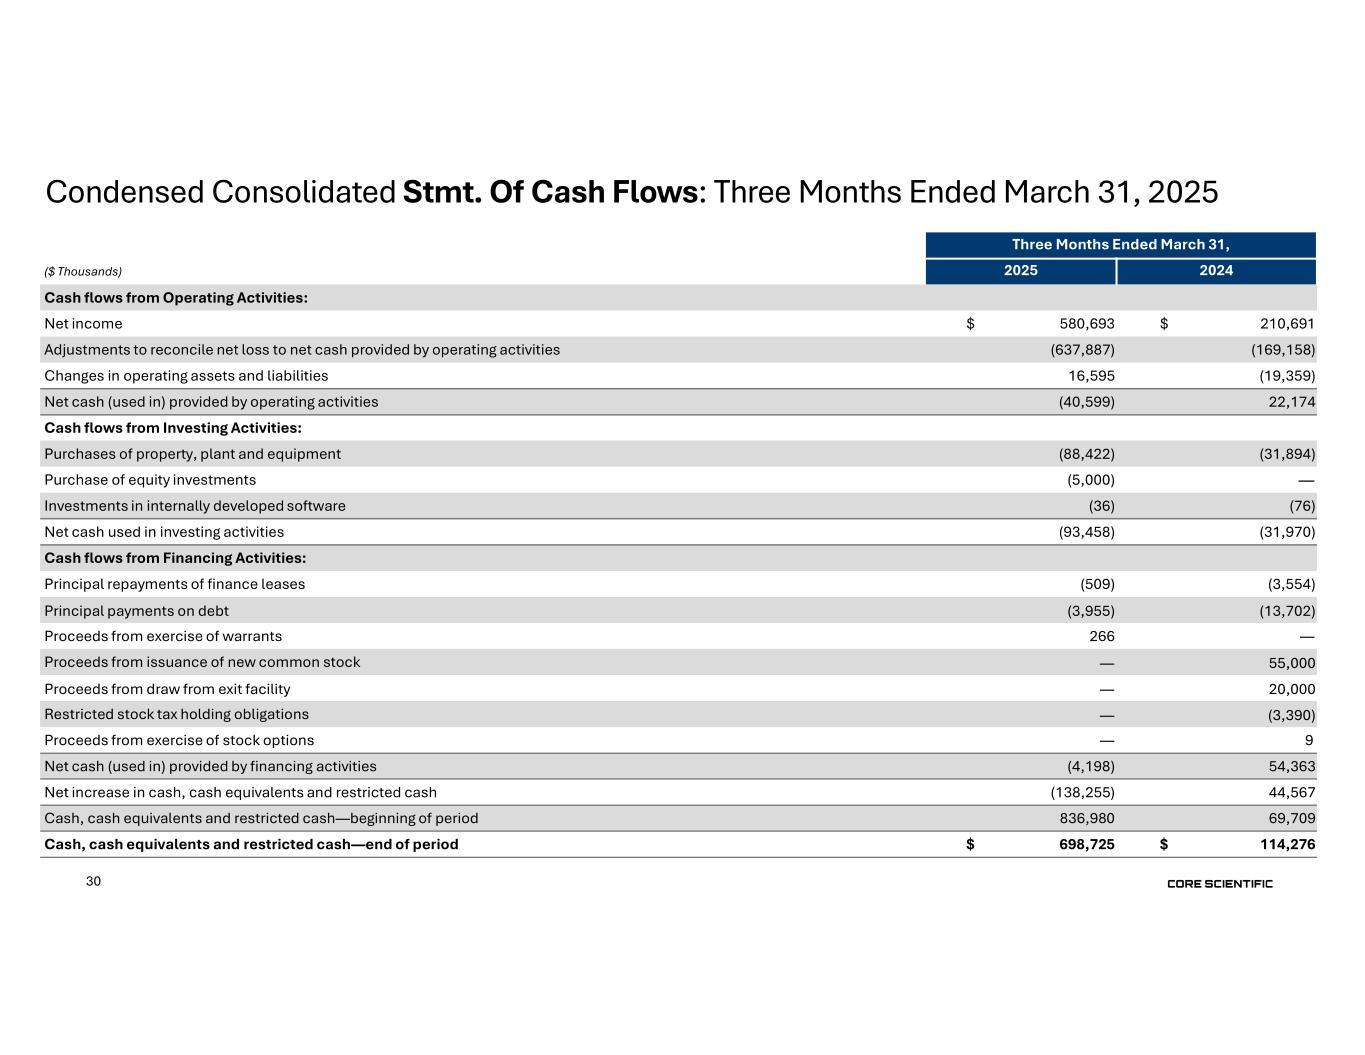
Three Months Ended March 31, | |||||||||||
| 2025 | 2024 | ||||||||||
| Cash flows from Operating Activities: | |||||||||||
Net income | $ | 580,693 | $ | 210,691 | |||||||
Adjustments to reconcile net income to net cash (used in) provided by operating activities: | |||||||||||
| Depreciation and amortization | 19,731 | 28,996 | |||||||||
| Losses on exchange or disposal of property, plant and equipment | 6 | 3,820 | |||||||||
| Amortization of operating lease right-of-use assets | 2,676 | 770 | |||||||||
| Stock-based compensation | 16,185 | (1,060) | |||||||||
| Digital asset self-mining and shared hosting revenue | (67,441) | (149,959) | |||||||||
| Proceeds from sale of digital assets generated by self-mining and shared hosting revenues1 | — | 152,810 | |||||||||
| Change in fair value of digital assets | 10,688 | — | |||||||||
| Gain from sale of digital assets | — | (543) | |||||||||
| Change in fair value of energy derivatives | — | (797) | |||||||||
| Change in fair value of warrant liabilities | (634,280) | (18,390) | |||||||||
| Change in fair value of contingent value rights | 12,816 | (41,724) | |||||||||
Loss on debt extinguishment | — | 50 | |||||||||
| Amortization of debt discount | 1,732 | 660 | |||||||||
| Non-cash reorganization items | — | (143,791) | |||||||||
| Changes in operating assets and liabilities: | |||||||||||
| Accounts receivable, net | 6 | (106) | |||||||||
| Prepaid expenses and other current assets | (10,469) | (5,989) | |||||||||
| Accounts payable | (14,295) | (9,735) | |||||||||
| Accrued expenses and other | 2,712 | (10,351) | |||||||||
Deferred revenue from colocation services | 42,005 | — | |||||||||
| Deferred revenue from hosted mining services | 734 | (580) | |||||||||
| Other noncurrent assets and liabilities, net | (4,098) | 7,402 | |||||||||
Net cash (used in) provided by operating activities | (40,599) | 22,174 | |||||||||
| Cash flows from Investing Activities: | |||||||||||
| Purchases of property, plant and equipment | (88,422) | (31,894) | |||||||||
| Purchase of equity investments | (5,000) | — | |||||||||
| Investments in internally developed software | (36) | (76) | |||||||||
| Net cash used in investing activities | (93,458) | (31,970) | |||||||||
| Cash flows from Financing Activities: | |||||||||||
| Principal repayments of finance leases | (509) | (3,554) | |||||||||
| Principal payments on debt | (3,955) | (13,702) | |||||||||
| Proceeds from exercise of warrants | 266 | — | |||||||||
| Proceeds from issuance of new common stock | — | 55,000 | |||||||||
| Proceeds from draw from exit facility | — | 20,000 | |||||||||
| Restricted stock tax holding obligations | — | (3,390) | |||||||||
| Proceeds from exercise of stock options | — | 9 | |||||||||
Net cash (used in) provided by financing activities | (4,198) | 54,363 | |||||||||
Net (decrease) increase in cash, cash equivalents and restricted cash | (138,255) | 44,567 | |||||||||
| Cash, cash equivalents and restricted cash—beginning of period | 836,980 | 69,709 | |||||||||
Cash, cash equivalents and restricted cash—end of period | $ | 698,725 | $ | 114,276 | |||||||
Reconciliation of cash, cash equivalents, and restricted cash within the consolidated balance sheets to the amounts shown in the consolidated statements of cash flows above: | |||||||||||
| Cash and cash equivalents | $ | 697,942 | $ | 98,125 | |||||||
| Restricted cash | 783 | 16,151 | |||||||||
| Total cash, cash equivalents and restricted cash | $ | 698,725 | $ | 114,276 | |||||||
Certain prior year amounts have been reclassified for consistency with the current year presentation.
1 Proceeds from digital assets received as noncash revenue consideration liquidated nearly immediately after receipt as a routine operating activity.
-more-
Core Scientific, Inc. Fiscal First Quarter 2025 Earnings Release - 8 | ||||||||
Core Scientific, Inc.
Segment Results
(in thousands, except percentages)
(Unaudited)
| Three Months Ended March 31, | |||||||||||
| 2025 | 2024 | ||||||||||
| Digital Asset Self-Mining Segment | (in thousands, except percentages) | ||||||||||
Digital asset self-mining revenue | $ | 67,179 | $ | 149,959 | |||||||
| Cost of digital asset self-mining: | |||||||||||
| Power fees | 30,319 | 44,983 | |||||||||
| Depreciation expense | 19,259 | 27,478 | |||||||||
| Employee compensation | 7,335 | 4,680 | |||||||||
| Facility operations expense | 3,280 | 2,950 | |||||||||
| Other segment items | 977 | 1,473 | |||||||||
| Total cost of digital asset self-mining | 61,170 | 81,564 | |||||||||
| Digital Asset Self-Mining gross profit | $ | 6,009 | $ | 68,395 | |||||||
| Digital Asset Self-Mining gross margin | 9 | % | 46 | % | |||||||
| Digital Asset Hosted Mining Segment | |||||||||||
| Digital asset hosted mining revenue from customers | $ | 3,773 | $ | 29,332 | |||||||
| Cost of digital asset hosted mining services: | |||||||||||
| Power fees | 1,367 | 13,494 | |||||||||
| Depreciation expense | 145 | 1,270 | |||||||||
| Employee compensation | 332 | 1,404 | |||||||||
| Facility operations expense | 148 | 885 | |||||||||
| Other segment items | 44 | 3,028 | |||||||||
| Total cost of digital asset hosted mining services | 2,036 | 20,081 | |||||||||
| Digital Asset Hosted Mining gross profit | $ | 1,737 | $ | 9,251 | |||||||
| Digital Asset Hosted Mining gross margin | 46 | % | 32 | % | |||||||
| Colocation Segment | |||||||||||
| Colocation revenue: | |||||||||||
| License fees | $ | 5,995 | $ | — | |||||||
| Maintenance and other | (8) | — | |||||||||
Licensing revenue | 5,987 | — | |||||||||
| Power fees passed through to customer | 2,586 | — | |||||||||
| Total Colocation revenue | 8,573 | — | |||||||||
| Cost of Colocation services: | |||||||||||
| Depreciation expense | 67 | — | |||||||||
Employee compensation | 1,295 | — | |||||||||
| Facility operations expense | 3,852 | — | |||||||||
| Other segment items | 306 | — | |||||||||
| Cost of licensing revenue | 5,520 | — | |||||||||
Power fees passed through to customer | 2,586 | — | |||||||||
| Total cost of Colocation services | 8,106 | — | |||||||||
| Colocation gross profit | $ | 467 | $ | — | |||||||
| Colocation licensing gross margin | 8 | % | — | % | |||||||
| HPC Hosting gross margin | 5 | % | — | % | |||||||
| Consolidated | |||||||||||
| Consolidated total revenue | $ | 79,525 | $ | 179,291 | |||||||
| Consolidated cost of revenue | $ | 71,312 | — | $ | 101,645 | ||||||
| Consolidated gross profit | $ | 8,213 | $ | 77,646 | |||||||
| Consolidated gross margin | 10 | % | 43 | % | |||||||
-more-
Core Scientific, Inc. Fiscal First Quarter 2025 Earnings Release - 9 | ||||||||
Core Scientific, Inc.
Non-GAAP Financial Measures
(Unaudited)
Adjusted EBITDA is a non-GAAP financial measure defined as our net income, adjusted to eliminate the effect of (i) interest income, interest expense, and other income (expense), net; (ii) provision for income taxes; (iii) depreciation and amortization; (iv) stock-based compensation expense; (v) Reorganization items, net; (vi) unrealized fair value adjustment on energy derivatives; (vii) change in the fair value of warrant and contingent value rights, (viii) Colocation organizational startup costs which are not reflective of the ongoing costs incurred after startup, (ix) post-emergence bankruptcy advisory costs incurred related to reorganization which are not reflective of the ongoing costs incurred in post-emergence operations, and (x) certain additional non-cash items that do not reflect the performance of our ongoing business operations. For additional information, including the reconciliation of net income to Adjusted EBITDA, please refer to the table below. We believe Adjusted EBITDA is an important measure because it allows management, investors, and our Board of Directors to evaluate and compare our operating results, including our return on capital and operating efficiencies, from period-to-period by making the adjustments described above. In addition, it provides useful information to investors and others in understanding and evaluating our results of operations, as well as provides a useful measure for period-to-period comparisons of our business, as it removes the effect of net interest expense, taxes, certain non-cash items, variable charges and timing differences. Moreover, we have included Adjusted EBITDA in this earnings release because it is a key measurement used by our management internally to make operating decisions, including those related to operating expenses, evaluate performance, and perform strategic and financial planning.
The above items are excluded from our Adjusted EBITDA measure because these items are non-cash in nature or because the amount and timing of these items are not related to the current results of our core business operations which renders evaluation of our current performance, comparisons of performance between periods and comparisons of our current performance with our competitors less meaningful. However, you should be aware that when evaluating Adjusted EBITDA, we may incur future expenses similar to those excluded when calculating this measure. Our presentation of this measure should not be construed as an inference that its future results will be unaffected by unusual items. Further, this non-GAAP financial measure should not be considered in isolation from, or as a substitute for, financial information prepared in accordance with accounting principles generally accepted in the United States (“GAAP”). We compensate for these limitations by relying primarily on GAAP results and using Adjusted EBITDA on a supplemental basis. Our computation of Adjusted EBITDA may not be comparable to other similarly titled measures computed by other companies because not all companies calculate this measure in the same fashion. You should review the reconciliation of net income to Adjusted EBITDA below and not rely on any single financial measure to evaluate our business.
-more-
Core Scientific, Inc. Fiscal First Quarter 2025 Earnings Release - 10 | ||||||||
The following table reconciles the non-GAAP financial measure to the most directly comparable U.S. GAAP financial performance measure, which is net income, for the periods presented (in thousands):
| Three Months Ended March 31, | |||||||||||
| 2025 | 2024 | ||||||||||
| Adjusted EBITDA | |||||||||||
| Net income | $ | 580,693 | $ | 210,691 | |||||||
| Adjustments: | |||||||||||
| Interest (income) expense, net | (2,187) | 14,087 | |||||||||
| Income tax expense | 205 | 206 | |||||||||
| Depreciation and amortization | 19,731 | 28,996 | |||||||||
| Stock-based compensation expense | 16,185 | (1,060) | |||||||||
| Unrealized fair value adjustment on energy derivatives | — | (797) | |||||||||
| Losses on exchange or disposal of property, plant and equipment | 6 | 3,820 | |||||||||
| Loss on debt extinguishment | — | 50 | |||||||||
| Post-emergence bankruptcy advisory costs | 603 | 1,687 | |||||||||
| Reorganization items, net | — | (111,439) | |||||||||
Change in fair value of warrants and contingent value rights | (621,464) | (60,114) | |||||||||
| Other non-operating expense, net | 157 | 1,746 | |||||||||
| Other | — | 123 | |||||||||
| Adjusted EBITDA | $ | (6,071) | $ | 87,996 | |||||||
-more-
Core Scientific, Inc. Fiscal First Quarter 2025 Earnings Release - 11 | ||||||||
/////////////////////////////////////////////////////////////////////////////////////////////////////////////////////////////////////
Please follow us on:
 |  |  | ||||||||||||
https://www.linkedin.com/company/corescientific/
https://twitter.com/core_scientific
https://www.youtube.com/@Core_Scientific
CONTACTS
Investors:
Media:
-end-