
Crawford & Company®
5335 Triangle Parkway
Peachtree Corners, GA 30092
FOR IMMEDIATE RELEASE
CRAWFORD & COMPANY REPORTS 2019 FOURTH QUARTER AND FULL YEAR RESULTS
ISSUES INITIAL 2020 GUIDANCE
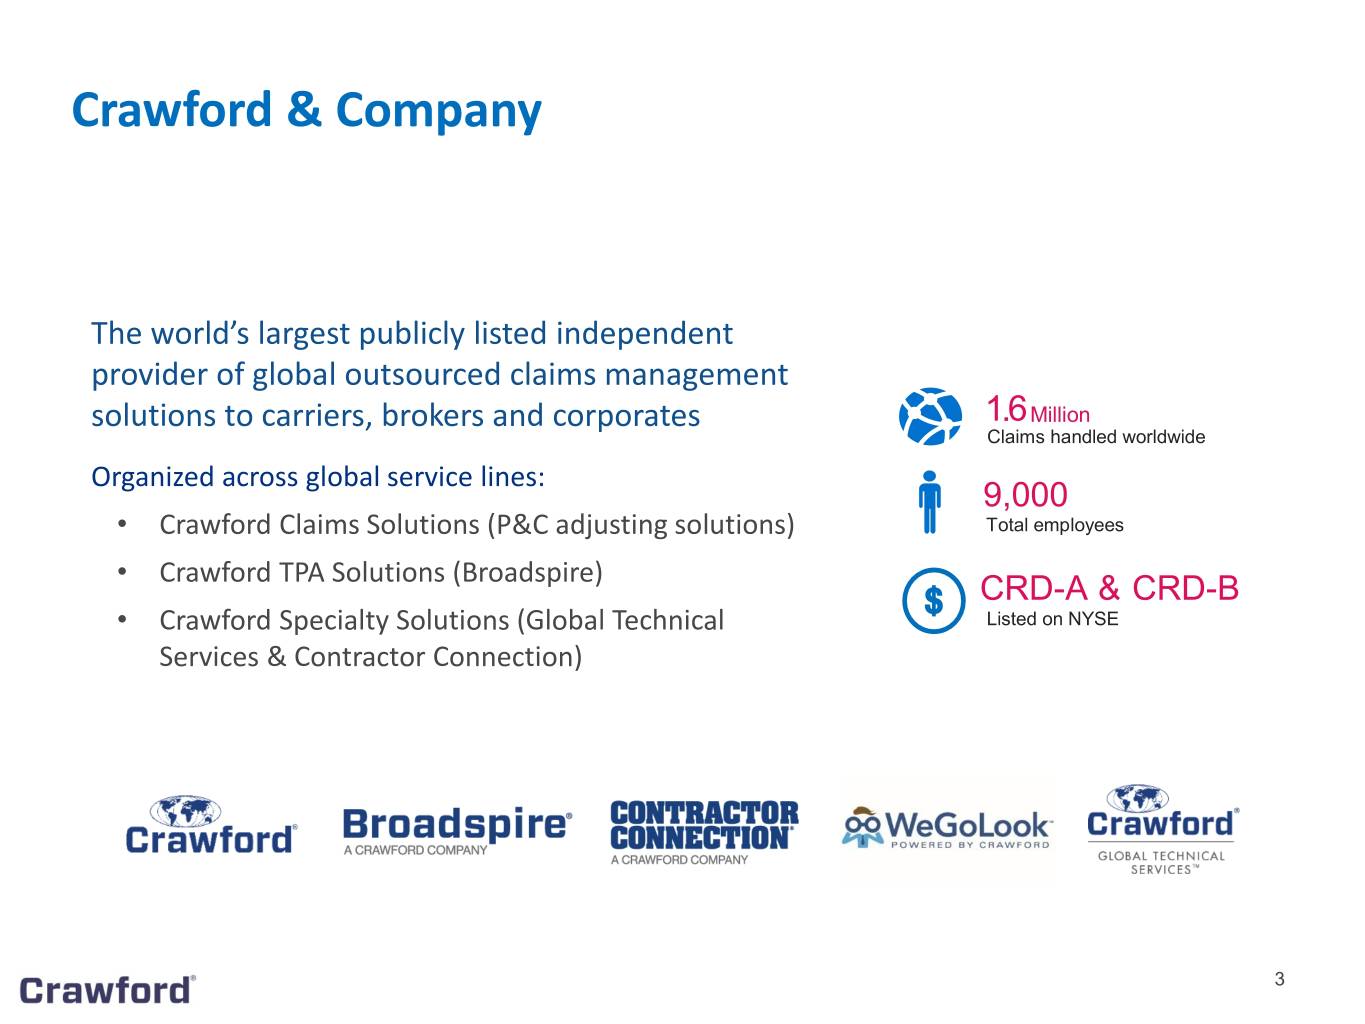
ATLANTA, (March 5, 2020) -- Crawford & Company® (NYSE: CRD-A and CRD-B), the world’s largest publicly listed independent provider of claims management and outsourcing solutions to carriers, brokers and corporates, today announced its financial results for the fourth quarter and full year ended December 31, 2019.
The Company’s two classes of stock are substantially identical, except with respect to voting rights and the Company’s ability to pay greater cash dividends on the non-voting Class A Common Stock (CRD-A) than on the voting Class B Common Stock (CRD-B), subject to certain limitations. In addition, with respect to mergers or similar transactions, holders of CRD-A must receive the same type and amount of consideration as holders of CRD-B, unless different consideration is approved by the holders of 75% of CRD-A, voting as a class.
GAAP Consolidated Results
Fourth Quarter 2019
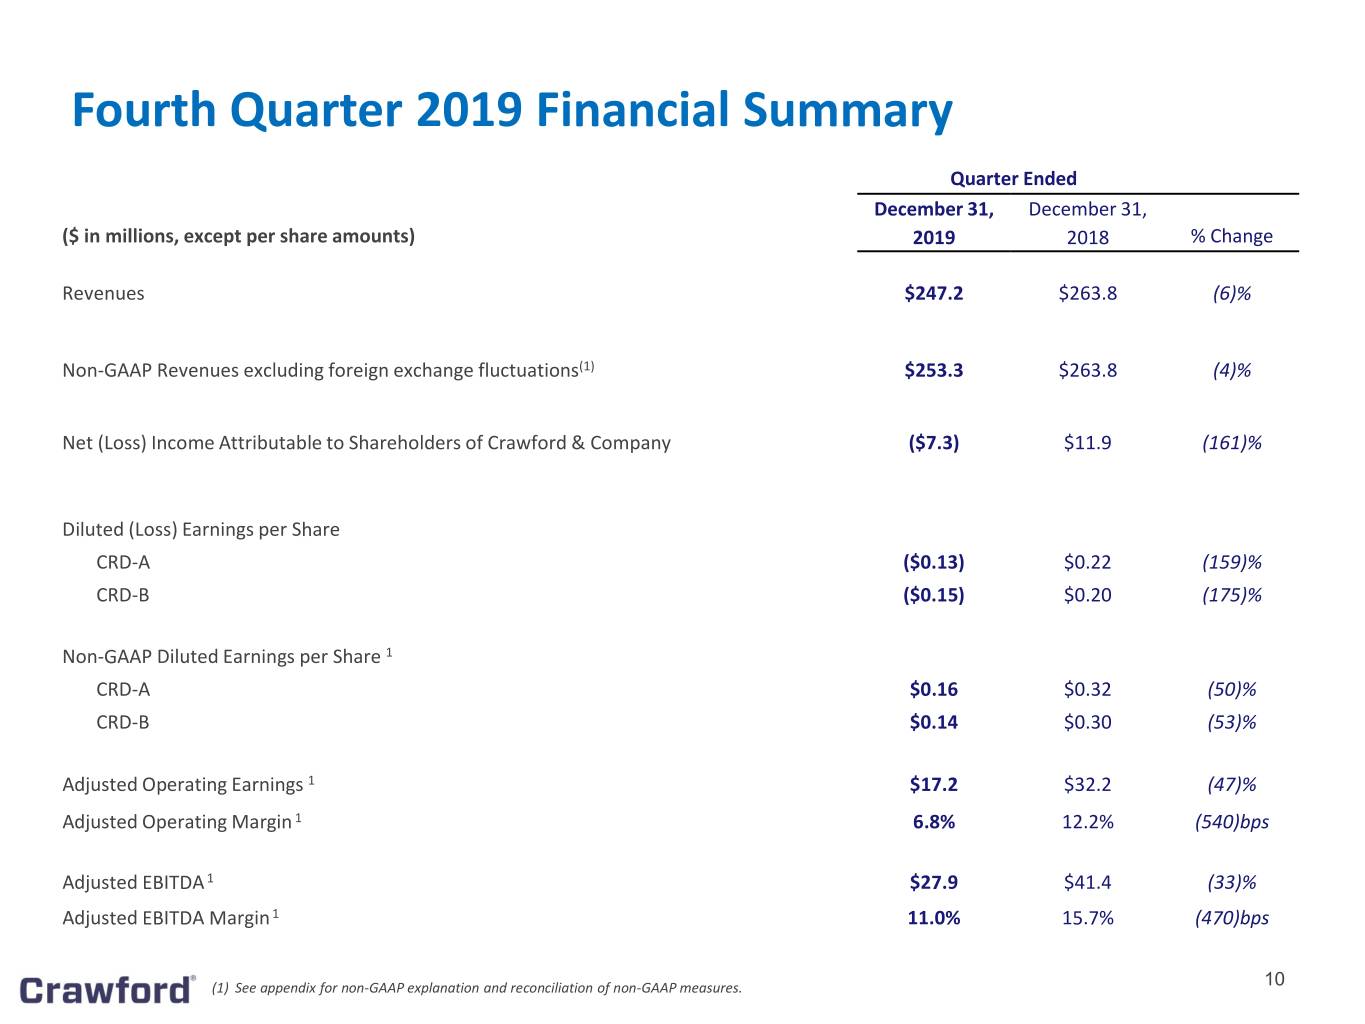
• | Revenues before reimbursements of $247.2 million, compared with $263.8 million for the 2018 fourth quarter |
• | Net loss attributable to shareholders of $(7.3) million, compared to income of $11.9 million in the same period last year |
• | Diluted loss per share of $(0.13) for CRD-A and $(0.15) for CRD-B, compared with earnings per share of $0.22 for CRD-A and $0.20 for CRD-B in the prior year fourth quarter |
Non-GAAP Consolidated Results
Fourth Quarter 2019
Non-GAAP results for the 2019 fourth quarter have been presented on a constant dollar basis to 2018 and exclude goodwill impairment charges and valuation allowances on certain deferred tax assets. Non-GAAP consolidated results for the 2018 quarter exclude intangible asset impairment charges, loss on disposition of business line and the impact of tax reform in the U.S.
• | Revenues before reimbursements, on a non-GAAP basis, of $253.3 million, decreasing 4.0% compared with $263.8 million for the 2018 fourth quarter |
• | Net income attributable to shareholders, on a non-GAAP basis, totaled $7.9 million in the 2019 fourth quarter, down compared to $17.3 million in the same period last year |
• | Diluted earnings per share, on a non-GAAP basis, of $0.16 for CRD-A and $0.14 for CRD-B in the 2019 fourth quarter, down from $0.32 for CRD-A and $0.30 for CRD-B in the prior year fourth quarter |
Page 1 of 18
• | Consolidated adjusted operating earnings, on a non-GAAP basis, were $17.2 million, or 6.8% of non-GAAP revenues, in the 2019 fourth quarter, down compared with $32.2 million, or 12.2% of revenues, in the 2018 fourth quarter |
• | Consolidated adjusted EBITDA, a non-GAAP financial measure, was $27.9 million, or 11.0% of non-GAAP revenues, in the 2019 fourth quarter, down compared with $41.4 million, or 15.7% of revenues, in the 2018 fourth quarter |
GAAP Consolidated Results
Full Year 2019
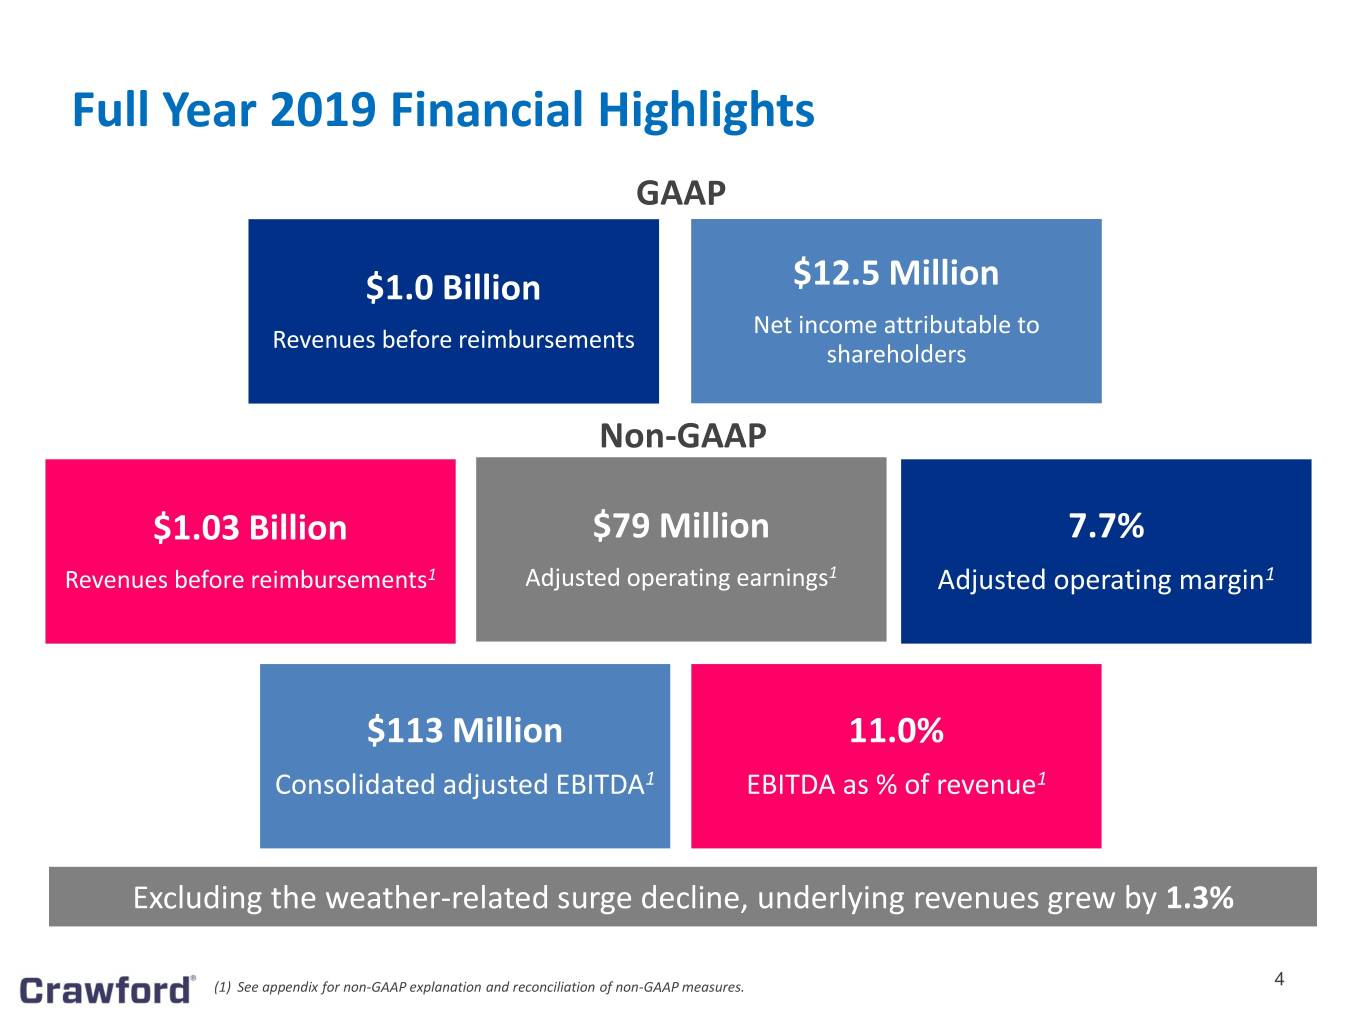
• | Revenues before reimbursements of $1.006 billion in 2019, compared with $1.071 billion for 2018 |
• | Net income attributable to shareholders of $12.5 million, compared to $26.0 million in 2018 |
• | Diluted earnings per share of $0.26 for CRD-A and $0.19 for CRD-B, compared with $0.50 for CRD-A and $0.42 for CRD-B in 2018 |
Non-GAAP Consolidated Results
Full Year 2019
Non-GAAP results for 2019 full year have been presented on a constant dollar basis to 2018 and excluding goodwill impairment charges, arbitration and claim settlements and valuation allowances on certain deferred tax assets. Non-GAAP consolidated results for the 2018 full year exclude net operating results of the Garden City Group business, the “GCG business”, disposed of on June 15, 2018, the loss on disposition of the GCG business line, intangible asset impairment charges and the impact of tax reform in the U.S.
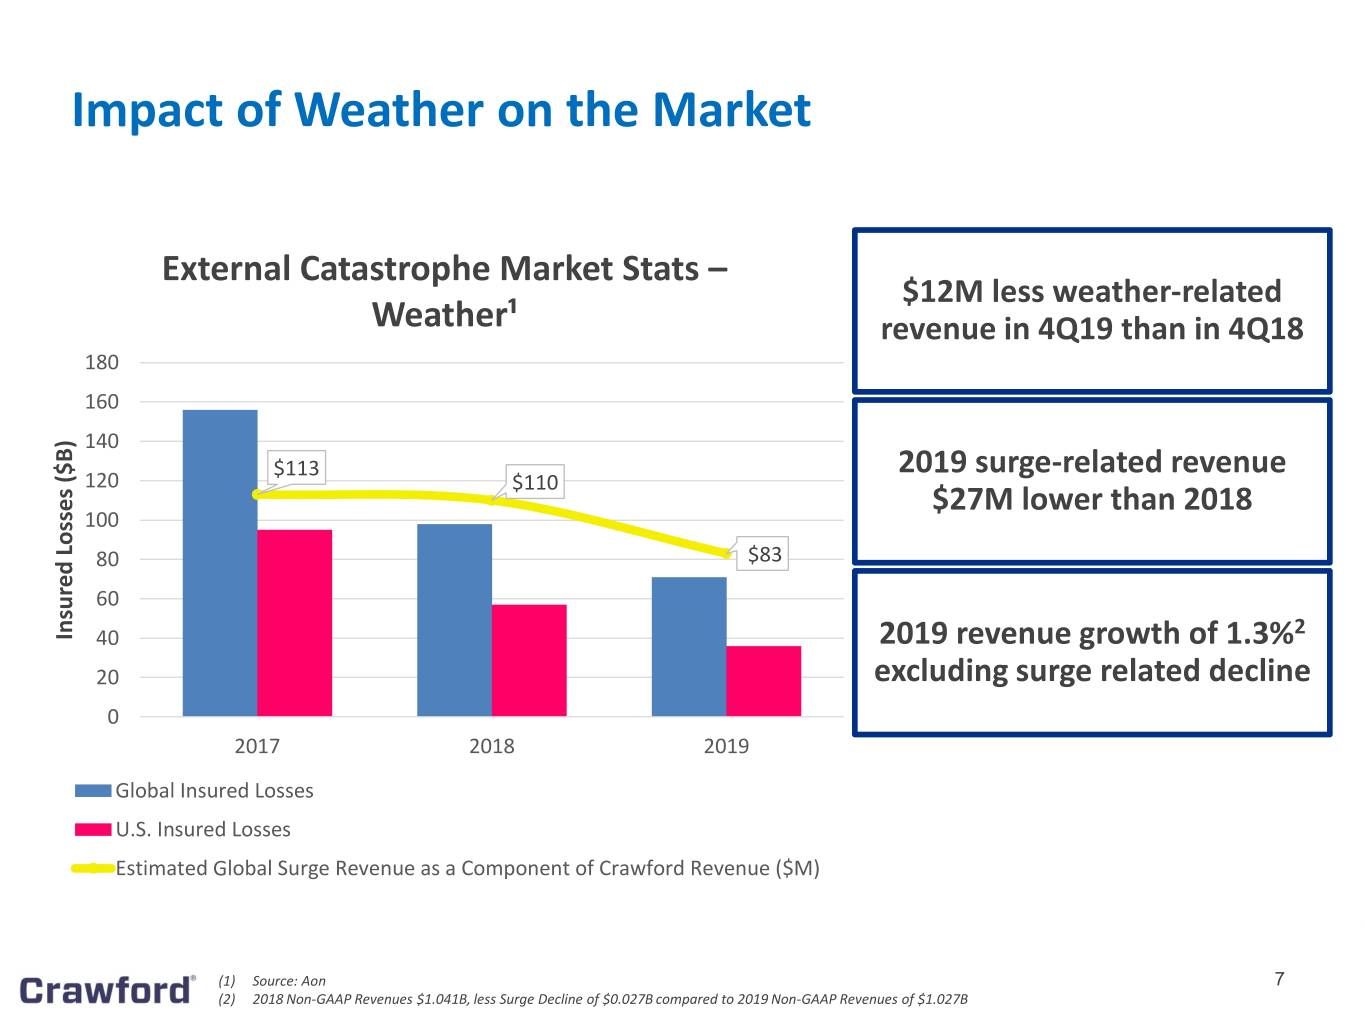
• | Revenues before reimbursements, on a non-GAAP basis, of $1.027 billion, decreasing 1.3% compared with $1.041 billion for 2018 |
• | Net income attributable to shareholders, on a non-GAAP basis, totaled $37.3 million in 2019 compared to $46.3 million last year |
• | Diluted earnings per share, on a non-GAAP basis, of $0.72 for CRD-A and $0.65 for CRD-B in 2019, down from $0.86 for CRD-A and $0.79 for CRD-B in the prior year |
• | Consolidated adjusted operating earnings, on a non-GAAP basis, were $78.7 million, or 7.7% of non-GAAP revenues, in 2019, down compared with $89.5 million, or 8.6% of revenues, in 2018 |
• | Consolidated adjusted EBITDA, a non-GAAP financial measure, was $112.8 million, or 11.0% of non-GAAP revenues in 2019, compared with $127.2 million, or 12.2% of revenues, in 2018 |
Page 2 of 18
Management Comments
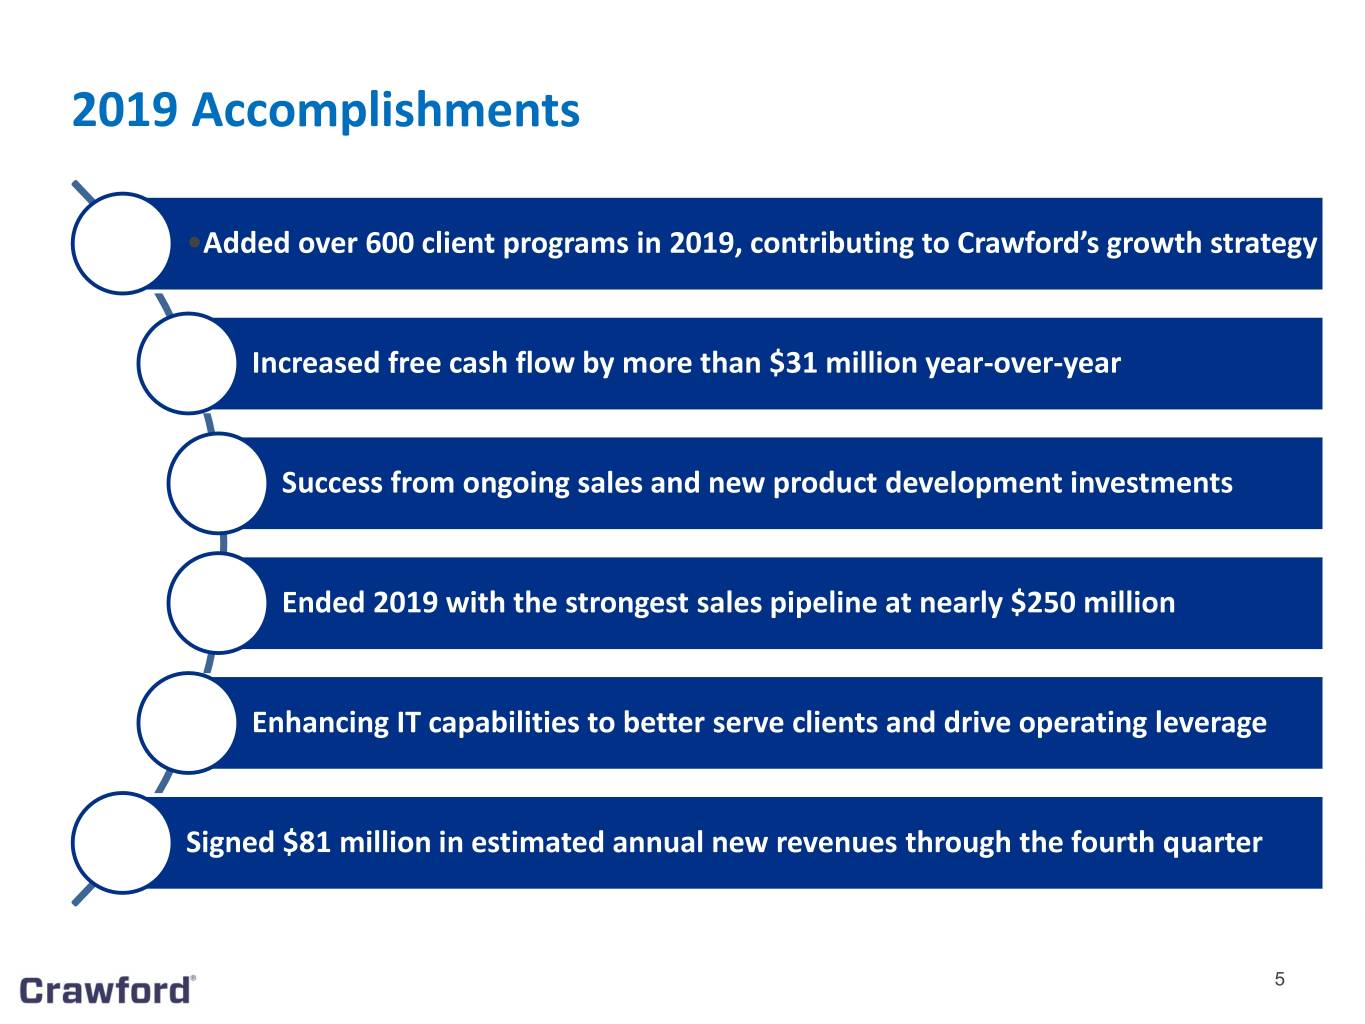
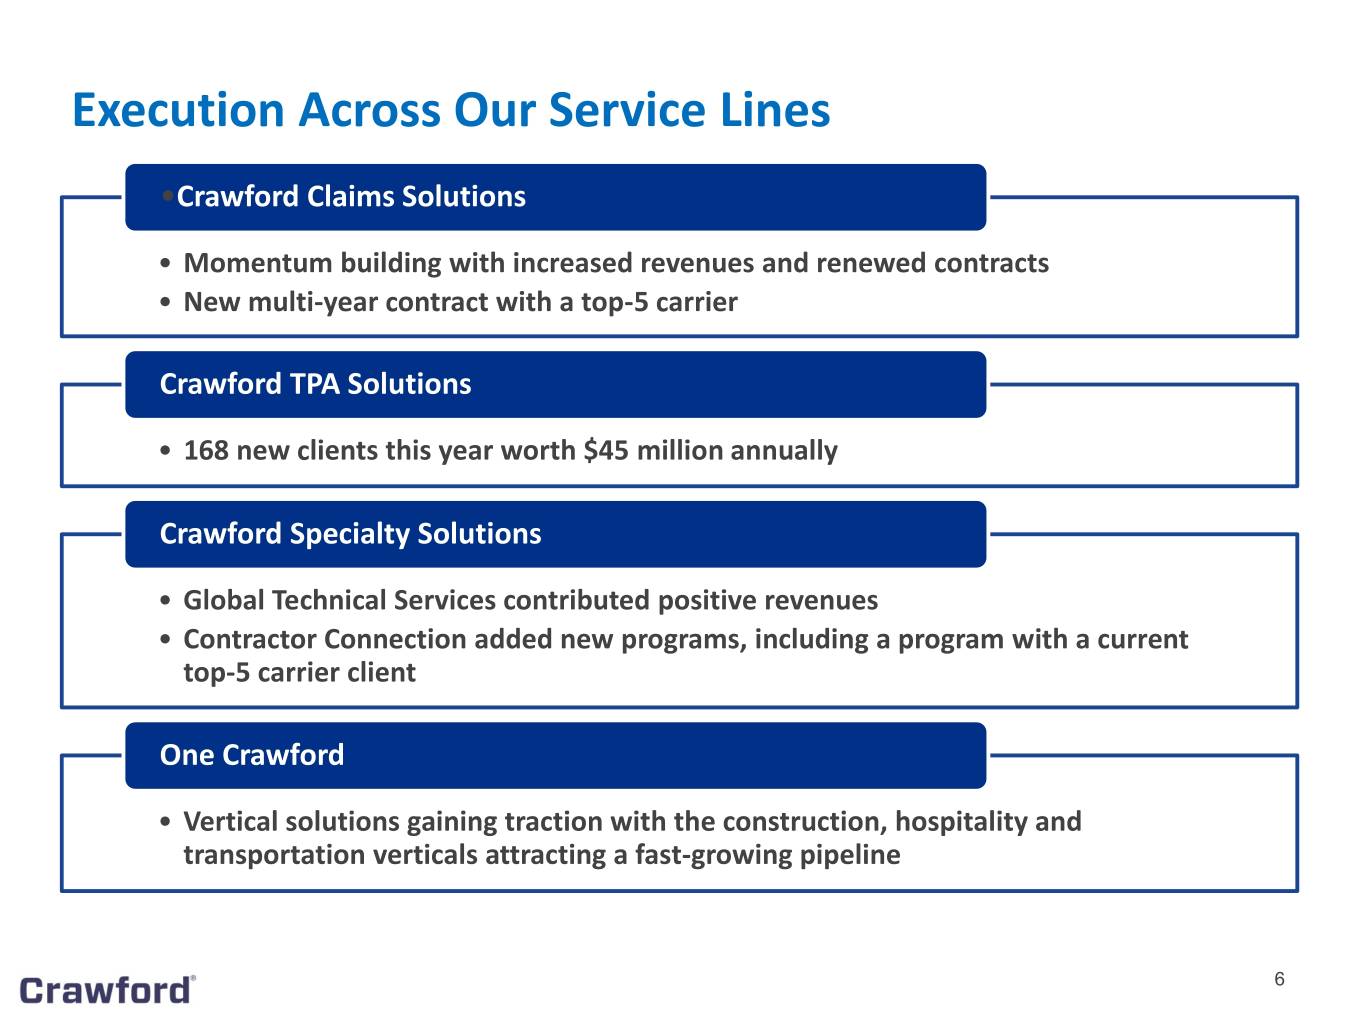
Mr. Harsha V. Agadi, president and chief executive officer of Crawford & Company, stated, “Operating a business with exposure to weather can ultimately be difficult to predict, and so while the impact on the fourth quarter and full year results were largely driven by external factors, we were still able to deliver on many of our objectives. We grew operating and free cash flow significantly, invested $14.0 million in innovations to better equip our client service delivery teams around the world, built a more robust pipeline of sales opportunities in all of our global service lines, and closed a large number of new clients which should help drive our growth in 2020. We continued to leverage our previous investments in technology towards broadening our product offerings, which has allowed us to close a number of small- and mid-sized carrier clients in the year.”
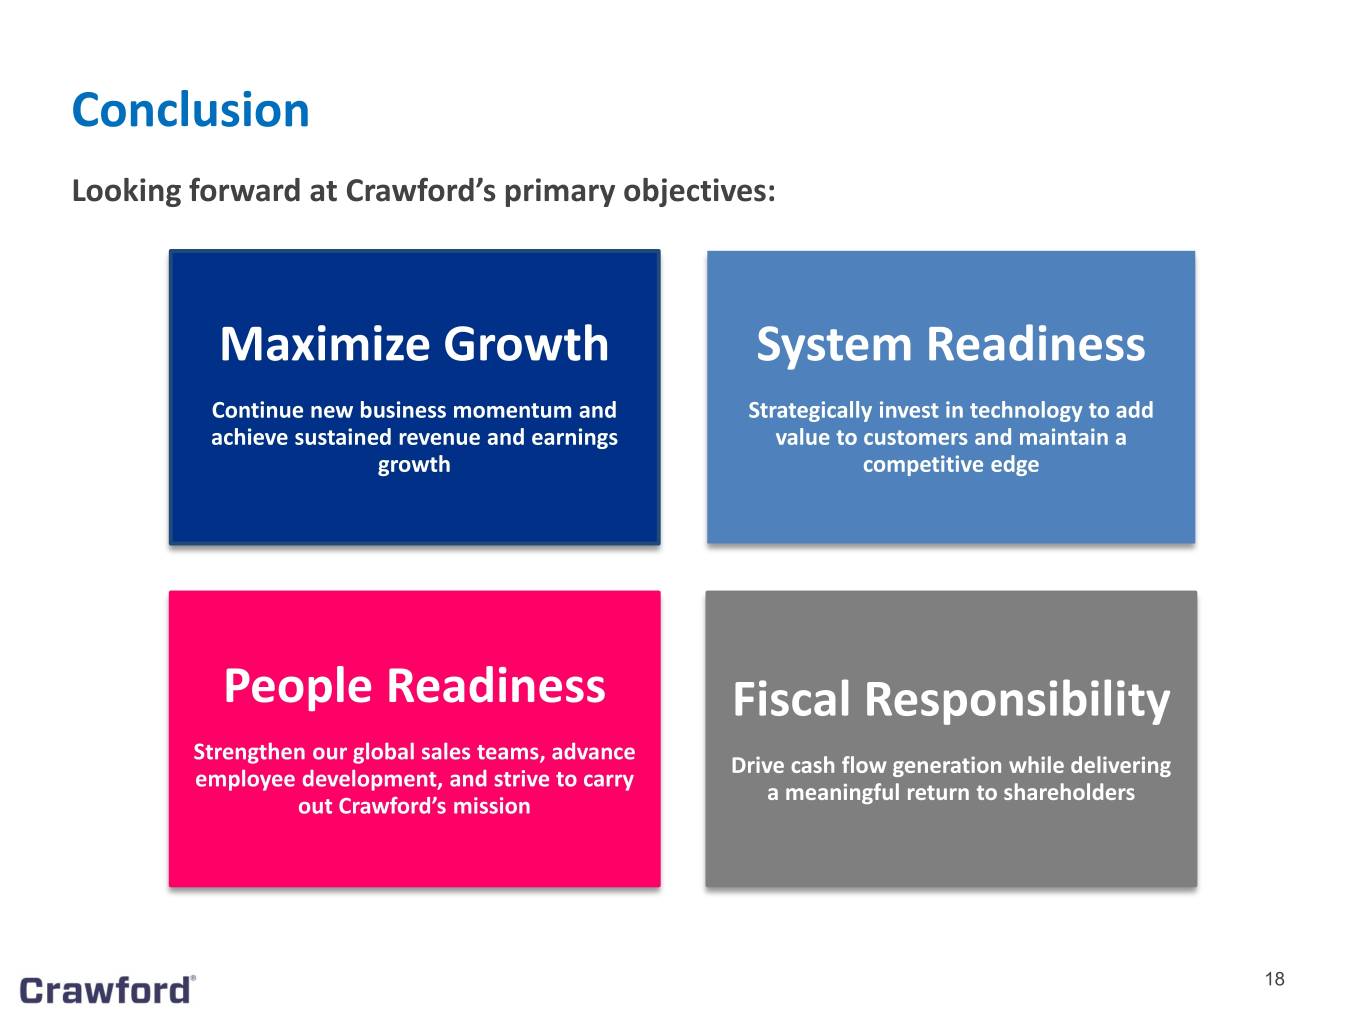
Mr. Agadi concluded, “Going forward, we will continue to focus on the areas we can control. On the expense side, we have identified several areas of cost savings that we expect to gain traction in the second quarter of this year, we will continue to focus on cash generation, paying down debt, and maintaining our strong and flexible balance sheet so that we can remain nimble with our strategic investments. Long term, we remain committed to sustained revenue and earnings growth, and are confident we have laid the foundation to achieve our future business goals. With catastrophic climate conditions as the new reality, our global teams are equipped to handle the increased claims volumes that should ensue. We have developed industry-leading offerings that are innovative and attractive to our customers who increasingly view us as strategic partners. Long term, this Company remains on a path to sustained growth and driving free cash flow generation to support our investments and returning cash to shareholders, which we believe will deliver meaningful value creation for our shareholders.”
Segment Results for the Fourth Quarter and Full Year
Crawford TPA Solutions
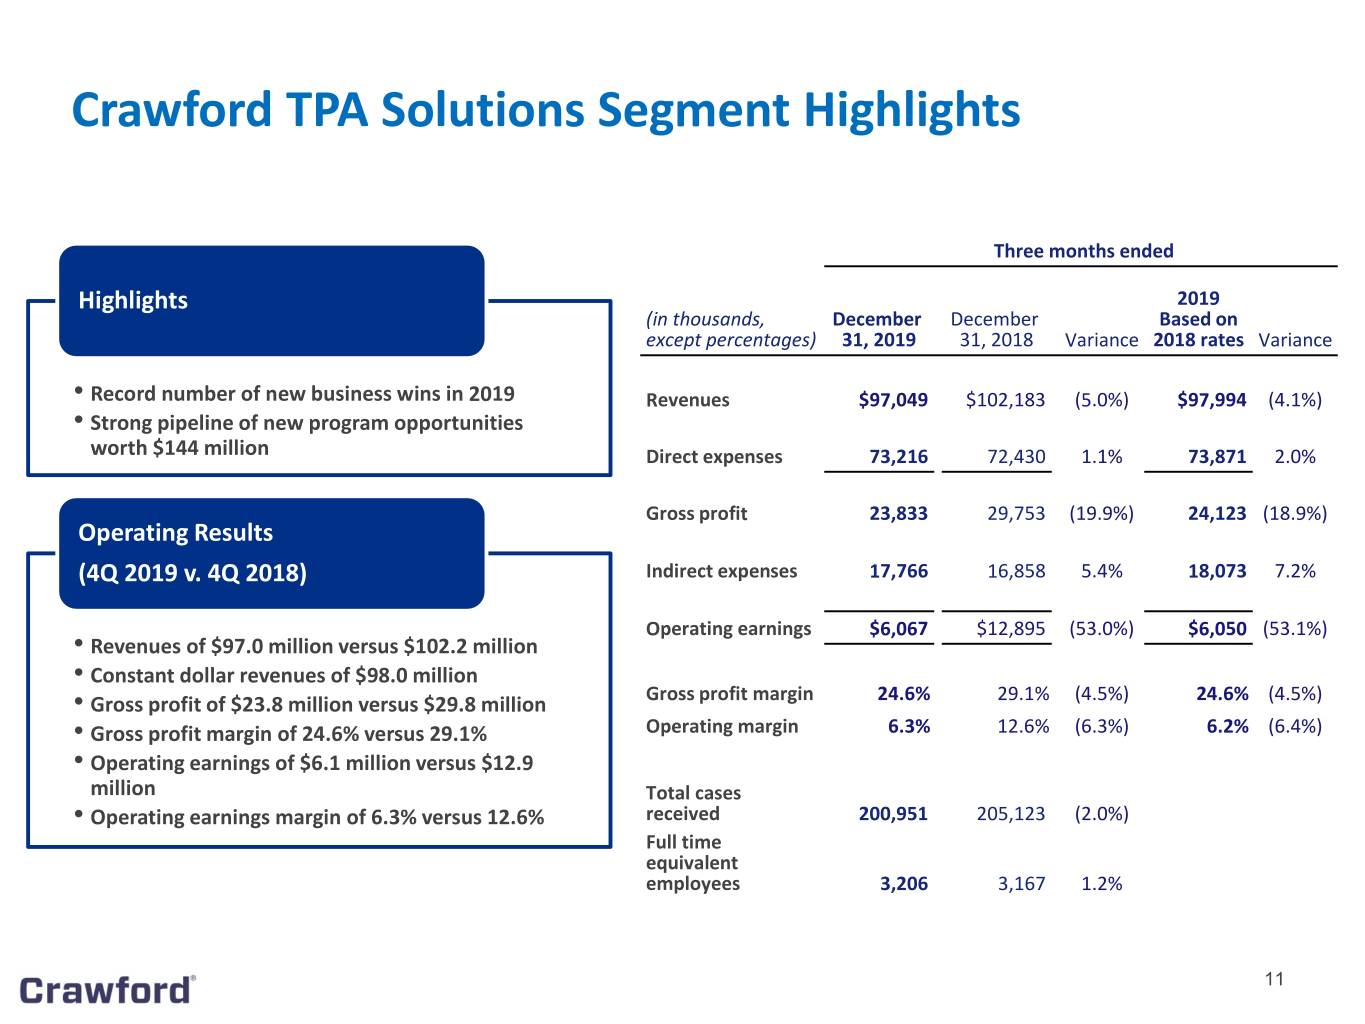
Crawford TPA Solutions segment revenues before reimbursements were $97.0 million in the 2019 fourth quarter, decreasing from $102.2 million in the 2018 fourth quarter. Absent foreign currency rate fluctuations of $1.0 million, fourth quarter 2019 revenues would have been $98.0 million, down 4.1% from prior year fourth quarter.
Excluding centralized indirect support costs, gross profit decreased to $23.8 million, or a gross margin of 24.6% in 2019 from $29.8 million, or a gross margin of 29.1% in 2018. After allocation of indirect costs, Crawford TPA Solutions recorded operating earnings of $6.1 million in the fourth quarter of 2019 representing an operating margin of 6.3% compared with $12.9 million, or 12.6% of revenues, in the 2018 fourth quarter.
For the year, Crawford TPA Solutions segment revenues before reimbursements were $393.9 million a decrease from $405.3 million in 2018. Absent foreign exchange rate fluctuations of $3.7 million, 2019 revenues were $397.6 million, down 1.9% from prior year.
Excluding centralized indirect support costs, gross profit decreased to $99.7 million, or a gross margin of 25.3% in 2019 from $109.2 million, or a gross margin of 26.9% in 2018. After allocation of indirect costs, Crawford TPA Solutions recorded operating earnings of $27.2 million in 2019 representing an operating margin of 6.9% compared with $36.9 million, or 9.1% of revenues, in 2018.
Crawford Claims Solutions
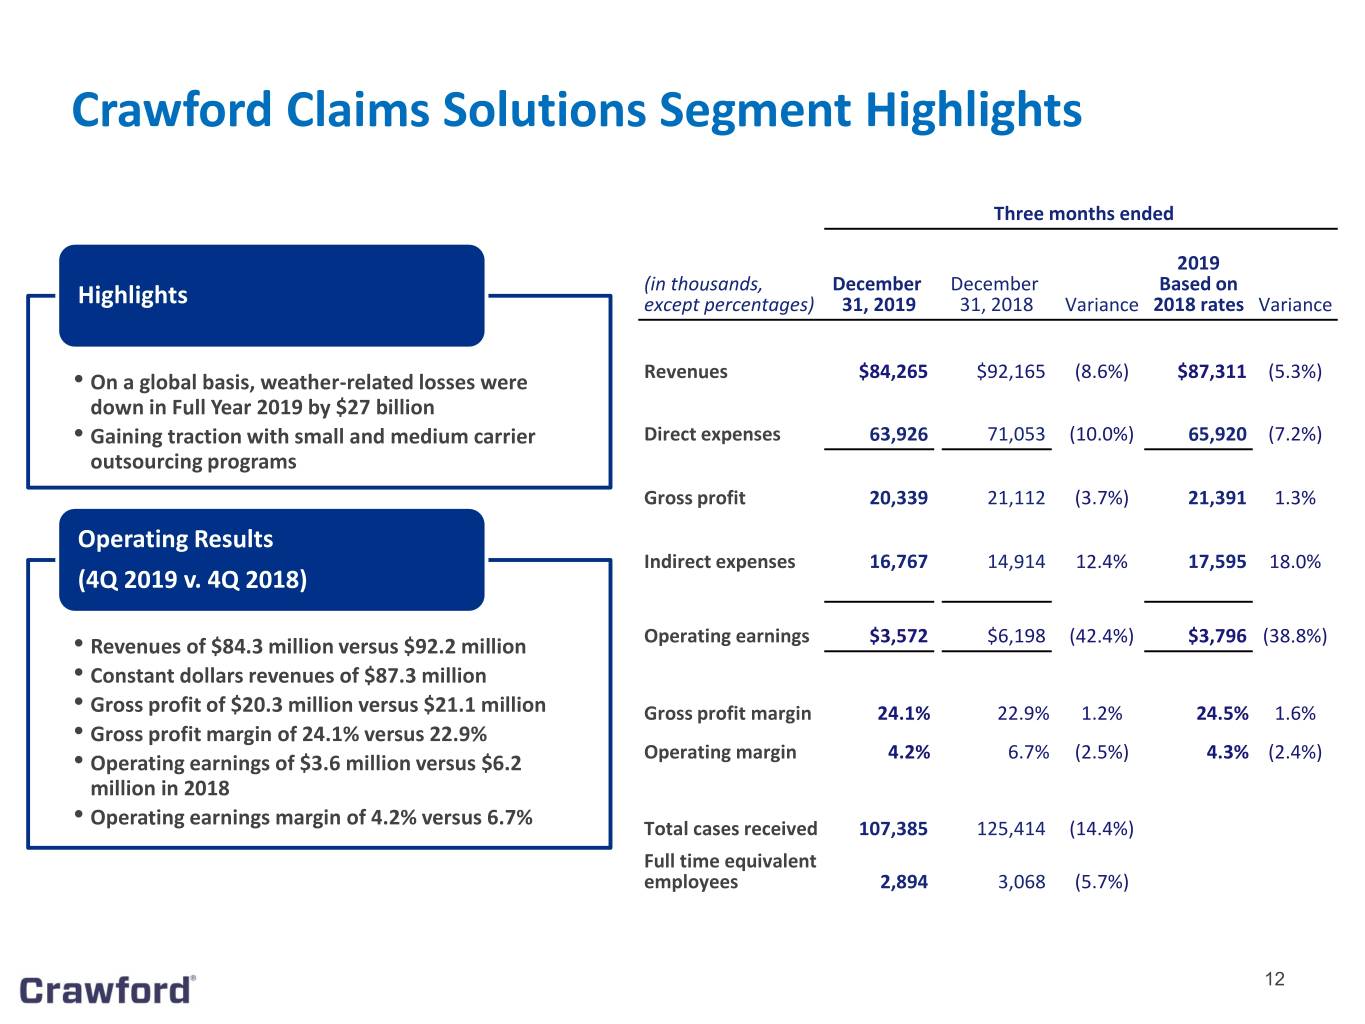
Crawford Claims Solutions revenues before reimbursements were $84.3 million in the fourth quarter of 2019, decreasing from $92.2 million in the fourth quarter of 2018. Absent foreign currency rate fluctuations of $3.0 million, fourth quarter 2019 revenues would have been $87.3 million, down 5.3% from the prior year fourth quarter.
Excluding centralized indirect support costs, gross profit decreased to $20.3 million, or a gross margin of 24.1% in 2019 from $21.1 million, or a gross margin of 22.9% in 2018. After the allocation of indirect costs, operating earnings were $3.6 million in the 2019 fourth quarter compared with operating earnings of $6.2 million in the fourth quarter of 2018. These results represent an operating margin of 4.2% in the 2019 quarter and 6.7% in the 2018 quarter.
Page 3 of 18
Crawford Claims Solutions revenues before reimbursements were $339.8 million for the full year 2019, decreasing from $361.1 million in 2018. Absent foreign currency rate fluctuations of $10.7 million, 2019 revenues were $350.5 million, down 2.9% from the prior year.
Excluding centralized indirect support costs, gross profit decreased to $76.7 million, or a gross margin of 22.6% in 2019 from $78.3 million, or a gross margin of 21.7% in 2018. After the allocation of indirect costs, operating earnings were $7.6 million in 2019 compared with operating earnings of $11.3 million in 2018. These results represent an operating margin of 2.2% in 2019 and 3.1% in 2018.
Crawford Specialty Solutions
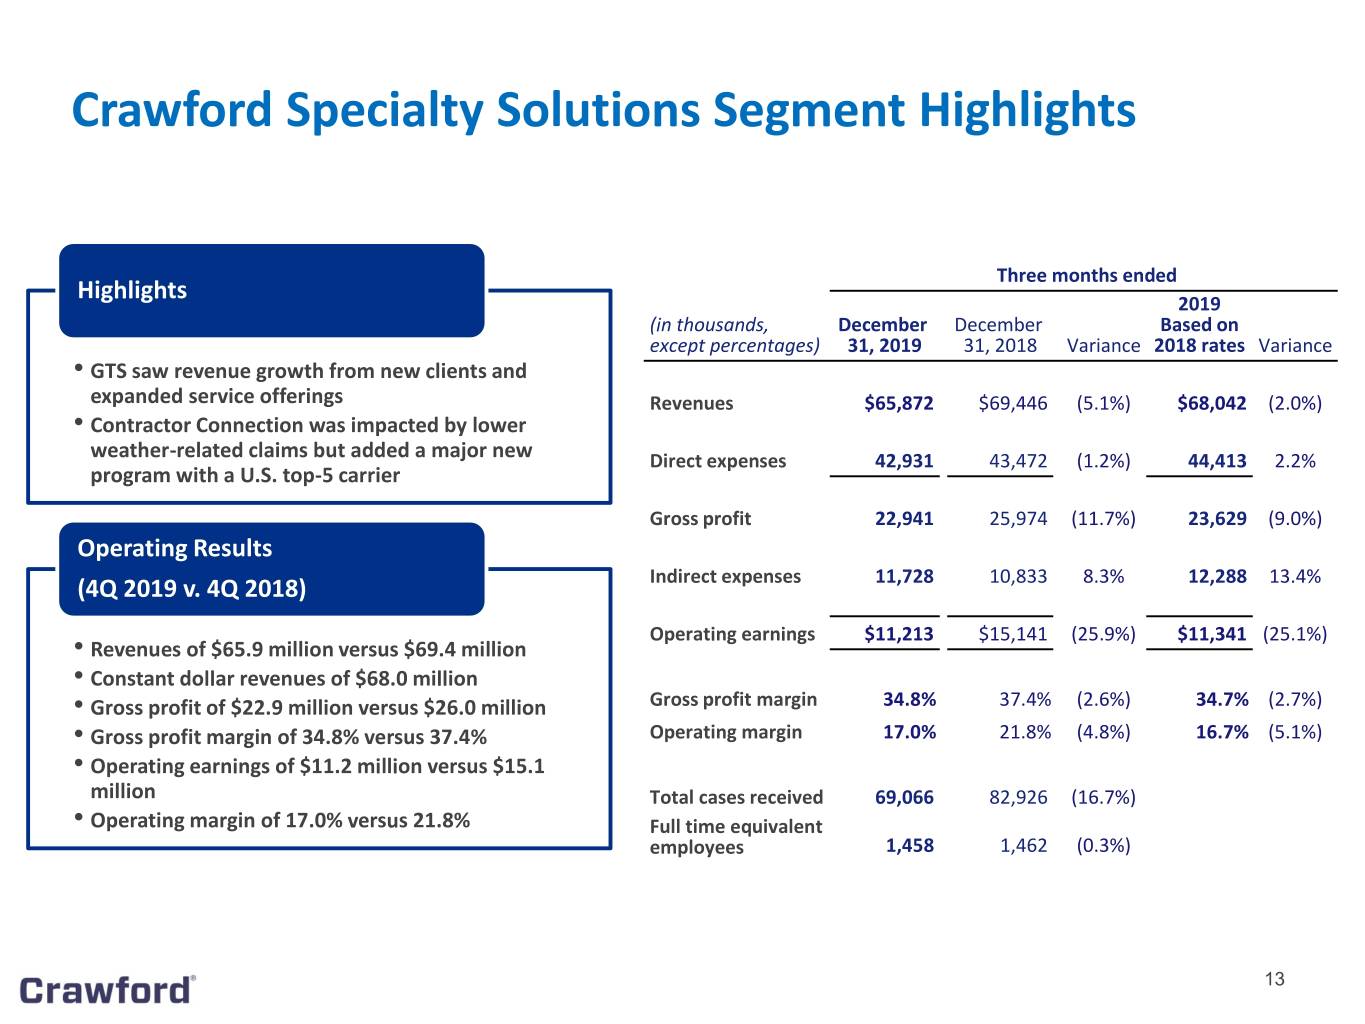
Crawford Specialty Solutions revenues before reimbursements were $65.9 million in the fourth quarter of 2019, down from $69.4 million in the same period of 2018. Absent foreign exchange rate fluctuations of $2.1 million, revenues would have been $68.0 million for the three months ended December 31, 2019, decreasing 2.0% compared to prior year fourth quarter revenues of $69.4 million.
Excluding indirect support costs, gross profit decreased to $22.9 million, or a gross margin of 34.8% in the 2019 quarter, from $26.0 million, or a gross margin of 37.4%, in the 2018 period. After allocation of indirect costs, operating earnings were $11.2 million in the 2019 fourth quarter compared with $15.1 million in the 2018 period. The segment’s operating margin for the 2019 quarter was 17.0% as compared to 21.8% in the 2018 quarter.
Crawford Specialty Solutions revenues before reimbursements were $272.1 million in 2019, down from $304.6 million in 2018. Absent foreign exchange rate fluctuations of $7.2 million, revenues would have been $279.3 million for 2019, decreasing 8.3% over prior year revenues of $304.6 million, which included $29.9 million of GCG business revenues.
Excluding indirect support costs, gross profit decreased to $95.4 million, or a gross margin of 35.1% in 2019, down from $105.5 million, or a gross margin of 34.6%, in 2018, which included $6.2 million from the GCG business. After allocation of indirect costs, operating earnings were $49.3 million in 2019 compared with $49.6 million in 2018, which included $1.0 million from the GCG business. The segment’s operating margin for 2019 was 18.1% as compared to 16.3% in 2018.
Unallocated Corporate and Shared Costs and Credits, Net
Unallocated corporate costs, net were $4.1 million in the fourth quarter of 2019, compared with $2.0 million in the same period of 2018. The increase for the three months ended December 31, 2019 was primarily due to an increase in defined benefit pension expense of $1.1 million and bad debt expense of $0.7 million.
Unallocated corporate costs, net were $6.5 million in 2019, compared with $9.3 million in the same period of 2018. The decrease for 2019 was primarily due to lower professional fees of $4.9 million and other administrative costs of $2.3 million, partially offset by an increase of $4.4 million in U.S. defined benefit plan expense.
Arbitration and Claim Settlements
The Company recognized arbitration and claim settlement charges in 2019 of $12.6 million, or $0.17 per share after tax, related to an arbitration panel awarding three of four former executives of our former Garden City Group business unit additional payments associated with their departure from the Garden City Group on December 31, 2015, and a claim settlement with the fourth former executive. There are no other potential claimants related to this matter.
Page 4 of 18
Goodwill Impairment Charges
We recognized a non-cash goodwill impairment charge in 2019 totaling $17.5 million related to our Crawford Claims Solutions segment, due to lower forecasts in that reporting unit. This charge was partially offset by a $2.2 million reduction in income tax expense and $2.2 million credit in noncontrolling interest expense, or an aggregate impact of $0.24 per share.
Deferred Tax Asset Valuation Allowances
During the 2019 fourth quarter, the Company recognized a $2.0 million, or $0.04 per share, non-recurring deferred tax asset valuation allowance primarily related to certain state net operating loss carryforwards, foreign tax credits and capital losses. During the 2018 fourth quarter, the Company completed its accounting under Staff Accounting Bulletin No. 118 and recorded an income tax benefit of $3.4 million, or $0.06 per share, primarily related to the release of uncertain tax positions on transition tax, and an income tax expense of $7.0 million, or $0.13 per share, for valuation allowances against foreign tax credit carryforwards that are anticipated to expire unutilized.
Balance Sheet and Cash Flow
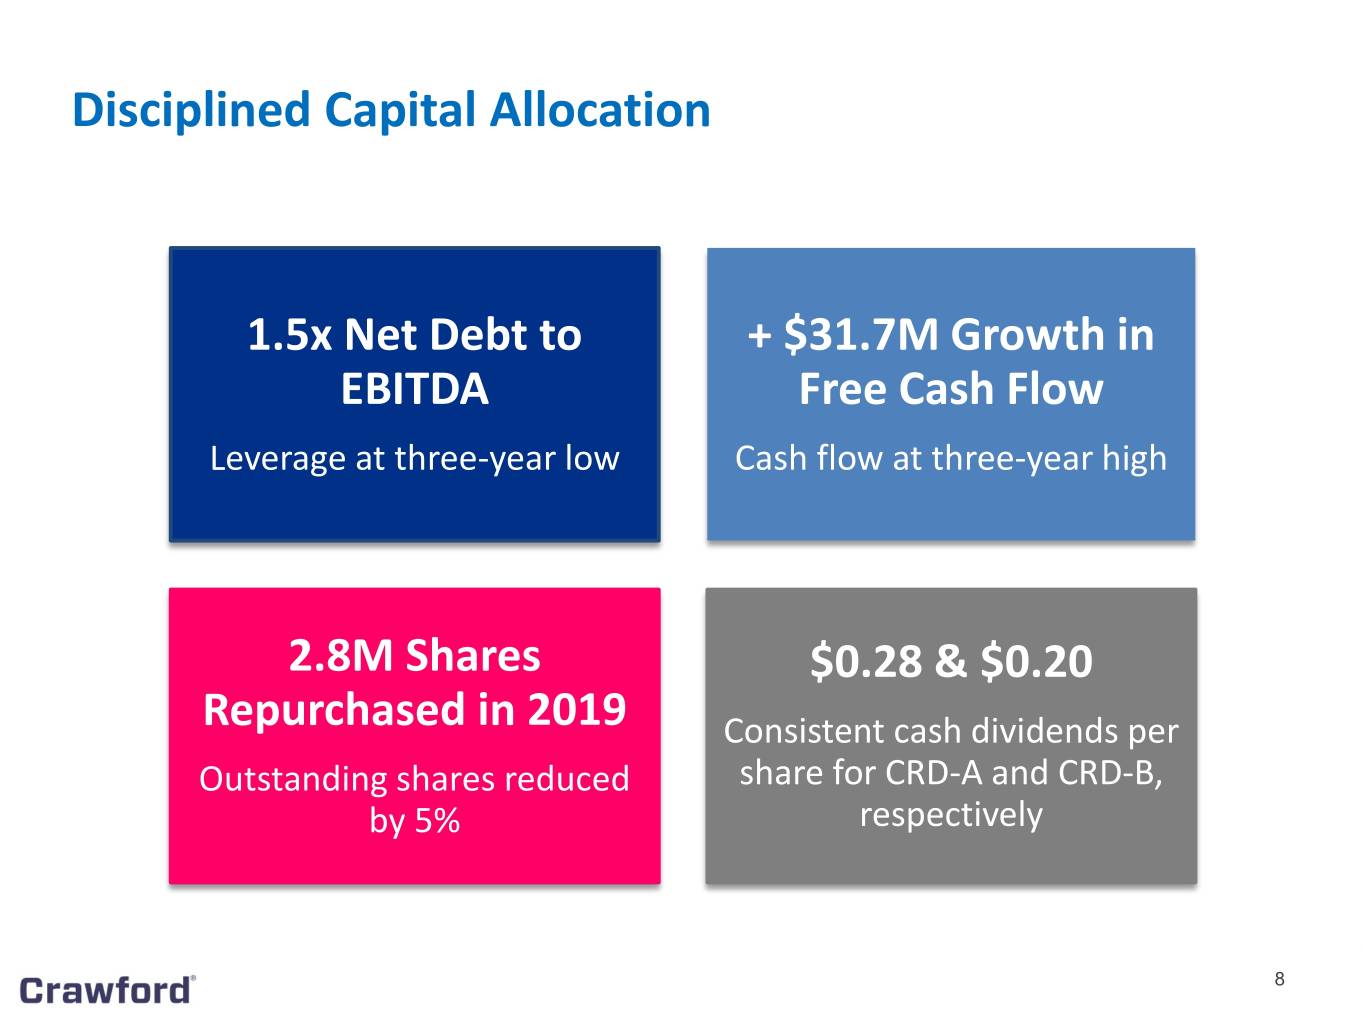
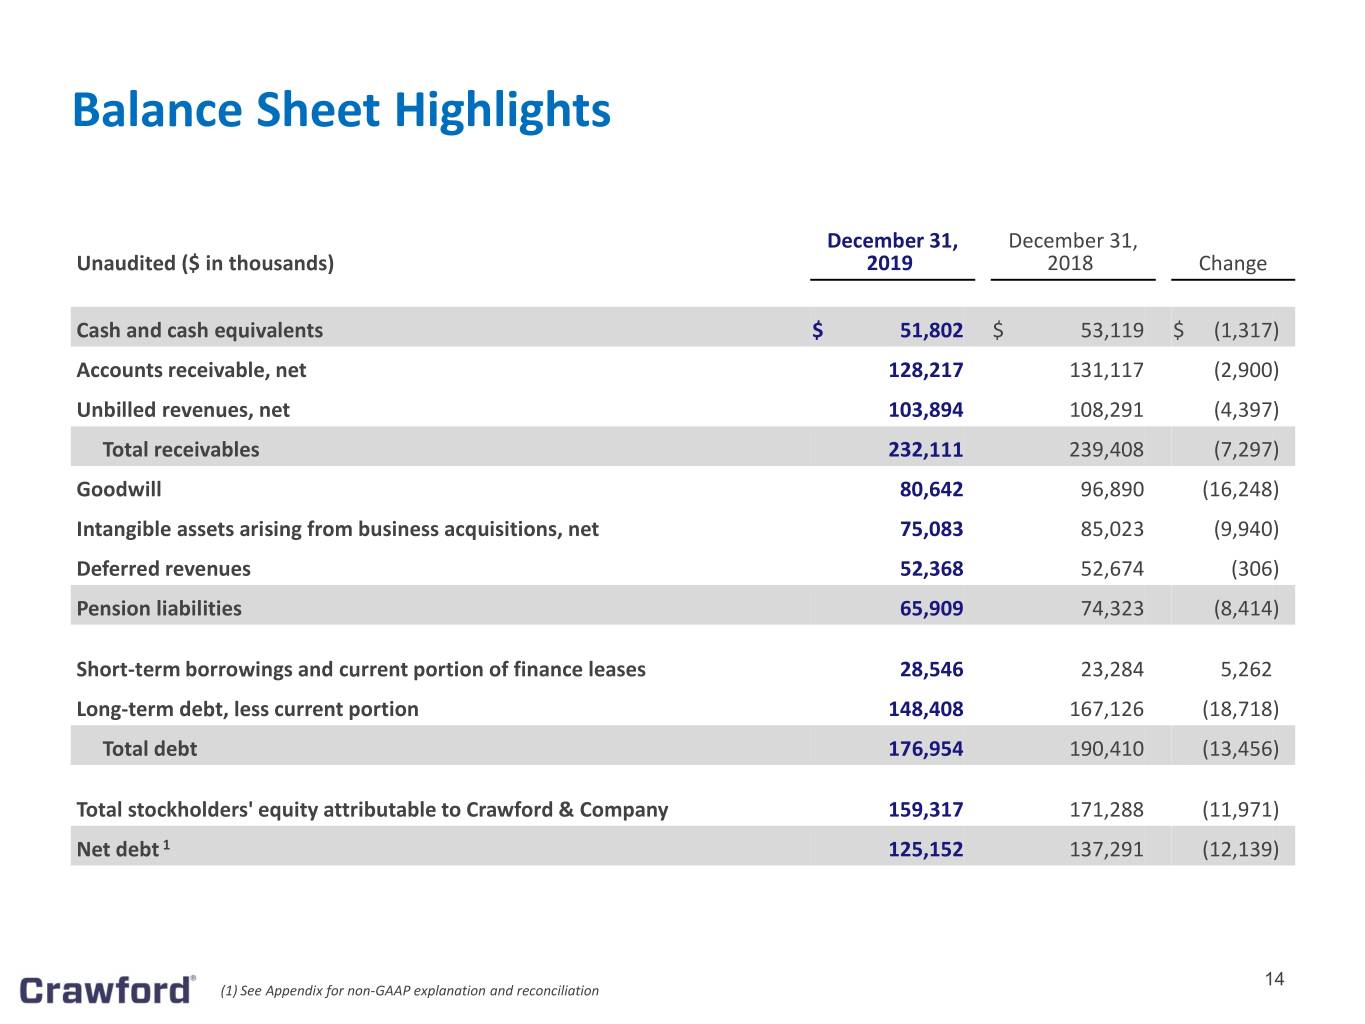
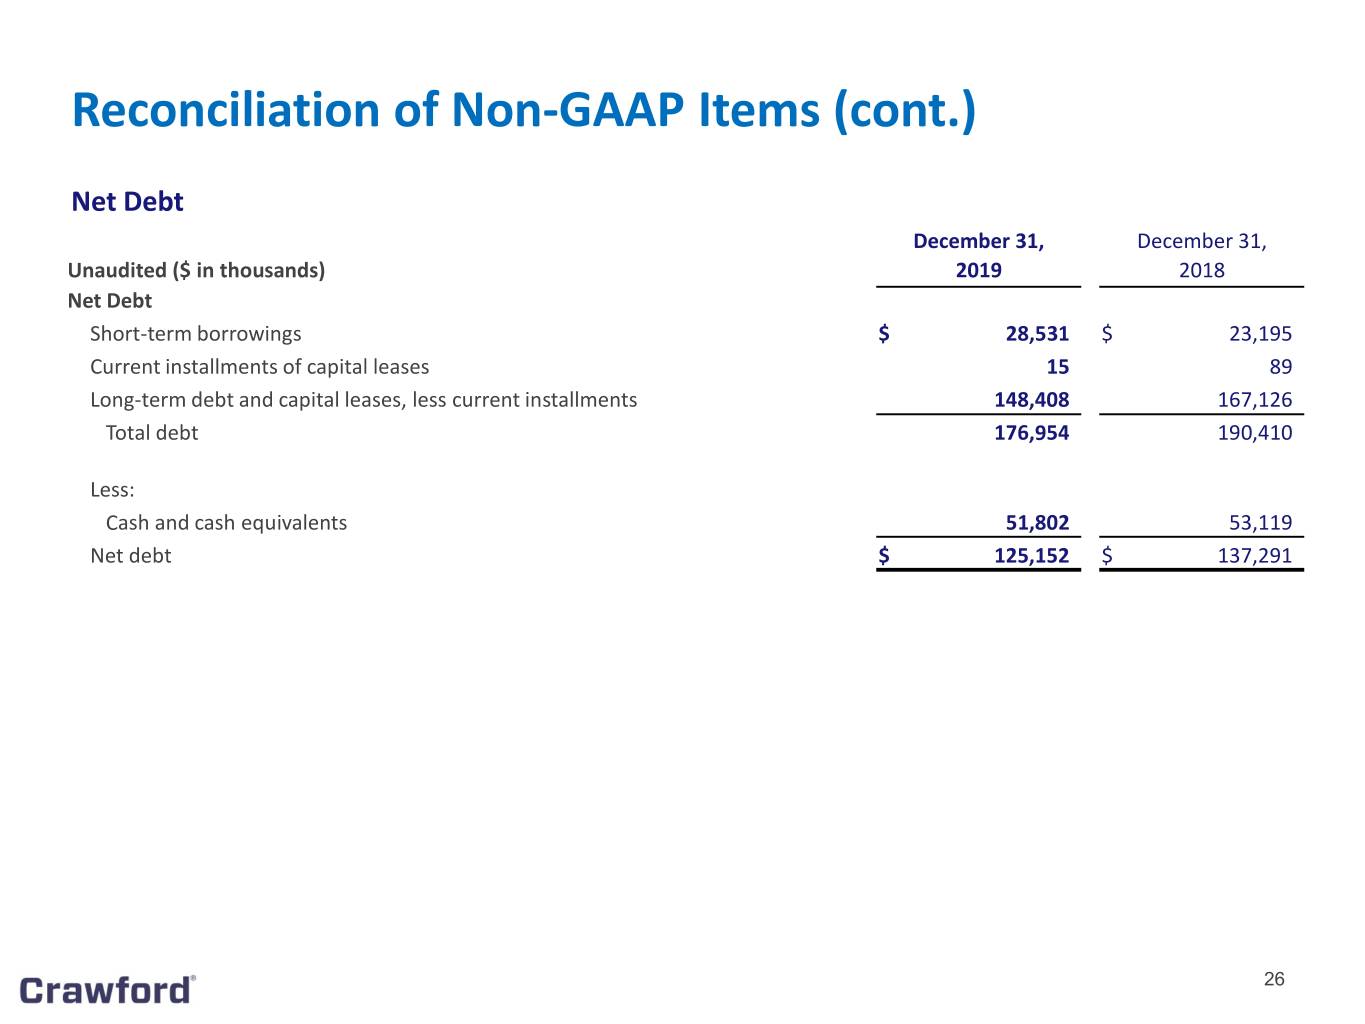
The Company’s consolidated cash and cash equivalents position as of December 31, 2019, totaled $51.8 million, compared with $53.1 million at December 31, 2018. The Company’s total debt outstanding as of December 31, 2019, totaled $177.0 million, compared with $190.4 million at December 31, 2018.
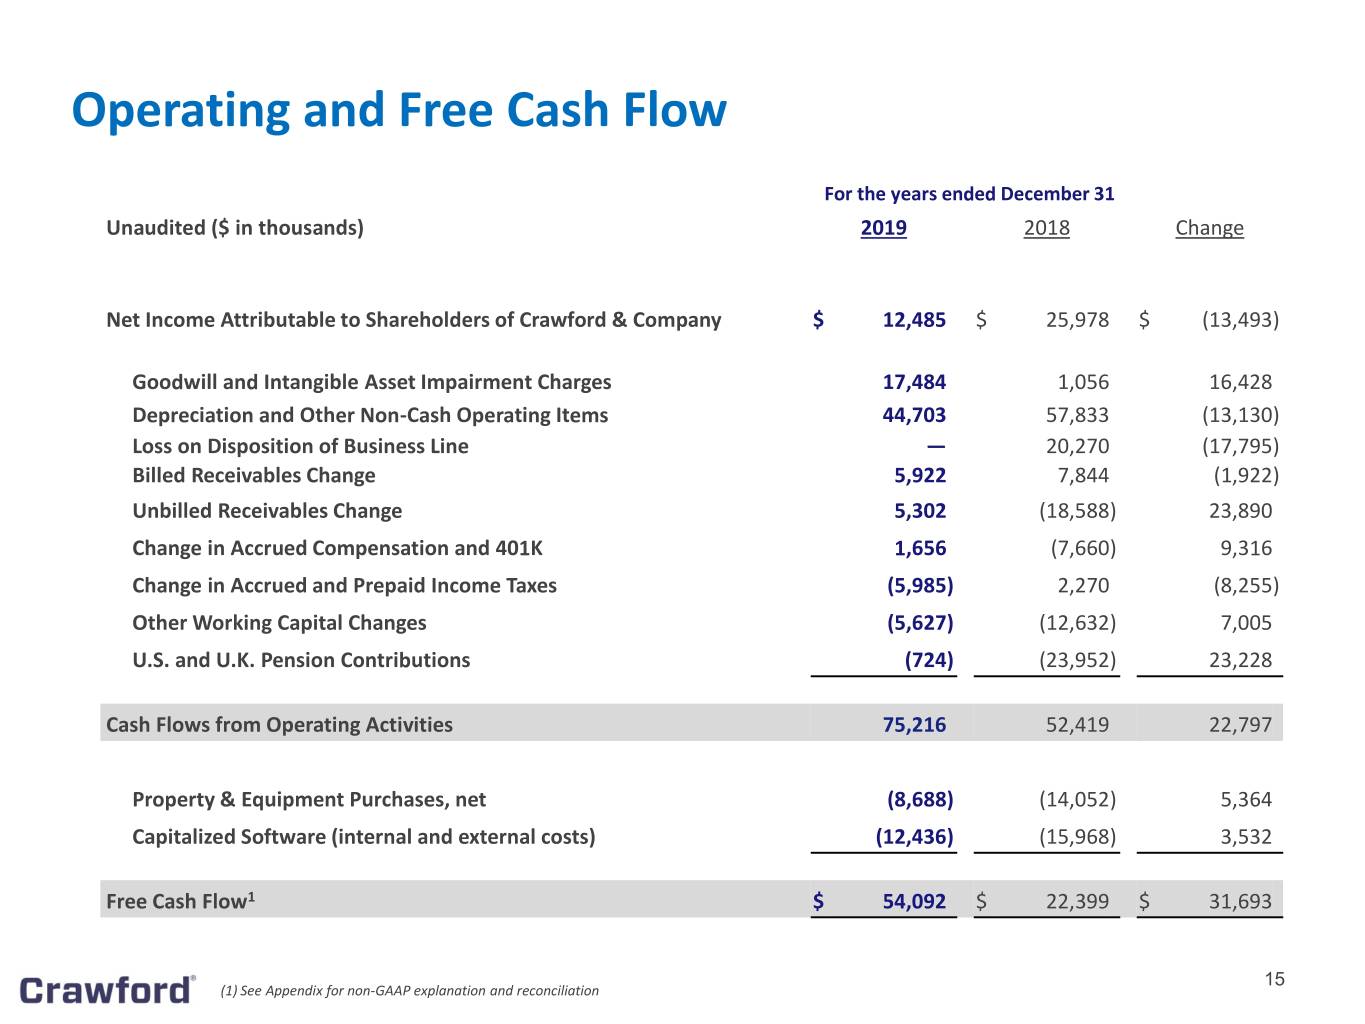
The Company’s operations provided $75.2 million of cash during 2019, compared with $52.4 million in 2018. The $22.8 million increase in cash provided by operating activities was primarily due to lower pension contributions and lower working capital requirements. Free cash flow improved by $31.7 million over 2018, reflecting lower capital expenditures in 2019 compared to 2018.
As expected, the Company made no contributions to its U.S defined benefit pension plan and $0.7 million to its U.K. plans for 2019, compared with contributions of $19.0 million and $5.0 million, respectively, in 2018.
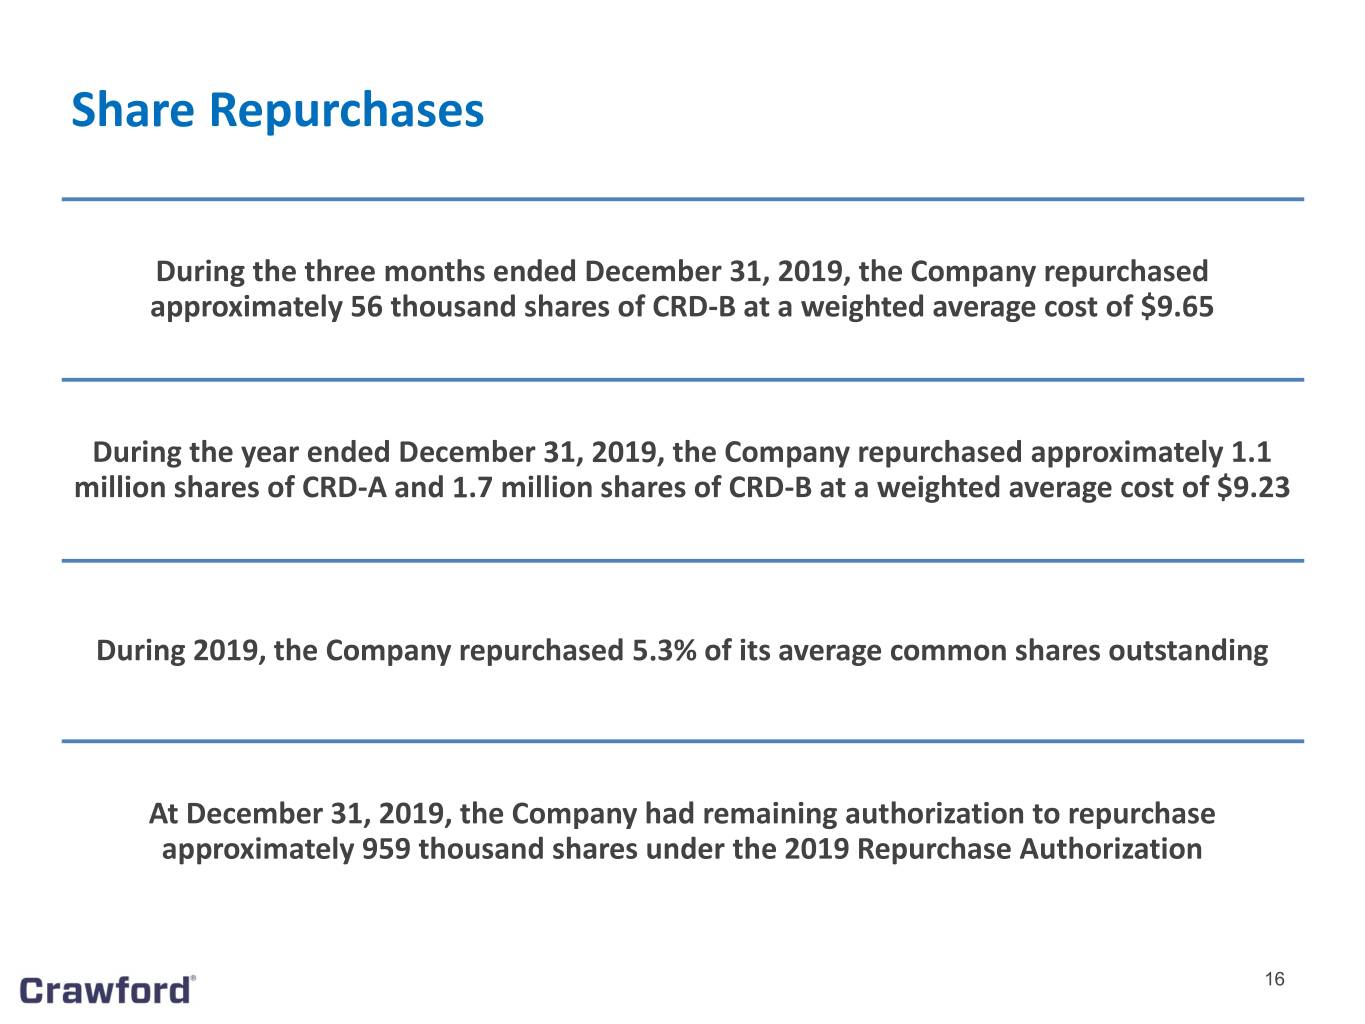
During 2019, the Company repurchased 1,103,398 shares of CRD-A and 1,736,011 of CRD-B at an average cost of $9.33 and $9.17 per share, respectively. The total cost of share repurchases during 2019 was $26.2 million.
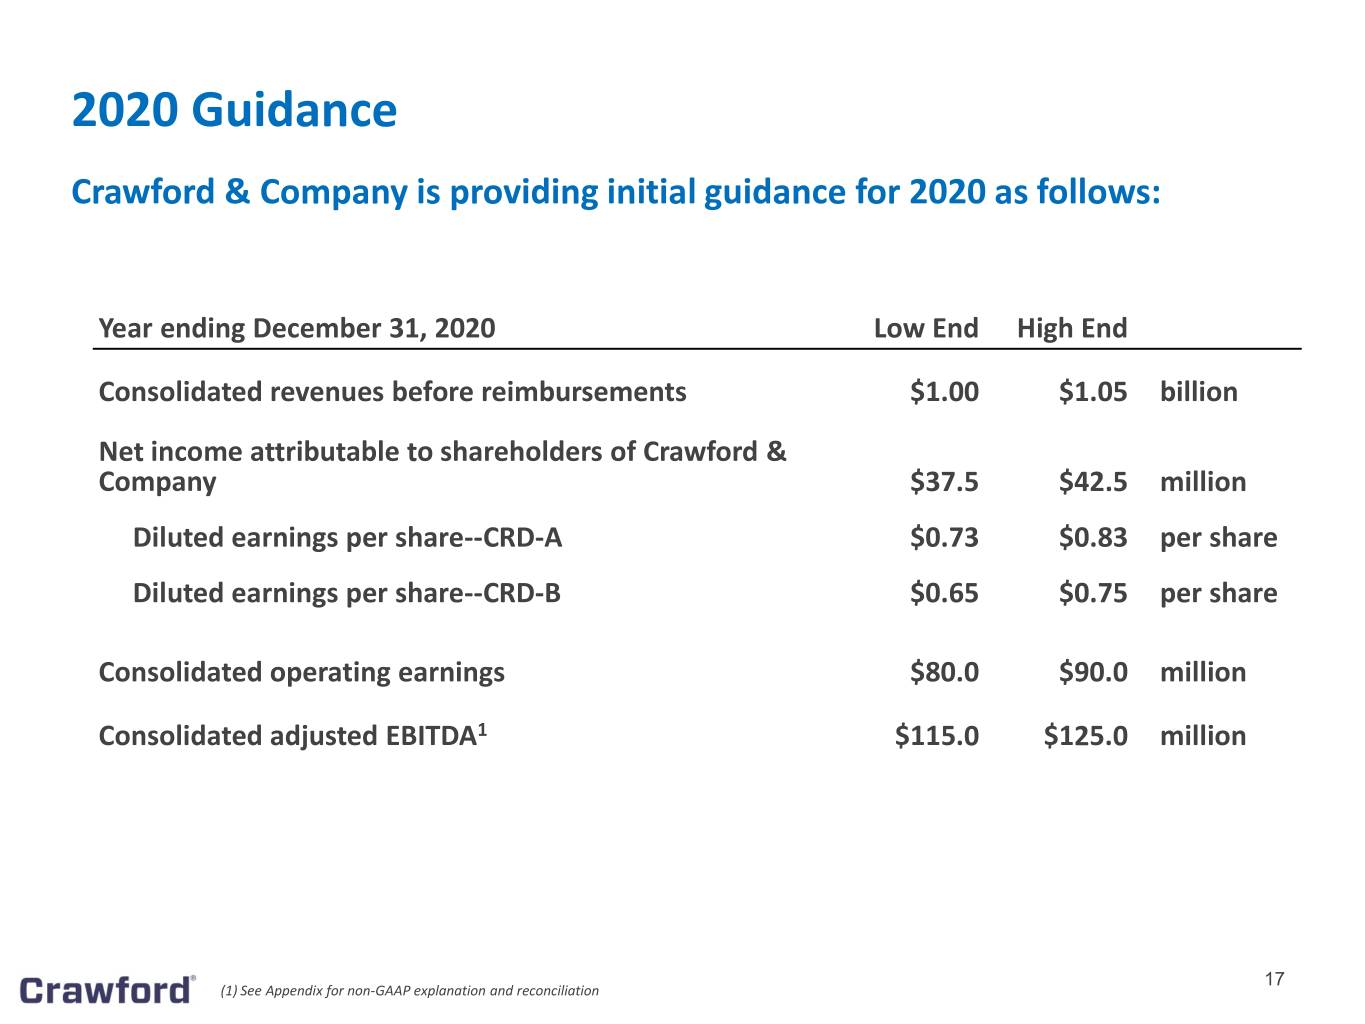
2020 Guidance
Crawford & Company is providing its initial guidance for 2020 as follows:
• | Consolidated revenues before reimbursements between $1.00 and $1.05 billion; |
• | Net income attributable to shareholders of Crawford & Company between $37.5 and $42.5 million, or $0.73 to $0.83 diluted earnings per CRD-A share, and $0.65 to $0.75 diluted earnings per CRD-B share; |
• | Consolidated operating earnings between $80.0 and $90.0 million; |
• | Consolidated adjusted EBITDA between $115.0 and $125.0 million. |
To a significant extent, Crawford’s business depends on claim volumes. The Company cannot predict the future trend of claim volumes for a number of reasons, including the fact that the frequency and severity of weather-related claims and the occurrence of natural and man-made disasters, which are a significant source of claims and revenue for the Company, are generally not subject to accurate forecasting.
Page 5 of 18
Conference Call
As previously announced, Crawford & Company will host a conference call on March 6, 2020 at 8:30 a.m. Eastern Time to discuss its fourth quarter 2019 results. The conference call can be accessed live by dialing 1-800-374-2518 and using Conference ID 6458497. A presentation for tomorrow’s call can also be found on the investor relations portion of the Company’s website, http://www.crawco.com. The call will be recorded and available for replay through April 6, 2020. You may dial 1-855-859-2056 to listen to the replay.
Non-GAAP Presentation
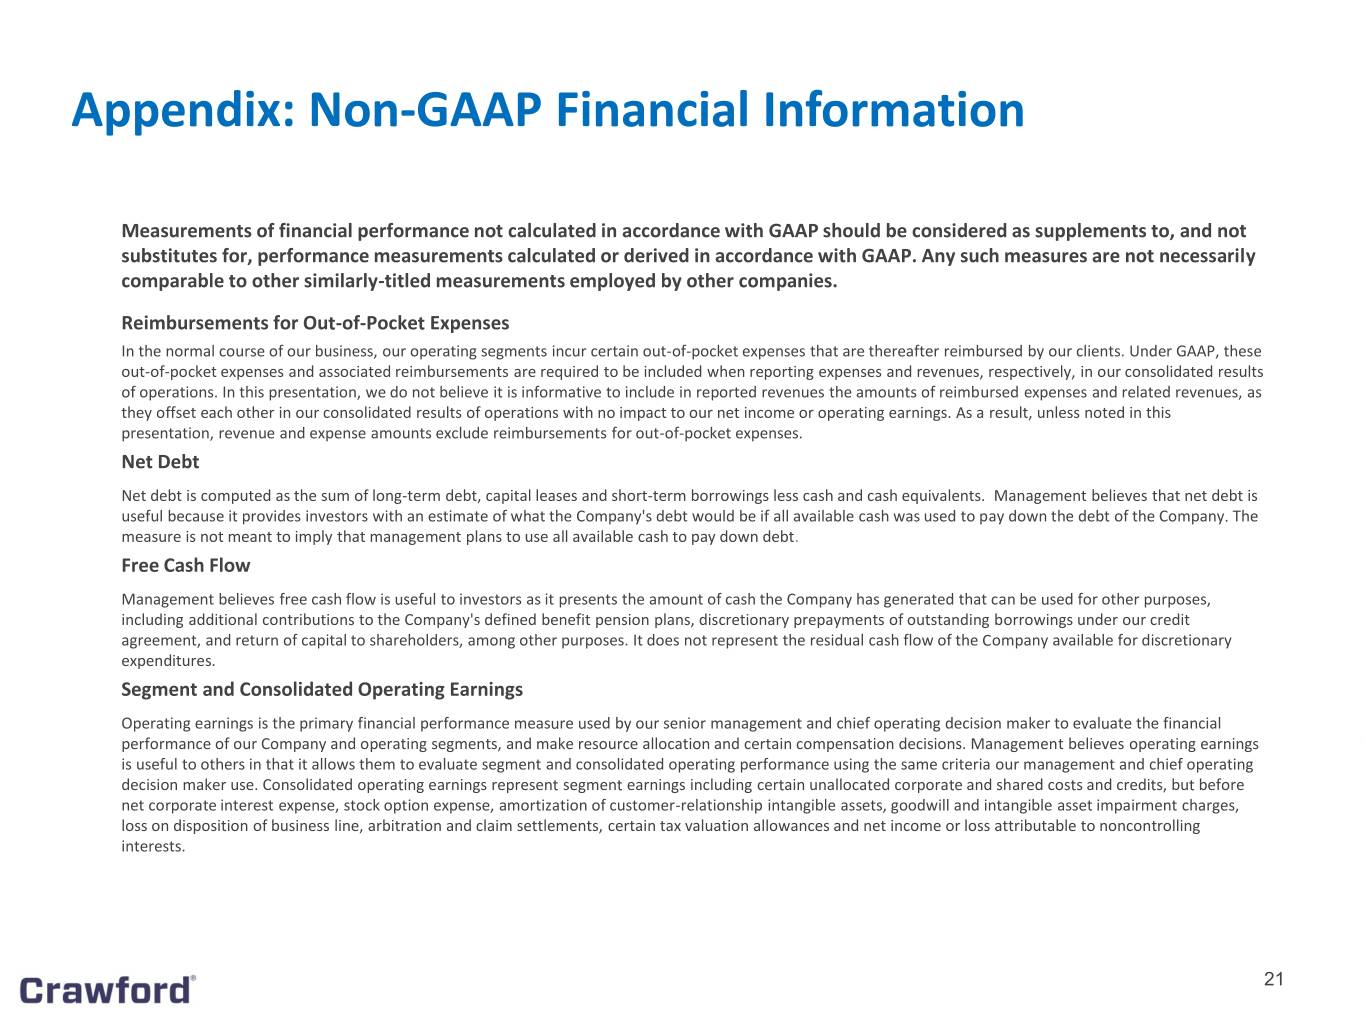
In the normal course of business, our operating segments incur certain out-of-pocket expenses that are thereafter reimbursed by our clients. Under U.S. generally accepted accounting principles (“GAAP”), these out-of-pocket expenses and associated reimbursements are required to be included when reporting expenses and revenues, respectively, in our consolidated results of operations. In the foregoing discussion and analysis of segment results of operations, we do not include a gross up of segment expenses and revenues for these pass-through reimbursed expenses. The amounts of reimbursed expenses and related revenues offset each other in our results of operations with no impact to our net income or operating earnings. A reconciliation of revenues before reimbursements to consolidated revenues determined in accordance with GAAP is self-evident from the face of the accompanying unaudited condensed consolidated statements of operations.
Operating earnings is the primary financial performance measure used by our senior management and chief operating decision maker (“CODM”) to evaluate the financial performance of our Company and operating segments, and make resource allocation and certain compensation decisions. Unlike net income, segment operating earnings is not a standard performance measure found in GAAP. We believe this measure is useful to others in that it allows them to evaluate segment and consolidated operating performance using the same criteria used by our senior management and CODM. Consolidated operating earnings represent segment earnings including certain unallocated corporate and shared costs, but before net corporate interest expense, stock option expense, amortization of customer-relationship intangible assets, goodwill and intangible asset impairment charges, certain deferred tax asset tax valuation allowances, loss on disposition of business line, arbitration and claim settlements, income taxes, and net income or loss attributable to noncontrolling interests and redeemable noncontrolling interests.
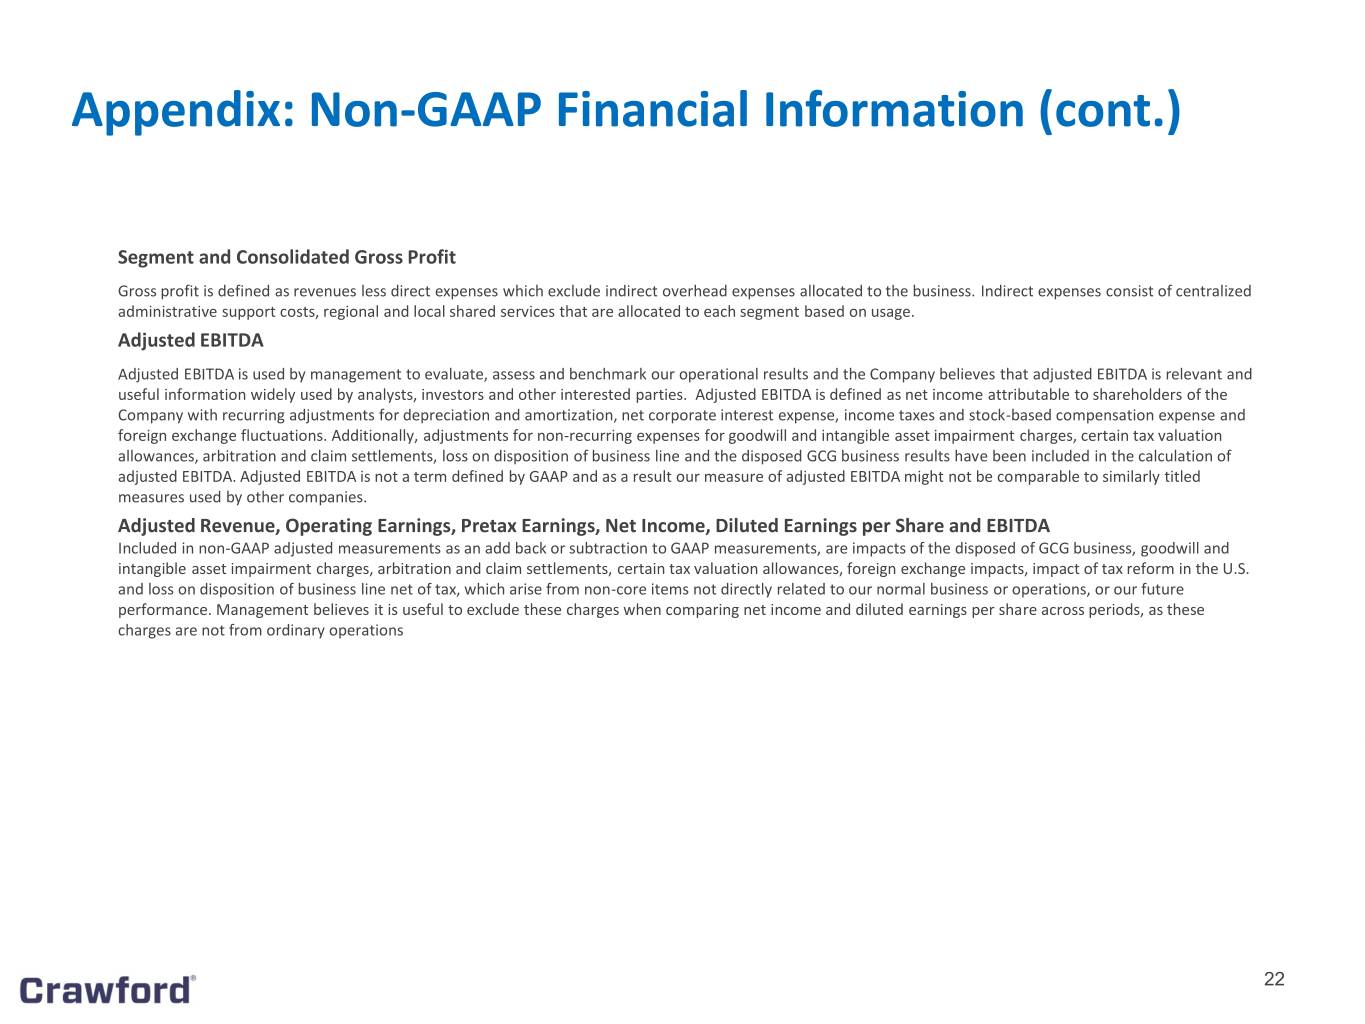
Gross profit is defined as revenues less direct expenses which exclude indirect overhead expenses allocated to the business. Indirect expenses consist of centralized administrative support costs, regional and local shared services that are allocated to each segment based on usage.
Adjusted EBITDA is not a term defined by GAAP and as a result our measure of adjusted EBITDA might not be comparable to similarly titled measures used by other companies. However, adjusted EBITDA is used by management to evaluate, assess and benchmark our operational results. The Company believes that adjusted EBITDA is relevant and useful information widely used by analysts, investors and other interested parties. Adjusted EBITDA is defined as net income attributable to shareholders of the Company with recurring adjustments for depreciation and amortization, net corporate interest expense, income taxes and stock-based compensation expense and foreign exchange fluctuations. Additionally, adjustments for non-recurring expenses for goodwill and intangible asset impairment charges, certain deferred tax asset tax valuation allowances, arbitration and claim settlements, loss on disposition of business line and the disposed GCG business results have been included in the calculation of adjusted EBITDA.
Unallocated corporate and shared costs and credits include expenses and credits related to our chief executive officer and Board of Directors, certain provisions for bad debt allowances or subsequent recoveries such as those related to bankrupt clients, defined benefit pension costs or credits for our frozen U.S. pension plan, certain unallocated professional fees, and certain self-insurance costs and recoveries that are not allocated to our individual operating segments.
Page 6 of 18
Income taxes, net corporate interest expense, stock option expense, and amortization of customer-relationship intangible assets are recurring components of our net income, but they are not considered part of our segment operating earnings because they are managed on a corporate-wide basis. Income taxes are calculated for the Company on a consolidated basis based on statutory rates in effect in the various jurisdictions in which we provide services, and vary significantly by jurisdiction. Net corporate interest expense results from capital structure decisions made by senior management and the Board of Directors, affecting the Company as a whole. Stock option expense represents the non-cash costs generally related to stock options and employee stock purchase plan expenses which are not allocated to our operating segments. Amortization expense is a non-cash expense for finite-lived customer-relationship and trade name intangible assets acquired in business combinations. None of these costs relate directly to the performance of our services or operating activities and, therefore, are excluded from segment operating earnings in order to better assess the results of each segment's operating activities on a consistent basis.
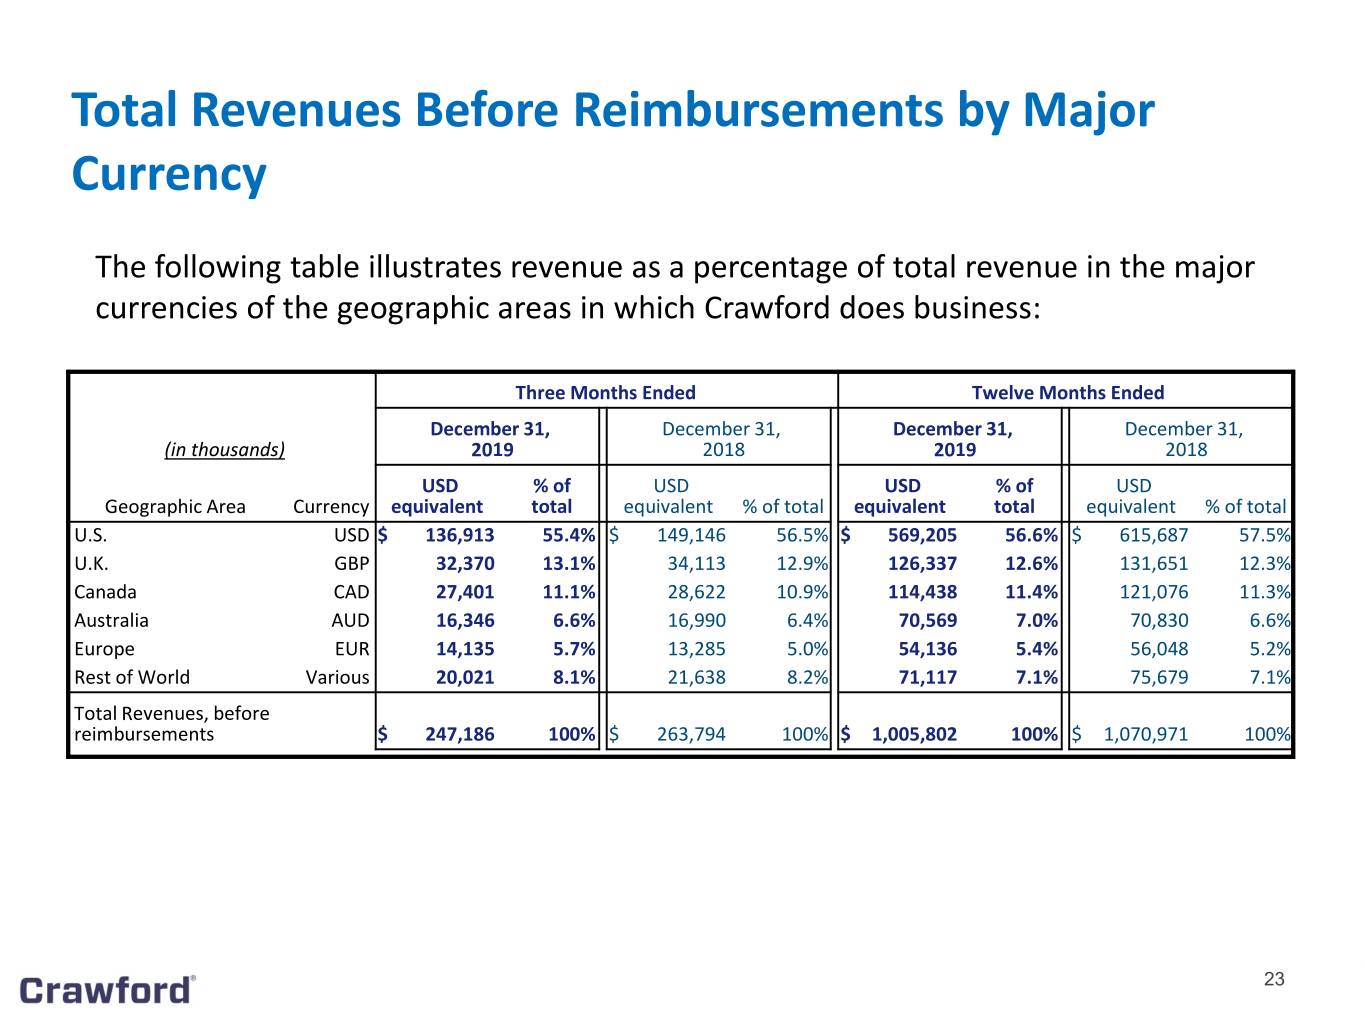
A significant portion of our operations are international. These international operations subject us to foreign exchange fluctuations. The following table illustrates revenue as a percentage of total revenue for the major currencies of the geographic areas that Crawford does business:
Three Months Ended | Twelve Months Ended | |||||||||||||||||||||||
(in thousands) | December 31, 2019 | December 31, 2018 | December 31, 2019 | December 31, 2018 | ||||||||||||||||||||
Geographic Area | Currency | USD equivalent | % of total | USD equivalent | % of total | USD equivalent | % of total | USD equivalent | % of total | |||||||||||||||
U.S. | USD | $ | 136,913 | 55.4 | % | $ | 149,146 | 56.5 | % | $ | 569,205 | 56.6 | % | $ | 615,687 | 57.5 | % | |||||||
U.K. | GBP | 32,370 | 13.1 | % | 34,113 | 12.9 | % | 126,337 | 12.6 | % | 131,651 | 12.3 | % | |||||||||||
Canada | CAD | 27,401 | 11.1 | % | 28,622 | 10.9 | % | 114,438 | 11.4 | % | 121,076 | 11.3 | % | |||||||||||
Australia | AUD | 16,346 | 6.6 | % | 16,990 | 6.4 | % | 70,569 | 7.0 | % | 70,830 | 6.6 | % | |||||||||||
Europe | EUR | 14,135 | 5.7 | % | 13,285 | 5.0 | % | 54,136 | 5.4 | % | 56,048 | 5.2 | % | |||||||||||
Rest of World | Various | 20,021 | 8.1 | % | 21,638 | 8.2 | % | 71,117 | 7.1 | % | 75,679 | 7.1 | % | |||||||||||
Total Revenues, before reimbursements | $ | 247,186 | 100 | % | $ | 263,794 | 100 | % | $ | 1,005,802 | 100 | % | $ | 1,070,971 | 100 | % | ||||||||
Page 7 of 18
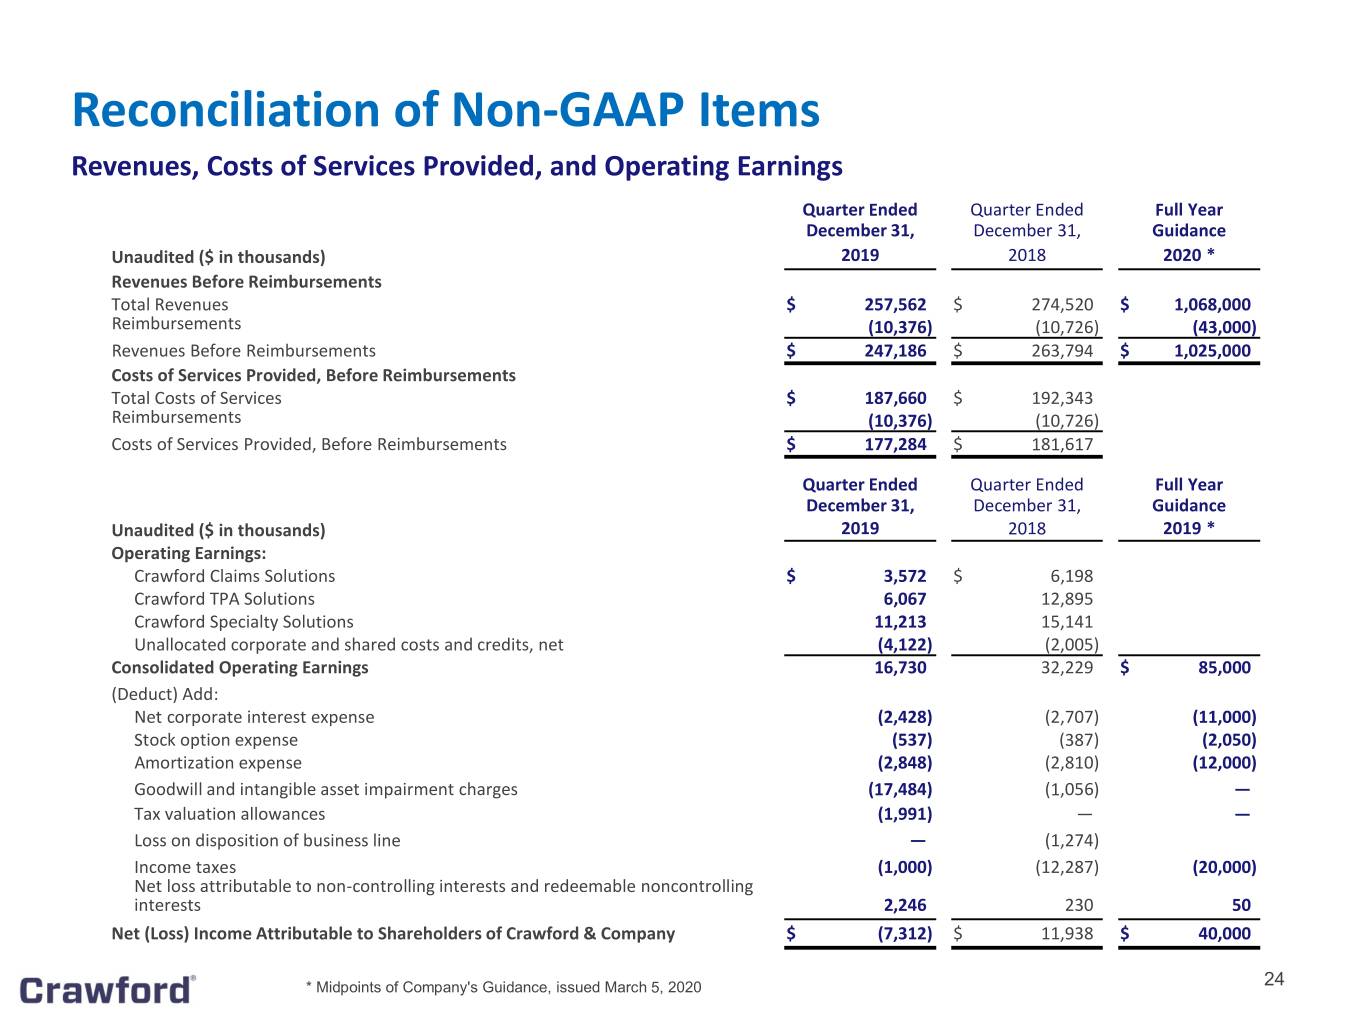
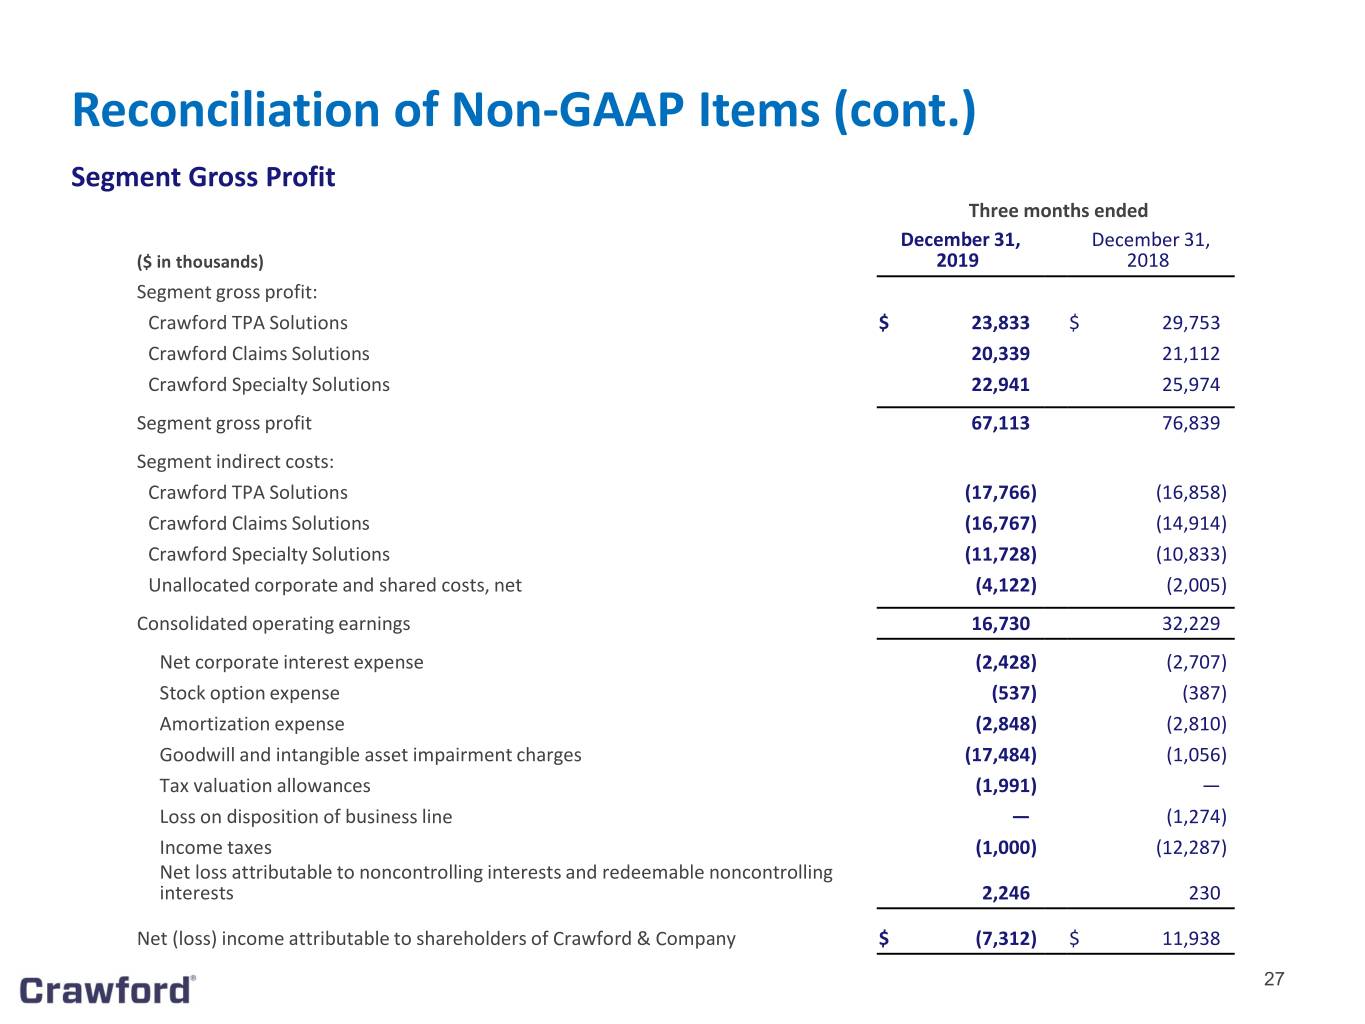
Following is a reconciliation of segment and consolidated operating earnings to net (loss) income attributable to shareholders of Crawford & Company on a GAAP basis. The reconciliation of full year 2020 guidance is to the midpoint of the guidance range.
Three months ended | Year Ended | Midpoint | |||||||||||||||
(in thousands) | December 31, 2019 | December 31, 2018 | December 31, 2019 | December 31, 2018 | Guidance 2020 | ||||||||||||
Operating earnings: | |||||||||||||||||
Crawford TPA Solutions | $ | 6,067 | $ | 12,895 | $ | 27,173 | $ | 36,909 | |||||||||
Crawford Claims Solutions | 3,572 | 6,198 | 7,630 | 11,308 | |||||||||||||
Crawford Specialty Solutions | 11,213 | 15,141 | 49,321 | 49,564 | |||||||||||||
Unallocated corporate and shared costs, net | (4,122 | ) | (2,005 | ) | (6,515 | ) | (9,321 | ) | |||||||||
Consolidated operating earnings | 16,730 | 32,229 | 77,609 | 88,460 | $ | 85,000 | |||||||||||
(Deduct) add: | |||||||||||||||||
Net corporate interest expense | (2,428 | ) | (2,707 | ) | (10,774 | ) | (10,109 | ) | (11,000 | ) | |||||||
Stock option expense | (537 | ) | (387 | ) | (1,885 | ) | (1,742 | ) | (2,050 | ) | |||||||
Amortization expense | (2,848 | ) | (2,810 | ) | (11,277 | ) | (11,152 | ) | (12,000 | ) | |||||||
Goodwill and intangible asset impairment charges | (17,484 | ) | (1,056 | ) | (17,484 | ) | (1,056 | ) | — | ||||||||
Arbitration and claim settlements | — | — | (12,552 | ) | — | — | |||||||||||
Tax valuation allowances | (1,991 | ) | — | (1,991 | ) | — | — | ||||||||||
Loss on disposition of business line | — | (1,274 | ) | — | (20,270 | ) | — | ||||||||||
Income taxes | (1,000 | ) | (12,287 | ) | (12,120 | ) | (18,542 | ) | (20,000 | ) | |||||||
Net loss attributable to noncontrolling interests and redeemable noncontrolling interests | 2,246 | 230 | 2,959 | 389 | 50 | ||||||||||||
Net (loss) income attributable to shareholders of Crawford & Company | $ | (7,312 | ) | $ | 11,938 | $ | 12,485 | $ | 25,978 | $ | 40,000 | ||||||
Page 8 of 18
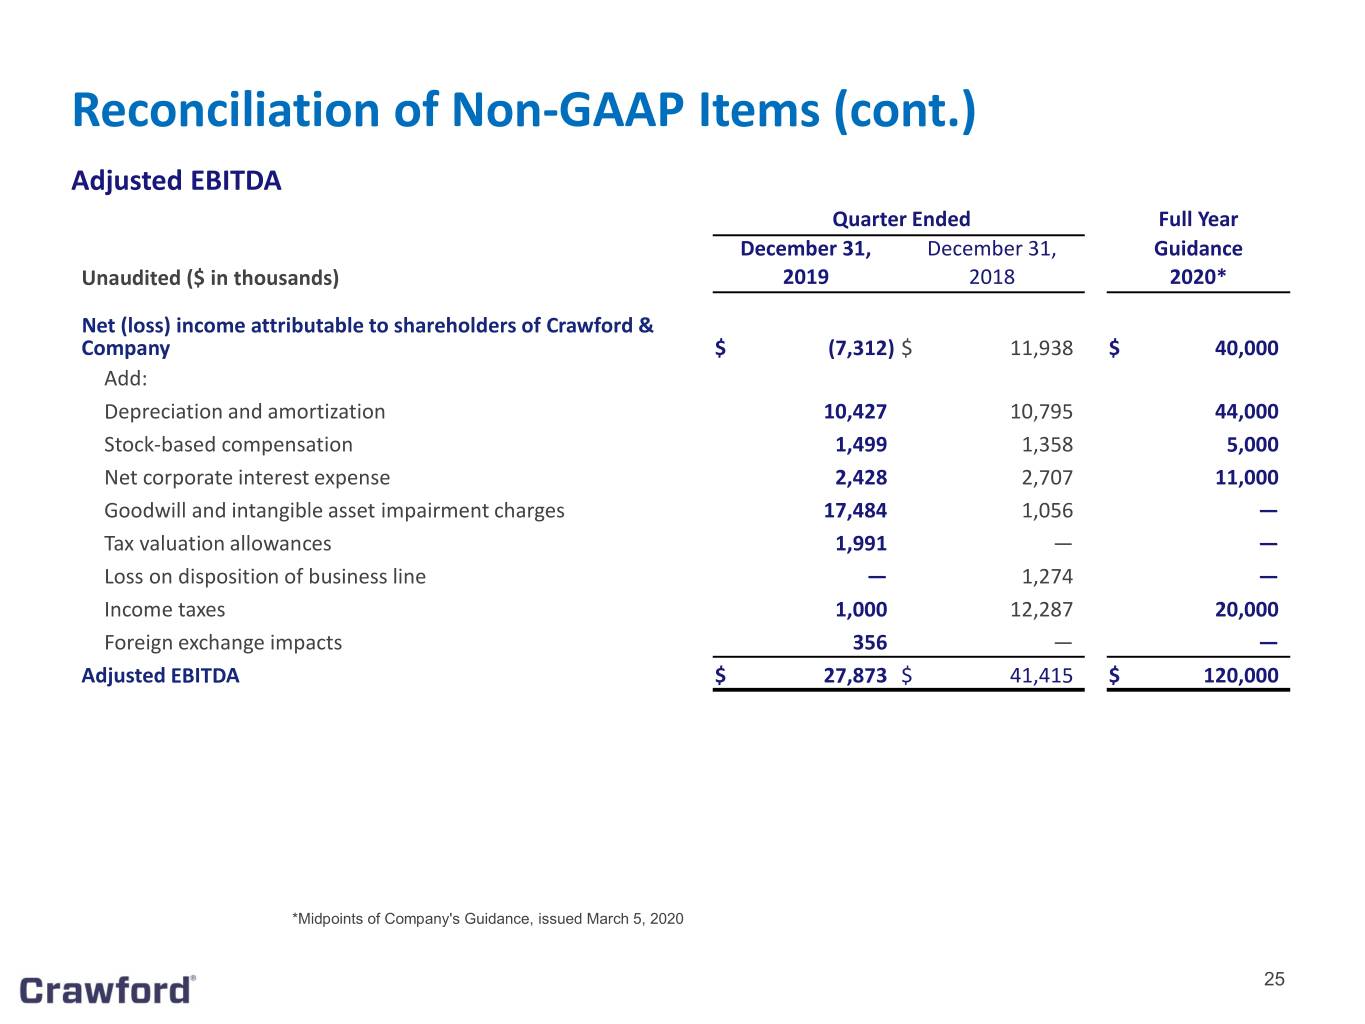
Following is a reconciliation of net (loss) income attributable to shareholders of Crawford & Company on a GAAP basis to non-GAAP adjusted EBITDA. The reconciliation of full year 2020 guidance is to the midpoint of the guidance range.
Three months ended | Year Ended | Midpoint | |||||||||||||||
(in thousands) | December 31, 2019 | December 31, 2018 | December 31, 2019 | December 31, 2018 | Guidance 2020 | ||||||||||||
Net (loss) income attributable to shareholders of Crawford & Company | $ | (7,312 | ) | $ | 11,938 | $ | 12,485 | $ | 25,978 | $ | 40,000 | ||||||
Add (Deduct): | |||||||||||||||||
Depreciation and amortization | 10,427 | 10,795 | 40,513 | 44,079 | 44,000 | ||||||||||||
Stock-based compensation | 1,499 | 1,358 | 4,109 | 6,196 | 5,000 | ||||||||||||
Net corporate interest expense | 2,428 | 2,707 | 10,774 | 10,109 | 11,000 | ||||||||||||
Goodwill and intangible asset impairment charges | 17,484 | 1,056 | 17,484 | 1,056 | — | ||||||||||||
Arbitration and claim settlements | — | — | 12,552 | — | — | ||||||||||||
Tax valuation allowances | 1,991 | — | 1,991 | — | — | ||||||||||||
Loss on disposition of business line | — | 1,274 | — | 20,270 | — | ||||||||||||
Income taxes | 1,000 | 12,287 | 12,120 | 18,542 | 20,000 | ||||||||||||
Foreign exchange fluctuations | 356 | — | 815 | — | — | ||||||||||||
Removal of the impact of the disposed GCG business | — | — | — | 1,007 | — | ||||||||||||
Non-GAAP adjusted EBITDA | $ | 27,873 | $ | 41,415 | $ | 112,843 | $ | 127,237 | $ | 120,000 | |||||||
Following is a reconciliation of operating cash flow to free cash flow for the year ended December 31, 2019 and December 31, 2018:
Year Ended | |||||||||||
(in thousands) | December 31, 2019 | December 31, 2018 | Change | ||||||||
Net Cash Provided by Operating Activities | $ | 75,216 | $ | 52,419 | $ | 22,797 | |||||
Less: | |||||||||||
Property & Equipment Purchases, net | (8,688 | ) | (14,052 | ) | 5,364 | ||||||
Capitalized Software (internal and external costs) | (12,436 | ) | (15,968 | ) | 3,532 | ||||||
Free Cash Flow | $ | 54,092 | $ | 22,399 | $ | 31,693 | |||||
Page 9 of 18
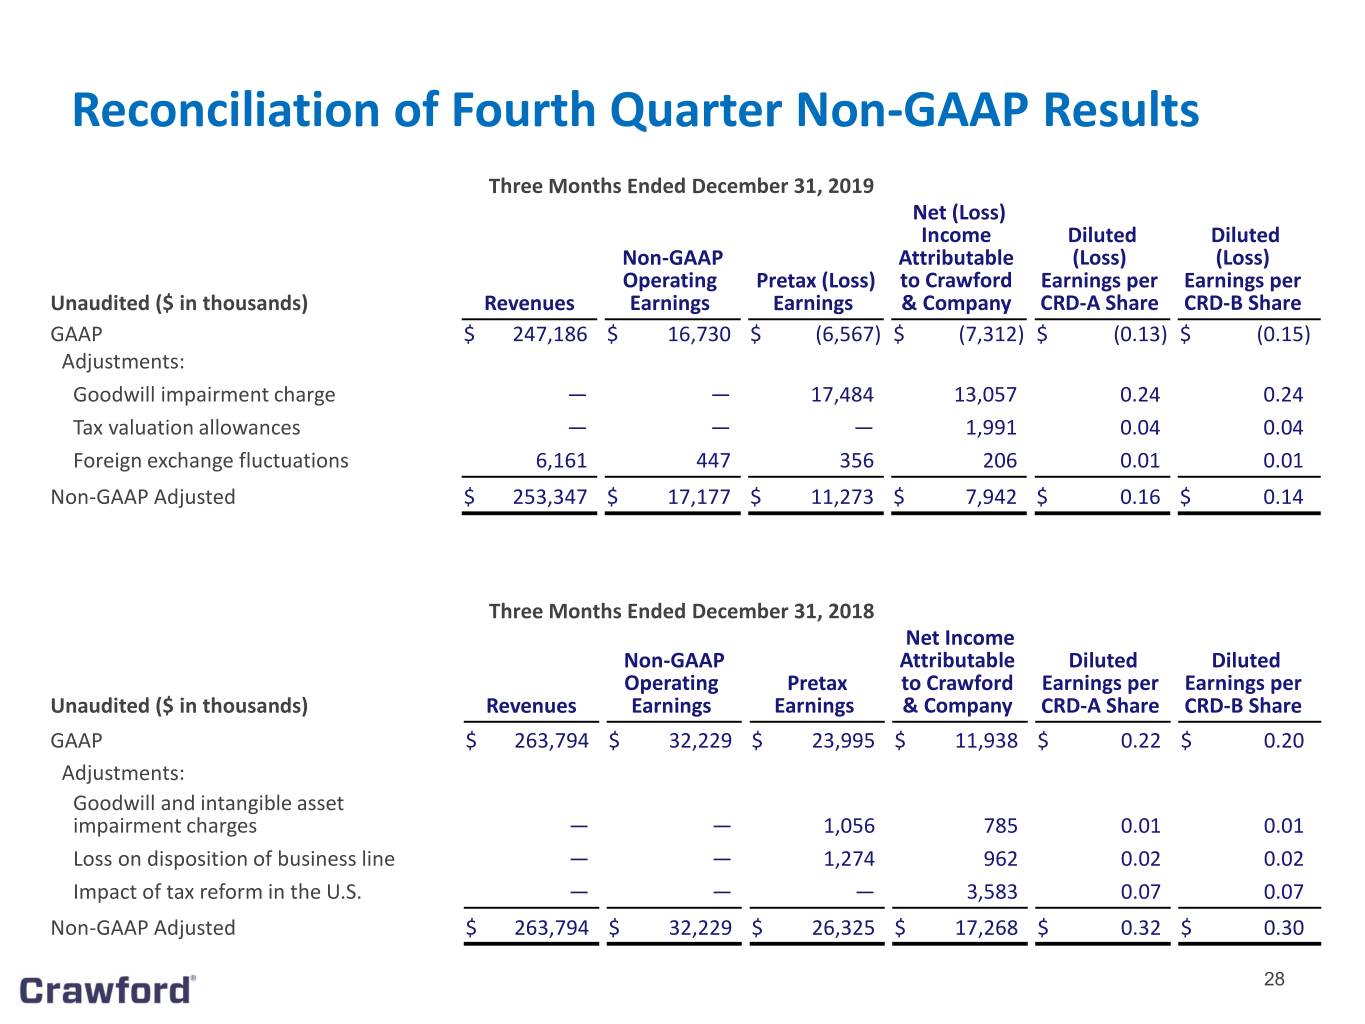
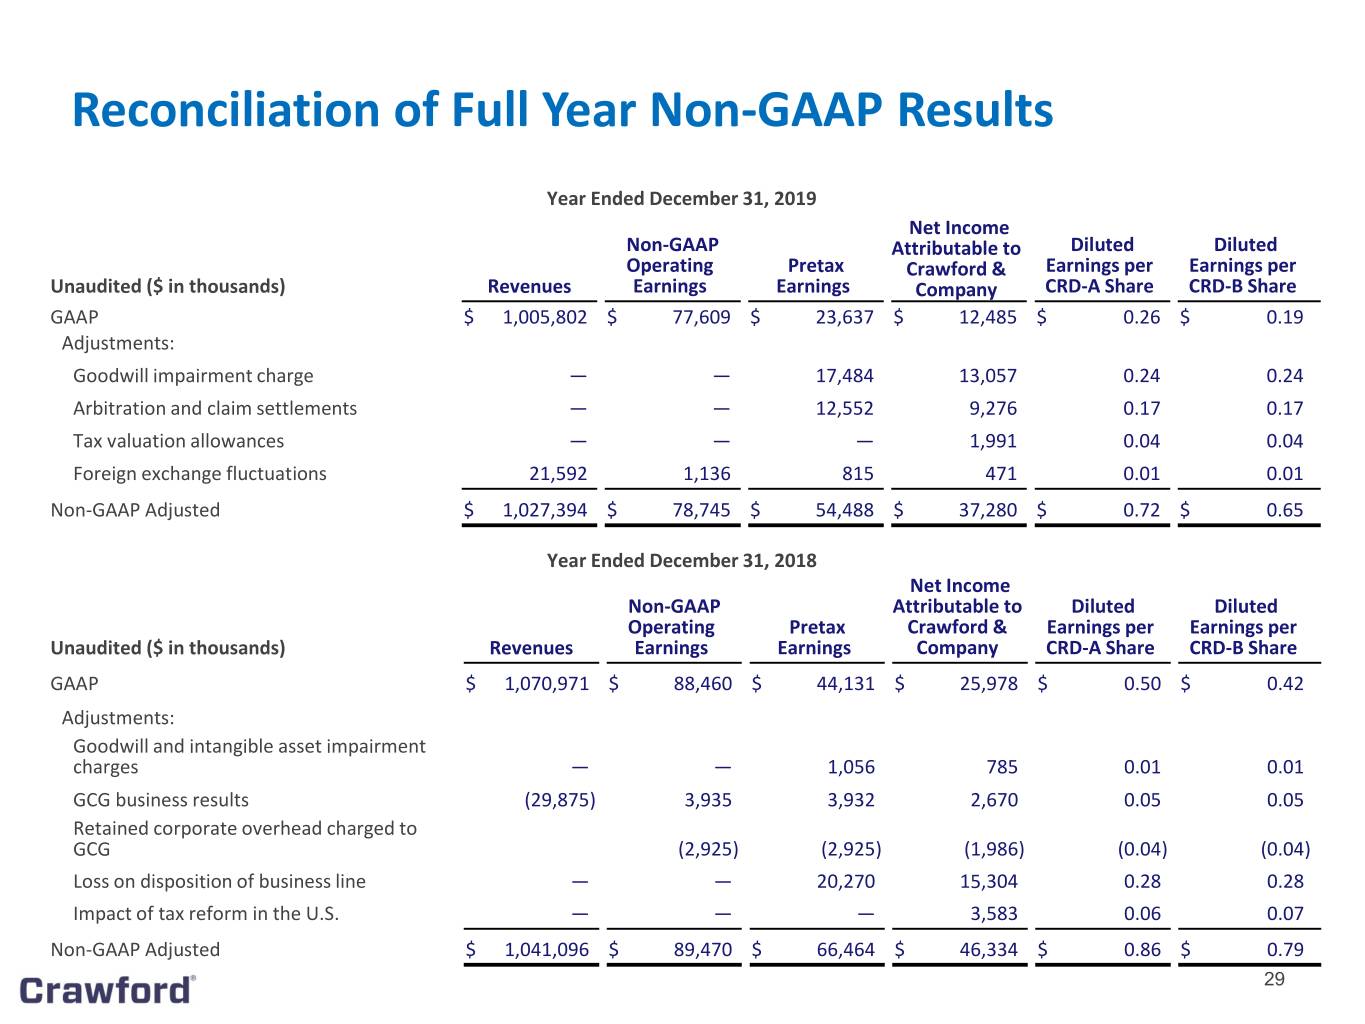
Following are the reconciliations of GAAP Revenue, Operating Earnings, Pretax Earnings, Net (Loss) Income and (Loss) Earnings Per Share to related non-GAAP Adjusted figures, which reflect 2019 on a constant dollar basis before goodwill impairment charge, certain deferred tax asset valuation allowances and arbitration and claim settlements. These measures exclude the results of the disposal of the GCG business, goodwill and intangible impairment charges, the impact of tax reform in the U.S. and the loss on disposition of business line for the 2018 periods.
Three months ended December 31, 2019 | ||||||||||||||||||
(in thousands) | Revenues | Non-GAAP Operating earnings | Pretax (loss)earnings | Net (loss) income attributable to Crawford & Company | Diluted (loss) earnings per CRD-A share | Diluted (loss) earnings per CRD-B share | ||||||||||||
GAAP | $ | 247,186 | $ | 16,730 | $ | (6,567 | ) | $ | (7,312 | ) | $ | (0.13 | ) | $ | (0.15 | ) | ||
Adjustments: | ||||||||||||||||||
Goodwill impairment charge | — | — | 17,484 | 13,057 | 0.24 | 0.24 | ||||||||||||
Tax valuation allowances | — | — | — | 1,991 | 0.04 | 0.04 | ||||||||||||
Foreign exchange fluctuations | 6,161 | 447 | 356 | 206 | 0.01 | 0.01 | ||||||||||||
Non-GAAP Adjusted | $ | 253,347 | $ | 17,177 | $ | 11,273 | $ | 7,942 | $ | 0.16 | $ | 0.14 | ||||||
Three months ended December 31, 2018 | ||||||||||||||||||
(in thousands) | Revenues | Non-GAAP Operating earnings | Pretax earnings | Net income attributable to Crawford & Company | Diluted earnings per CRD-A share | Diluted earnings per CRD-B share | ||||||||||||
GAAP | $ | 263,794 | $ | 32,229 | $ | 23,995 | $ | 11,938 | $ | 0.22 | $ | 0.20 | ||||||
Adjustments: | ||||||||||||||||||
Goodwill and intangible asset impairment charges | — | — | 1,056 | 785 | 0.01 | 0.01 | ||||||||||||
Loss on disposition of business line, net of tax of $312 | — | — | 1,274 | 962 | 0.02 | 0.02 | ||||||||||||
Impact of tax reform in the U.S. | — | — | — | 3,583 | 0.07 | 0.07 | ||||||||||||
Non-GAAP Adjusted | $ | 263,794 | $ | 32,229 | $ | 26,325 | $ | 17,268 | $ | 0.32 | $ | 0.30 | ||||||
Year ended December 31, 2019 | ||||||||||||||||||
(in thousands) | Revenues | Non-GAAP Operating earnings | Pretax earnings | Net income attributable to Crawford & Company | Diluted earnings per CRD-A share | Diluted earnings per CRD-B share | ||||||||||||
GAAP | $ | 1,005,802 | $ | 77,609 | $ | 23,637 | $ | 12,485 | $ | 0.26 | $ | 0.19 | ||||||
Adjustments: | ||||||||||||||||||
Goodwill impairment charge | — | — | 17,484 | 13,057 | 0.24 | 0.24 | ||||||||||||
Arbitration and claim settlements | — | — | 12,552 | 9,276 | 0.17 | 0.17 | ||||||||||||
Tax valuation allowances | — | — | — | 1,991 | 0.04 | 0.04 | ||||||||||||
Foreign exchange fluctuations | 21,592 | 1,136 | 815 | 471 | 0.01 | 0.01 | ||||||||||||
Non-GAAP Adjusted | $ | 1,027,394 | $ | 78,745 | $ | 54,488 | $ | 37,280 | $ | 0.72 | $ | 0.65 | ||||||
Page 10 of 18
Year ended December 31, 2018 | ||||||||||||||||||
(in thousands) | Revenues | Non-GAAP Operating earnings | Pretax earnings | Net income attributable to Crawford & Company | Diluted earnings per CRD-A share | Diluted earnings per CRD-B share | ||||||||||||
GAAP | $ | 1,070,971 | $ | 88,460 | $ | 44,131 | $ | 25,978 | $ | 0.50 | $ | 0.42 | ||||||
Adjustments: | ||||||||||||||||||
Goodwill and intangible asset impairment charges | — | — | 1,056 | 785 | 0.01 | 0.01 | ||||||||||||
Loss on disposition of business line, net of tax of $4,796 | — | — | 20,270 | 15,304 | 0.28 | 0.28 | ||||||||||||
GCG business results | (29,875 | ) | 3,935 | 3,932 | 2,670 | 0.05 | 0.05 | |||||||||||
Retained corporate overhead charged to GCG | — | (2,925 | ) | (2,925 | ) | (1,986 | ) | (0.04 | ) | (0.04 | ) | |||||||
Impact of tax reform in the U.S. | — | — | — | 3,583 | 0.06 | 0.07 | ||||||||||||
Non-GAAP Adjusted | $ | 1,041,096 | $ | 89,470 | $ | 66,464 | $ | 46,334 | $ | 0.86 | $ | 0.79 | ||||||
Following is information regarding the weighted average shares used in the computation of basic and diluted earnings per share.
Three months ended | Year ended | |||||||
(in thousands) | December 31, 2019 | December 31, 2018 | December 31, 2019 | December 31, 2018 | ||||
Weighted-Average Shares Used to Compute Basic Earnings Per Share: | ||||||||
Class A Common Stock | 30,449 | 30,734 | 30,637 | 30,805 | ||||
Class B Common Stock | 22,689 | 24,429 | 22,975 | 24,449 | ||||
Weighted-Average Shares Used to Compute Diluted Earnings Per Share: | ||||||||
Class A Common Stock | 30,449 | 31,404 | 31,090 | 31,434 | ||||
Class B Common Stock | 22,689 | 24,429 | 22,975 | 24,449 | ||||
Further information regarding the Company’s operating results for the quarter and year ended December 31, 2019, and financial position as of December 31, 2019, and cash flows for the year ended December 31, 2019 is shown on the attached unaudited condensed consolidated financial statements.
About Crawford & Company
Based in Atlanta, Crawford & Company (NYSE: CRD-A and CRD-B) is the world's largest publicly listed independent provider of claims management and outsourcing solutions to carriers, brokers and corporates with an expansive global network serving clients in more than 70 countries. The Company’s shares are traded on the NYSE under the symbols CRD-A and CRD-B. The Company's two classes of stock are substantially identical, except with respect to voting rights and the Company's ability to pay greater cash dividends on the non-voting Class A Common Stock than on the voting Class B Common Stock, subject to certain limitations. In addition, with respect to mergers or similar transactions, holders of Class A Common Stock must receive the same type and amount of consideration as holders of Class B Common Stock, unless different consideration is approved by the holders of 75% of the Class A Common Stock, voting as a class. More information is available at www.crawco.com.
Page 11 of 18
Earnings per share may be different between CRD-A and CRD-B due to the payment of a higher per share dividend on CRD-A than CRD-B, and the impact that has on the earnings per share calculation according to generally accepted accounting principles.
FOR FURTHER INFORMATION REGARDING THIS PRESS RELEASE, PLEASE CALL BRUCE SWAIN AT (404) 300-1051.
This press release contains forward-looking statements, including statements about the expected future financial condition, results of operations and earnings outlook of Crawford & Company. Statements, both qualitative and quantitative, that are not historical facts may be “forward-looking statements” as defined in the Private Securities Litigation Reform Act of 1995 and other federal securities laws. Forward-looking statements involve a number of risks and uncertainties that could cause actual results to differ materially from historical experience or Crawford & Company’s present expectations. Accordingly, no one should place undue reliance on forward-looking statements, which speak only as of the date on which they are made. Crawford & Company does not undertake to update forward-looking statements to reflect the impact of circumstances or events that may arise or not arise after the date the forward-looking statements are made. For further information regarding Crawford & Company, including factors that could cause our actual financial condition, results or earnings to differ from those described in any forward-looking statements, please read Crawford & Company’s reports filed with the SEC and available at www.sec.gov and in the Investor Relations section of Crawford & Company’s website at www.crawco.com. |
Page 12 of 18
CRAWFORD & COMPANY
CONDENSED CONSOLIDATED STATEMENTS OF OPERATIONS
Unaudited
(In Thousands, Except Per Share Amounts and Percentages)
Three Months Ended December 31, | 2019 | 2018 | % Change | |||||||
Revenues: | ||||||||||
Revenues Before Reimbursements | $ | 247,186 | $ | 263,794 | (6 | )% | ||||
Reimbursements | 10,376 | 10,726 | (3 | )% | ||||||
Total Revenues | 257,562 | 274,520 | (6 | )% | ||||||
Costs and Expenses: | ||||||||||
Costs of Services Provided, Before Reimbursements | 177,284 | 181,617 | (2 | )% | ||||||
Reimbursements | 10,376 | 10,726 | (3 | )% | ||||||
Total Costs of Services | 187,660 | 192,343 | (2 | )% | ||||||
Selling, General, and Administrative Expenses | 55,763 | 53,514 | 4 | % | ||||||
Corporate Interest Expense, Net | 2,428 | 2,707 | (10 | )% | ||||||
Goodwill and Intangible Asset Impairment Charges | 17,484 | 1,056 | 1,556 | % | ||||||
Loss on Disposition of Business Line | — | 1,274 | nm | |||||||
Total Costs and Expenses | 263,335 | 250,894 | 5 | % | ||||||
Other (Expense) Income | (794 | ) | 369 | (315 | )% | |||||
(Loss) Income Before Income Taxes | (6,567 | ) | 23,995 | (127 | )% | |||||
Provision for Income Taxes | 2,991 | 12,287 | (76 | )% | ||||||
Net (Loss) Income | (9,558 | ) | 11,708 | (182 | )% | |||||
Net Loss Attributable to Noncontrolling Interests and Redeemable Noncontrolling Interests | 2,246 | 230 | 877 | % | ||||||
Net (Loss) Income Attributable to Shareholders of Crawford & Company | $ | (7,312 | ) | $ | 11,938 | (161 | )% | |||
(Loss) Earnings Per Share - Basic: | ||||||||||
Class A Common Stock | $ | (0.13 | ) | $ | 0.23 | (157 | )% | |||
Class B Common Stock | $ | (0.15 | ) | $ | 0.21 | (171 | )% | |||
(Loss) Earnings Per Share - Diluted: | ||||||||||
Class A Common Stock | $ | (0.13 | ) | $ | 0.22 | (159 | )% | |||
Class B Common Stock | $ | (0.15 | ) | $ | 0.20 | (175 | )% | |||
Cash Dividends Per Share: | ||||||||||
Class A Common Stock | $ | 0.07 | $ | 0.07 | — | % | ||||
Class B Common Stock | $ | 0.05 | $ | 0.05 | — | % | ||||
nm = not meaningful
Page 13 of 18
CRAWFORD & COMPANY
CONDENSED CONSOLIDATED STATEMENTS OF OPERATIONS
Unaudited
(In Thousands, Except Per Share Amounts and Percentages)
Year Ended December 31, | 2019 | 2018 | % Change | |||||||
Revenues: | ||||||||||
Revenues Before Reimbursements | $ | 1,005,802 | $ | 1,070,971 | (6 | )% | ||||
Reimbursements | 41,825 | 52,008 | (20 | )% | ||||||
Total Revenues | 1,047,627 | 1,122,979 | (7 | )% | ||||||
Costs and Expenses: | ||||||||||
Costs of Services Provided, Before Reimbursements | 710,948 | 755,997 | (6 | )% | ||||||
Reimbursements | 41,825 | 52,008 | (20 | )% | ||||||
Total Costs of Services | 752,773 | 808,005 | (7 | )% | ||||||
Selling, General, and Administrative Expenses | 227,170 | 242,421 | (6 | )% | ||||||
Corporate Interest Expense, Net | 10,774 | 10,109 | 7 | % | ||||||
Goodwill and Intangible Asset Impairment Charges | 17,484 | 1,056 | 1,556 | % | ||||||
Arbitration and Claim Settlements | 12,552 | — | nm | |||||||
Loss on Disposition of Business line | — | 20,270 | nm | |||||||
Total Costs and Expenses | 1,020,753 | 1,081,861 | (6 | )% | ||||||
Other (Expense) Income | (3,237 | ) | 3,013 | (207 | )% | |||||
Income Before Income Taxes | 23,637 | 44,131 | (46 | )% | ||||||
Provision for Income Taxes | 14,111 | 18,542 | (24 | )% | ||||||
Net Income | 9,526 | 25,589 | (63 | )% | ||||||
Net Loss Attributable to Noncontrolling Interests and Redeemable Noncontrolling Interests | 2,959 | 389 | 661 | % | ||||||
Net Income Attributable to Shareholders of Crawford & Company | $ | 12,485 | $ | 25,978 | (52 | )% | ||||
Earnings Per Share - Basic: | ||||||||||
Class A Common Stock | $ | 0.27 | $ | 0.51 | (47 | )% | ||||
Class B Common Stock | $ | 0.19 | $ | 0.43 | (56 | )% | ||||
Earnings Per Share - Diluted: | ||||||||||
Class A Common Stock | $ | 0.26 | $ | 0.50 | (48 | )% | ||||
Class B Common Stock | $ | 0.19 | $ | 0.42 | (55 | )% | ||||
Cash Dividends Per Share: | ||||||||||
Class A Common Stock | $ | 0.28 | $ | 0.28 | — | % | ||||
Class B Common Stock | $ | 0.20 | $ | 0.20 | — | % | ||||
nm = not meaningful
Page 14 of 18
CRAWFORD & COMPANY
CONDENSED CONSOLIDATED BALANCE SHEETS
As of December 31, 2019 and December 31, 2018
Unaudited
(In Thousands, Except Par Values)
December 31, | December 31, | ||||||
2019 | 2018 | ||||||
ASSETS | |||||||
Current Assets: | |||||||
Cash and Cash Equivalents | $ | 51,802 | $ | 53,119 | |||
Accounts Receivable, Net | 128,217 | 131,117 | |||||
Unbilled Revenues, at Estimated Billable Amounts | 103,894 | 108,291 | |||||
Income Taxes Receivable | 7,820 | 4,084 | |||||
Prepaid Expenses and Other Current Assets | 23,476 | 24,237 | |||||
Total Current Assets | 315,209 | 320,848 | |||||
Net Property and Equipment | 31,425 | 34,303 | |||||
Other Assets: | |||||||
Operating Lease Right-of-Use Asset, Net | 102,354 | — | |||||
Goodwill | 80,642 | 96,890 | |||||
Intangible Assets Arising from Business Acquisitions, Net | 75,083 | 85,023 | |||||
Capitalized Software Costs, Net | 66,445 | 72,210 | |||||
Deferred Income Tax Assets | 17,971 | 22,146 | |||||
Other Noncurrent Assets | 70,884 | 70,022 | |||||
Total Other Assets | 413,379 | 346,291 | |||||
Total Assets | $ | 760,013 | $ | 701,442 | |||
LIABILITIES AND SHAREHOLDERS’ INVESTMENT | |||||||
Current Liabilities: | |||||||
Short-Term Borrowings | $ | 28,531 | $ | 23,195 | |||
Accounts Payable | 34,377 | 37,834 | |||||
Operating Lease Liability | 30,765 | — | |||||
Accrued Compensation and Related Costs | 68,499 | 66,530 | |||||
Self-Insured Risks | 11,311 | 15,246 | |||||
Income Taxes Payable | 3,030 | 3,145 | |||||
Deferred Rent | — | 15,919 | |||||
Other Accrued Liabilities | 31,449 | 32,391 | |||||
Deferred Revenues | 28,288 | 30,961 | |||||
Current Installments of Finance Leases | 15 | 89 | |||||
Total Current Liabilities | 236,265 | 225,310 | |||||
Noncurrent Liabilities: | |||||||
Long-Term Debt and Finance Leases, Less Current Installments | 148,408 | 167,126 | |||||
Operating Lease Liability | 87,064 | — | |||||
Deferred Revenues | 24,080 | 21,713 | |||||
Accrued Pension Liabilities | 65,909 | 74,323 | |||||
Other Noncurrent Liabilities | 33,410 | 32,024 | |||||
Total Noncurrent Liabilities | 358,871 | 295,186 | |||||
Redeemable Noncontrolling Interests | 2,310 | 5,500 | |||||
Shareholders’ Investment: | |||||||
Class A Common Stock, $1.00 Par Value | 30,610 | 30,927 | |||||
Class B Common Stock, $1.00 Par Value | 22,671 | 24,408 | |||||
Additional Paid-in Capital | 63,392 | 58,793 | |||||
Retained Earnings | 249,551 | 273,607 | |||||
Accumulated Other Comprehensive Loss | (206,907 | ) | (216,447 | ) | |||
Shareholders’ Investment Attributable to Shareholders of Crawford & Company | 159,317 | 171,288 | |||||
Noncontrolling Interests | 3,250 | 4,158 | |||||
Total Shareholders’ Investment | 162,567 | 175,446 | |||||
Total Liabilities and Shareholders’ Investment | $ | 760,013 | $ | 701,442 | |||
Page 15 of 18
CRAWFORD & COMPANY
SUMMARY RESULTS BY OPERATING SEGMENT WITH DIRECT COMPENSATION AND OTHER EXPENSES
Unaudited
(In Thousands, Except Percentages)
Three Months Ended December 31,
,
Crawford TPA Solutions | % | Crawford Claims Solutions | % | Crawford Specialty Solutions | % | |||||||||||||||||||
2019 | 2018 | Change | 2019 | 2018 | Change | 2019 | 2018 | Change | ||||||||||||||||
Revenues Before Reimbursements | $ | 97,049 | $ | 102,183 | (5.0 | )% | $ | 84,265 | $ | 92,165 | (8.6 | )% | $ | 65,872 | $ | 69,446 | (5.1 | )% | ||||||
Direct Compensation, Fringe Benefits & Non-Employee Labor | 58,942 | 58,107 | 1.4 | % | 54,688 | 62,345 | (12.3 | )% | 35,773 | 35,950 | (0.5 | )% | ||||||||||||
% of Revenues Before Reimbursements | 60.7 | % | 56.9 | % | 64.9 | % | 67.6 | % | 54.3 | % | 51.8 | % | ||||||||||||
Expenses Other than Reimbursements, Direct Compensation, Fringe Benefits & Non-Employee Labor | 32,040 | 31,181 | 2.8 | % | 26,005 | 23,622 | 10.1 | % | 18,886 | 18,355 | 2.9 | % | ||||||||||||
% of Revenues Before Reimbursements | 33.0 | % | 30.5 | % | 30.9 | % | 25.6 | % | 28.7 | % | 26.4 | % | ||||||||||||
Total Operating Expenses | 90,982 | 89,288 | 1.9 | % | 80,693 | 85,967 | (6.1 | )% | 54,659 | 54,305 | 0.7 | % | ||||||||||||
Operating Earnings (1) | $ | 6,067 | $ | 12,895 | (53.0 | )% | $ | 3,572 | $ | 6,198 | (42.4 | )% | $ | 11,213 | $ | 15,141 | (25.9 | )% | ||||||
% of Revenues Before Reimbursements | 6.3 | % | 12.6 | % | 4.2 | % | 6.7 | % | 17.0 | % | 21.8 | % | ||||||||||||
Twelve Months Ended December 31,
Crawford TPA Solutions | % | Crawford Claims Solutions | % | Crawford Specialty Solutions | % | |||||||||||||||||||
2019 | 2018 | Change | 2019 | 2018 | Change | 2019 | 2018 | Change | ||||||||||||||||
Revenues Before Reimbursements | $ | 393,856 | $ | 405,335 | (2.8 | )% | $ | 339,837 | $ | 361,053 | (5.9 | )% | $ | 272,109 | $ | 304,583 | (10.7 | )% | ||||||
Direct Compensation, Fringe Benefits & Non-Employee Labor | 236,853 | 235,813 | 0.4 | % | 223,639 | 239,123 | (6.5 | )% | 141,776 | 156,771 | (9.6 | )% | ||||||||||||
% of Revenues Before Reimbursements | 60.1 | % | 58.2 | % | 65.8 | % | 66.2 | % | 52.1 | % | 51.5 | % | ||||||||||||
Expenses Other than Reimbursements, Direct Compensation, Fringe Benefits & Non-Employee Labor | 129,830 | 132,613 | (2.1 | )% | 108,568 | 110,622 | (1.9 | )% | 81,012 | 98,248 | (17.5 | )% | ||||||||||||
% of Revenues Before Reimbursements | 33.0 | % | 32.7 | % | 31.9 | % | 30.6 | % | 29.8 | % | 32.3 | % | ||||||||||||
Total Operating Expenses | 366,683 | 368,426 | (0.5 | )% | 332,207 | 349,745 | (5.0 | )% | 222,788 | 255,019 | (12.6 | )% | ||||||||||||
Operating Earnings (1) | $ | 27,173 | $ | 36,909 | (26.4 | )% | $ | 7,630 | $ | 11,308 | (32.5 | )% | $ | 49,321 | $ | 49,564 | (0.5 | )% | ||||||
% of Revenues Before Reimbursements | 6.9 | % | 9.1 | % | 2.2 | % | 3.1 | % | 18.1 | % | 16.3 | % | ||||||||||||
(1) A non-GAAP financial measurement which represents net income attributable to the applicable reporting segment excluding income taxes, net corporate interest expense, stock option expense, amortization of customer-relationship intangible assets, loss on disposition of business line, arbitration and claim settlements, goodwill and intangible asset impairment charges and certain unallocated corporate and shared costs and credits. See pages 6-8 for additional information about segment operating earnings.
Page 16 of 18
CRAWFORD & COMPANY
SUMMARY RESULTS BY OPERATING SEGMENT WITH DIRECT AND INDIRECT COSTS
Unaudited
(In Thousands, Except Percentages)
Three Months Ended December 31,
Crawford TPA Solutions | % | Crawford Claims Solutions | % | Crawford Specialty Solutions | % | |||||||||||||||||||
2019 | 2018 | Change | 2019 | 2018 | Change | 2019 | 2018 | Change | ||||||||||||||||
Revenues Before Reimbursements | $ | 97,049 | $ | 102,183 | (5.0 | )% | $ | 84,265 | $ | 92,165 | (8.6 | )% | $ | 65,872 | $ | 69,446 | (5.1 | )% | ||||||
Direct Expense | 73,216 | 72,430 | 1.1 | % | 63,926 | 71,053 | (10.0 | )% | 42,931 | 43,472 | (1.2 | )% | ||||||||||||
% of Revenues Before Reimbursements | 75.4 | % | 70.9 | % | 75.9 | % | 77.1 | % | 65.2 | % | 62.6 | % | ||||||||||||
Segment Gross Profit | 23,833 | 29,753 | (19.9 | )% | 20,339 | 21,112 | (3.7 | )% | 22,941 | 25,974 | (11.7 | )% | ||||||||||||
% of Revenues Before Reimbursements | 24.6 | % | 29.1 | % | 24.1 | % | 22.9 | % | 34.8 | % | 37.4 | % | ||||||||||||
Indirect Costs | 17,766 | 16,858 | 5.4 | % | 16,767 | 14,914 | 12.4 | % | 11,728 | 10,833 | 8.3 | % | ||||||||||||
% of Revenues Before Reimbursements | 18.3 | % | 16.5 | % | 19.9 | % | 16.2 | % | 17.8 | % | 15.6 | % | ||||||||||||
Operating Earnings (1) | $ | 6,067 | $ | 12,895 | (53.0 | )% | $ | 3,572 | $ | 6,198 | (42.4 | )% | $ | 11,213 | $ | 15,141 | (25.9 | )% | ||||||
% of Revenues Before Reimbursements | 6.3 | % | 12.6 | % | 4.2 | % | 6.7 | % | 17.0 | % | 21.8 | % | ||||||||||||
Twelve Months Ended December 31,
Crawford TPA Solutions | % | Crawford Claims Solutions | % | Crawford Specialty Solutions | % | |||||||||||||||||||
2019 | 2018 | Change | 2019 | 2018 | Change | 2019 | 2018 | Change | ||||||||||||||||
Revenues Before Reimbursements | $ | 393,856 | $ | 405,335 | (2.8 | )% | $ | 339,837 | $ | 361,053 | (5.9 | )% | $ | 272,109 | $ | 304,583 | (10.7 | )% | ||||||
Direct Expense | 294,172 | 296,111 | (0.7 | )% | 263,116 | 282,778 | (7.0 | )% | 176,702 | 199,055 | (11.2 | )% | ||||||||||||
% of Revenues Before Reimbursements | 74.7 | % | 73.1 | % | 77.4 | % | 78.3 | % | 64.9 | % | 65.4 | % | ||||||||||||
Segment Gross Profit | 99,684 | 109,224 | (8.7 | )% | 76,721 | 78,275 | (2.0 | )% | 95,407 | 105,528 | (9.6 | )% | ||||||||||||
% of Revenues Before Reimbursements | 25.3 | % | 26.9 | % | 22.6 | % | 21.7 | % | 35.1 | % | 34.6 | % | ||||||||||||
Indirect Costs | 72,511 | 72,315 | 0.3 | % | 69,091 | 66,967 | 3.2 | % | 46,086 | 55,964 | (17.7 | )% | ||||||||||||
% of Revenues Before Reimbursements | 18.4 | % | 17.8 | % | 20.3 | % | 18.5 | % | 16.9 | % | 18.4 | % | ||||||||||||
Operating Earnings (1) | $ | 27,173 | $ | 36,909 | (26.4 | )% | $ | 7,630 | $ | 11,308 | (32.5 | )% | $ | 49,321 | $ | 49,564 | (0.5 | )% | ||||||
% of Revenues Before Reimbursements | 6.9 | % | 9.1 | % | 2.2 | % | 3.1 | % | 18.1 | % | 16.3 | % | ||||||||||||
(1) A non-GAAP financial measurement which represents net income attributable to the applicable reporting segment excluding income taxes, net corporate interest expense, stock option expense, amortization of customer-relationship intangible assets, loss on disposition of business line, arbitration and claim settlements, goodwill and asset impairment charges and certain unallocated corporate and shared costs and credits. See pages 6-8 for additional information about segment operating earnings.
Page 17 of 18
CRAWFORD & COMPANY
CONDENSED CONSOLIDATED STATEMENTS OF CASH FLOWS
Year Ended December 31, 2019 and December 31, 2018
Unaudited
(In Thousands)
2019 | 2018 | |||||||
Cash Flows From Operating Activities: | ||||||||
Net Income | $ | 9,526 | $ | 25,589 | ||||
Reconciliation of Net Income to Net Cash Provided by Operating Activities: | ||||||||
Depreciation and Amortization | 40,513 | 44,079 | ||||||
Goodwill and Intangible Asset Impairment Charges | 17,484 | 1,056 | ||||||
Deferred Income Taxes | 3,040 | 7,947 | ||||||
Stock-Based Compensation Costs | 4,109 | 6,196 | ||||||
Loss on Disposition of Business Line | — | 20,270 | ||||||
Changes in Operating Assets and Liabilities, Net of Effects of Acquisitions and Dispositions: | ||||||||
Accounts Receivable, Net | 5,922 | 7,844 | ||||||
Unbilled Revenues, Net | 5,302 | (18,588 | ) | |||||
Accrued or Prepaid Income Taxes | (5,985 | ) | 2,270 | |||||
Accounts Payable and Accrued Liabilities | (6,946 | ) | (8,952 | ) | ||||
Deferred Revenues | (281 | ) | (4,969 | ) | ||||
Accrued Retirement Costs | 3,387 | (25,896 | ) | |||||
Prepaid Expenses and Other Operating Activities | (855 | ) | (4,427 | ) | ||||
Net Cash Provided by Operating Activities | 75,216 | 52,419 | ||||||
Cash Flows From Investing Activities: | ||||||||
Acquisitions of Property and Equipment | (8,688 | ) | (14,052 | ) | ||||
Cash Proceeds from Disposition of Business Line | — | 39,187 | ||||||
Capitalization of Computer Software Costs | (12,436 | ) | (15,968 | ) | ||||
Payments for Business Acquisitions, Net of Cash Acquired | (2,296 | ) | (2,500 | ) | ||||
Other Investing Activities | — | (218 | ) | |||||
Net Cash (Used in) Provided by Investing Activities | (23,420 | ) | 6,449 | |||||
Cash Flows From Financing Activities: | ||||||||
Cash Dividends Paid | (13,171 | ) | (13,528 | ) | ||||
Payments Related to Shares Received for Withholding Taxes Under Stock-Based Compensation Plans | (827 | ) | (1,110 | ) | ||||
Proceeds from Shares Purchased Under Employee Stock-Based Compensation Plans | 2,104 | 1,387 | ||||||
Repurchases of Common Stock | (26,210 | ) | (10,409 | ) | ||||
Increases in Short-Term and Revolving Credit Facility Borrowings | 66,197 | 101,428 | ||||||
Payments on Short-Term and Revolving Credit Facility Borrowings | (80,948 | ) | (135,433 | ) | ||||
Payments on Finance Lease Obligations | (93 | ) | (477 | ) | ||||
Dividends Paid to Noncontrolling Interests | (458 | ) | (574 | ) | ||||
Capitalized Loan Costs | — | (23 | ) | |||||
Net Cash Used In Financing Activities | (53,406 | ) | (58,739 | ) | ||||
Effects of Exchange Rate Changes on Cash and Cash Equivalents | 293 | (1,021 | ) | |||||
Decrease in Cash and Cash Equivalents | (1,317 | ) | (892 | ) | ||||
Cash and Cash Equivalents at Beginning of Year | 53,119 | 54,011 | ||||||
Cash and Cash Equivalents at End of Period | $ | 51,802 | $ | 53,119 | ||||
Page 18 of 18