Exhibit 99.2 January 2022 (NYSE: CRGY) A Differentiated U.S. Energy Company C R E S C E N T E N E R G Y
Disclaimer This presentation relates to Crescent Energy Company (the “Company”) and contains “forward looking statements” within the meaning of Section 27A of the Securities Act of 1933, as amended (the “Securities Act”), and Section 21E of the Securities Exchange Act of 1934, as amended. All statements, other than statements of historical fact, included in this communication that address activities, events or developments that the Company expects, believes or anticipates will or may occur in the future are forward looking statements and are based on current expectations. Words such as “estimate,” “project,” “predict,” “believe,” “expect, expect,” anticipate,” “potential,” “possible,” “create,” “intend,” “should,” “could,” “may,” “foresee,” “plan,” “will,” “guidance,” “look,” “outlook,” “view,” “efforts,” “goal,” “future,” “assume,” “forecast,” build,” “focus,” “work,” “commitment,” “approach,” “continue” or the negative of such terms or other variations thereof and words and terms of similar substance (including labels “NTM” and “E”) used in connection with any discussion of future plans, actions, or events identify forward looking statements and express our expectations about future events. However, the absence of these words does not mean that the statements are not forward looking. These forward looking statements include, but are not limited to, statements regarding the recent consummation of the business combination (the “Transaction”) between Independence Energy LLC (“Independence”) and Contango Oil & Gas (“Contango”), pro forma descriptions of the combined company and its operations, integration and transition plans, synergies, opportunities, anticipated future performance, future commodity prices, future production targets, future earnings, EBITDAX, leverage targets, future capital spending plans, operational and cost efficiencies, inventory life, hedging activities, business strategy and market position, estimated reserves, cash flows, liquidity and accretive effects of the Transaction, financial strategy, budget, projections and future operating results. There are a number of risks and uncertainties that could cause actual results to differ materially from the forward looking statements included in this communication. These include the ability to have successfully integrated the businesses and achieving synergies, risks related to disruption of management time from ongoing business operations due to the closing of the Transaction, the risk that the closing of the Transaction could have a continuing adverse effect on the ability of the Company to retain customers and retain and hire key personnel and maintain relationships with their suppliers and customers and on their operating results and businesses generally, the impact of reduced demand for the Company’s products and products made from them due to governmental and societal actions taken in response to the COVID 19 pandemic, uncertainty related to the actions of OPEC and other oil-producing countries, the uncertainties, costs and risks involved in the Company’s operations, including as a result of employee misconduct, natural disasters, pandemics, epidemics (including the COVID-19 pandemic and any escalation or worsening thereof) or other public health conditions and other important factors that could cause actual results to differ materially from those projected. All such factors are difficult to predict and may be beyond the Company’s control, including those detailed in that certain final prospectus on Form 424B3 (the “Final Prospectus”) filed with the U.S. Securities and Exchange Commission (the “SEC”) relating to the Transaction that is available on the SEC’s website at http://www.sec.gov, the Company’s current reports on Form 8-K and Contango’s annual reports on Form 10-K, quarterly reports on Form 10-Q and current reports on Form 8-K that are available on the SEC’s website at http://www.sec.gov. All forward looking statements are based on a number of assumptions, risks and uncertainties that the Company believes to be reasonable but that may not prove to be accurate. Many of such risks, uncertainties and assumptions are beyond the Company’s ability to control or predict. Because of these risks, uncertainties and assumptions, readers are cautioned not to, and should not, place undue reliance on these forward-looking statements. The Company does not give any assurance (1) that they will achieve their expectations, or (2) to any regulatory action, administrative proceedings, government investigations, litigation, warning letters, consent decree, cost reductions, business strategies, earnings or revenue trends or future financial results. Any forward-looking statement speaks only as of the date on which such statement is made, and the Company undertakes no obligation to correct, revise or update any forward-looking statement, whether as a result of new information, future events or otherwise, except as required by applicable law. Readers are cautioned not to place undue reliance on these forward-looking statements that speak only as of the date hereof. All subsequent written and oral forward-looking statements concerning the Company or other matters and attributable thereto or to any person acting on its behalf are expressly qualified in their entirety by the cautionary statements above. Reserve engineering is a process of estimating underground accumulations of oil and natural gas that cannot be measured in an exact way. The accuracy of any reserve estimate depends on the quality of available data, the interpretation of such data and price and cost assumptions made by reservoir engineers. In addition, the results of drilling, testing and production activities may justify revisions of estimates that were made previously. If significant, such revisions would change the schedule of any further production and development drilling. Unless otherwise indicated, reserve estimates shown herein are based on reserve reports as of December 31, 2021 that were prepared or audited by the Company’s independent reserve engineers in accordance with applicable rules and guidelines of the SEC. Certain reserve estimates were prepared using commodity prices based on Henry Hub and West Texas Intermediate futures prices, referred to herein as “strip” pricing, rather than SEC pricing guidelines. The Company believes that the use of strip pricing provides useful information about its reserves, as the forward prices are based on the market’s forward-looking expectations of oil and natural gas prices as of a certain date. Strip prices are not necessarily a projection of future oil and natural gas prices and should be carefully considered in addition to, and not as a substitute for, SEC prices when considering the Company’s oil, natural gas and natural gas liquid reserves. This presentation includes certain financial measures that are not calculated in accordance with U.S. generally accepted accounting principles (“GAAP”). These measures include (i) Adj. EBITDAX, (ii) Unhedged Adj. EBITDAX, (iii) Net Debt, (iv) Leverage, (vi) Levered Free Cash Flow, (viii) Cash G&A, (vii) PV-0, (viii) PV-10, and (ix) Reinvestment Rate. The Company defines Adj. EBITDAX as net income (loss) before interest expense, realized (gain) loss on interest rate derivatives, income tax expense, depreciation, depletion and amortization, exploration expense, non-cash gain (loss) on derivatives, impairment of oil and natural gas properties, equity-based compensation, (gain) loss on sale of assets, other (income) expense, certain non-controlling interest distributions made by Crescent Energy OpCo, LLC (“OpCo”), non-recurring expenses and transaction expenses. The Company defines Unhedged Adj. EBITDAX as Adj. EBITDAX before realized (gain) loss on commodity derivatives. The Company defines Net Debt as total debt less unrestricted cash & cash equivalents. The Company defines Leverage as the ratio of Net Debt to Adj. EBITDAX. The Company defines Levered Free Cash Flow as Adjusted EBITDAX less interest expense, excluding noncash deferred financing cost amortization, realized gain (loss) on interest rate derivatives, current income tax provision, tax-related non-controlling distributions made by OpCo and development of oil and natural gas properties. The Company defines Reinvestment Rate as capital expenditures as a percentage of Adj. EBITDAX. The Company defines Cash G&A as General and Administrative Expense, excluding noncash equity-based compensation. In addition, pre-tax undiscounted present value (“PV-0”) and pre-tax present value discounted at ten percent (“PV-10”) are considered non-GAAP measures. The most directly comparable GAAP financial measure is standardized measure of discounted future net cash flows. Unless otherwise indicated, the Company has not provided reconciliations for forward-looking and pro forma non-GAAP measures because the Company cannot do so without unreasonable effort and any attempt to do so would be inherently imprecise. This is due to the inherent difficulty of forecasting the timing or amount of various reconciling items that would impact the most directly comparable forward-looking GAAP financial measure, that have not yet occurred, are out of our control and/or cannot be reasonably predicted. Forward-looking non-GAAP financial measures provided without the most directly comparable GAAP financial measures may vary materially from the corresponding GAAP financial measures. C R E S C E N T E N E R G Y 2
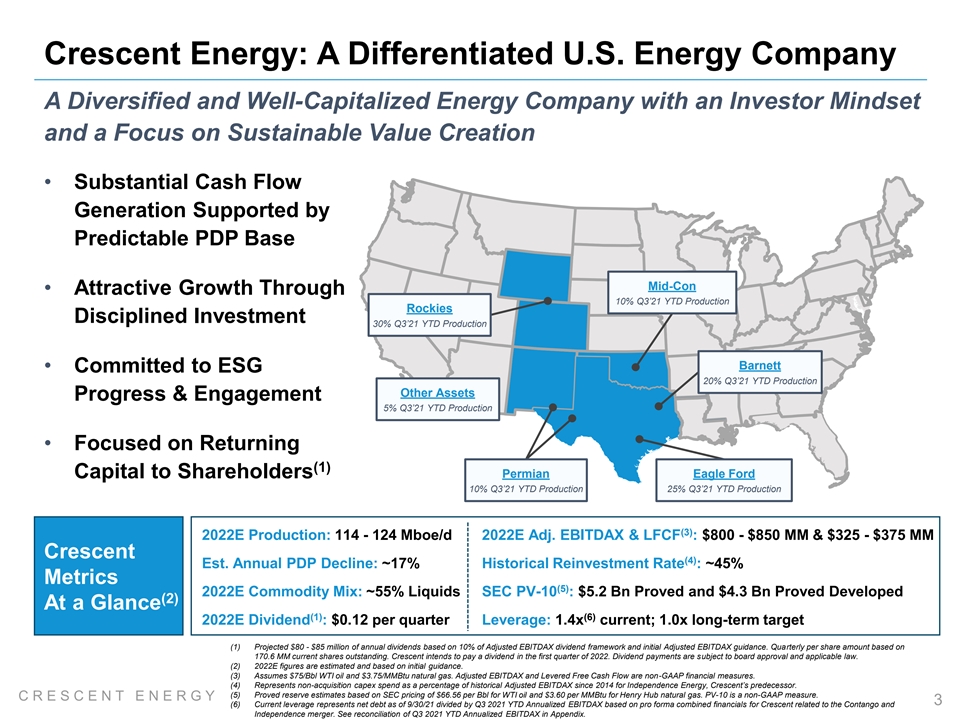
Crescent Energy: A Differentiated U.S. Energy Company A Diversified and Well-Capitalized Energy Company with an Investor Mindset and a Focus on Sustainable Value Creation • Substantial Cash Flow Generation Supported by Predictable PDP Base Mid-Con • Attractive Growth Through 10% Q3’21 YTD Production Rockies Disciplined Investment 30% Q3’21 YTD Production Barnett • Committed to ESG 20% Q3’21 YTD Production Other Assets Progress & Engagement 5% Q3’21 YTD Production • Focused on Returning (1) Capital to Shareholders Permian Eagle Ford 10% Q3’21 YTD Production 25% Q3’21 YTD Production (3) 2022E Production: 114 - 124 Mboe/d 2022E Adj. EBITDAX & LFCF : $800 - $850 MM & $325 - $375 MM Crescent (4) Est. Annual PDP Decline: ~17% Historical Reinvestment Rate : ~45% Metrics (5) 2022E Commodity Mix: ~55% Liquids SEC PV-10 : $5.2 Bn Proved and $4.3 Bn Proved Developed (2) At a Glance (1) (6) 2022E Dividend : $0.12 per quarter Leverage: 1.4x current; 1.0x long-term target (1) Projected $80 - $85 million of annual dividends based on 10% of Adjusted EBITDAX dividend framework and initial Adjusted EBITDAX guidance. Quarterly per share amount based on 170.6 MM current shares outstanding. Crescent intends to pay a dividend in the first quarter of 2022. Dividend payments are subject to board approval and applicable law. (2) 2022E figures are estimated and based on initial guidance. (3) Assumes $75/Bbl WTI oil and $3.75/MMBtu natural gas. Adjusted EBITDAX and Levered Free Cash Flow are non-GAAP financial measures. (4) Represents non-acquisition capex spend as a percentage of historical Adjusted EBITDAX since 2014 for Independence Energy, Crescent’s predecessor. (5) Proved reserve estimates based on SEC pricing of $66.56 per Bbl for WTI oil and $3.60 per MMBtu for Henry Hub natural gas. PV-10 is a non-GAAP measure. C R E S C E N T E N E R G Y 3 (6) Current leverage represents net debt as of 9/30/21 divided by Q3 2021 YTD Annualized EBITDAX based on pro forma combined financials for Crescent related to the Contango and Independence merger. See reconciliation of Q3 2021 YTD Annualized EBITDAX in Appendix.
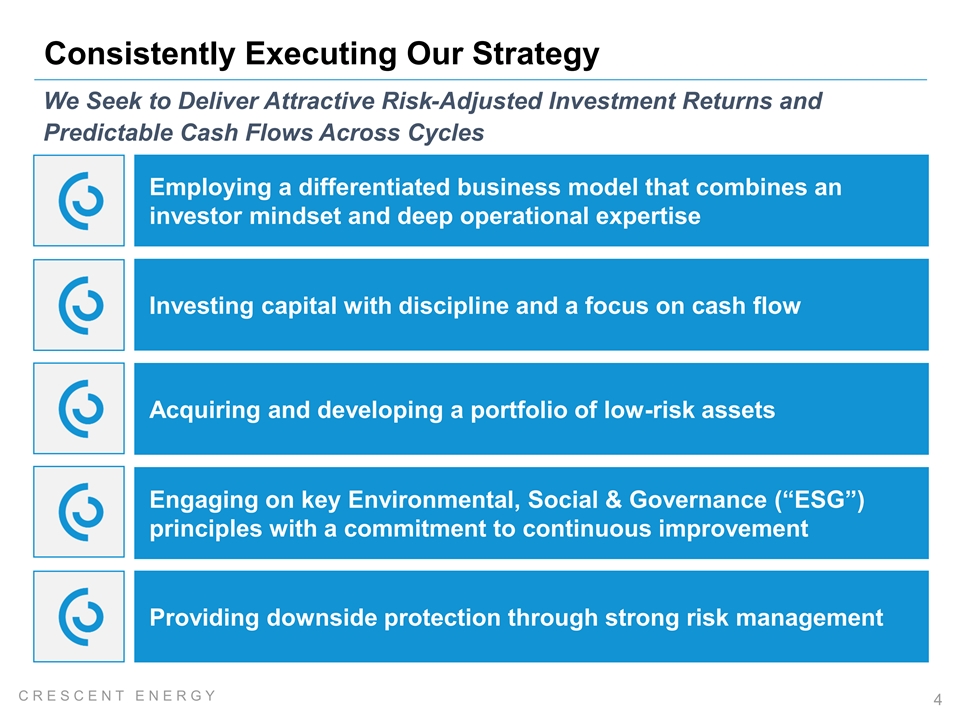
Consistently Executing Our Strategy We Seek to Deliver Attractive Risk-Adjusted Investment Returns and Predictable Cash Flows Across Cycles Employing a differentiated business model that combines an investor mindset and deep operational expertise Investing capital with discipline and a focus on cash flow Acquiring and developing a portfolio of low-risk assets Engaging on key Environmental, Social & Governance (“ESG”) principles with a commitment to continuous improvement Providing downside protection through strong risk management C R E S C E N T E N E R G Y 4
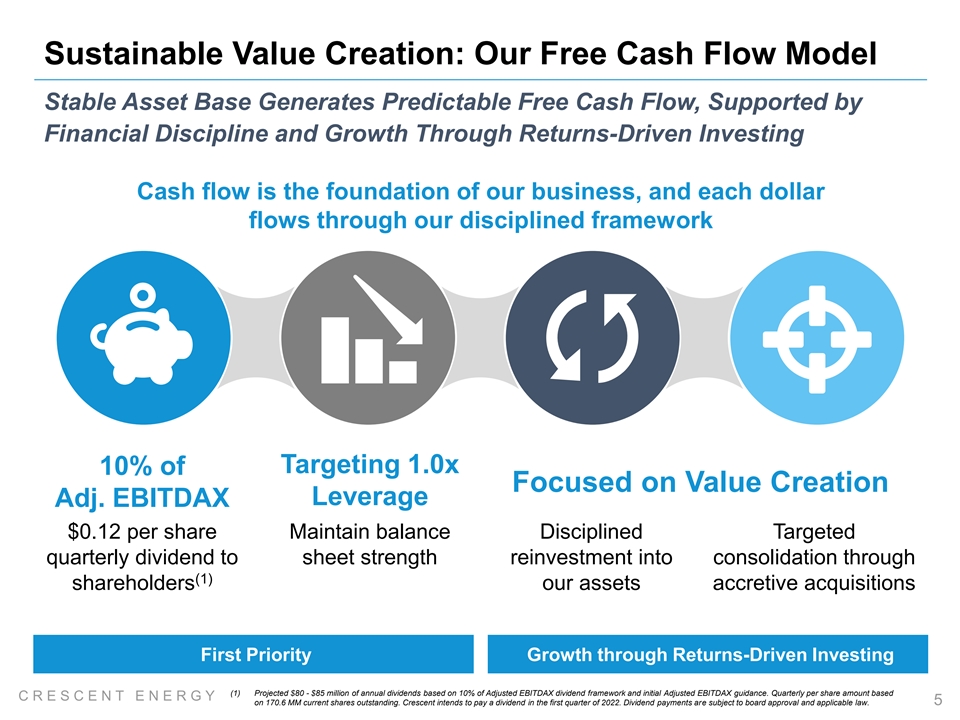
Sustainable Value Creation: Our Free Cash Flow Model Stable Asset Base Generates Predictable Free Cash Flow, Supported by Financial Discipline and Growth Through Returns-Driven Investing Cash flow is the foundation of our business, and each dollar flows through our disciplined framework Targeting 1.0x 10% of Focused on Value Creation Leverage Adj. EBITDAX $0.12 per share Maintain balance Disciplined Targeted quarterly dividend to sheet strength reinvestment into consolidation through (1) shareholders our assets accretive acquisitions First Priority Growth through Returns-Driven Investing (1) Projected $80 - $85 million of annual dividends based on 10% of Adjusted EBITDAX dividend framework and initial Adjusted EBITDAX guidance. Quarterly per share amount based C R E S C E N T E N E R G Y on 170.6 MM current shares outstanding. Crescent intends to pay a dividend in the first quarter of 2022. Dividend payments are subject to board approval and applicable law. 5
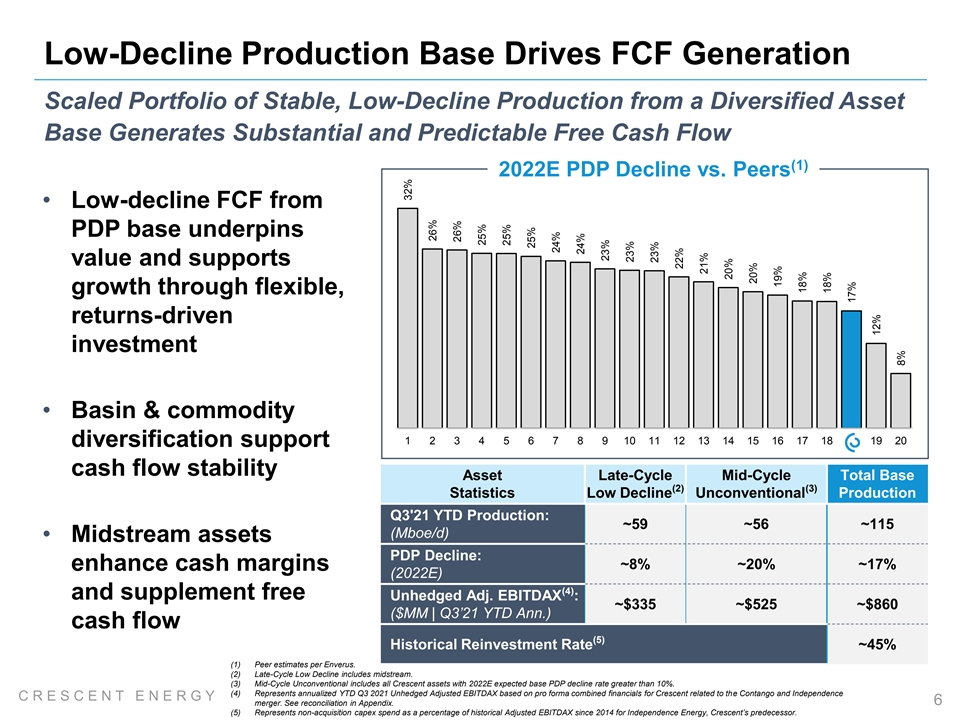
Low-Decline Production Base Drives FCF Generation Scaled Portfolio of Stable, Low-Decline Production from a Diversified Asset Base Generates Substantial and Predictable Free Cash Flow (1) 2022E PDP Decline vs. Peers • Low-decline FCF from PDP base underpins value and supports growth through flexible, returns-driven investment • Basin & commodity 1 2 3 4 5 6 7 8 9 10 11 12 13 14 15 16 17 18 19 20 diversification support cash flow stability Asset Late-Cycle Mid-Cycle Total Base (2) (3) Statistics Low Decline Unconventional Production Q3'21 YTD Production: ~59 ~56 ~115 (Mboe/d) • Midstream assets PDP Decline: ~8% ~20% ~17% enhance cash margins (2022E) (4) and supplement free Unhedged Adj. EBITDAX : ~$335 ~$525 ~$860 ($MM | Q3’21 YTD Ann.) cash flow (5) Historical Reinvestment Rate ~45% (1) Peer estimates per Enverus. (2) Late-Cycle Low Decline includes midstream. (3) Mid-Cycle Unconventional includes all Crescent assets with 2022E expected base PDP decline rate greater than 10%. (4) Represents annualized YTD Q3 2021 Unhedged Adjusted EBITDAX based on pro forma combined financials for Crescent related to the Contango and Independence C R E S C E N T E N E R G Y 6 merger. See reconciliation in Appendix. (5) Represents non-acquisition capex spend as a percentage of historical Adjusted EBITDAX since 2014 for Independence Energy, Crescent’s predecessor. 32% 26% 26% 25% 25% 25% 24% 24% 23% 23% 23% 22% 21% 20% 20% 19% 18% 18% 17% 12% 8%
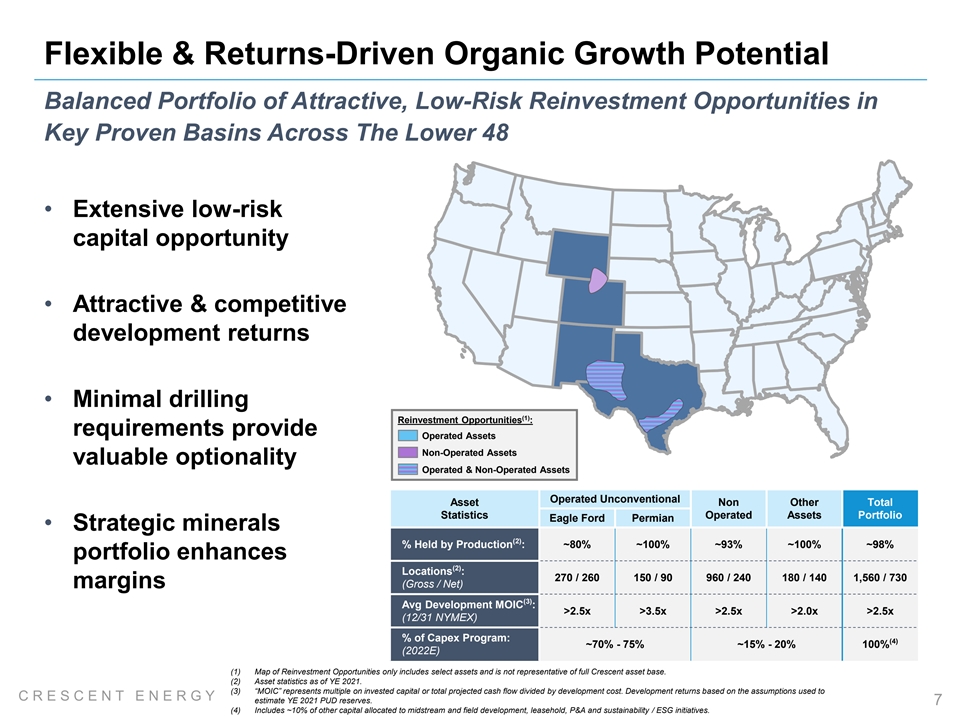
Flexible & Returns-Driven Organic Growth Potential Balanced Portfolio of Attractive, Low-Risk Reinvestment Opportunities in Key Proven Basins Across The Lower 48 • Extensive low-risk capital opportunity • Attractive & competitive development returns • Minimal drilling (1) Reinvestment Opportunities : requirements provide Operated Assets Non-Operated Assets valuable optionality Operated & Non-Operated Assets Operated Unconventional Asset Non Other Total Statistics Operated Assets Portfolio Eagle Ford Permian • Strategic minerals (2) % Held by Production : ~80% ~100% ~93% ~100% ~98% portfolio enhances (2) Locations : 270 / 260 150 / 90 960 / 240 180 / 140 1,560 / 730 margins (Gross / Net) (3) Avg Development MOIC : >2.5x >3.5x >2.5x >2.0x >2.5x (12/31 NYMEX) % of Capex Program: (4) ~70% - 75% ~15% - 20% 100% (2022E) (1) Map of Reinvestment Opportunities only includes select assets and is not representative of full Crescent asset base. (2) Asset statistics as of YE 2021. (3) “MOIC” represents multiple on invested capital or total projected cash flow divided by development cost. Development returns based on the assumptions used to C R E S C E N T E N E R G Y estimate YE 2021 PUD reserves. 7 (4) Includes ~10% of other capital allocated to midstream and field development, leasehold, P&A and sustainability / ESG initiatives.
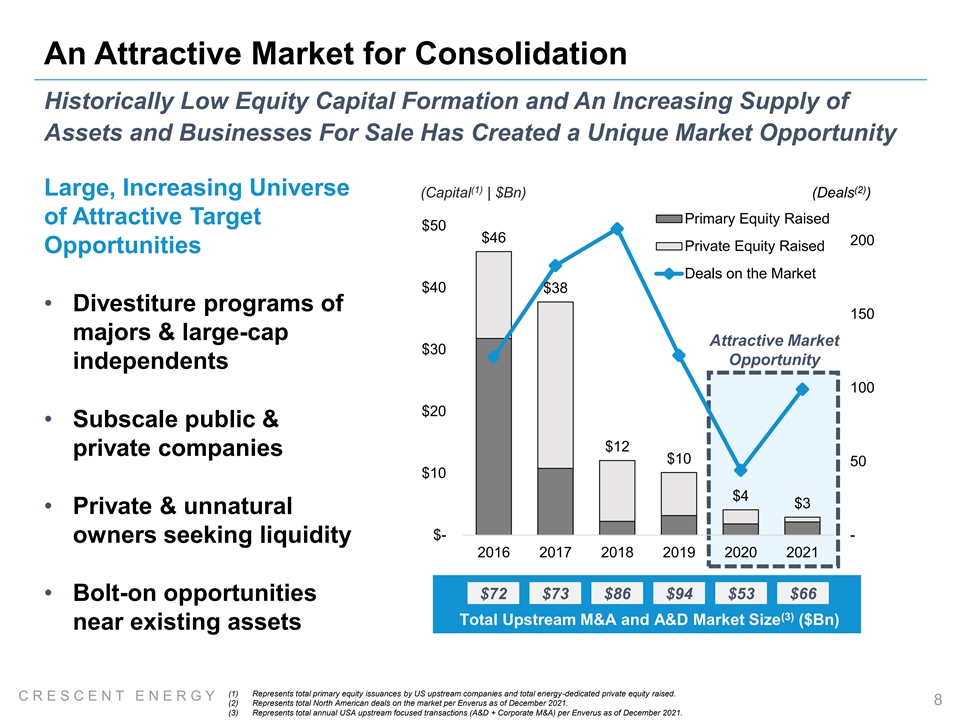
An Attractive Market for Consolidation Historically Low Equity Capital Formation and An Increasing Supply of Assets and Businesses For Sale Has Created a Unique Market Opportunity (1) (2) Large, Increasing Universe (Capital | $Bn) (Deals ) of Attractive Target Primary Equity Raised $50 $46 200 Private Equity Raised Opportunities Deals on the Market $40 $38 • Divestiture programs of 150 majors & large-cap Attractive Market $30 Opportunity independents 100 $20 • Subscale public & $12 private companies $10 50 $10 $4 $3 • Private & unnatural $- - owners seeking liquidity 2016 2017 2018 2019 2020 2021 $72 $73 $86 $94 $53 $66 • Bolt-on opportunities (3) Total Upstream M&A and A&D Market Size ($Bn) near existing assets (1) Represents total primary equity issuances by US upstream companies and total energy-dedicated private equity raised. C R E S C E N T E N E R G Y 8 (2) Represents total North American deals on the market per Enverus as of December 2021. (3) Represents total annual USA upstream focused transactions (A&D + Corporate M&A) per Enverus as of December 2021.
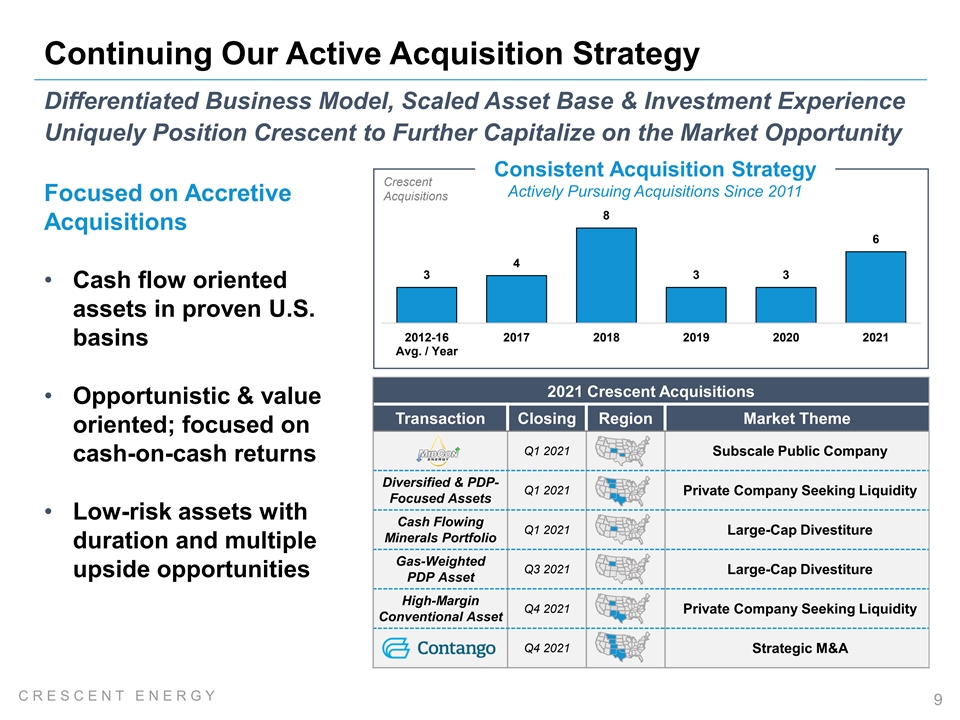
Continuing Our Active Acquisition Strategy Differentiated Business Model, Scaled Asset Base & Investment Experience Uniquely Position Crescent to Further Capitalize on the Market Opportunity Consistent Acquisition Strategy Crescent Actively Pursuing Acquisitions Since 2011 Acquisitions Focused on Accretive 8 Acquisitions 6 4 3 3 3 • Cash flow oriented assets in proven U.S. 2012-16 2017 2018 2019 2020 2021 basins Avg. / Year 2021 Crescent Acquisitions • Opportunistic & value Transaction Closing Region Market Theme oriented; focused on Q1 2021 Subscale Public Company cash-on-cash returns Diversified & PDP- Q1 2021 Private Company Seeking Liquidity Focused Assets • Low-risk assets with Cash Flowing Q1 2021 Large-Cap Divestiture Minerals Portfolio duration and multiple Gas-Weighted Q3 2021 Large-Cap Divestiture upside opportunities PDP Asset High-Margin Q4 2021 Private Company Seeking Liquidity Conventional Asset Q4 2021 Strategic M&A C R E S C E N T E N E R G Y 9
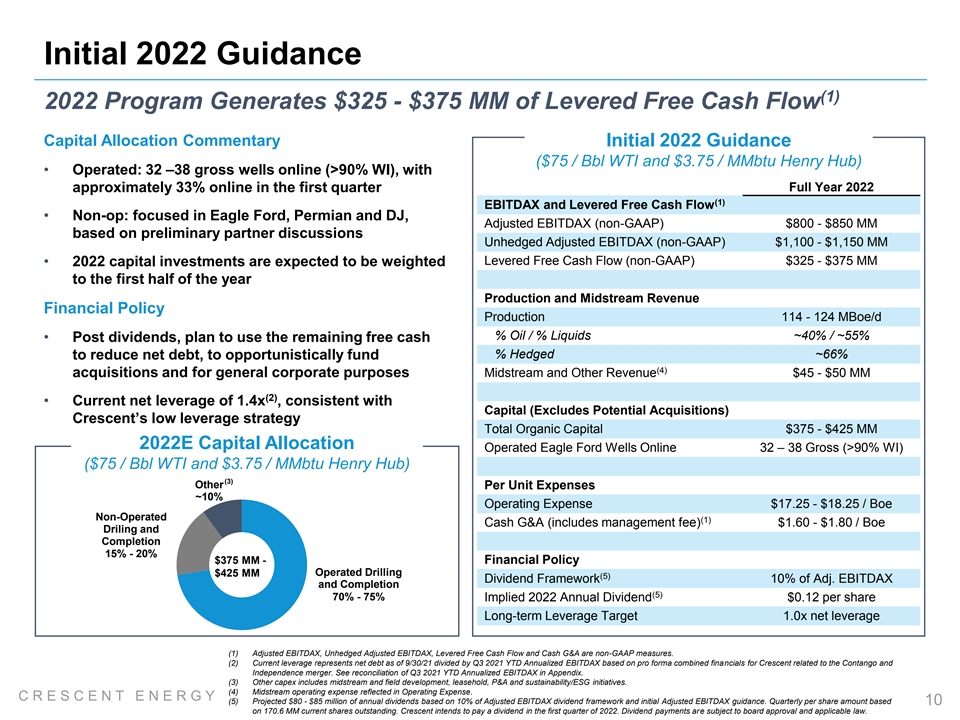
Initial 2022 Guidance (1) 2022 Program Generates $325 - $375 MM of Levered Free Cash Flow Capital Allocation Commentary Initial 2022 Guidance ($75 / Bbl WTI and $3.75 / MMbtu Henry Hub) • Operated: 32 –38 gross wells online (>90% WI), with approximately 33% online in the first quarter Full Year 2022 (1) EBITDAX and Levered Free Cash Flow • Non-op: focused in Eagle Ford, Permian and DJ, Adjusted EBITDAX (non-GAAP) $800 - $850 MM based on preliminary partner discussions Unhedged Adjusted EBITDAX (non-GAAP) $1,100 - $1,150 MM Levered Free Cash Flow (non-GAAP) $325 - $375 MM • 2022 capital investments are expected to be weighted to the first half of the year Production and Midstream Revenue Financial Policy Production 114 - 124 MBoe/d % Oil / % Liquids ~40% / ~55% • Post dividends, plan to use the remaining free cash % Hedged ~66% to reduce net debt, to opportunistically fund (4) acquisitions and for general corporate purposes Midstream and Other Revenue $45 - $50 MM (2) • Current net leverage of 1.4x , consistent with Capital (Excludes Potential Acquisitions) Crescent’s low leverage strategy Total Organic Capital $375 - $425 MM 2022E Capital Allocation Operated Eagle Ford Wells Online 32 – 38 Gross (>90% WI) ($75 / Bbl WTI and $3.75 / MMbtu Henry Hub) (3) Other Per Unit Expenses ~10% Operating Expense $17.25 - $18.25 / Boe Non-Operated (1) Cash G&A (includes management fee) $1.60 - $1.80 / Boe Driling and Completion 15% - 20% $375 MM - Financial Policy Operated Drilling $425 MM (5) Dividend Framework 10% of Adj. EBITDAX and Completion (5) 70% - 75% Implied 2022 Annual Dividend $0.12 per share Long-term Leverage Target 1.0x net leverage (1) Adjusted EBITDAX, Unhedged Adjusted EBITDAX, Levered Free Cash Flow and Cash G&A are non-GAAP measures. (2) Current leverage represents net debt as of 9/30/21 divided by Q3 2021 YTD Annualized EBITDAX based on pro forma combined financials for Crescent related to the Contango and Independence merger. See reconciliation of Q3 2021 YTD Annualized EBITDAX in Appendix. (3) Other capex includes midstream and field development, leasehold, P&A and sustainability/ESG initiatives. (4) Midstream operating expense reflected in Operating Expense. C R E S C E N T E N E R G Y (5) Projected $80 - $85 million of annual dividends based on 10% of Adjusted EBITDAX dividend framework and initial Adjusted EBITDAX guidance. Quarterly per share amount based 10 on 170.6 MM current shares outstanding. Crescent intends to pay a dividend in the first quarter of 2022. Dividend payments are subject to board approval and applicable law.
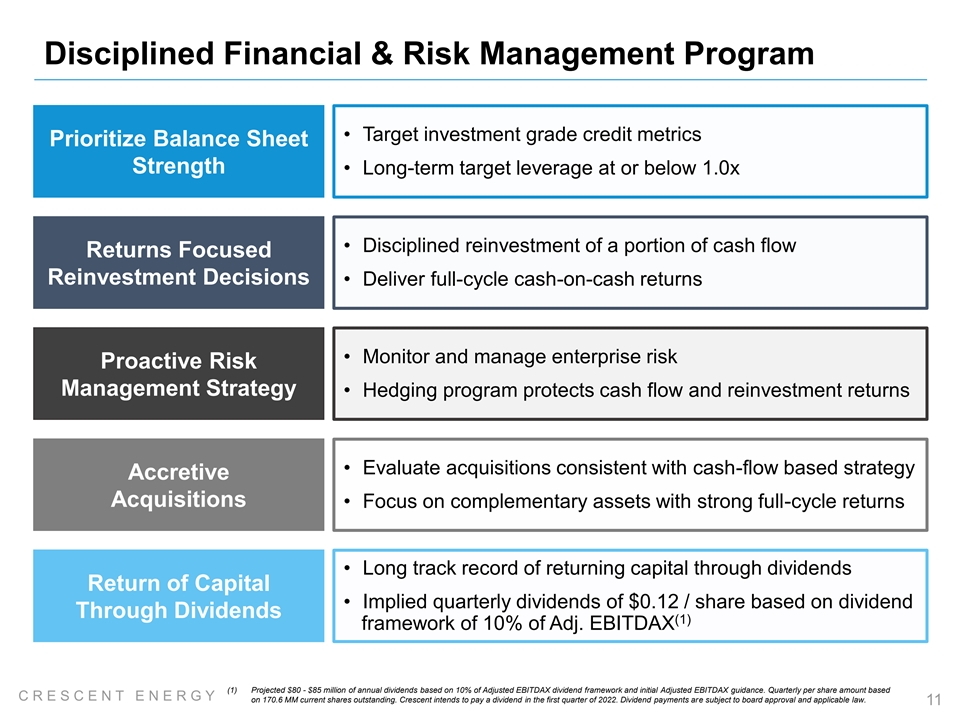
Disciplined Financial & Risk Management Program • Target investment grade credit metrics Prioritize Balance Sheet Strength • Long-term target leverage at or below 1.0x • Disciplined reinvestment of a portion of cash flow Returns Focused Reinvestment Decisions• Deliver full-cycle cash-on-cash returns • Monitor and manage enterprise risk Proactive Risk Management Strategy • Hedging program protects cash flow and reinvestment returns • Evaluate acquisitions consistent with cash-flow based strategy Accretive Acquisitions • Focus on complementary assets with strong full-cycle returns • Long track record of returning capital through dividends Return of Capital • Implied quarterly dividends of $0.12 / share based on dividend Through Dividends (1) framework of 10% of Adj. EBITDAX (1) Projected $80 - $85 million of annual dividends based on 10% of Adjusted EBITDAX dividend framework and initial Adjusted EBITDAX guidance. Quarterly per share amount based C R E S C E N T E N E R G Y on 170.6 MM current shares outstanding. Crescent intends to pay a dividend in the first quarter of 2022. Dividend payments are subject to board approval and applicable law. 11
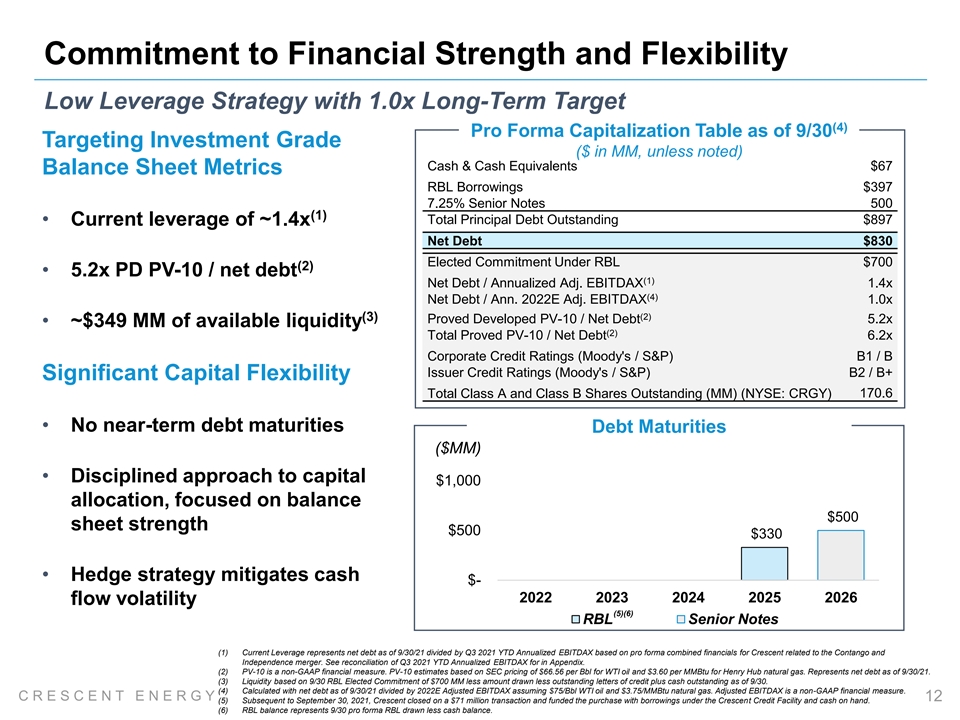
Commitment to Financial Strength and Flexibility Low Leverage Strategy with 1.0x Long-Term Target (4) Pro Forma Capitalization Table as of 9/30 Targeting Investment Grade ($ in MM, unless noted) Cash & Cash Equivalents $67 Balance Sheet Metrics RBL Borrowings $397 7.25% Senior Notes 500 (1) Total Principal Debt Outstanding $897 • Current leverage of ~1.4x Net Debt $830 Elected Commitment Under RBL $700 (2) • 5.2x PD PV-10 / net debt (1) Net Debt / Annualized Adj. EBITDAX 1.4x (4) Net Debt / Ann. 2022E Adj. EBITDAX 1.0x (2) (3) Proved Developed PV-10 / Net Debt 5.2x • ~$349 MM of available liquidity (2) Total Proved PV-10 / Net Debt 6.2x Corporate Credit Ratings (Moody's / S&P) B1 / B Issuer Credit Ratings (Moody's / S&P) B2 / B+ Significant Capital Flexibility 170.6 Total Class A and Class B Shares Outstanding (MM) (NYSE: CRGY) • No near-term debt maturities Debt Maturities ($MM) • Disciplined approach to capital $1,000 allocation, focused on balance $500 sheet strength $500 $330 • Hedge strategy mitigates cash $- 2022 2023 2024 2025 2026 flow volatility (5)(6) RBL Senior Notes (1) Current Leverage represents net debt as of 9/30/21 divided by Q3 2021 YTD Annualized EBITDAX based on pro forma combined financials for Crescent related to the Contango and Independence merger. See reconciliation of Q3 2021 YTD Annualized EBITDAX for in Appendix. (2) PV-10 is a non-GAAP financial measure. PV-10 estimates based on SEC pricing of $66.56 per Bbl for WTI oil and $3.60 per MMBtu for Henry Hub natural gas. Represents net debt as of 9/30/21. (3) Liquidity based on 9/30 RBL Elected Commitment of $700 MM less amount drawn less outstanding letters of credit plus cash outstanding as of 9/30. (4) Calculated with net debt as of 9/30/21 divided by 2022E Adjusted EBITDAX assuming $75/Bbl WTI oil and $3.75/MMBtu natural gas. Adjusted EBITDAX is a non-GAAP financial measure. C R E S C E N T E N E R G Y 12 (5) Subsequent to September 30, 2021, Crescent closed on a $71 million transaction and funded the purchase with borrowings under the Crescent Credit Facility and cash on hand. (6) RBL balance represents 9/30 pro forma RBL drawn less cash balance.
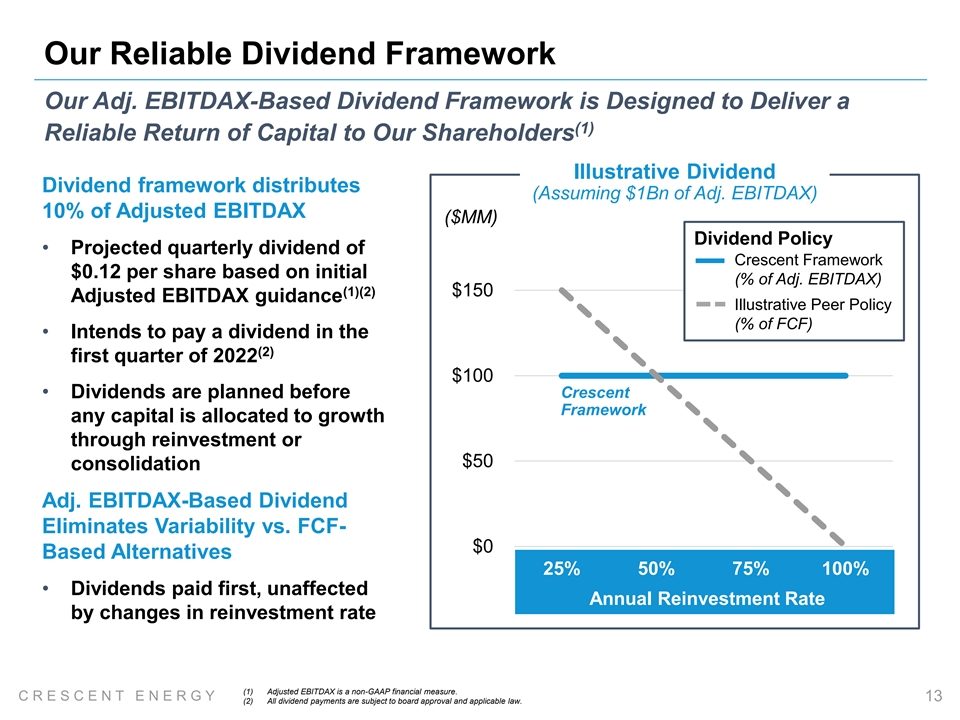
Our Reliable Dividend Framework Our Adj. EBITDAX-Based Dividend Framework is Designed to Deliver a (1) Reliable Return of Capital to Our Shareholders Illustrative Dividend Dividend framework distributes (Assuming $1Bn of Adj. EBITDAX) 10% of Adjusted EBITDAX ($MM) Dividend Policy • Projected quarterly dividend of Crescent Framework $0.12 per share based on initial (% of Adj. EBITDAX) (1)(2) $150 Adjusted EBITDAX guidance Illustrative Peer Policy (% of FCF) • Intends to pay a dividend in the (2) first quarter of 2022 $100 • Dividends are planned before Crescent Framework any capital is allocated to growth through reinvestment or $50 consolidation Adj. EBITDAX-Based Dividend Eliminates Variability vs. FCF- $0 Based Alternatives 25% 50% 75% 100% • Dividends paid first, unaffected Annual Reinvestment Rate by changes in reinvestment rate (1) Adjusted EBITDAX is a non-GAAP financial measure. C R E S C E N T E N E R G Y 13 (2) All dividend payments are subject to board approval and applicable law.

Our Commitment to ESG Improvement Shared Commitment to Developing Industry-Leading ESG Programs and Continually Improving ESG Performance Crescent Energy’s ESG highlights and priorities: Published inaugural 2020 ESG Work to reduce greenhouse gas emissions report • Reported on key ESG performance metrics using (1) Aspire to be a zero incident workplace SASB standards • Announced formation of ESG Advisory Council Manage and reduce fresh water use Identified ESG priorities and actions for 2022 Listen and respond to community and • Plans to provide short- and stakeholder concerns long-term ESG targets in its 2021 report Develop a diverse and inclusive workforce Supported by the network of culture the broader KKR platform (1) Reported in line with the Value Reporting Foundation’s SASB Standard for Oil & Gas – Exploration & Production. C R E S C E N T E N E R G Y 14
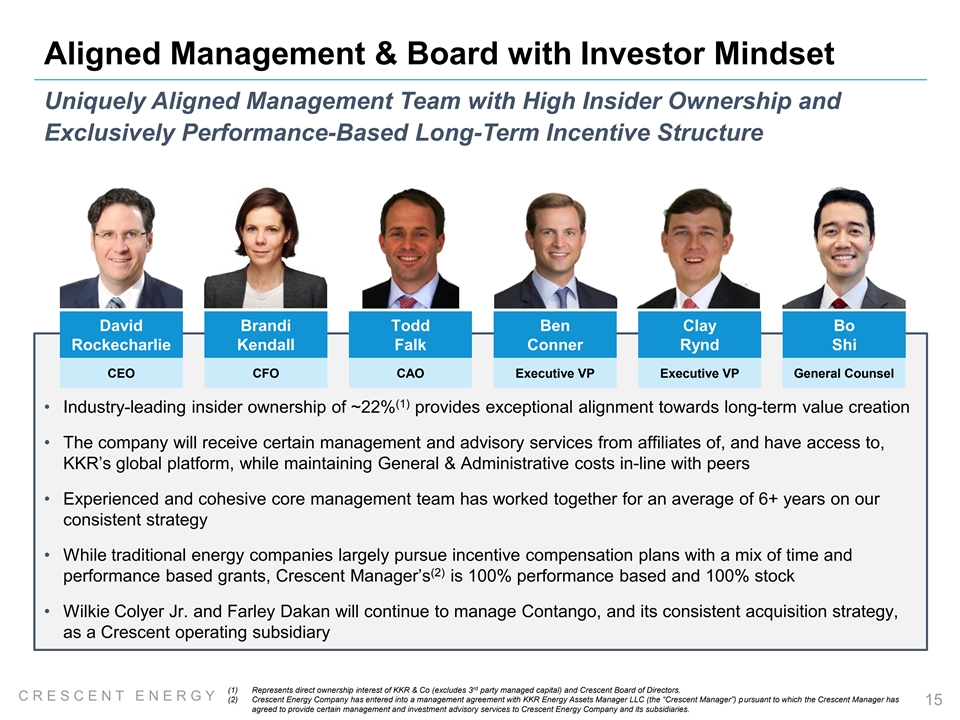
Aligned Management & Board with Investor Mindset Uniquely Aligned Management Team with High Insider Ownership and Exclusively Performance-Based Long-Term Incentive Structure David Brandi Todd Ben Clay Bo Rockecharlie Kendall Falk Conner Rynd Shi CEO CFO CAO Executive VP Executive VP General Counsel (1) • Industry-leading insider ownership of ~22% provides exceptional alignment towards long-term value creation • The company will receive certain management and advisory services from affiliates of, and have access to, KKR’s global platform, while maintaining General & Administrative costs in-line with peers • Experienced and cohesive core management team has worked together for an average of 6+ years on our consistent strategy • While traditional energy companies largely pursue incentive compensation plans with a mix of time and (2) performance based grants, Crescent Manager’s is 100% performance based and 100% stock • Wilkie Colyer Jr. and Farley Dakan will continue to manage Contango, and its consistent acquisition strategy, as a Crescent operating subsidiary rd (1) Represents direct ownership interest of KKR & Co (excludes 3 party managed capital) and Crescent Board of Directors. C R E S C E N T E N E R G Y (2) Crescent Energy Company has entered into a management agreement with KKR Energy Assets Manager LLC (the “Crescent Manager”) pursuant to which the Crescent Manager has 15 agreed to provide certain management and investment advisory services to Crescent Energy Company and its subsidiaries.
Crescent Energy: A Compelling Investment A Diversified and Well-Capitalized Energy Company with an Investor Mindset and a Focus on Sustainable Value Creation Unique business model combining an investor mindset & deep operational expertise Investing capital with discipline and a focus on cash flow Acquiring and developing a portfolio of low risk assets Engaging on key ESG principles with a commitment to continuous improvement Providing downside protection through strong risk management C R E S C E N T E N E R G Y 16
Appendix C R E S C E N T E N E R G Y
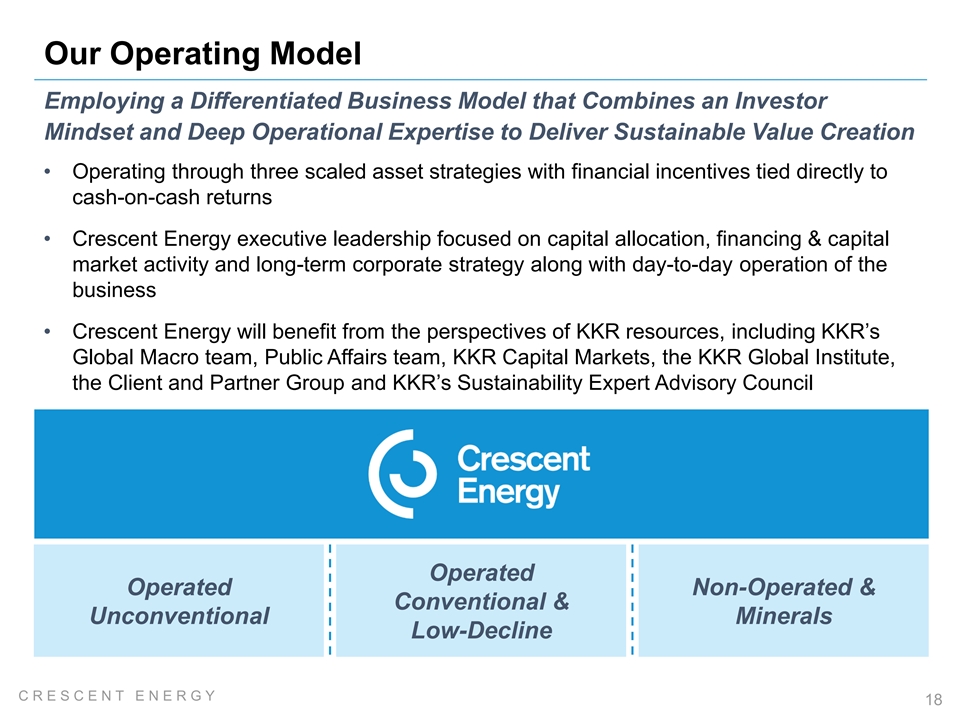
Our Operating Model Employing a Differentiated Business Model that Combines an Investor Mindset and Deep Operational Expertise to Deliver Sustainable Value Creation • Operating through three scaled asset strategies with financial incentives tied directly to cash-on-cash returns • Crescent Energy executive leadership focused on capital allocation, financing & capital market activity and long-term corporate strategy along with day-to-day operation of the business • Crescent Energy will benefit from the perspectives of KKR resources, including KKR’s Global Macro team, Public Affairs team, KKR Capital Markets, the KKR Global Institute, the Client and Partner Group and KKR’s Sustainability Expert Advisory Council Operated Operated Non-Operated & Conventional & Unconventional Minerals Low-Decline C R E S C E N T E N E R G Y 18
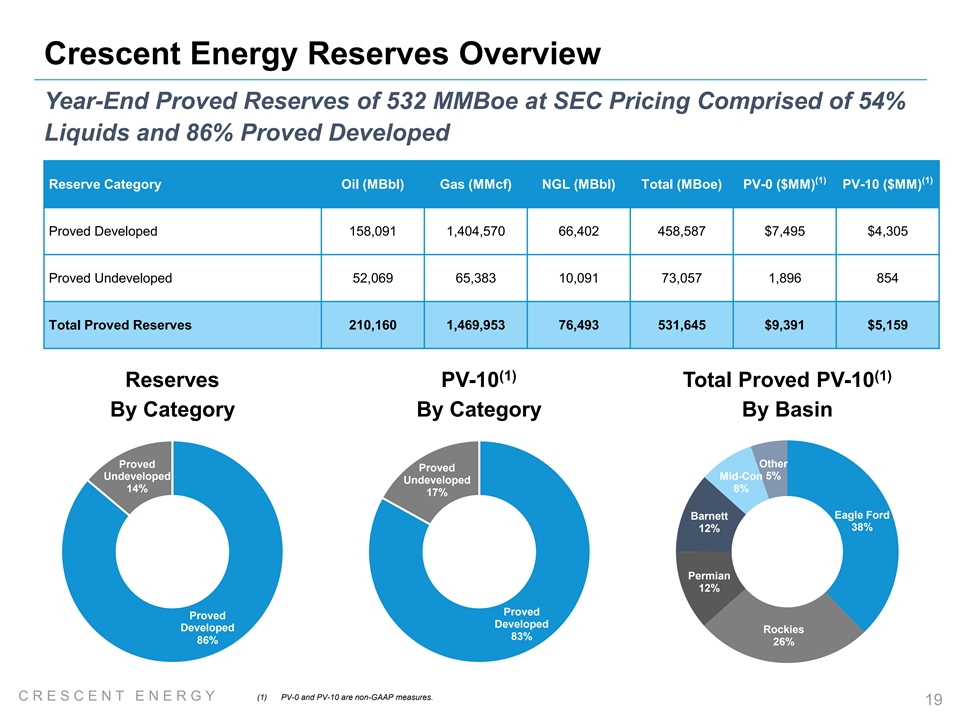
Crescent Energy Reserves Overview Year-End Proved Reserves of 532 MMBoe at SEC Pricing Comprised of 54% Liquids and 86% Proved Developed (1) (1) Reserve Category Oil (MBbl) Gas (MMcf) NGL (MBbl) Total (MBoe) PV-0 ($MM) PV-10 ($MM) Proved Developed 158,091 1,404,570 66,402 458,587 $7,495 $4,305 Proved Undeveloped 52,069 65,383 10,091 73,057 1,896 854 Total Proved Reserves 210,160 1,469,953 76,493 531,645 $9,391 $5,159 (1) (1) Reserves PV-10 Total Proved PV-10 By Category By Category By Basin Proved Other Proved Undeveloped Mid-Con 5% Undeveloped 14% 8% 17% Eagle Ford Barnett 38% 12% Permian 12% Proved Proved Developed Developed Rockies 83% 86% 26% (1) PV-0 and PV-10 are non-GAAP measures. C R E S C E N T E N E R G Y 19
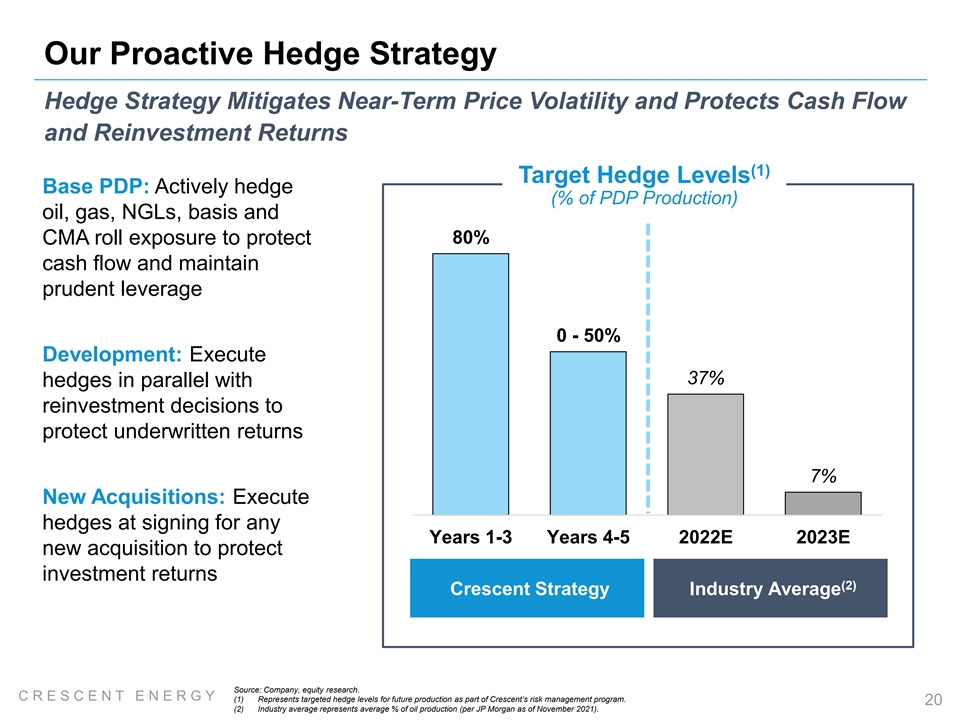
Our Proactive Hedge Strategy Hedge Strategy Mitigates Near-Term Price Volatility and Protects Cash Flow and Reinvestment Returns (1) Target Hedge Levels Base PDP: Actively hedge (% of PDP Production) oil, gas, NGLs, basis and 80% CMA roll exposure to protect cash flow and maintain prudent leverage 0 - 50% Development: Execute 37% hedges in parallel with reinvestment decisions to protect underwritten returns 7% New Acquisitions: Execute hedges at signing for any Years 1-3 Years 4-5 2022E 2023E new acquisition to protect investment returns (2) Crescent Strategy Industry Average Source: Company, equity research. C R E S C E N T E N E R G Y (1) Represents targeted hedge levels for future production as part of Crescent’s risk management program. 20 (2) Industry average represents average % of oil production (per JP Morgan as of November 2021).
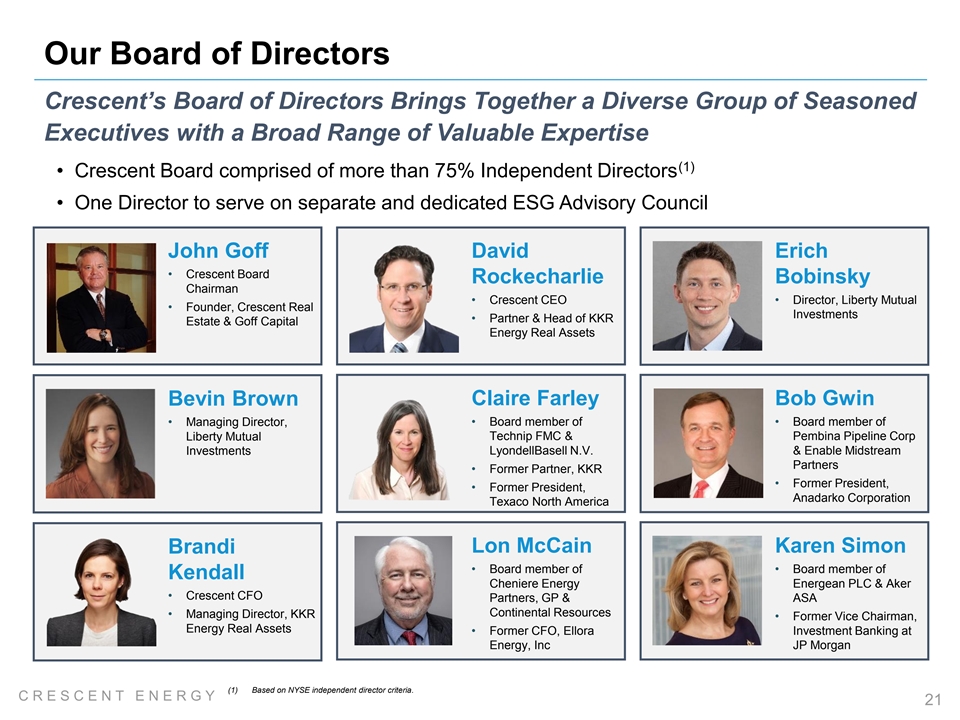
Our Board of Directors Crescent’s Board of Directors Brings Together a Diverse Group of Seasoned Executives with a Broad Range of Valuable Expertise (1) • Crescent Board comprised of more than 75% Independent Directors • One Director to serve on separate and dedicated ESG Advisory Council John Goff David Erich • Crescent Board Rockecharlie Bobinsky Chairman • Crescent CEO• Director, Liberty Mutual • Founder, Crescent Real Investments • Partner & Head of KKR Estate & Goff Capital Energy Real Assets Bevin Brown Claire Farley Bob Gwin • Board member of • Board member of • Managing Director, Technip FMC & Pembina Pipeline Corp Liberty Mutual Investments LyondellBasell N.V. & Enable Midstream Partners • Former Partner, KKR • Former President, • Former President, Anadarko Corporation Texaco North America Brandi Lon McCain Karen Simon • Board member of • Board member of Kendall Cheniere Energy Energean PLC & Aker • Crescent CFO Partners, GP & ASA Continental Resources • Managing Director, KKR • Former Vice Chairman, Energy Real Assets • Former CFO, Ellora Investment Banking at Energy, Inc JP Morgan (1) Based on NYSE independent director criteria. C R E S C E N T E N E R G Y 21
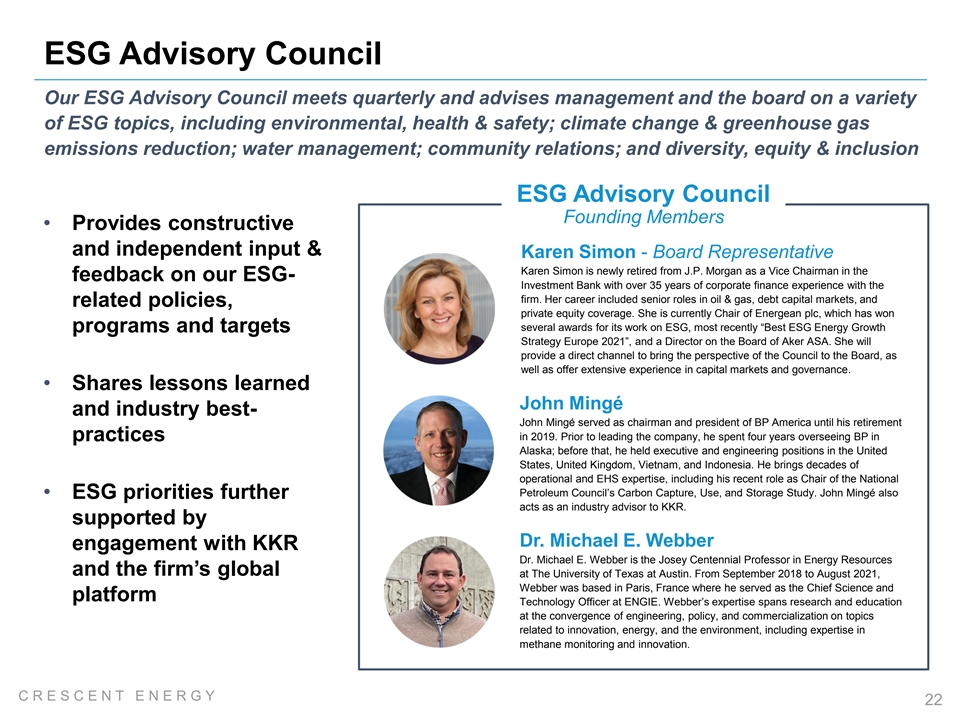
ESG Advisory Council Our ESG Advisory Council meets quarterly and advises management and the board on a variety of ESG topics, including environmental, health & safety; climate change & greenhouse gas emissions reduction; water management; community relations; and diversity, equity & inclusion ESG Advisory Council Founding Members • Provides constructive and independent input & Karen Simon - Board Representative Karen Simon is newly retired from J.P. Morgan as a Vice Chairman in the feedback on our ESG- Investment Bank with over 35 years of corporate finance experience with the firm. Her career included senior roles in oil & gas, debt capital markets, and related policies, private equity coverage. She is currently Chair of Energean plc, which has won several awards for its work on ESG, most recently “Best ESG Energy Growth programs and targets Strategy Europe 2021”, and a Director on the Board of Aker ASA. She will provide a direct channel to bring the perspective of the Council to the Board, as well as offer extensive experience in capital markets and governance. • Shares lessons learned John Mingé and industry best- John Mingé served as chairman and president of BP America until his retirement in 2019. Prior to leading the company, he spent four years overseeing BP in practices Alaska; before that, he held executive and engineering positions in the United States, United Kingdom, Vietnam, and Indonesia. He brings decades of operational and EHS expertise, including his recent role as Chair of the National Petroleum Council’s Carbon Capture, Use, and Storage Study. John Mingé also • ESG priorities further acts as an industry advisor to KKR. supported by Dr. Michael E. Webber engagement with KKR Dr. Michael E. Webber is the Josey Centennial Professor in Energy Resources and the firm’s global at The University of Texas at Austin. From September 2018 to August 2021, Webber was based in Paris, France where he served as the Chief Science and platform Technology Officer at ENGIE. Webber’s expertise spans research and education at the convergence of engineering, policy, and commercialization on topics related to innovation, energy, and the environment, including expertise in methane monitoring and innovation. C R E S C E N T E N E R G Y 22
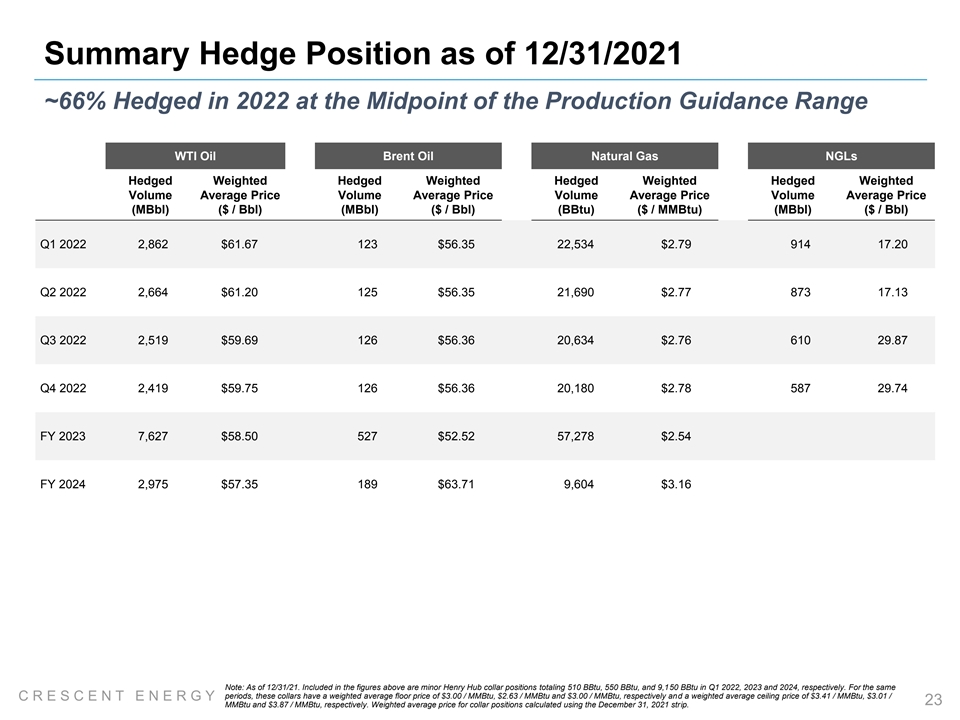
Summary Hedge Position as of 12/31/2021 ~66% Hedged in 2022 at the Midpoint of the Production Guidance Range WTI Oil Brent Oil Natural Gas NGLs Hedged Weighted Hedged Weighted Hedged Weighted Hedged Weighted Volume Average Price Volume Average Price Volume Average Price Volume Average Price (MBbl) ($ / Bbl) (MBbl) ($ / Bbl) (BBtu) ($ / MMBtu) (MBbl) ($ / Bbl) Q1 2022 2,862 $61.67 123 $56.35 22,534 $2.79 914 17.20 Q2 2022 2,664 $61.20 125 $56.35 21,690 $2.77 873 17.13 Q3 2022 2,519 $59.69 126 $56.36 20,634 $2.76 610 29.87 Q4 2022 2,419 $59.75 126 $56.36 20,180 $2.78 587 29.74 FY 2023 7,627 $58.50 527 $52.52 57,278 $2.54 FY 2024 2,975 $57.35 189 $63.71 9,604 $3.16 Note: As of 12/31/21. Included in the figures above are minor Henry Hub collar positions totaling 510 BBtu, 550 BBtu, and 9,150 BBtu in Q1 2022, 2023 and 2024, respectively. For the same periods, these collars have a weighted average floor price of $3.00 / MMBtu, $2.63 / MMBtu and $3.00 / MMBtu, respectively and a weighted average ceiling price of $3.41 / MMBtu, $3.01 / C R E S C E N T E N E R G Y 23 MMBtu and $3.87 / MMBtu, respectively. Weighted average price for collar positions calculated using the December 31, 2021 strip.
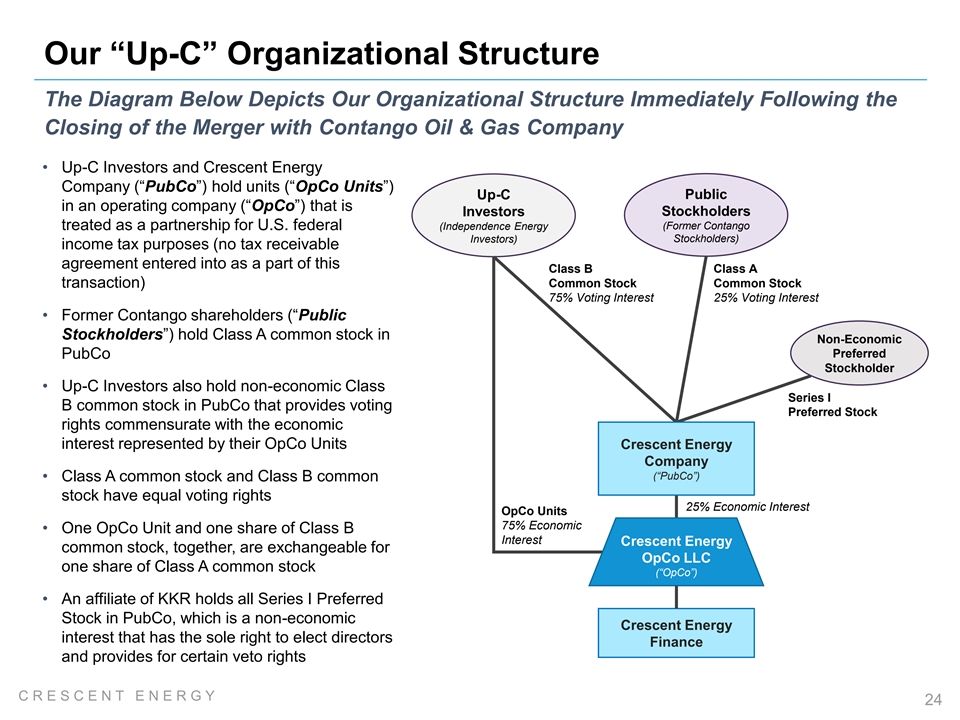
Our “Up-C” Organizational Structure The Diagram Below Depicts Our Organizational Structure Immediately Following the Closing of the Merger with Contango Oil & Gas Company • Up-C Investors and Crescent Energy Company (“PubCo”) hold units (“OpCo Units”) Public Up-C in an operating company (“OpCo”) that is Investors Stockholders (Former Contango treated as a partnership for U.S. federal (Independence Energy Investors) Stockholders) income tax purposes (no tax receivable agreement entered into as a part of this Class B Class A transaction) Common Stock Common Stock 75% Voting Interest 25% Voting Interest • Former Contango shareholders (“Public Stockholders”) hold Class A common stock in Non-Economic Preferred PubCo Stockholder • Up-C Investors also hold non-economic Class Series I B common stock in PubCo that provides voting Preferred Stock rights commensurate with the economic interest represented by their OpCo Units Crescent Energy Company (“PubCo”) • Class A common stock and Class B common stock have equal voting rights 25% Economic Interest OpCo Units 75% Economic • One OpCo Unit and one share of Class B Interest Crescent Energy common stock, together, are exchangeable for OpCo LLC one share of Class A common stock (“OpCo”) • An affiliate of KKR holds all Series I Preferred Stock in PubCo, which is a non-economic Crescent Energy interest that has the sole right to elect directors Finance and provides for certain veto rights C R E S C E N T E N E R G Y 24
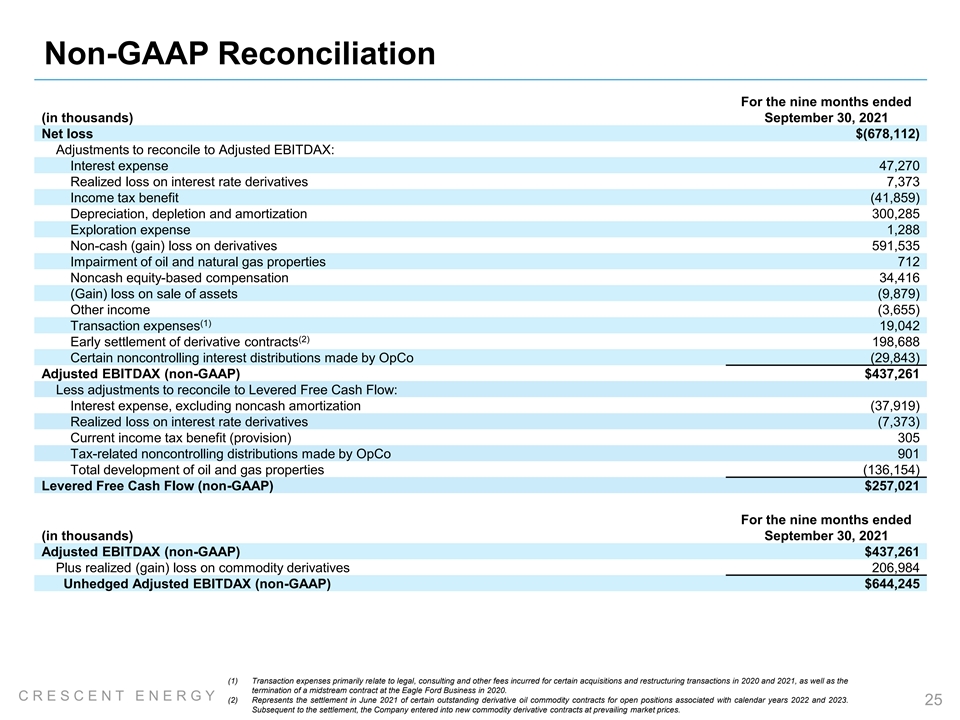
Non-GAAP Reconciliation For the nine months ended (in thousands) September 30, 2021 Net loss $(678,112) Adjustments to reconcile to Adjusted EBITDAX: Interest expense 47,270 Realized loss on interest rate derivatives 7,373 Income tax benefit (41,859) Depreciation, depletion and amortization 300,285 Exploration expense 1,288 Non-cash (gain) loss on derivatives 591,535 Impairment of oil and natural gas properties 712 Noncash equity-based compensation 34,416 (Gain) loss on sale of assets (9,879) Other income (3,655) (1) Transaction expenses 19,042 (2) Early settlement of derivative contracts 198,688 Certain noncontrolling interest distributions made by OpCo (29,843) Adjusted EBITDAX (non-GAAP) $437,261 Less adjustments to reconcile to Levered Free Cash Flow: Interest expense, excluding noncash amortization (37,919) Realized loss on interest rate derivatives (7,373) Current income tax benefit (provision) 305 Tax-related noncontrolling distributions made by OpCo 901 Total development of oil and gas properties (136,154) Levered Free Cash Flow (non-GAAP) $257,021 For the nine months ended (in thousands) September 30, 2021 Adjusted EBITDAX (non-GAAP) $437,261 Plus realized (gain) loss on commodity derivatives 206,984 Unhedged Adjusted EBITDAX (non-GAAP) $644,245 (1) Transaction expenses primarily relate to legal, consulting and other fees incurred for certain acquisitions and restructuring transactions in 2020 and 2021, as well as the termination of a midstream contract at the Eagle Ford Business in 2020. C R E S C E N T E N E R G Y (2) Represents the settlement in June 2021 of certain outstanding derivative oil commodity contracts for open positions associated with calendar years 2022 and 2023. 25 Subsequent to the settlement, the Company entered into new commodity derivative contracts at prevailing market prices.

Stay Connected. Emily Newport [email protected] 600 Travis Street Suite 7200 Houston, Texas 77002 + 1 (713) 332-7001 www.crescentenergyco.com