
Corsair Gaming Reports Strong First Quarter 2025 Growth in Revenue,
EBITDA and Gross Margin
Global Manufacturing Strategy Limits Tariff Exposure
MILPITAS, CA, May 6, 2025 – Corsair Gaming, Inc. (Nasdaq: CRSR) (“Corsair” or the “Company”), a leading global provider and innovator of high-performance products for gamers, streamers, content-creators, and gaming PC builders, today announced financial results for the first quarter ended March 31, 2025.
First Quarter 2025 Select Financial Metrics
•Net revenue was $369.8 million compared to $337.3 million in the first quarter of 2024, led by continued growth in the Gamer and Creator Peripherals segment and a rebound in growth in the Gaming Components and Systems segment.
•Gamer and Creator Peripherals segment net revenue was $112.0 million compared to $107.0 million in the first quarter of 2024. Gaming Components and Systems segment net revenue was $257.8 million compared to $230.3 million in the first quarter of 2024.
•Net loss attributable to common shareholders was $10.1 million, or net loss of $0.10 per diluted share, compared to a net loss of $12.5 million, or net loss of $0.12 per diluted share, in the first quarter of 2024.
•Adjusted net income was $12.3 million, or net income of $0.11 per diluted share, compared to adjusted net income of $9.5 million, or net income of $0.09 per diluted share, in the first quarter of 2024.
•Adjusted EBITDA was $22.6 million, compared to $18.0 million for the first quarter of 2024.
•Cash and restricted cash was $102.5 million as of March 31, 2025.
Definitions of the non-GAAP financial measures used in this press release and reconciliations of such measures to their nearest GAAP equivalents are included below under the heading “Use and Reconciliation of Non-GAAP Financial Measures.”
Andy Paul, Chief Executive Officer of Corsair, stated, “We met our revenue and earnings targets for Q1, reflecting strong execution across the business, with continued growth in the Gamer and Creator Peripherals segment and a rebound in growth in the Gaming Components and Systems segment. One of the key milestones this quarter was the successful initial integration of Fanatec into Corsair, including our website, e-commerce systems, enterprise resource planning, supply chain, and customer support infrastructure. Consumers have responded enthusiastically to the improved product availability, enhanced customer service and better overall experience. We’re excited to bring Fanatec products to key specialist retailers in Q2, further expanding our reach in the enthusiast gaming market and driving incremental revenue growth.”
“Looking ahead to Q2, we expect continued year over year growth in the self-built PC market as GPU availability improves, barring any unexpected tariff-related disruptions and barring any consumer slowdown, which could follow from generally higher prices on other consumer goods. We have proactively built substantial inventory in-country and, based on what we know today, we do not anticipate major tariffs on the core processing components of gaming PCs, including CPUs and GPUs. If that holds, we see no significant barriers to continued momentum in gaming PC builds, especially given the aging GPU install base of 3 to 5 years in systems for a significant portion of our customer base. While casual gaming purchases may soften in a broader economic slowdown, we believe our enthusiast-level products, including high-performance keyboards, mice, and headsets, will remain resilient. Growth in non-China Asia continues to be strong, with increased investment in Japan, South Korea, and other important markets.
“Finally, we are also starting to see the benefits of AI across our business. Elgato is already shipping AI-enhanced tools like the AI Prompter and AI Wavelink with AiCoustic, and our customer support team is leveraging AI-driven knowledge base systems. We expect AI to be an even more significant growth driver for us as it impacts every aspect of game creation and play.”
Thi La, President and future Chief Executive Officer of Corsair as of July 1, 2025, stated, “Roughly 45% of our business is in the U.S. Based on current tariff policies, and using our Q125 product mix, approximately 80% of our product sales in the U.S. are excluded from tariffs or have tariff rates of 10% or less. In Q1, only 19% of our U.S. imports were sourced from China, and this number is expected to drop during this year. Our supply chain is highly adaptable, and we have the flexibility to shift manufacturing to alternative locations within two to four quarters if needed.”
Michael G. Potter, Chief Financial Officer of Corsair, stated, “We are pleased with the continued improvement in our first quarter performance, particularly the expansion in margins, which reflects our disciplined execution and focus on operational efficiency. From a financial standpoint, we have taken meaningful steps to further strengthen our balance sheet, including reducing debt and enhancing liquidity, which provides us with increased flexibility and resilience in the face of broader market volatility. These improvements not only reinforce our strong financial position but also enable us to strategically invest in innovation and pursue long-term growth opportunities that we believe will build meaningful value for shareholders.”
Given the current uncertainty stemming from newly announced tariffs, and the potential for further tariffs and retaliatory measures, we are not reaffirming our full-year 2025 guidance at this time. However, if current conditions hold, we remain on track to achieve the guidance originally issued on February 12, 2025. We intend to provide an updated outlook later this year as visibility improves.
The information provided above is based on Corsair’s current estimates and is not a guarantee of future performance. These statements are forward-looking and actual results may differ materially. Refer to the “Forward-Looking Statements” section below for information on the factors that could cause Corsair’s actual results to differ materially from these forward-looking statements.
Recent Developments
•Power supplies designed for NVIDIA high power GPU cards. With dual 12V-2x6 cables and fully modular cabling, Corsair’s HXi Series platinum power supplies have every connection needed to power today’s most demanding PC upgrades, including the latest, most powerful GPUs, the NVIDIA® RTX 50 series and AMD® 9070 series graphics cards. A new dual-color connector provides visual confirmation of a secure connection, offering additional peace of mind for PC builders.
•Expanded Custom labs platform: Launched in 2024, Corsair’s innovative platform empowers gamers to personalize gaming peripherals to create a setup that reflects their unique style and preferences. This includes recent expanded options with the award-winning Call of Duty and Starfield franchises across multiple product categories at Corsair including Drop, Elgato, ORIGIN PC and SCUF Gaming. Peter Moreo was recently hired as Custom Solutions VP responsible for forging new marketing partnerships and further expanding Corsair’s custom offerings, as the company continues to build upon its differentiated position with leading brands and gaming enthusiasts.
•Porsche launches with Fanatec: The officially licensed CSL Elite Steering Wheel Porsche Vision GT features an intuitive input layout, premium materials and exceptional craftsmanship. Suitable for the full range of Fanatec bases. This is the first steering wheel to use Fanatec’s new Tactaris material, a premium microfiber fabric that enhances durability, comfort, and handling.
Conference Call and Webcast Information
Corsair will host a conference call to discuss the first quarter 2025 financial results today at 2:00 p.m. Pacific Time. The conference call will be accessible on Corsair’s Investor Relations website at https://ir.corsair.com, or by dialing 1-844-676-2245 (USA) or 1-412-634-6652 (International) with conference ID 10198678. A replay will be available approximately 3 hours after the live call ends on Corsair’s Investor Relations website, or through May 13, 2025 by dialing 1-844-512-2921 (USA) or 1-412-317-6671 (International), with passcode 10198678.
About Corsair Gaming
Corsair (Nasdaq: CRSR) is a leading global developer and manufacturer of high-performance products and technology for gamers, content creators, and PC enthusiasts. From award-winning PC components and peripherals to premium streaming equipment and smart ambient lighting, Corsair delivers a full ecosystem of products that work together to enable everyone, from casual gamers to committed professionals, to perform at their very best. Corsair also sells products under its Fanatec brand, the leading end-to-end premium Sim Racing product line; Elgato brand, which provides premium studio equipment and accessories for content creators; SCUF Gaming brand, which builds custom-designed controllers for competitive gamers; Drop, the leading community-driven mechanical keyboard brand; and ORIGIN PC brand, a builder of custom gaming and workstation desktop PCs.
Forward-Looking Statements
This press release contains express and implied forward-looking statements within the meaning of the Private Securities Litigation Reform Act of 1995, including, but not limited to, statements regarding the Company’s financial outlook for the full year 2025; market headwinds and tailwinds, including its expectations regarding the gaming market’s continued growth; new product launches, the entry into new product categories and demand for new products; the Company’s ability to successfully close and integrate acquisitions and expectations regarding the growth of these acquisitions as well as their estimated impact on the Company’s financial results in future periods and the size of markets and segments in the future. Forward-looking statements are based on our management’s beliefs, as well as assumptions made by, and information currently available to them. Because such statements are based on expectations as to future financial and operating results and are not statements of fact, actual results may differ materially from those projected. Factors which may cause actual results to differ materially from current expectations include, but are not limited to: the Company’s limited operating history, which makes it difficult to forecast the Company’s future results of operations; current macroeconomic conditions, including the impacts of high inflation and risk of recession, on demand for our products, consumer confidence and financial
markets generally; changes in trade regulations, policies, and agreements and the imposition of tariffs that affect our products or operations, including potential new tariffs that may be imposed on U.S. imports and our ability to mitigate; the Company’s ability to build and maintain the strength of the Company’s brand among gaming and streaming enthusiasts and ability to continuously develop and successfully market new products and improvements to existing products; the introduction and success of new third-party high-performance computer hardware, particularly graphics processing units and central processing units as well as sophisticated new video games; fluctuations in operating results; the loss or inability to attract and retain key management; the impacts from geopolitical events and unrest; delays or disruptions at the Company or third-parties’ manufacturing and distribution facilities; and the other factors described under the heading “Risk Factors” in our Annual Report on Form 10-K for the year ended December 31, 2024 filed with the Securities and Exchange Commission (“SEC”) and our subsequent filings with the SEC. All forward-looking statements reflect our beliefs and assumptions only as of the date of this press release. We undertake no obligation to update forward-looking statements to reflect future events or circumstances. Our results for the quarter ended March 31, 2025 are also not necessarily indicative of our operating results for any future periods.
Use and Reconciliation of Non-GAAP Financial Measures
To supplement the financial results presented in accordance with GAAP, this earnings release presents certain non-GAAP financial information, including adjusted operating income (loss), adjusted net income (loss), adjusted net income (loss) per diluted share and adjusted EBITDA. These are important financial performance measures for us, but are not financial measures as defined by GAAP. The presentation of this non-GAAP financial information is not intended to be considered in isolation of or as a substitute for, or superior to, the financial information prepared and presented in accordance with GAAP.
We use adjusted operating income (loss), adjusted net income (loss), adjusted net income (loss) per share and adjusted EBITDA to evaluate our operating performance and trends and make planning decisions. We believe that these non-GAAP financial measures help identify underlying trends in our business that could otherwise be masked by the effect of the expenses and other items that we exclude in such non-GAAP measures. Accordingly, we believe that these non-GAAP financial measures provide useful information to investors and others in understanding and evaluating our operating results, enhancing the overall understanding of our past performance and future prospects, and allowing for greater transparency with respect to the key financial metrics used by our management in our financial and operational decision-making. We also present these non-GAAP financial measures because we believe investors, analysts and rating agencies consider it useful in measuring our ability to meet our debt service obligations.
Our use of these terms may vary from that of others in our industry. These non-GAAP financial measures should not be considered as an alternative to net revenue, operating income (loss), net income (loss), cash provided by operating activities, or any other measures derived in accordance with GAAP as measures of operating performance or liquidity. Reconciliations of these measures to the most directly comparable GAAP financial measures are presented in the attached schedules.
We calculate these non-GAAP financial measures as follows:
•Adjusted operating income (loss), non-GAAP, is determined by adding back to GAAP operating income (loss), the impact from amortization, stock-based compensation, one-time costs related to legal and other matters, acquisition and related integration costs, restructuring and other charges, and acquisition accounting impact related to recognizing acquired inventory at fair value.
•Adjusted net income (loss), non-GAAP, excludes the impact from amortization, stock-based compensation, one-time costs related to legal and other matters, acquisition and related
integration costs, restructuring and other charges, acquisition accounting impact related to recognizing acquired inventory at fair value and the reversal of bargain purchase gain on business acquisition recognized in prior year, as well as the related tax effects of each of these adjustments.
•Adjusted net income (loss) per diluted share, non-GAAP, is determined by dividing adjusted net income (loss), non-GAAP by the respective weighted average shares outstanding, inclusive of the impact of other dilutive securities.
•Adjusted EBITDA excludes the impact from amortization, stock-based compensation, one-time costs related to legal and other matters, depreciation, interest expense, net, acquisition and related integration costs, restructuring and other charges, acquisition accounting impact related to recognizing acquired inventory at fair value, and the reversal of bargain purchase gain on business acquisition recognized in prior year, and tax expense (benefit).
We encourage investors and others to review our financial information in its entirety, not to rely on any single financial measure and to view these non-GAAP financial measures in conjunction with the related GAAP financial measures.
Corsair Gaming, Inc.
Condensed Consolidated Statements of Operations
(Unaudited, in thousands, except per share amounts)
|
|
|
|
|
|
|
|
|
|
|
Three Months Ended
March 31, |
|
|
|
2025 |
|
|
2024 |
|
|
|
|
|
|
|
|
Net revenue |
|
$ |
369,750 |
|
|
$ |
337,257 |
|
Cost of revenue |
|
|
267,388 |
|
|
|
250,618 |
|
Gross profit |
|
|
102,362 |
|
|
|
86,639 |
|
Operating expenses: |
|
|
|
|
|
|
Sales, general and administrative |
|
|
86,992 |
|
|
|
80,217 |
|
Product development |
|
|
17,633 |
|
|
|
16,641 |
|
Total operating expenses |
|
|
104,625 |
|
|
|
96,858 |
|
Operating loss |
|
|
(2,263 |
) |
|
|
(10,219 |
) |
Other (expense) income: |
|
|
|
|
|
|
Interest expense |
|
|
(2,676 |
) |
|
|
(3,691 |
) |
Interest income |
|
|
630 |
|
|
|
1,565 |
|
Other expense, net |
|
|
(3,947 |
) |
|
|
(461 |
) |
Total other expense, net |
|
|
(5,993 |
) |
|
|
(2,587 |
) |
Loss before income taxes |
|
|
(8,256 |
) |
|
|
(12,806 |
) |
Income tax benefit (expense) |
|
|
(2,061 |
) |
|
|
1,777 |
|
Net loss |
|
|
(10,317 |
) |
|
|
(11,029 |
) |
Less: Net income attributable to noncontrolling interest |
|
|
142 |
|
|
|
536 |
|
Net loss attributable to Corsair Gaming, Inc. |
|
$ |
(10,459 |
) |
|
$ |
(11,565 |
) |
|
|
|
|
|
|
|
Calculation of net loss per share attributable to common stockholders of Corsair Gaming, Inc.: |
|
|
|
|
|
|
Net loss attributable to Corsair Gaming, Inc. |
|
$ |
(10,459 |
) |
|
$ |
(11,565 |
) |
Change in redemption value of redeemable noncontrolling interest |
|
|
392 |
|
|
|
(975 |
) |
Net loss attributable to common stockholders of Corsair Gaming, Inc. |
|
$ |
(10,067 |
) |
|
$ |
(12,540 |
) |
|
|
|
|
|
|
|
Net loss per share attributable to common stockholders of Corsair Gaming, Inc.: |
|
|
|
|
|
|
Basic |
|
$ |
(0.10 |
) |
|
$ |
(0.12 |
) |
Diluted |
|
$ |
(0.10 |
) |
|
$ |
(0.12 |
) |
Weighted-average common shares outstanding: |
|
|
|
|
|
|
Basic |
|
|
105,240 |
|
|
|
103,563 |
|
Diluted |
|
|
105,240 |
|
|
|
103,563 |
|
Corsair Gaming, Inc.
Segment Information
(Unaudited, in thousands, except percentages)
|
|
|
|
|
|
|
|
|
|
|
Three Months Ended
March 31, |
|
|
|
2025 |
|
|
2024 |
|
|
|
|
|
|
|
|
Net revenue: |
|
|
|
|
|
|
Gamer and Creator Peripherals |
|
$ |
111,973 |
|
|
$ |
106,973 |
|
Gaming Components and Systems |
|
|
257,777 |
|
|
|
230,284 |
|
Total Net revenue |
|
$ |
369,750 |
|
|
$ |
337,257 |
|
|
|
|
|
|
|
|
Gross Profit: |
|
|
|
|
|
|
Gamer and Creator Peripherals |
|
$ |
46,414 |
|
|
$ |
43,643 |
|
Gaming Components and Systems |
|
|
55,948 |
|
|
|
42,996 |
|
Total Gross Profit |
|
$ |
102,362 |
|
|
$ |
86,639 |
|
|
|
|
|
|
|
|
Gross Margin: |
|
|
|
|
|
|
Gamer and Creator Peripherals |
|
|
41.5 |
% |
|
|
40.8 |
% |
Gaming Components and Systems |
|
|
21.7 |
% |
|
|
18.7 |
% |
Total Gross Margin |
|
|
27.7 |
% |
|
|
25.7 |
% |
Corsair Gaming, Inc.
Condensed Consolidated Balance Sheets
(Unaudited, in thousands)
|
|
|
|
|
|
|
|
|
|
|
March 31,
2025 |
|
|
December 31,
2024 |
|
|
|
|
|
|
|
|
Assets |
|
|
|
|
|
|
Current assets: |
|
|
|
|
|
|
Cash and restricted cash |
|
$ |
102,282 |
|
|
$ |
109,385 |
|
Accounts receivable, net |
|
|
219,216 |
|
|
|
218,648 |
|
Inventories |
|
|
276,837 |
|
|
|
259,979 |
|
Prepaid expenses and other current assets |
|
|
35,024 |
|
|
|
35,376 |
|
Total current assets |
|
|
633,359 |
|
|
|
623,388 |
|
Restricted cash, noncurrent |
|
|
247 |
|
|
|
246 |
|
Property and equipment, net |
|
|
28,448 |
|
|
|
29,742 |
|
Goodwill |
|
|
355,002 |
|
|
|
354,222 |
|
Intangible assets, net |
|
|
154,943 |
|
|
|
164,319 |
|
Other assets |
|
|
67,458 |
|
|
|
63,912 |
|
Total assets |
|
$ |
1,239,457 |
|
|
$ |
1,235,829 |
|
Liabilities |
|
|
|
|
|
|
Current liabilities: |
|
|
|
|
|
|
Debt maturing within one year, net |
|
$ |
12,267 |
|
|
$ |
12,229 |
|
Accounts payable |
|
|
240,114 |
|
|
|
207,215 |
|
Other liabilities and accrued expenses |
|
|
164,800 |
|
|
|
176,869 |
|
Total current liabilities |
|
|
417,181 |
|
|
|
396,313 |
|
Long-term debt, net |
|
|
136,391 |
|
|
|
161,310 |
|
Deferred tax liabilities |
|
|
7,360 |
|
|
|
7,379 |
|
Other liabilities, noncurrent |
|
|
55,233 |
|
|
|
51,375 |
|
Total liabilities |
|
|
616,165 |
|
|
|
616,377 |
|
Temporary equity |
|
|
|
|
|
|
Redeemable noncontrolling interest |
|
|
14,535 |
|
|
|
15,149 |
|
Stockholders' equity |
|
|
|
|
|
|
Common stock and additional paid-in capital |
|
|
680,027 |
|
|
|
667,627 |
|
Accumulated deficit |
|
|
(68,832 |
) |
|
|
(58,765 |
) |
Accumulated other comprehensive loss |
|
|
(2,438 |
) |
|
|
(4,559 |
) |
Total stockholders' equity |
|
|
608,757 |
|
|
|
604,303 |
|
Total liabilities, temporary equity and stockholders' equity |
|
$ |
1,239,457 |
|
|
$ |
1,235,829 |
|
Corsair Gaming, Inc.
Condensed Consolidated Statements of Cash Flows
(Unaudited, in thousands)
|
|
|
|
|
|
|
|
|
|
|
Three Months Ended
March 31, |
|
|
|
2025 |
|
|
2024 |
|
|
|
|
|
|
|
|
Cash flows from operating activities: |
|
|
|
|
|
|
Net loss |
|
$ |
(10,317 |
) |
|
$ |
(11,029 |
) |
Adjustments to reconcile net loss to net cash provided by (used in) operating activities: |
|
|
|
|
|
|
Stock-based compensation |
|
|
9,322 |
|
|
|
7,691 |
|
Depreciation |
|
|
3,373 |
|
|
|
3,087 |
|
Amortization |
|
|
9,782 |
|
|
|
9,515 |
|
Reversal of bargain purchase gain on business acquisition recognized in prior year |
|
|
2,581 |
|
|
|
— |
|
Deferred income taxes |
|
|
(1,016 |
) |
|
|
(6,059 |
) |
Other |
|
|
3,031 |
|
|
|
758 |
|
Changes in operating assets and liabilities: |
|
|
|
|
|
|
Accounts receivable |
|
|
201 |
|
|
|
46,928 |
|
Inventories |
|
|
(22,237 |
) |
|
|
(12,101 |
) |
Prepaid expenses and other assets |
|
|
2,247 |
|
|
|
4,437 |
|
Accounts payable |
|
|
34,253 |
|
|
|
(47,962 |
) |
Other liabilities and accrued expenses |
|
|
(12,470 |
) |
|
|
(21,582 |
) |
Net cash provided by (used in) operating activities |
|
|
18,750 |
|
|
|
(26,317 |
) |
Cash flows from investing activities: |
|
|
|
|
|
|
Purchase of property and equipment |
|
|
(3,072 |
) |
|
|
(2,520 |
) |
Purchase price adjustment related to business acquisition |
|
|
— |
|
|
|
1,041 |
|
Net cash used in investing activities |
|
|
(3,072 |
) |
|
|
(1,479 |
) |
Cash flows from financing activities: |
|
|
|
|
|
|
Repayment of debt |
|
|
(25,000 |
) |
|
|
(15,000 |
) |
Payment of deferred and contingent consideration |
|
|
— |
|
|
|
(4,942 |
) |
Proceeds from issuance of shares through employee equity incentive plans |
|
|
3,440 |
|
|
|
2,351 |
|
Payment of taxes related to net share settlement of equity awards |
|
|
(390 |
) |
|
|
(398 |
) |
Dividend paid to noncontrolling interest |
|
|
(304 |
) |
|
|
(1,960 |
) |
Net cash used in financing activities |
|
|
(22,254 |
) |
|
|
(19,949 |
) |
Effect of exchange rate changes on cash |
|
|
(526 |
) |
|
|
(636 |
) |
Net decrease in cash and restricted cash |
|
|
(7,102 |
) |
|
|
(48,381 |
) |
Cash and restricted cash at the beginning of the period |
|
|
109,631 |
|
|
|
178,564 |
|
Cash and restricted cash at the end of the period |
|
$ |
102,529 |
|
|
$ |
130,183 |
|
Corsair Gaming, Inc.
GAAP to Non-GAAP Reconciliations
Non-GAAP Operating Income Reconciliations
(Unaudited, in thousands, except percentages)
|
|
|
|
|
|
|
|
|
|
|
Three Months Ended
March 31, |
|
|
|
2025 |
|
|
2024 |
|
|
|
|
|
|
|
|
Operating Loss - GAAP |
|
$ |
(2,263 |
) |
|
$ |
(10,219 |
) |
Amortization |
|
|
9,782 |
|
|
|
9,515 |
|
Stock-based compensation |
|
|
9,322 |
|
|
|
7,691 |
|
One-time costs related to legal and other matters |
|
|
— |
|
|
|
6,414 |
|
Acquisition and related integration costs |
|
|
2,185 |
|
|
|
702 |
|
Restructuring and other charges |
|
|
1,095 |
|
|
|
1,126 |
|
Acquisition accounting impact related to recognizing acquired inventory at fair value |
|
|
515 |
|
|
|
169 |
|
Adjusted Operating Income - Non-GAAP |
|
$ |
20,636 |
|
|
$ |
15,398 |
|
|
|
|
|
|
|
|
As a % of net revenue - GAAP |
|
|
-0.6 |
% |
|
|
-3.0 |
% |
As a % of net revenue - Non-GAAP |
|
|
5.6 |
% |
|
|
4.6 |
% |
Corsair Gaming, Inc.
GAAP to Non-GAAP Reconciliations
Non-GAAP Net Income and Net Income Per Share Reconciliations
(Unaudited, in thousands, except per share amounts)
|
|
|
|
|
|
|
|
|
|
|
Three Months Ended
March 31, |
|
|
|
2025 |
|
|
2024 |
|
Net loss attributable to common stockholders of Corsair Gaming, Inc. (1) |
|
$ |
(10,067 |
) |
|
$ |
(12,540 |
) |
Less: Change in redemption value of redeemable noncontrolling interest |
|
|
392 |
|
|
|
(975 |
) |
Net loss attributable to Corsair Gaming, Inc. |
|
|
(10,459 |
) |
|
|
(11,565 |
) |
Add: Net income attributable to noncontrolling interest |
|
|
142 |
|
|
|
536 |
|
Net Loss - GAAP |
|
|
(10,317 |
) |
|
|
(11,029 |
) |
Adjustments: |
|
|
|
|
|
|
Amortization |
|
|
9,782 |
|
|
|
9,515 |
|
Stock-based compensation |
|
|
9,322 |
|
|
|
7,691 |
|
One-time costs related to legal and other matters |
|
|
— |
|
|
|
6,414 |
|
Acquisition and related integration costs |
|
|
2,185 |
|
|
|
702 |
|
Restructuring and other charges |
|
|
1,095 |
|
|
|
1,126 |
|
Acquisition accounting impact related to recognizing acquired inventory at fair value |
|
|
515 |
|
|
|
169 |
|
Reversal of bargain purchase gain on business acquisition recognized in prior year |
|
|
2,581 |
|
|
|
— |
|
Non-GAAP income tax adjustment |
|
|
(2,844 |
) |
|
|
(5,072 |
) |
Adjusted Net Income - Non-GAAP |
|
$ |
12,319 |
|
|
$ |
9,516 |
|
|
|
|
|
|
|
|
Diluted net income (loss) per share: |
|
|
|
|
|
|
GAAP |
|
$ |
(0.10 |
) |
|
$ |
(0.12 |
) |
Adjusted, Non-GAAP |
|
$ |
0.11 |
|
|
$ |
0.09 |
|
|
|
|
|
|
|
|
Weighted-average common shares outstanding - Diluted: |
|
|
|
|
|
|
GAAP |
|
|
105,240 |
|
|
|
103,563 |
|
Adjusted, Non-GAAP |
|
|
107,367 |
|
|
|
106,530 |
|
|
|
|
|
|
|
|
(1) Numerator for calculating net income (loss) per share-GAAP |
|
|
|
|
|
|
Corsair Gaming, Inc.
GAAP to Non-GAAP Reconciliations
Adjusted EBITDA Reconciliations
(Unaudited, in thousands, except percentages)
|
|
|
|
|
|
|
|
|
|
|
Three Months Ended
March 31, |
|
|
|
2025 |
|
|
2024 |
|
Net Loss - GAAP |
|
$ |
(10,317 |
) |
|
$ |
(11,029 |
) |
Amortization |
|
|
9,782 |
|
|
|
9,515 |
|
Stock-based compensation |
|
|
9,322 |
|
|
|
7,691 |
|
One-time costs related to legal and other matters |
|
|
— |
|
|
|
6,414 |
|
Depreciation |
|
|
3,373 |
|
|
|
3,087 |
|
Interest expense, net of interest income |
|
|
2,046 |
|
|
|
2,126 |
|
Acquisition and related integration costs |
|
|
2,185 |
|
|
|
702 |
|
Restructuring and other charges |
|
|
1,095 |
|
|
|
1,126 |
|
Acquisition accounting impact related to recognizing acquired inventory at fair value |
|
|
515 |
|
|
|
169 |
|
Reversal of bargain purchase gain on business acquisition recognized in prior year |
|
|
2,581 |
|
|
|
— |
|
Income tax (benefit) expense |
|
|
2,061 |
|
|
|
(1,777 |
) |
Adjusted EBITDA - Non-GAAP |
|
$ |
22,643 |
|
|
$ |
18,024 |
|
|
|
|
|
|
|
|
Adjusted EBITDA margin - Non-GAAP |
|
|
6.1 |
% |
|
|
5.3 |
% |
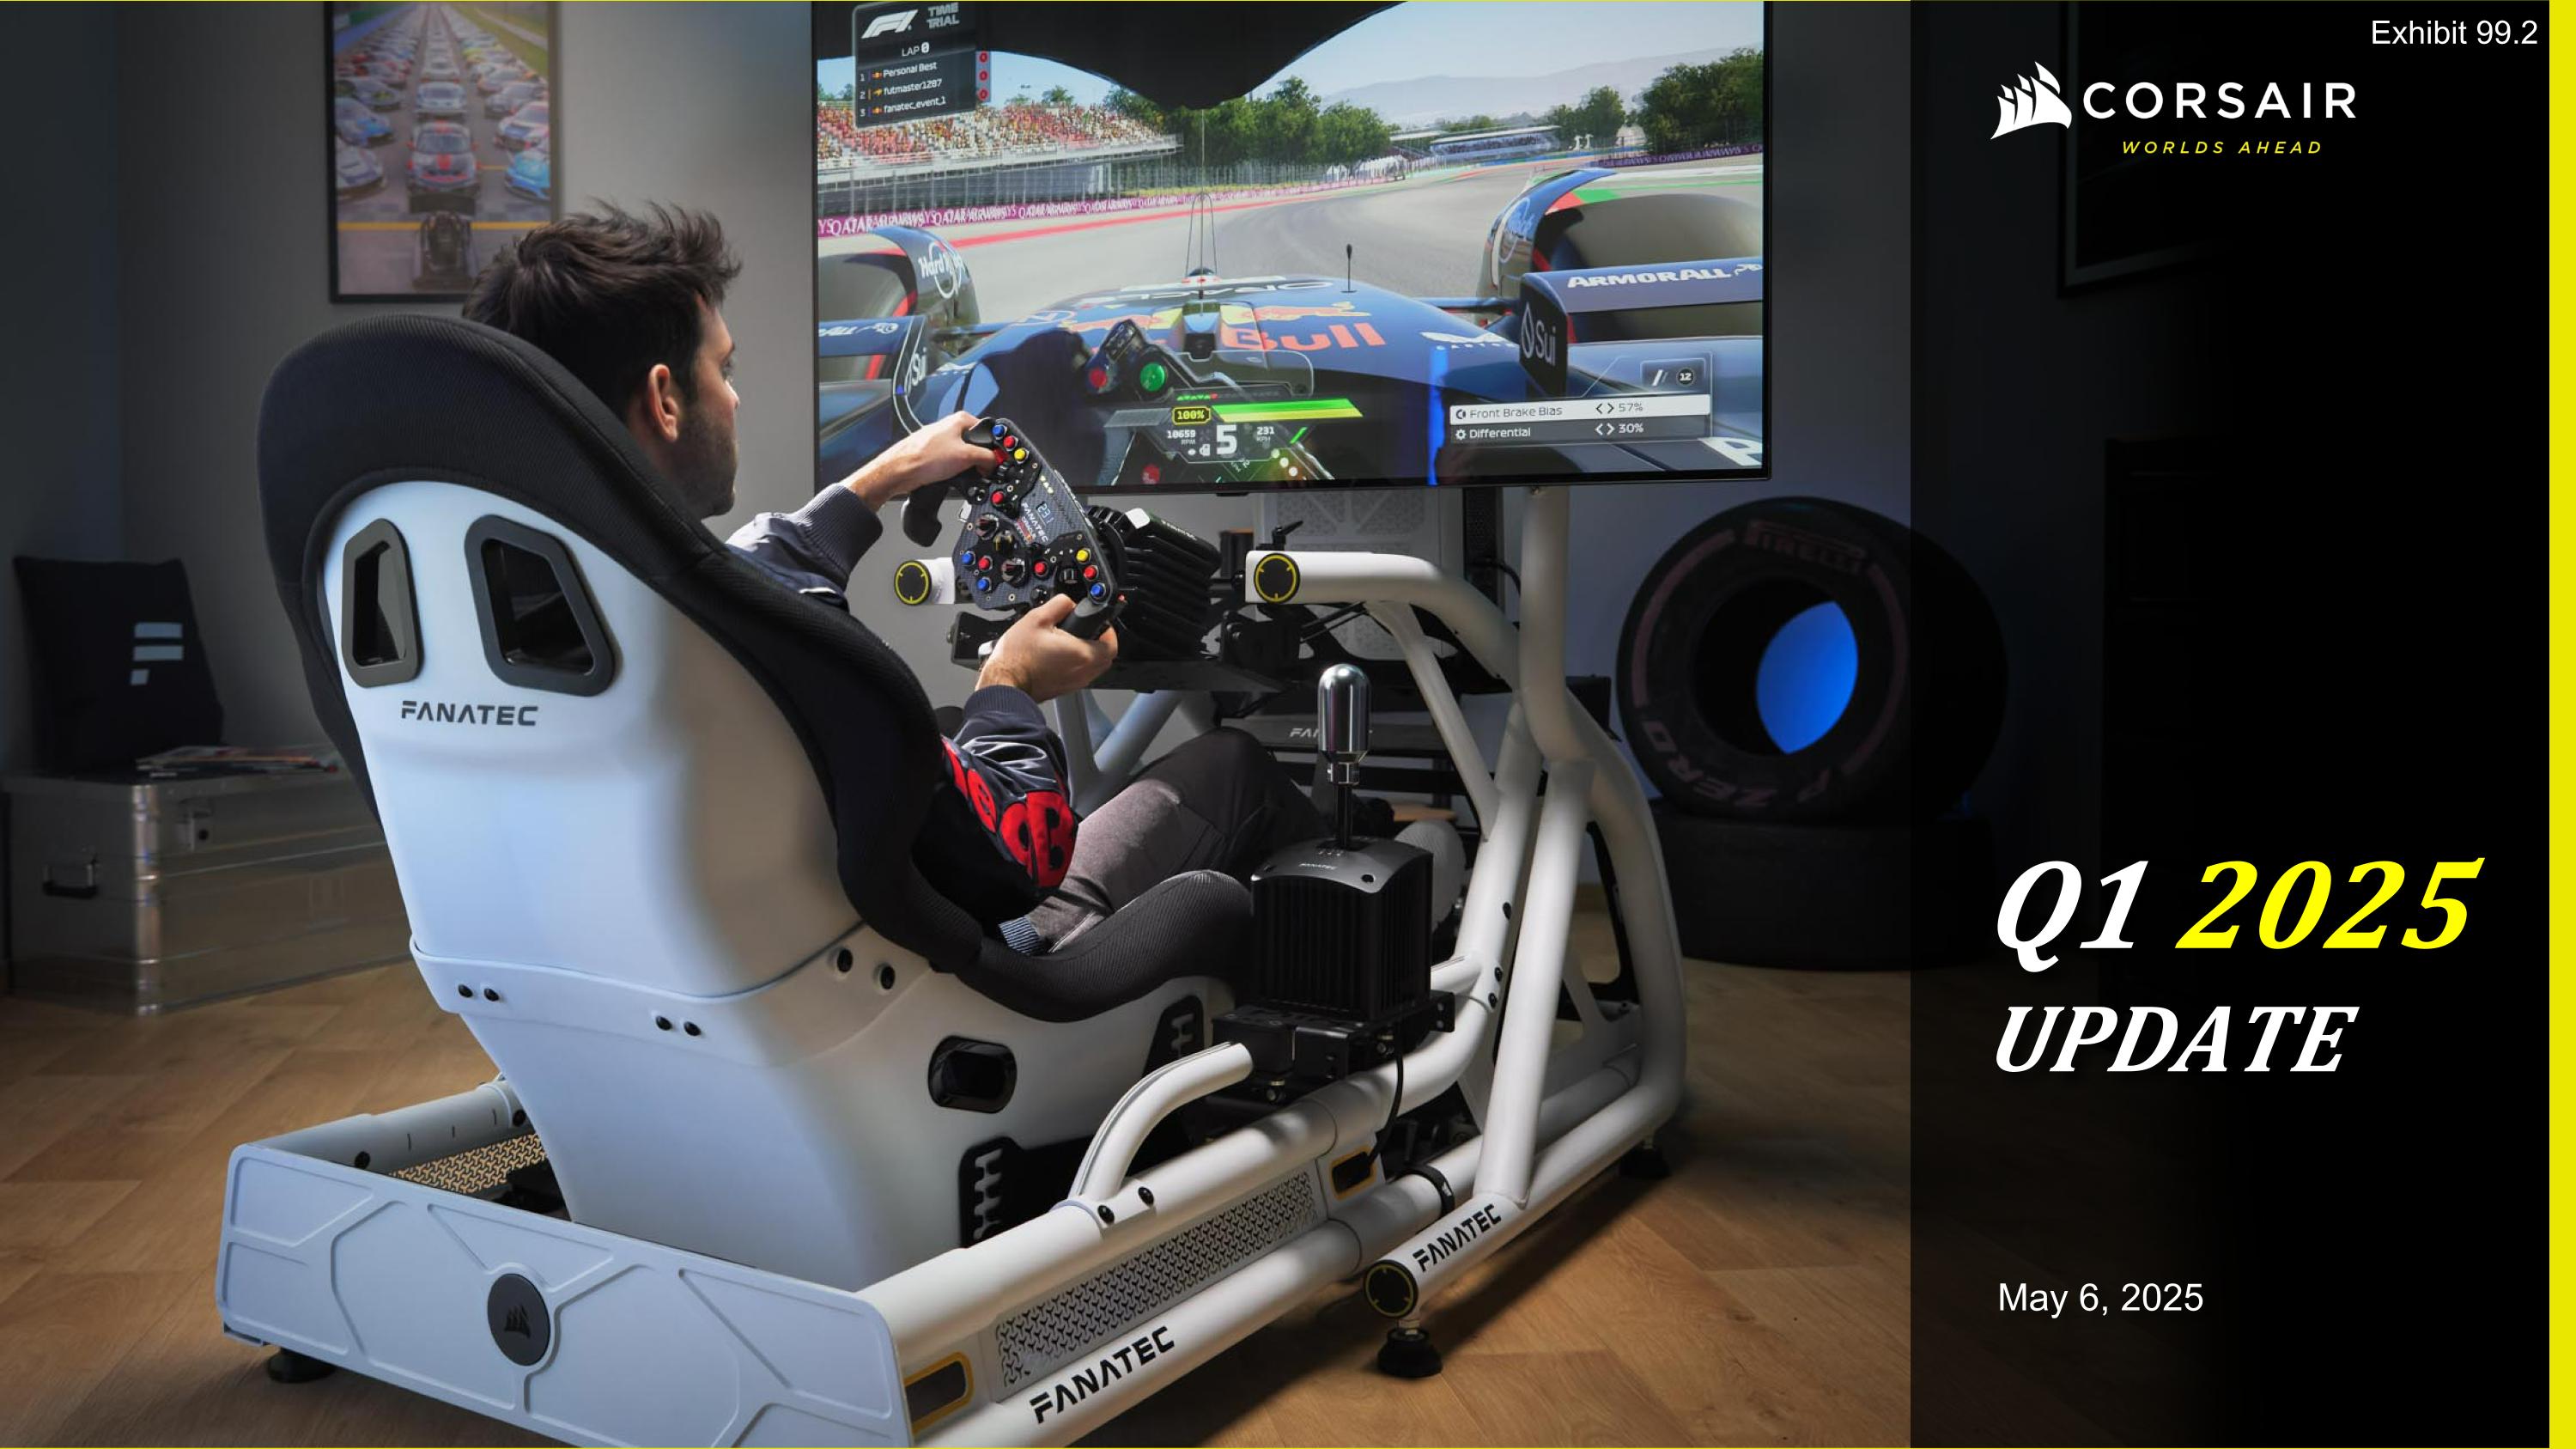
Q1 2025�UPDATE May 6, 2025 Exhibit 99.2
Forward Looking Statements�This presentation contains express and implied forward-looking statements within the meaning of the Private Securities Litigation Reform Act of 1995, including, but not limited to, statements regarding the Company’s financial outlook for the full year 2025; market headwinds and tailwinds, including its expectations regarding the gaming market’s continued growth; new product launches, the entry into new product categories and demand for new products; the Company’s ability to successfully close and integrate acquisitions and expectations regarding the growth of these acquisitions as well as their estimated impact on the Company’s financial results in future periods and the size of markets and segments in the future. Forward-looking statements are based on our management’s beliefs, as well as assumptions made by, and information currently available to them. Because such statements are based on expectations as to future financial and operating results and are not statements of fact, actual results may differ materially from those projected. Factors which may cause actual results to differ materially from current expectations include, but are not limited to: the Company’s limited operating history, which makes it difficult to forecast the Company’s future results of operations; current macroeconomic conditions, including the impacts of high inflation and risk of recession, on demand for our products, consumer confidence and financial markets generally; changes in trade regulations, policies, and agreements and the imposition of tariffs that affect our products or operations, including potential new tariffs that may be imposed on U.S. imports and our ability to mitigate; the Company’s ability to build and maintain the strength of the Company’s brand among gaming and streaming enthusiasts and ability to continuously develop and successfully market new products and improvements to existing products; the introduction and success of new third-party high-performance computer hardware, particularly graphics processing units and central processing units as well as sophisticated new video games; fluctuations in operating results; the loss or inability to attract and retain key management; the impacts from geopolitical events and unrest; delays or disruptions at the Company or third-parties’ manufacturing and distribution facilities; and the other factors described under the heading “Risk Factors” in our Annual Report on Form 10-K for the year ended December 31, 2024 filed with the Securities and Exchange Commission (“SEC”) and our subsequent filings with the SEC. All forward-looking statements reflect our beliefs and assumptions only as of the date of this press release. We undertake no obligation to update forward-looking statements to reflect future events or circumstances. Our results for the quarter ended March 31, 2025 are also not necessarily indicative of our operating results for any future periods. Non-GAAP Financial Measures�Included in this presentation are certain non-GAAP financial measures, including Adjusted Operating Income (Loss), Adjusted EBITDA, Adjusted EBITDA Margin, Adjusted Net Income (Loss) and Adjusted Net Earnings (Loss) Per Share, which are not recognized under the generally accepted accounting principles (“GAAP”) in the United States and designed to complement the financial information presented in accordance with GAAP in the United States because management believes such measures are useful to investors. The non-GAAP measures have limitations as analytical tools and you should not consider them in isolation of, or as an alternative to, measures prepared in accordance with U.S. GAAP. The non-GAAP measures used by the Company may differ from the non-GAAP measures used by other companies. The Company urges you to review the reconciliation of its non-GAAP financial measures to the most directly comparable U.S. GAAP financial measures set forth in the Appendix to this presentation, and not to rely on any single financial measure to evaluate the Company's business. Market & Industry Data�This presentation also contains estimates and other statistical data made by independent parties and by the Company relating to the Company’s industry, the Company’s business and the market for the Company’s products and its future growth. This data involves a number of assumptions and limitations, and you are cautioned not to give undue weight to such estimates. In addition, projections, assumptions, and estimates of the Company’s future performance and the future performance of the market for its products are necessarily subject to a high degree of uncertainty and risk. DISCLAIMER
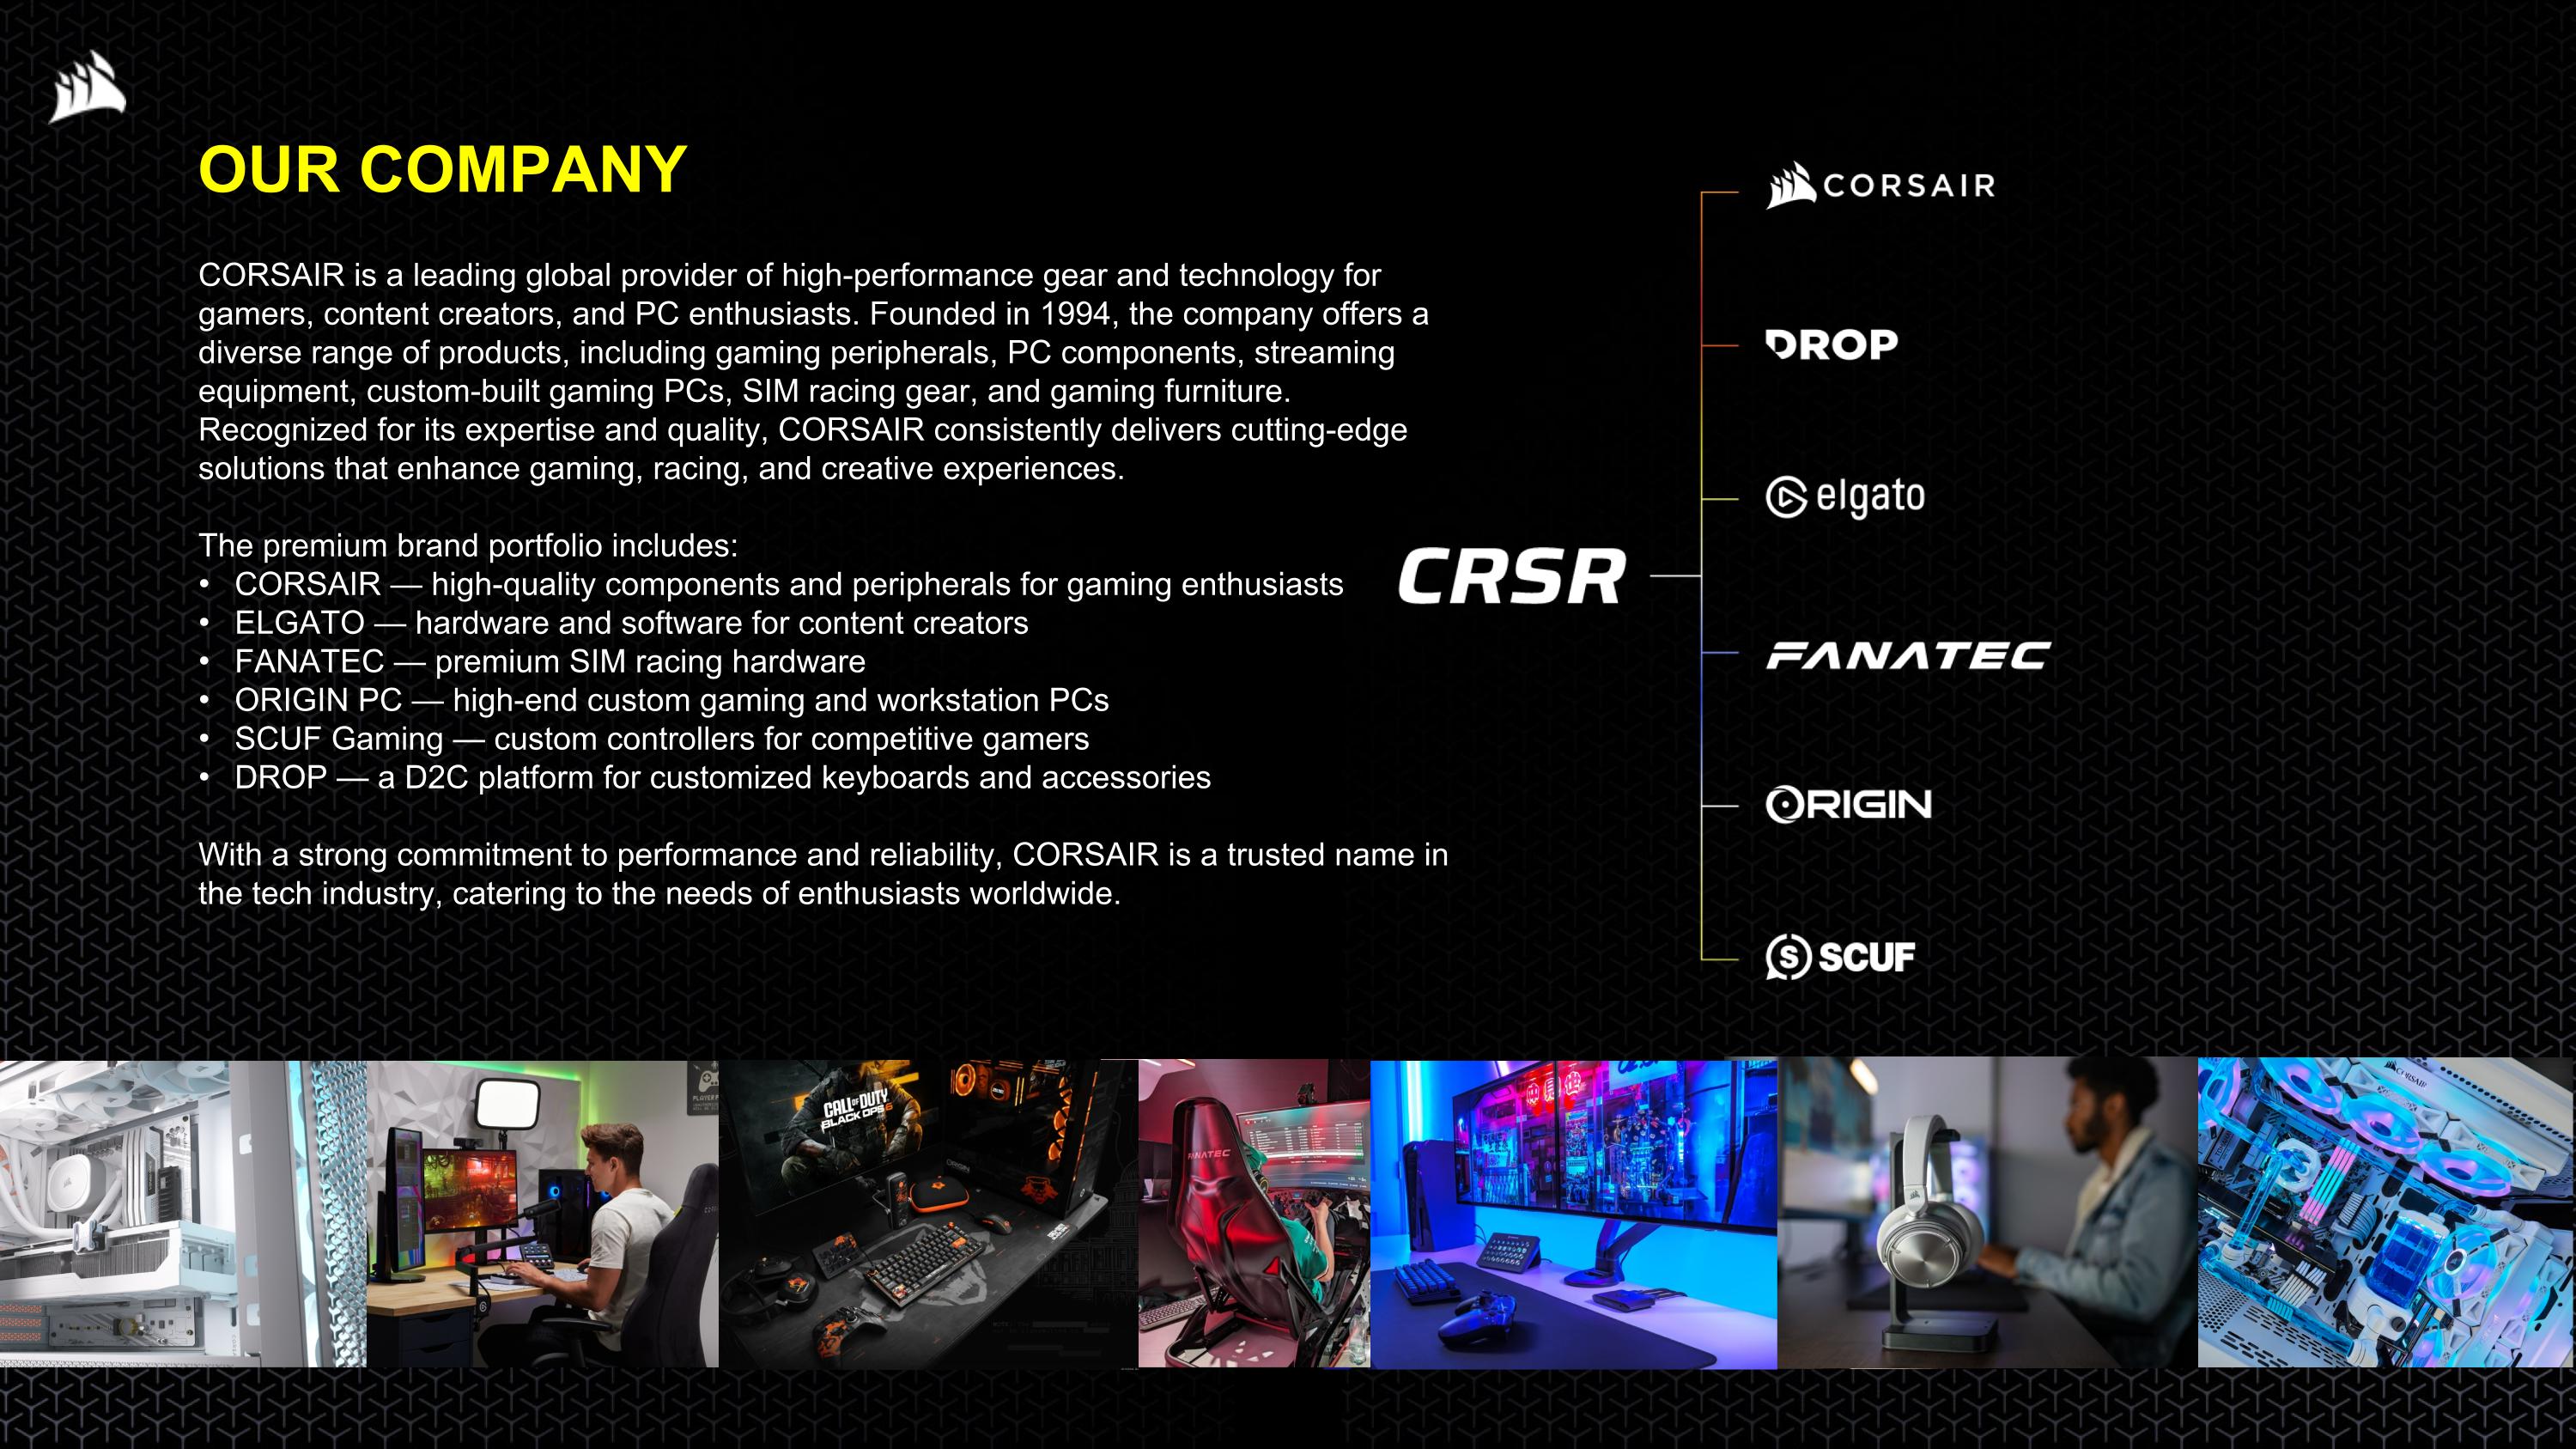
OUR COMPANY CORSAIR is a leading global provider of high-performance gear and technology for gamers, content creators, and PC enthusiasts. Founded in 1994, the company offers a diverse range of products, including gaming peripherals, PC components, streaming equipment, custom-built gaming PCs, SIM racing gear, and gaming furniture. Recognized for its expertise and quality, CORSAIR consistently delivers cutting-edge solutions that enhance gaming, racing, and creative experiences. The premium brand portfolio includes: CORSAIR — high-quality components and peripherals for gaming enthusiasts ELGATO — hardware and software for content creators FANATEC — premium SIM racing hardware ORIGIN PC — high-end custom gaming and workstation PCs SCUF Gaming — custom controllers for competitive gamers DROP — a D2C platform for customized keyboards and accessories With a strong commitment to performance and reliability, CORSAIR is a trusted name in the tech industry, catering to the needs of enthusiasts worldwide.
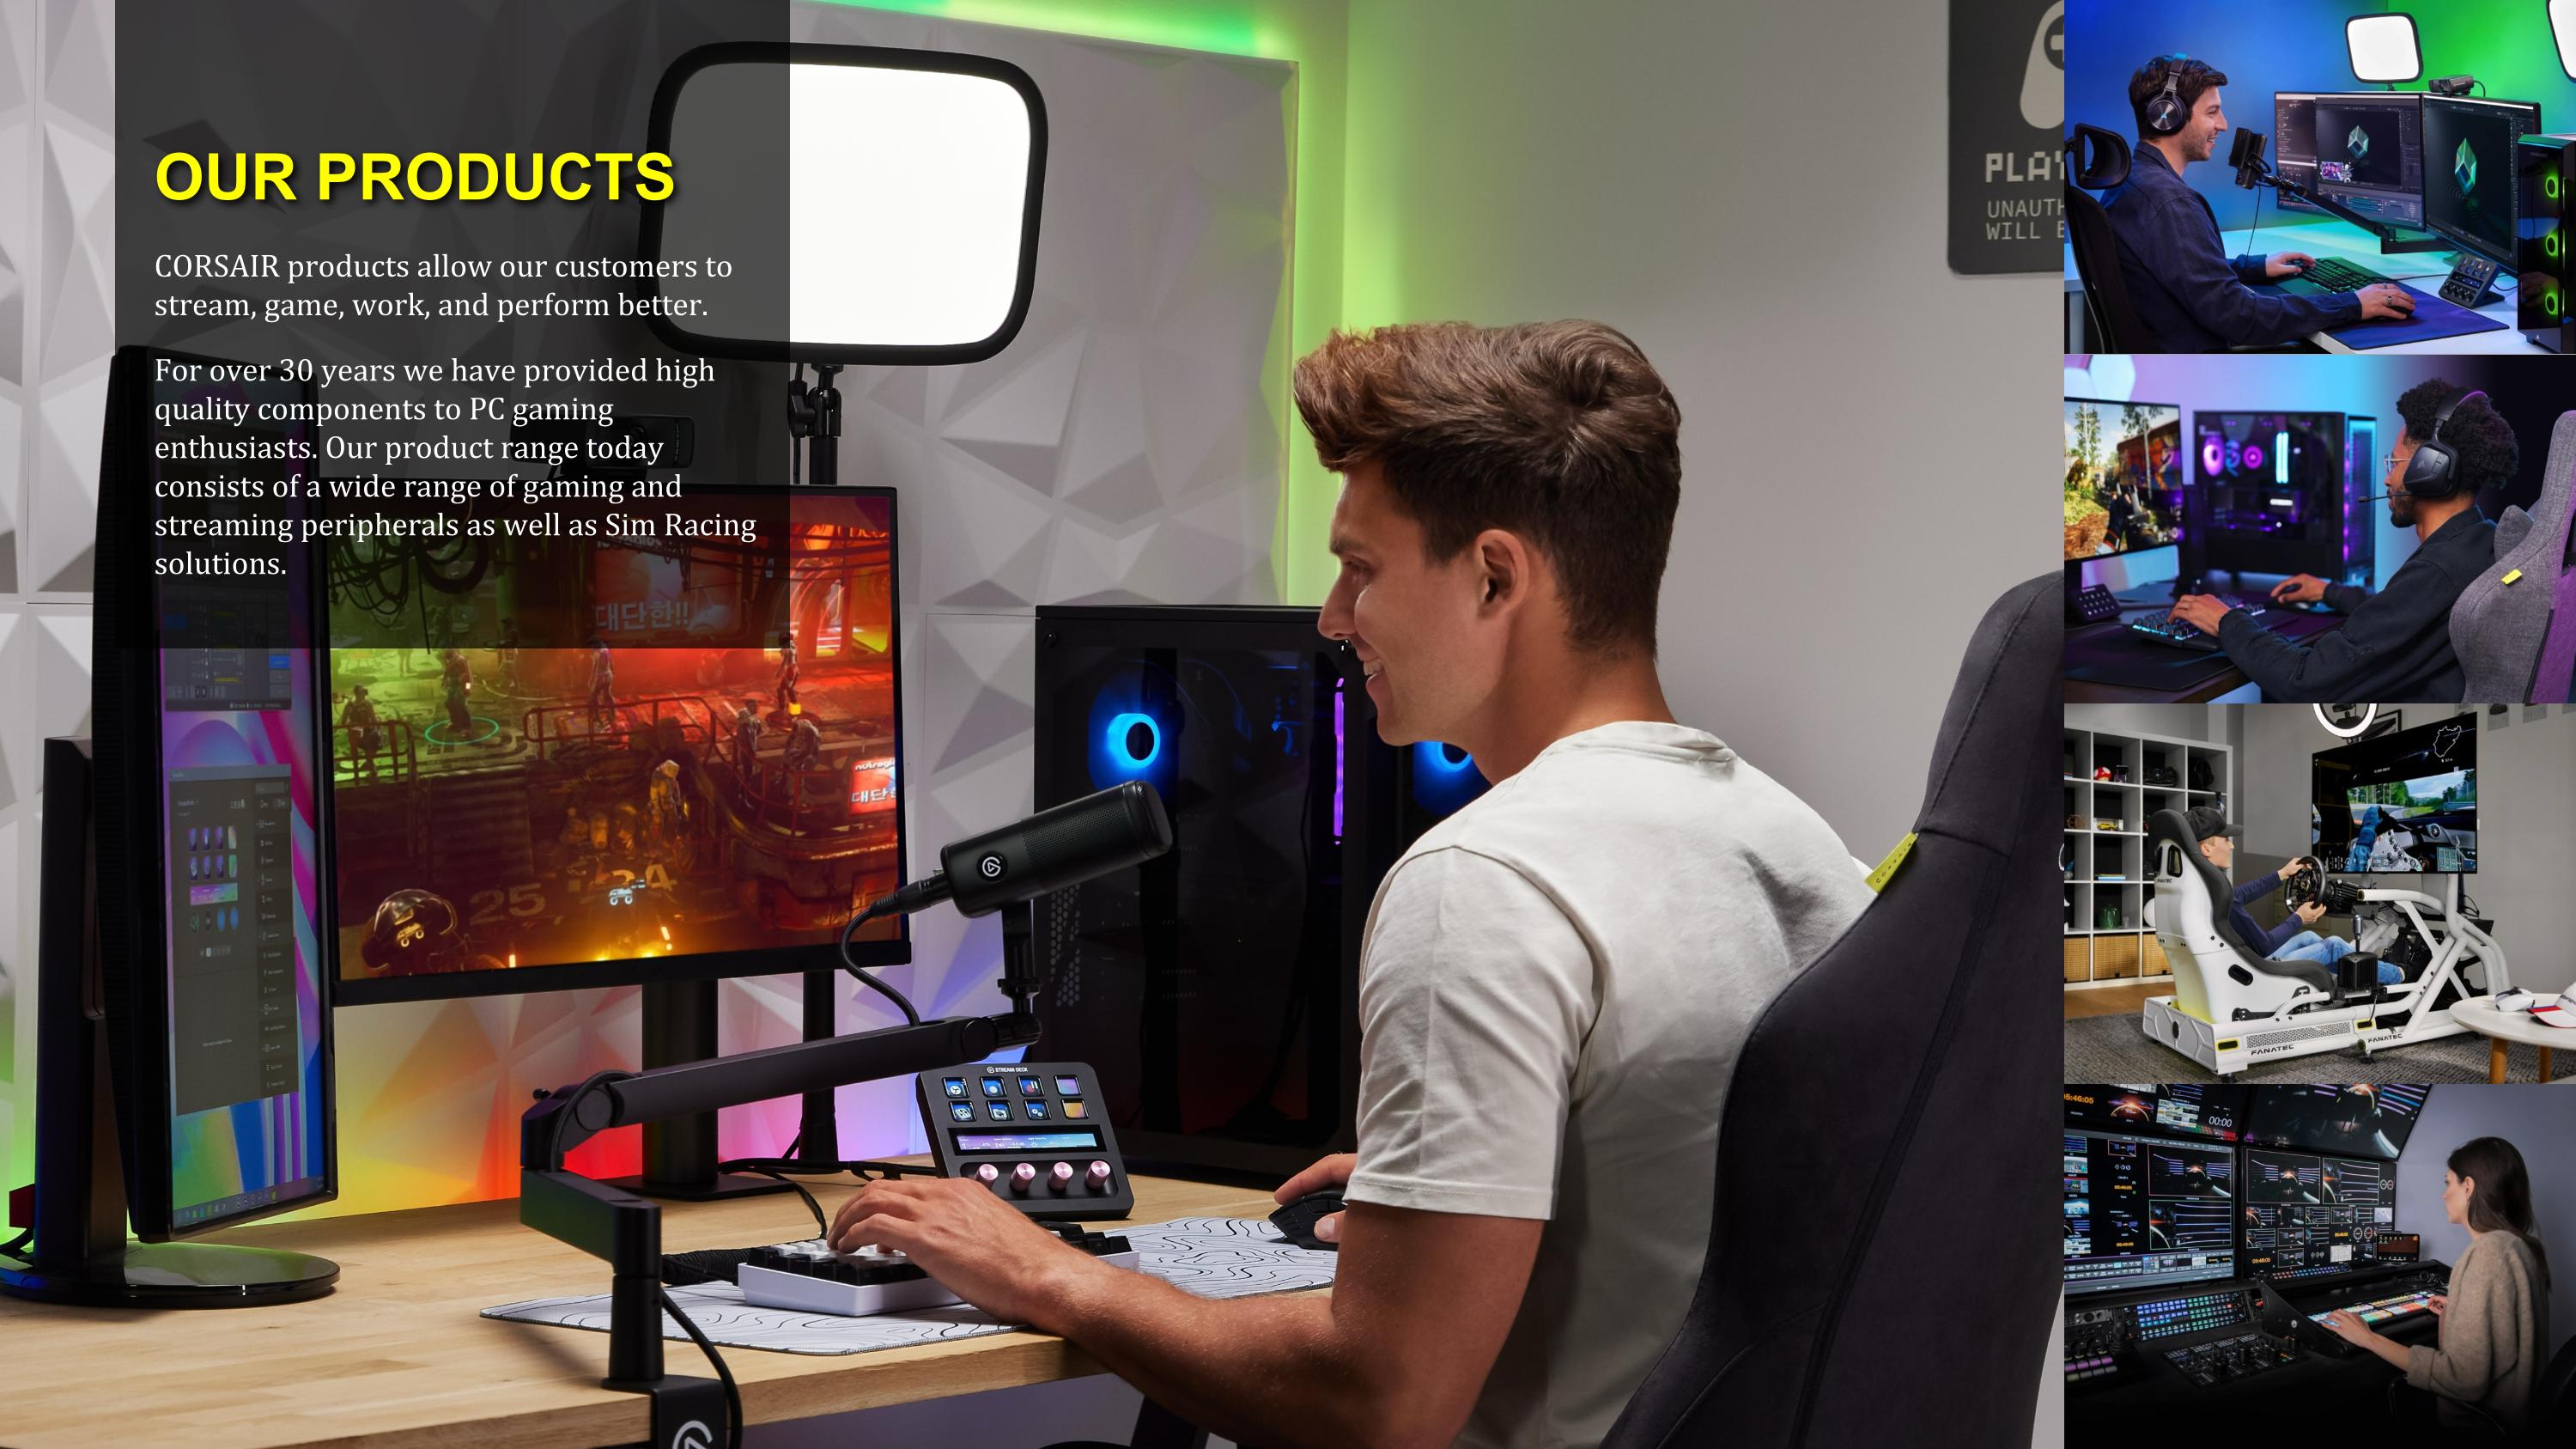
CORSAIR products allow our customers to stream, game, work, and perform better. For over 30 years we have provided high quality components to PC gaming enthusiasts. Our product range today consists of a wide range of gaming and streaming peripherals as well as Sim Racing solutions. OUR PRODUCTS
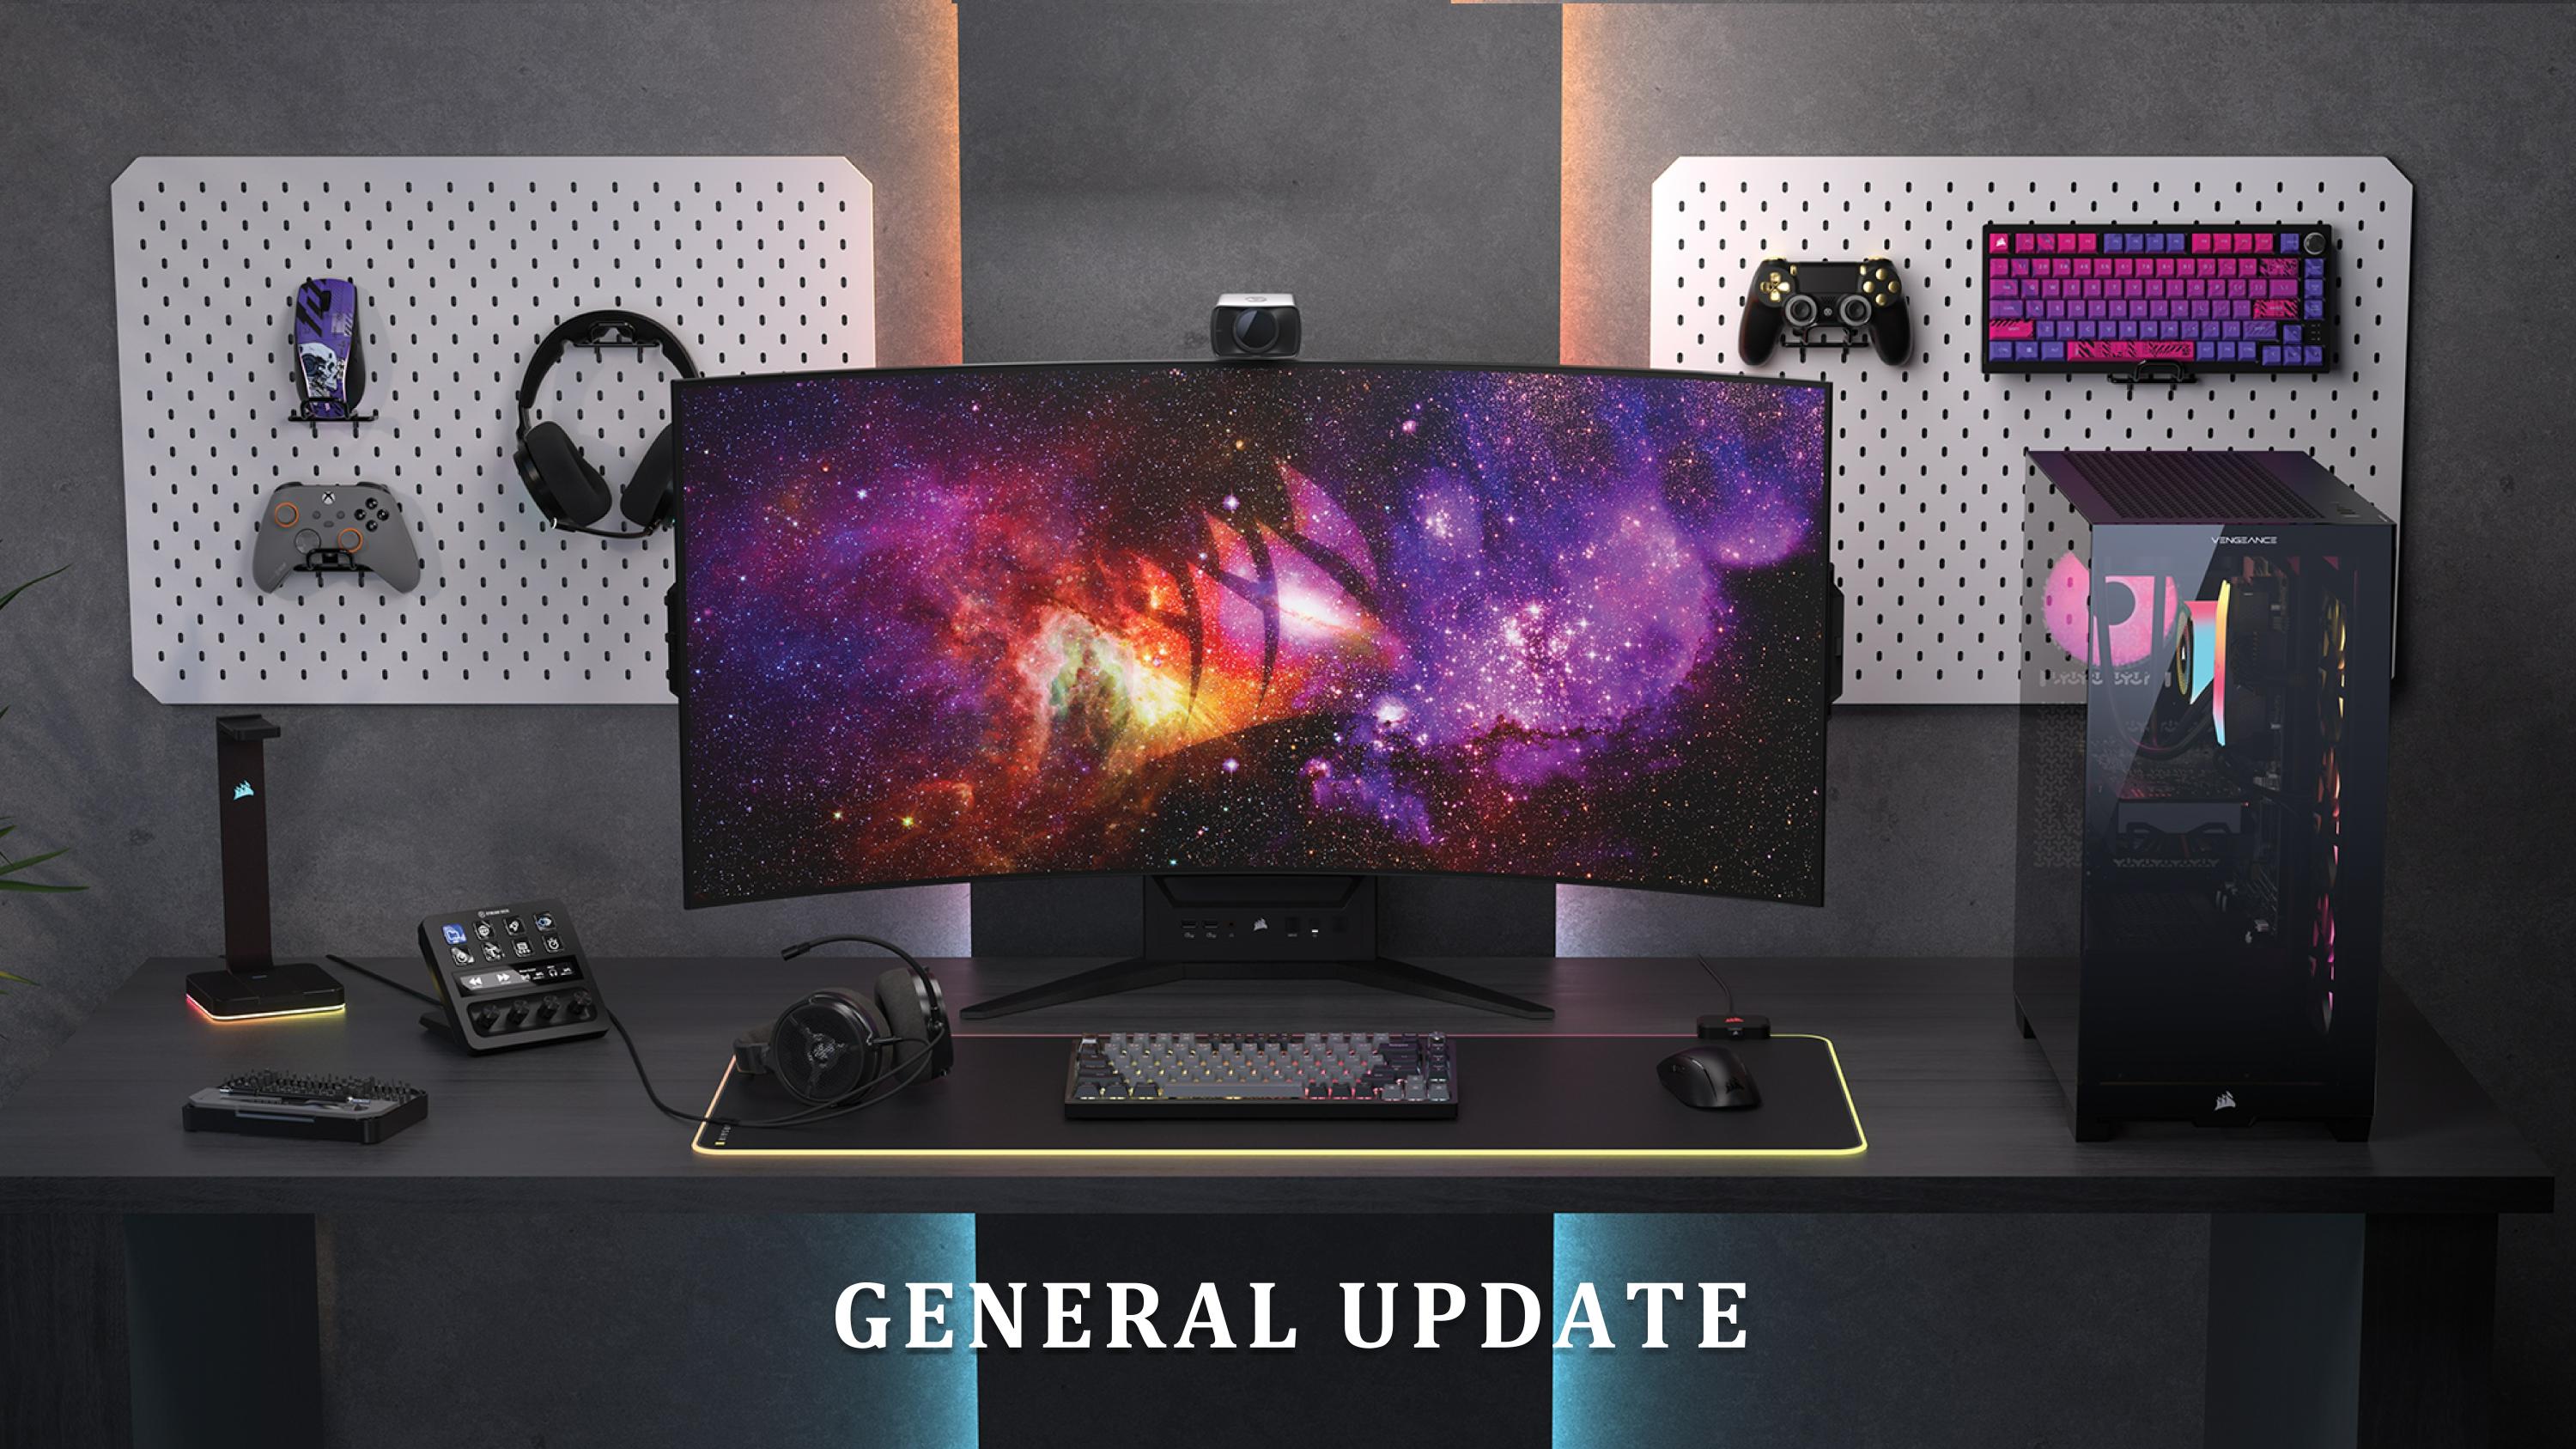
GENERAL UPDATE
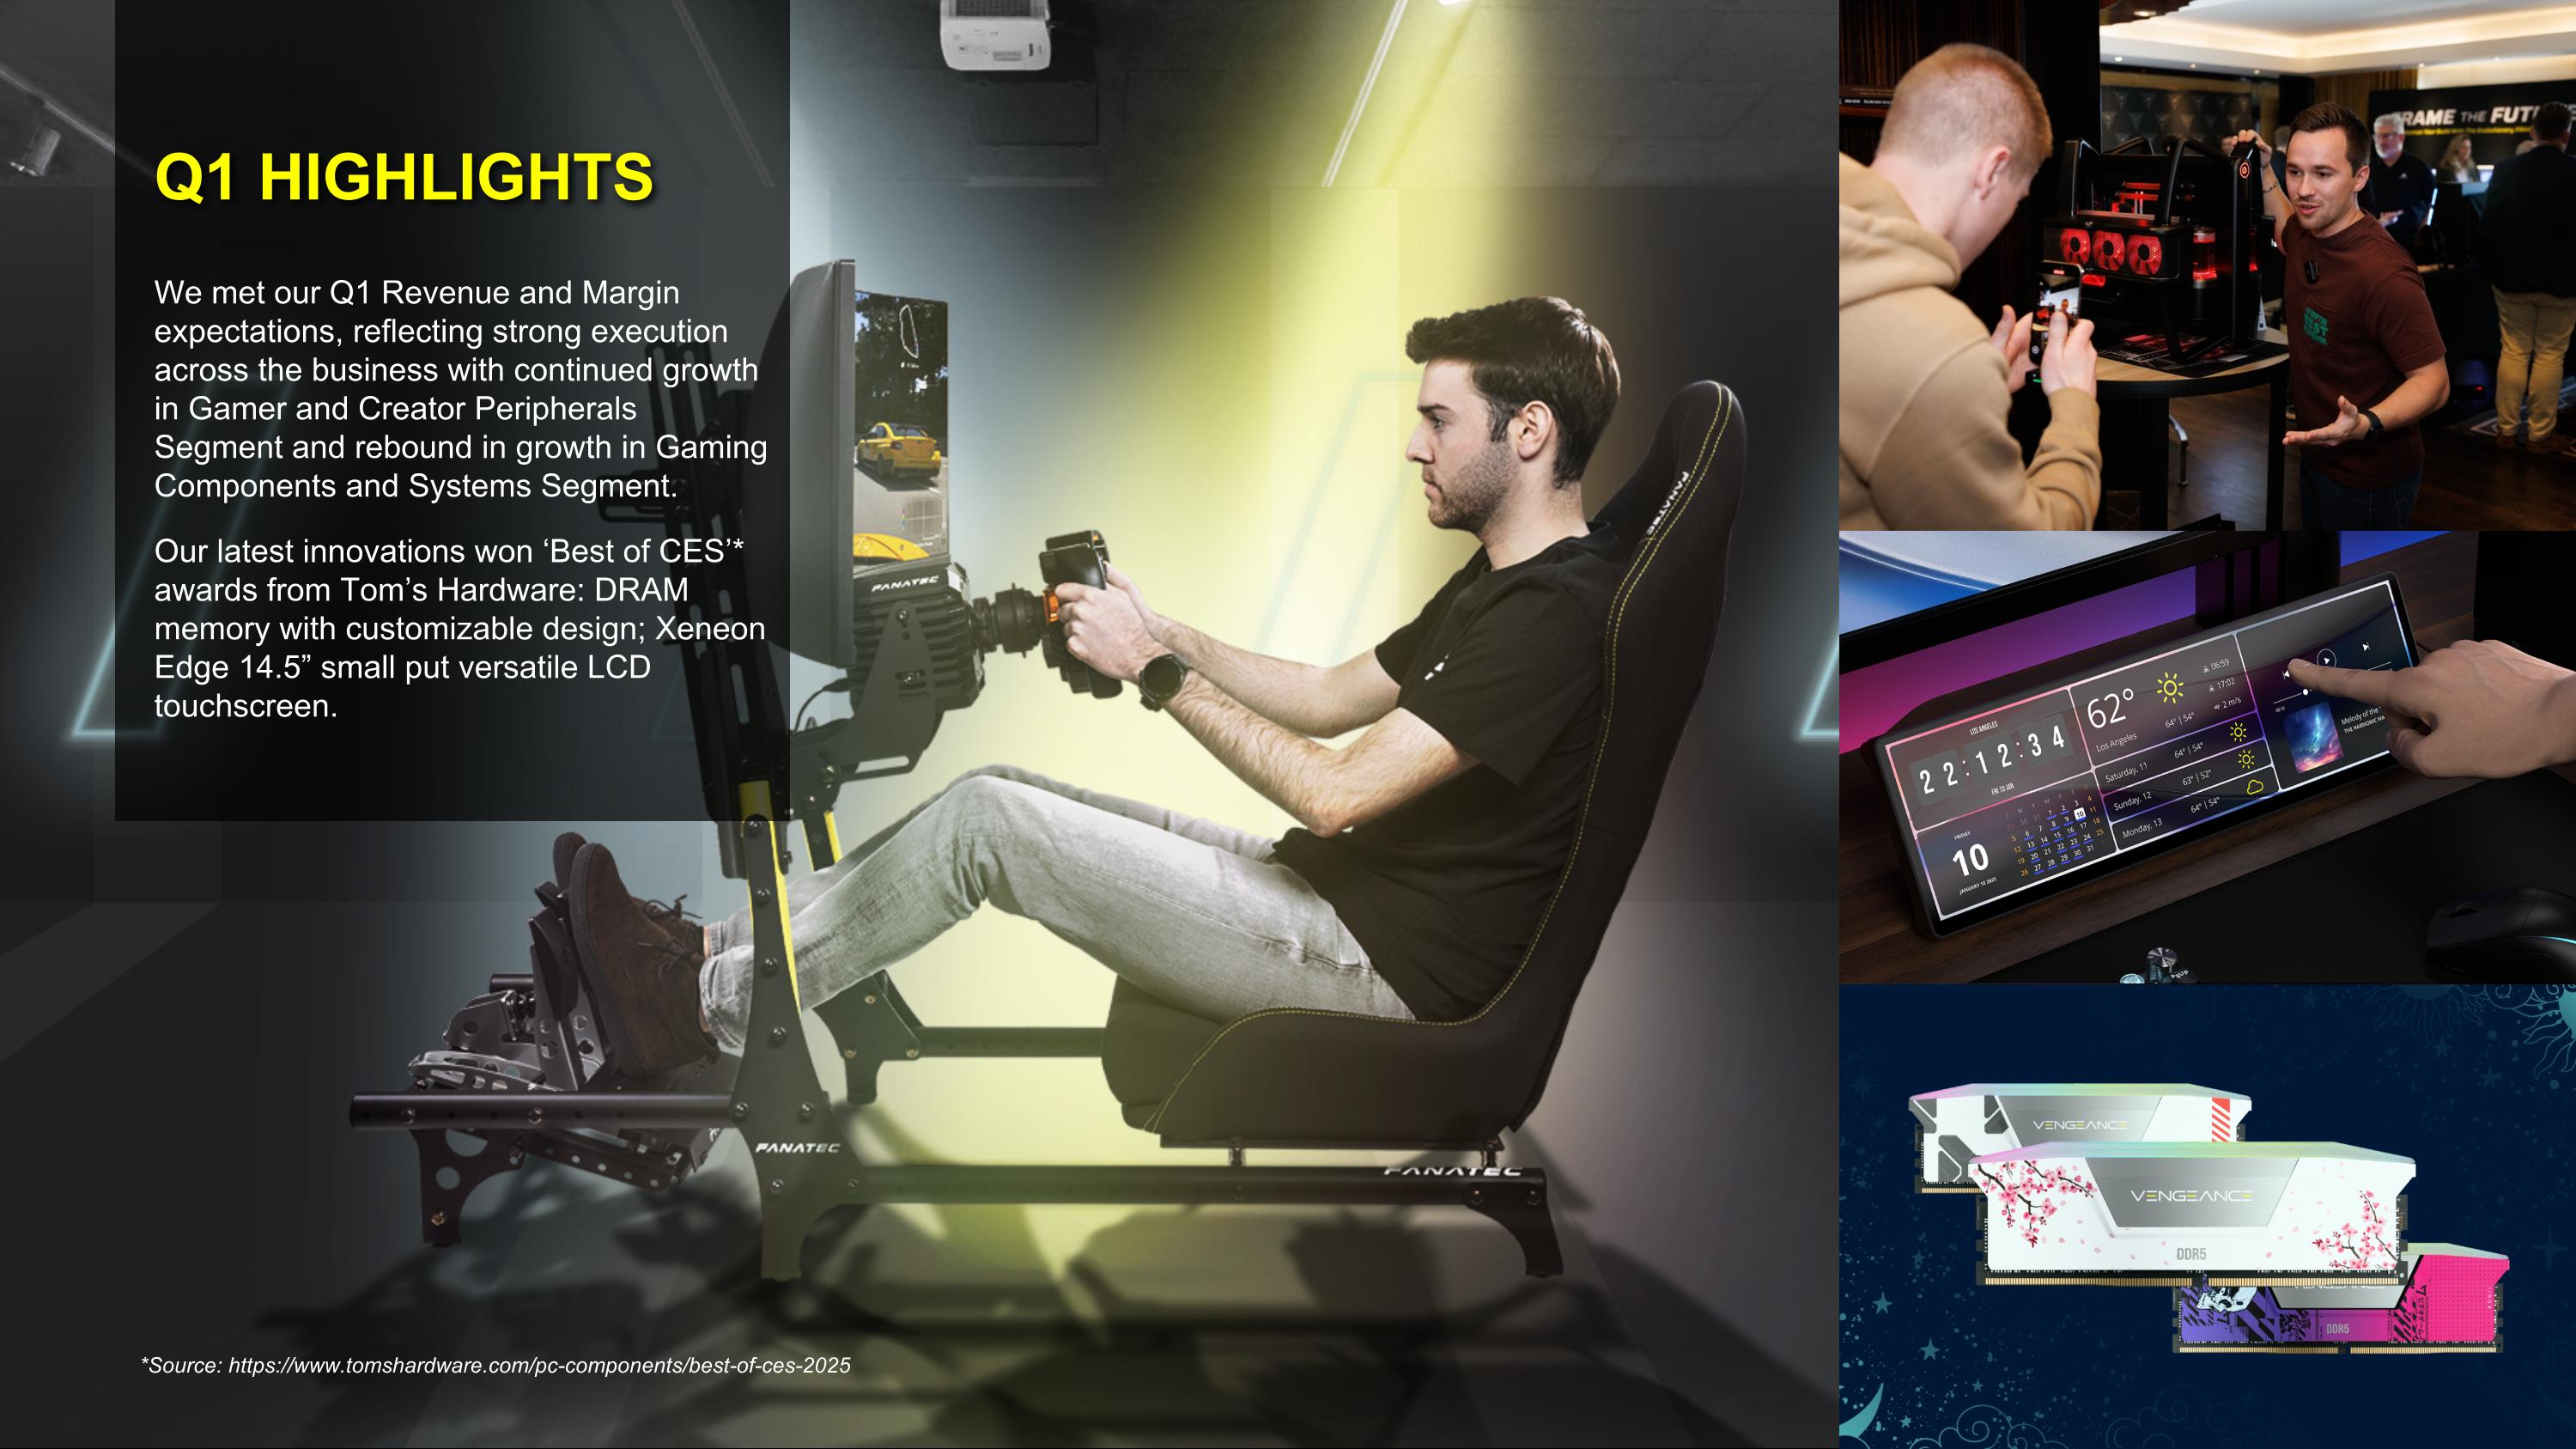
We met our Q1 Revenue and Margin expectations, reflecting strong execution across the business with continued growth in Gamer and Creator Peripherals Segment and rebound in growth in Gaming Components and Systems Segment. Our latest innovations won ‘Best of CES’* awards from Tom’s Hardware: DRAM memory with customizable design; Xeneon Edge 14.5” small put versatile LCD touchscreen. Q1 HIGHLIGHTS *Source: https://www.tomshardware.com/pc-components/best-of-ces-2025
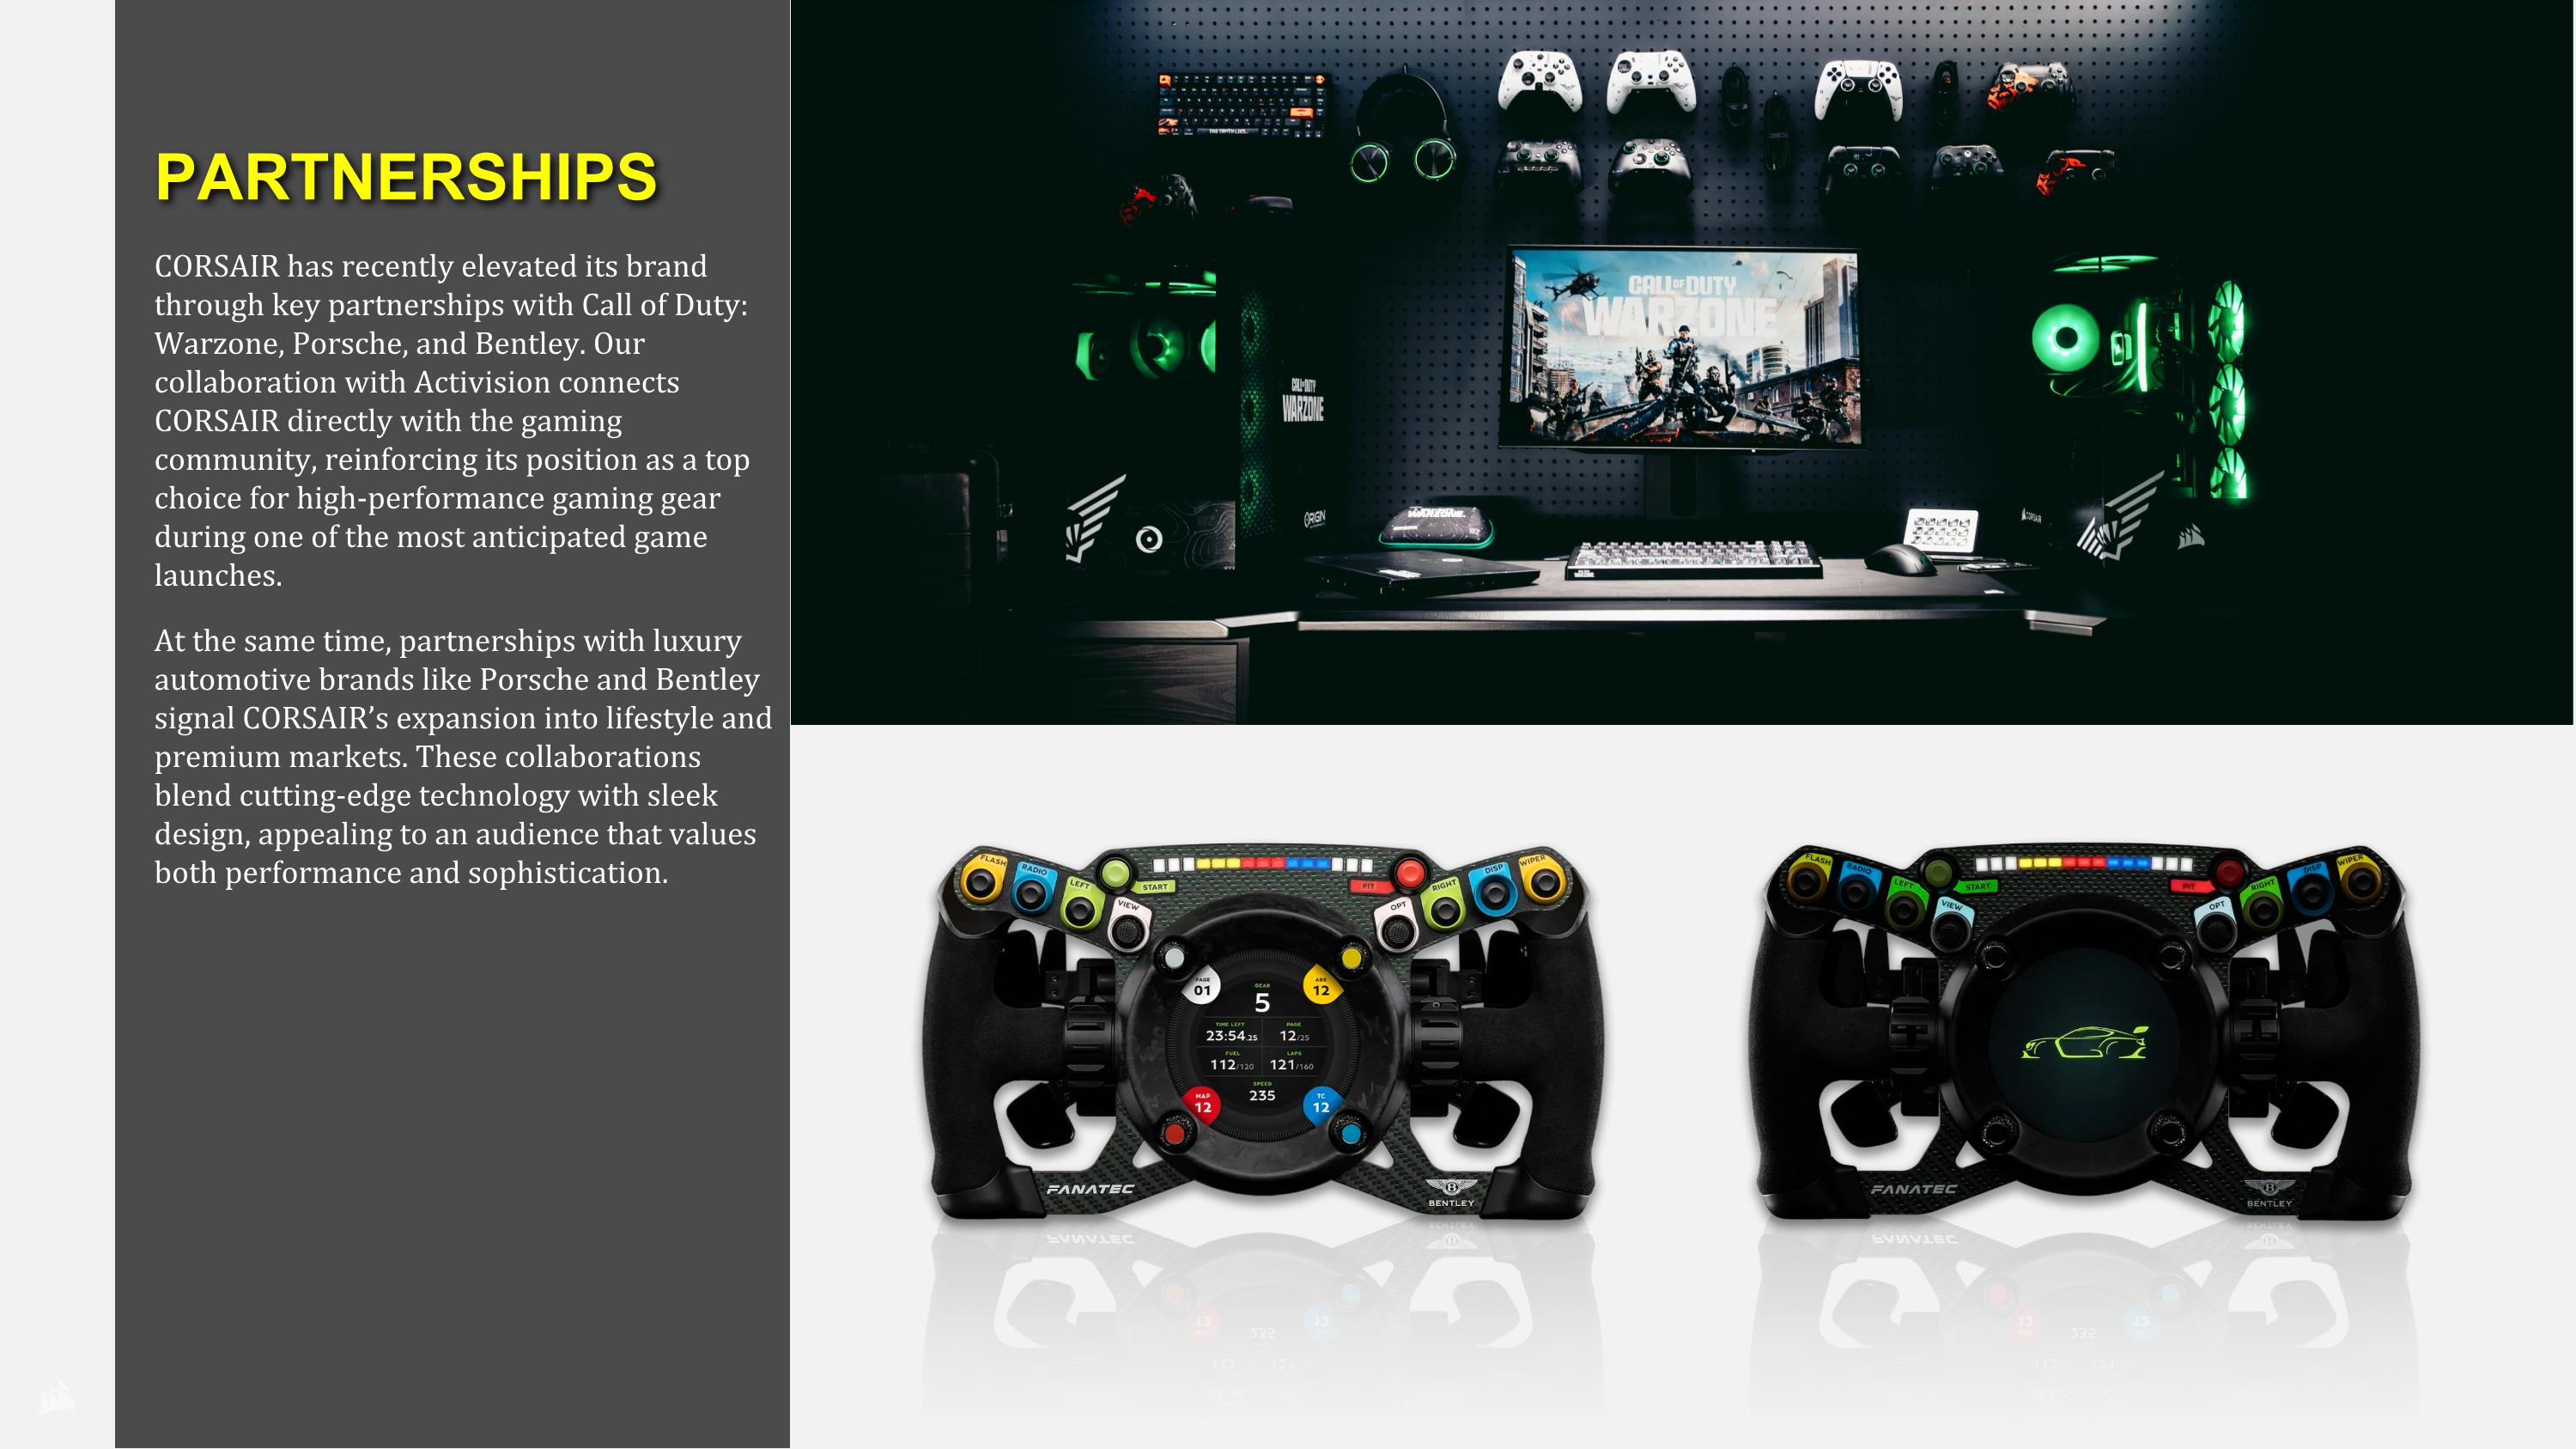
CORSAIR has recently elevated its brand through key partnerships with Call of Duty: Warzone, Porsche, and Bentley. Our collaboration with Activision connects CORSAIR directly with the gaming community, reinforcing its position as a top choice for high-performance gaming gear during one of the most anticipated game launches. At the same time, partnerships with luxury automotive brands like Porsche and Bentley signal CORSAIR’s expansion into lifestyle and premium markets. These collaborations blend cutting-edge technology with sleek design, appealing to an audience that values both performance and sophistication. PARTNERSHIPS
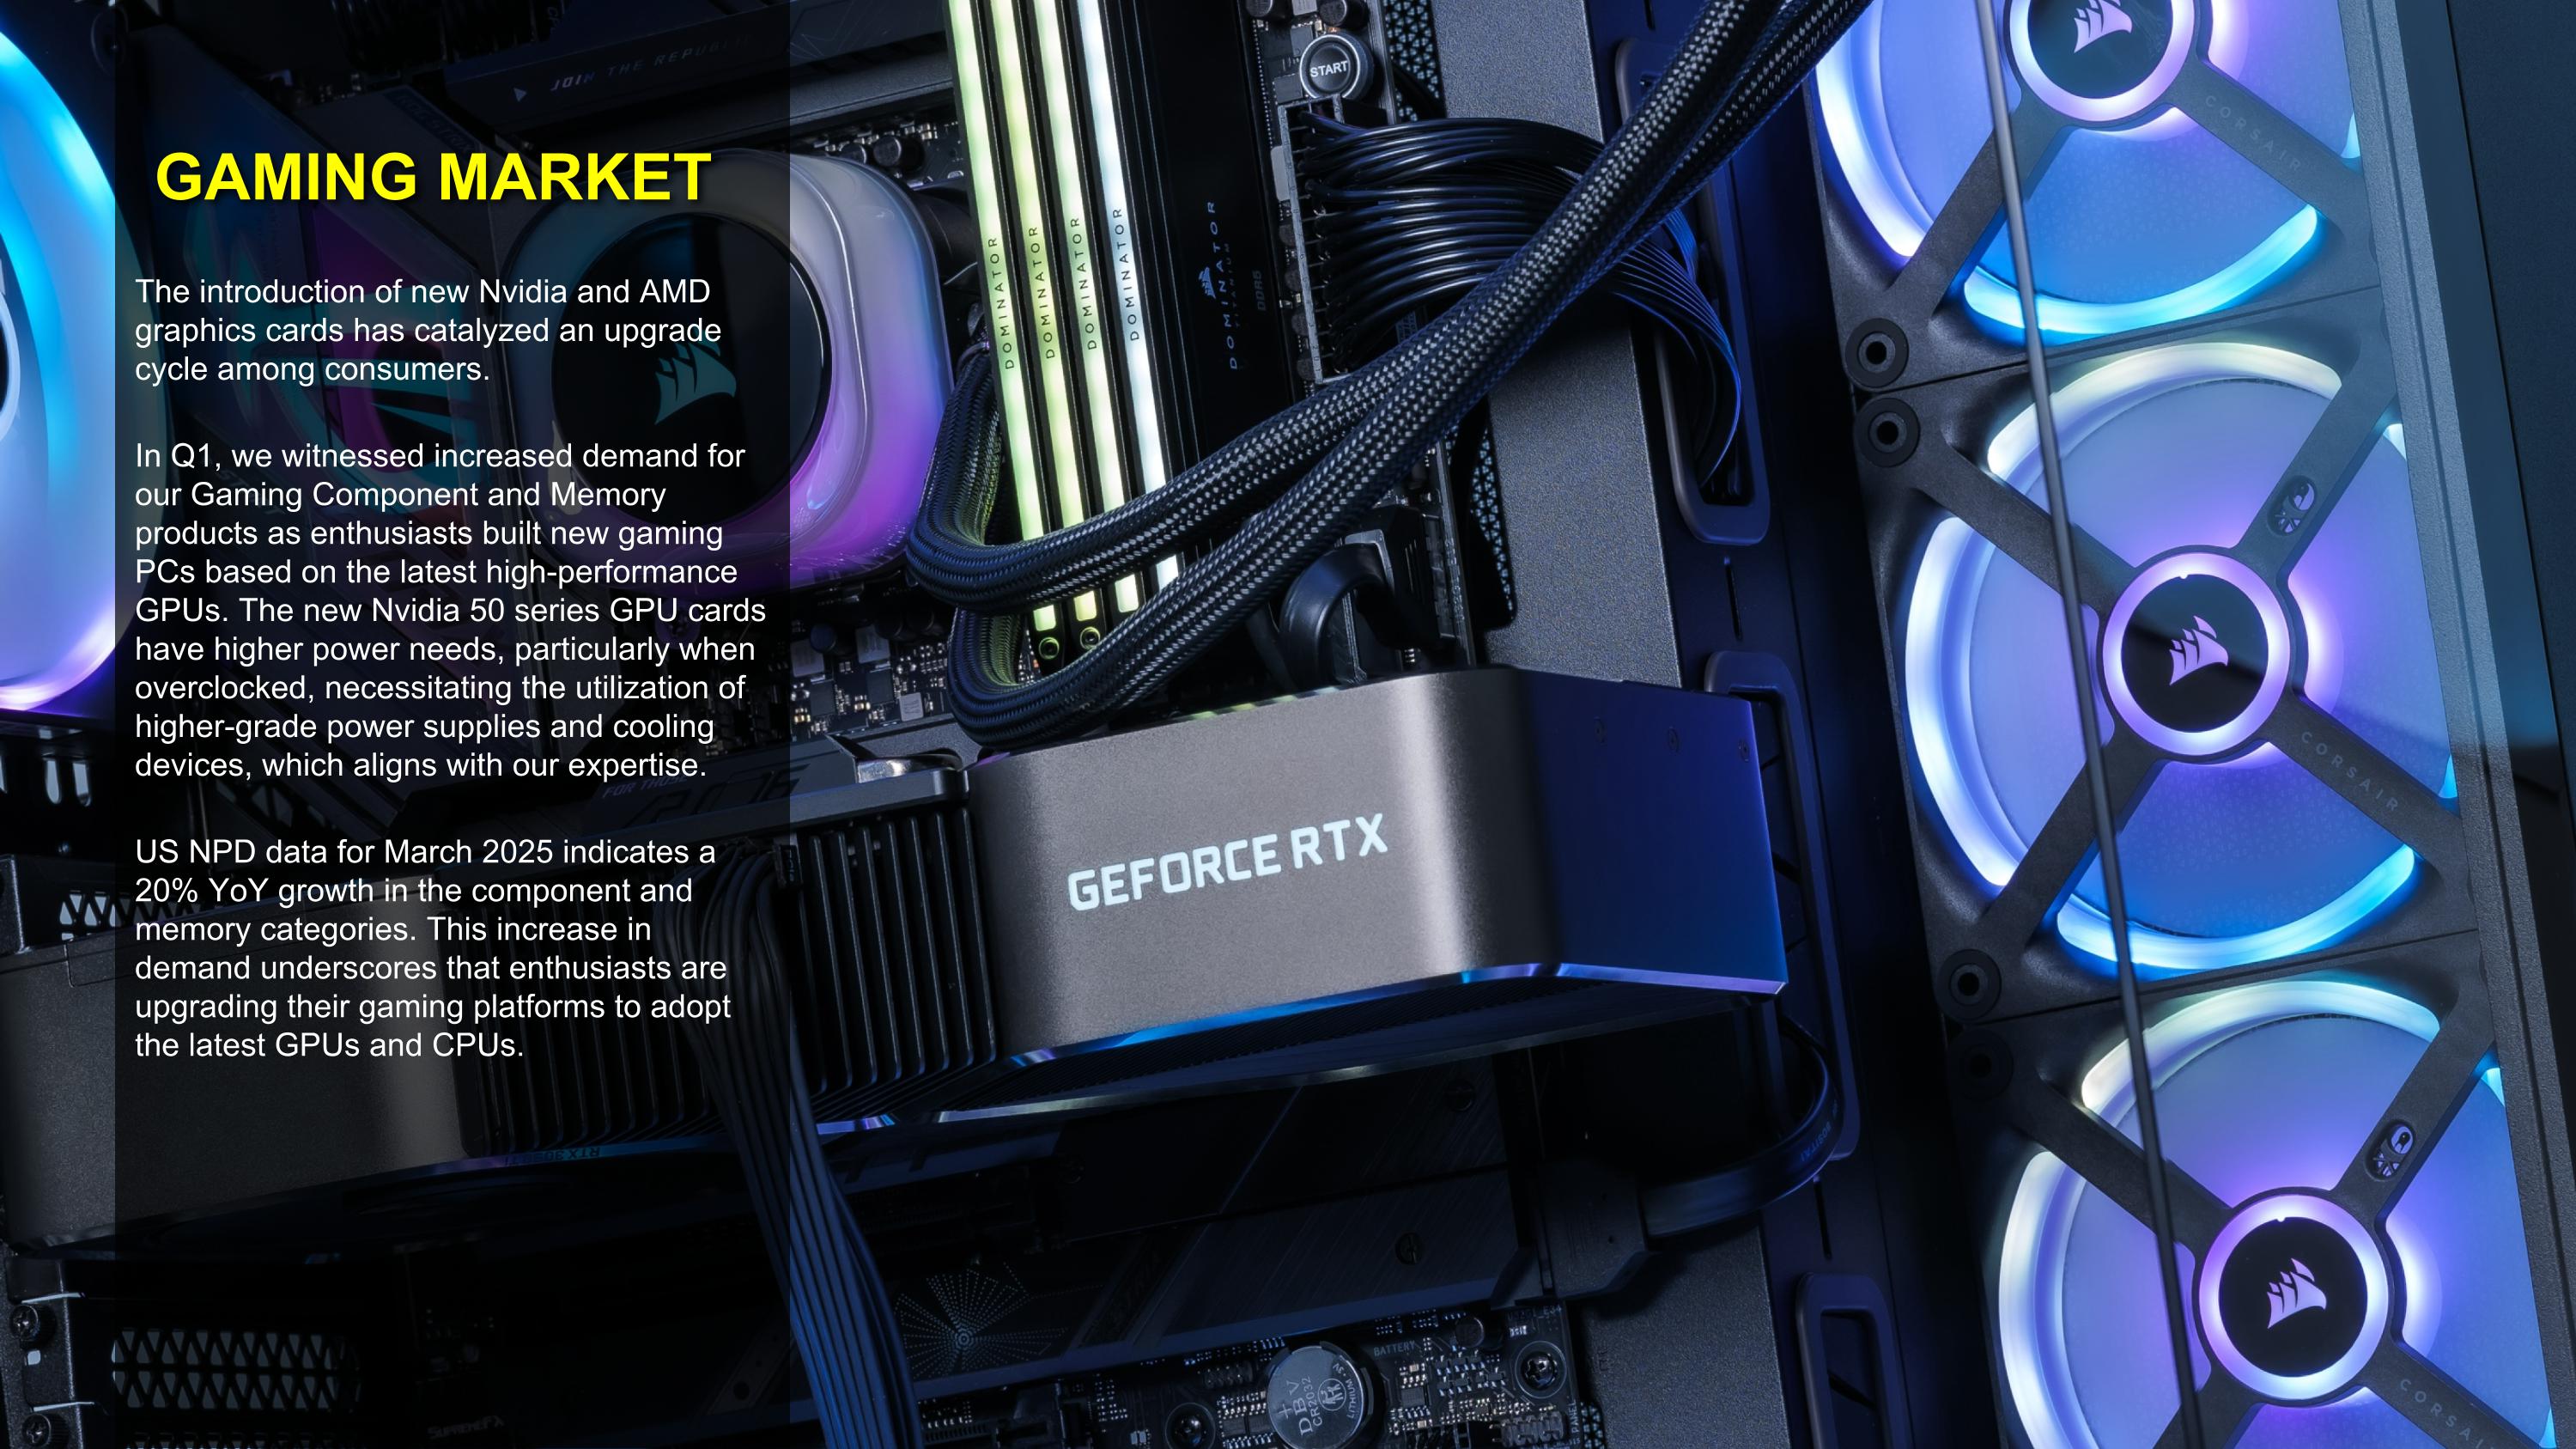
The introduction of new Nvidia and AMD graphics cards has catalyzed an upgrade cycle among consumers. In Q1, we witnessed increased demand for our Gaming Component and Memory products as enthusiasts built new gaming PCs based on the latest high-performance GPUs. The new Nvidia 50 series GPU cards have higher power needs, particularly when overclocked, necessitating the utilization of higher-grade power supplies and cooling devices, which aligns with our expertise. US NPD data for March 2025 indicates a 20% YoY growth in the component and memory categories. This increase in demand underscores that enthusiasts are upgrading their gaming platforms to adopt the latest GPUs and CPUs. GAMING MARKET
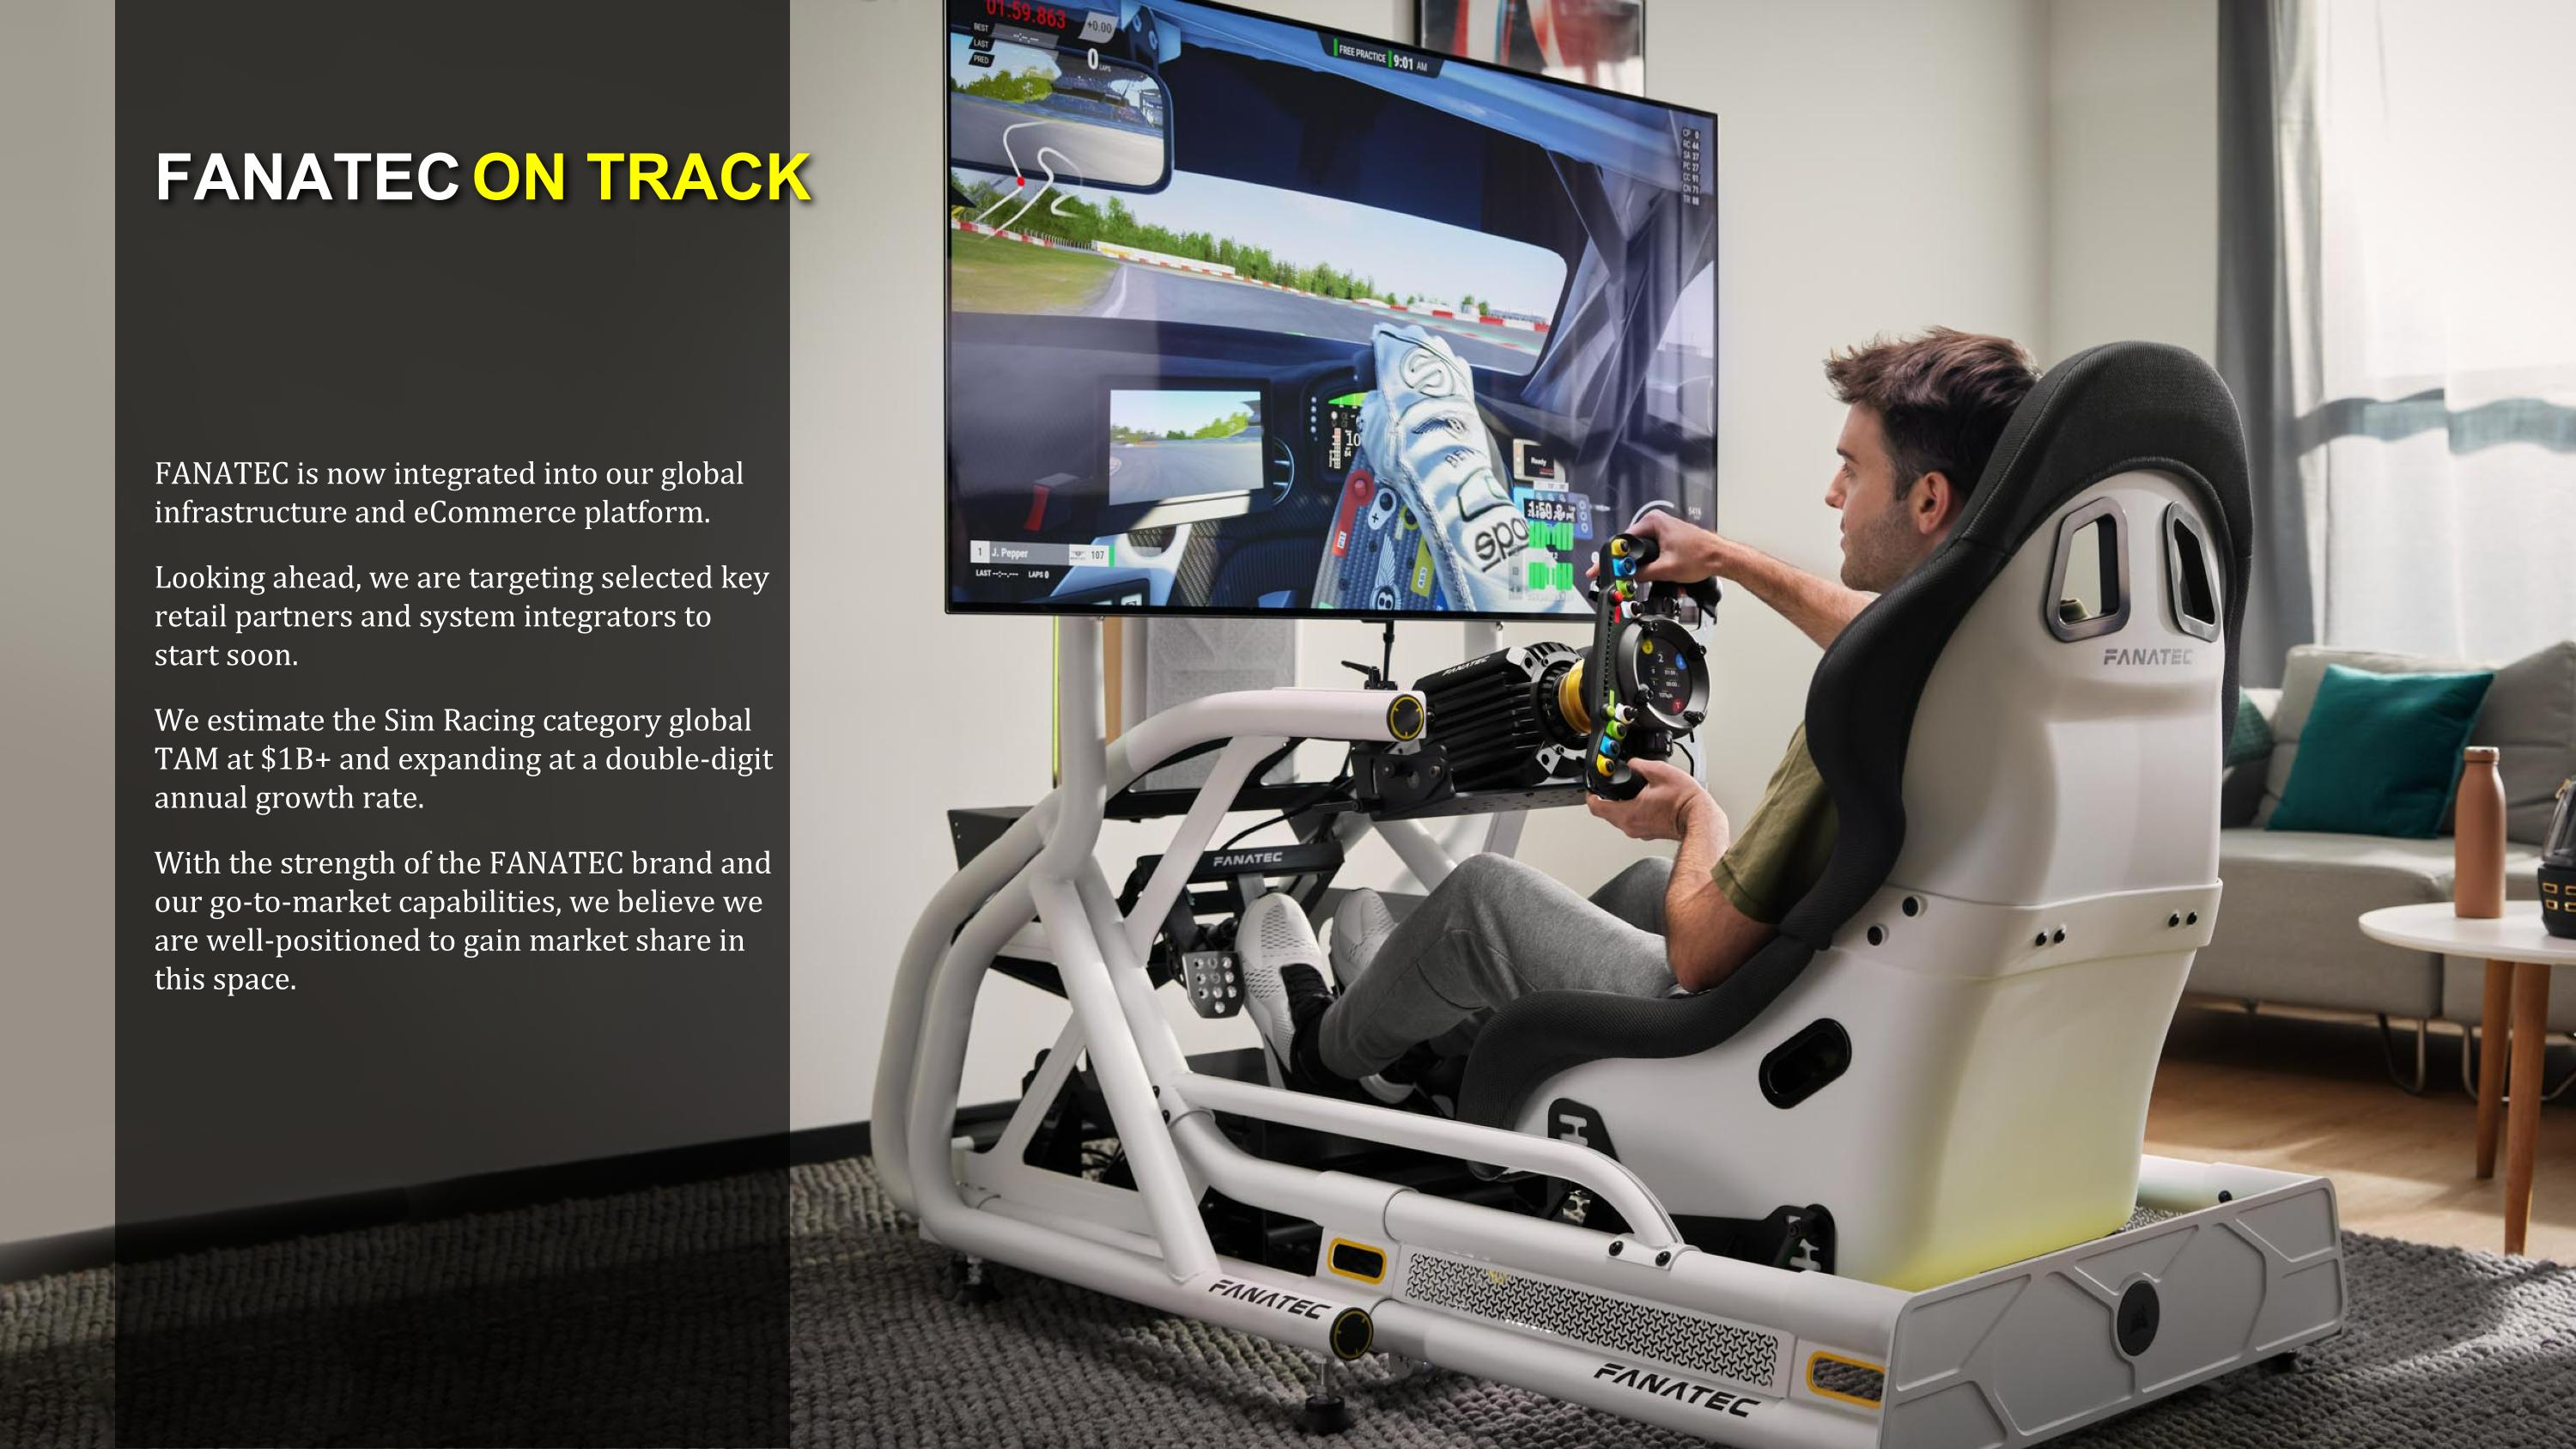
FANATEC is now integrated into our global infrastructure and eCommerce platform. Looking ahead, we are targeting selected key retail partners and system integrators to start soon. We estimate the Sim Racing category global TAM at $1B+ and expanding at a double-digit annual growth rate. With the strength of the FANATEC brand and our go-to-market capabilities, we believe we are well-positioned to gain market share in this space. FANATEC ON TRACK

CORSAIR is identified as one of the TOP TEN BEST BRANDS for 2025, awarded by PC MAG This officially licensed steering wheel, inspired by the Porsche Vision Gran Turismo concept car in Gran Turismo® 7, brings Porsche’s visionary design to sim racers worldwide. Featuring an intuitive input layout, premium materials and exceptional craftsmanship. Suitable for the full range of Fanatec bases. This is the first steering wheel to use Fanatec’s new Tactaris material, a premium microfiber fabric that enhances durability, comfort, and handling. FANATEC PORSCHE STEERING WHEEL
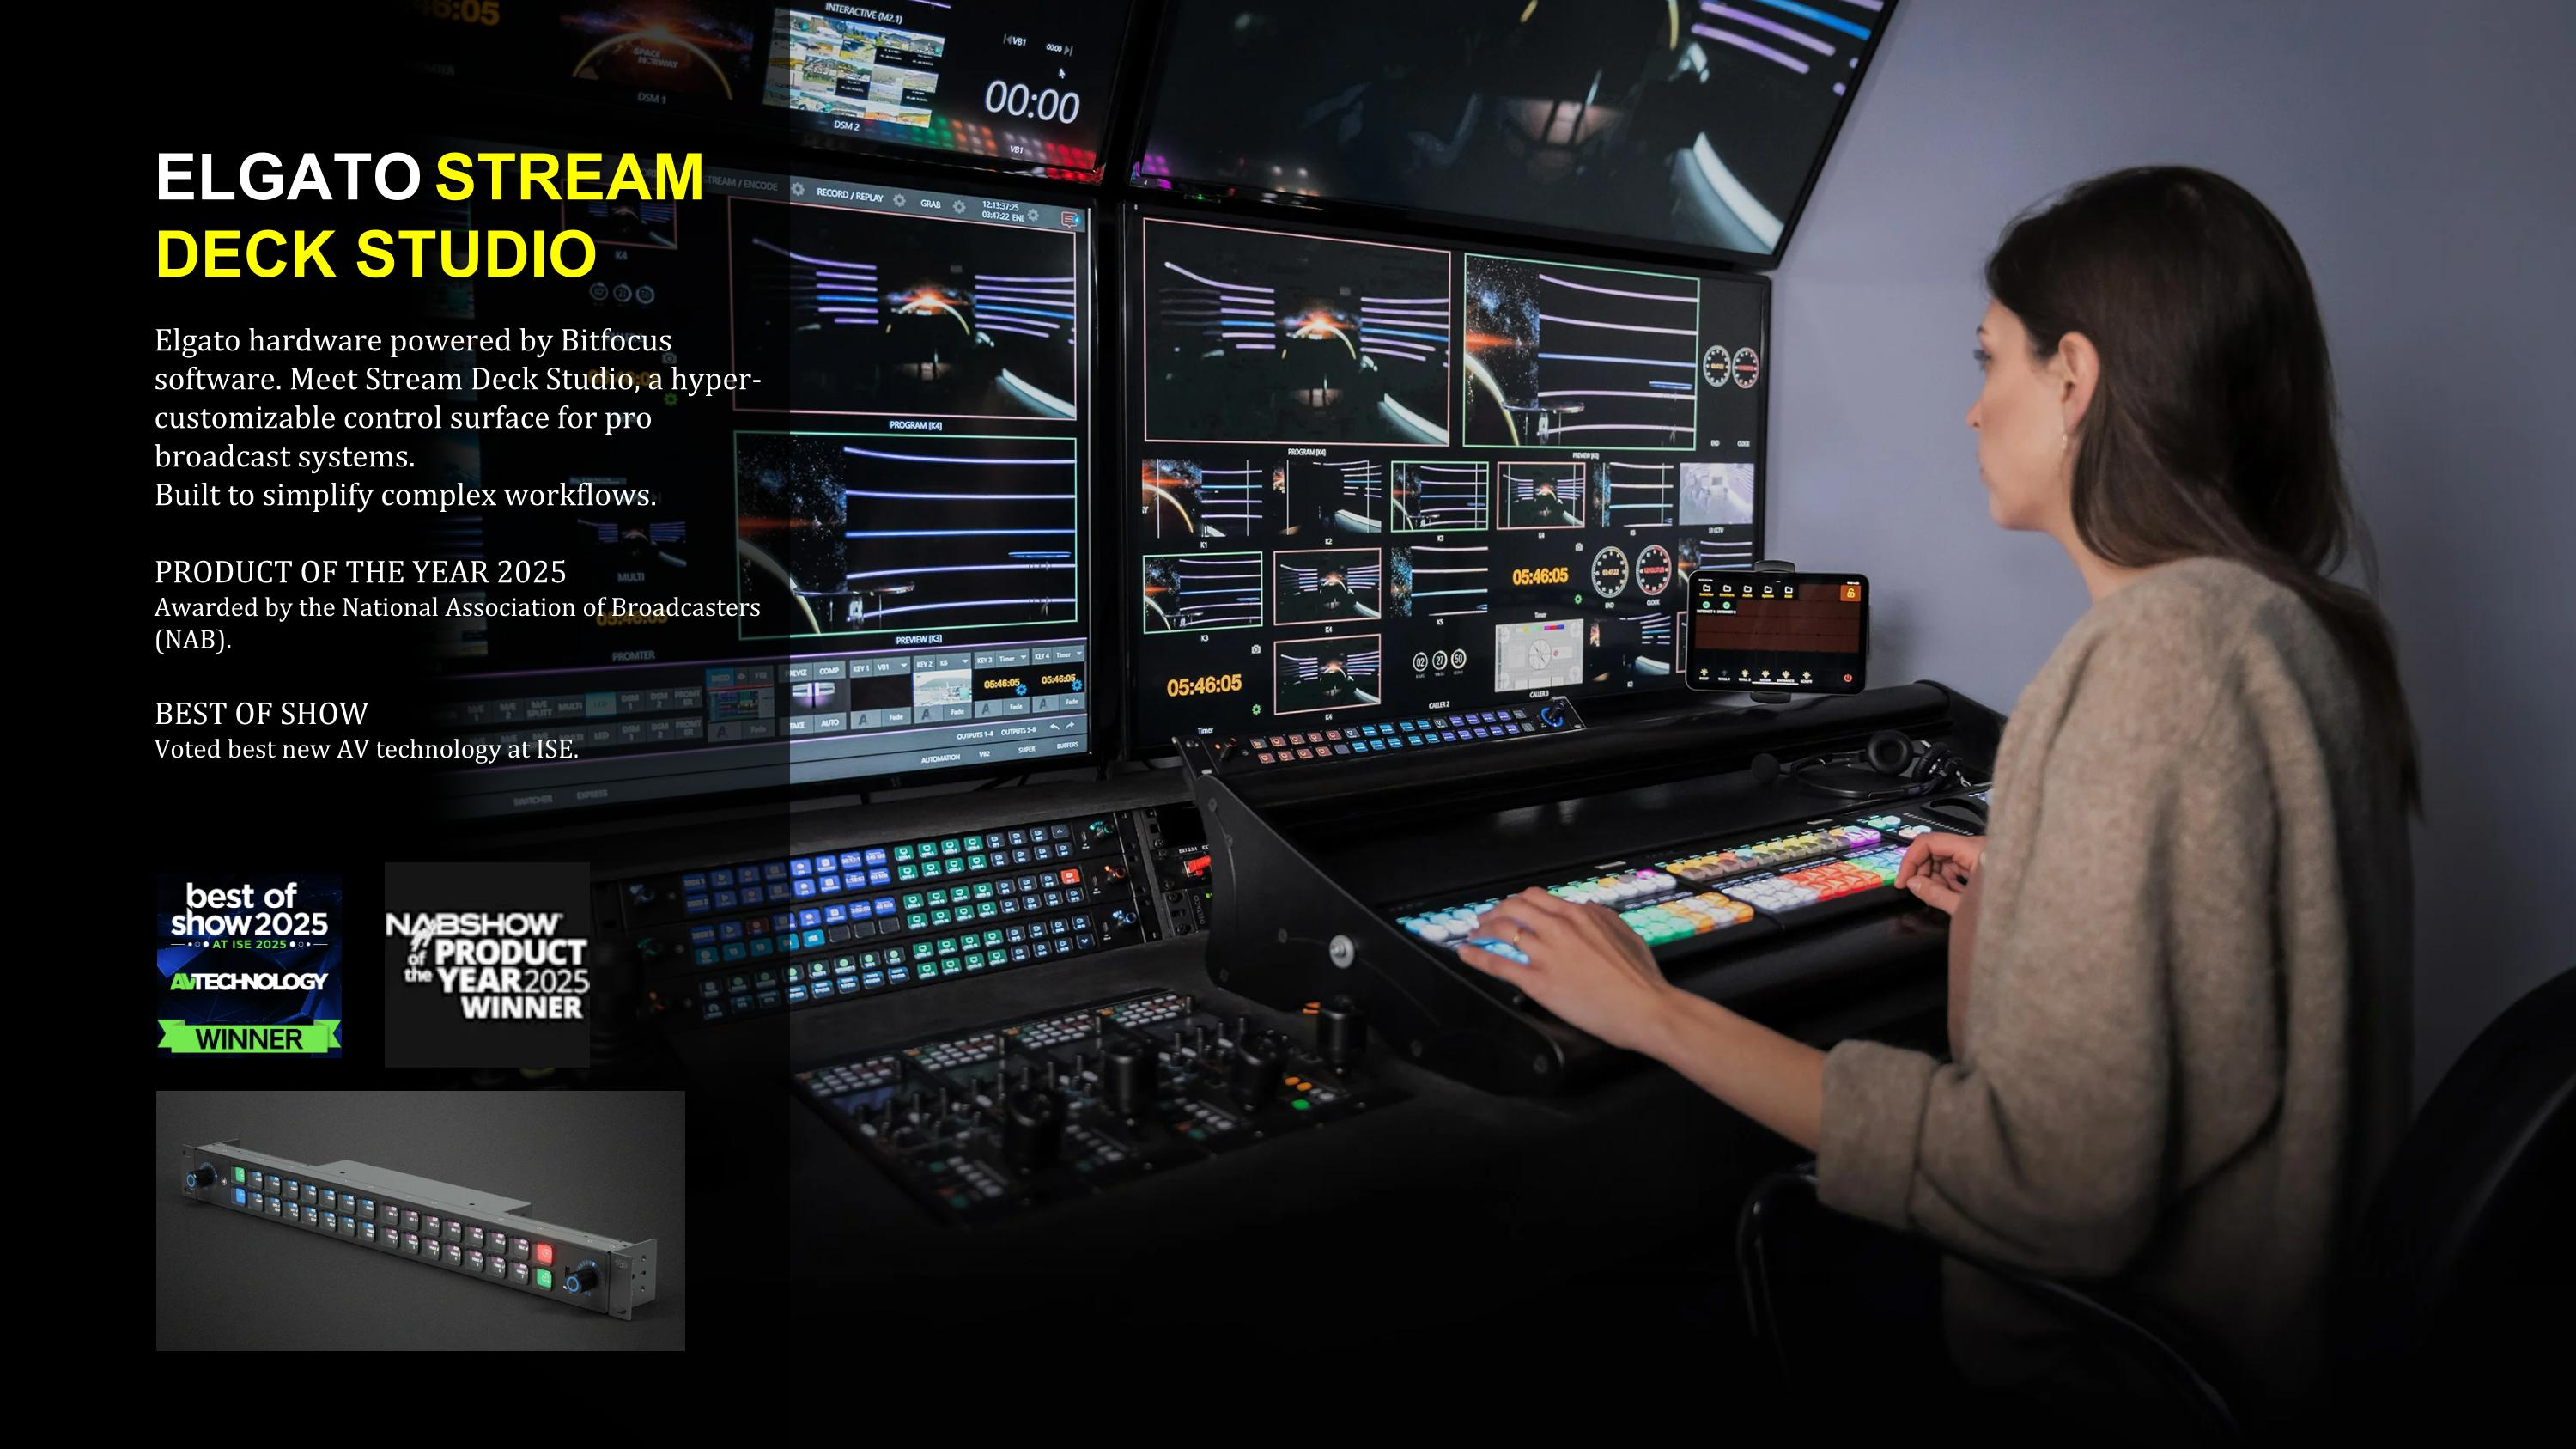
Elgato hardware powered by Bitfocus software. Meet Stream Deck Studio, a hyper-customizable control surface for pro broadcast systems.�Built to simplify complex workflows. PRODUCT OF THE YEAR 2025 Awarded by the National Association of Broadcasters (NAB).��BEST OF SHOW Voted best new AV technology at ISE. ELGATO STREAM�DECK STUDIO
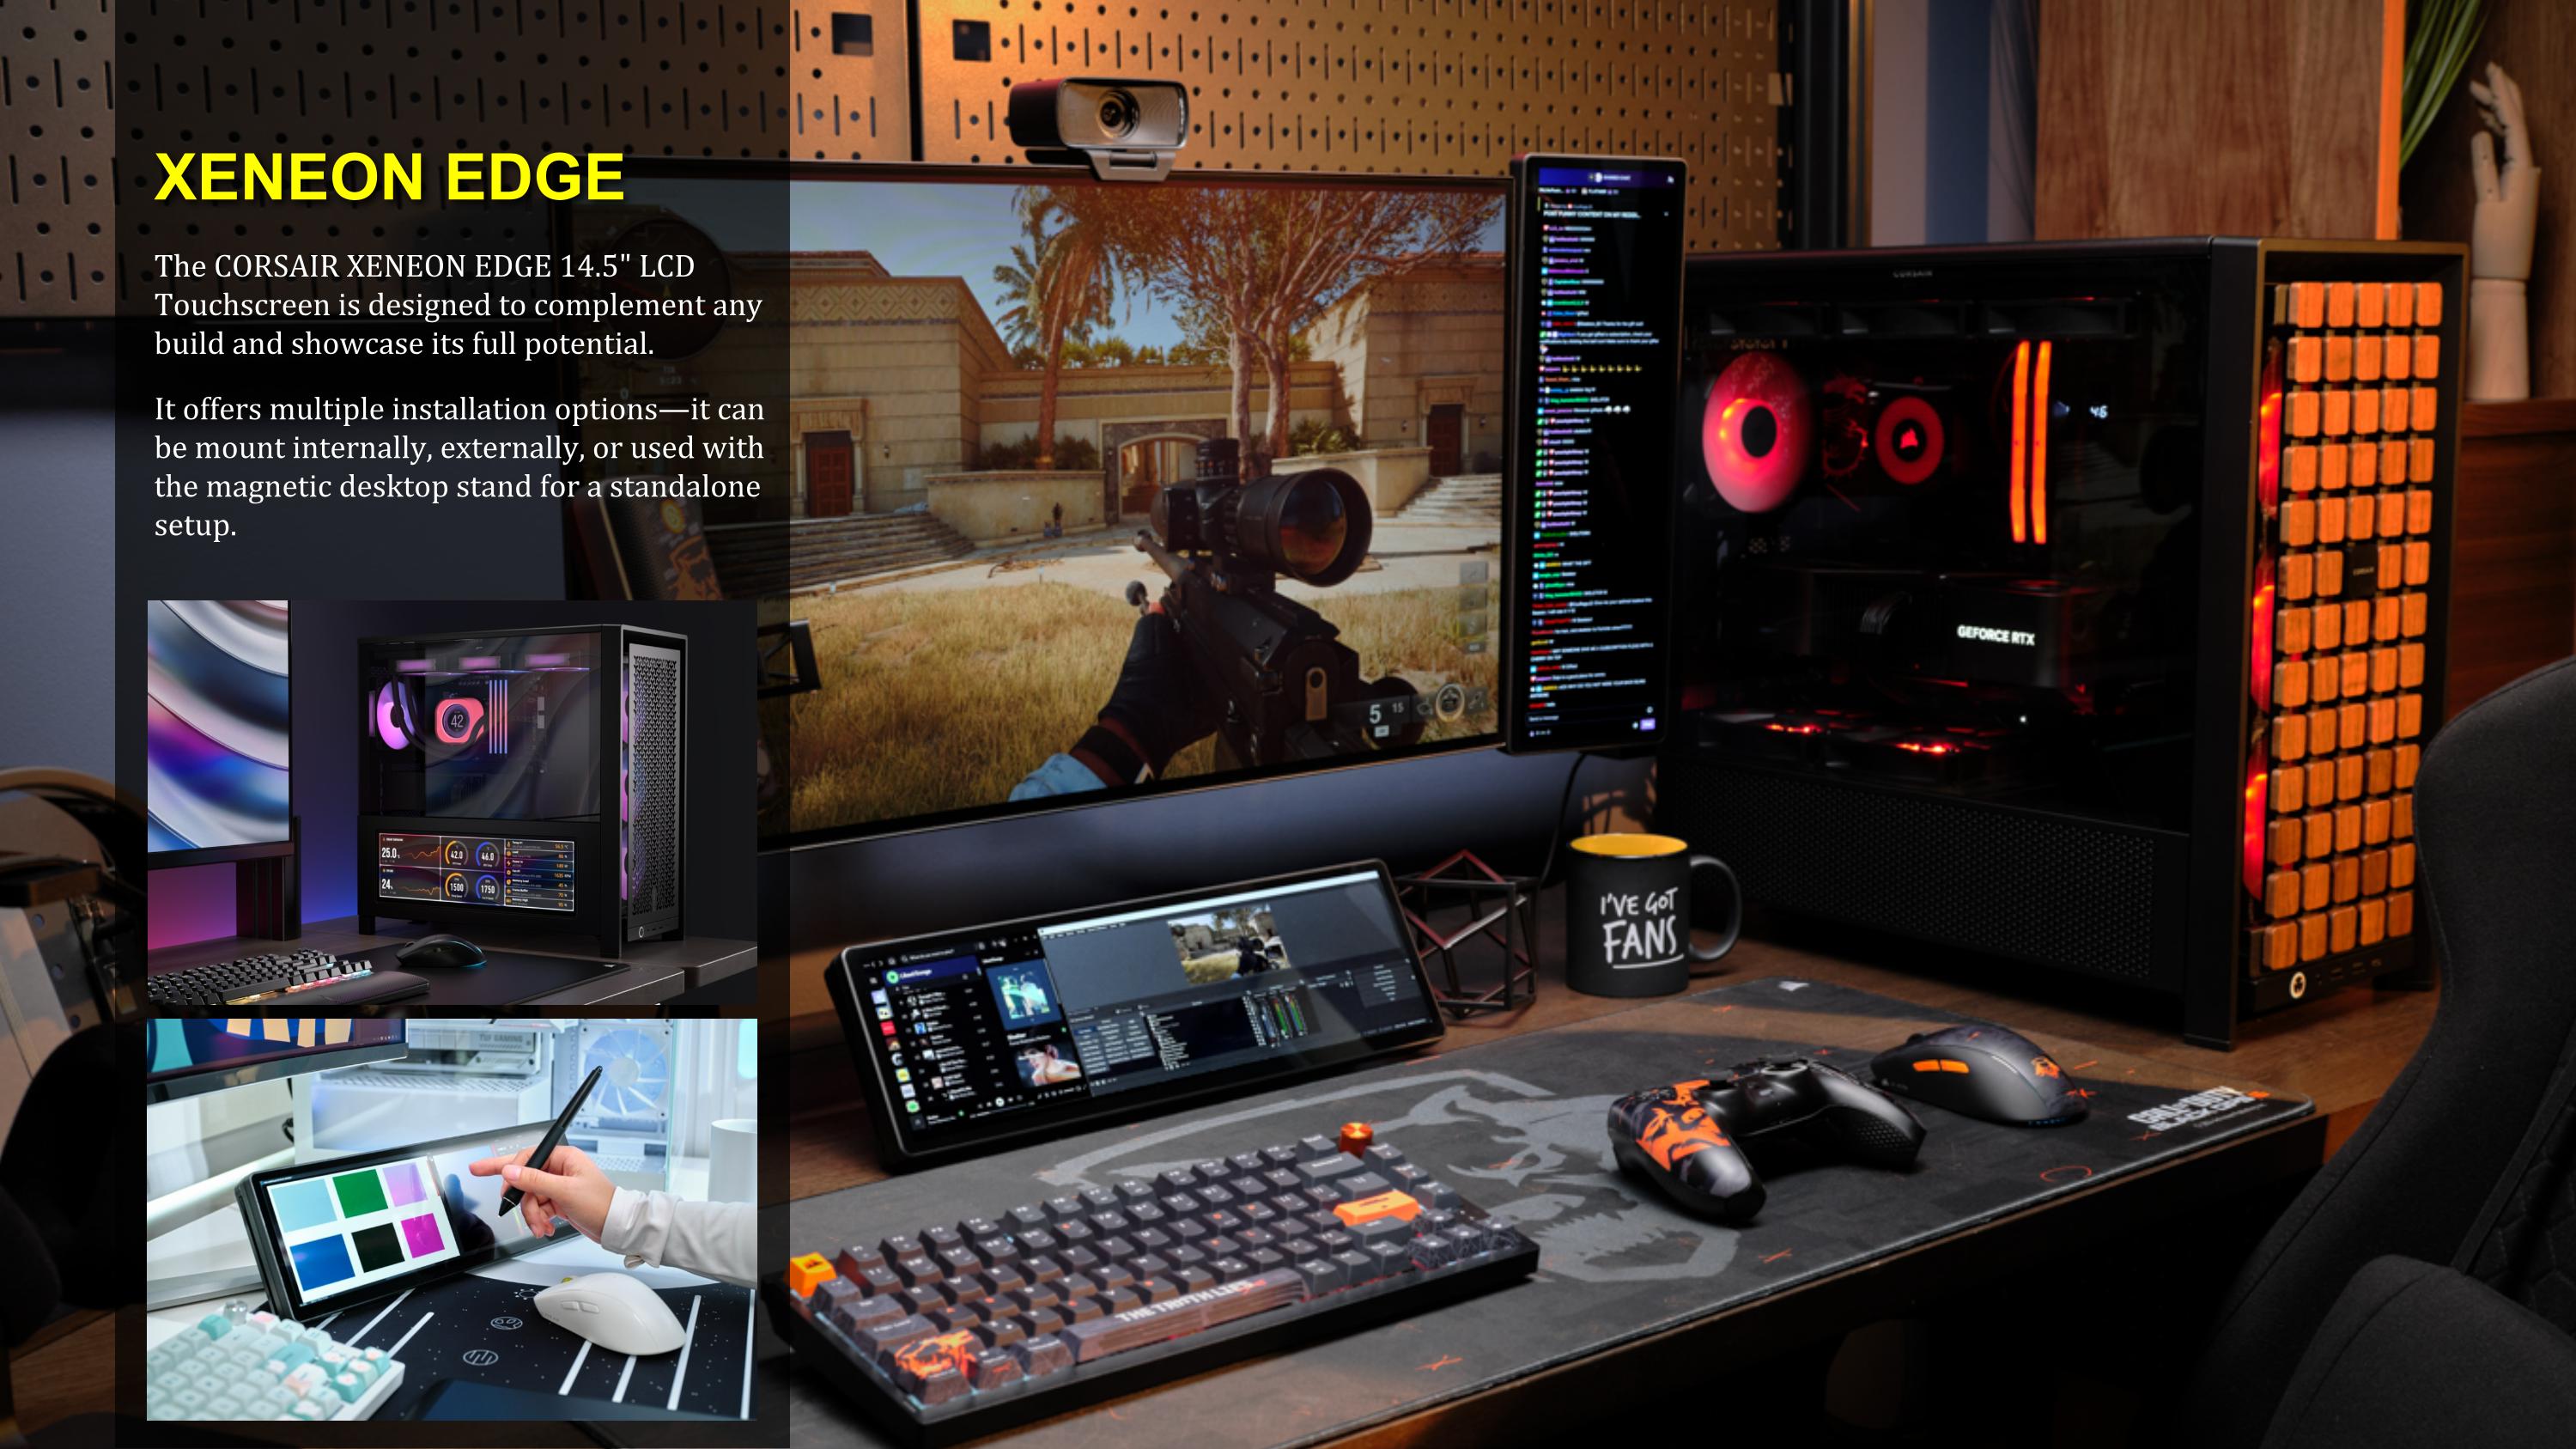
The CORSAIR XENEON EDGE 14.5" LCD Touchscreen is designed to complement any build and showcase its full potential. It offers multiple installation options—it can be mount internally, externally, or used with the magnetic desktop stand for a standalone setup. XENEON EDGE
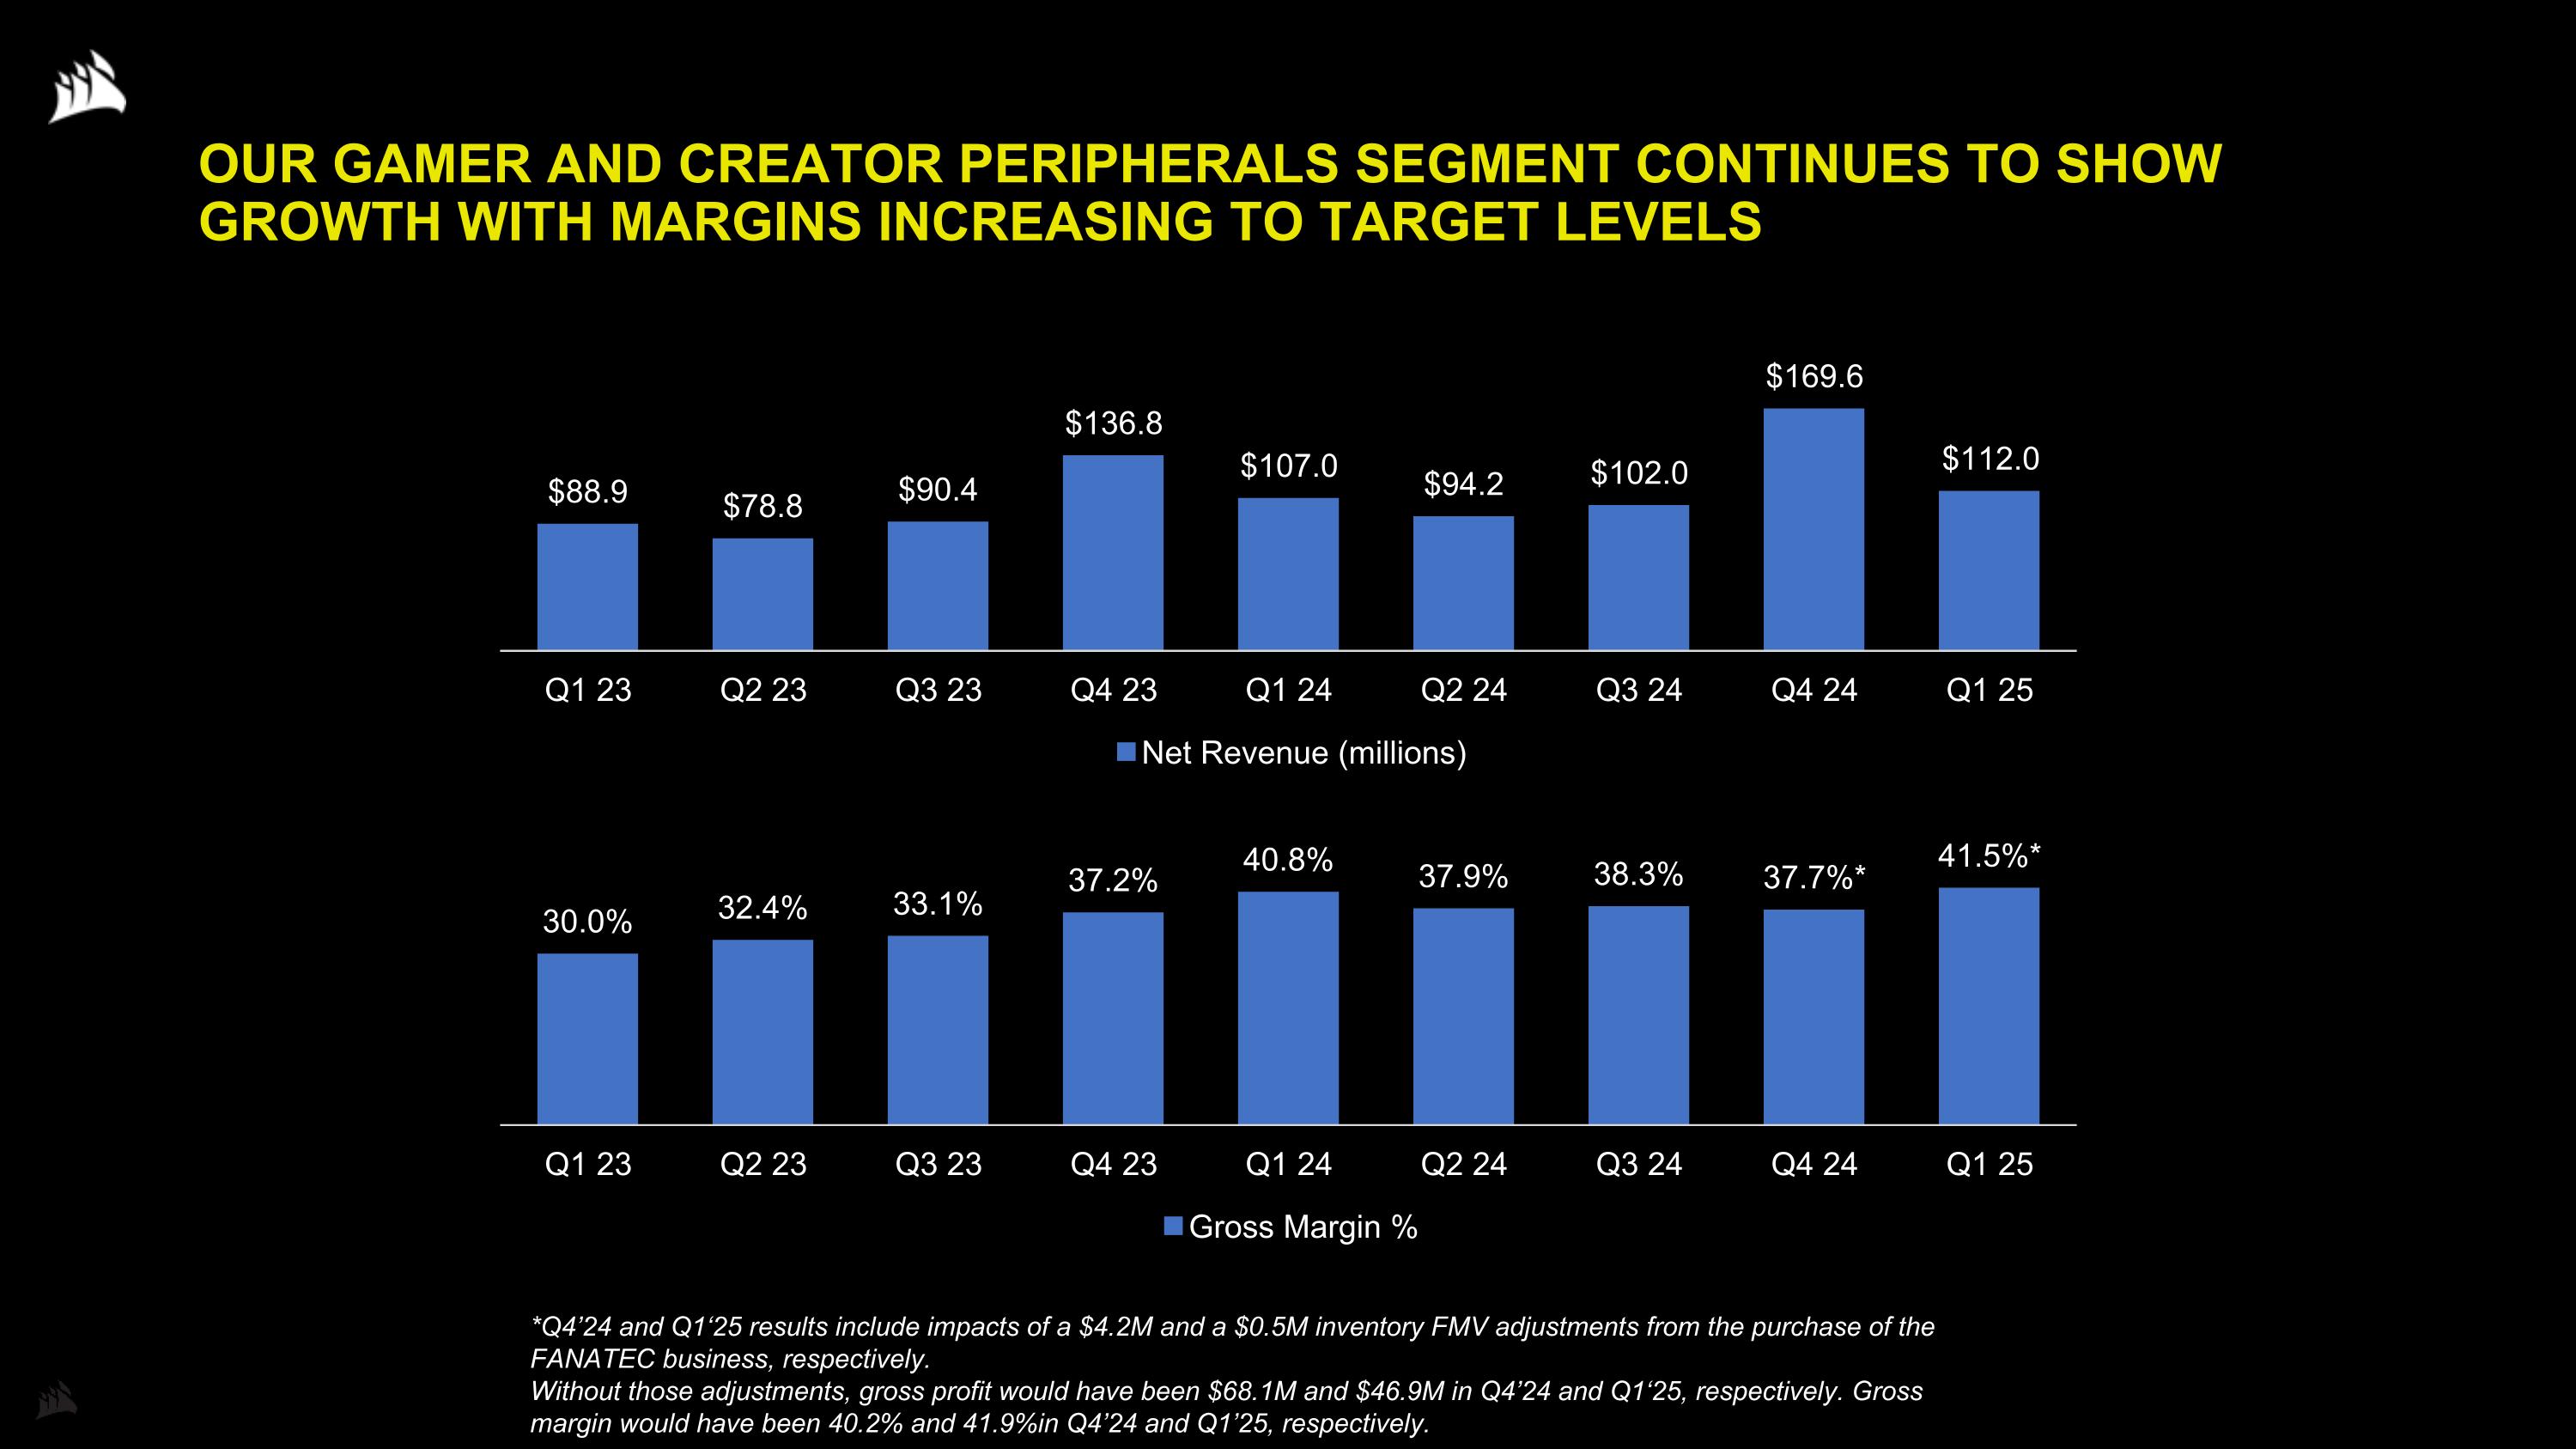
OUR GAMER AND CREATOR PERIPHERALS SEGMENT CONTINUES TO SHOW GROWTH WITH MARGINS INCREASING TO TARGET LEVELS *Q4’24 and Q1‘25 results include impacts of a $4.2M and a $0.5M inventory FMV adjustments from the purchase of the FANATEC business, respectively. Without those adjustments, gross profit would have been $68.1M and $46.9M in Q4’24 and Q1‘25, respectively. Gross margin would have been 40.2% and 41.9%in Q4’24 and Q1’25, respectively.

FINANCIAL RESULTS
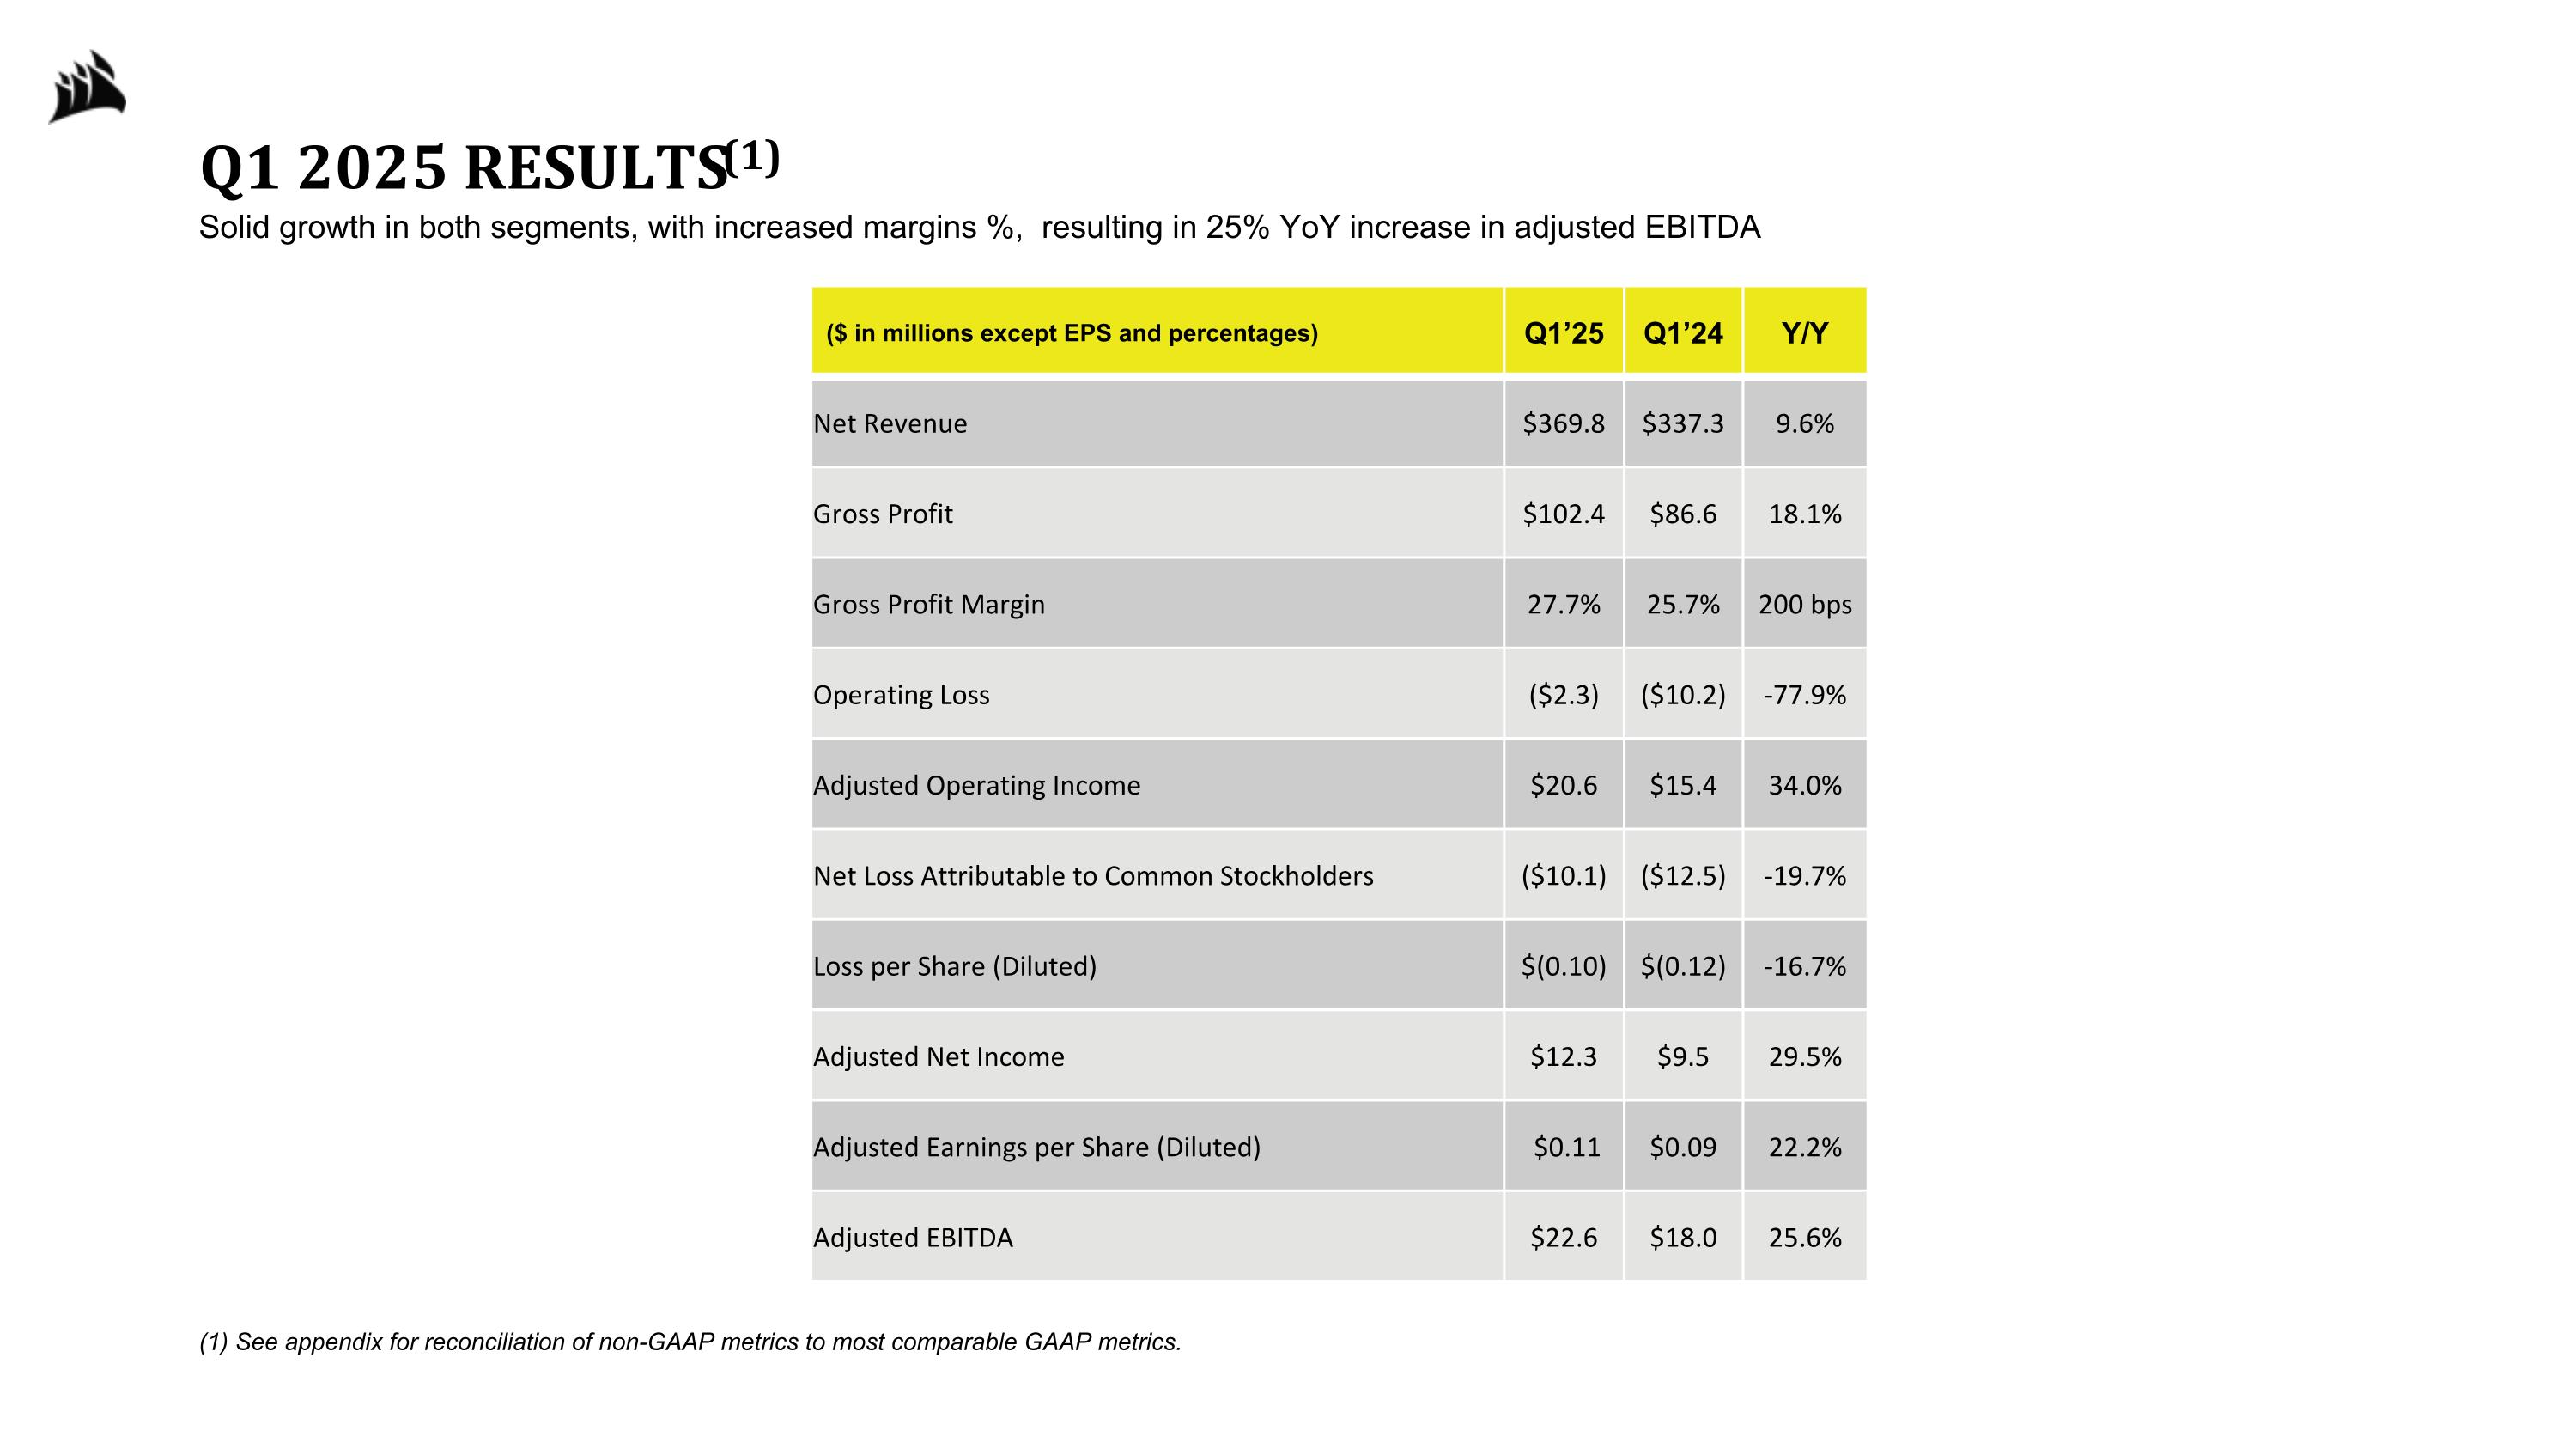
Q1 2025 RESULTS(1) Solid growth in both segments, with increased margins %, resulting in 25% YoY increase in adjusted EBITDA (1) See appendix for reconciliation of non-GAAP metrics to most comparable GAAP metrics. ($ in millions except EPS and percentages) Q1’25 Q1’24 Y/Y Net Revenue $369.8 $337.3 9.6% Gross Profit $102.4 $86.6 18.1% Gross Profit Margin 27.7% 25.7% 200 bps Operating Loss ($2.3) ($10.2) -77.9% Adjusted Operating Income $20.6 $15.4 34.0% Net Loss Attributable to Common Stockholders ($10.1) ($12.5) -19.7% Loss per Share (Diluted) $(0.10) $(0.12) -16.7% Adjusted Net Income $12.3 $9.5 29.5% Adjusted Earnings per Share (Diluted) $0.11 $0.09 22.2% Adjusted EBITDA $22.6 $18.0 25.6%
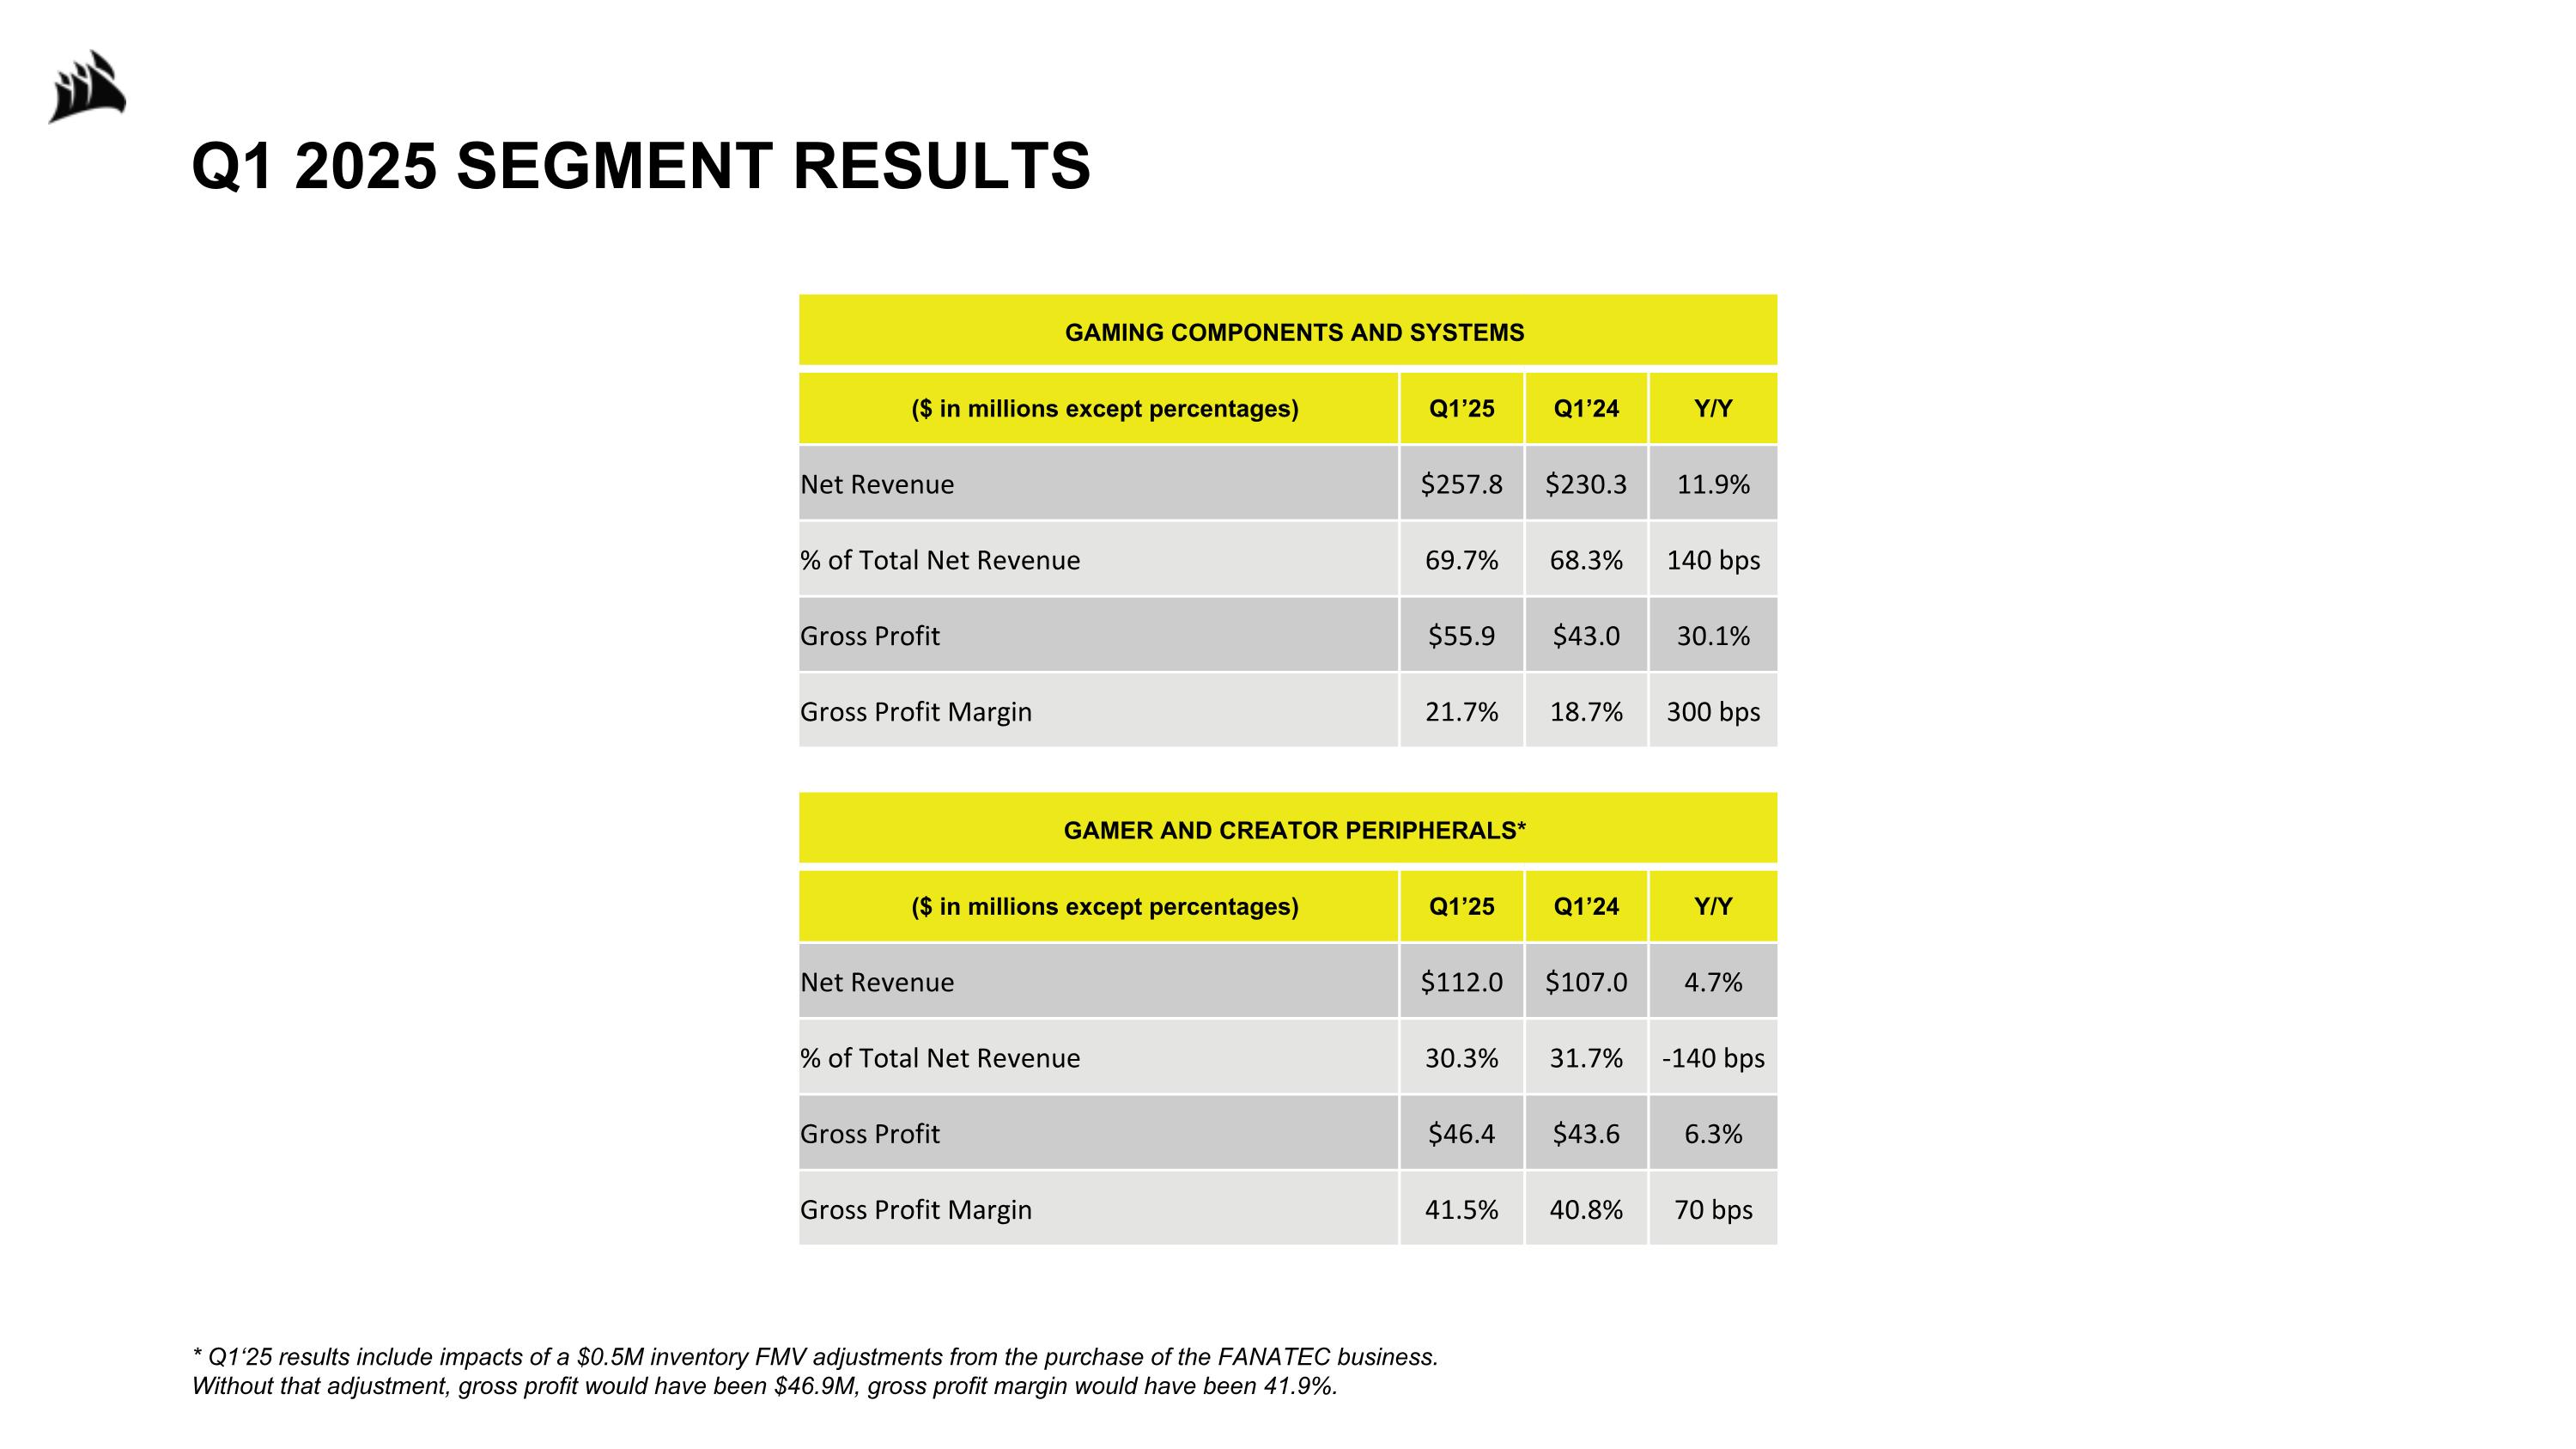
Q1 2025 SEGMENT RESULTS GAMING COMPONENTS AND SYSTEMS ($ in millions except percentages) Q1’25 Q1’24 Y/Y Net Revenue $257.8 $230.3 11.9% % of Total Net Revenue 69.7% 68.3% 140 bps Gross Profit $55.9 $43.0 30.1% Gross Profit Margin 21.7% 18.7% 300 bps GAMER AND CREATOR PERIPHERALS* ($ in millions except percentages) Q1’25 Q1’24 Y/Y Net Revenue $112.0 $107.0 4.7% % of Total Net Revenue 30.3% 31.7% -140 bps Gross Profit $46.4 $43.6 6.3% Gross Profit Margin 41.5% 40.8% 70 bps * Q1‘25 results include impacts of a $0.5M inventory FMV adjustments from the purchase of the FANATEC business. Without that adjustment, gross profit would have been $46.9M, gross profit margin would have been 41.9%.
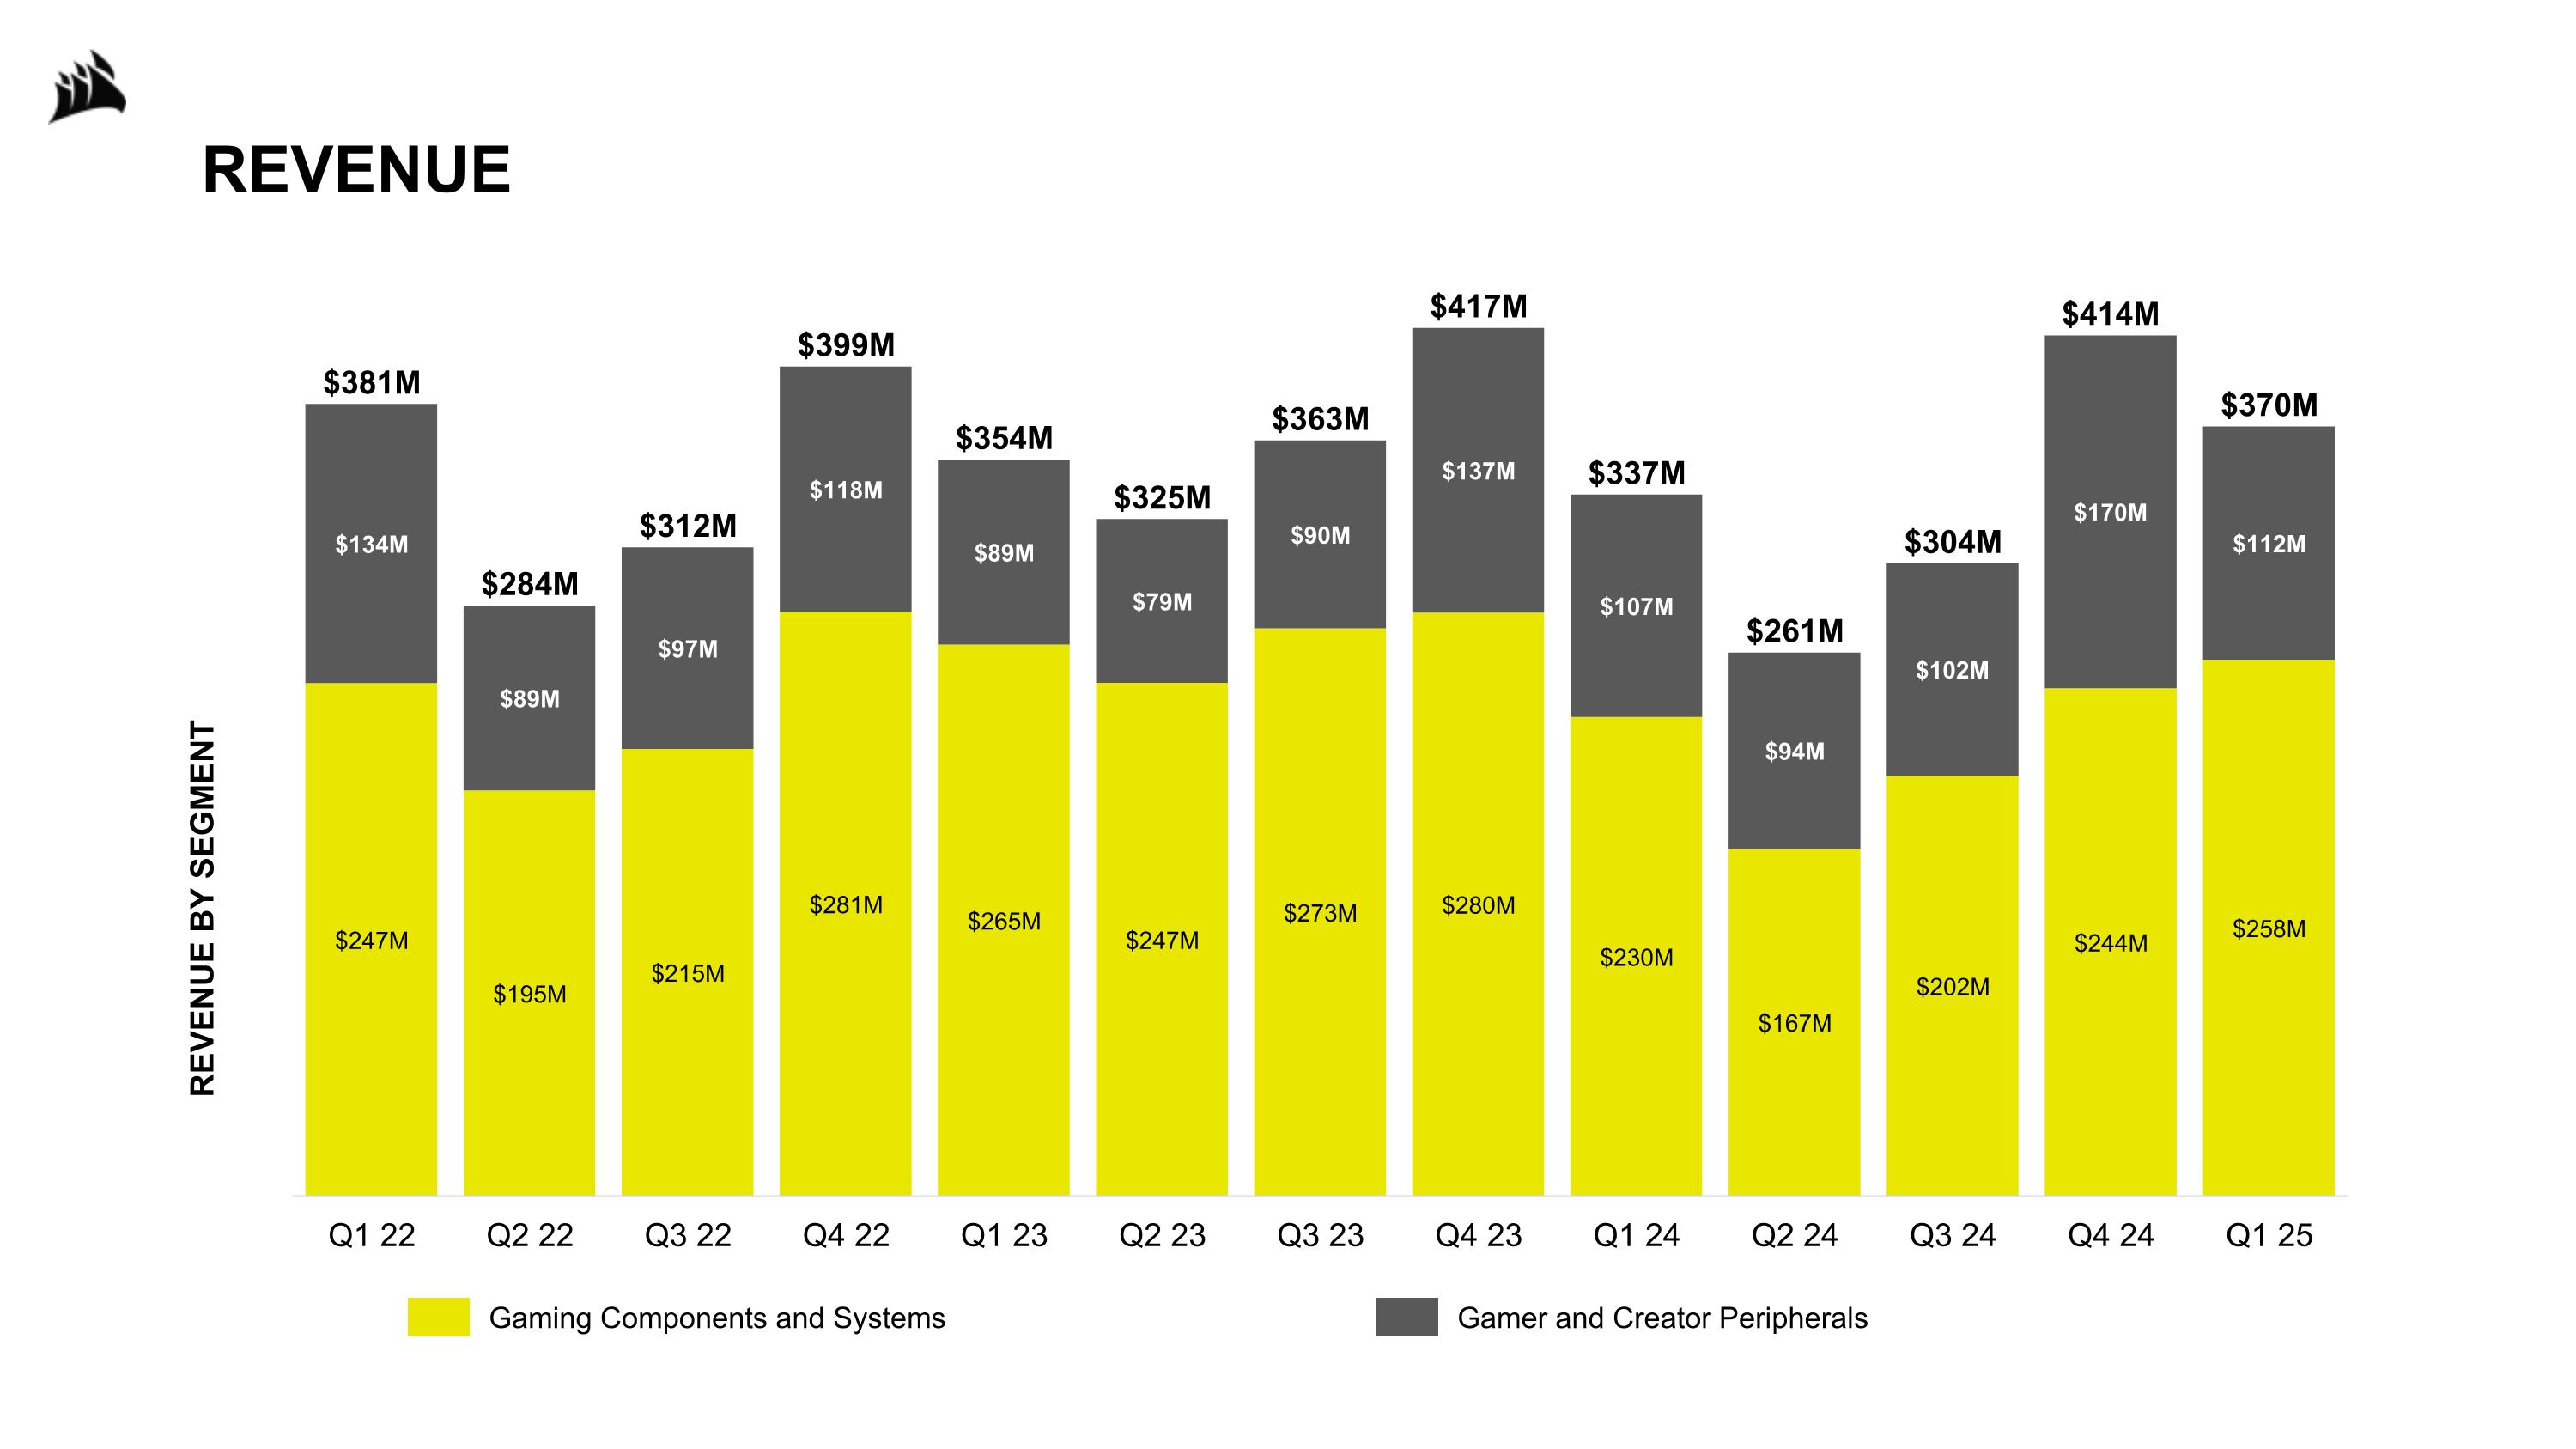
REVENUE BY SEGMENT Gaming Components and Systems Gamer and Creator Peripherals REVENUE
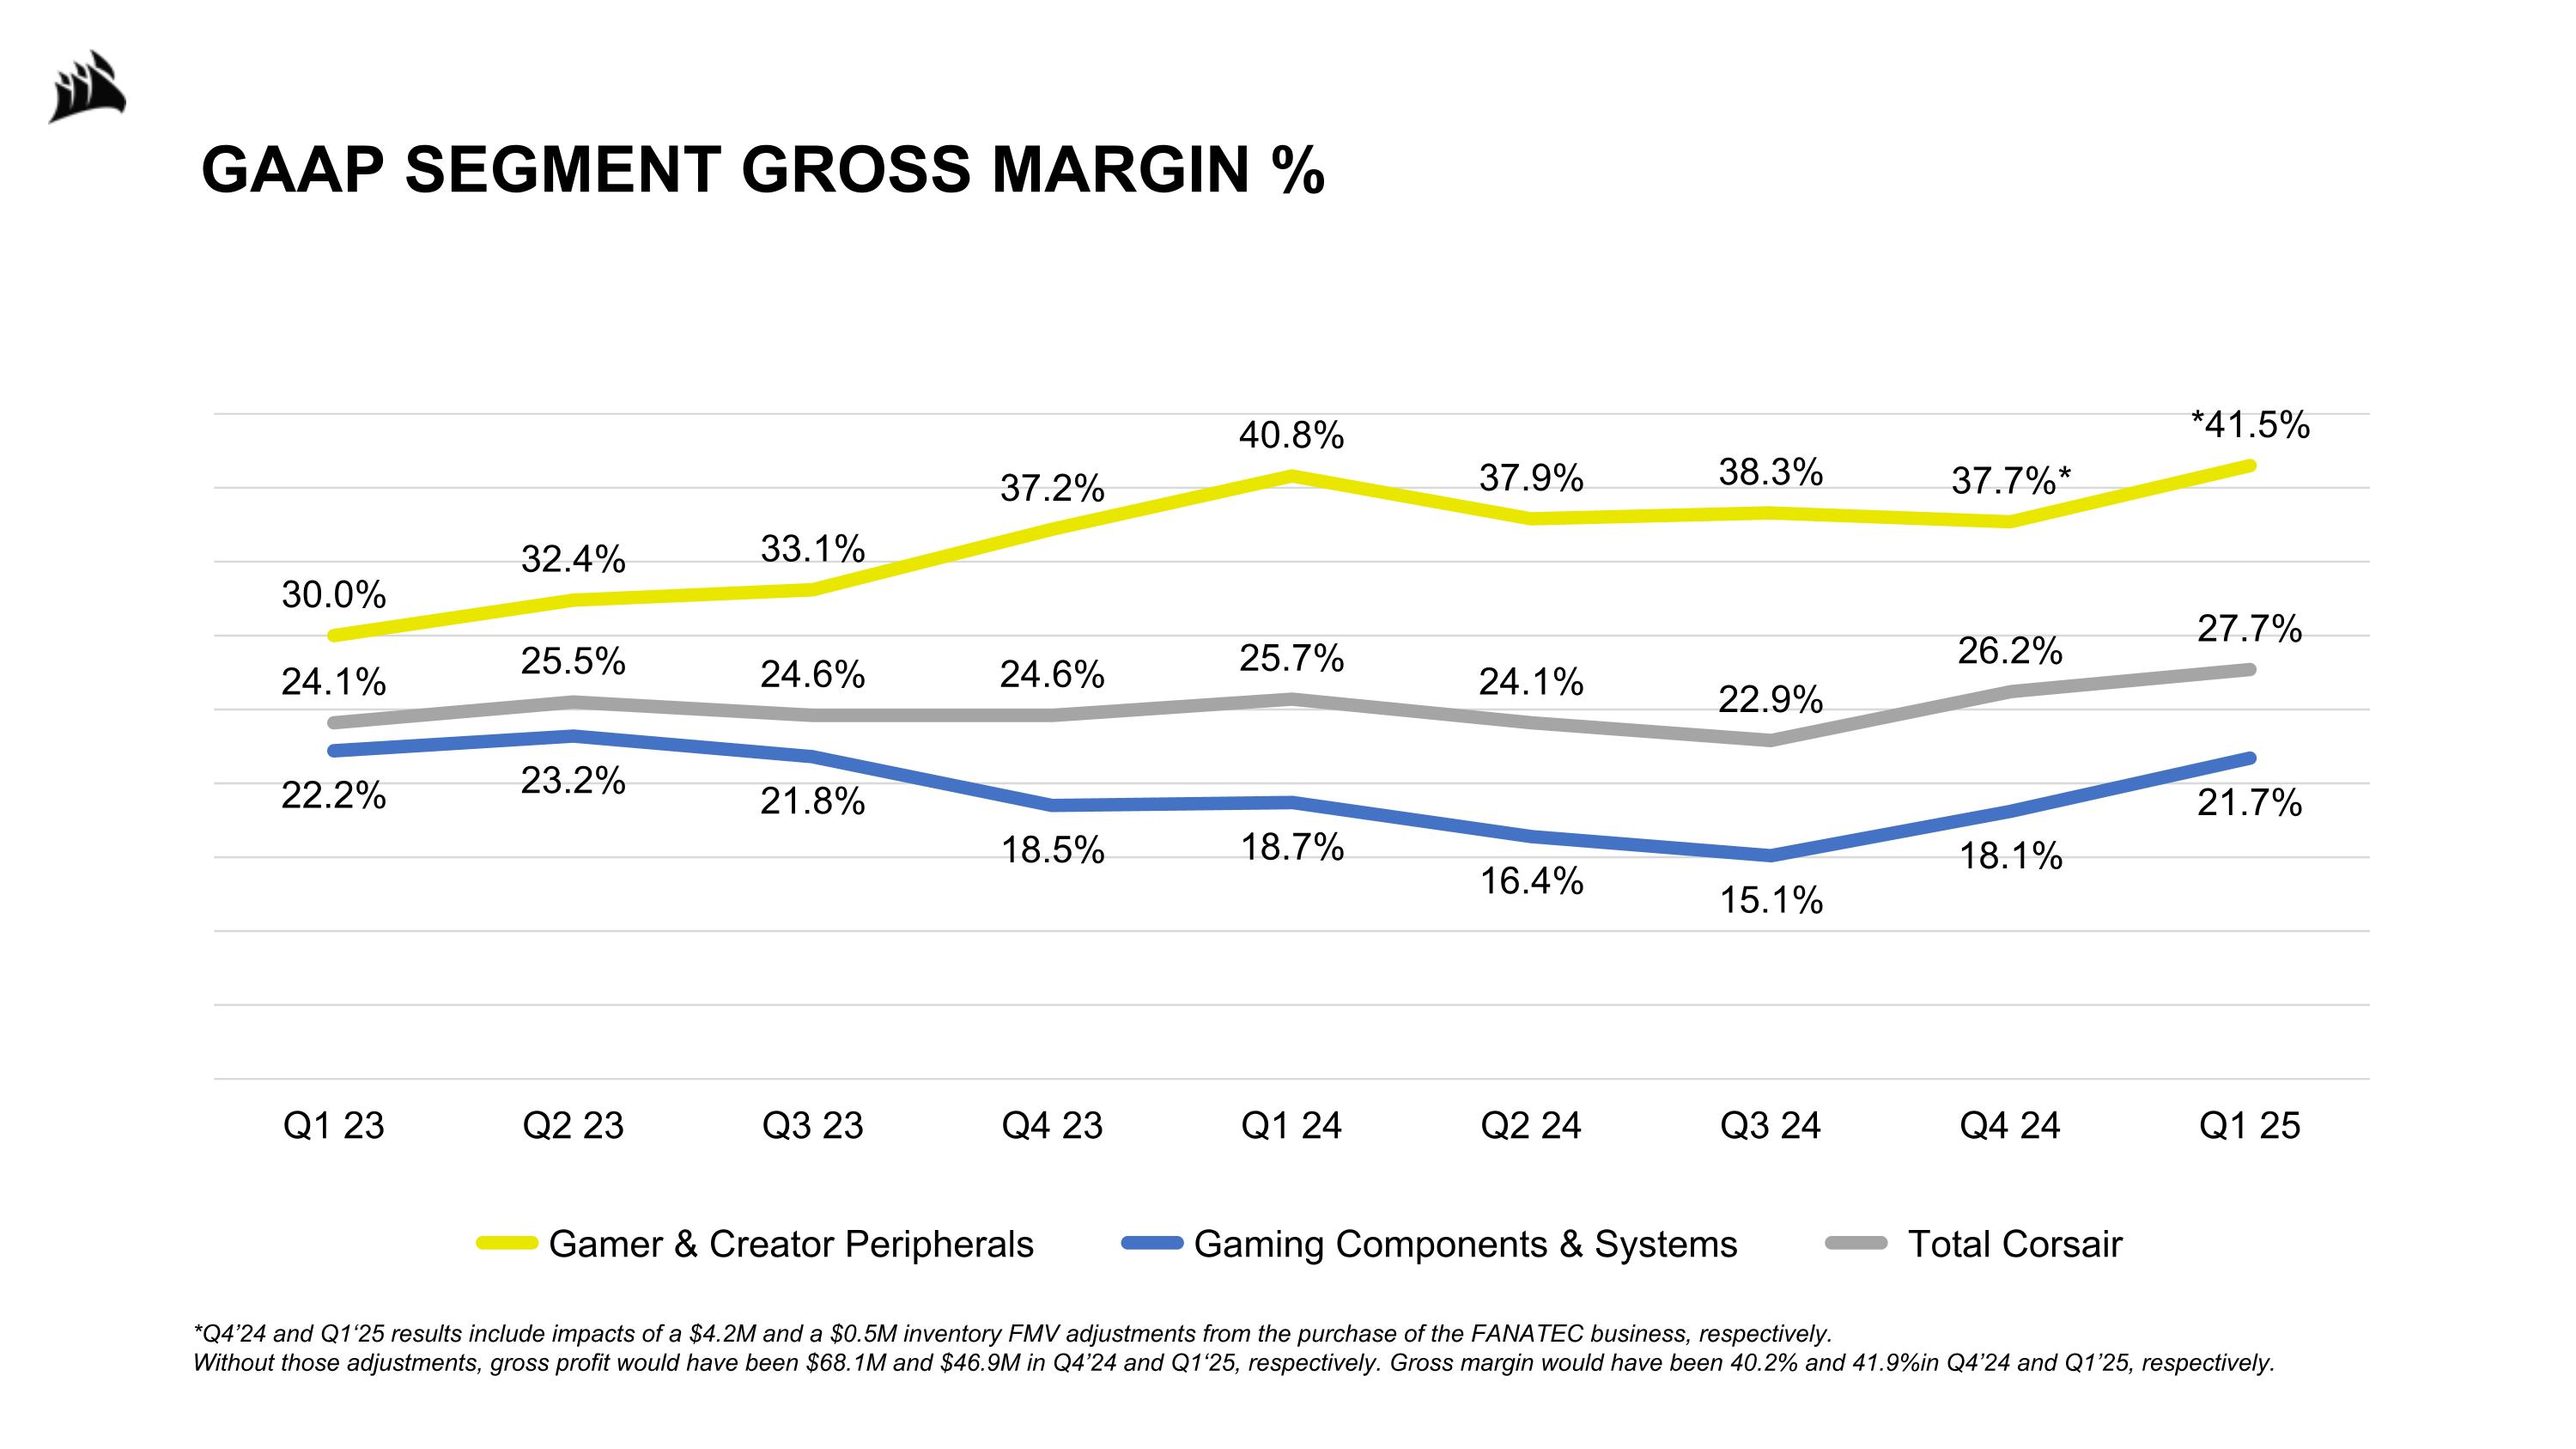
GAAP SEGMENT GROSS MARGIN % *Q4’24 and Q1‘25 results include impacts of a $4.2M and a $0.5M inventory FMV adjustments from the purchase of the FANATEC business, respectively. Without those adjustments, gross profit would have been $68.1M and $46.9M in Q4’24 and Q1‘25, respectively. Gross margin would have been 40.2% and 41.9%in Q4’24 and Q1’25, respectively.
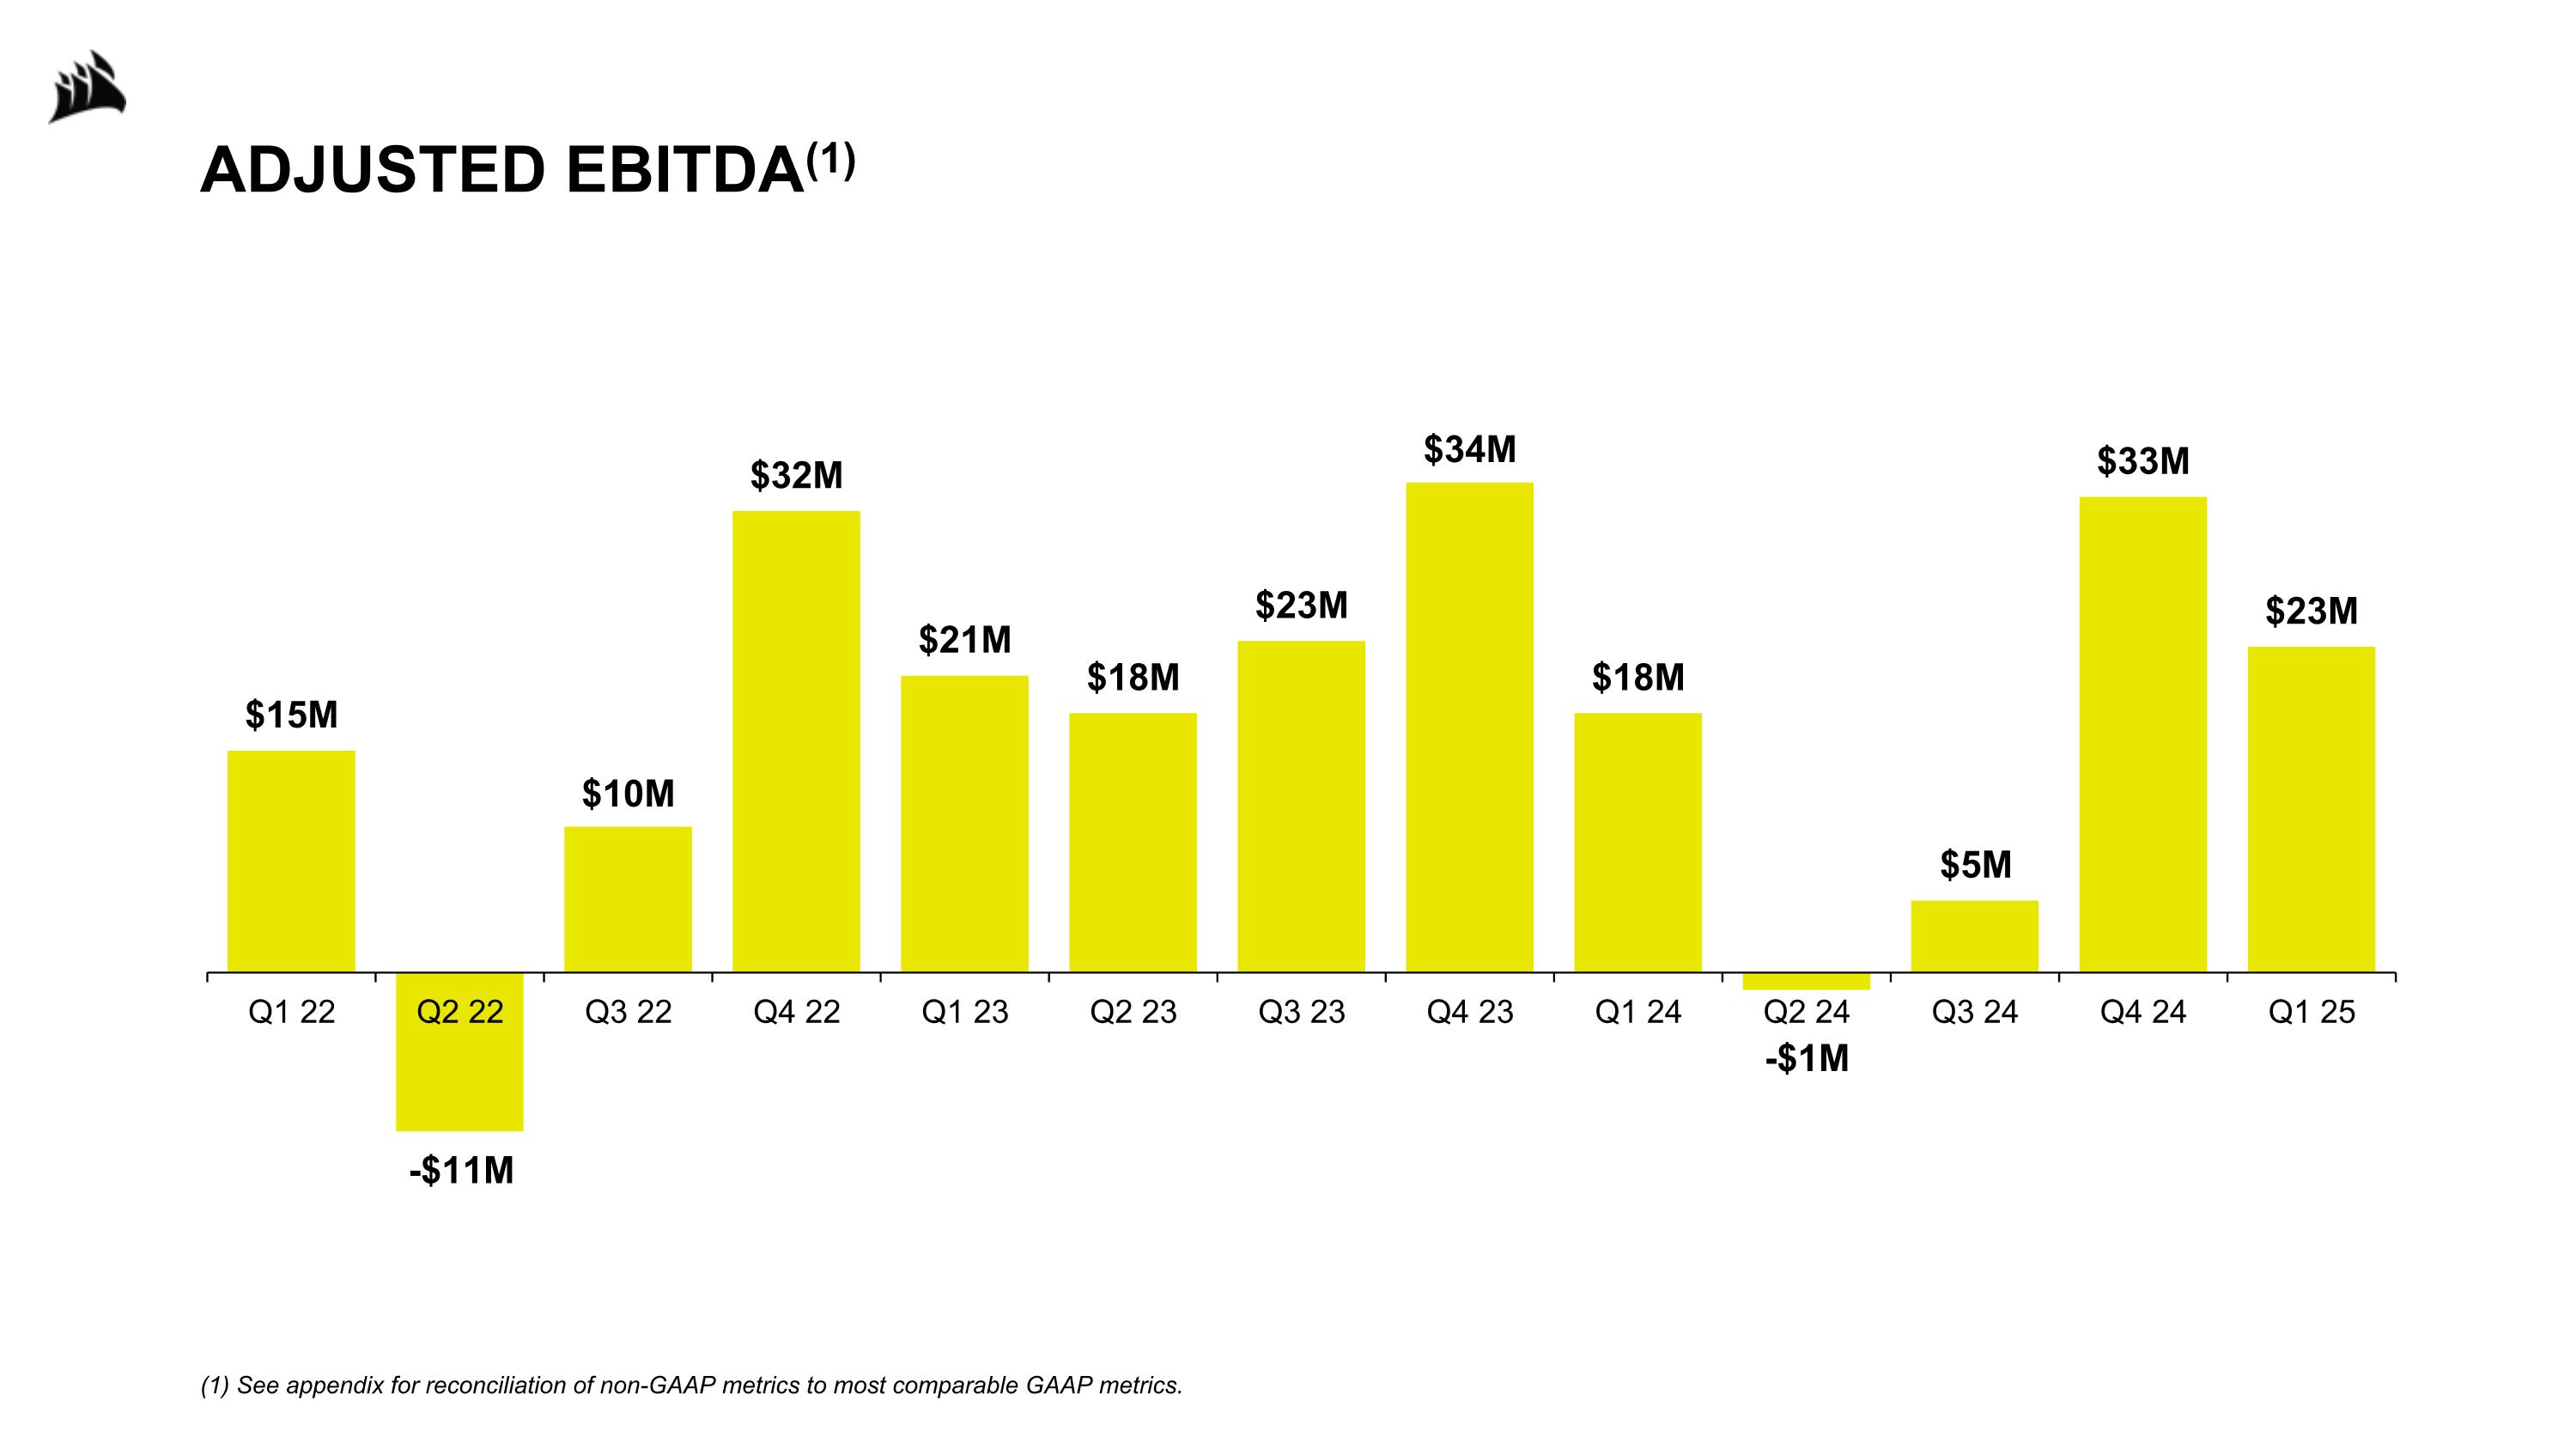
ADJUSTED EBITDA(1) (1) See appendix for reconciliation of non-GAAP metrics to most comparable GAAP metrics.
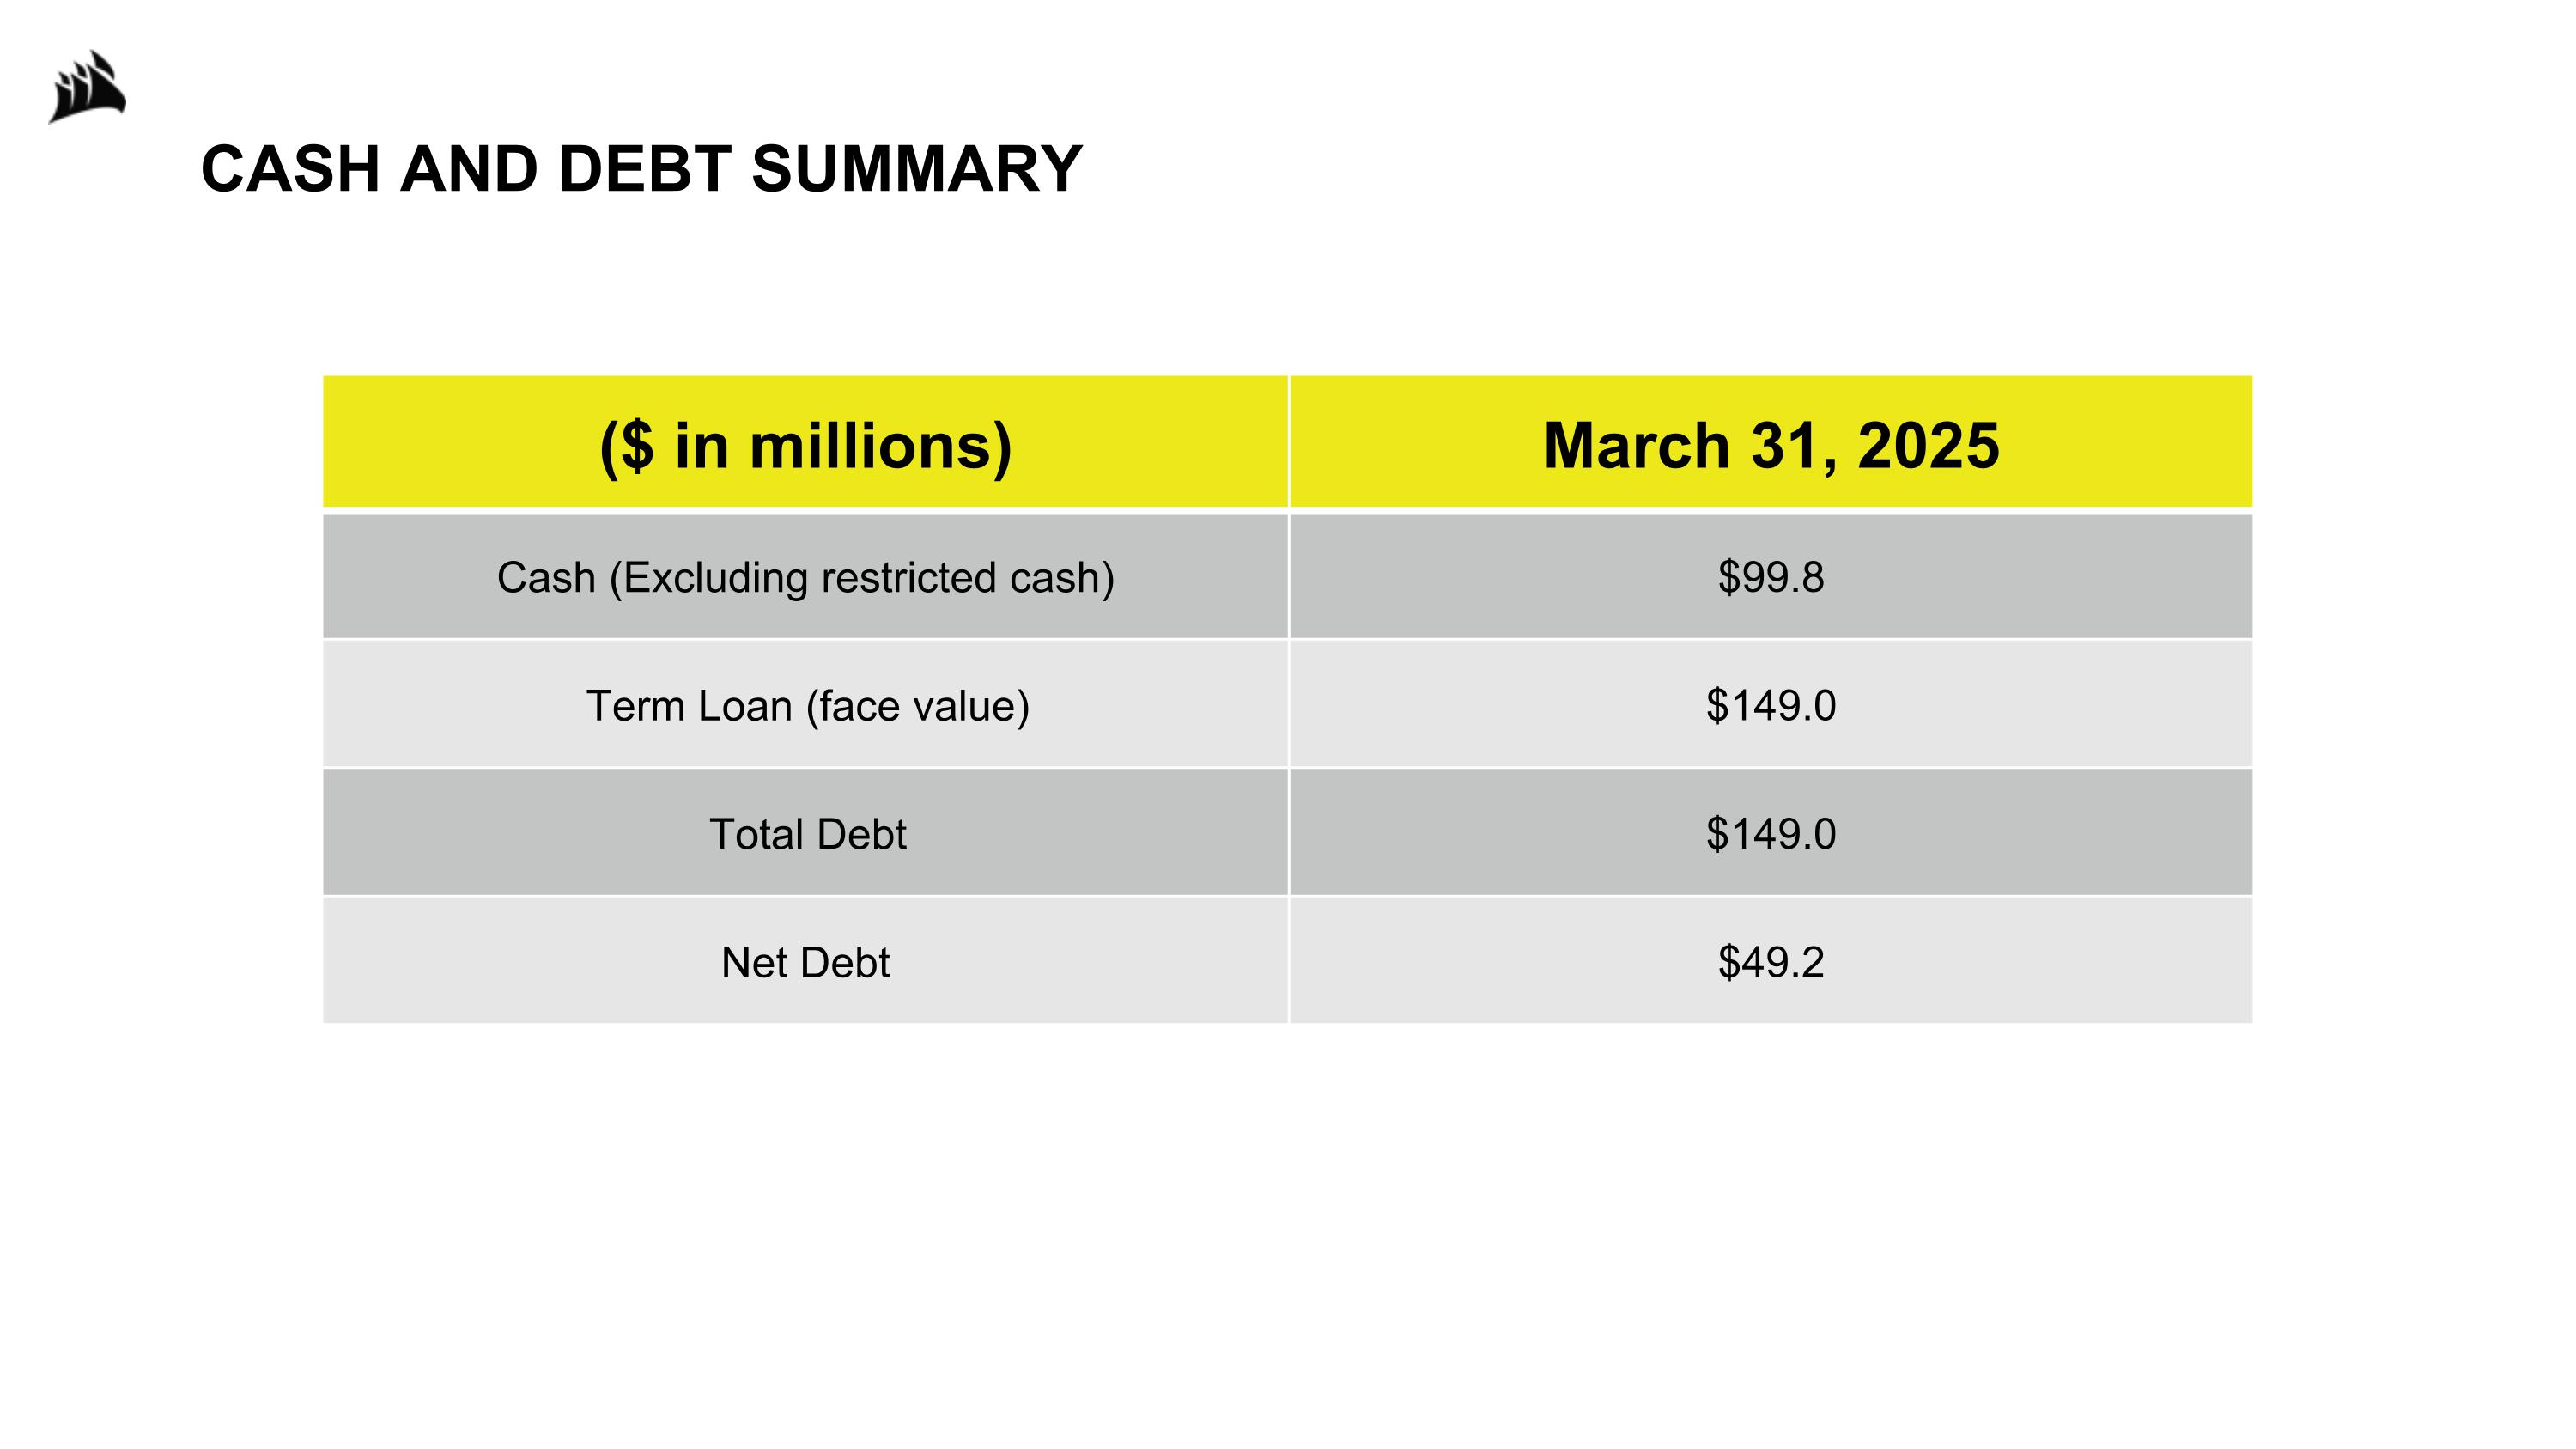
CASH AND DEBT SUMMARY ($ in millions) March 31, 2025 Cash (Excluding restricted cash) $99.8 Term Loan (face value) $149.0 Total Debt $149.0 Net Debt $49.2
APPENDIX
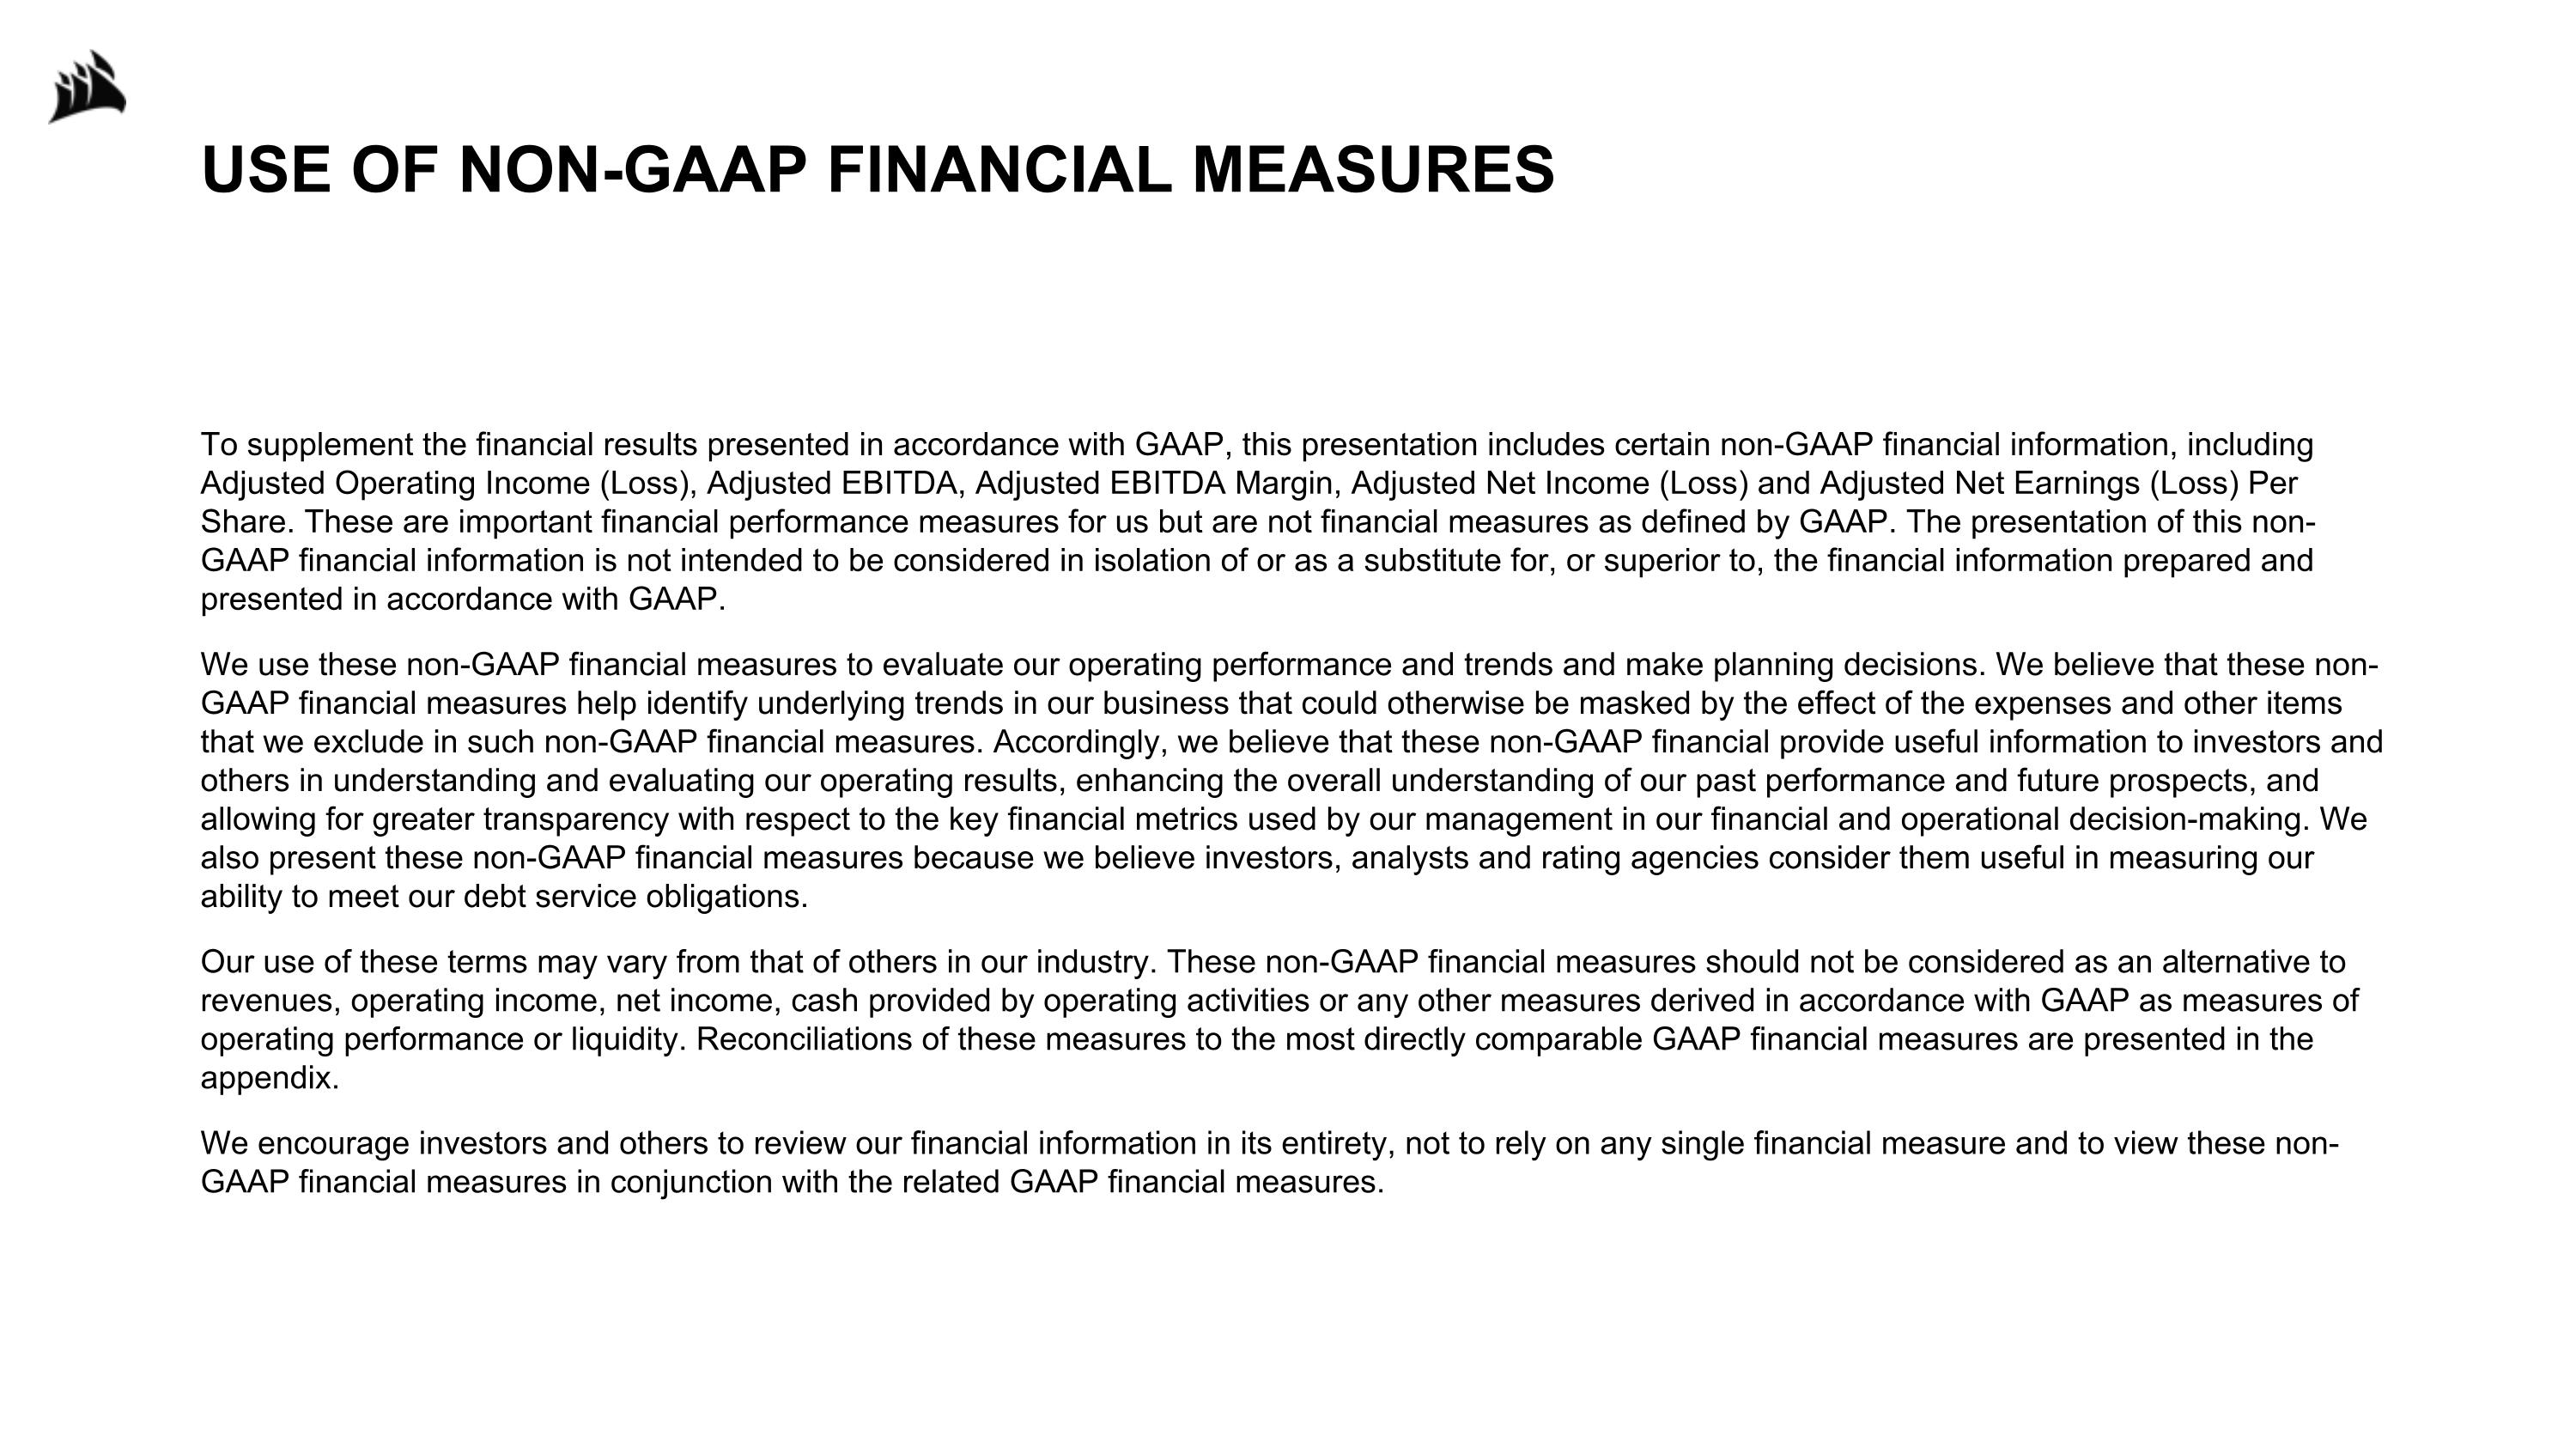
USE OF NON-GAAP FINANCIAL MEASURES To supplement the financial results presented in accordance with GAAP, this presentation includes certain non-GAAP financial information, including Adjusted Operating Income (Loss), Adjusted EBITDA, Adjusted EBITDA Margin, Adjusted Net Income (Loss) and Adjusted Net Earnings (Loss) Per Share. These are important financial performance measures for us but are not financial measures as defined by GAAP. The presentation of this non-GAAP financial information is not intended to be considered in isolation of or as a substitute for, or superior to, the financial information prepared and presented in accordance with GAAP. We use these non-GAAP financial measures to evaluate our operating performance and trends and make planning decisions. We believe that these non-GAAP financial measures help identify underlying trends in our business that could otherwise be masked by the effect of the expenses and other items that we exclude in such non-GAAP financial measures. Accordingly, we believe that these non-GAAP financial provide useful information to investors and others in understanding and evaluating our operating results, enhancing the overall understanding of our past performance and future prospects, and allowing for greater transparency with respect to the key financial metrics used by our management in our financial and operational decision-making. We also present these non-GAAP financial measures because we believe investors, analysts and rating agencies consider them useful in measuring our ability to meet our debt service obligations. Our use of these terms may vary from that of others in our industry. These non-GAAP financial measures should not be considered as an alternative to revenues, operating income, net income, cash provided by operating activities or any other measures derived in accordance with GAAP as measures of operating performance or liquidity. Reconciliations of these measures to the most directly comparable GAAP financial measures are presented in the appendix. We encourage investors and others to review our financial information in its entirety, not to rely on any single financial measure and to view these non-GAAP financial measures in conjunction with the related GAAP financial measures.
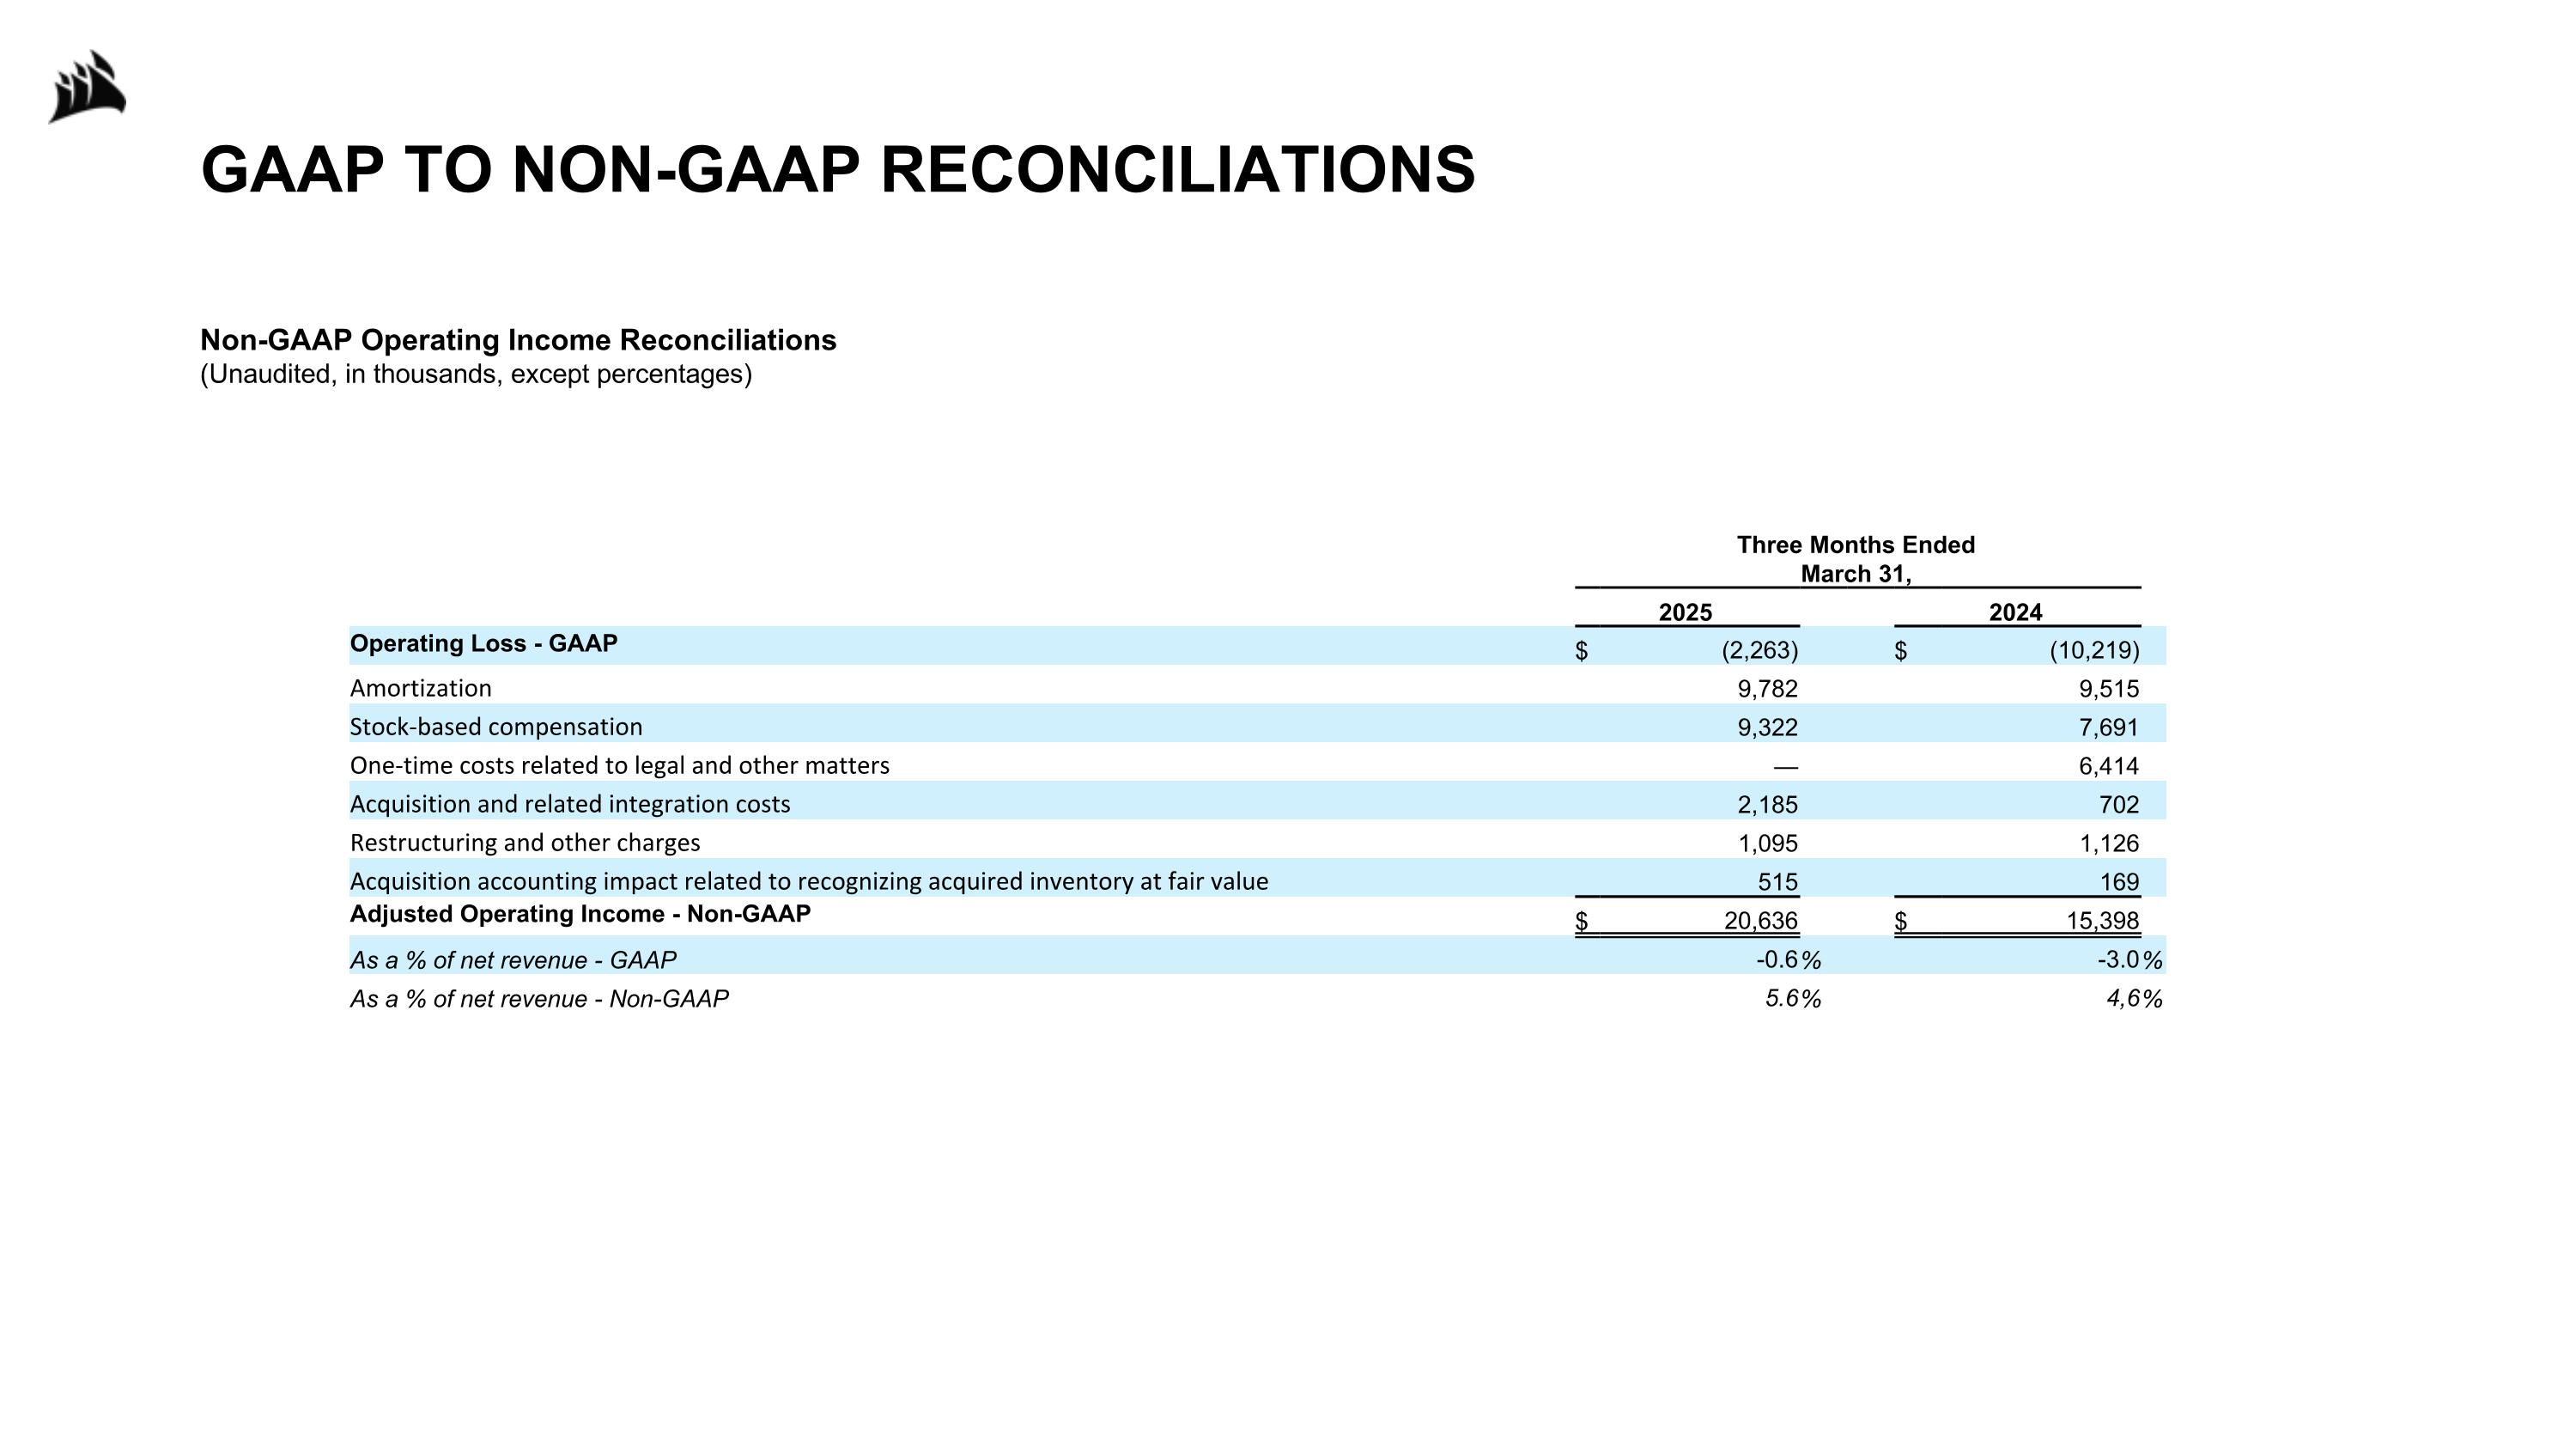
GAAP TO NON-GAAP RECONCILIATIONS Non-GAAP Operating Income Reconciliations (Unaudited, in thousands, except percentages) Three Months Ended�March 31, 2025 2024 Operating Loss - GAAP $ (2,263) $ (10,219) Amortization 9,782 9,515 Stock-based compensation 9,322 7,691 One-time costs related to legal and other matters — 6,414 Acquisition and related integration costs 2,185 702 Restructuring and other charges 1,095 1,126 Acquisition accounting impact related to recognizing acquired inventory at fair value 515 169 Adjusted Operating Income - Non-GAAP $ 20,636 $ 15,398 As a % of net revenue - GAAP -0.6 % -3.0 % As a % of net revenue - Non-GAAP 5.6 % 4,6 %
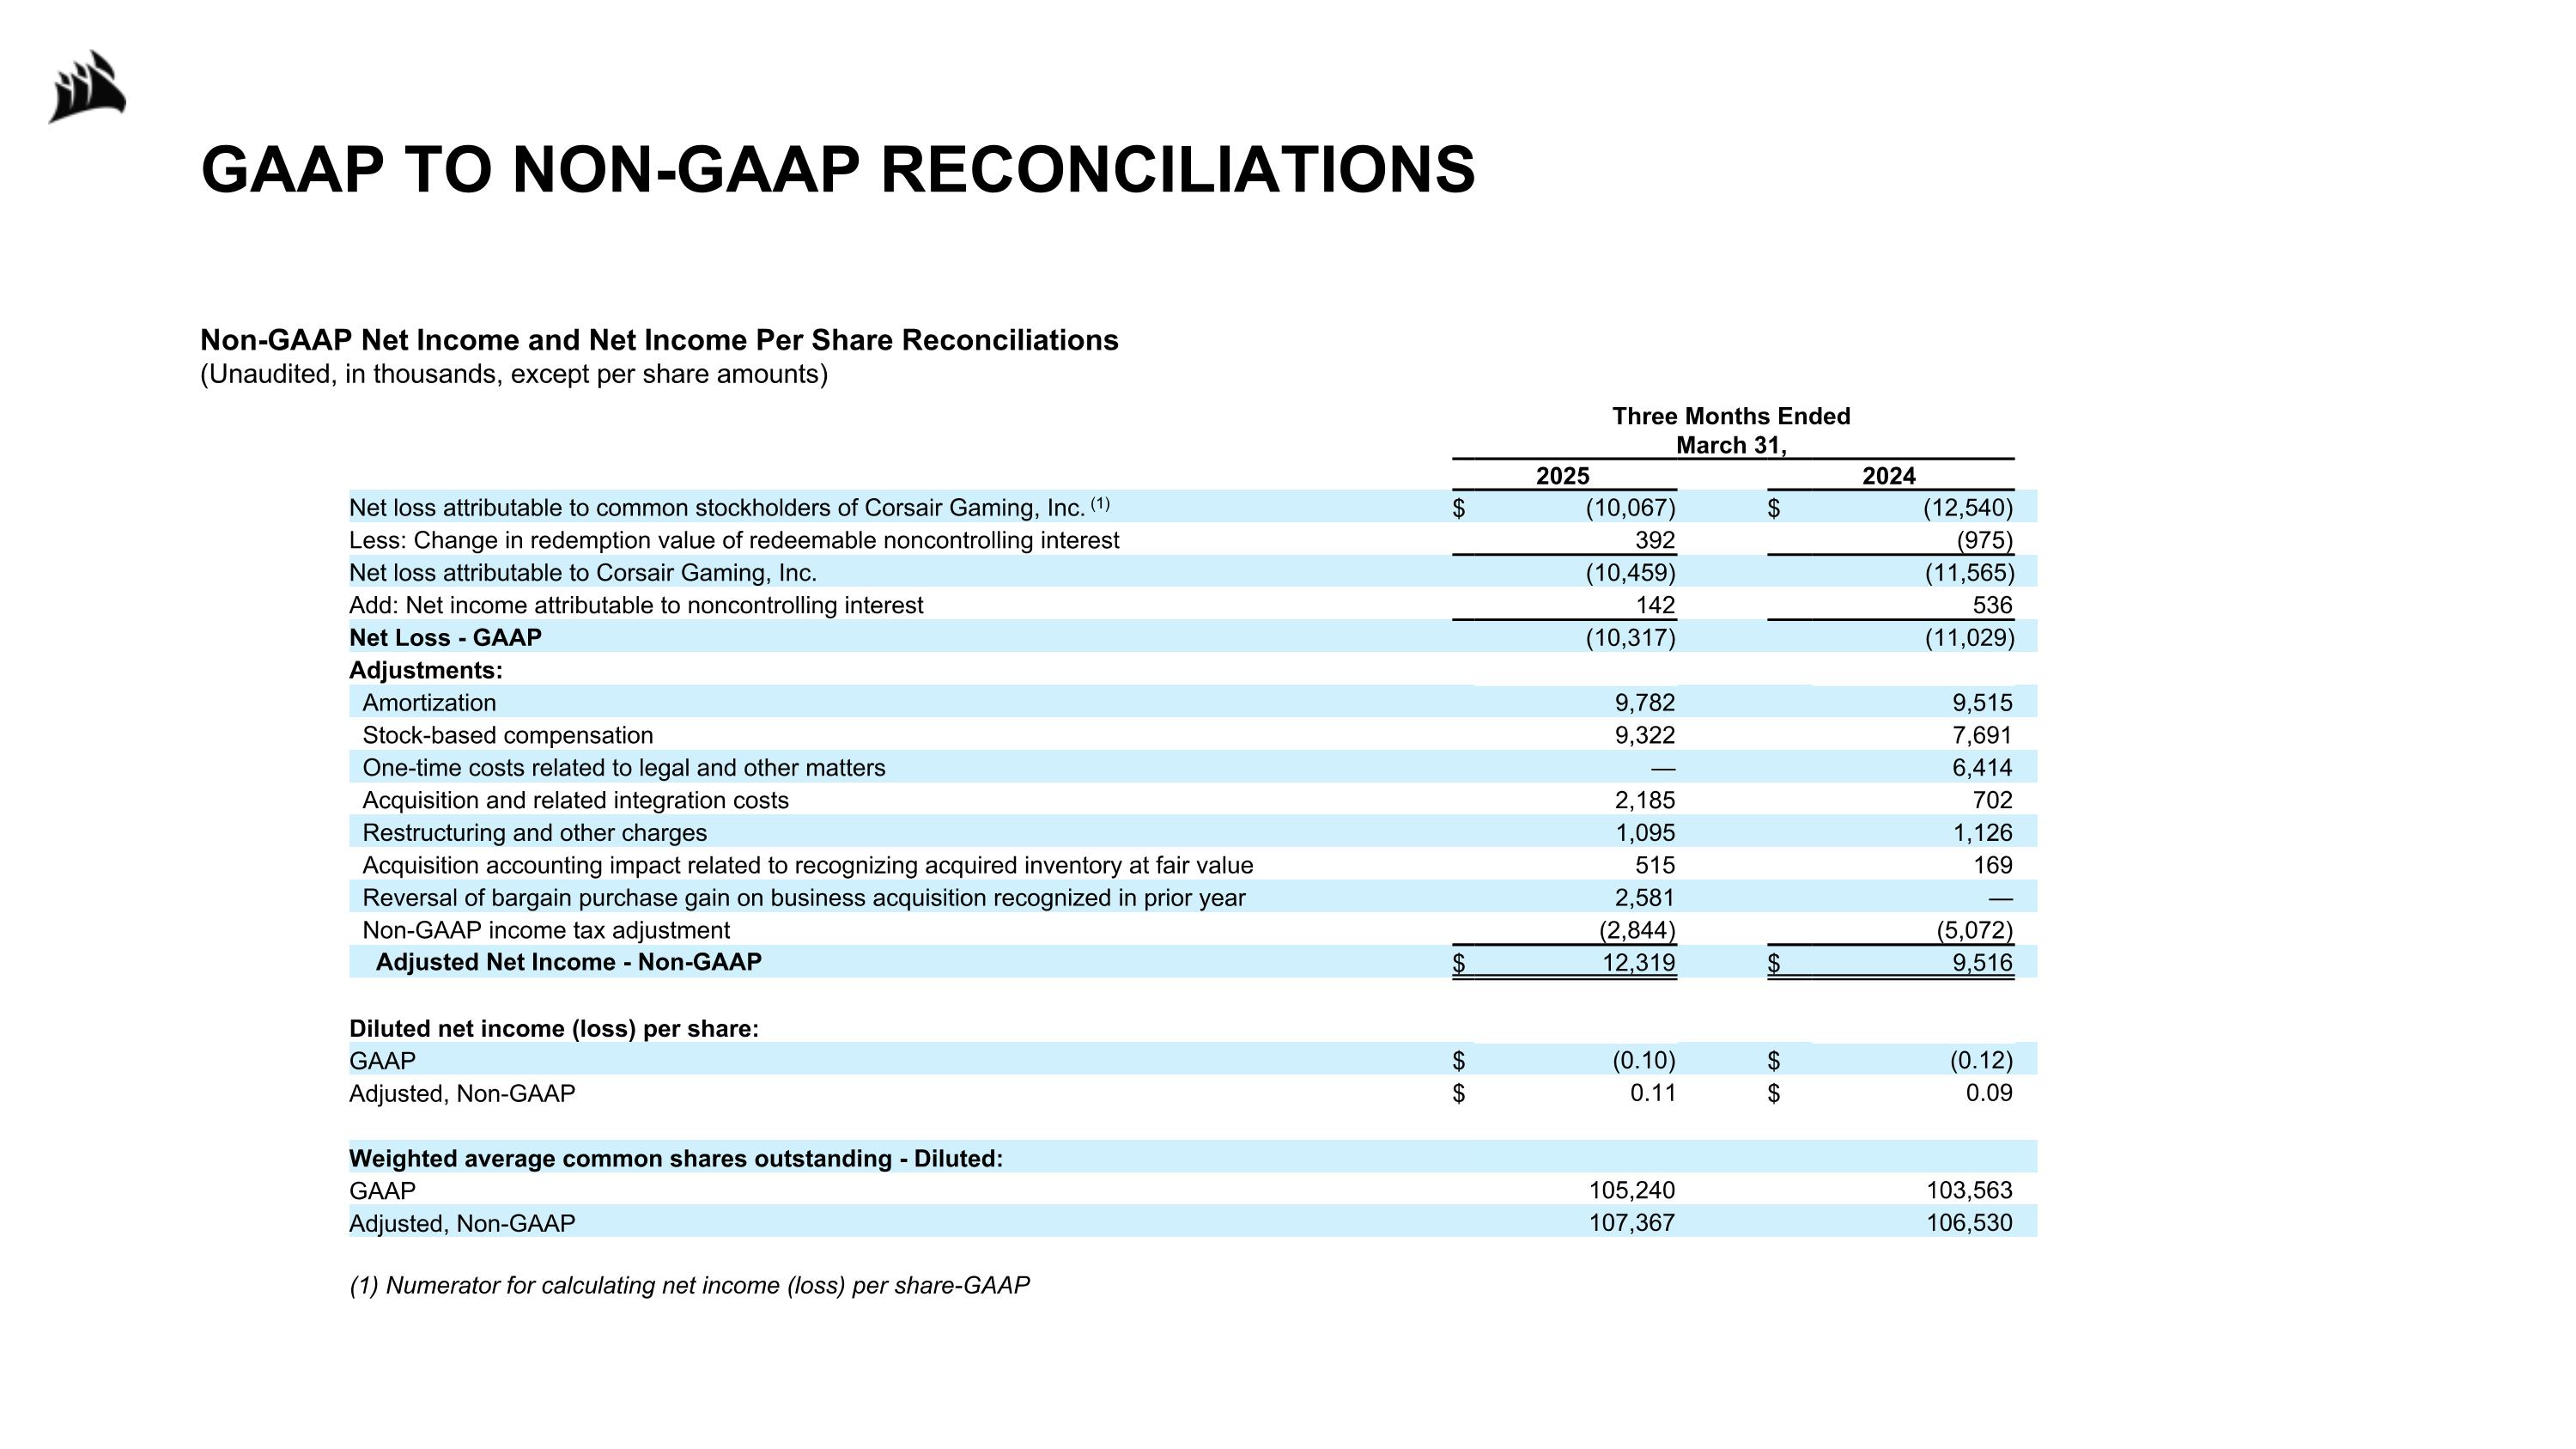
Non-GAAP Net Income and Net Income Per Share Reconciliations (Unaudited, in thousands, except per share amounts) GAAP TO NON-GAAP RECONCILIATIONS Three Months Ended�March 31, 2025 2024 Net loss attributable to common stockholders of Corsair Gaming, Inc. (1) $ (10,067) $ (12,540) Less: Change in redemption value of redeemable noncontrolling interest 392 (975) Net loss attributable to Corsair Gaming, Inc. (10,459) (11,565) Add: Net income attributable to noncontrolling interest 142 536 Net Loss - GAAP (10,317) (11,029) Adjustments: Amortization 9,782 9,515 Stock-based compensation 9,322 7,691 One-time costs related to legal and other matters — 6,414 Acquisition and related integration costs 2,185 702 Restructuring and other charges 1,095 1,126 Acquisition accounting impact related to recognizing acquired inventory at fair value 515 169 Reversal of bargain purchase gain on business acquisition recognized in prior year 2,581 — Non-GAAP income tax adjustment (2,844) (5,072) Adjusted Net Income - Non-GAAP $ 12,319 $ 9,516 Diluted net income (loss) per share: GAAP $ (0.10) $ (0.12) Adjusted, Non-GAAP $ 0.11 $ 0.09 Weighted average common shares outstanding - Diluted: GAAP 105,240 103,563 Adjusted, Non-GAAP 107,367 106,530 (1) Numerator for calculating net income (loss) per share-GAAP
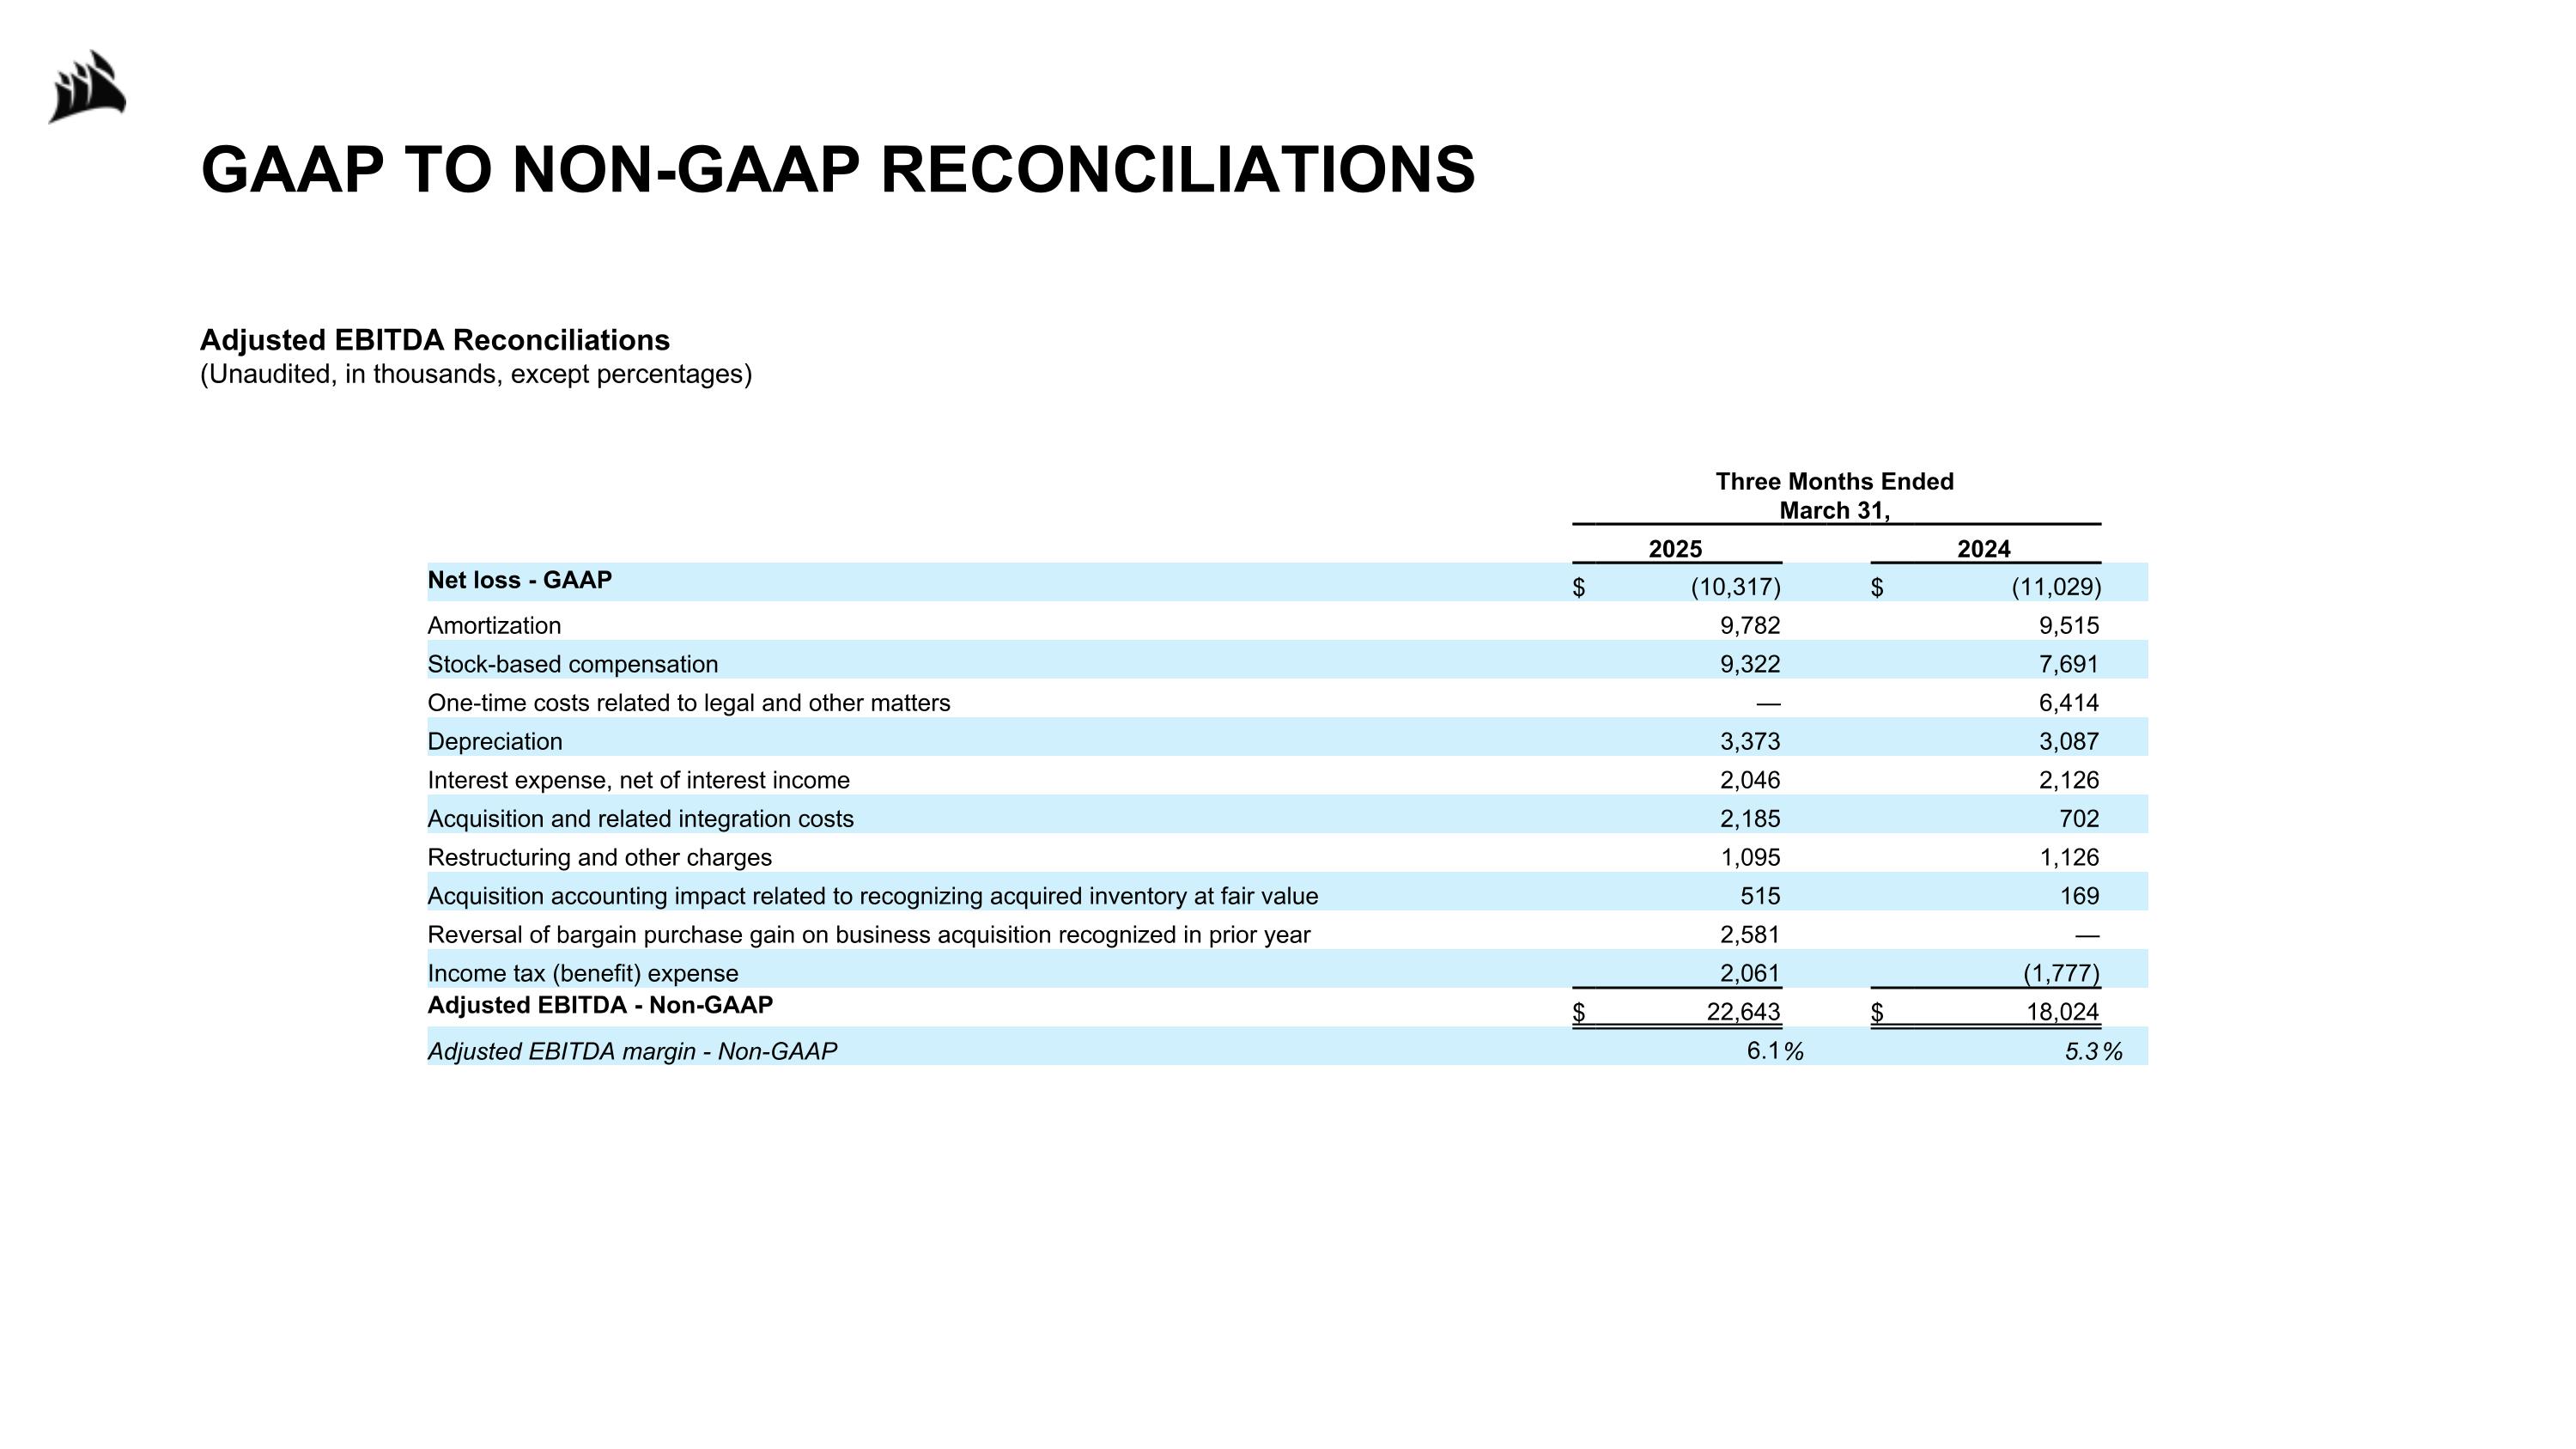
Adjusted EBITDA Reconciliations (Unaudited, in thousands, except percentages) GAAP TO NON-GAAP RECONCILIATIONS Three Months Ended�March 31, 2025 2024 Net loss - GAAP $ (10,317) $ (11,029) Amortization 9,782 9,515 Stock-based compensation 9,322 7,691 One-time costs related to legal and other matters — 6,414 Depreciation 3,373 3,087 Interest expense, net of interest income 2,046 2,126 Acquisition and related integration costs 2,185 702 Restructuring and other charges 1,095 1,126 Acquisition accounting impact related to recognizing acquired inventory at fair value 515 169 Reversal of bargain purchase gain on business acquisition recognized in prior year 2,581 — Income tax (benefit) expense 2,061 (1,777) Adjusted EBITDA - Non-GAAP $ 22,643 $ 18,024 Adjusted EBITDA margin - Non-GAAP 6.1 % 5.3 %