UNITED STATES
SECURITIES AND EXCHANGE COMMISSION
WASHINGTON, D.C. 20549


FORM 8-K

CURRENT REPORT

PURSUANT TO SECTION 13 OR 15(D) OF THE
SECURITIES EXCHANGE ACT OF 1934

Date of report (Date of earliest event reported):      November 1, 2021

CIRRUS LOGIC, INC.
(Exact name of Registrant as specified in its charter)

Delaware
 
000-17795
 
77-0024818
(State or Other Jurisdiction of
Incorporation or Organization)
 
(Commission File Number)
 
(IRS Employer Identification No.)

800 W. 6th Street, Austin, Texas
 
78701
(Address of Principal Executive Offices)
 
(Zip Code)

Registrant's telephone number, including area code:  (512) 851-4000

Check the appropriate box below if the Form 8-K filing is intended to simultaneously satisfy the filing obligation of the registrant under any of the following provisions:

Written communications pursuant to Rule 425 under the Securities Act (17 CFR 230.425)
Soliciting material pursuant to Rule 14a-12 under the Exchange Act (17 CFR 240.14a-12)
Pre-commencement communications pursuant to Rule 14d-2(b) under the Exchange Act (17 CFR 240.14d-2(b))
Pre-commencement communications pursuant to Rule 13e-4(c) under the Exchange Act (17 CFR 240.13e-4(c))

Securities registered pursuant to Section 12(b) of the Act:

Title of each class
 
Trading Symbol
 
Name
Common stock, $0.001 par value
 
CRUS
 
The NASDAQ Stock Market LLC

Indicate by check mark whether the registrant is an emerging growth company as defined in Rule 405 of the Securities Act of 1933 (§230.405 of this chapter) or Rule 12b-2 of the Securities Exchange Act of 1934 (§240.12b-2 of this chapter).
 
Emerging growth company
 
If an emerging growth company, indicate by check mark if the registrant has elected not to use the extended transition period for complying with any new or revised financial accounting standards provided pursuant to Section 13(a) of the Exchange Act. ☐


Item 2.02     Results of Operations and Financial Condition.
 
On November 1, 2021, Cirrus Logic, Inc. (“Cirrus Logic” or the “Company”) issued a press release announcing its financial results for its second quarter of fiscal year 2022.  The full text of the press release is furnished as Exhibit No. 99.1 to this Current Report on Form 8-K.

Item 5.02     Departure of Directors or Certain Officers; Election of Directors; Appointment of Certain Officers; Compensatory Arrangements of Certain Officers.

On November 1, 2021, the Company announced that Thurman Case is planning to retire from his position as chief financial officer.  Mr. Case will remain in his role and will work to help ensure a seamless transition following a comprehensive search to identify his successor.

Item 7.01     Regulation FD Disclosure.
 
On November 1, 2021, the Company posted on its website a shareholder letter to investors summarizing the financial results for its second quarter of fiscal year 2022.  The full text of the shareholder letter is furnished as Exhibit No. 99.3 to this Current Report on Form 8-K.  Additionally, on November 1, 2021, the Company issued a press release announcing the planned retirement of the Company’s chief financial officer, Thurman Case, as described in item 5.02 of this Form 8-K.  The full text of the press release is furnished herewith as Exhibit 99.2.

Use of Non-GAAP Financial Information

To supplement Cirrus Logic's financial statements presented on a GAAP basis, Cirrus has provided non-GAAP financial information, including non-GAAP net income, diluted earnings per share, operating income and profit, operating expenses, gross margin and profit, tax expense, tax expense impact on earnings per share, and effective tax rate.  A reconciliation of the adjustments to GAAP results is included in the press release below.  Non-GAAP financial information is not meant as a substitute for GAAP results, but is included because management believes such information is useful to our investors for informational and comparative purposes.  In addition, certain non-GAAP financial information is used internally by management to evaluate and manage the company.  The non-GAAP financial information used by Cirrus Logic may differ from that used by other companies.  These non-GAAP measures should be considered in addition to, and not as a substitute for, the results prepared in accordance with GAAP.

The information contained in Items 2.02, 7.01, and 9.01 in this Current Report on Form 8-K and the exhibits furnished hereto contain forward-looking statements regarding the Company and cautionary statements identifying important factors that could cause actual results to differ materially from those anticipated.  In addition, this information shall not be deemed “filed” for purposes of Section 18 of the Securities Exchange Act of 1934, as amended (the “Exchange Act”), or otherwise subject to the liabilities of that section, nor shall they be deemed incorporated by reference in any filing under the Securities Act of 1933, as amended, or the Exchange Act, except as expressly set forth by specific reference in such a filing.

Item 9.01     Financial Statements and Exhibits.


(d)            Exhibits
     
  Exhibit  Description
     
 
Exhibit 99.1
Cirrus Logic, Inc. press release dated November 1, 2021
 
Exhibit 99.2
Cirrus Logic, Inc. press release dated November 1, 2021
 
Exhibit 99.3
Cirrus Logic, Inc. shareholder letter dated November 1, 2021
 
Exhibit 104
Cover Page Interactive Data File (formatted as Inline XBRL)


SIGNATURES

Pursuant to the requirements of the Securities Exchange Act of 1934, Registrant has duly caused this report to be signed on its behalf by the undersigned thereunto duly authorized.


     CIRRUS LOGIC, INC.  
       
       
Date:  November 1, 2021 
By:
/s/ Thurman K. Case  
    Name:  Thurman K. Case  
    Title:    Chief Financial Officer  


EXHIBIT INDEX


Exhibit No.
Description
   
99.1
99.2
99.3
104
Cover Page Interactive Data File (formatted as Inline XBRL)
_____________________________________________________________

Exhibit 99.1
Exhibit 99.2
Exhibit 99.3
Exhibit 104


 Exhibit 99.1


Cirrus Logic Reports Q2 FY22 Revenue of $465.9 Million

High-Performance Mixed-Signal Content Gains Drove 34 Percent Year-Over-Year Revenue Growth

AUSTIN, Texas--(BUSINESS WIRE)--November 1, 2021--Cirrus Logic, Inc. (Nasdaq: CRUS) today posted on its website at http://investor.cirrus.com the quarterly Shareholder Letter that contains the complete financial results for the second quarter fiscal year 2022, which ended Sept. 25, 2021, as well as the company’s current business outlook.

“Cirrus Logic reported record revenue and EPS for the September quarter and delivered solid year-over-year operating profit growth,” said John Forsyth, Cirrus Logic president and chief executive officer. “During the quarter we made great progress on the company’s strategy to diversify beyond audio. In our high-performance mixed-signal product line, we brought our new power conversion and control IC to market, increased the attach rate of our camera controllers in smartphones and sampled new fast-charging products to our general market customers. This represents a significant expansion of Cirrus Logic’s technology and product mix, with our high-performance mixed-signal business delivering 30 percent of total revenue in the first half fiscal year 2022, up 117 percent year over year. We continue to be excited about the opportunities these new technologies offer for further growth and diversification in the future.”


Reported Financial Results – Second Quarter FY22

  • Revenue of $465.9 million;
  • GAAP gross margin of 50.5 percent and non-GAAP gross margin of 51.3 percent;
  • GAAP operating expenses of $140.2 million and non-GAAP operating expenses of $114.5 million; and
  • GAAP earnings per share of $1.43 and non-GAAP earnings per share of $1.82.

A reconciliation of GAAP to non-GAAP financial information is included in the tables accompanying this press release.

Business Outlook – Third Quarter FY22

  • Revenue is expected to range between $490 million and $530 million;
  • GAAP gross margin is forecasted to be between 50 percent and 52 percent; and
  • Combined GAAP R&D and SG&A expenses are anticipated to range between $141 million and $147 million, including approximately $19 million in stock-based compensation expense, $9 million in amortization of acquired intangibles and $3 million in acquisition-related costs.

Cirrus Logic will host a live Q&A session at 5 p.m. EDT today to answer questions related to its financial results and business outlook. Participants may listen to the conference call on the Cirrus Logic website. Participants who would like to submit a question to be addressed during the call are requested to email [email protected]. A replay of the webcast can be accessed on the Cirrus Logic website approximately two hours following its completion, or by calling (416) 621-4642, or toll-free at (800) 585-8367 (Access Code: 3476036).

Cirrus Logic, Inc.

Cirrus Logic is a leader in low-power, high-precision mixed-signal processing solutions that create innovative user experiences for the world’s top mobile and consumer applications. With headquarters in Austin, Texas, Cirrus Logic is recognized globally for its award-winning corporate culture. Check us out at www.cirrus.com.

Cirrus Logic, Cirrus and the Cirrus Logic logo are registered trademarks of Cirrus Logic, Inc. All other company or product names noted herein may be trademarks of their respective holders.


Use of non-GAAP Financial Information

To supplement Cirrus Logic's financial statements presented on a GAAP basis, the company has provided non-GAAP financial information, including non-GAAP net income, diluted earnings per share, operating income and profit, operating expenses, gross margin and profit, tax expense, tax expense impact on earnings per share, and effective tax rate. A reconciliation of the adjustments to GAAP results is included in the tables below. Non-GAAP financial information is not meant as a substitute for GAAP results but is included because management believes such information is useful to our investors for informational and comparative purposes. In addition, certain non-GAAP financial information is used internally by management to evaluate and manage the company. The non-GAAP financial information used by Cirrus Logic may differ from that used by other companies. These non-GAAP measures should be considered in addition to, and not as a substitute for, the results prepared in accordance with GAAP.

Safe Harbor Statement

Except for historical information contained herein, the matters set forth in this news release contain forward-looking statements including our statements about our opportunities for further growth and diversification in the future, and our estimates for the third quarter fiscal year 2022 revenue, gross margin, combined research and development and selling, general and administrative expense levels, stock compensation expense and amortization of acquired intangibles. In some cases, forward-looking statements are identified by words such as “expect,” “anticipate,” “target,” “project,” “believe,” “goals,” “opportunity,” “estimates,” “intend,” and variations of these types of words and similar expressions. In addition, any statements that refer to our plans, expectations, strategies or other characterizations of future events or circumstances are forward-looking statements. These forward-looking statements are based on our current expectations, estimates, and assumptions and are subject to certain risks and uncertainties that could cause actual results to differ materially and readers should not place undue reliance on such statements. These risks and uncertainties include, but are not limited to, the following: the effects of the global COVID-19 outbreak and the measures taken to limit the spread of COVID-19, including any disruptions to our business that could result from measures to contain the outbreak that may be taken by governmental authorities in the jurisdictions in which we and our supply chain operate; the susceptibility of the markets we address to economic downturns, including as a result of the COVID-19 outbreak and the actions taken to mitigate the spread of COVID-19; the risks of doing business internationally, including increased import/export restrictions and controls (e.g., the effect of the U.S. Bureau of Industry and Security of the U.S. Department of Commerce placing Huawei Technologies Co., Ltd. and certain of its affiliates on the Bureau’s Entity List), imposition of trade protection measures (e.g., tariffs or taxes), security and health risks, possible disruptions in transportation networks, and other economic, social, military and geo-political conditions in the countries in which we, our customers or our suppliers operate; recent increased industry-wide capacity constraints that may impact our ability to meet current customer demand, which could cause an unanticipated decline in our sales and damage our existing customer relationships and our ability to establish new customer relationships; the potential for increased prices due to capacity constraints in our supply chain, which, if we are unable to increase our selling price to our customers, could result in lower revenues and margins that could adversely affect our financial results; the level of orders and shipments during the third quarter of fiscal year 2022, customer cancellations of orders, or the failure to place orders consistent with forecasts, along with the risk factors listed in our Form 10-K for the year ended March 28, 2021 and in our other filings with the Securities and Exchange Commission, which are available at www.sec.gov. The foregoing information concerning our business outlook represents our outlook as of the date of this news release, and we expressly disclaim any obligation to update or revise any forward-looking statements, whether as a result of new developments or otherwise.

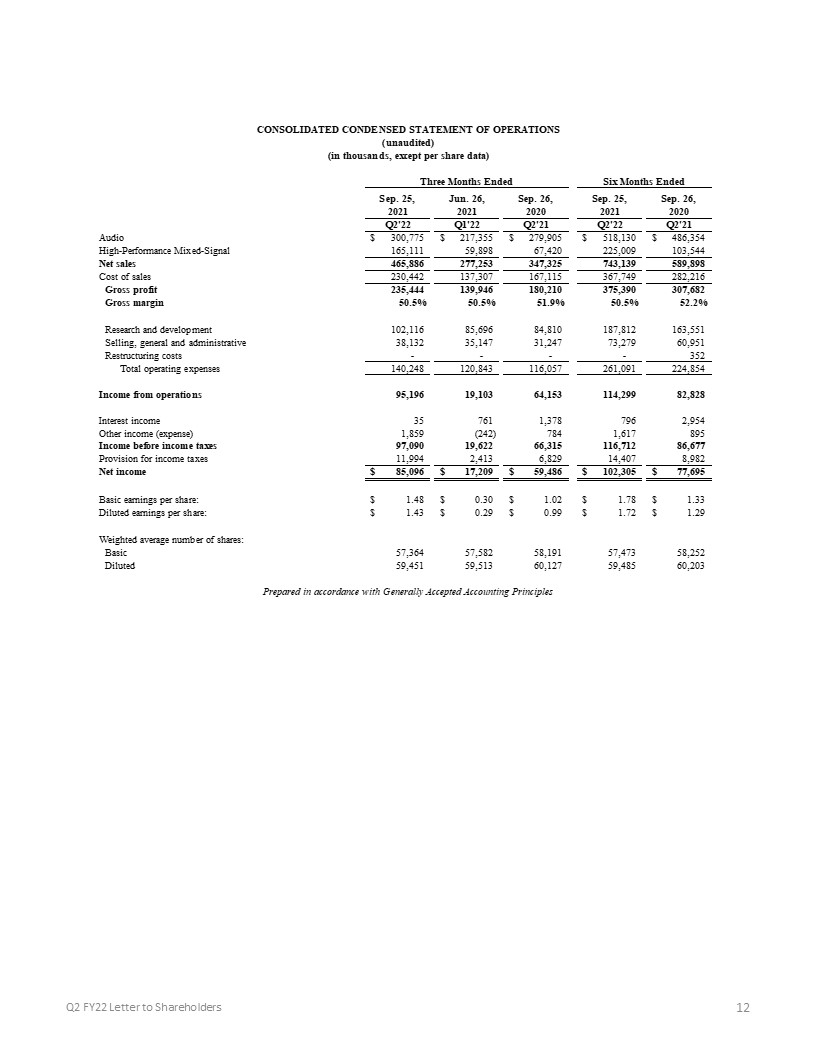
Summary financial data follows:


CONSOLIDATED CONDENSED STATEMENT OF OPERATIONS
(unaudited)
(in thousands, except per share data)


Three Months Ended


Six Months Ended


Sep. 25,


Jun. 26,


Sep. 26,


Sep. 25,


Sep. 26,


2021


2021


2020


2021


2020


Q2'22


Q1'22


Q2'21


Q2'22


Q2'21


Audio

$

300,775


$

217,355


$

279,905


$

518,130


$

486,354


High-Performance Mixed-Signal


165,111


59,898


67,420


225,009


103,544


Net sales


465,886


277,253


347,325


743,139


589,898


Cost of sales


230,442


137,307


167,115


367,749


282,216


Gross profit


235,444


139,946


180,210


375,390


307,682


Gross margin


50.5

%


50.5

%


51.9

%


50.5

%


52.2

%


Research and development


102,116


85,696


84,810


187,812


163,551


Selling, general and administrative


38,132


35,147


31,247


73,279


60,951


Restructuring costs


-


-


-


-


352


Total operating expenses


140,248


120,843


116,057


261,091


224,854


Income from operations


95,196


19,103


64,153


114,299


82,828


Interest income


35


761


1,378


796


2,954


Other income (expense)


1,859


(242

)


784


1,617


895


Income before income taxes


97,090


19,622


66,315


116,712


86,677


Provision for income taxes


11,994


2,413


6,829


14,407


8,982


Net income

$

85,096


$

17,209


$

59,486


$

102,305


$

77,695


Basic earnings per share:

$

1.48


$

0.30


$

1.02


$

1.78


$

1.33


Diluted earnings per share:

$

1.43


$

0.29


$

0.99


$

1.72


$

1.29


Weighted average number of shares:


Basic


57,364


57,582


58,191


57,473


58,252


Diluted


59,451


59,513


60,127


59,485


60,203


Prepared in accordance with Generally Accepted Accounting Principles


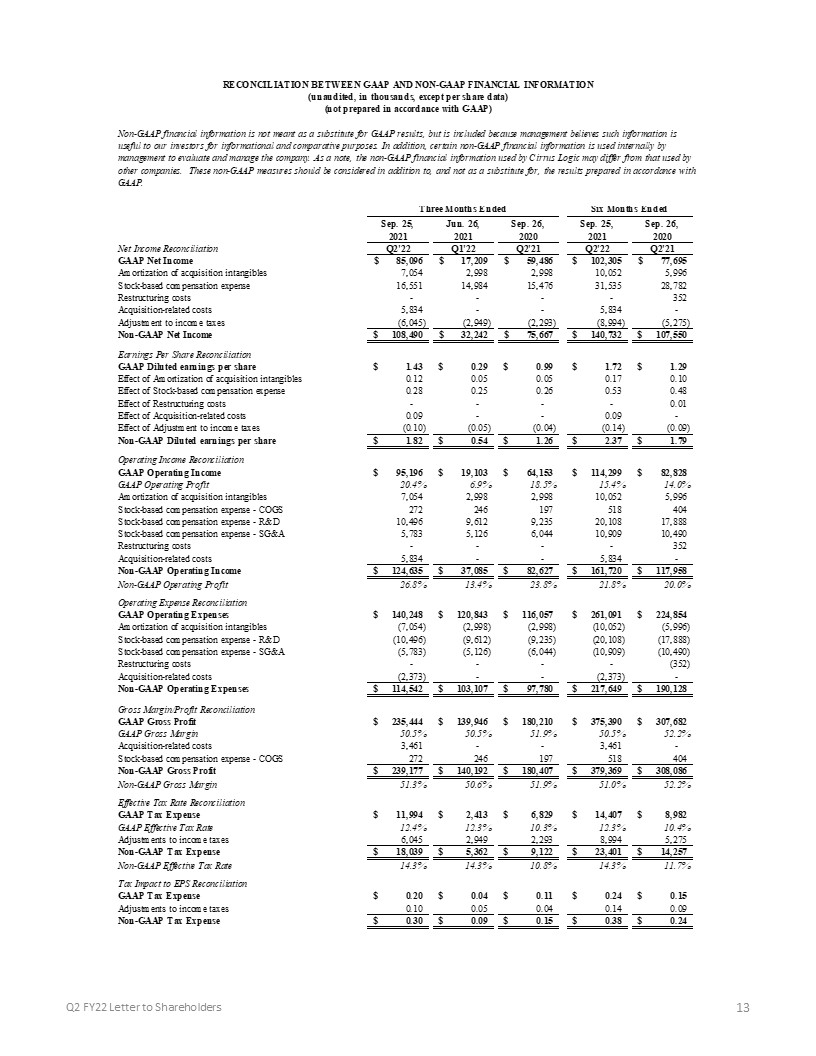
RECONCILIATION BETWEEN GAAP AND NON-GAAP FINANCIAL INFORMATION

(unaudited, in thousands, except per share data)

(not prepared in accordance with GAAP)


Non-GAAP financial information is not meant as a substitute for GAAP results, but is included because management believes such information is useful to our investors for informational and comparative purposes. In addition, certain non-GAAP financial information is used internally by management to evaluate and manage the company. As a note, the non-GAAP financial information used by Cirrus Logic may differ from that used by other companies. These non-GAAP measures should be considered in addition to, and not as a substitute for, the results prepared in accordance with GAAP.


Three Months Ended


Six Months Ended


Sep. 25,


Jun. 26,


Sep. 26,


Sep. 25,


Sep. 26,


2021


2021


2020


2021


2020


Net Income Reconciliation Q2'22
Q1'22
Q2'21
Q2'22
Q2'21


GAAP Net Income

$

85,096


$

17,209


$

59,486


$

102,305


$

77,695


Amortization of acquisition intangibles


7,054


2,998


2,998


10,052


5,996


Stock-based compensation expense


16,551


14,984


15,476


31,535


28,782


Restructuring costs


-


-


-


-


352


Acquisition-related costs


5,834


-


-


5,834


-


Adjustment to income taxes


(6,045

)


(2,949

)


(2,293

)


(8,994

)


(5,275

)


Non-GAAP Net Income

$

108,490


$

32,242


$

75,667


$

140,732


$

107,550


Earnings Per Share Reconciliation


GAAP Diluted earnings per share

$

1.43


$

0.29


$

0.99


$

1.72


$

1.29


Effect of Amortization of acquisition intangibles


0.12


0.05


0.05


0.17


0.10


Effect of Stock-based compensation expense


0.28


0.25


0.26


0.53


0.48


Effect of Restructuring costs


-


-


-


-


0.01


Effect of Acquisition-related costs


0.09


-


-


0.09


-


Effect of Adjustment to income taxes


(0.10

)


(0.05

)


(0.04

)


(0.14

)


(0.09

)


Non-GAAP Diluted earnings per share

$

1.82


$

0.54


$

1.26


$

2.37


$

1.79


Operating Income Reconciliation


GAAP Operating Income

$

95,196


$

19,103


$

64,153


$

114,299


$

82,828


GAAP Operating Profit


20.4

%


6.9

%


18.5

%


15.4

%


14.0

%


Amortization of acquisition intangibles


7,054


2,998


2,998


10,052


5,996


Stock-based compensation expense - COGS


272


246


197


518


404


Stock-based compensation expense - R&D


10,496


9,612


9,235


20,108


17,888


Stock-based compensation expense - SG&A


5,783


5,126


6,044


10,909


10,490


Restructuring costs


-


-


-


-


352


Acquisition-related costs


5,834


-


-


5,834


-


Non-GAAP Operating Income

$

124,635


$

37,085


$

82,627


$

161,720


$

117,958


Non-GAAP Operating Profit


26.8

%


13.4

%


23.8

%


21.8

%


20.0

%


Operating Expense Reconciliation


GAAP Operating Expenses

$

140,248


$

120,843


$

116,057


$

261,091


$

224,854


Amortization of acquisition intangibles


(7,054

)


(2,998

)


(2,998

)


(10,052

)


(5,996

)


Stock-based compensation expense - R&D


(10,496

)


(9,612

)


(9,235

)


(20,108

)


(17,888

)


Stock-based compensation expense - SG&A


(5,783

)


(5,126

)


(6,044

)


(10,909

)


(10,490

)


Restructuring costs


-


-


-


-


(352

)


Acquisition-related costs


(2,373

)


-


-


(2,373

)


-


Non-GAAP Operating Expenses

$

114,542


$

103,107


$

97,780


$

217,649


$

190,128


Gross Margin/Profit Reconciliation


GAAP Gross Profit

$

235,444


$

139,946


$

180,210


$

375,390


$

307,682


GAAP Gross Margin


50.5

%


50.5

%


51.9

%


50.5

%


52.2

%


Acquisition-related costs


3,461


-


-


3,461


-


Stock-based compensation expense - COGS


272


246


197


518


404


Non-GAAP Gross Profit

$

239,177


$

140,192


$

180,407


$

379,369


$

308,086


Non-GAAP Gross Margin


51.3

%


50.6

%


51.9

%


51.0

%


52.2

%


Effective Tax Rate Reconciliation


GAAP Tax Expense

$

11,994


$

2,413


$

6,829


$

14,407


$

8,982


GAAP Effective Tax Rate


12.4

%


12.3

%


10.3

%


12.3

%


10.4

%


Adjustments to income taxes


6,045


2,949


2,293


8,994


5,275


Non-GAAP Tax Expense

$

18,039


$

5,362


$

9,122


$

23,401


$

14,257


Non-GAAP Effective Tax Rate


14.3

%


14.3

%


10.8

%


14.3

%


11.7

%


Tax Impact to EPS Reconciliation


GAAP Tax Expense

$

0.20


$

0.04


$

0.11


$

0.24


$

0.15


Adjustments to income taxes


0.10


0.05


0.04


0.14


0.09


Non-GAAP Tax Expense

$

0.30


$

0.09


$

0.15


$

0.38


$

0.24


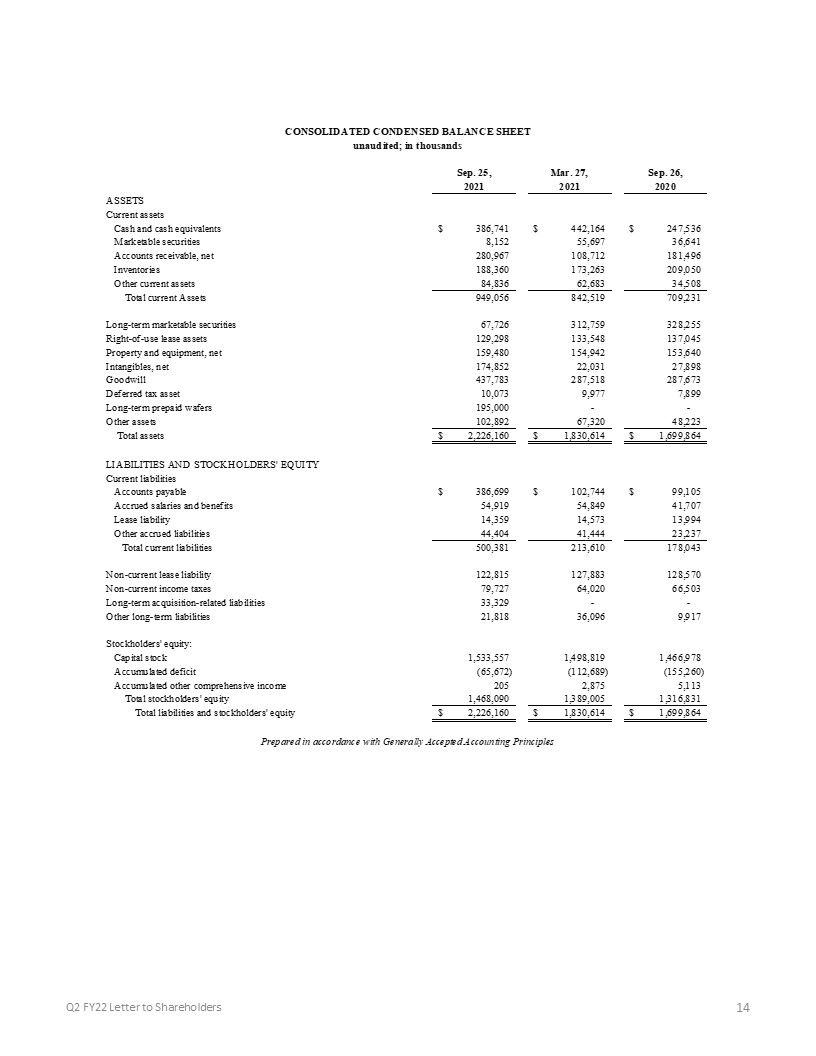
CONSOLIDATED CONDENSED BALANCE SHEET
unaudited; in thousands


Sep. 25,


Mar. 27,


Sep. 26,


2021


2021


2020

ASSETS


Current assets


Cash and cash equivalents

$

386,741


$

442,164


$

247,536

Marketable securities


8,152


55,697


36,641

Accounts receivable, net


280,967


108,712


181,496

Inventories


188,360


173,263


209,050

Other current assets


84,836


62,683


34,508

Total current Assets


949,056


842,519


709,231


Long-term marketable securities


67,726


312,759


328,255

Right-of-use lease assets


129,298


133,548


137,045

Property and equipment, net


159,480


154,942


153,640

Intangibles, net


174,852


22,031


27,898

Goodwill


437,783


287,518


287,673

Deferred tax asset


10,073


9,977


7,899

Long-term prepaid wafers


195,000


-


-

Other assets


102,892


67,320


48,223

Total assets

$

2,226,160


$

1,830,614


$

1,699,864


LIABILITIES AND STOCKHOLDERS' EQUITY


Current liabilities


Accounts payable

$

386,699


$

102,744


$

99,105

Accrued salaries and benefits


54,919


54,849


41,707

Lease liability


14,359


14,573


13,994

Other accrued liabilities


44,404


41,444


23,237

Total current liabilities


500,381


213,610


178,043


Non-current lease liability


122,815


127,883


128,570

Non-current income taxes


79,727


64,020


66,503

Long-term acquisition-related liabilities


33,329


-


-

Other long-term liabilities


21,818


36,096


9,917


Stockholders' equity:


Capital stock


1,533,557


1,498,819


1,466,978

Accumulated deficit


(65,672)


(112,689)


(155,260)

Accumulated other comprehensive income


205


2,875


5,113

Total stockholders' equity


1,468,090


1,389,005


1,316,831

Total liabilities and stockholders' equity

$

2,226,160


$

1,830,614


$

1,699,864


Prepared in accordance with Generally Accepted Accounting Principles


Contacts

Investor Contact:
Thurman K. Case
Chief Financial Officer
Cirrus Logic, Inc.
(512) 851-4125
[email protected]

 
 Exhibit 99.2


Cirrus Logic Announces CFO Retirement

AUSTIN, Texas--(BUSINESS WIRE)--November 1, 2021--Cirrus Logic, Inc. (Nasdaq: CRUS) today announced that Thurman Case is planning to retire from his position as chief financial officer. Mr. Case will remain in his role and will work to help ensure a seamless transition following a comprehensive search to identify his successor.

“On behalf of the entire Cirrus Logic team, I would like to thank Thurman for his leadership and valuable contributions over his 21 years with the company,” said John Forsyth, Cirrus Logic president and chief executive officer. “During his tenure as CFO, Thurman helped guide the company through a period of growth and his dedication to the development of a world-class finance organization has positioned Cirrus Logic for continued success in the coming years. I want to wish Thurman all the best in his future endeavors.”

Cirrus Logic, Inc.

Cirrus Logic is a leader in low-power, high-precision mixed-signal processing solutions that create innovative user experiences for the world’s top mobile and consumer applications. With headquarters in Austin, Texas, Cirrus Logic is recognized globally for its award-winning corporate culture. Check us out at www.cirrus.com.

Contacts

Bill Schnell
Public Relations
Cirrus Logic, Inc.
(512) 851-4084
[email protected]

Angie Hatfield
Strategic Communications, Inc.
(425) 941-2895
[email protected]

 
 Exhibit 99.3


 6    Q2 FY22Letter to ShareholdersNovember 1, 2021  
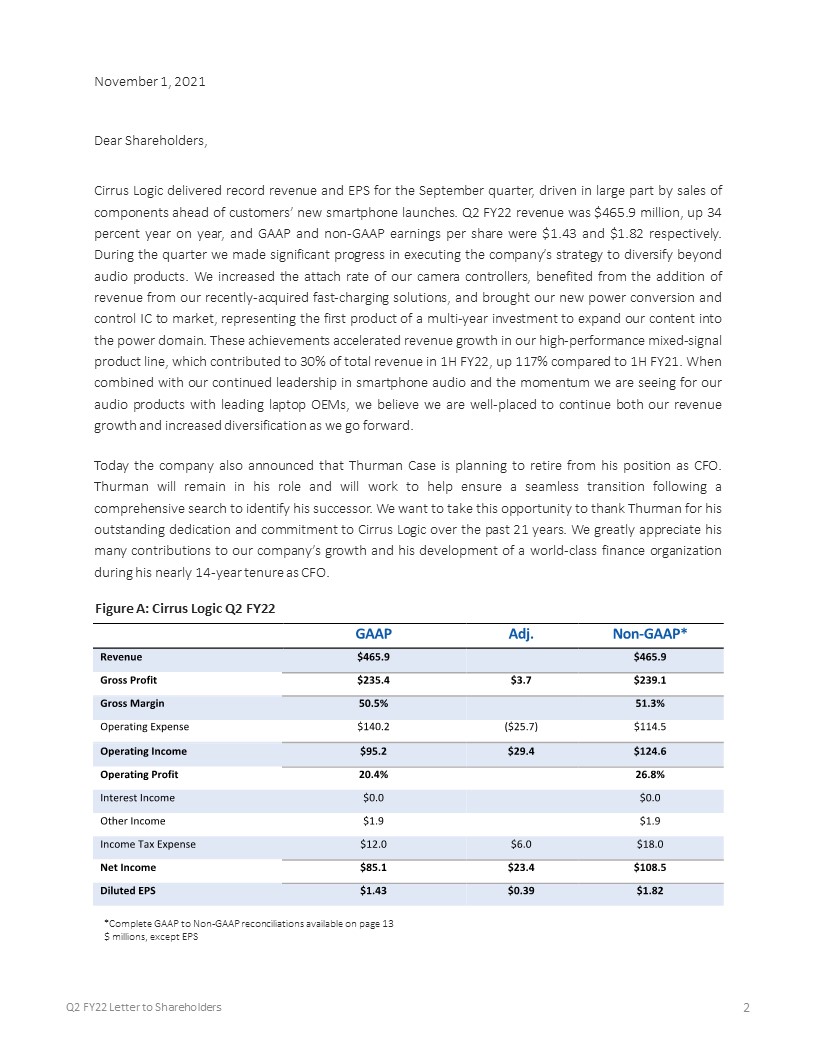
 

 2  November 1, 2021 Dear Shareholders,Cirrus Logic delivered record revenue and EPS for the September quarter, driven in large part by sales of components ahead of customers’ new smartphone launches. Q2 FY22 revenue was $465.9 million, up 34 percent year on year, and GAAP and non-GAAP earnings per share were $1.43 and $1.82 respectively. During the quarter we made significant progress in executing the company’s strategy to diversify beyond audio products. We increased the attach rate of our camera controllers, benefited from the addition of revenue from our recently-acquired fast-charging solutions, and brought our new power conversion and control IC to market, representing the first product of a multi-year investment to expand our content into the power domain. These achievements accelerated revenue growth in our high-performance mixed-signal product line, which contributed to 30% of total revenue in 1H FY22, up 117% compared to 1H FY21. When combined with our continued leadership in smartphone audio and the momentum we are seeing for our audio products with leading laptop OEMs, we believe we are well-placed to continue both our revenue growth and increased diversification as we go forward.Today the company also announced that Thurman Case is planning to retire from his position as CFO. Thurman will remain in his role and will work to help ensure a seamless transition following a comprehensive search to identify his successor. We want to take this opportunity to thank Thurman for his outstanding dedication and commitment to Cirrus Logic over the past 21 years. We greatly appreciate his many contributions to our company’s growth and his development of a world-class finance organization during his nearly 14-year tenure as CFO.  *Complete GAAP to Non-GAAP reconciliations available on page 13$ millions, except EPS  Figure A: Cirrus Logic Q2 FY22   Q2 FY22 Letter to Shareholders 
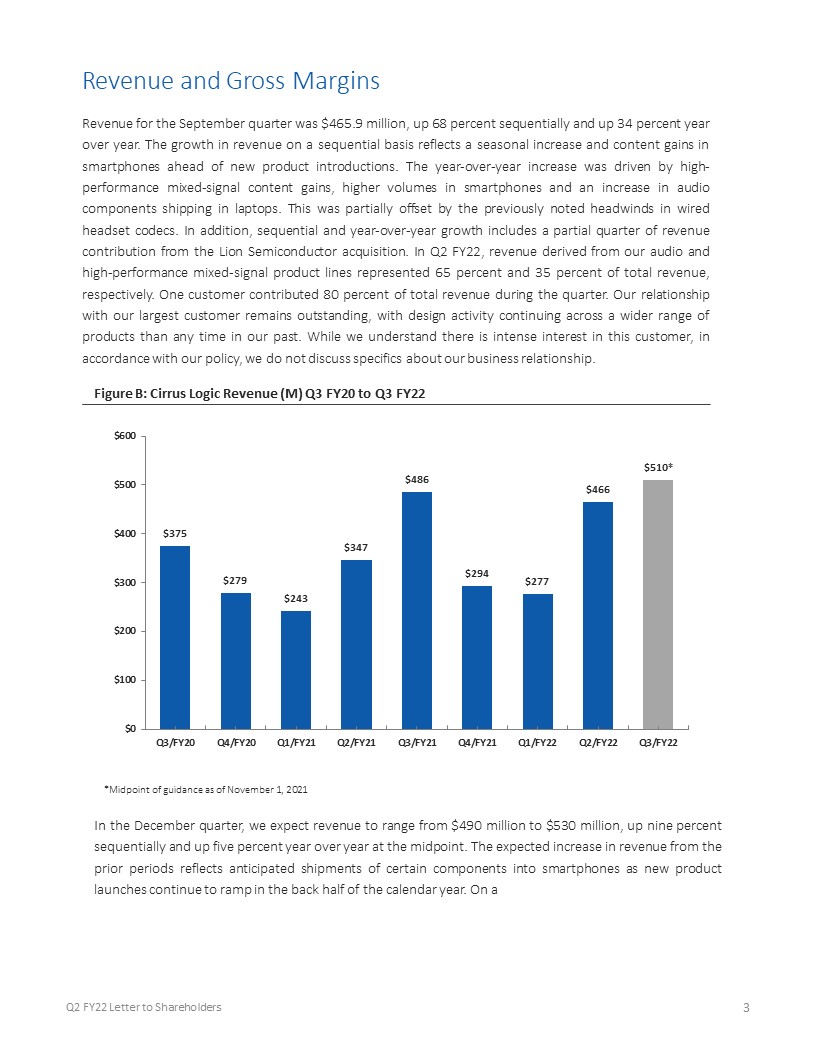
 

 3    Revenue and Gross MarginsRevenue for the September quarter was $465.9 million, up 68 percent sequentially and up 34 percent year over year. The growth in revenue on a sequential basis reflects a seasonal increase and content gains in smartphones ahead of new product introductions. The year-over-year increase was driven by high-performance mixed-signal content gains, higher volumes in smartphones and an increase in audio components shipping in laptops. This was partially offset by the previously noted headwinds in wired headset codecs. In addition, sequential and year-over-year growth includes a partial quarter of revenue contribution from the Lion Semiconductor acquisition. In Q2 FY22, revenue derived from our audio and high-performance mixed-signal product lines represented 65 percent and 35 percent of total revenue, respectively. One customer contributed 80 percent of total revenue during the quarter. Our relationship with our largest customer remains outstanding, with design activity continuing across a wider range of products than any time in our past. While we understand there is intense interest in this customer, in accordance with our policy, we do not discuss specifics about our business relationship.   Q2 FY22 Letter to Shareholders  Figure B: Cirrus Logic Revenue (M) Q3 FY20 to Q3 FY22  *Midpoint of guidance as of November 1, 2021  In the December quarter, we expect revenue to range from $490 million to $530 million, up nine percent sequentially and up five percent year over year at the midpoint. The expected increase in revenue from the prior periods reflects anticipated shipments of certain components into smartphones as new product launches continue to ramp in the back half of the calendar year. On a  
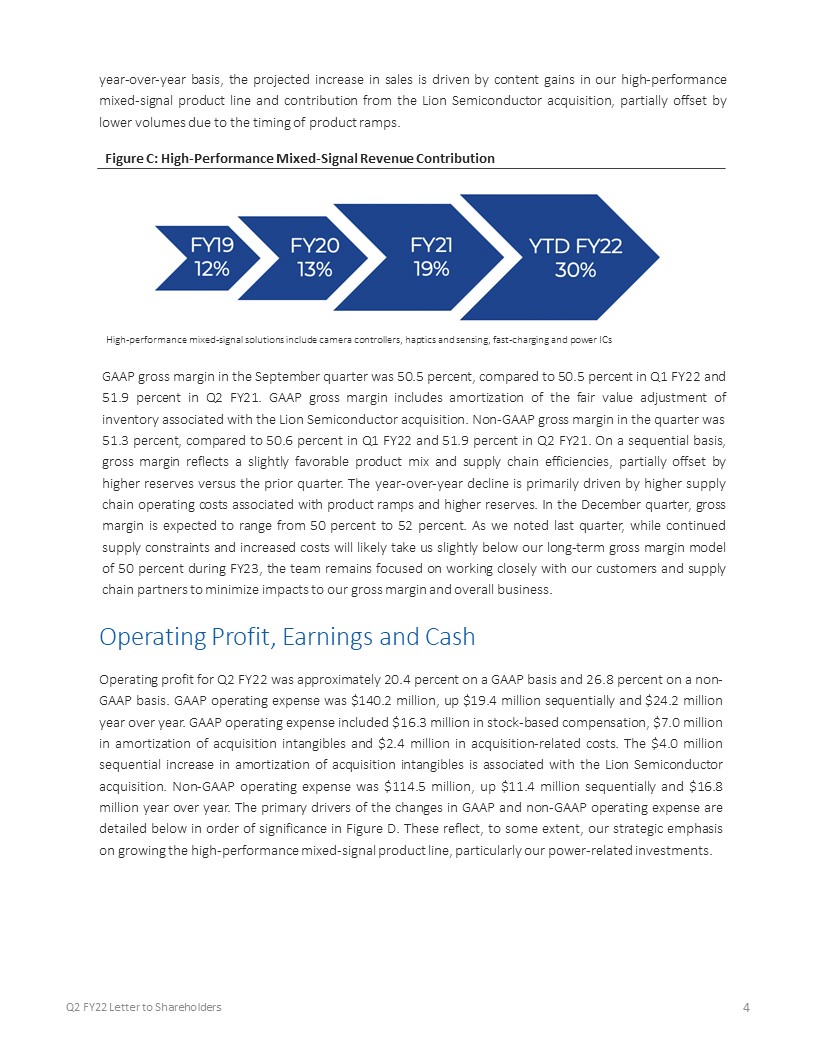
 

 4  year-over-year basis, the projected increase in sales is driven by content gains in our high-performance mixed-signal product line and contribution from the Lion Semiconductor acquisition, partially offset by lower volumes due to the timing of product ramps.                     GAAP gross margin in the September quarter was 50.5 percent, compared to 50.5 percent in Q1 FY22 and 51.9 percent in Q2 FY21. GAAP gross margin includes amortization of the fair value adjustment of inventory associated with the Lion Semiconductor acquisition. Non-GAAP gross margin in the quarter was 51.3 percent, compared to 50.6 percent in Q1 FY22 and 51.9 percent in Q2 FY21. On a sequential basis, gross margin reflects a slightly favorable product mix and supply chain efficiencies, partially offset by higher reserves versus the prior quarter. The year-over-year decline is primarily driven by higher supply chain operating costs associated with product ramps and higher reserves. In the December quarter, gross margin is expected to range from 50 percent to 52 percent. As we noted last quarter, while continued supply constraints and increased costs will likely take us slightly below our long-term gross margin model of 50 percent during FY23, the team remains focused on working closely with our customers and supply chain partners to minimize impacts to our gross margin and overall business.  Q2 FY22 Letter to Shareholders  Figure C: High-Performance Mixed-Signal Revenue Contribution  High-performance mixed-signal solutions include camera controllers, haptics and sensing, fast-charging and power ICs  Operating Profit, Earnings and CashOperating profit for Q2 FY22 was approximately 20.4 percent on a GAAP basis and 26.8 percent on a non-GAAP basis. GAAP operating expense was $140.2 million, up $19.4 million sequentially and $24.2 million year over year. GAAP operating expense included $16.3 million in stock-based compensation, $7.0 million in amortization of acquisition intangibles and $2.4 million in acquisition-related costs. The $4.0 million sequential increase in amortization of acquisition intangibles is associated with the Lion Semiconductor acquisition. Non-GAAP operating expense was $114.5 million, up $11.4 million sequentially and $16.8 million year over year. The primary drivers of the changes in GAAP and non-GAAP operating expense are detailed below in order of significance in Figure D. These reflect, to some extent, our strategic emphasis on growing the high-performance mixed-signal product line, particularly our power-related investments.  
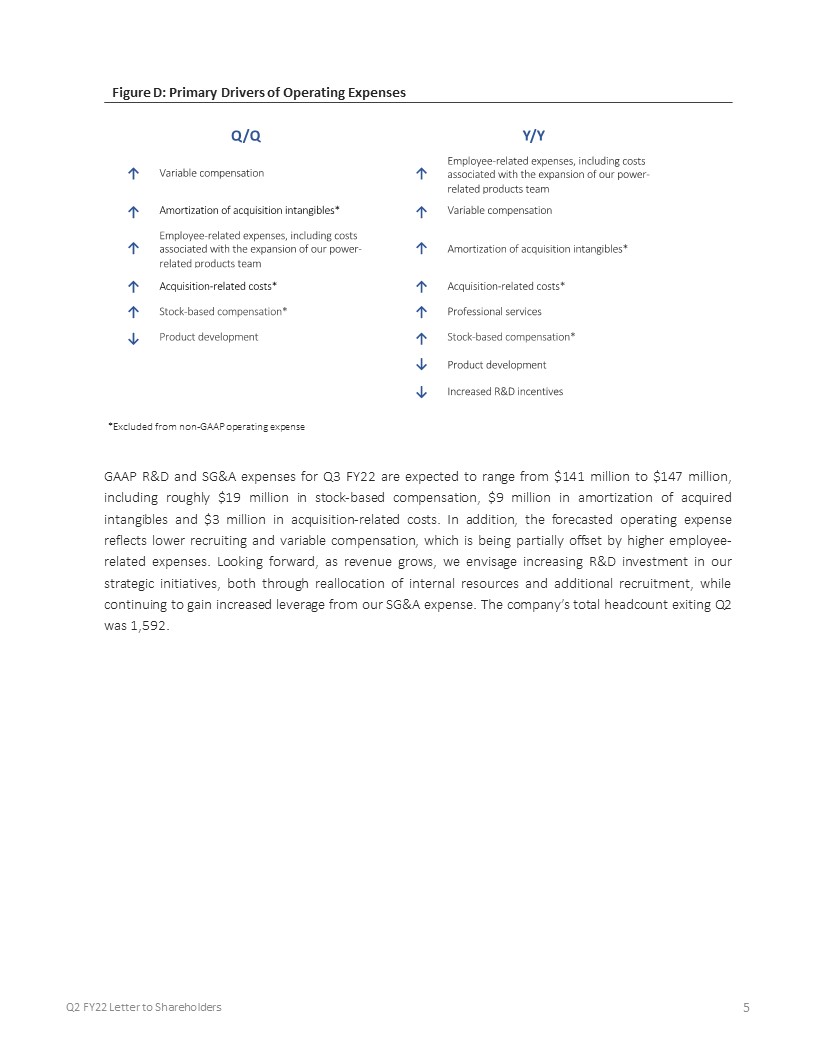
 

 5                    GAAP R&D and SG&A expenses for Q3 FY22 are expected to range from $141 million to $147 million, including roughly $19 million in stock-based compensation, $9 million in amortization of acquired intangibles and $3 million in acquisition-related costs. In addition, the forecasted operating expense reflects lower recruiting and variable compensation, which is being partially offset by higher employee-related expenses. Looking forward, as revenue grows, we envisage increasing R&D investment in our strategic initiatives, both through reallocation of internal resources and additional recruitment, while continuing to gain increased leverage from our SG&A expense. The company’s total headcount exiting Q2 was 1,592.   Figure D: Primary Drivers of Operating Expenses  *Excluded from non-GAAP operating expense   Q2 FY22 Letter to Shareholders 
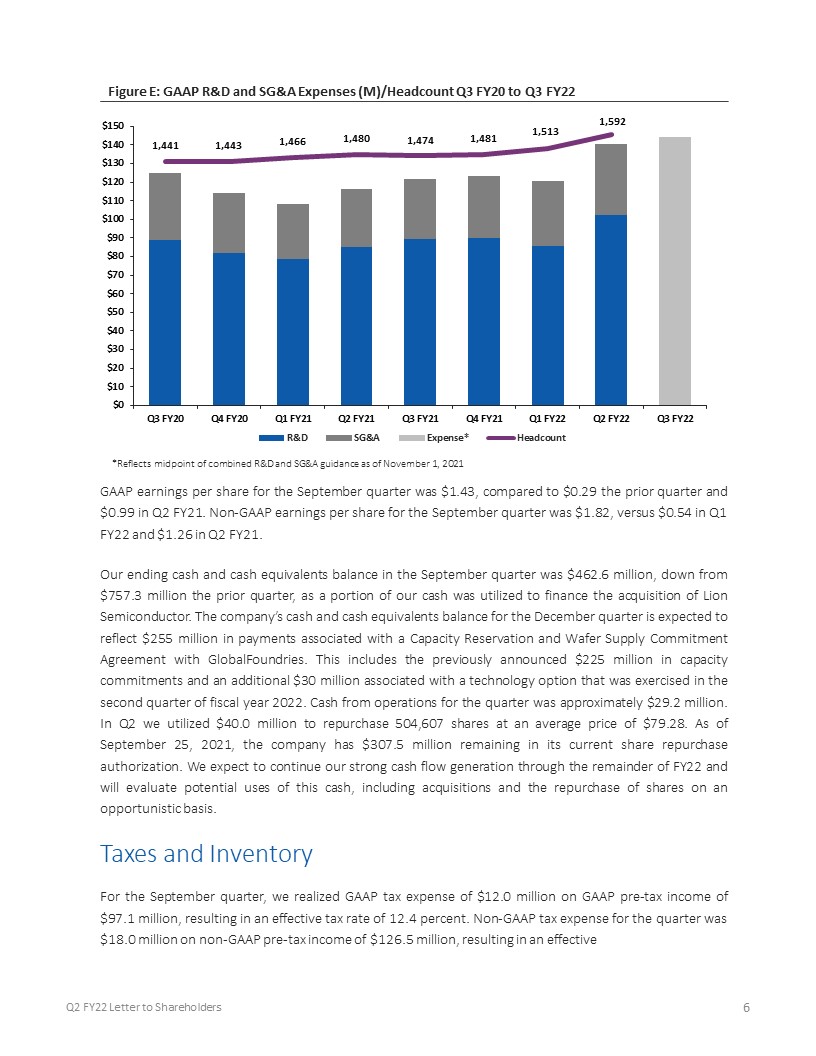
 

 6  GAAP earnings per share for the September quarter was $1.43, compared to $0.29 the prior quarter and $0.99 in Q2 FY21. Non-GAAP earnings per share for the September quarter was $1.82, versus $0.54 in Q1 FY22 and $1.26 in Q2 FY21.Our ending cash and cash equivalents balance in the September quarter was $462.6 million, down from $757.3 million the prior quarter, as a portion of our cash was utilized to finance the acquisition of Lion Semiconductor. The company’s cash and cash equivalents balance for the December quarter is expected to reflect $255 million in payments associated with a Capacity Reservation and Wafer Supply Commitment Agreement with GlobalFoundries. This includes the previously announced $225 million in capacity commitments and an additional $30 million associated with a technology option that was exercised in the second quarter of fiscal year 2022. Cash from operations for the quarter was approximately $29.2 million. In Q2 we utilized $40.0 million to repurchase 504,607 shares at an average price of $79.28. As of September 25, 2021, the company has $307.5 million remaining in its current share repurchase authorization. We expect to continue our strong cash flow generation through the remainder of FY22 and will evaluate potential uses of this cash, including acquisitions and the repurchase of shares on an opportunistic basis. Taxes and Inventory For the September quarter, we realized GAAP tax expense of $12.0 million on GAAP pre-tax income of $97.1 million, resulting in an effective tax rate of 12.4 percent. Non-GAAP tax expense for the quarter was $18.0 million on non-GAAP pre-tax income of $126.5 million, resulting in an effective   Figure E: GAAP R&D and SG&A Expenses (M)/Headcount Q3 FY20 to Q3 FY22    *Reflects midpoint of combined R&D and SG&A guidance as of November 1, 2021  Q2 FY22 Letter to Shareholders 
 

 7  tax rate of 14.3 percent. Non-GAAP tax expense for the quarter includes the effect of higher non-GAAP income in various jurisdictions. We expect the worldwide non-GAAP effective tax rate to be approximately 13 percent to 15 percent for FY22. Q2 inventory was $188.4 million, down from $192.7 million in Q1 FY22. In Q3 FY22, we expect a meaningful decrease in inventory from the prior quarter as we continue to fulfill ongoing demand for certain high-volume products. Company Strategy In the September quarter, we achieved major milestones in the execution of our strategy to drive growth in high-performance mixed-signal products. These included the integration of fast-charging products into our general market portfolio following the completion of our acquisition of Lion Semiconductor and ramping shipments of a new power device alongside our audio, haptic and camera solutions. These accomplishments reflect our commitment to a three-pronged strategy for business growth: first, strengthening our leadership position in smartphone audio; second, broadening sales of audio components in applications beyond smartphones; and third, applying our mixed-signal engineering expertise to develop solutions in new, adjacent high-performance mixed-signal solutions. During the quarter, shipments of boosted amplifiers and smart codecs ramped with multiple customers in flagship and mid-tier smartphones, again raising the bar in high-quality audio for upper-tier mobile devices. Sales of these components also continued to gain traction outside smartphones, with numerous product introductions in laptops and tablets during the quarter. Notably, momentum with leading laptop OEMs remained strong and we expect to see a pipeline of new products incorporating our technology come to market over the next year. Our revenue growth in the laptop space has accelerated ahead of our strategic objectives, due in part to opportunities presented by supply chain disruptions and the significant uptick in demand seen in this market during the COVID-19 pandemic. However, we believe underlying secular factors are also expanding our content opportunity, in particular: a growing preference for high-quality video and audio; an evolution towards technologies that facilitate thinner devices, such as haptic trackpads and micro-speakers requiring higher-voltage drivers; and an architectural evolution away from HDA-connected devices towards multiple Soundwire®-connected boosted amplifiers. Looking ahead, we are investing in next-generation audio technologies, such as higher-voltage capabilities and 22-nanometer process node design, which we believe will strengthen our leadership and competitive advantage in audio in the years to come. We made significant progress toward further product diversification and revenue growth in the high-performance mixed-signal category over the past quarter. Shipments of our camera controller ramped ahead of a new product launch and we were delighted to see that our technology remains   Q2 FY22 Letter to Shareholders 
 

 8  an important differentiator for this generation of devices. With a robust roadmap of next-generation components that offer further feature and performance enhancements, our team is focused on driving innovation and creating additional value in camera controllers. Customer interest and design activity around our haptic driver and sensing solutions were encouraging and while adoption in smartphones continues to grow, we are also excited about the opportunity to provide an immersive touch experience in other devices including laptops, AR/VR and wearables. We view power as our largest growth opportunity within the high-performance mixed-signal category and are investing in new product development in this area. During the quarter, we commenced high-volume shipments of our first-generation power conversion and control IC, which brings new technologies and system-level capabilities to smartphones. Additionally, we are encouraged by the customer engagement and design momentum around the innovative fast-charging products added to our portfolio with the acquisition of Lion Semiconductor. There is significant interest in continued innovation for wired and wireless fast-charging and the company is focused on expanding and accelerating Lion’s roadmap. Longer-term, we believe these battery-centric solutions and our power conversion and control IC technology are highly complementary and offer a unique opportunity to add value around battery health and performance. Finally, we are also excited to have recently welcomed Raghib Hussain to the company’s board of directors. With a deep knowledge of the semiconductor industry, strong technical expertise and a track record of operational and strategic success, Mr. Hussain will be an outstanding addition to the Cirrus Logic team as we look to drive continued financial growth through innovation in mixed-signal products.  Q2 FY22 Letter to Shareholders  Summary and GuidanceFor the December quarter we expect the following results:Revenue to range between $490 million and $530 million; GAAP gross margin to be between 50 percent and 52 percent; and Combined GAAP R&D and SG&A expenses to range between $141 million and $147 million, including approximately $19 million in stock-based compensation expense, $9 million in amortization of acquired intangibles and $3 million in acquisition-related costs. In summary, in the September quarter we ramped shipments for numerous new devices and executed on key strategic initiatives that are expected to fuel growth opportunities in new product categories. With a rich portfolio of high-performance products and a roadmap that will strengthen our position as a leading supplier of innovative mixed-signal solutions, we are excited by our opportunities for further product diversification and growth in the future.  
 

 9  Sincerely,    John ForsythPresident & Chief Executive Officer    Thurman CaseChief Financial Officer  Conference Call Q&A SessionCirrus Logic will host a live Q&A session at 5 p.m. EDT today to answer questions related to its financial results and business outlook. Participants may listen to the conference call on the Cirrus Logic website. Participants who would like to submit a question to be addressed during the call are requested to email [email protected] replay of the webcast can be accessed on the Cirrus Logic website approximately two hours following its completion, or by calling (416) 621-4642 or toll free at (800) 585-8367 (Access Code: 3476036).   Use of Non-GAAP Financial InformationTo supplement Cirrus Logic's financial statements presented on a GAAP basis, Cirrus has provided non-GAAP financial information, including non-GAAP net income, diluted earnings per share, operating income and profit, operating expenses, gross margin and profit, tax expense, tax expense impact on earnings per share, and effective tax rate. A reconciliation of the adjustments to GAAP results is included in the tables below. We are also providing guidance on our non-GAAP expected effective tax rate. We are not able to provide guidance on our GAAP tax rate or a related reconciliation without unreasonable efforts since our future GAAP tax rate depends on our future stock price and related stock-based compensation information that is not currently available.Non-GAAP financial information is not meant as a substitute for GAAP results but is included because management believes such information is useful to our investors for informational and comparative purposes. In addition, certain non-GAAP financial information is used internally by management to evaluate and manage the company. The non-GAAP financial information used by   Q2 FY22 Letter to Shareholders 
 

 10  Cirrus Logic may differ from that used by other companies. These non-GAAP measures should be considered in addition to, and not as a substitute for, the results prepared in accordance with GAAP. Safe Harbor Statement Except for historical information contained herein, the matters set forth in this shareholder letter contain forward-looking statements, including statements about our long-term growth opportunities; our ability to grow revenue and diversify our product portfolio as we go forward; our ability to achieve our long-term gross margin model of 50 percent; our ability to work closely with our customers and supply chain partners to minimize impacts to our gross margin and overall business; our ability to increase R&D investment in our strategic initiatives, while continuing to gain increased leverage from our SG&A expense; our expectations for new products incorporating our technology to come to market over the next year; our expectations around growing our content in laptops, AR/VR and wearables; our ability to expand and accelerate Lion’s roadmap of fast-charging solutions; our ability to fuel growth opportunities in new product categories; our ability to strengthen our position as a leading supplier of high-performance mixed-signal solutions; our expectation around product diversification and growth in the future; our ability to continue to generate strong cash flow generation through FY22; effective tax rate for the full fiscal year 2022; and our forecasts for the third quarter of fiscal year 2022 revenue, profit, gross margin, combined research and development and selling, general and administrative expense levels, stock-based compensation expense, amortization of acquired intangibles and inventory levels. In some cases, forward-looking statements are identified by words such as “emerge,” “expect,” “anticipate,” “foresee,” “target,” “project,” “believe,” “goals,” “opportunity,” “estimates,” “intend,” “will,” and variations of these types of words and similar expressions. In addition, any statements that refer to our plans, expectations, strategies or other characterizations of future events or circumstances are forward-looking statements. These forward-looking statements are based on our current expectations, estimates and assumptions and are subject to certain risks and uncertainties that could cause actual results to differ materially and readers should not place undue reliance on such statements. These risks and uncertainties include, but are not limited to, the following: the level and timing of orders and shipments during the third quarter of fiscal year 2022, customer cancellations of orders, or the failure to place orders consistent with forecasts; changes with respect to our current expectations of future smartphone unit volumes; any delays in the timing and/or success of customers’ new product ramps; failure to win new designs or additional content as expected at Android customers; the risks of doing business internationally, including increased import/export restrictions and controls (e.g., the effect of the U.S. Bureau of Industry and Security of the U.S. Department of Commerce placing Huawei Technologies Co., Ltd. and certain of its affiliates on the Bureau’s Entity List), imposition of trade protection measures (e.g., tariffs or taxes), security and health risks, possible disruptions in transportation networks, and other economic, social, military and geo-political conditions in the countries in which we, our customers or our suppliers operate; recent increased industry-wide capacity constraints that may impact our ability to meet current customer demand, which could cause an unanticipated decline in our sales and damage our existing customer relationships and our ability to establish new customer relationships; the potential for increased prices due to capacity constraints in our supply chain, which, if we are unable to increase our selling price to our customers, could result in lower revenues and margins that could adversely affect our financial results; and the risk factors listed in our Form   Q2 FY22 Letter to Shareholders 
 

 11  10-K for the year ended March 27, 2021 and in our other filings with the Securities and Exchange Commission, which are available at www.sec.gov. The foregoing information concerning our business outlook represents our outlook as of the date of this news release, and we expressly disclaim any obligation to update or revise any forward-looking statements, whether as a result of new developments or otherwise.Special Statement Concerning Risks Associated with the COVID-19 Pandemic and Our Forward-Looking DisclosuresWe face risks related to global health epidemics that could impact our sales, supply chain and operations, resulting in significantly reduced revenue and adversely affecting operating results. On March 11, 2020, the World Health Organization declared a pandemic related to a novel coronavirus, commonly referred to as COVID-19. We continue to expect that COVID-19 will have an adverse effect on our business, financial condition and results of operations and, with the pandemic ongoing, we are unable to predict the full extent and nature of these impacts at this time. The COVID-19 pandemic will likely heighten or exacerbate many of the other risks described in the risk factors listed in our Form 10-K for the year ended March 27, 2021, and in our other filings with the Securities and Exchange CommissionAlthough we have not experienced a significant reduction in our overall productivity during fiscal year 2022, we have experienced, and expect to continue to experience, disruptions to our business operations, including those resulting from remote work arrangements for the majority of our employees, the implementation of certain measures at our facilities worldwide to protect our employees’ health and safety, government stay-at-home directives, quarantines, self-isolations, travel restrictions, or other restrictions on the ability of our employees to perform their jobs that may impact our ability to develop and design our products in a timely manner, meet required milestones, or win new business. Any increased or additional disruptions to our business operations would likely impact our ability to continue to maintain current levels of productivity. In the longer term, the COVID-19 pandemic is likely to continue to adversely affect the economies and financial markets of many countries, leading to a global economic downturn and potentially a recession. This would likely adversely affect the demand environment for our products and those of our customers, particularly consumer products such as smartphones, which may, in turn negatively affect our revenue and operating results. Cirrus Logic, Cirrus, and the Cirrus Logic logo are registered trademarks of Cirrus Logic, Inc. All other company or product names noted herein may be trademarks of their respective holders.   Q2 FY22 Letter to Shareholders  Summary of Financial Data Below:  
 

 12  Q2 FY22 Letter to Shareholders 
 

 13  Q2 FY22 Letter to Shareholders 
 

 14  Q2 FY22 Letter to Shareholders