Exhibit 99.1

April 30, 2025
Constellium Reports First Quarter 2025 Results and Maintains Full Year 2025 Guidance
Paris - Constellium SE (NYSE: CSTM) ("Constellium"
or the "Company") today reported results for the first quarter ended March 31, 2025.
First quarter 2025 highlights:
| • |
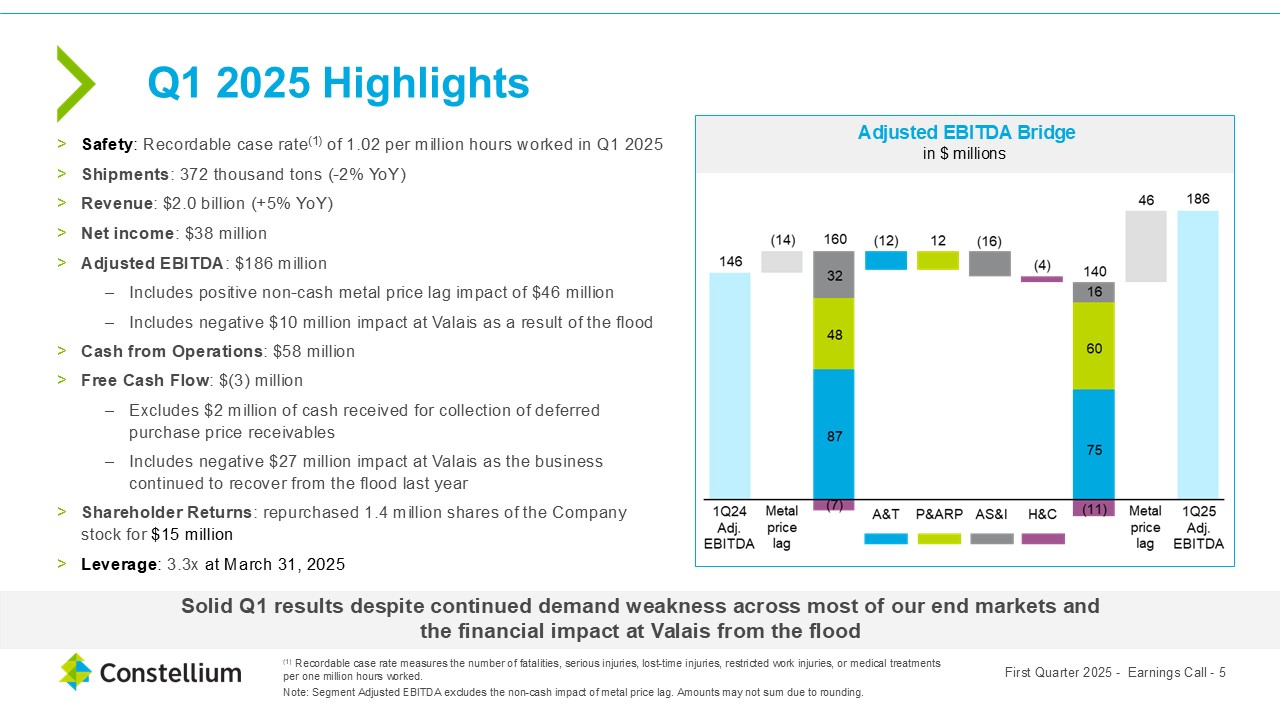
Shipments of 372 thousand metric tons, down 2% compared to Q1 2024
|
| • |
Revenue of $2.0 billion, up 5% compared to Q1 2024
|
| • |
Net income of $38 million compared to net income of $22 million in Q1 2024
|
| • |
Adjusted EBITDA of $186 million
|
> Includes positive non-cash metal price lag impact of $46 million
> Includes negative $10 million impact at Valais as a result of the flood
| • |
Segment Adjusted EBITDA of $75 million at A&T, $60 million at P&ARP, $16 million at AS&I, and $(11) million at H&C
|
> A&T and AS&I results include negative impact at Valais as a result of the flood
| • |
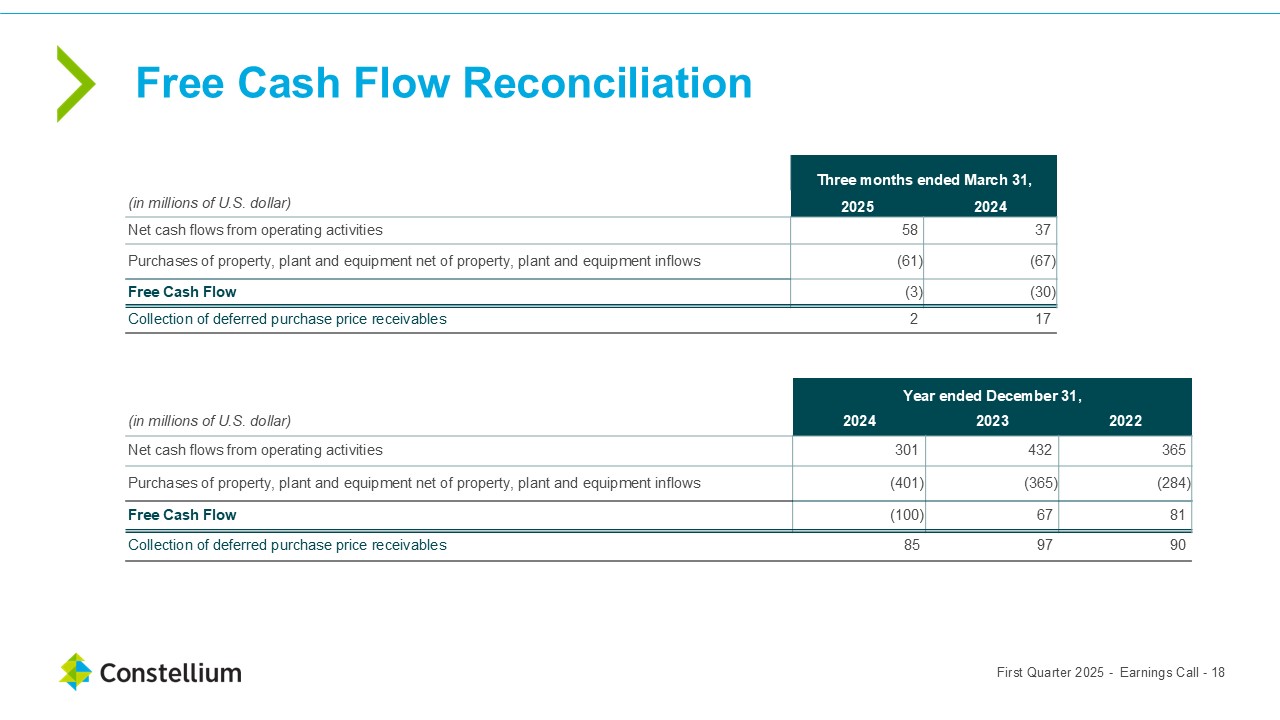
Cash from Operations of $58 million and Free Cash Flow of $(3) million
|
> Excludes $2 million of cash received for collection of deferred purchase price receivables
> Includes negative $27 million impact at Valais as the business continued to recover from the flood last year
| • |
Repurchased 1.4 million shares of the Company stock for $15 million
|
| • |
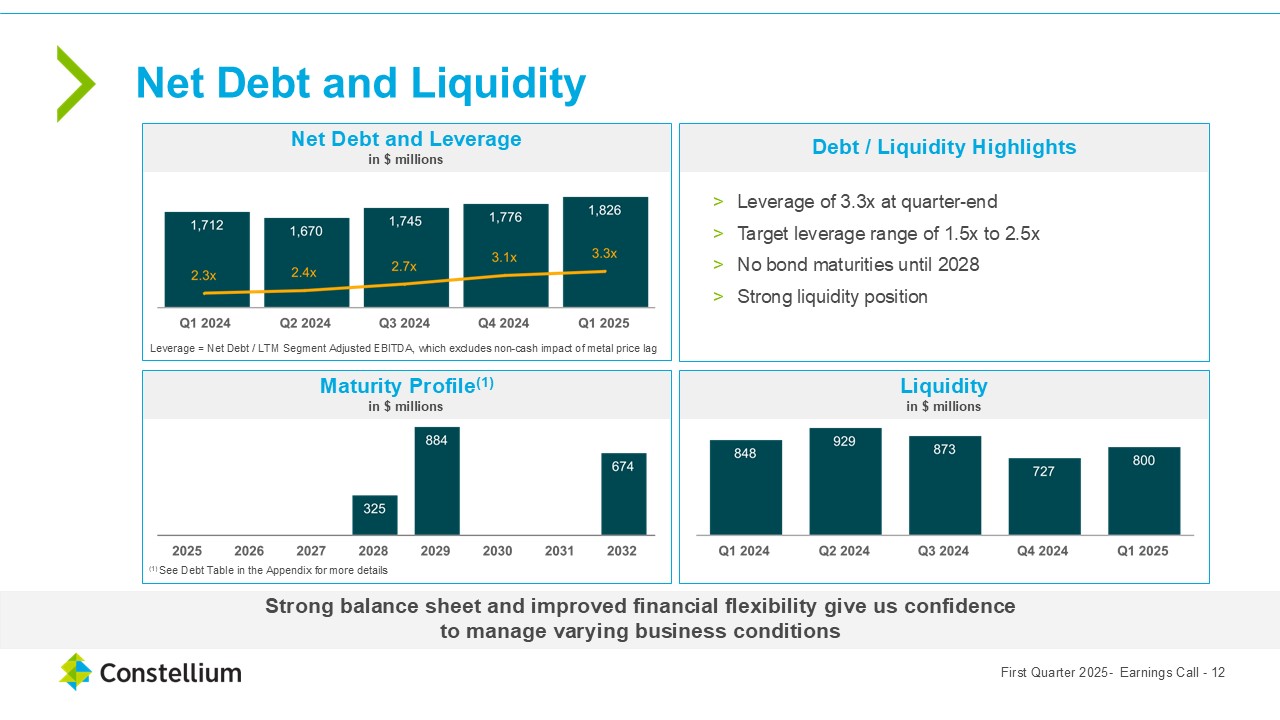
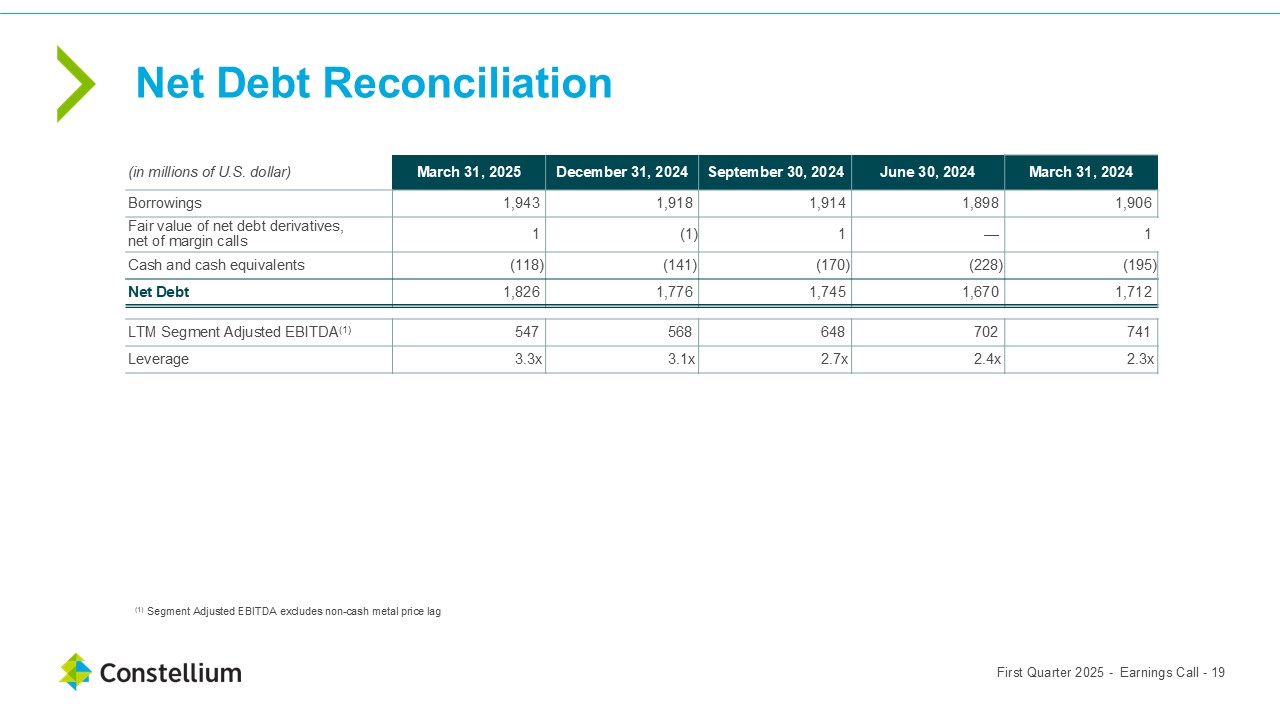
Leverage of 3.3x at March 31, 2025
|
|
Media Contacts
|
||
|
Investor Relations
|
Communications
|
|
|
Jason Hershiser
|
Delphine Dahan-Kocher
|
|
|
Phone: +1 443 988-0600
|
Phone: +1 443 420 7860
|
|
1
Jean-Marc Germain, Constellium’s Chief Executive Officer said, “Constellium delivered solid results in the first quarter despite continued demand weakness across most of
our end markets outside of packaging and some lingering impacts from the flood last year at our Valais operations. I am proud of our team for their relentless focus on cost reduction efforts and commercial and capital discipline in this uncertain
environment. Free Cash Flow was negative $3 million in the quarter, which includes a negative $27 million impact at Valais as the business continued to recover from the flood last year. We repurchased 1.4 million shares for $15 million during the
quarter, and we ended the quarter with leverage at 3.3x.”
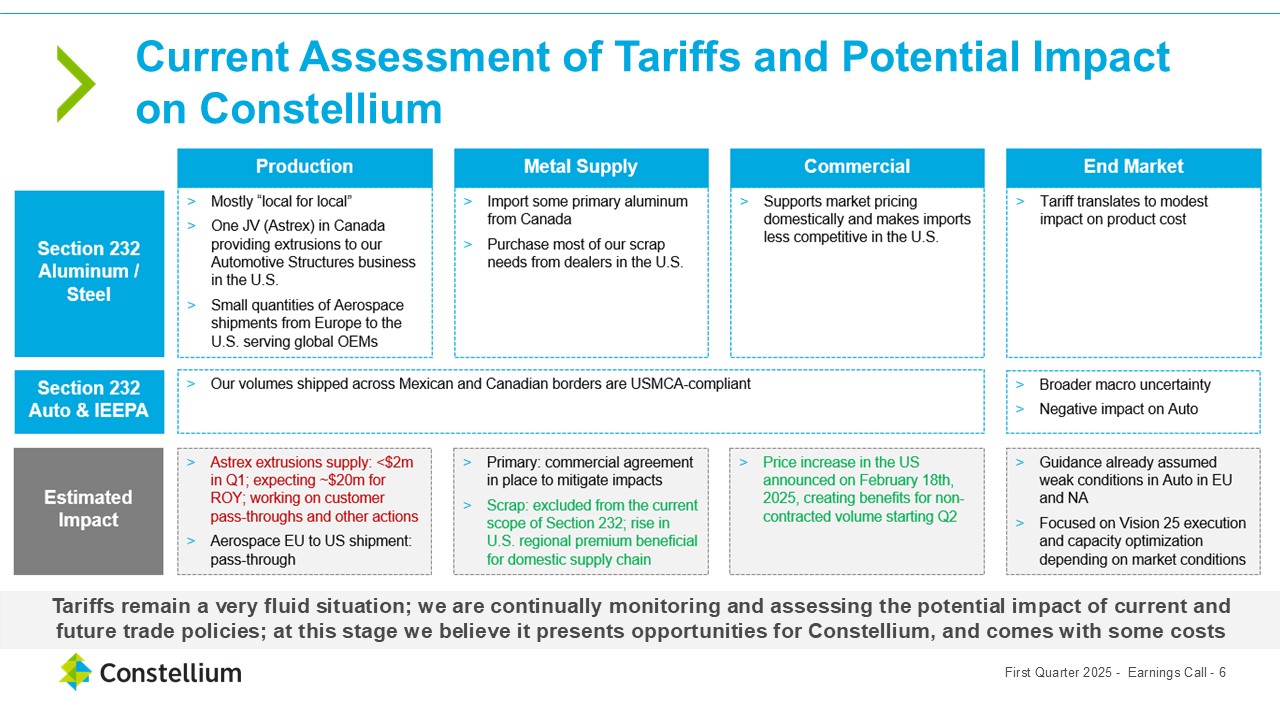
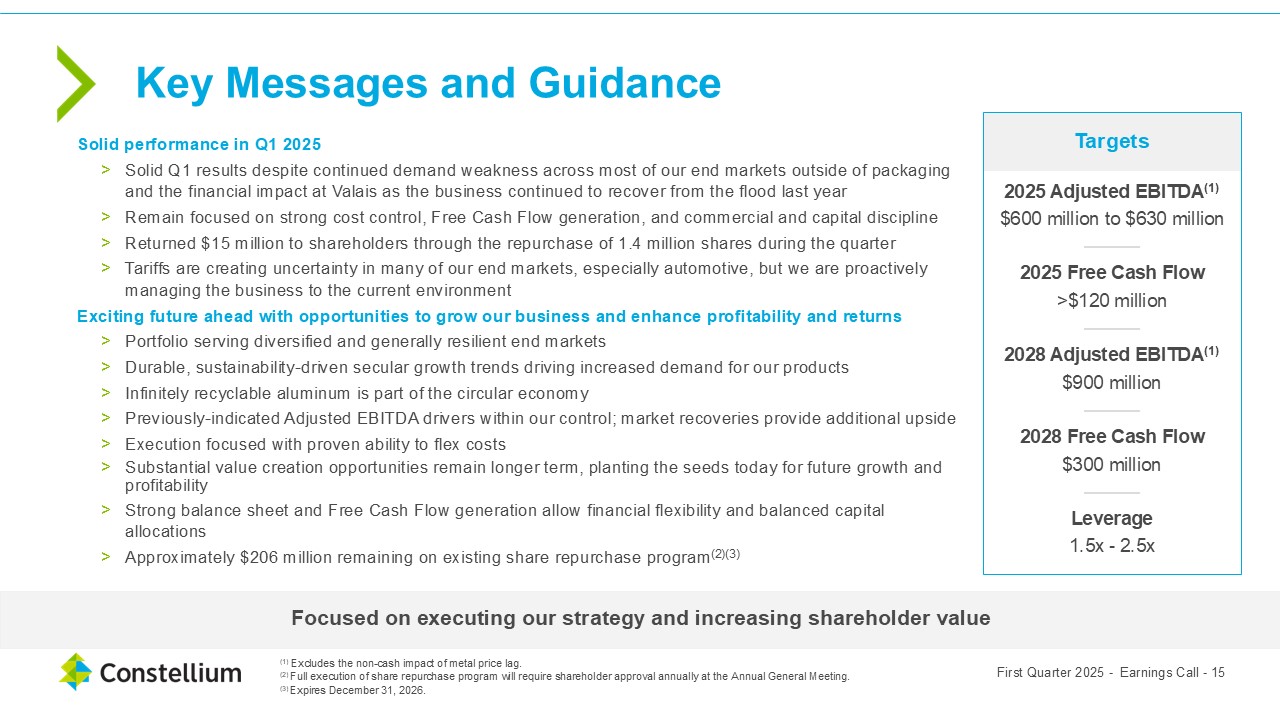
Mr. Germain continued, “While the tariff and international trade situation remains highly unpredictable, at this stage we are maintaining our prior guidance for 2025 and
expect Adjusted EBITDA to be in the range of $600 million to $630 million, excluding the non-cash impact of metal price lag, and Free Cash Flow in excess of $120 million. Our guidance assumes that the overall macroeconomic and end market
environment will remain relatively stable. We also remain confident in our ability to deliver on our long-term target of Adjusted EBITDA of $900 million, excluding the non-cash impact of metal price lag, and Free Cash Flow of $300 million, in 2028.
We will continue to closely monitor the situation and update our guidance as necessary. Our focus remains on executing our strategy, driving operational performance, generating Free Cash Flow and increasing shareholder value.”
 |
2 |
Group Summary
|
Q1 2025
|
Q1 2024
|
Var.
|
||||||||||
|
Shipments (k metric tons)
|
372
|
380
|
(2
|
)%
|
||||||||
|
Revenue ($ millions)
|
1,979
|
1,880
|
5
|
%
|
||||||||
|
Net income ($ millions)
|
38
|
22
|
n.m.
|
|||||||||
|
Adjusted EBITDA ($ millions)
|
186
|
146
|
n.m.
|
|||||||||
|
Metal price lag (non-cash) ($ millions)
|
46
|
(14
|
)
|
n.m.
|
||||||||
The difference between the sum of reported segment revenue and total group revenue includes revenue from certain non-core activities and inter-segment
eliminations. The difference between the sum of reported Segment Adjusted EBITDA and the Group Adjusted EBITDA is related to Holdings and Corporate and the non-cash impact of metal price lag.
For the first quarter of 2025, shipments of 372 thousand metric tons decreased 2% compared to the first quarter of 2024 due to lower shipments in the A&T and AS&I
segments, partially offset by higher shipments in the P&ARP segment. Revenue of $2.0 billion increased 5% compared to the first quarter of the prior year primarily due to higher metal prices, partially offset by lower shipments. Net income of
$38 million increased $16 million compared to net income of $22 million in the first quarter of 2024. Adjusted EBITDA of $186 million increased $40 million compared to Adjusted EBITDA of $146 million in the first quarter of last year primarily due
to stronger results in our P&ARP segment and a favorable change in the non-cash metal price lag impact, partially offset by weaker results in our A&T and AS&I segments, unfavorable foreign exchange translation, and a $10 million impact
at Valais as a result of the flood.
Results by Segment
Aerospace & Transportation (A&T)
|
Q1 2025
|
Q1 2024
|
Var.
|
||||||||||
|
Shipments (k metric tons)
|
51
|
57
|
(11
|
) %
|
||||||||
|
Revenue ($ millions)
|
468
|
479
|
(2
|
)%
|
||||||||
|
Segment Adjusted EBITDA ($ millions)
|
75
|
87
|
(14
|
)%
|
||||||||
|
Segment Adjusted EBITDA per metric ton ($)
|
1,469
|
1,513
|
(3
|
)%
|
||||||||
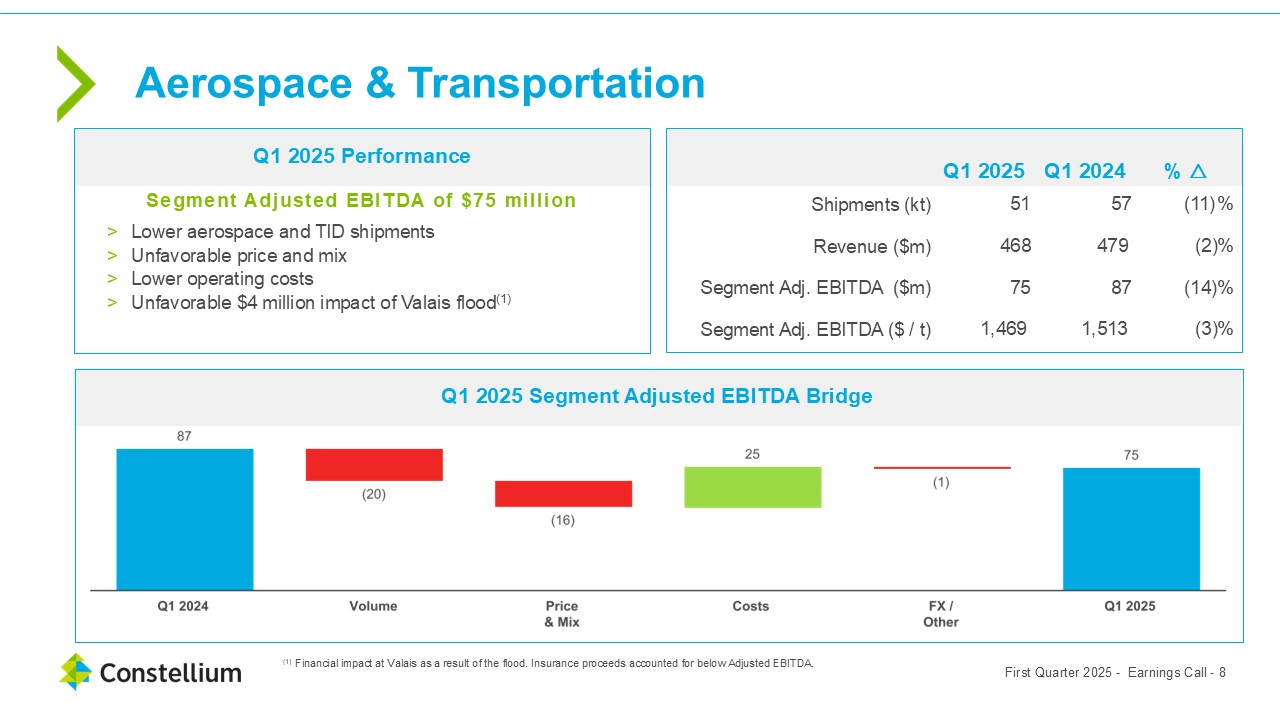
For the first quarter of 2025, Segment Adjusted EBITDA of $75 million decreased 14% compared to the first quarter of 2024 primarily due to lower shipments, unfavorable
price and mix and a $4 million impact at Valais as a result of the flood, partially offset by lower operating costs. Shipments of 51 thousand metric tons decreased 11% compared to the first quarter of 2024 due to lower shipments of aerospace and
transportation, industry and defense (TID) rolled products. Revenue of $468 million decreased 2% compared to the first quarter of 2024 primarily due to lower shipments, mostly offset by higher metal prices.
|
3 |
Packaging & Automotive Rolled Products (P&ARP)
|
Q1 2025
|
Q1 2024
|
Var.
|
||||||||||
|
Shipments (k metric tons)
|
269
|
264
|
2
|
%
|
||||||||
|
Revenue ($ millions)
|
1,187
|
1,018
|
17
|
%
|
||||||||
|
Segment Adjusted EBITDA ($ millions)
|
60
|
48
|
25
|
%
|
||||||||
|
Segment Adjusted EBITDA per metric ton ($)
|
223
|
182
|
23
|
%
|
||||||||
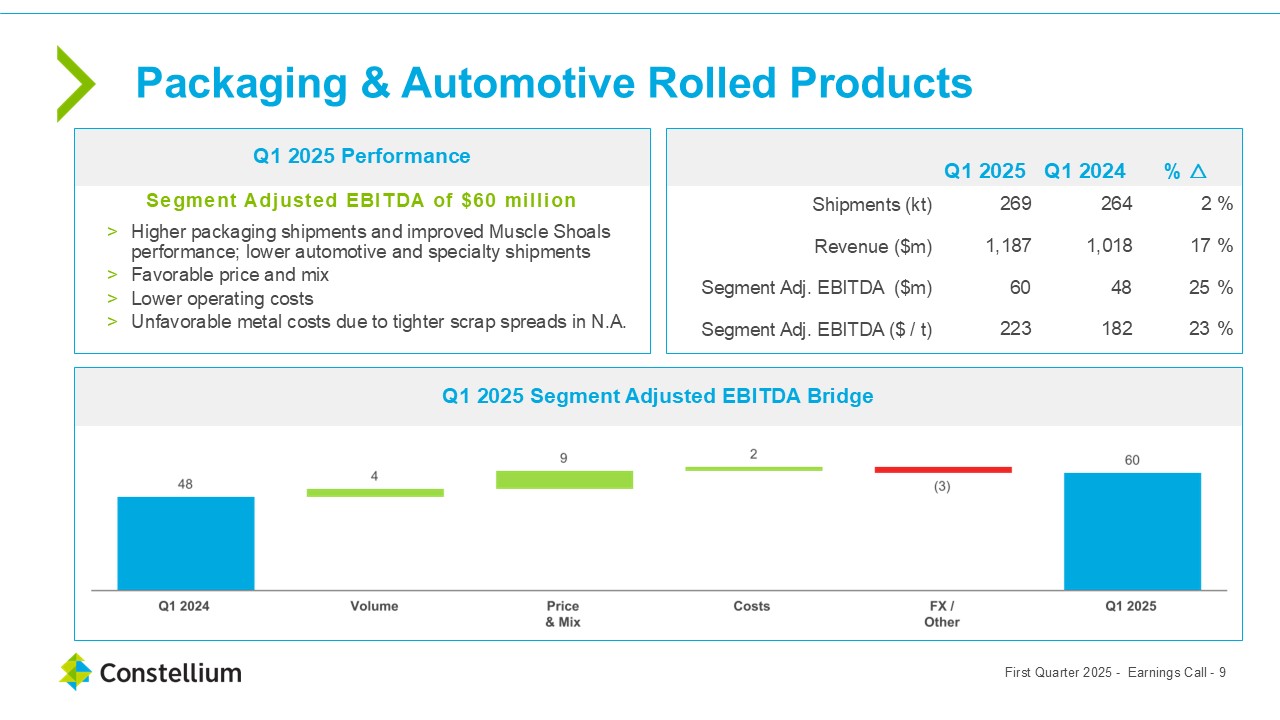
For the first quarter of 2025, Segment Adjusted EBITDA of $60 million increased 25% compared to the first quarter of 2024 primarily due to higher shipments and improved
Muscle Shoals performance, favorable price and mix and lower operating costs, partially offset by unfavorable metal costs due to tighter scrap spreads in North America. Shipments of 269 thousand metric tons increased 2% compared to the first
quarter of 2024 due to higher shipments of packaging rolled products, partially offset by lower shipments of automotive and specialty rolled products. Revenue of $1.2 billion increased 17% compared to the first quarter of 2024 primarily due to
higher metal prices.
Automotive Structures & Industry (AS&I)
|
Q1 2025
|
Q1 2024
|
Var.
|
||||||||||
|
Shipments (k metric tons)
|
52
|
59
|
(12
|
)%
|
||||||||
|
Revenue ($ millions)
|
381
|
396
|
(4
|
)%
|
||||||||
|
Segment Adjusted EBITDA ($ millions)
|
16
|
32
|
(50
|
)%
|
||||||||
|
Segment Adjusted EBITDA per metric ton ($)
|
306
|
541
|
(43
|
)%
|
||||||||
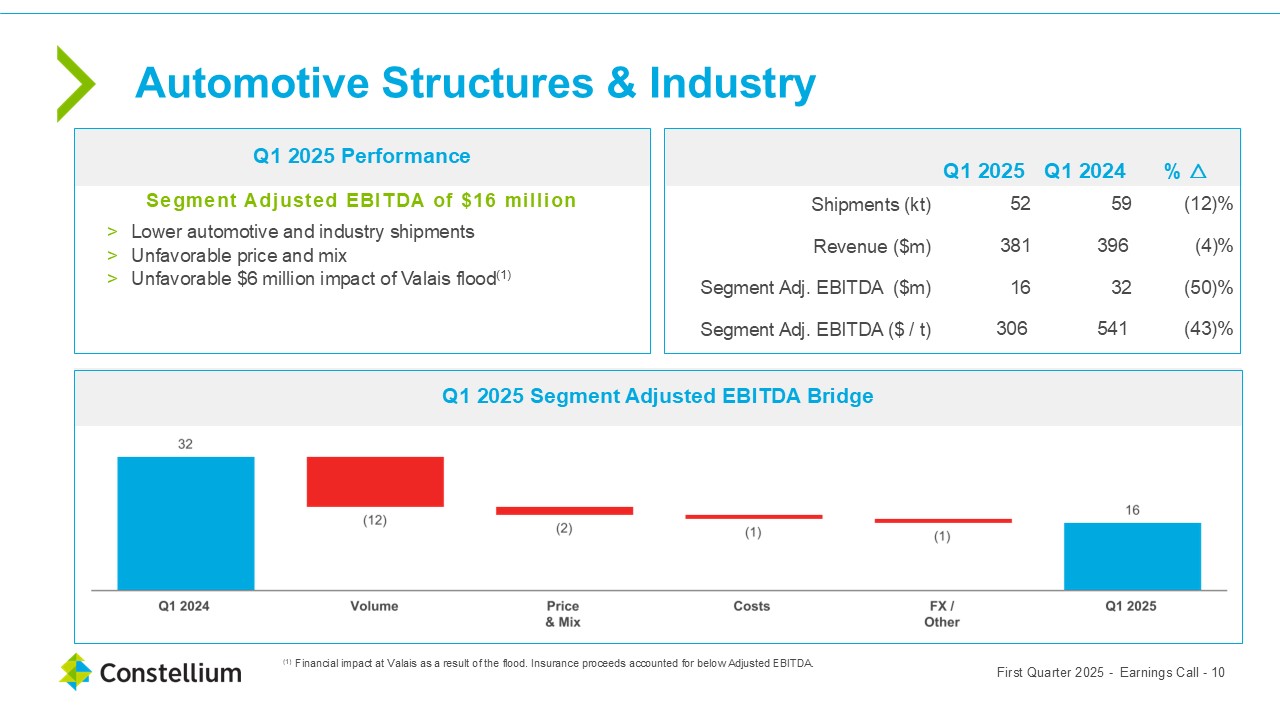
For the first quarter of 2025, Segment Adjusted EBITDA of $16 million decreased 50% compared to the first quarter of 2024 primarily due to lower shipments and a $6
million impact at Valais as a result of the flood. Shipments of 52 thousand metric tons decreased 12% compared to the first quarter of 2024 due to lower shipments of automotive and other extruded products. Revenue of $381 million decreased 4%
compared to the first quarter of 2024 primarily due to lower shipments, partially offset by higher metal prices.
|
4 |
The following table reconciles the total of our segments’ measures of profitability to the group’s net income:
|
Three months ended March 31,
|
||||||||
|
(in millions of U.S. dollar)
|
2025
|
2024
|
||||||
|
A&T
|
75
|
87
|
||||||
|
P&ARP
|
60
|
48
|
||||||
|
AS&I
|
16
|
32
|
||||||
|
Holdings and Corporate
|
(11
|
)
|
(7
|
)
|
||||
|
Segment Adjusted EBITDA
|
140
|
160
|
||||||
|
Metal price lag
|
46
|
(14
|
)
|
|||||
|
Adjusted EBITDA
|
186
|
146
|
||||||
|
Other adjustments
|
(97
|
)
|
(89
|
)
|
||||
|
Finance costs - net
|
(27
|
)
|
(27
|
)
|
||||
|
Income before tax
|
62
|
30
|
||||||
|
Income tax expense
|
(24
|
)
|
(8
|
)
|
||||
|
Net income
|
38
|
22
|
||||||
Reconciling items excluded from our Segment Adjusted EBITDA include the following:
Metal price lag
Metal price lag represents the financial impact of the timing difference between when aluminum prices included within Constellium's Revenue are established and when
aluminum purchase prices included in Cost of sales are established. The metal price lag will generally increase our earnings in times of rising primary aluminum prices and decrease our earnings in times of declining primary aluminum prices. The
calculation of metal price lag adjustment is based on a standardized methodology applied at each of Constellium’s manufacturing sites. Metal price lag is calculated as the average value of product purchased in the period, approximated at the market
price, less the value of product in inventory at the weighted average of metal purchased over time, multiplied by the quantity sold in the period.
For the first quarter of 2025, metal price lag is positive which reflects London Metal Exchange (LME) prices for aluminum increasing during the period. For the first
quarter of 2024, metal price lag was negative which reflected LME prices for aluminum decreasing during the period.
Other adjustments are detailed in the Reconciliation of net income to Adjusted EBITDA Table on page 17.
|
5 |
Net Income
For the first quarter of 2025, net income of $38 million compares to net income of $22 million in the first quarter of the prior year. The increase in net income is
primarily related to higher gross profit and favorable changes in gains and losses on derivatives mostly related to our hedging positions, partially offset by higher income tax expense.
Cash Flow
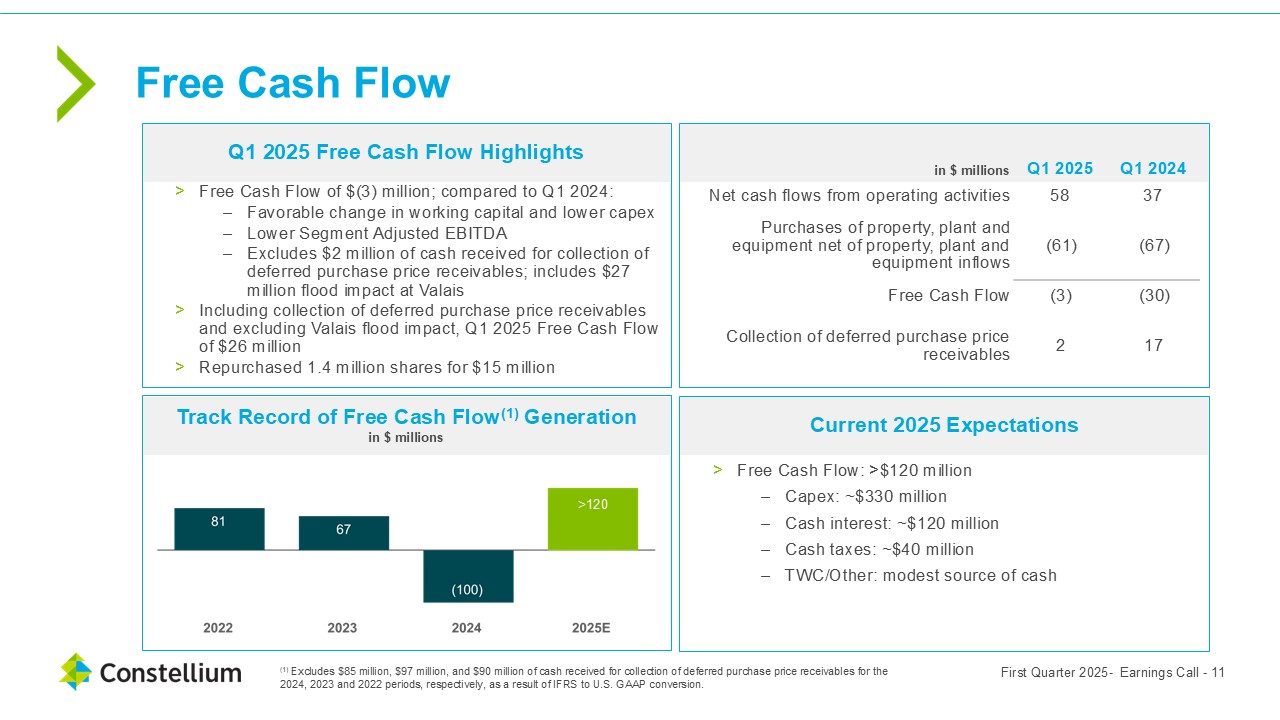
Free Cash Flow was $(3) million in the first quarter of 2025 compared to $(30) million in the first quarter of 2024. The increase in Free Cash Flow was primarily due to a
favorable change in working capital excluding working capital build up at Valais as a result of the flood and lower capital expenditures, partially offset by lower Segment Adjusted EBITDA.
Cash flows from operating activities were $58 million for the first quarter of 2025 compared to cash flows from operating activities of $37 million in the first quarter
of the prior year.
Cash flows used in investing activities were $59 million for the first quarter of 2025 compared to cash flows used in investing activities of $50 million in the first
quarter of the prior year.
Cash flows used in financing activities were $26 million for first quarter of 2025 compared to cash flows used in financing activities of $10 million in the first quarter
of the prior year. During the first quarter of 2025, the Company repurchased 1.4 million shares of the Company stock for $15 million.
Liquidity and Net Debt
Liquidity at March 31, 2025 was $800 million, comprised of $118 million of cash and cash equivalents and $682 million available under our committed lending facilities and
factoring arrangements.
Net debt was $1,826 million at March 31, 2025 compared to $1,776 million at December 31, 2024.
|
6 |
Outlook
Based on our current outlook, for 2025 we expect Adjusted EBITDA, which excludes the non-cash impact of metal price lag, to be in the range of $600 million to $630
million and Free Cash Flow in excess of $120 million. For 2028, we expect Adjusted EBITDA, which excludes the non-cash impact of metal price lag, of $900 million and Free Cash Flow of $300 million.
We are not able to provide a reconciliation of this Adjusted EBITDA guidance to net income, the comparable GAAP measure, because certain items that
are excluded from Adjusted EBITDA cannot be reasonably predicted or are not in our control. In particular, we are unable to forecast the timing or magnitude of realized and unrealized gains and losses on derivative instruments, impairment or
restructuring charges, or taxes without unreasonable efforts, and these items could significantly impact, either individually or in the aggregate, net income in the future.
|
7 |
Forward-looking statements
Certain statements contained in this press release may constitute forward-looking statements within the meaning of the Private Securities Litigation Reform Act of 1995.
This press release may contain “forward-looking statements” with respect to our business, results of operations and financial condition, and our expectations or beliefs concerning future events and conditions. You can identify forward-looking
statements because they contain words such as, but not limited to, “believes,” “expects,” “may,” “should,” “approximately,” “anticipates,” “estimates,” “intends,” “plans,” “targets,” likely,” “will,” “would,” “could” and similar expressions (or the
negative of these terminologies or expressions). All forward-looking statements involve risks and uncertainties. Many risks and uncertainties are inherent in our industry and markets, while others are more specific to our business and operations.
These risks and uncertainties include, but are not limited to: market competition; economic downturn or industry specific conditions including the impacts of tax and tariff programs, inflation, foreign currency exchange, and industry consolidation;
disruption to business operations; natural disasters including severe flooding and other weather-related events; the conflict between Russia and Ukraine and other geopolitical tensions; the inability to meet customer demand and quality
requirements; the loss of key customers, suppliers or other business relationships; supply disruptions; excessive inflation; the capacity and effectiveness of our hedging policy activities; the loss of key employees; levels of indebtedness which
could limit our operating flexibility and opportunities; and other risk factors set forth under the heading “Risk Factors” in our Annual Report on Form 10-K, and as described from time to time in subsequent reports filed with the U.S. Securities
and Exchange Commission. The occurrence of the events described and the achievement of the expected results depend on many events, some or all of which are not predictable or within our control. Consequently, actual results may differ materially
from the forward-looking statements contained in this press release. We undertake no obligation to update or revise any forward-looking statement as a result of new information, future events or otherwise, except as required by law.
About Constellium
Constellium (NYSE: CSTM) is a global sector leader that develops innovative, value-added aluminum products for a broad scope of markets and applications, including
aerospace, packaging and automotive. Constellium generated $7.3 billion of revenue in 2024.
Constellium’s earnings materials for the first quarter ended March 31, 2025 are also available on the
company’s website (www.constellium.com).
|
8 |
Non-GAAP measures
In addition to the results reported in accordance with United States Generally Accepted Accounting Principles (“U.S. GAAP”), this press release includes information
regarding certain financial measures which are not prepared in accordance with U.S. GAAP (“non-GAAP measures”). The non-GAAP measures used in this press release are: Adjusted EBITDA, Free Cash Flow and Net debt. Reconciliations to the most directly
comparable U.S. GAAP financial measures are presented in the schedules to this press release. We believe these non-GAAP measures are important supplemental measures of our operating and financial performance. By providing these measures, together
with the reconciliations, we believe we are enhancing investors’ understanding of our business, our results of operations and our financial position, as well as assisting investors in evaluating the extent to which we are executing our strategic
initiatives. However, these non-GAAP financial measures supplement our U.S. GAAP disclosures and should not be considered an alternative to the U.S. GAAP measures and may not be comparable to similarly titled measures of other companies.
Adjusted EBITDA is not a presentation made in accordance with U.S. GAAP, is not a measure of financial condition, liquidity or profitability and should not be considered
as an alternative to profit or loss for the period, revenues or operating cash flows determined in accordance with U.S. GAAP. The most directly comparable U.S. GAAP measure to Adjusted EBITDA is our net income or loss for the relevant period.
Adjusted EBITDA is defined as income / (loss) from continuing operations before income taxes, results from joint ventures, net finance costs, other expenses and
depreciation and amortization as adjusted to exclude restructuring costs, impairment charges, unrealized gains or losses on derivatives and on foreign exchange differences on transactions which do not qualify for hedge accounting, share based
compensation expense, non-operating gains / (losses) on pension and other post-employment benefits, factoring expenses, effects of certain purchase accounting adjustments, start-up and development costs or acquisition, integration and separation
costs, certain incremental costs and other exceptional, unusual or generally non-recurring items.
We believe Adjusted EBITDA is useful to investors as it illustrates the underlying performance of continuing operations by excluding certain non-recurring and
non-operating items. Similar concepts of Adjusted EBITDA are frequently used by securities analysts, investors and other stakeholders in their evaluation of our company and in comparison, to other companies, many of which present an Adjusted
EBITDA-related performance measure when reporting their results.
|
9 |
Free Cash Flow is defined as net cash flow from operating activities, less capital expenditures, net of property, plant and equipment inflows. Management believes that
Free Cash Flow is a useful measure of the net cash flow generated or used by the business as it takes into account both the cash generated or consumed by operating activities, including working capital, and the capital expenditure requirements of
the business. However, Free Cash Flow is not a presentation made in accordance with U.S. GAAP and should not be considered as an alternative to operating cash flows determined in accordance with U.S. GAAP. Free Cash Flow has certain inherent
limitations, including the fact that it does not represent residual cash flows available for discretionary spending, notably because it does not reflect principal repayments required in connection with our debt or capital lease obligations.
Net debt is defined as debt plus or minus the fair value of cross currency basis swaps net of margin calls less cash and cash equivalents and cash pledged for the
issuance of guarantees. Management believes that Net debt is a useful measure of indebtedness because it takes into account the cash and cash equivalent balances held by the Company as well as the total external debt of the Company. Net debt is not
a presentation made in accordance with U.S. GAAP, and should not be considered as an alternative to debt determined in accordance with U.S. GAAP. Leverage is defined as Net debt divided by last twelve months Segment Adjusted EBITDA, which excludes
the non-cash impact of metal price lag.
|
10 |
CONSOLIDATED INCOME STATEMENT (UNAUDITED)
|
Three months ended March 31,
|
||||||||
|
(in millions of U.S. dollar)
|
2025
|
2024
|
||||||
|
Revenue
|
1,979
|
1,880
|
||||||
|
Cost of sales (excluding depreciation and amortization)
|
(1,716
|
)
|
(1,635
|
)
|
||||
|
Depreciation and amortization
|
(78
|
)
|
(75
|
)
|
||||
|
Selling and administrative expenses
|
(78
|
)
|
(80
|
)
|
||||
|
Research and development expenses
|
(13
|
)
|
(15
|
)
|
||||
|
Other gains and losses - net
|
(5
|
)
|
(18
|
)
|
||||
|
Finance costs - net
|
(27
|
)
|
(27
|
)
|
||||
|
Income before tax
|
62
|
30
|
||||||
|
Income tax expense
|
(24
|
)
|
(8
|
)
|
||||
|
Net income
|
38
|
22
|
||||||
|
Attributable to:
|
||||||||
|
Equity holders of Constellium
|
37
|
21
|
||||||
|
Non-controlling interests
|
1
|
1
|
||||||
|
Net income
|
38
|
22
|
||||||
|
Earnings per share attributable to the equity holders of Constellium (in dollars)
|
||||||||
|
Basic
|
0.26
|
0.14
|
||||||
|
Diluted
|
0.26
|
0.14
|
||||||
|
Weighted average number of shares (in thousands)
|
||||||||
|
Basic
|
142,495
|
146,796
|
||||||
|
Diluted
|
144,090
|
150,211
|
||||||
|
11 |
CONSOLIDATED STATEMENT OF COMPREHENSIVE INCOME / (LOSS) (UNAUDITED)
|
Three months ended March 31,
|
||||||||
|
(in millions of U.S. dollar)
|
2025
|
2024
|
||||||
|
Net income
|
38
|
22
|
||||||
|
Net change in post-employment benefit obligations
|
(3
|
)
|
(5
|
)
|
||||
|
Income tax on net change in post-employment benefit obligations
|
1
|
2
|
||||||
|
Net change in cash flow hedges
|
12
|
(2
|
)
|
|||||
|
Income tax on cash flow hedges
|
(3
|
)
|
—
|
|||||
|
Currency translation differences
|
4
|
(6
|
)
|
|||||
|
Other comprehensive income / (loss)
|
11
|
(11
|
)
|
|||||
|
Total comprehensive income
|
49
|
11
|
||||||
|
Attributable to:
|
||||||||
|
Equity holders of Constellium
|
48
|
10
|
||||||
|
Non-controlling interests
|
1
|
1
|
||||||
|
Total comprehensive income
|
49
|
11
|
||||||
|
12 |
CONSOLIDATED BALANCE SHEETS (UNAUDITED)
|
(in millions of U.S. dollar, except share data)
|
At March 31, 2025
|
At December 31,
2024
|
||||||
|
Assets
|
||||||||
|
Current assets
|
||||||||
|
Cash and cash equivalents
|
118
|
141
|
||||||
|
Trade receivables and other, net
|
818
|
486
|
||||||
|
Inventories
|
1,278
|
1,181
|
||||||
|
Fair value of derivatives instruments and other financial assets
|
22
|
26
|
||||||
|
Total current assets
|
2,236
|
1,834
|
||||||
|
Non-current assets
|
||||||||
|
Property, plant and equipment, net
|
2,456
|
2,408
|
||||||
|
Goodwill
|
46
|
46
|
||||||
|
Intangible assets, net
|
94
|
97
|
||||||
|
Deferred tax assets
|
294
|
311
|
||||||
|
Trade receivables and other, net
|
38
|
36
|
||||||
|
Fair value of derivatives instruments
|
4
|
2
|
||||||
|
Total non-current assets
|
2,932
|
2,900
|
||||||
|
Total assets
|
5,168
|
4,734
|
||||||
|
Liabilities
|
||||||||
|
Current liabilities
|
||||||||
|
Trade payables and other
|
1,665
|
1,309
|
||||||
|
Short-term debt
|
35
|
39
|
||||||
|
Fair value of derivatives instruments
|
42
|
33
|
||||||
|
Income tax payable
|
17
|
18
|
||||||
|
Pension and other benefit obligations
|
23
|
22
|
||||||
|
Provisions
|
26
|
25
|
||||||
|
Total current liabilities
|
1,808
|
1,446
|
||||||
|
Non-current liabilities
|
||||||||
|
Trade payables and other
|
160
|
156
|
||||||
|
Long-term debt
|
1,908
|
1,879
|
||||||
|
Fair value of derivatives instruments
|
10
|
21
|
||||||
|
Pension and other benefit obligations
|
377
|
375
|
||||||
|
Provisions
|
92
|
91
|
||||||
|
Deferred tax liabilities
|
48
|
39
|
||||||
|
Total non-current liabilities
|
2,595
|
2,561
|
||||||
|
Total liabilities
|
4,403
|
4,007
|
||||||
|
Commitments and contingencies
|
||||||||
|
Shareholder's equity
|
||||||||
|
Ordinary shares, par value €0.02, 146,819,884 shares issued at March 31, 2025 and December 31, 2024
|
4
|
4
|
||||||
|
Additional paid in capital
|
513
|
513
|
||||||
|
Accumulated other comprehensive income
|
(1
|
)
|
(14
|
)
|
||||
|
Retained earnings and other reserves
|
229
|
203
|
||||||
|
Equity attributable to equity holders of Constellium
|
745
|
706
|
||||||
|
Non-controlling interests
|
20
|
21
|
||||||
|
Total equity
|
765
|
727
|
||||||
|
Total equity and liabilities
|
5,168
|
4,734
|
||||||
|
13 |
CONSOLIDATED STATEMENT OF CHANGES IN EQUITY (UNAUDITED)
|
(in millions of U.S. dollar)
|
Ordinary shares
|
Additional paid in capital
|
Treasury shares
|
Accumulated other comprehensive income / (loss)
|
Other reserves
|
Retained earnings
|
Total
|
Non-
controlling interests
|
Total equity
|
|||||||||||||||||||||||||||
|
At January 1, 2025
|
4
|
513
|
(51
|
)
|
(14
|
)
|
161
|
93
|
706
|
21
|
727
|
|||||||||||||||||||||||||
|
Net income
|
—
|
—
|
—
|
—
|
—
|
37
|
37
|
1
|
38
|
|||||||||||||||||||||||||||
|
Other comprehensive income / (loss)
|
—
|
—
|
—
|
13
|
—
|
—
|
13
|
—
|
13
|
|||||||||||||||||||||||||||
|
Total comprehensive income / (loss)
|
—
|
—
|
—
|
13
|
—
|
37
|
50
|
1
|
51
|
|||||||||||||||||||||||||||
|
Share-based compensation
|
—
|
—
|
—
|
—
|
6
|
—
|
6
|
—
|
6
|
|||||||||||||||||||||||||||
|
Repurchase of ordinary shares
|
—
|
—
|
(15
|
)
|
—
|
—
|
—
|
(15
|
)
|
—
|
(15
|
)
|
||||||||||||||||||||||||
|
Allocation of treasury shares to share-based compensation plan vested
|
—
|
—
|
12
|
—
|
—
|
(12
|
)
|
—
|
—
|
—
|
||||||||||||||||||||||||||
|
Transactions with non-controlling interests
|
—
|
—
|
—
|
—
|
—
|
—
|
—
|
(2
|
)
|
(2
|
)
|
|||||||||||||||||||||||||
|
At March 31, 2025
|
4
|
513
|
(54
|
)
|
(1
|
)
|
167
|
116
|
744
|
21
|
765
|
|||||||||||||||||||||||||
|
(in millions of U.S. dollar)
|
Ordinary shares
|
Additiona
l paid in
capital
|
Treasur
y shares
|
Accumulated
other
comprehensiv
e income / (loss)
|
Other reserves
|
Retained earnings
|
Total
|
Non-
controlling interests
|
Total equity
|
|||||||||||||||||||||||||||
|
At January 1, 2024
|
4
|
513
|
—
|
—
|
136
|
65
|
718
|
24
|
742
|
|||||||||||||||||||||||||||
|
Net income
|
—
|
—
|
—
|
—
|
—
|
21
|
21
|
1
|
22
|
|||||||||||||||||||||||||||
|
Other comprehensive income / (loss)
|
—
|
—
|
—
|
(11
|
)
|
—
|
—
|
(11
|
)
|
—
|
(11
|
)
|
||||||||||||||||||||||||
|
Total comprehensive income / (loss)
|
—
|
—
|
—
|
(11
|
)
|
—
|
21
|
10
|
1
|
11
|
||||||||||||||||||||||||||
|
Share-based compensation
|
—
|
—
|
—
|
—
|
6
|
—
|
6
|
—
|
6
|
|||||||||||||||||||||||||||
|
Repurchase of ordinary shares
|
—
|
—
|
(7
|
)
|
—
|
—
|
—
|
(7
|
)
|
—
|
(7
|
)
|
||||||||||||||||||||||||
|
Allocation of treasury shares to share-based compensation plan vested
|
—
|
—
|
—
|
—
|
—
|
—
|
—
|
—
|
—
|
|||||||||||||||||||||||||||
|
Transactions with non-controlling interests
|
—
|
—
|
—
|
—
|
—
|
—
|
—
|
(1
|
)
|
(1
|
)
|
|||||||||||||||||||||||||
|
At March 31, 2024
|
4
|
513
|
(7
|
)
|
(11
|
)
|
142
|
86
|
727
|
24
|
751
|
|||||||||||||||||||||||||
|
14 |
CONSOLIDATED STATEMENT OF CASH FLOWS (UNAUDITED)
|
Three months ended March 31,
|
||||||||
|
(in millions of U.S. dollar)
|
2025
|
2024
|
||||||
|
Net income
|
38
|
22
|
||||||
|
Adjustments
|
||||||||
|
Depreciation and amortization
|
78
|
75
|
||||||
|
Impairment of assets
|
—
|
3
|
||||||
|
Pension and other long-term benefits
|
2
|
2
|
||||||
|
Finance costs - net
|
27
|
27
|
||||||
|
Income tax expense
|
24
|
8
|
||||||
|
Unrealized losses on derivatives - net and from remeasurement of monetary assets and liabilities - net
|
11
|
3
|
||||||
|
Losses on disposal
|
—
|
1
|
||||||
|
Other - net
|
11
|
13
|
||||||
|
Changes in working capital
|
||||||||
|
Inventories
|
(69
|
)
|
16
|
|||||
|
Trade receivables
|
(273
|
)
|
(173
|
)
|
||||
|
Trade payables
|
279
|
100
|
||||||
|
Other
|
(18
|
)
|
(16
|
)
|
||||
|
Change in provisions
|
(1
|
)
|
(2
|
)
|
||||
|
Pension and other long-term benefits paid
|
(13
|
)
|
(10
|
)
|
||||
|
Interest paid
|
(29
|
)
|
(26
|
)
|
||||
|
Income tax paid
|
(9
|
)
|
(6
|
)
|
||||
|
Net cash flows from operating activities
|
58
|
37
|
||||||
|
Purchases of property, plant and equipment
|
(69
|
)
|
(74
|
)
|
||||
|
Property, plant and equipment inflows
|
8
|
7
|
||||||
|
Collection of deferred purchase price receivable
|
2
|
17
|
||||||
|
Net cash flows used in investing activities
|
(59
|
)
|
(50
|
)
|
||||
|
Repurchase of ordinary shares
|
(15
|
)
|
(7
|
)
|
||||
|
Repayments of long-term debt
|
(1
|
)
|
(2
|
)
|
||||
|
Net change in revolving credit facilities and short-term debt
|
5
|
1
|
||||||
|
Finance lease repayments
|
(2
|
)
|
(2
|
)
|
||||
|
Transactions with non-controlling interests
|
(2
|
)
|
(1
|
)
|
||||
|
Other financing activities
|
(11
|
)
|
1
|
|||||
|
Net cash flows used in financing activities
|
(26
|
)
|
(10
|
)
|
||||
|
Net decrease in cash and cash equivalents
|
(27
|
)
|
(23
|
)
|
||||
|
Cash and cash equivalents - beginning of the period
|
141
|
223
|
||||||
|
Effect of exchange rate changes on cash and cash equivalents
|
4
|
(6
|
)
|
|||||
|
Cash and cash equivalents - end of period
|
118
|
194
|
||||||
|
15 |
SEGMENT ADJUSTED EBITDA
|
Three months ended March 31,
|
||||||||
|
(in millions of U.S. dollar)
|
2025
|
2024
|
||||||
|
A&T
|
75
|
87
|
||||||
|
P&ARP
|
60
|
48
|
||||||
|
AS&I
|
16
|
32
|
||||||
|
Holdings and Corporate
|
(11
|
)
|
(7
|
)
|
||||
SHIPMENTS AND REVENUE BY PRODUCT LINE
|
Three months ended March 31,
|
||||||||
|
(in k metric tons)
|
2025
|
2024
|
||||||
|
Aerospace rolled products
|
24
|
27
|
||||||
|
Transportation, industry, defense and other rolled products
|
28
|
30
|
||||||
|
Packaging rolled products
|
204
|
187
|
||||||
|
Automotive rolled products
|
60
|
71
|
||||||
|
Specialty and other thin-rolled products
|
4
|
6
|
||||||
|
Automotive extruded products
|
31
|
36
|
||||||
|
Other extruded products
|
22
|
23
|
||||||
|
Total shipments
|
372
|
380
|
||||||
|
Three months ended March 31,
|
||||||||
|
(in millions of U.S. dollar)
|
2025
|
2024
|
||||||
|
Aerospace rolled products
|
267
|
286
|
||||||
|
Transportation, industry, defense and other rolled products
|
201
|
193
|
||||||
|
Packaging rolled products
|
868
|
671
|
||||||
|
Automotive rolled products
|
291
|
311
|
||||||
|
Specialty and other thin-rolled products
|
28
|
36
|
||||||
|
Automotive extruded products
|
234
|
263
|
||||||
|
Other extruded products
|
147
|
133
|
||||||
|
Other and inter-segment eliminations
|
(57
|
)
|
(13
|
)
|
||||
|
Total Revenue by product line
|
1,979
|
1,880
|
||||||
Amounts may not sum due to rounding.
|
16 |
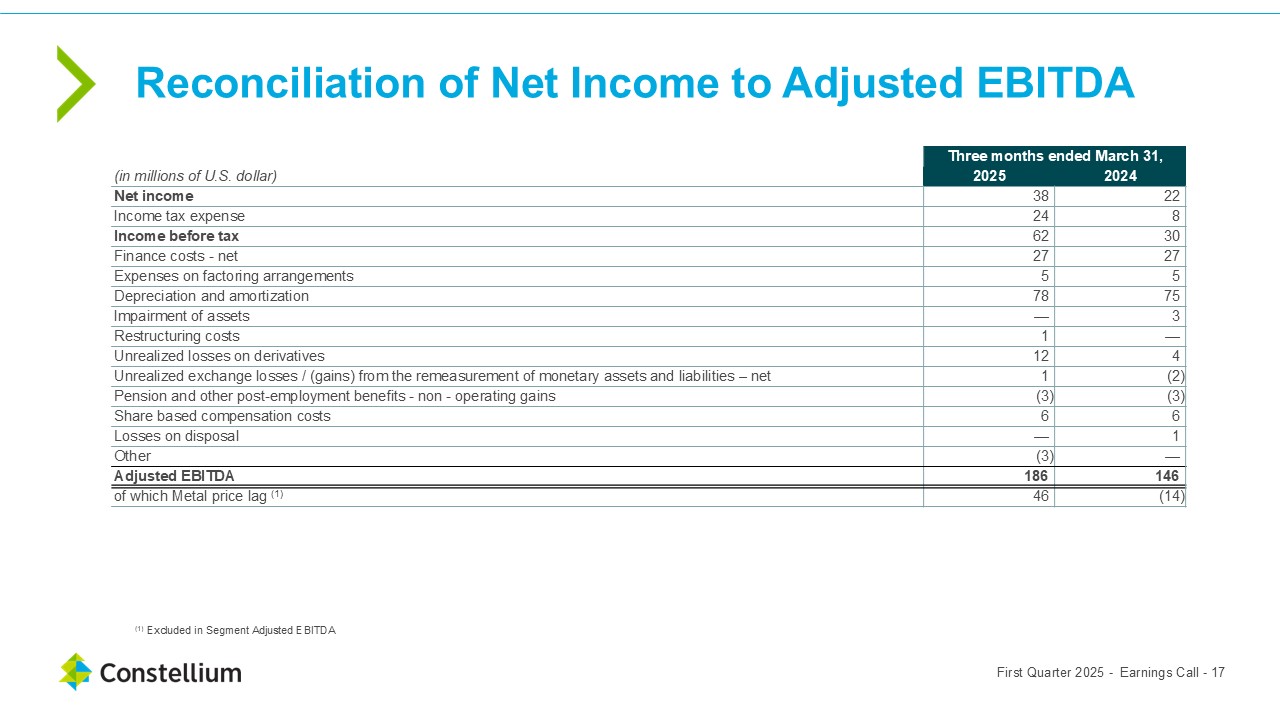
NON-GAAP MEASURES
Reconciliation of net income to Adjusted EBITDA (a non-GAAP measure)
|
Three months ended March 31,
|
||||||||
|
(in millions of U.S. dollar)
|
2025
|
2024
|
||||||
|
Net income
|
38
|
22
|
||||||
|
Income tax expense
|
24
|
8
|
||||||
|
Income before tax
|
62
|
30
|
||||||
|
Finance costs - net
|
27
|
27
|
||||||
|
Expenses on factoring arrangements
|
5
|
5
|
||||||
|
Depreciation and amortization
|
78
|
75
|
||||||
|
Impairment of assets (B)
|
—
|
3
|
||||||
|
Restructuring costs
|
1
|
—
|
||||||
|
Unrealized losses on derivatives
|
12
|
4
|
||||||
|
Unrealized exchange losses / (gains) from the remeasurement of monetary assets and liabilities – net
|
1
|
(2
|
)
|
|||||
|
Pension and other post-employment benefits - non - operating gains
|
(3
|
)
|
(3
|
)
|
||||
|
Share based compensation costs
|
6
|
6
|
||||||
|
Losses on disposal
|
—
|
1
|
||||||
|
Other (C)
|
(3
|
)
|
—
|
|||||
|
Adjusted EBITDA1
|
186
|
146
|
||||||
|
of which Metal price lag (A)
|
46
|
(14
|
)
|
|||||
1Adjusted EBITDA includes the non-cash impact of metal price lag
| (A) |
Metal price lag represents the financial impact of the timing difference between when aluminum prices included within Constellium's Revenue are established and when aluminum purchase prices
included in Cost of sales are established. The metal price lag will generally increase our earnings in times of rising primary aluminum prices and decrease our earnings in times of declining primary aluminum prices. The calculation of metal
price lag adjustment is based on a standardized methodology applied at each of Constellium’s manufacturing sites. Metal price lag is calculated as the average value of product purchased in the period, approximated at the market price, less
the value of product in inventory at the weighted average of metal purchased over time, multiplied by the quantity sold in the period.
|
| (B) |
For the three months ended March 31, 2024, impairment related to property, plant and equipment in our Valais operations.
|
| (C) |
For the three months ended March 31, 2025, other included $7 million of
insurance proceeds and $3 million of clean-up costs related to the flooding of our facilities in Valais (Switzerland).
|
|
17 |
Reconciliation of net cash flows from operating activities to Free Cash Flow (a non-GAAP measure)
|
Three months ended March 31,
|
||||||||
|
(in millions of U.S. dollar)
|
2025
|
2024
|
||||||
|
Net cash flows from operating activities
|
58
|
37
|
||||||
|
Purchases of property, plant and equipment
|
(69
|
)
|
(74
|
)
|
||||
|
Property, plant and equipment inflows
|
8
|
7
|
||||||
|
Free Cash Flow
|
(3
|
)
|
(30
|
)
|
||||
Reconciliation of borrowings to Net debt (a non-GAAP measure)
|
(in millions of U.S. dollar)
|
At March 31, 2025
|
At December 31, 2024
|
||||||
|
Debt
|
1,943
|
1,918
|
||||||
|
Fair value of cross currency basis swaps,
net of margin calls
|
1
|
(1
|
)
|
|||||
|
Cash and cash equivalents
|
(118
|
)
|
(141
|
)
|
||||
|
Net debt
|
1,826
|
1,776
|
||||||
|
18 |