Exhibit 99.1

|
April 28, 2022 |
FOR IMMEDIATE RELEASE |
CTS Announces First Quarter 2022 Results
Delivered solid growth, further advancing diversification strategy
Lisle, Ill. - CTS Corporation (NYSE: CTS), a leading global designer and manufacturer of custom engineered solutions that “sense, connect and move” today announced first quarter 2022 results.
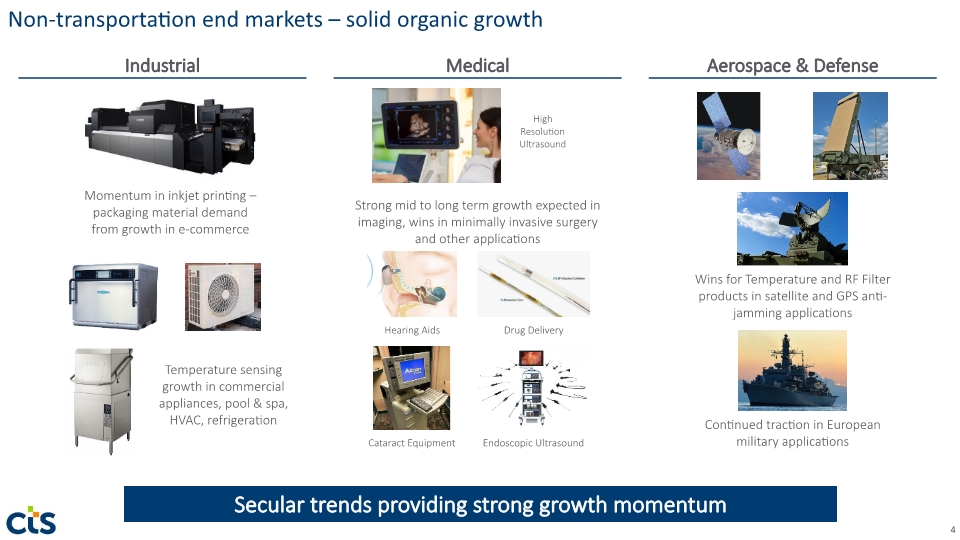
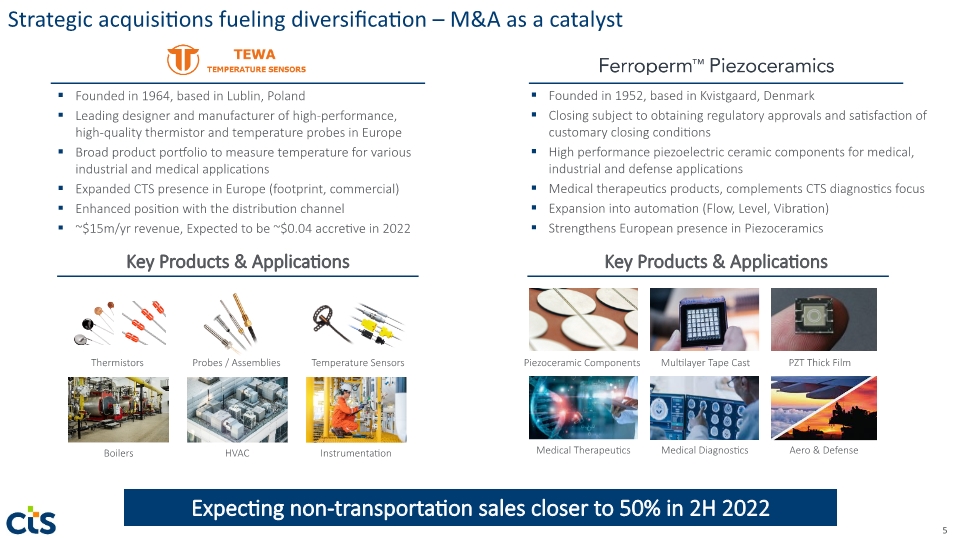
“Our solid first quarter results highlight the progress of our diversification strategy and our ability to deliver enhanced profitability, with revenue growing 15% and Adjusted EBITDA margin expanding 350-basis points. Our acquisition of TEWA Sensors in the first quarter and our recently announced agreement to acquire Ferroperm demonstrate our efforts to expand growth of non-transportation end markets and will move this portion of the business closer to 50% of total revenues in the year ahead,” said Kieran O’Sullivan, CEO of CTS Corporation. "Demand remains robust across all end markets. Our strong balance sheet and solid cash flow generation continue to be key competitive advantages as we further execute on our strategic priorities and drive value for our shareholders.”
First Quarter 2022 Results
|
• |
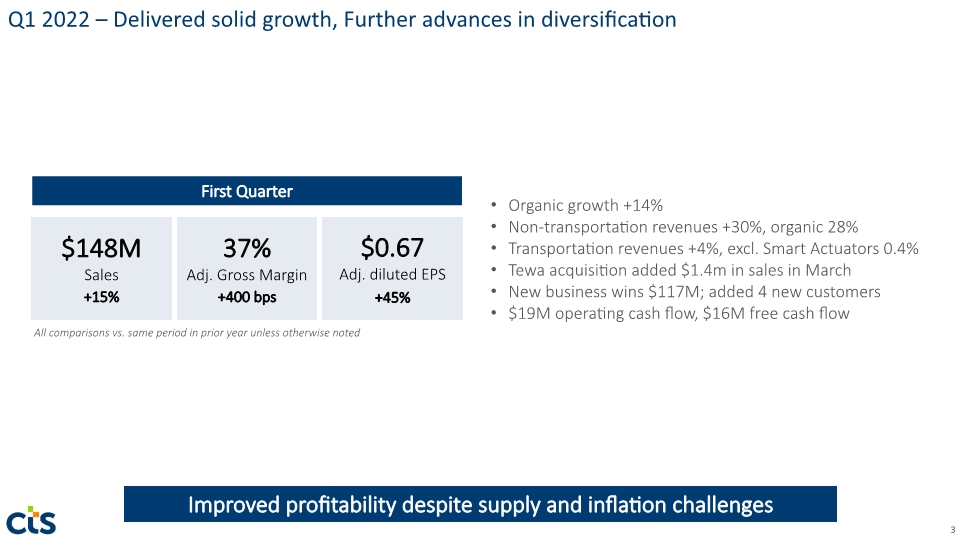
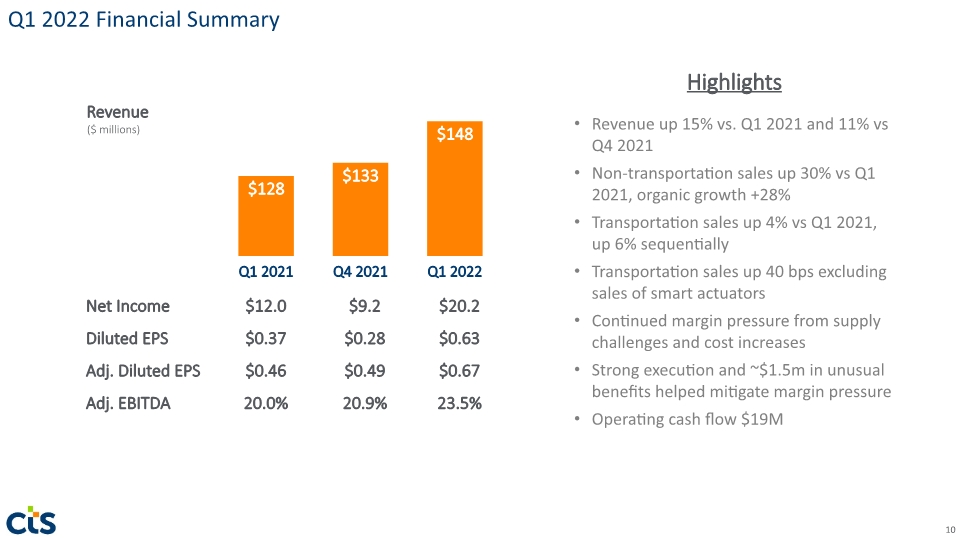
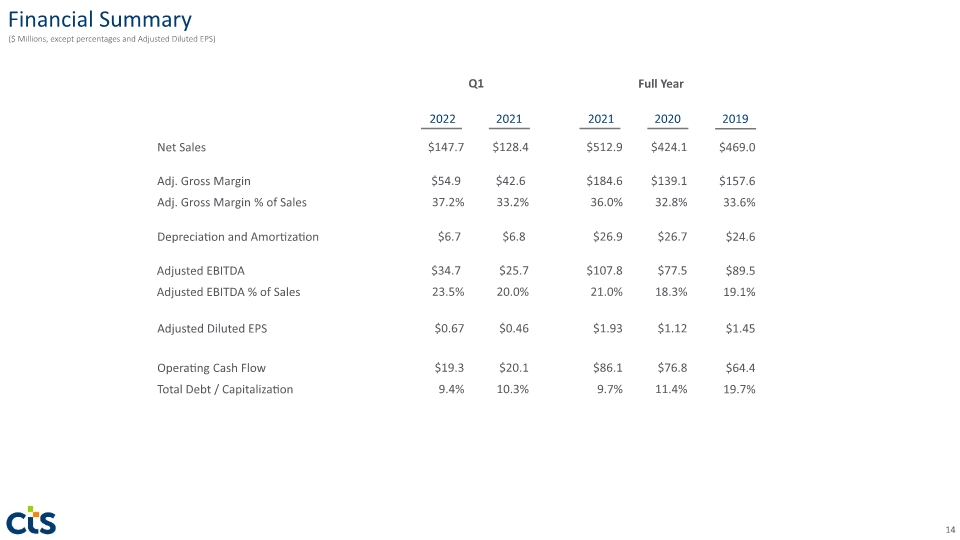
Sales were $147.7 million, up 15% year-over-year. Sales to non-transportation end markets increased 30%, and sales to the transportation end market increased 4% over the same period. |
|
• |
Net income was $20.2 million, or $0.63 per diluted share, compared to $12.0 million, or $0.37 per diluted share, in the first quarter of 2021. |
|
• |
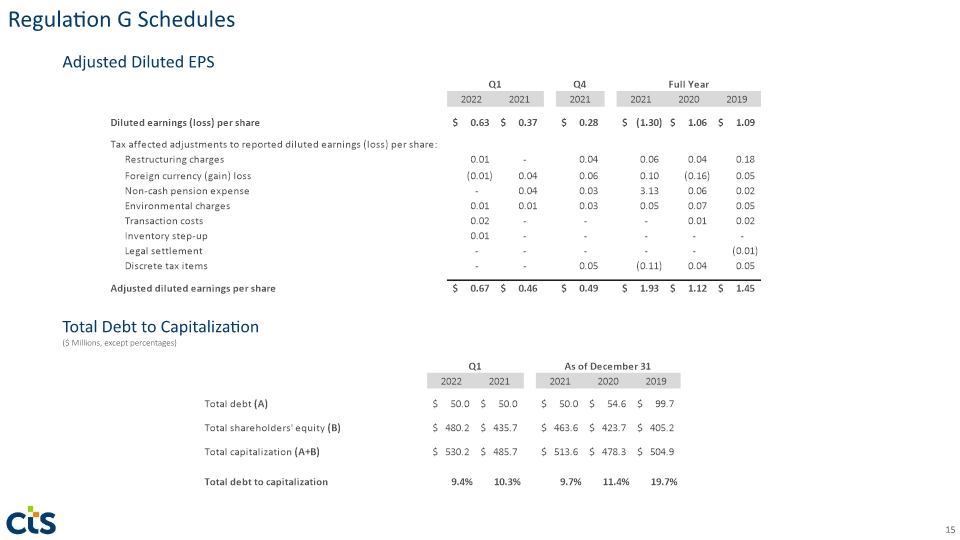
Adjusted diluted EPS was $0.67, up from $0.46 in the first quarter of 2021. |
|
• |
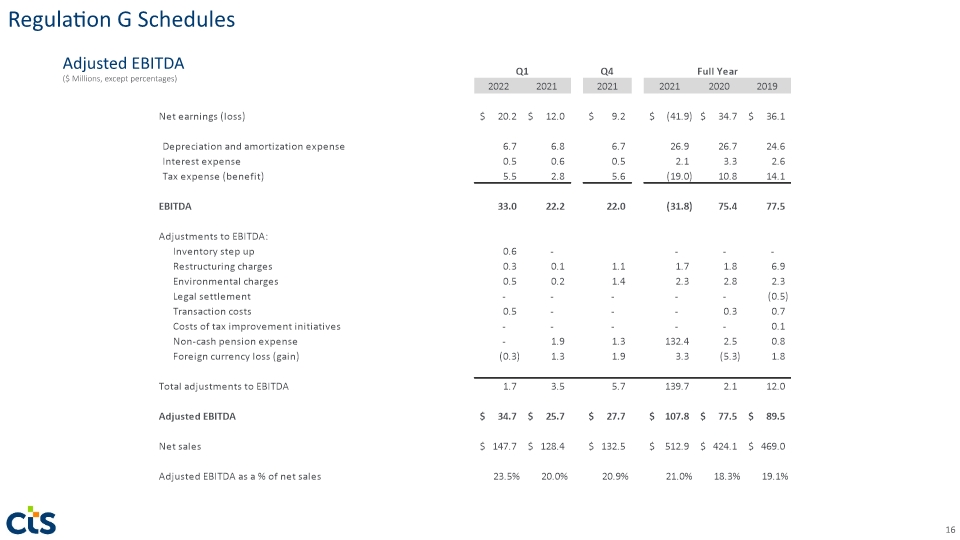
Adjusted EBITDA margin was 23.5% compared to 20.0% in the first quarter of 2021. |
2022 Guidance
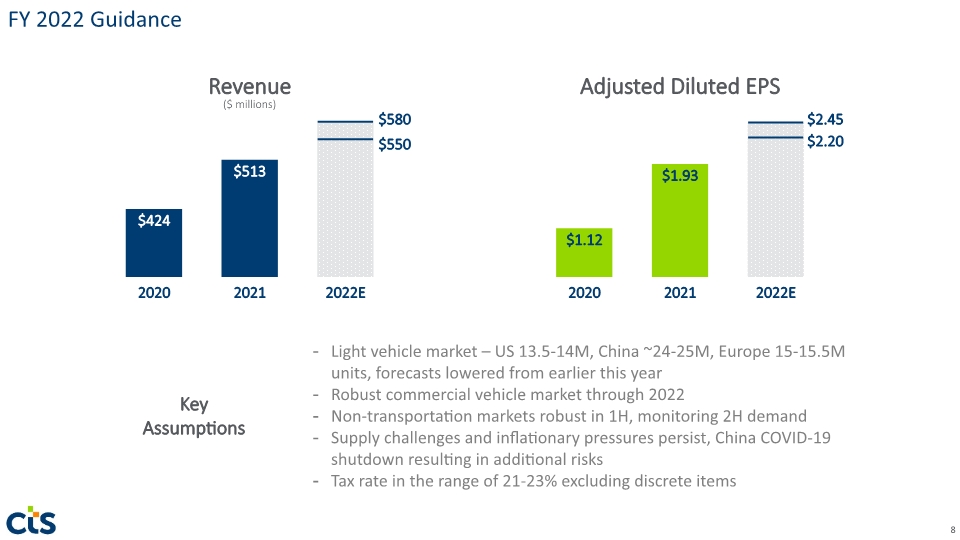
Including the impact of the recent TEWA Sensors acquisition, CTS now expects full year 2022 sales to be in the range of $550 – $580 million, up from the previous guidance of $525 – $550 million and adjusted diluted EPS in the range of $2.20 - $2.45, up from the previous guidance of $2.00 – $2.25. Management continues to carefully evaluate the impact of inflation, supply chain issues, COVID 19-related disruptions in China, and geopolitical risks.
Conference Call and Supplemental Materials
As previously announced, the Company has scheduled a conference call at 10:00 a.m. (EDT) today to discuss the first quarter 2022 financial results. The dial-in number for the U.S. and Canada is 844-200-6205 (+1 929-526-1599, if calling from outside the U.S. or Canada). The passcode is 549088. In addition, the Company will be using a supplemental slide presentation that will be referred to during the call. The presentation and a live audio webcast of the conference call will be available and can be accessed directly from CTS’ website at https://www.ctscorp.com/investors/events-presentations/.
www.ctscorp.com
Exhibit 99.1
About CTS
CTS (NYSE: CTS) is a leading designer and manufacturer of products that Sense, Connect, and Move. The company manufactures sensors, actuators, and electronic components in North America, Europe, and Asia, and provides engineered products to customers in the aerospace/defense, industrial, medical, and transportation markets. For more information, visit www.ctscorp.com.
Safe Harbor
This document contains statements that are, or may be deemed to be, forward-looking statements within the meaning of the Private Securities Litigation Reform Act of 1995. These forward-looking statements include, but are not limited to, any financial or other guidance, statements that reflect our current expectations concerning future results and events, and any other statements that are not based solely on historical fact. Forward-looking statements are based on management’s expectations, certain assumptions and currently available information. Readers are cautioned not to place undue reliance on these forward-looking statements, which speak only as of the date hereof and are based on various assumptions as to future events, the occurrence of which necessarily are subject to uncertainties. These forward-looking statements are made subject to certain risks, uncertainties and other factors, which could cause CTS’ actual results, performance or achievements to differ materially from those presented in the forward-looking statements. Examples of factors that may affect future operating results and financial condition include, but are not limited to: the ultimate impact of the COVID-19 pandemic on CTS’ business, results of operations or financial condition; changes in the economy generally and in respect to the business in which CTS operates; unanticipated issues in integrating acquisitions including TEWA Temperature Sensors and Ferroperm Piezoceramics (once closed subject to obtaining regulatory approvals and satisfaction of customary closing conditions); the results of actions to reposition CTS’ business; rapid technological change; general market conditions in the transportation, as well as conditions in the industrial, aerospace and defense, and medical markets; reliance on key customers; unanticipated public health crises, natural disasters or other events; environmental compliance and remediation expenses; the ability to protect CTS’ intellectual property; pricing pressures and demand for CTS’ products; and risks associated with CTS’ international operations, including trade and tariff barriers, exchange rates and political and geopolitical risks (including, without limitation, the potential impact the conflict between Russia and Ukraine may have on our business, results of operations and financial condition). Many of these, and other risks and uncertainties, are discussed in further detail in Item 1A. of CTS’ Annual Report on Form 10-K and other filings made with the SEC. CTS undertakes no obligation to publicly update CTS’ forward-looking statements to reflect new information or events or circumstances that arise after the date hereof, including market or industry changes.
Non-GAAP Financial Measures
From time to time, CTS may use non-GAAP financial measures in discussing CTS’ business. These measures are intended to supplement, not replace, CTS’ presentation of its financial results in accordance with U.S. GAAP. CTS’ management believes that non-GAAP financial measures can be useful to investors in analyzing CTS’ financial performance and results of operations over time. CTS recommends that investors consider both actual and adjusted measures in evaluating the performance of CTS with peer companies.
The information included in this press release includes the non-GAAP financial measures of adjusted gross margin, adjusted operating earnings, adjusted EBITDA, adjusted net earnings, adjusted diluted earnings per share, debt to capitalization ratio, controllable working capital ratio, and free cash flow. Many of these non-GAAP financial measures exclude the effect of certain expenses and income not related directly to the underlying performance of CTS’ fundamental business operations.
CTS believes that adjusted gross margins, adjusted operating earnings, adjusted EBITDA, adjusted net earnings and, adjusted diluted earnings per share provide useful information to investors regarding its operational performance because they enhance an investor’s overall understanding of CTS’ core financial performance and facilitate comparisons to historical results of operations, by excluding items that are not related directly to the underlying performance of CTS’ fundamental business operations or were not part of CTS’ business operations during a comparable period.
www.ctscorp.com
Exhibit 99.1
CTS believes that debt to capitalization ratio is a measurement of financial leverage and provides an insight into the financial structure of CTS and its financial strength. CTS believes the controllable working capital ratio provides an objective measure of the efficiency with which CTS manages its short-term capital needs. CTS believes that free cash flow is a useful measure of its ability to generate cash.
CTS believes that these non-GAAP financial measures are commonly used by financial analysts and others in the industries in which CTS operates, and thus further provide useful information to investors. Note that CTS’ definitions of these non-GAAP financial measures may differ from those terms as defined or used by other companies.
CTS does not provide reconciliations of forward-looking non-GAAP financial measures, such as estimated adjusted diluted earnings per share, to the most comparable GAAP financial measures on a forward-looking basis because CTS is unable to provide a meaningful or accurate calculation or estimation of reconciling items and the information is not available without unreasonable effort. This is due to the inherent difficulty of forecasting the timing and amount of certain items, such as, but not limited to, restructuring costs, environmental remediation costs, acquisition related costs, foreign exchange rates and other non-routine costs. Each of such adjustments has not yet occurred, are out of CTS' control and/or cannot be reasonably predicted. For the same reasons, CTS is unable to address the probable significance of the unavailable information.
Contact
Ashish Agrawal
Vice President and Chief Financial Officer
CTS Corporation
4925 Indiana Avenue
Lisle, IL 60532 USA
+1 (630) 577-8800
www.ctscorp.com
Exhibit 99.1
CTS CORPORATION AND SUBSIDIARIES
CONDENSED CONSOLIDATED STATEMENTS OF EARNINGS - UNAUDITED
(In thousands of dollars, except per share amounts)
|
|
|
Three Months Ended |
|
|||||
|
|
|
March 31, 2022 |
|
|
March 31, 2021 |
|
||
|
Net sales |
|
$ |
147,695 |
|
|
$ |
128,427 |
|
|
Cost of goods sold |
|
|
93,355 |
|
|
|
85,836 |
|
|
Gross margin |
|
|
54,340 |
|
|
|
42,591 |
|
|
Selling, general and administrative expenses |
|
|
21,788 |
|
|
|
18,325 |
|
|
Research and development expenses |
|
|
6,194 |
|
|
|
5,687 |
|
|
Restructuring charges |
|
|
312 |
|
|
|
81 |
|
|
Operating earnings |
|
|
26,046 |
|
|
|
18,498 |
|
|
Other (expense) income: |
|
|
|
|
|
|
|
|
|
Interest expense |
|
|
(546 |
) |
|
|
(555 |
) |
|
Interest income |
|
|
180 |
|
|
|
202 |
|
|
Other income (expense), net |
|
|
66 |
|
|
|
(3,356 |
) |
|
Total other expense, net |
|
|
(300 |
) |
|
|
(3,709 |
) |
|
Earnings before income taxes |
|
|
25,746 |
|
|
|
14,789 |
|
|
Income tax expense |
|
|
5,507 |
|
|
|
2,799 |
|
|
Net earnings |
|
|
20,239 |
|
|
|
11,990 |
|
|
Earnings per share: |
|
|
|
|
|
|
|
|
|
Basic |
|
$ |
0.63 |
|
|
$ |
0.37 |
|
|
Diluted |
|
$ |
0.63 |
|
|
$ |
0.37 |
|
|
Basic weighted – average common shares outstanding: |
|
|
32,123 |
|
|
|
32,319 |
|
|
Effect of dilutive securities |
|
|
204 |
|
|
|
301 |
|
|
Diluted weighted – average common shares outstanding: |
|
|
32,327 |
|
|
|
32,620 |
|
|
Cash dividends declared per share |
|
$ |
0.04 |
|
|
$ |
0.04 |
|
www.ctscorp.com
Exhibit 99.1
CTS CORPORATION AND SUBSIDIARIES
CONDENSED CONSOLIDATED BALANCE SHEETS
(In thousands of dollars)
|
|
|
(Unaudited) |
|
|
|
|
|
|
|
|
|
March 31, 2022 |
|
|
December 31, 2021 |
|
||
|
ASSETS |
|
|
|
|
|
|
|
|
|
Current Assets |
|
|
|
|
|
|
|
|
|
Cash and cash equivalents |
|
$ |
126,118 |
|
|
$ |
141,465 |
|
|
Accounts receivable, net |
|
|
95,107 |
|
|
|
82,191 |
|
|
Inventories, net |
|
|
52,454 |
|
|
|
49,506 |
|
|
Other current assets |
|
|
18,366 |
|
|
|
15,927 |
|
|
Total current assets |
|
|
292,045 |
|
|
|
289,089 |
|
|
Property, plant and equipment, net |
|
|
97,041 |
|
|
|
96,876 |
|
|
Operating lease assets, net |
|
|
23,212 |
|
|
|
21,594 |
|
|
Other Assets |
|
|
|
|
|
|
|
|
|
Prepaid pension asset |
|
|
31,882 |
|
|
|
49,382 |
|
|
Goodwill |
|
|
117,524 |
|
|
|
109,798 |
|
|
Other intangible assets, net |
|
|
79,849 |
|
|
|
69,888 |
|
|
Deferred income taxes |
|
|
23,828 |
|
|
|
25,415 |
|
|
Other |
|
|
19,365 |
|
|
|
2,420 |
|
|
Total other assets |
|
|
272,448 |
|
|
|
256,903 |
|
|
Total Assets |
|
$ |
684,746 |
|
|
$ |
664,462 |
|
|
LIABILITIES AND SHAREHOLDERS’ EQUITY |
|
|
|
|
|
|
|
|
|
Current Liabilities |
|
|
|
|
|
|
|
|
|
Accounts payable |
|
$ |
60,010 |
|
|
$ |
55,537 |
|
|
Operating lease obligations |
|
|
3,522 |
|
|
|
3,393 |
|
|
Accrued payroll and benefits |
|
|
12,954 |
|
|
|
18,418 |
|
|
Accrued expenses and other liabilities |
|
|
38,554 |
|
|
|
36,718 |
|
|
Total current liabilities |
|
|
115,040 |
|
|
|
114,066 |
|
|
Long-term debt |
|
|
50,000 |
|
|
|
50,000 |
|
|
Long-term operating lease obligations |
|
|
22,712 |
|
|
|
21,354 |
|
|
Long-term pension obligations |
|
|
6,464 |
|
|
|
6,886 |
|
|
Deferred income taxes |
|
|
5,865 |
|
|
|
5,894 |
|
|
Other long-term obligations |
|
|
4,487 |
|
|
|
2,684 |
|
|
Total Liabilities |
|
|
204,568 |
|
|
|
200,884 |
|
|
Commitments and Contingencies |
|
|
|
|
|
|
|
|
|
Shareholders’ Equity |
|
|
|
|
|
|
|
|
|
Common stock |
|
|
316,496 |
|
|
|
314,620 |
|
|
Additional contributed capital |
|
|
41,158 |
|
|
|
42,549 |
|
|
Retained earnings |
|
|
511,197 |
|
|
|
492,242 |
|
|
Accumulated other comprehensive loss |
|
|
(3,445 |
) |
|
|
(4,525 |
) |
|
Total shareholders’ equity before treasury stock |
|
|
865,406 |
|
|
|
844,886 |
|
|
Treasury stock |
|
|
(385,228 |
) |
|
|
(381,308 |
) |
|
Total shareholders’ equity |
|
|
480,178 |
|
|
|
463,578 |
|
|
Total Liabilities and Shareholders’ Equity |
|
$ |
684,746 |
|
|
$ |
664,462 |
|
www.ctscorp.com
Exhibit 99.1
CTS CORPORATION AND SUBSIDIARIES
OTHER SUPPLEMENTAL INFORMATION - UNAUDITED
(In millions of dollars, except per share amounts)
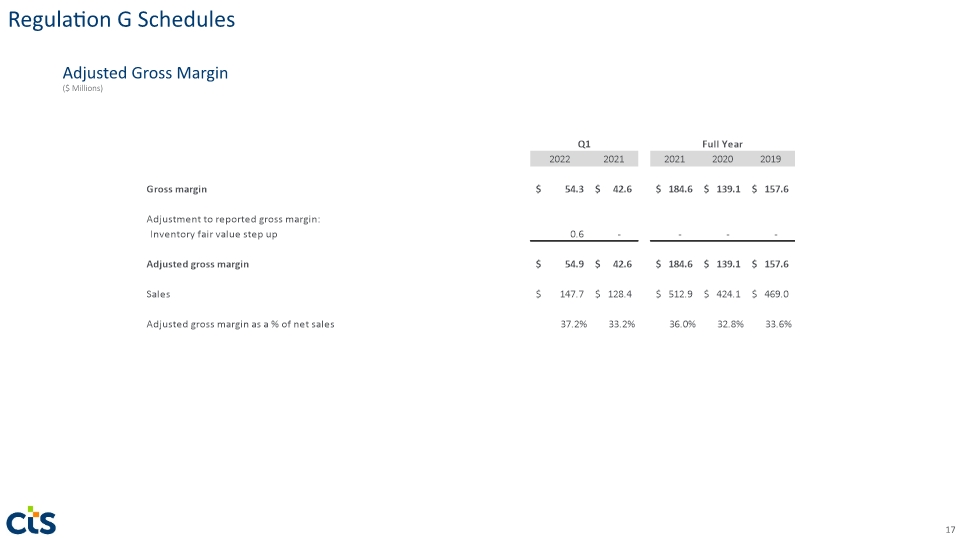
Adjusted Gross Margin
|
|
|
Three Months Ended March 31, |
|
|
Twelve Months Ended December 31, |
|
||||||||||||||
|
|
|
2022 |
|
|
2021 |
|
|
2021 |
|
|
2020 |
|
|
2019 |
|
|||||
|
Gross margin |
|
$ |
54.3 |
|
|
$ |
42.6 |
|
|
$ |
184.6 |
|
|
$ |
139.1 |
|
|
$ |
157.6 |
|
|
Adjustments to reported gross margin: |
|
|
|
|
|
|
|
|
|
|
|
|
|
|
|
|
|
|
|
|
|
Inventory fair value step-up |
|
$ |
0.6 |
|
|
$ |
— |
|
|
$ |
— |
|
|
$ |
— |
|
|
$ |
— |
|
|
|
|
|
|
|
|
|
|
|
|
|
|
|
|
|
|
|
|
|
|
|
|
Adjusted gross margin |
|
$ |
54.9 |
|
|
$ |
42.6 |
|
|
$ |
184.6 |
|
|
$ |
139.1 |
|
|
$ |
157.6 |
|
|
|
|
|
|
|
|
|
|
|
|
|
|
|
|
|
|
|
|
|
|
|
|
Net sales |
|
$ |
147.7 |
|
|
$ |
128.4 |
|
|
$ |
512.9 |
|
|
$ |
424.1 |
|
|
$ |
469.0 |
|
|
|
|
|
|
|
|
|
|
|
|
|
|
|
|
|
|
|
|
|
|
|
|
Adjusted gross margin as a % of net sales |
|
|
37.2 |
% |
|
|
33.2 |
% |
|
|
36.0 |
% |
|
|
32.8 |
% |
|
|
33.6 |
% |
Adjusted Operating Earnings
|
|
|
Three Months Ended March 31, |
|
|
Twelve Months Ended December 31, |
|
||||||||||||||
|
|
|
2022 |
|
|
2021 |
|
|
2021 |
|
|
2020 |
|
|
2019 |
|
|||||
|
Operating earnings |
|
$ |
26.0 |
|
|
$ |
18.5 |
|
|
$ |
76.5 |
|
|
$ |
45.1 |
|
|
$ |
53.8 |
|
|
Adjustments to reported operating earnings: |
|
|
|
|
|
|
|
|
|
|
|
|
|
|
|
|
|
|
|
|
|
Restructuring charges |
|
|
0.3 |
|
|
|
0.1 |
|
|
|
1.7 |
|
|
|
1.8 |
|
|
|
7.4 |
|
|
Environmental charges |
|
|
0.5 |
|
|
|
0.2 |
|
|
|
2.3 |
|
|
|
2.8 |
|
|
|
2.3 |
|
|
Legal settlement |
|
|
— |
|
|
|
— |
|
|
|
— |
|
|
|
— |
|
|
|
(0.5 |
) |
|
Transaction costs |
|
|
0.5 |
|
|
|
— |
|
|
|
— |
|
|
|
0.3 |
|
|
|
0.7 |
|
|
Inventory fair value step-up |
|
|
0.6 |
|
|
|
— |
|
|
|
— |
|
|
|
— |
|
|
|
— |
|
|
Costs of tax improvement initiatives |
|
|
— |
|
|
|
— |
|
|
|
— |
|
|
|
— |
|
|
|
0.1 |
|
|
Total adjustments to reported operating earnings |
|
$ |
1.9 |
|
|
$ |
0.3 |
|
|
$ |
3.9 |
|
|
$ |
4.9 |
|
|
$ |
10.0 |
|
|
|
|
|
|
|
|
|
|
|
|
|
|
|
|
|
|
|
|
|
|
|
|
Adjusted operating earnings |
|
$ |
28.0 |
|
|
$ |
18.8 |
|
|
$ |
80.4 |
|
|
$ |
50.0 |
|
|
$ |
63.8 |
|
|
|
|
|
|
|
|
|
|
|
|
|
|
|
|
|
|
|
|
|
|
|
|
Net sales |
|
$ |
147.7 |
|
|
$ |
128.4 |
|
|
$ |
512.9 |
|
|
$ |
424.1 |
|
|
$ |
469.0 |
|
|
|
|
|
|
|
|
|
|
|
|
|
|
|
|
|
|
|
|
|
|
|
|
Adjusted operating earnings as a % of net sales |
|
|
19.0 |
% |
|
|
14.6 |
% |
|
|
15.7 |
% |
|
|
11.8 |
% |
|
|
13.6 |
% |
www.ctscorp.com
Exhibit 99.1
Adjusted EBITDA
|
|
|
Three Months Ended March 31, |
|
|
Twelve Months Ended December 31, |
|
||||||||||||||
|
|
|
2022 |
|
|
2021 |
|
|
2021 |
|
|
2020 |
|
|
2019 |
|
|||||
|
Net earnings (loss) |
|
$ |
20.2 |
|
|
$ |
12.0 |
|
|
$ |
(41.9 |
) |
|
$ |
34.7 |
|
|
$ |
36.1 |
|
|
|
|
|
|
|
|
|
|
|
|
|
|
|
|
|
|
|
|
|
|
|
|
Depreciation and amortization expense |
|
|
6.7 |
|
|
|
6.8 |
|
|
|
26.9 |
|
|
|
26.7 |
|
|
|
24.6 |
|
|
Interest expense |
|
|
0.5 |
|
|
|
0.6 |
|
|
|
2.1 |
|
|
|
3.3 |
|
|
|
2.6 |
|
|
Tax expense (benefit) |
|
|
5.5 |
|
|
|
2.8 |
|
|
|
(19.0 |
) |
|
|
10.8 |
|
|
|
14.1 |
|
|
|
|
|
|
|
|
|
|
|
|
|
|
|
|
|
|
|
|
|
|
|
|
EBITDA |
|
|
33.0 |
|
|
|
22.2 |
|
|
|
(31.8 |
) |
|
|
75.4 |
|
|
|
77.5 |
|
|
|
|
|
|
|
|
|
|
|
|
|
|
|
|
|
|
|
|
|
|
|
|
Adjustments to EBITDA: |
|
|
|
|
|
|
|
|
|
|
|
|
|
|
|
|
|
|
|
|
|
Restructuring charges |
|
|
0.3 |
|
|
|
0.1 |
|
|
|
1.7 |
|
|
|
1.8 |
|
|
|
6.9 |
|
|
Environmental charges |
|
|
0.5 |
|
|
|
0.2 |
|
|
|
2.3 |
|
|
|
2.8 |
|
|
|
2.3 |
|
|
Legal settlement |
|
|
— |
|
|
|
— |
|
|
|
— |
|
|
|
— |
|
|
|
(0.5 |
) |
|
Transaction costs |
|
|
0.5 |
|
|
|
— |
|
|
|
— |
|
|
|
0.3 |
|
|
|
0.7 |
|
|
Inventory fair value step-up |
|
|
0.6 |
|
|
|
— |
|
|
|
— |
|
|
|
— |
|
|
|
— |
|
|
Costs of tax improvement initiatives |
|
|
— |
|
|
|
— |
|
|
|
— |
|
|
|
— |
|
|
|
0.1 |
|
|
Non-cash pension expense |
|
|
— |
|
|
|
1.9 |
|
|
|
132.4 |
|
|
|
2.5 |
|
|
|
0.8 |
|
|
Foreign currency (gain) loss |
|
|
(0.3 |
) |
|
|
1.3 |
|
|
|
3.3 |
|
|
|
(5.3 |
) |
|
|
1.8 |
|
|
|
|
|
|
|
|
|
|
|
|
|
|
|
|
|
|
|
|
|
|
|
|
Total adjustments to EBITDA |
|
|
1.7 |
|
|
|
3.5 |
|
|
|
139.7 |
|
|
|
2.1 |
|
|
|
12.0 |
|
|
|
|
|
|
|
|
|
|
|
|
|
|
|
|
|
|
|
|
|
|
|
|
Adjusted EBITDA |
|
$ |
34.7 |
|
|
$ |
25.7 |
|
|
$ |
107.8 |
|
|
$ |
77.5 |
|
|
$ |
89.5 |
|
|
|
|
|
|
|
|
|
|
|
|
|
|
|
|
|
|
|
|
|
|
|
|
Net sales |
|
$ |
147.7 |
|
|
$ |
128.4 |
|
|
$ |
512.9 |
|
|
$ |
424.1 |
|
|
$ |
469.0 |
|
|
|
|
|
|
|
|
|
|
|
|
|
|
|
|
|
|
|
|
|
|
|
|
Adjusted EBITDA as a % of net sales |
|
|
23.5 |
% |
|
|
20.0 |
% |
|
|
21.0 |
% |
|
|
18.3 |
% |
|
|
19.1 |
% |
www.ctscorp.com
Exhibit 99.1
Adjusted Net Earnings
|
|
|
Three Months Ended March 31, |
|
|
Twelve Months Ended December 31, |
|
||||||||||||||
|
|
|
2022 |
|
|
2021 |
|
|
2021 |
|
|
2020 |
|
|
2019 |
|
|||||
|
Net earnings (loss) (A) |
|
$ |
20.2 |
|
|
$ |
12.0 |
|
|
$ |
(41.9 |
) |
|
$ |
34.7 |
|
|
$ |
36.1 |
|
|
Adjustments to reported net earnings (loss): |
|
|
|
|
|
|
|
|
|
|
|
|
|
|
|
|
|
|
|
|
|
Restructuring charges |
|
|
0.3 |
|
|
|
0.1 |
|
|
|
1.7 |
|
|
|
1.8 |
|
|
|
7.4 |
|
|
Environmental charges |
|
|
0.5 |
|
|
|
0.2 |
|
|
|
2.3 |
|
|
|
2.8 |
|
|
|
2.3 |
|
|
Legal settlement |
|
|
— |
|
|
|
— |
|
|
|
— |
|
|
|
— |
|
|
|
(0.5 |
) |
|
Transaction costs |
|
|
0.5 |
|
|
|
— |
|
|
|
— |
|
|
|
0.3 |
|
|
|
0.7 |
|
|
Inventory fair value step-up |
|
|
0.6 |
|
|
|
— |
|
|
|
— |
|
|
|
— |
|
|
|
— |
|
|
Costs of tax improvement initiatives |
|
|
— |
|
|
|
— |
|
|
|
— |
|
|
|
— |
|
|
|
0.1 |
|
|
Non-cash pension expense |
|
|
— |
|
|
|
1.9 |
|
|
|
132.4 |
|
|
|
2.5 |
|
|
|
0.8 |
|
|
Foreign currency (gain) loss |
|
|
(0.3 |
) |
|
|
1.3 |
|
|
|
3.3 |
|
|
|
(5.3 |
) |
|
|
1.8 |
|
|
Total adjustments to reported net earnings (loss) |
|
$ |
1.7 |
|
|
$ |
3.5 |
|
|
$ |
139.7 |
|
|
$ |
2.1 |
|
|
$ |
12.6 |
|
|
Total adjustments, tax affected (B) |
|
$ |
1.4 |
|
|
$ |
3.0 |
|
|
$ |
108.6 |
|
|
$ |
0.4 |
|
|
$ |
10.2 |
|
|
|
|
|
|
|
|
|
|
|
|
|
|
|
|
|
|
|
|
|
|
|
|
Tax adjustments: |
|
|
|
|
|
|
|
|
|
|
|
|
|
|
|
|
|
|
|
|
|
Increase in valuation allowances |
|
|
— |
|
|
|
— |
|
|
|
0.9 |
|
|
|
0.2 |
|
|
|
— |
|
|
Other discrete tax items |
|
|
— |
|
|
|
— |
|
|
|
(4.7 |
) |
|
|
1.2 |
|
|
|
1.8 |
|
|
Total tax adjustments (C) |
|
$ |
— |
|
|
$ |
— |
|
|
$ |
(3.8 |
) |
|
$ |
1.4 |
|
|
$ |
1.8 |
|
|
Adjusted net earnings (A+B+C) |
|
$ |
21.7 |
|
|
$ |
15.0 |
|
|
$ |
63.0 |
|
|
$ |
36.5 |
|
|
$ |
48.1 |
|
|
|
|
|
|
|
|
|
|
|
|
|
|
|
|
|
|
|
|
|
|
|
|
Net sales |
|
$ |
147.7 |
|
|
$ |
128.4 |
|
|
$ |
512.9 |
|
|
$ |
424.1 |
|
|
$ |
469.0 |
|
|
|
|
|
|
|
|
|
|
|
|
|
|
|
|
|
|
|
|
|
|
|
|
Adjusted net earnings as a % of net sales |
|
|
14.7 |
% |
|
|
11.7 |
% |
|
|
12.3 |
% |
|
|
8.6 |
% |
|
|
10.3 |
% |
Adjusted Diluted Earnings Per Share
|
|
|
Three Months Ended March 31, |
|
|
Twelve Months Ended December 31, |
|
||||||||||||||
|
|
|
2022 |
|
|
2021 |
|
|
2021 |
|
|
2020 |
|
|
2019 |
|
|||||
|
GAAP diluted earnings (loss) per share |
|
$ |
0.63 |
|
|
$ |
0.37 |
|
|
$ |
(1.30 |
) |
|
$ |
1.06 |
|
|
$ |
1.09 |
|
|
Tax affected charges to reported diluted earnings (loss) per share: |
|
|
|
|
|
|
|
|
|
|
|
|
|
|
|
|
|
|
|
|
|
Restructuring charges |
|
|
0.01 |
|
|
|
— |
|
|
|
0.06 |
|
|
|
0.04 |
|
|
|
0.18 |
|
|
Foreign currency (gain) loss |
|
|
(0.01 |
) |
|
|
0.04 |
|
|
|
0.10 |
|
|
|
(0.16 |
) |
|
|
0.05 |
|
|
Non-cash pension expense |
|
|
— |
|
|
|
0.04 |
|
|
|
3.13 |
|
|
|
0.06 |
|
|
|
0.02 |
|
|
Environmental charges |
|
|
0.01 |
|
|
|
0.01 |
|
|
|
0.05 |
|
|
|
0.07 |
|
|
|
0.05 |
|
|
Transaction costs |
|
|
0.02 |
|
|
|
— |
|
|
|
— |
|
|
|
0.01 |
|
|
|
0.02 |
|
|
Inventory fair value step-up |
|
|
0.01 |
|
|
|
— |
|
|
|
— |
|
|
|
— |
|
|
|
— |
|
|
Legal settlement |
|
|
— |
|
|
|
— |
|
|
|
— |
|
|
|
— |
|
|
|
(0.01 |
) |
|
Discrete tax items |
|
|
— |
|
|
|
— |
|
|
|
(0.11 |
) |
|
|
0.04 |
|
|
|
0.05 |
|
|
Adjusted diluted earnings per share |
|
$ |
0.67 |
|
|
$ |
0.46 |
|
|
$ |
1.93 |
|
|
$ |
1.12 |
|
|
$ |
1.45 |
|
www.ctscorp.com
Exhibit 99.1
Debt to Capitalization
|
|
Three Months Ended March 31, |
|
|
Twelve Months Ended December 31, |
|
||||||||||||||
|
|
2022 |
|
|
2021 |
|
|
2021 |
|
|
2020 |
|
|
2019 |
|
|||||
|
Total debt (A) |
$ |
50.0 |
|
|
$ |
50.0 |
|
|
$ |
50.0 |
|
|
$ |
54.6 |
|
|
$ |
99.7 |
|
|
Total shareholders' equity (B) |
$ |
480.2 |
|
|
$ |
435.7 |
|
|
$ |
463.6 |
|
|
$ |
423.7 |
|
|
$ |
405.2 |
|
|
Total capitalization (A+B) |
$ |
530.2 |
|
|
$ |
485.7 |
|
|
$ |
513.6 |
|
|
$ |
478.3 |
|
|
$ |
504.9 |
|
|
Total debt to capitalization |
|
9.4 |
% |
|
|
10.3 |
% |
|
|
9.7 |
% |
|
|
11.4 |
% |
|
|
19.7 |
% |
Controllable Working Capital
|
|
Three Months Ended March 31, |
|
|
Twelve Months Ended December 31, |
|
|||||||||||||
|
|
2022 |
|
2021 |
|
|
2021 |
|
|
2020 |
|
|
2019 |
|
|||||
|
Net accounts receivable |
$ |
95.1 |
|
$ |
81.6 |
|
|
$ |
82.2 |
|
|
$ |
81.0 |
|
|
$ |
78.0 |
|
|
|
|
|
|
|
|
|
|
|
|
|
|
|
|
|
|
|
|
|
|
Net inventory |
$ |
52.5 |
|
$ |
47.5 |
|
|
$ |
49.5 |
|
|
$ |
45.9 |
|
|
$ |
42.2 |
|
|
|
|
|
|
|
|
|
|
|
|
|
|
|
|
|
|
|
|
|
|
Accounts payable |
$ |
(60.0 |
) |
$ |
(53.3 |
) |
|
$ |
(55.5 |
) |
|
$ |
(50.5 |
) |
|
$ |
(48.2 |
) |
|
|
|
|
|
|
|
|
|
|
|
|
|
|
|
|
|
|
|
|
|
Controllable working capital |
$ |
87.6 |
|
$ |
75.8 |
|
|
$ |
76.2 |
|
|
$ |
76.4 |
|
|
$ |
72.0 |
|
|
|
|
|
|
|
|
|
|
|
|
|
|
|
|
|
|
|
|
|
|
Quarter sales |
$ |
147.7 |
|
$ |
128.4 |
|
|
$ |
132.5 |
|
|
$ |
123.0 |
|
|
$ |
115.0 |
|
|
Multiplied by 4 |
|
4 |
|
|
4 |
|
|
|
4 |
|
|
|
4 |
|
|
|
4 |
|
|
Annualized sales |
$ |
590.8 |
|
$ |
513.6 |
|
|
$ |
530.1 |
|
|
$ |
492.1 |
|
|
$ |
460.2 |
|
|
|
|
|
|
|
|
|
|
|
|
|
|
|
|
|
|
|
|
|
|
Controllable working capital as a % of annualized net sales |
|
14.8 |
% |
|
14.8 |
% |
|
|
14.4 |
% |
|
|
15.5 |
% |
|
|
15.7 |
% |
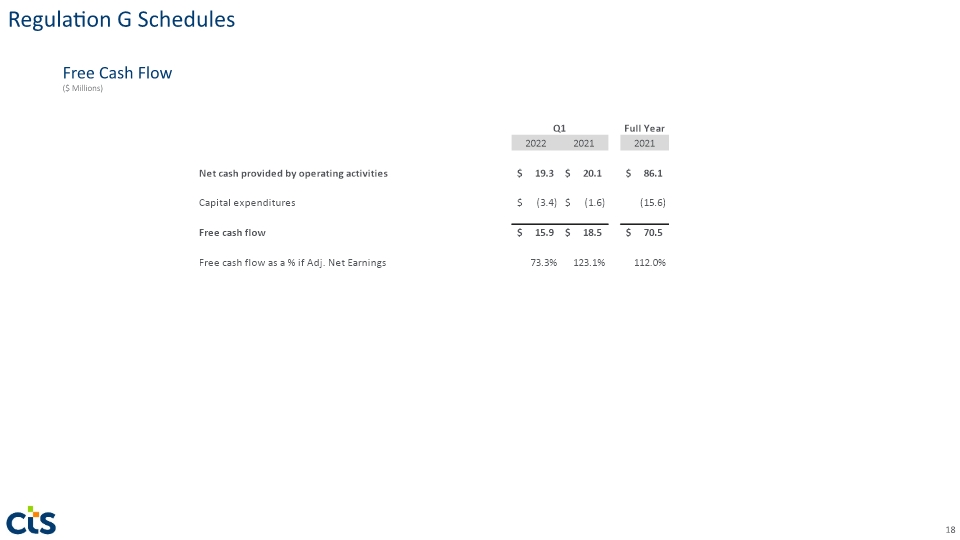
Free Cash Flow
|
|
|
Three Months Ended March 31, |
|
|
Twelve Months Ended December 31, |
|
||||||||||||||
|
|
|
2022 |
|
|
2021 |
|
|
2021 |
|
|
2020 |
|
|
2019 |
|
|||||
|
Net cash provided by operating activities |
|
$ |
19.3 |
|
|
$ |
20.1 |
|
|
$ |
86.1 |
|
|
$ |
76.8 |
|
|
$ |
64.4 |
|
|
Capital expenditures |
|
|
(3.4 |
) |
|
|
(1.6 |
) |
|
|
(15.6 |
) |
|
|
(14.9 |
) |
|
|
(21.7 |
) |
|
Free cash flow |
|
$ |
15.9 |
|
|
$ |
18.5 |
|
|
$ |
70.5 |
|
|
$ |
61.9 |
|
|
$ |
42.7 |
|
Capital Expenditures
|
|
|
Three Months Ended March 31, |
|
|
Twelve Months Ended December 31, |
|
||||||||||||||
|
|
|
2022 |
|
|
2021 |
|
|
2021 |
|
|
2020 |
|
|
2019 |
|
|||||
|
Capital expenditures |
|
$ |
3.4 |
|
|
$ |
1.6 |
|
|
$ |
15.6 |
|
|
$ |
14.9 |
|
|
$ |
21.7 |
|
|
Net sales |
|
$ |
147.7 |
|
|
$ |
128.4 |
|
|
$ |
512.9 |
|
|
$ |
424.1 |
|
|
$ |
469.0 |
|
|
Capex as % of net sales |
|
|
2.3 |
% |
|
|
1.3 |
% |
|
|
3.0 |
% |
|
|
3.5 |
% |
|
|
4.6 |
% |
www.ctscorp.com
Exhibit 99.1
Additional Information
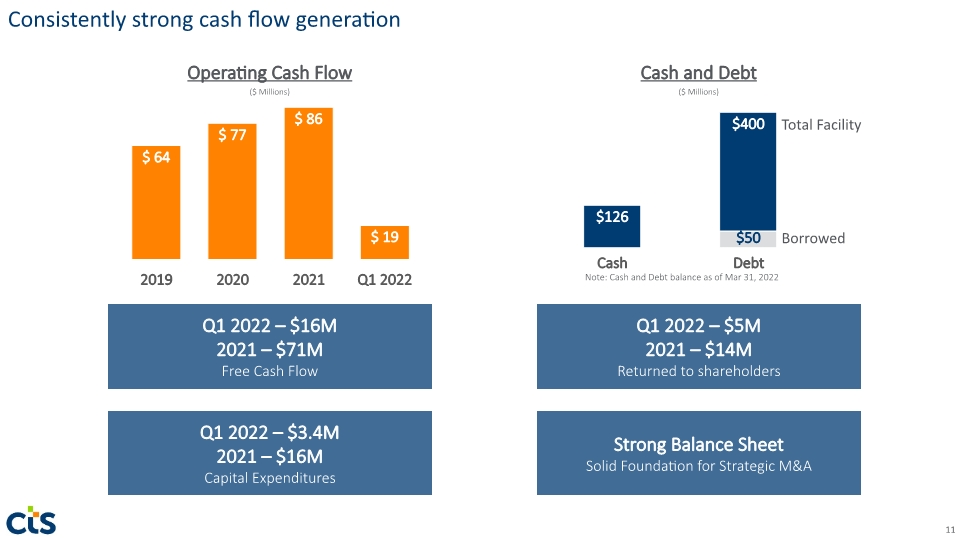
The following table includes other financial information not presented in the preceding financial statements.
|
|
|
Three Months Ended March 31, |
|
|
Twelve Months Ended December 31, |
|
||||||||||||||
|
|
|
2022 |
|
|
2021 |
|
|
2021 |
|
|
2020 |
|
|
2019 |
|
|||||
|
Depreciation and amortization expense |
|
$ |
6.7 |
|
|
$ |
6.8 |
|
|
$ |
26.9 |
|
|
$ |
26.7 |
|
|
$ |
24.6 |
|
|
Stock-based compensation expense |
|
$ |
2.0 |
|
|
$ |
1.2 |
|
|
$ |
6.1 |
|
|
$ |
3.4 |
|
|
$ |
5.0 |
|
www.ctscorp.com