Exhibit 99.1
COGNIZANT REPORTS SECOND QUARTER 2021 RESULTS
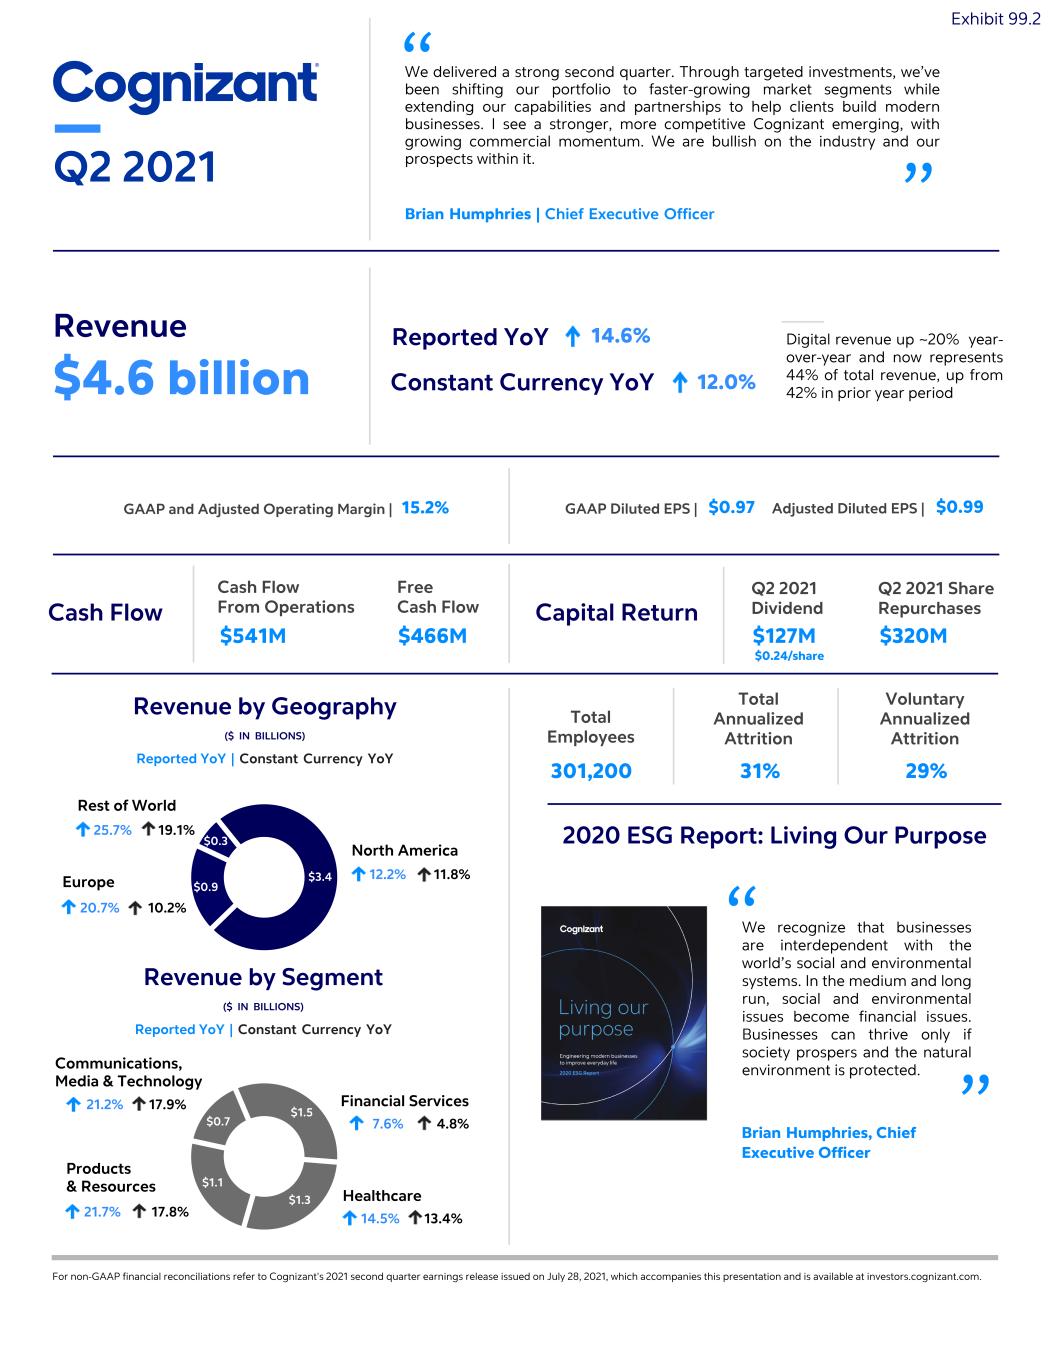
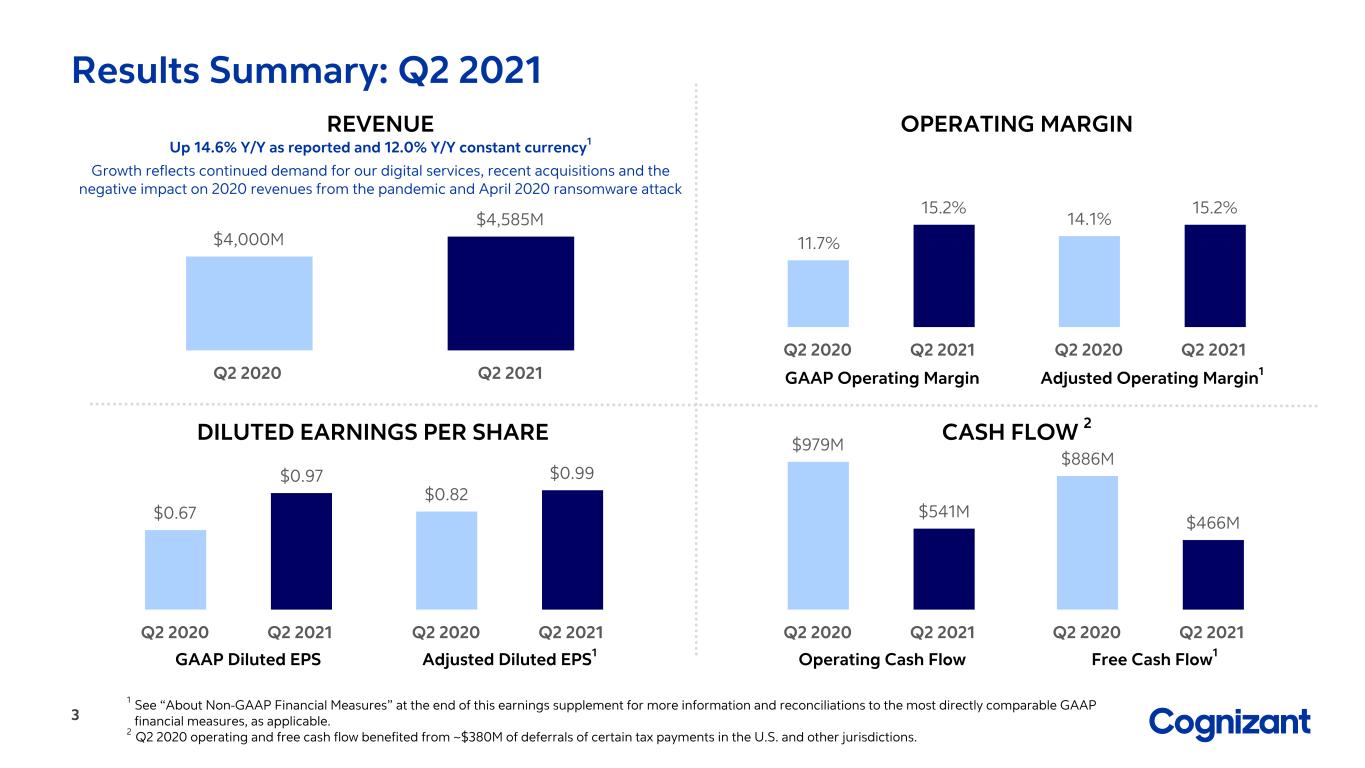
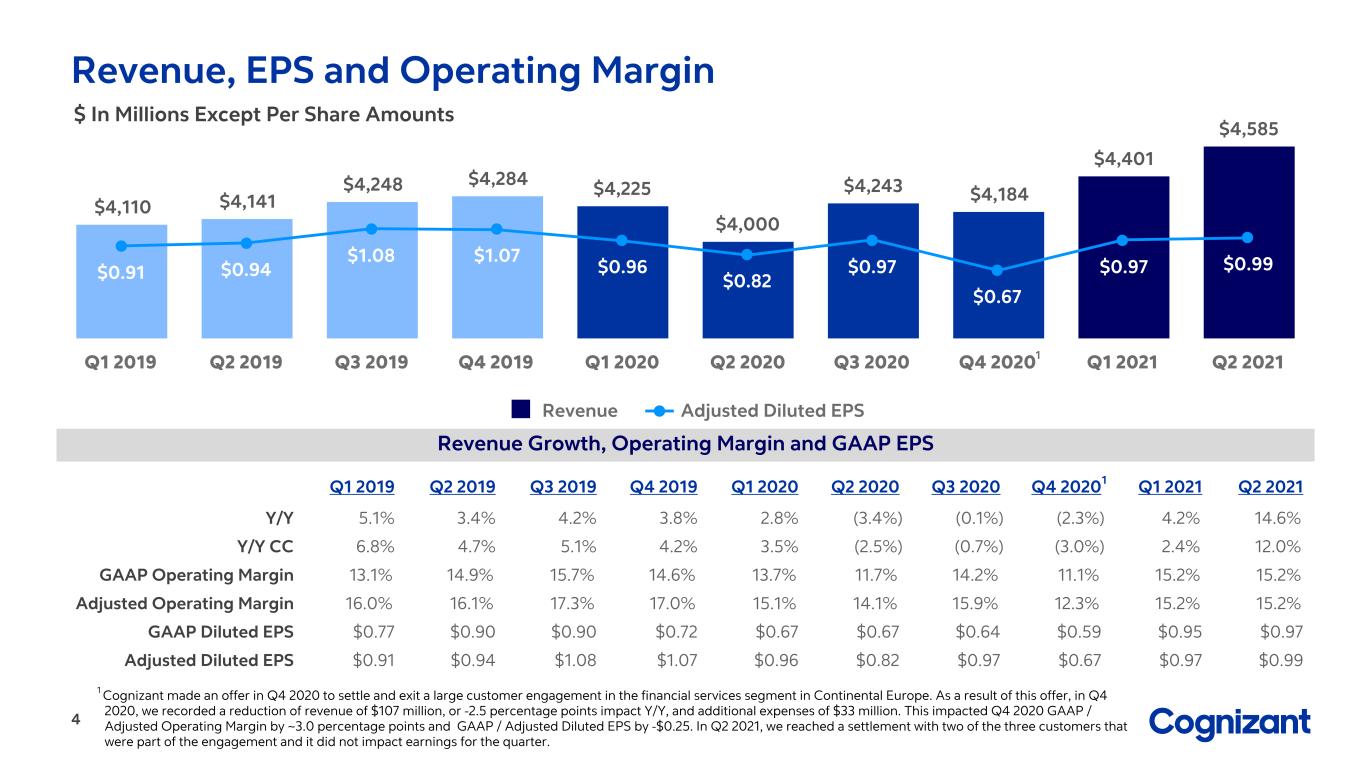
•Revenue of $4.6 billion grew 14.6% year-over-year (12.0% in constant currency1)
•Digital revenue grew approximately 20% year-over-year
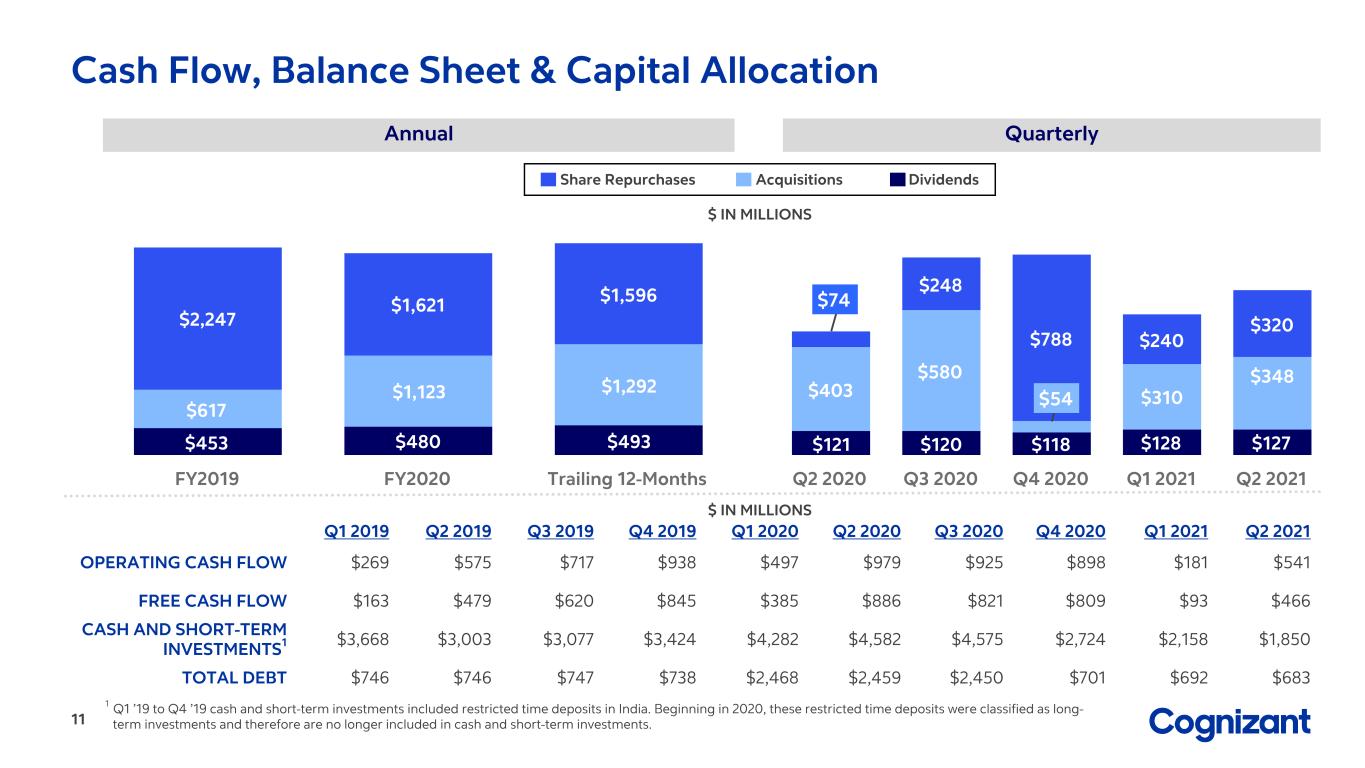
•$1.5 billion deployed on acquisitions, share repurchases and dividends year-to-date
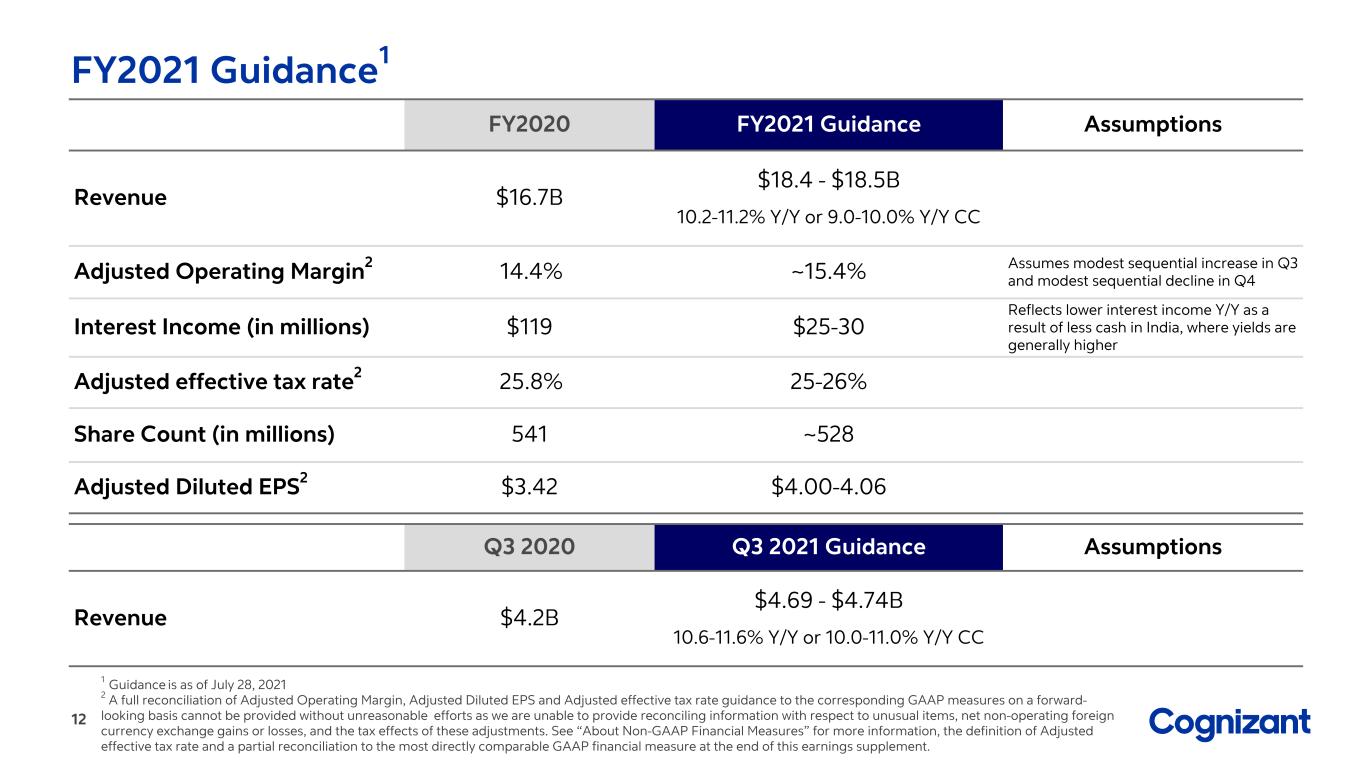
•2021 revenue growth guidance increased to 10.2-11.2%, or 9.0-10.0% in constant currency
TEANECK, N.J., July 28, 2021 - Cognizant (Nasdaq: CTSH), one of the world’s leading professional services companies, today announced its second quarter 2021 financial results.
“We delivered a strong second quarter,” said Brian Humphries, Chief Executive Officer. “Through targeted investments, we’ve been shifting our portfolio to faster-growing market segments while extending our capabilities and partnerships to help clients build modern businesses. I see a stronger, more competitive Cognizant emerging, with growing commercial momentum. We are bullish on the industry and our prospects within it.”
| | | | | | | | | | | | | | |
| | Q2 2021 | | Q2 2020 |
| Revenue (in billions) | | $4.6 | | | $4.0 | |
| GAAP operating margin | | 15.2 | % | | 11.7 | % |
Adjusted Operating Margin1 | | 15.2 | % | | 14.1 | % |
| GAAP diluted EPS | | $0.97 | | $0.67 |
Adjusted Diluted EPS1 | | $0.99 | | $0.82 |
Second Quarter 2021 Performance by Business Segment
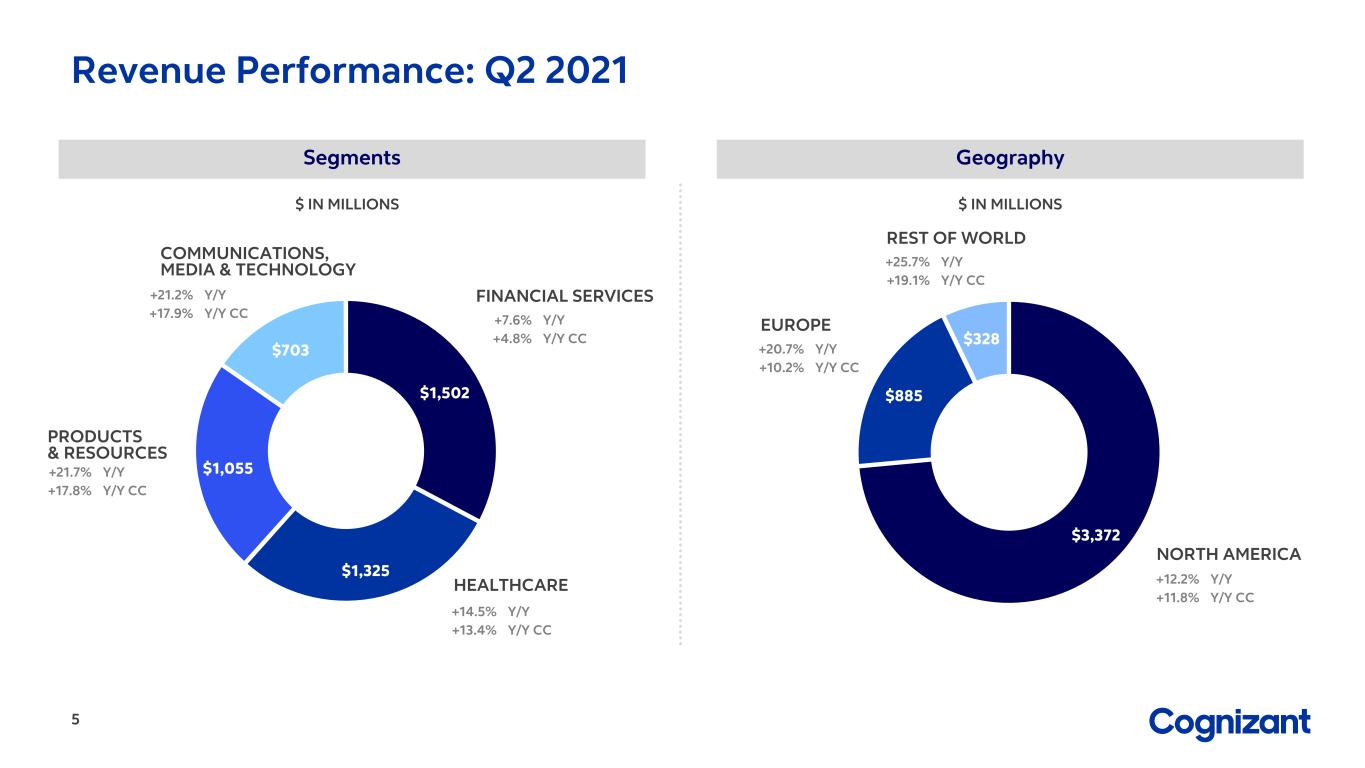
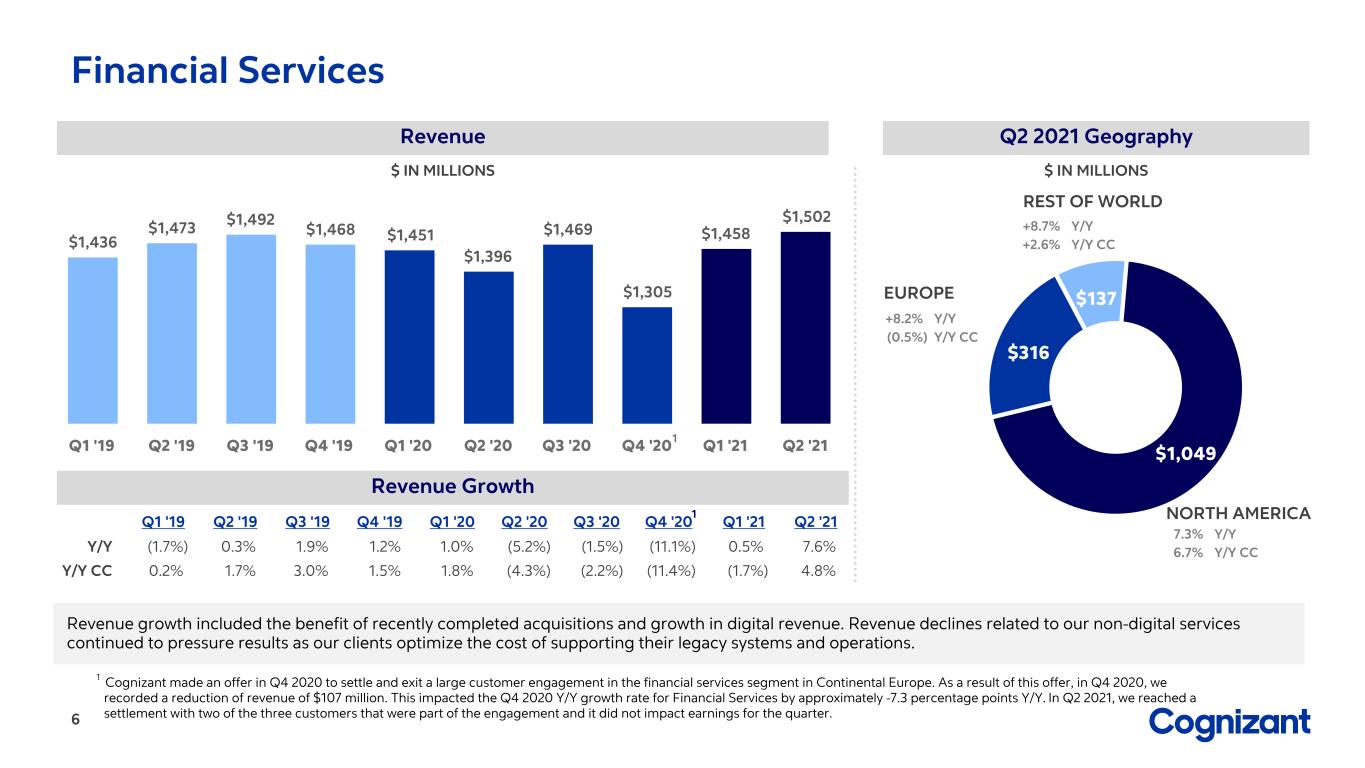
Financial Services (32.8% of revenues) revenue grew 7.6% year-over-year, or 4.8% in constant currency, which included the benefit of recently completed acquisitions and growth in digital revenue. Revenue declines related to our non-digital services continued to pressure results as our clients optimize the cost of supporting their legacy systems and operations.
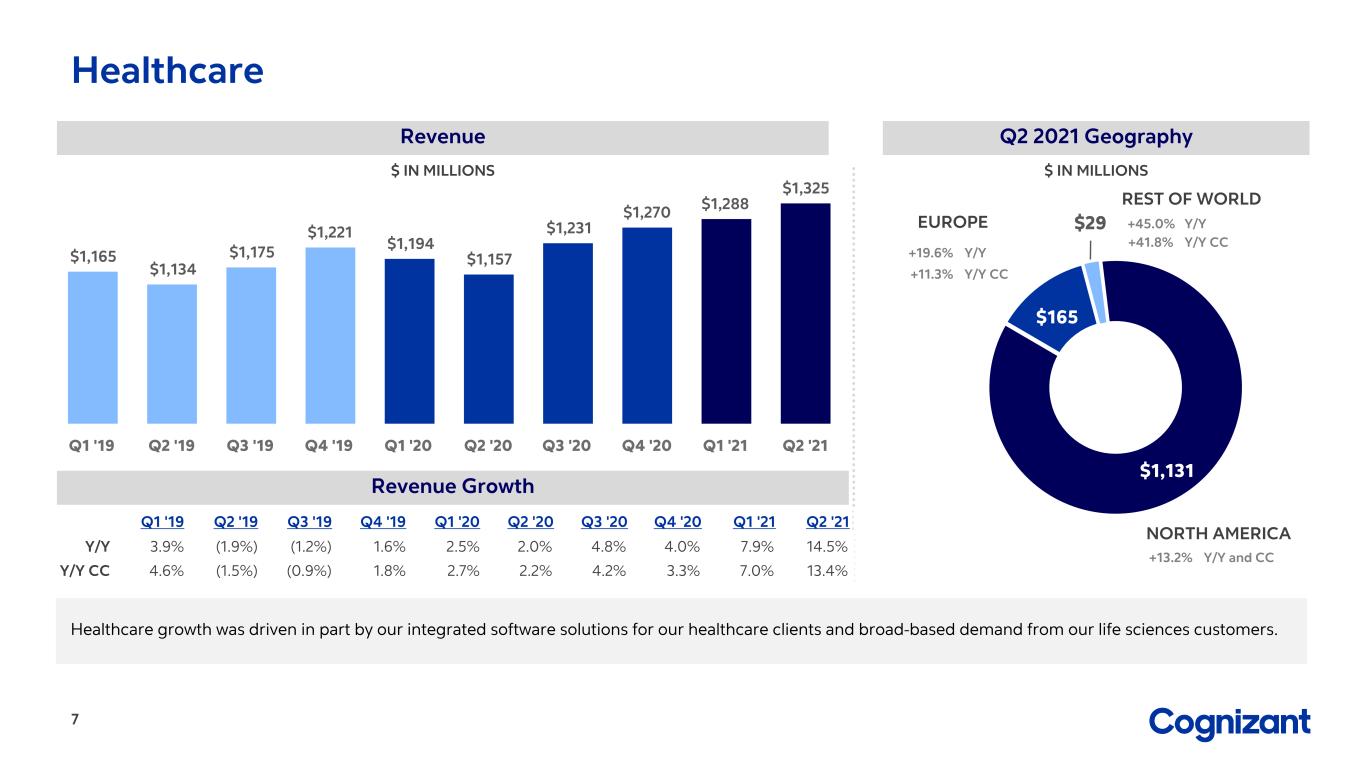
Healthcare (28.9% of revenues) revenue grew 14.5% year-over-year, or 13.4% in constant currency. Growth was driven in part by our integrated software solutions for our healthcare clients and broad-based demand from our life sciences customers.
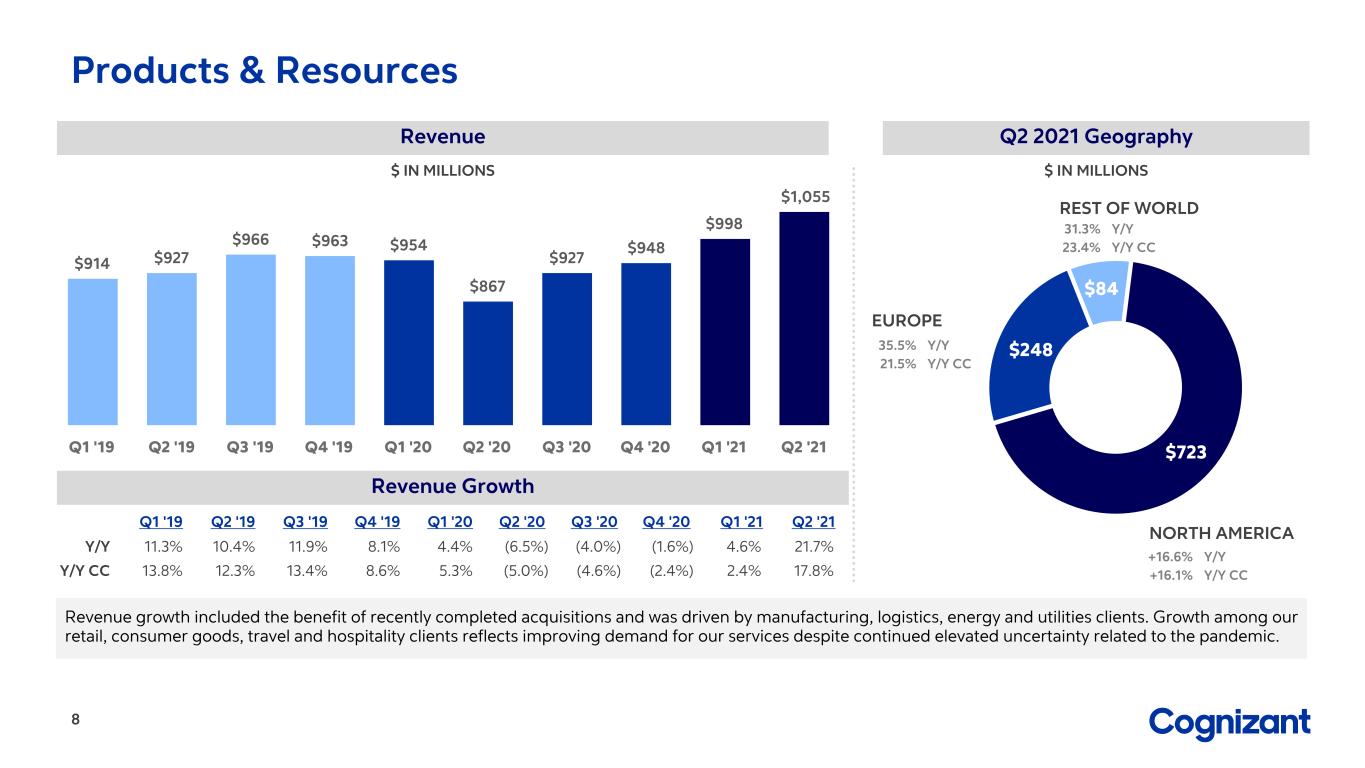
Products and Resources (23.0% of revenues) revenue grew 21.7% year-over-year, or 17.8% in constant currency, which included the benefit of recently completed acquisitions and was driven by manufacturing, logistics, energy and utilities clients. Growth among our retail, consumer goods, travel and hospitality clients reflects improving demand for our services despite continued elevated uncertainty related to the pandemic.
1 Constant currency ("CC") revenue growth, Adjusted Operating Margin and Adjusted Diluted Earnings Per Share ("Adjusted Diluted EPS") are not measures of financial performance prepared in accordance with GAAP. See “About Non-GAAP Financial Measures and Performance Metrics” for more information and, where applicable, reconciliations to the most directly comparable GAAP financial measures at the end of this release.
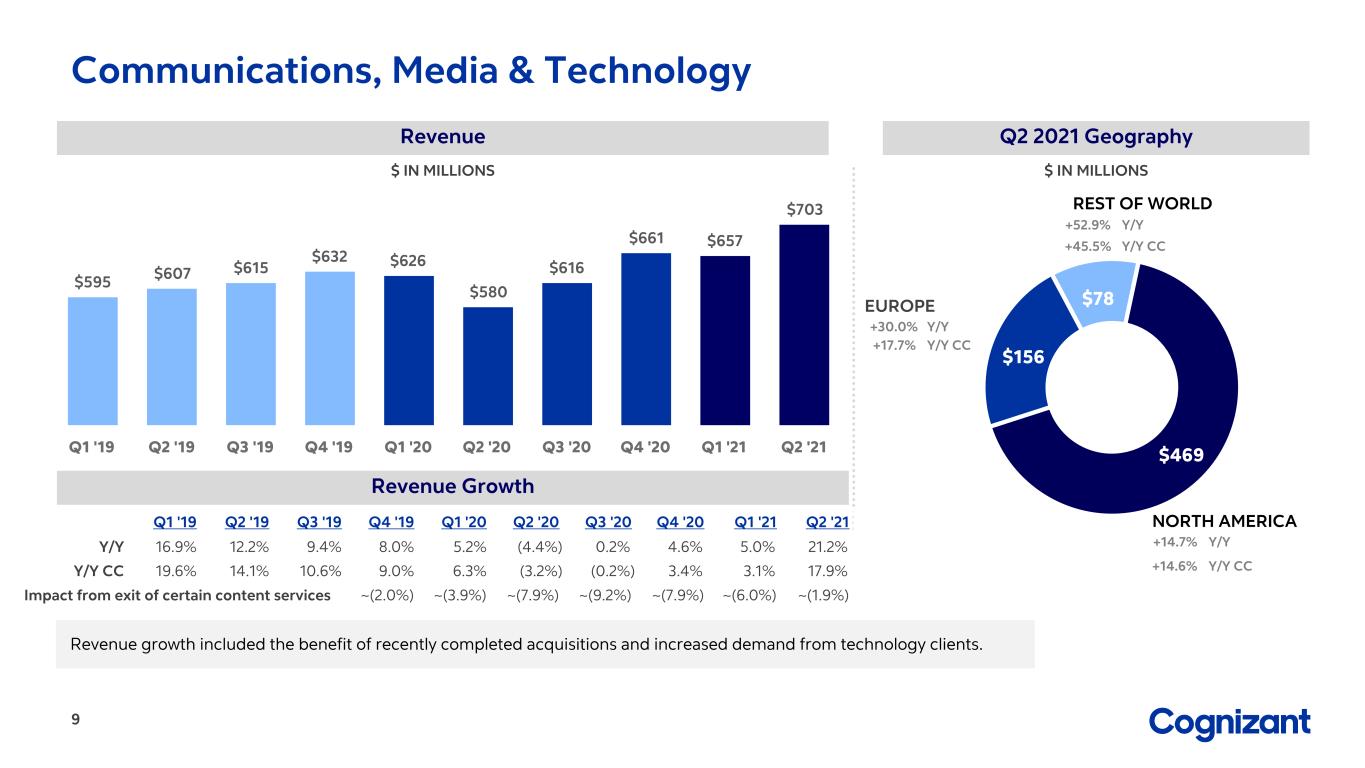
Communications, Media and Technology (15.3% of revenues) revenue grew 21.2% year-over-year, or 17.9% in constant currency. Revenue growth included the benefit of recently completed acquisitions and increased demand from technology clients. The impact from our exit of certain content-related services negatively impacted segment growth by approximately 190 basis points.
In addition to the above, year-over-year revenue growth across all segments reflects the impact on 2020 revenues from the pandemic and the April 2020 ransomware attack.
Return of Capital to Shareholders
During the second quarter, the Company repurchased 4.0 million shares for $296 million at an average price of $73.52 under its share repurchase program. As of June 30, 2021, there was $2.3 billion remaining under the current share repurchase authorization. In July 2021, the Company declared a quarterly cash dividend of $0.24 per share for shareholders of record on August 20, 2021. This dividend will be payable on August 31, 2021.
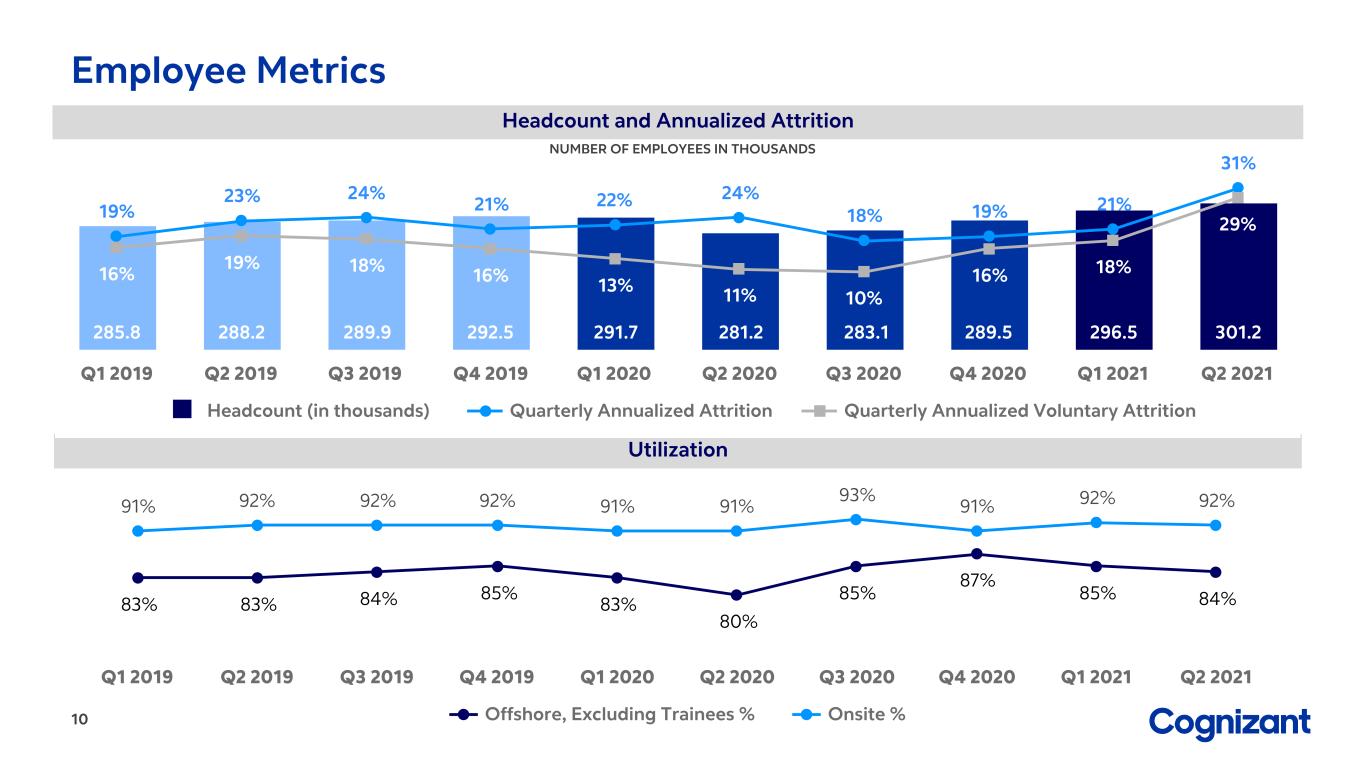
“Second quarter top-line results exceeded our guidance, driven by improved demand for our services and momentum in our digital revenue, and we increased our full-year 2021 revenue growth to 10.2-11.2%,” said Jan Siegmund, Chief Financial Officer. “To meet the strong client demand for our services, we have continued to scale our recruiting capabilities and invest in our people."
Third Quarter and Full Year 2021 Outlook
The Company provided the following guidance:
•Third quarter revenue is expected to be $4.69-$4.74 billion, or growth of 10.6-11.6% (10.0-11.0% in CC).
•Full year 2021 revenue is expected to be $18.4-$18.5 billion, or growth of 10.2-11.2% (9.0-10.0% in CC).
•Full year 2021 Adjusted Operating Margin2 is expected to be approximately 15.4%.
•Full year 2021 Adjusted Diluted EPS2 is expected to be in the range of $4.00-$4.06.
Conference Call
Cognizant will host a conference call on July 28, 2021, at 5:00 p.m. (Eastern) to discuss the Company’s second quarter 2021 results. To listen to the conference call, please dial (877) 810-9510 (domestic) or +1 (201) 493-6778 (international) and provide the following conference passcode: “Cognizant Call.”
The conference call will also be available live on the Investor Relations section of the Cognizant website at http://investors.cognizant.com. An earnings supplement will also be available on the Cognizant website at the time of the conference call.
For those who cannot access the live broadcast, a replay will be available. To listen to the replay, please dial (877) 660-6853 (domestically) or +1 (201) 612-7415 (internationally) and enter 13721332 from two hours after the end of the call until 11:59 p.m. (Eastern) on Wednesday, July 28, 2021. The replay will also be available at Cognizant’s website www.cognizant.com for 60 days following the call.
2 A full reconciliation of Adjusted Operating Margin and Adjusted Diluted EPS guidance to the corresponding GAAP measure on a forward-looking basis cannot be provided without unreasonable efforts, as we are unable to provide reconciling information with respect to unusual items. See “About Non-GAAP Financial Measures and Performance Metrics” for more information and a partial reconciliation at the end of this release.
About Cognizant
Cognizant (Nasdaq-100: CTSH) is one of the world’s leading professional services companies, transforming clients’ business, operating and technology models for the digital era. Our unique industry-based, consultative approach helps clients envision, build and run more innovative and efficient businesses. Headquartered in the U.S., Cognizant is ranked 185 on the Fortune 500 and is consistently listed among the most admired companies in the world. Learn how Cognizant helps clients lead with digital at www.cognizant.com or follow us @Cognizant.
Forward-Looking Statements
This press release includes statements that may constitute forward-looking statements made pursuant to the safe harbor provisions of the Private Securities Litigation Reform Act of 1995, the accuracy of which are necessarily subject to risks, uncertainties, and assumptions as to future events that may not prove to be accurate. These statements include, but are not limited to, express or implied forward-looking statements relating to our expectations regarding the impact of the COVID-19 pandemic on our business,
opportunities in the marketplace, our cost structure, investment in and growth of our business, the effectiveness of our recruiting and talent efforts, the impact of the 2020 Fit for Growth Plan, the likelihood and potential terms of any settlement of and exit from our referenced large customer engagement in the financial services segment, our and our clients’ shift to digital solutions and services and our anticipated financial performance. These statements are neither promises nor guarantees, but are subject to a variety of risks and uncertainties, many of which are beyond our control, which could cause actual results to differ materially from those contemplated in these forward-looking statements. Existing and prospective investors are cautioned not to place undue reliance on these forward-looking statements, which speak only as of the date hereof. Factors that could cause actual results to differ materially from those expressed or implied include general economic conditions, legal, reputational and financial risks resulting from cyberattacks, the impact of and effectiveness of business continuity plans during the COVID-19 pandemic, the competitive marketplace for talent, changes in the regulatory environment, including with respect to immigration and taxes, and the other factors discussed in our most recent Annual Report on Form 10-K and other filings with the Securities and Exchange Commission. Cognizant undertakes no obligation to update or revise any forward-looking statements, whether as a result of new information, future events, or otherwise, except as may be required under applicable securities law.
About Non-GAAP Financial Measures and Performance Metrics
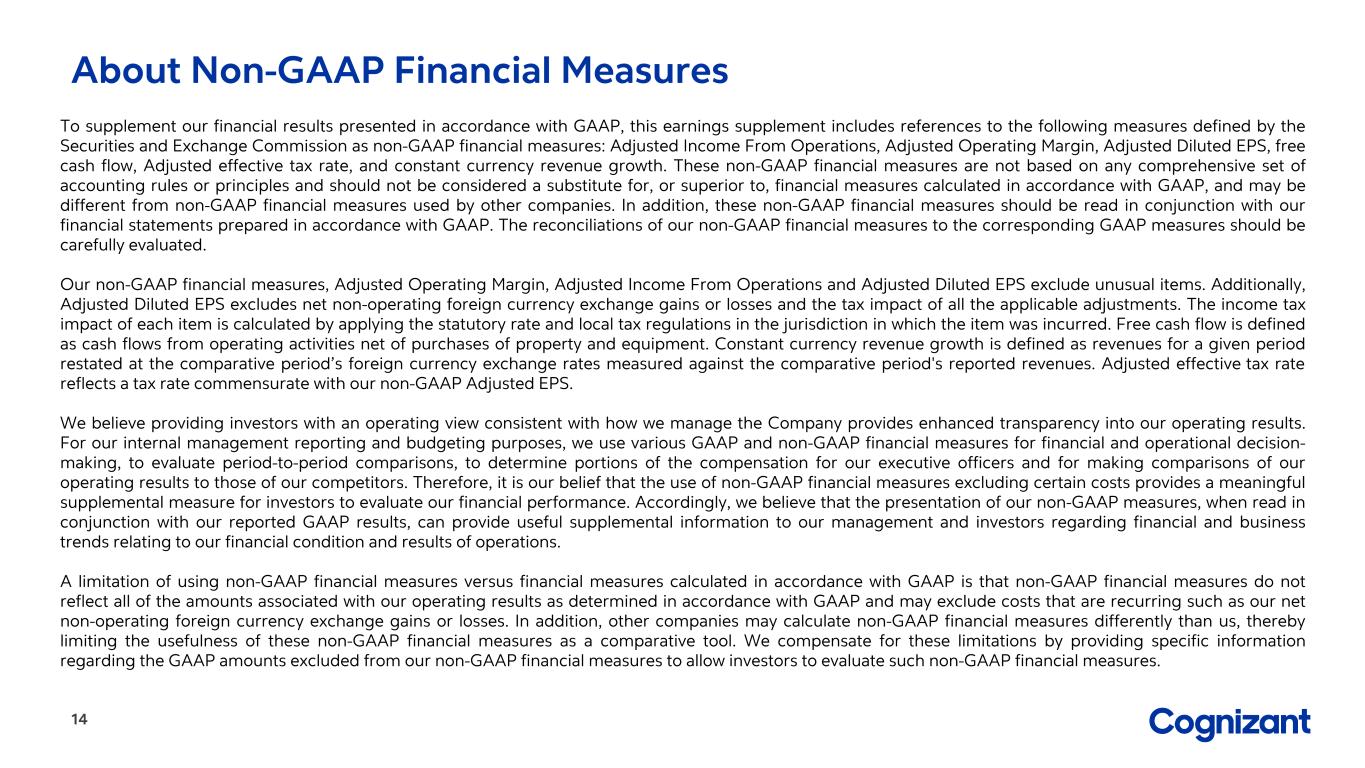
To supplement our financial results presented in accordance with GAAP, this press release includes references to the following measures defined by the Securities and Exchange Commission as non-GAAP financial measures: Adjusted Income From Operations, Adjusted Operating Margin, Adjusted Diluted EPS, free cash flow, net cash and constant currency revenue growth. These non-GAAP financial measures are not based on any comprehensive set of accounting rules or principles and should not be considered a substitute for, or superior to, financial measures calculated in accordance with GAAP, and may be different from non-GAAP financial measures used by other companies. In addition, these non-GAAP financial measures should be read in conjunction with our financial statements prepared in accordance with GAAP. The reconciliations of our non-GAAP financial measures to the corresponding GAAP measures should be carefully evaluated.
Our non-GAAP financial measures, Adjusted Operating Margin, Adjusted Income From Operations and Adjusted Diluted EPS exclude unusual items. Additionally, Adjusted Diluted EPS excludes net non-operating foreign currency exchange gains or losses and the tax impact of all the applicable adjustments. The income tax impact of each item is calculated by applying the statutory rate and local tax regulations in the jurisdiction in which the item was incurred. Free cash flow is defined as cash flows from operating activities net of purchases of property and equipment. Net cash is defined as cash and cash equivalents and short-term investments less short-term and long-term debt. Constant currency revenue growth is defined as revenues for a given period restated at the comparative period’s foreign currency exchange rates measured against the comparative period's reported revenues.
Management believes providing investors with an operating view consistent with how we manage the Company provides enhanced transparency into our operating results. For our internal management reporting and budgeting purposes, we use various GAAP and non-GAAP financial measures for financial and operational decision-making, to evaluate period-to-period comparisons, to determine portions of the compensation for our executive officers and for making comparisons of our operating results to those of our competitors. Therefore, it is our belief that the use of non-GAAP financial measures excluding certain costs provides a meaningful supplemental measure for investors to evaluate our financial performance. Accordingly, we believe that the presentation of our non-GAAP measures, when read in conjunction with our reported GAAP results, can provide useful supplemental information to our management and investors regarding financial and business trends relating to our financial condition and results of operations.
A limitation of using non-GAAP financial measures versus financial measures calculated in accordance with GAAP is that non-GAAP financial measures do not reflect all of the amounts associated with our operating results as determined in accordance with GAAP and may exclude costs that are recurring such as our net non-operating foreign currency exchange gains or losses. In addition, other companies may calculate non-GAAP financial measures differently than us, thereby limiting the usefulness of these non-GAAP financial measures as a comparative tool. We compensate for these limitations by providing specific information regarding the GAAP amounts excluded from our non-GAAP financial measures to allow investors to evaluate such non-GAAP financial measures.
Bookings are defined as total contract value (or TCV) of new contracts, including new contract sales as well as renewals and expansions of existing contracts. Bookings can vary significantly quarter to quarter depending in part on the timing of the signing of a small number of large contracts. Our book-to-bill ratio is defined as bookings for the trailing twelve months divided by revenue for the same period. Measuring bookings involves the use of estimates and judgments and there are no independent standards or requirements governing the calculation of bookings. The extent and timing of conversion of bookings to revenues may be impacted by, among other factors, the types of services and solutions sold, contract duration, the pace of client spending, actual volumes of services delivered as compared to the volumes anticipated at the time of sale, and contract modifications, including terminations, over the lifetime of a contract. The majority of our contracts are terminable by the client on short notice often without penalty, and some without notice. We do not update our bookings for material subsequent terminations or reductions related to bookings originally recorded in prior year periods or foreign currency exchange rate fluctuations. Information regarding our bookings is not comparable to, nor should it be substituted for, an analysis of our reported revenues. However, management believes that it is a key indicator of potential future revenues and provides a useful indicator of the volume of our business over time.
We disclose digital revenue as management believes it provides additional insights into the Company’s business. Measuring digital revenue requires the use of estimates and judgement, there are no independent standards or requirements governing the calculation and our calculation may differ from the calculations underlying similar such metrics disclosed by other companies.
| | | | | | | | | | | | | | |
| Investor Relations Contact: | | | | Media Contact: |
| Tyler Scott | | | | Jeff DeMarrais |
| VP, Investor Relations | | | | VP, Corporate Communications |
| 551-220-8246 | | | | 475-223-2298 |
| [email protected] | | | | [email protected] |
- tables to follow -
COGNIZANT TECHNOLOGY SOLUTIONS CORPORATION
CONSOLIDATED STATEMENTS OF OPERATIONS
(Unaudited)
| | | | | | | | | | | | | | | | | | | | | | | |
| (in millions, except per share data) | Three Months Ended
June 30, | | Six Months Ended
June 30, |
| | 2021 | | 2020 | | 2021 | | 2020 |
| Revenues | $ | 4,585 | | | $ | 4,000 | | | $ | 8,986 | | | $ | 8,225 | |
| Operating expenses: | | | | | | | |
| Cost of revenues (exclusive of depreciation and amortization expense shown separately below) | 2,863 | | | 2,615 | | | 5,627 | | | 5,362 | |
| Selling, general and administrative expenses | 881 | | | 711 | | | 1,708 | | | 1,422 | |
| Restructuring charges | — | | | 71 | | | — | | | 126 | |
| Depreciation and amortization expense | 145 | | | 136 | | | 286 | | | 269 | |
| Income from operations | 696 | | | 467 | | | 1,365 | | | 1,046 | |
| Other income (expense), net: | | | | | | | |
| Interest income | 7 | | | 37 | | | 16 | | | 78 | |
| Interest expense | (2) | | | (9) | | | (4) | | | (15) | |
| Foreign currency exchange gains (losses), net | (7) | | | (2) | | | (16) | | | (104) | |
| Other, net | — | | | 2 | | | (2) | | | — | |
| Total other income (expense), net | (2) | | | 28 | | | (6) | | | (41) | |
| Income before provision for income taxes | 694 | | | 495 | | | 1,359 | | | 1,005 | |
| Provision for income taxes | (184) | | | (134) | | | (344) | | | (276) | |
| Income (loss) from equity method investment | 2 | | | — | | | 2 | | | (1) | |
| Net income | $ | 512 | | | $ | 361 | | | $ | 1,017 | | | $ | 728 | |
| Basic earnings per share | $ | 0.97 | | | $ | 0.67 | | | $ | 1.93 | | | $ | 1.34 | |
| Diluted earnings per share | $ | 0.97 | | | $ | 0.67 | | | $ | 1.92 | | | $ | 1.34 | |
| Weighted average number of common shares outstanding - Basic | 527 | | | 541 | | | 528 | | | 543 | |
| Dilutive effect of shares issuable under stock-based compensation plans | 1 | | | — | | | 1 | | | 1 | |
| Weighted average number of common shares outstanding - Diluted | 528 | | | 541 | | | 529 | | | 544 | |
COGNIZANT TECHNOLOGY SOLUTIONS CORPORATION
CONSOLIDATED STATEMENTS OF FINANCIAL POSITION
(Unaudited)
| | | | | | | | | | | |
(in millions, except par values) | June 30,
2021 | | December 31, 2020 |
| Assets | | | |
| Current assets: | | | |
| Cash and cash equivalents | $ | 1,368 | | | $ | 2,680 | |
| Short-term investments | 482 | | | 44 | |
| Trade accounts receivable, net | 3,419 | | | 3,087 | |
| Other current assets | 1,182 | | | 1,040 | |
| Total current assets | 6,451 | | | 6,851 | |
| Property and equipment, net | 1,225 | | | 1,251 | |
| Operating lease assets, net | 1,004 | | | 1,013 | |
| Goodwill | 5,457 | | | 5,031 | |
| Intangible assets, net | 1,219 | | | 1,046 | |
| Deferred income tax assets, net | 308 | | | 445 | |
| Long-term investments | 433 | | | 440 | |
| Other noncurrent assets | 732 | | | 846 | |
| Total assets | $ | 16,829 | | | $ | 16,923 | |
| Liabilities and Stockholders’ Equity | | | |
| Current liabilities: | | | |
| Accounts payable | $ | 351 | | | $ | 389 | |
| Deferred revenue | 356 | | | 383 | |
| Short-term debt | 38 | | | 38 | |
| Operating lease liabilities | 204 | | | 211 | |
| Accrued expenses and other current liabilities | 2,234 | | | 2,519 | |
| Total current liabilities | 3,183 | | | 3,540 | |
| Deferred revenue, noncurrent | 33 | | | 36 | |
| Operating lease liabilities, noncurrent | 842 | | | 846 | |
| Deferred income tax liabilities, net | 230 | | | 206 | |
| Long-term debt | 645 | | | 663 | |
| Long-term income taxes payable | 378 | | | 428 | |
| Other noncurrent liabilities | 313 | | | 368 | |
| Total liabilities | 5,624 | | | 6,087 | |
| Stockholders’ equity: | | | |
| Preferred stock, $0.10 par value, 15 shares authorized, none issued | — | | | — | |
Class A common stock, $0.01 par value, 1,000 shares authorized, 525 and 530 shares issued and outstanding as of June 30, 2021 and December 31, 2020, respectively | 5 | | | 5 | |
| Additional paid-in capital | 32 | | | 32 | |
| Retained earnings | 11,086 | | | 10,689 | |
| Accumulated other comprehensive income (loss) | 82 | | | 110 | |
| Total stockholders’ equity | 11,205 | | | 10,836 | |
| Total liabilities and stockholders’ equity | $ | 16,829 | | | $ | 16,923 | |
COGNIZANT TECHNOLOGY SOLUTIONS CORPORATION
Reconciliations of Non-GAAP Financial Measures
(Unaudited)
| | | | | | | | | | | | | | | | | | | | | | | | | | | | | | | |
| (dollars in millions, except per share amounts) | Three Months Ended
June 30, | | Six Months Ended
June 30, | | | | Guidance |
| | 2021 | | 2020 | | 2021 | | 2020 | | | | Full Year 2021 |
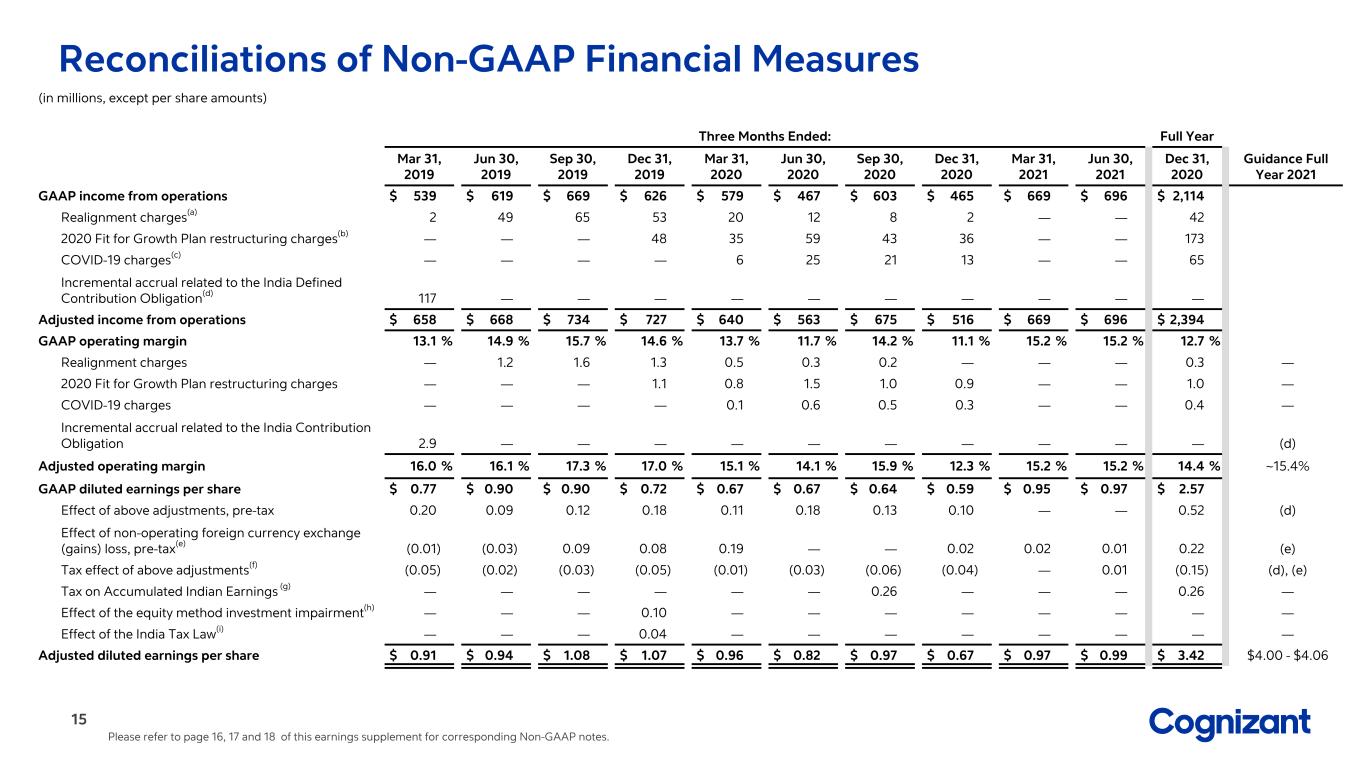
| GAAP income from operations | $ | 696 | | | $ | 467 | | | $ | 1,365 | | | $ | 1,046 | | | | | |
Realignment charges(a) | — | | | 12 | | | — | | | 32 | | | | | |
2020 Fit for Growth Plan restructuring charges(b) | — | | | 59 | | | — | | | 94 | | | | | |
COVID-19 charges(c) | — | | | 25 | | | — | | | 31 | | | | | |
| | | | | | | | | | | |
| | | | | | | | | | | |
| Adjusted Income From Operations | $ | 696 | | | $ | 563 | | | $ | 1,365 | | | $ | 1,203 | | | | | |
| | | | | | | | | | | |
| GAAP operating margin | 15.2 | % | | 11.7 | % | | 15.2 | % | | 12.7 | % | | | | |
| Realignment charges | — | | | 0.3 | | | — | | | 0.4 | | | | | — |
2020 Fit for Growth Plan restructuring charges | — | | | 1.5 | | | — | | | 1.1 | | | | | — |
| COVID-19 charges | — | | | 0.6 | | | — | | | 0.4 | | | | | — |
| | | | | | | | | | | |
Adjusted Operating Margin | 15.2 | % | | 14.1 | % | | 15.2 | % | | 14.6 | % | | | | ~15.4% |
| | | | | | | | | | | |
| GAAP diluted earnings per share | $ | 0.97 | | | $ | 0.67 | | | $ | 1.92 | | | $ | 1.34 | | | | | |
| Effect of above adjustments to income from operations, pre-tax | — | | | 0.18 | | | — | | | 0.29 | | | | | — |
Non-operating foreign currency exchange (gains) losses, pre-tax(d) | 0.01 | | | — | | | 0.03 | | | 0.19 | | | | | (d) |
Tax effect of above adjustments(e) | 0.01 | | | (0.03) | | | 0.01 | | | (0.04) | | | | | (d) |
| | | | | | | | | | | |
| | | | | | | | | | | |
| | | | | | | | | | | |
| Adjusted Diluted Earnings Per Share | $ | 0.99 | | | $ | 0.82 | | | $ | 1.96 | | | $ | 1.78 | | | | | $4.00 - $4.06 |
| | | | | | | | | | | |
| | | | | | | | | | | |
| | | | | | | | | | | |
| | | | | | | | | | | |
| | | | | | | | | | | |
| | | | | | | | | | | |
| | | | | | | | | | | |
| | | | | | | | | | | |
| | | | | | | | | | | |
Notes:
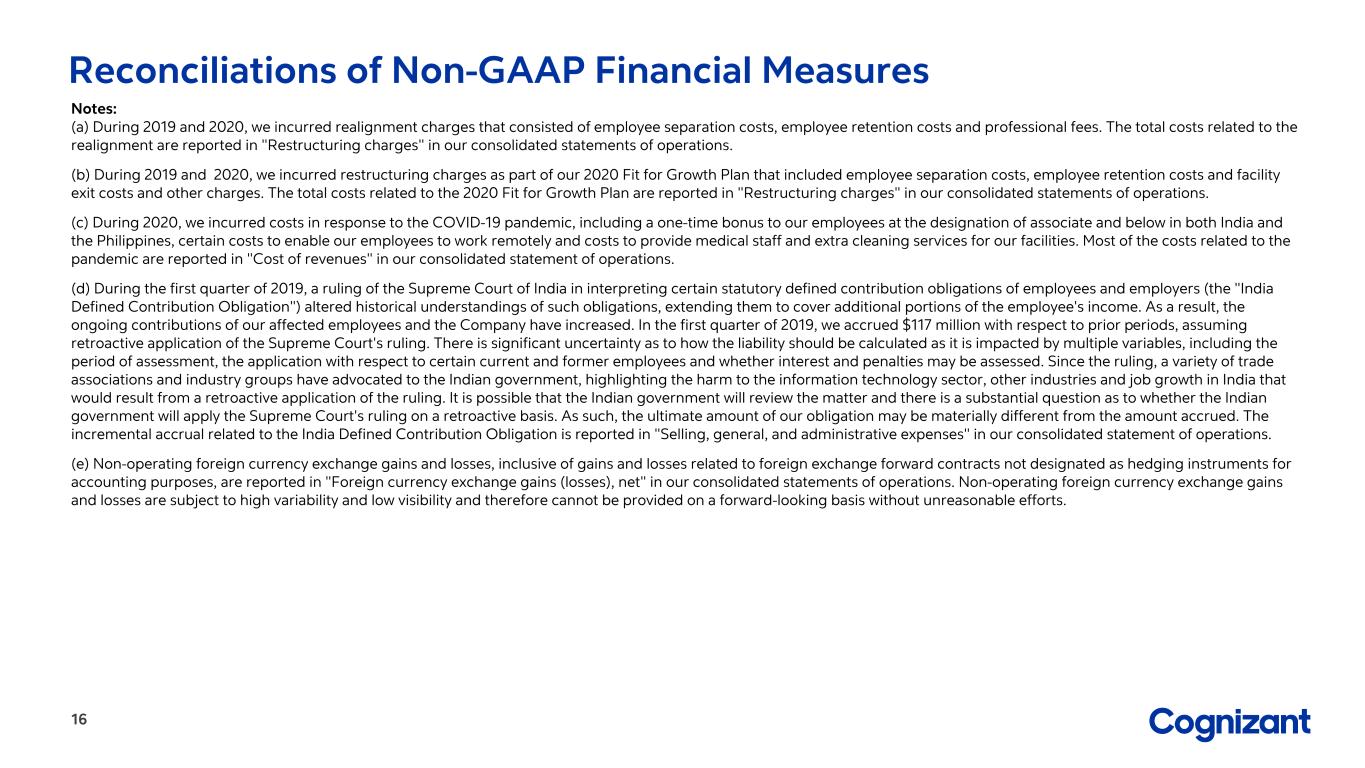
(a)As part of the realignment program, during the three and six months ended June 30, 2020, we incurred certain retention costs and professional fees. The total costs related to the realignment plan are reported in "Restructuring charges" in our unaudited consolidated statement of operations.
(b)As part of our 2020 Fit for Growth plan, during the three and six months ended June 30, 2020, we incurred certain employee separation, employee retention and facility exit costs and other charges. The total costs related to the 2020 Fit for Growth Plan are reported in "Restructuring charges" in our unaudited consolidated statement of operations.
(c)During the three and six months ended June 30, 2020, we incurred costs in response to the COVID-19 pandemic, including a one-time bonus to our employees at the designation of associate and below in both India and the Philippines, certain costs to enable our employees to work remotely and costs to provide medical staff and extra cleaning services for our facilities. Substantially all of the costs related to the pandemic are reported in "Cost of revenues" in our unaudited consolidated statement of operations.
(d)Non-operating foreign currency exchange gains and losses, inclusive of gains and losses on related foreign exchange forward contracts not designated as hedging instruments for accounting purposes, are reported in "Foreign currency exchange gains (losses), net" in our unaudited consolidated statements of operations. Non-operating foreign currency exchange gains and losses are subject to high variability and low visibility and therefore cannot be provided on a forward-looking basis without unreasonable efforts.
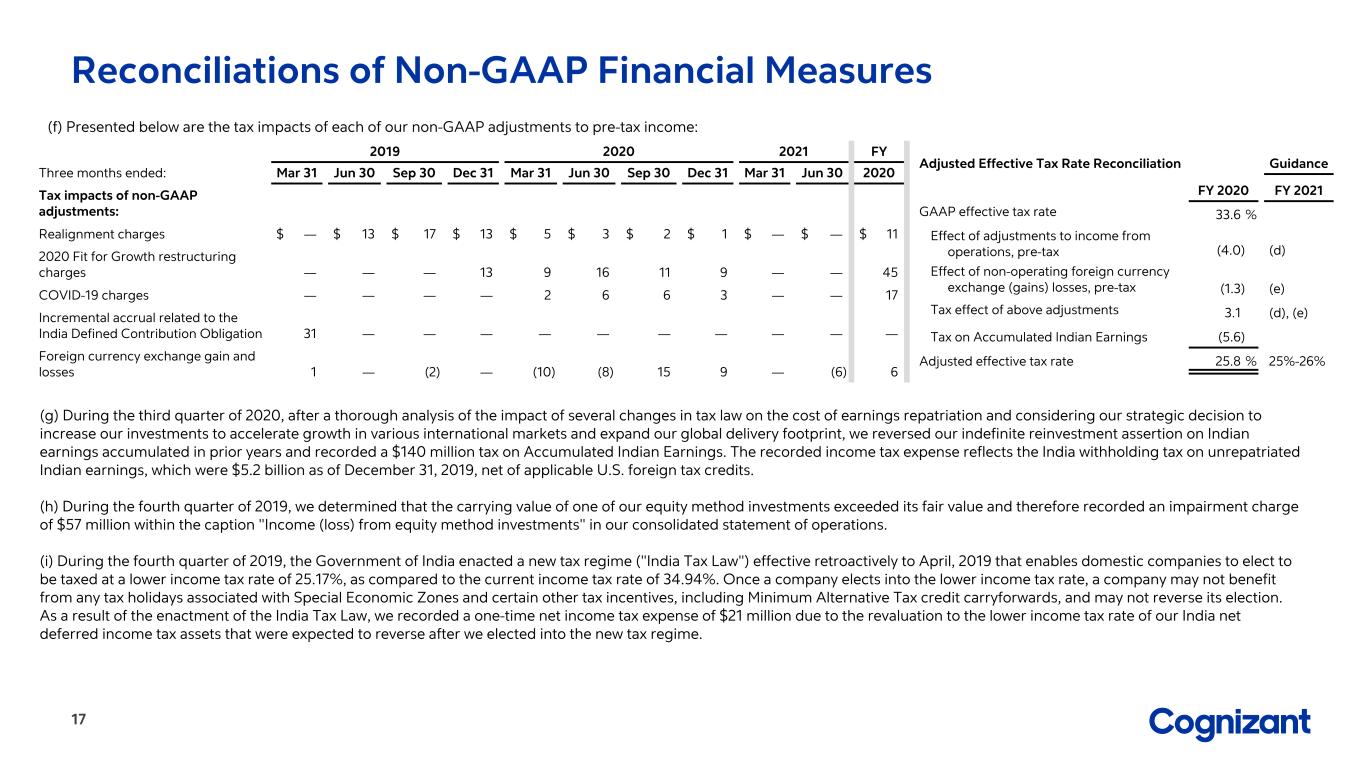
(e)Presented below are the tax impacts of each of our non-GAAP adjustments to pre-tax income for the three and six months ended June 30:
| | | | | | | | | | | | | | | | | | | | | | | |
| Three Months Ended
June 30, | | Six Months Ended June 30, |
| (in millions) | 2021 | | 2020 | | 2021 | | 2020 |
| Non-GAAP income tax benefit (expense) related to: | | | | | | | |
| Realignment charges | $ | — | | | $ | 3 | | | $ | — | | | $ | 8 | |
| 2020 Fit For Growth Plan restructuring charges | — | | | 16 | | | — | | | 25 | |
| COVID-19 charges | — | | | 6 | | | — | | | 8 | |
Foreign currency exchange gains and losses | (6) | | | (8) | | | (6) | | | (18) | |
Reconciliations of net cash
| | | | | | | | | | | | | | |
(in millions) | | June 30, 2021 | | December 31, 2020 |
| Cash and cash equivalents | | $ | 1,368 | | | $ | 2,680 | |
| Short-term investments | | 482 | | | 44 | |
| Less: | | | | |
| Short-term debt | | 38 | | | 38 | |
| Long-term debt | | 645 | | | 663 | |
| Net cash | | $ | 1,167 | | | $ | 2,023 | |
The above tables serve to reconcile the Non-GAAP financial measures to the most directly comparable GAAP measures. Refer to the “About Non-GAAP Financial Measures and Performance Metrics” section of our press release for further information on the use of these Non-GAAP measures.
COGNIZANT TECHNOLOGY SOLUTIONS CORPORATION
Revenue by Business Segment and Geography
(Unaudited)
| | | | | | | | | | | | | | | | | | | | | | | |
| (dollars in millions) | Three Months Ended June 30, 2021 |
| | | | | Year over Year |
| | $ | | % of total | | % Change | | Constant Currency % Change (a) |
| Revenues by Segment: | | | | | | | |
| Financial Services | $ | 1,502 | | | 32.8 | % | | 7.6 | % | | 4.8 | % |
| Healthcare | 1,325 | | | 28.9 | % | | 14.5 | % | | 13.4 | % |
| Products and Resources | 1,055 | | | 23.0 | % | | 21.7 | % | | 17.8 | % |
| Communications, Media and Technology | 703 | | | 15.3 | % | | 21.2 | % | | 17.9 | % |
| Total Revenues | $ | 4,585 | | | | | 14.6 | % | | 12.0 | % |
| Revenues by Geography: | | | | | | | |
| North America | $ | 3,372 | | | 73.5 | % | | 12.2 | % | | 11.8 | % |
| United Kingdom | 403 | | | 8.8 | % | | 28.3 | % | | 16.4 | % |
| Continental Europe | 482 | | | 10.5 | % | | 15.0 | % | | 5.6 | % |
Europe - Total | 885 | | | 19.3 | % | | 20.7 | % | | 10.2 | % |
| Rest of World | 328 | | | 7.2 | % | | 25.7 | % | | 19.1 | % |
| Total Revenues | $ | 4,585 | | | | | 14.6 | % | | 12.0 | % |
| | | | | | | |
| | Six Months Ended June 30, 2021 |
| | | | | Year over Year |
| | $ | | % of total | | % Change | | Constant Currency % Change (a) |
| Revenues by Segment: | | | | | | | |
| Financial Services | $ | 2,960 | | | 32.9 | % | | 4.0 | % | | 1.5 | % |
| Healthcare | 2,613 | | | 29.1 | % | | 11.1 | % | | 10.1 | % |
| Products and Resources | 2,053 | | | 22.9 | % | | 12.7 | % | | 9.7 | % |
| Communications, Media and Technology | 1,360 | | | 15.1 | % | | 12.8 | % | | 10.2 | % |
| Total Revenues | $ | 8,986 | | | | | 9.3 | % | | 7.1 | % |
| Revenues by Geography: | | | | | | | |
| North America | $ | 6,655 | | | 74.1 | % | | 7.4 | % | | 7.1 | % |
| United Kingdom | 773 | | | 8.6 | % | | 18.7 | % | | 9.3 | % |
| Continental Europe | 938 | | | 10.4 | % | | 9.6 | % | | 0.9 | % |
| Europe - Total | 1,711 | | | 19.0 | % | | 13.5 | % | | 4.5 | % |
| Rest of World | 620 | | | 6.9 | % | | 18.8 | % | | 14.0 | % |
| Total Revenues | $ | 8,986 | | | | | 9.3 | % | | 7.1 | % |
Notes:
(a)Constant currency revenue growth is not a measure of financial performance prepared in accordance with GAAP. See “About Non-GAAP Financial Measures and Performance Metrics” section of our press release for further information.
COGNIZANT TECHNOLOGY SOLUTIONS CORPORATION
CONDENSED CONSOLIDATED STATEMENTS OF CASH FLOWS
(Unaudited)
| | | | | | | | | | | | | | | | | | | | | | | |
(in millions) | Three Months Ended
June 30, | | Six Months Ended
June 30, |
| 2021 | | 2020 | | 2021 | | 2020 |
| Cash flows from operating activities: | | | | | | | |
| Net income | $ | 512 | | | $ | 361 | | | $ | 1,017 | | | $ | 728 | |
| Adjustments for non-cash income and expenses | 207 | | | 171 | | | 532 | | | 487 | |
| Changes in assets and liabilities | (178) | | | 447 | | | (827) | | | 261 | |
| Net cash provided by operating activities | 541 | | | 979 | | | 722 | | | 1,476 | |
| Cash flows from investing activities: | | | | | | | |
| Purchases of property and equipment | (75) | | | (93) | | | (163) | | | (205) | |
| Net (purchases) sales of investments | (298) | | | 237 | | | (438) | | | 163 | |
Payments for business combinations, net of cash acquired | (348) | | | (403) | | | (658) | | | (489) | |
| Net cash (used in) investing activities | (721) | | | (259) | | | (1,259) | | | (531) | |
| Cash flows from financing activities: | | | | | | | |
| Repurchases of common stock | (320) | | | (74) | | | (560) | | | (585) | |
| Repayment of term loan borrowings and finance lease and earnout obligations | (13) | | | (12) | | | (28) | | | (25) | |
| Proceeds from borrowings under the revolving credit facility | — | | | — | | | — | | | 1,740 | |
| Dividends paid | (127) | | | (121) | | | (255) | | | (242) | |
| Issuance of common stock under stock-based compensation plans | 32 | | | 36 | | | 75 | | | 76 | |
| Net cash (used in) provided by financing activities | (428) | | | (171) | | | (768) | | | 964 | |
| Effect of exchange rate changes on cash and cash equivalents | 3 | | | (13) | | | (7) | | | (132) | |
| (Decrease) increase in cash and cash equivalents | (605) | | | 536 | | | (1,312) | | | 1,777 | |
| Cash and cash equivalents, beginning of period | 1,973 | | | 3,886 | | | 2,680 | | | 2,645 | |
| Cash and cash equivalents, end of period | $ | 1,368 | | | $ | 4,422 | | | $ | 1,368 | | | $ | 4,422 | |
SUPPLEMENTAL CASH FLOW INFORMATION
| | | | | | | | | | | | | | |
| (in millions) | | Three Months Ended |
| Stock Repurchases under Board of Directors' authorized stock repurchase program: | | June 30, 2021 | | June 30, 2020 |
| Number of shares repurchased | | 4.0 | | | 0.9 | |
| | | | |
Remaining authorized balance as of June 30, 2021 | | $ | 2,285 | | | |
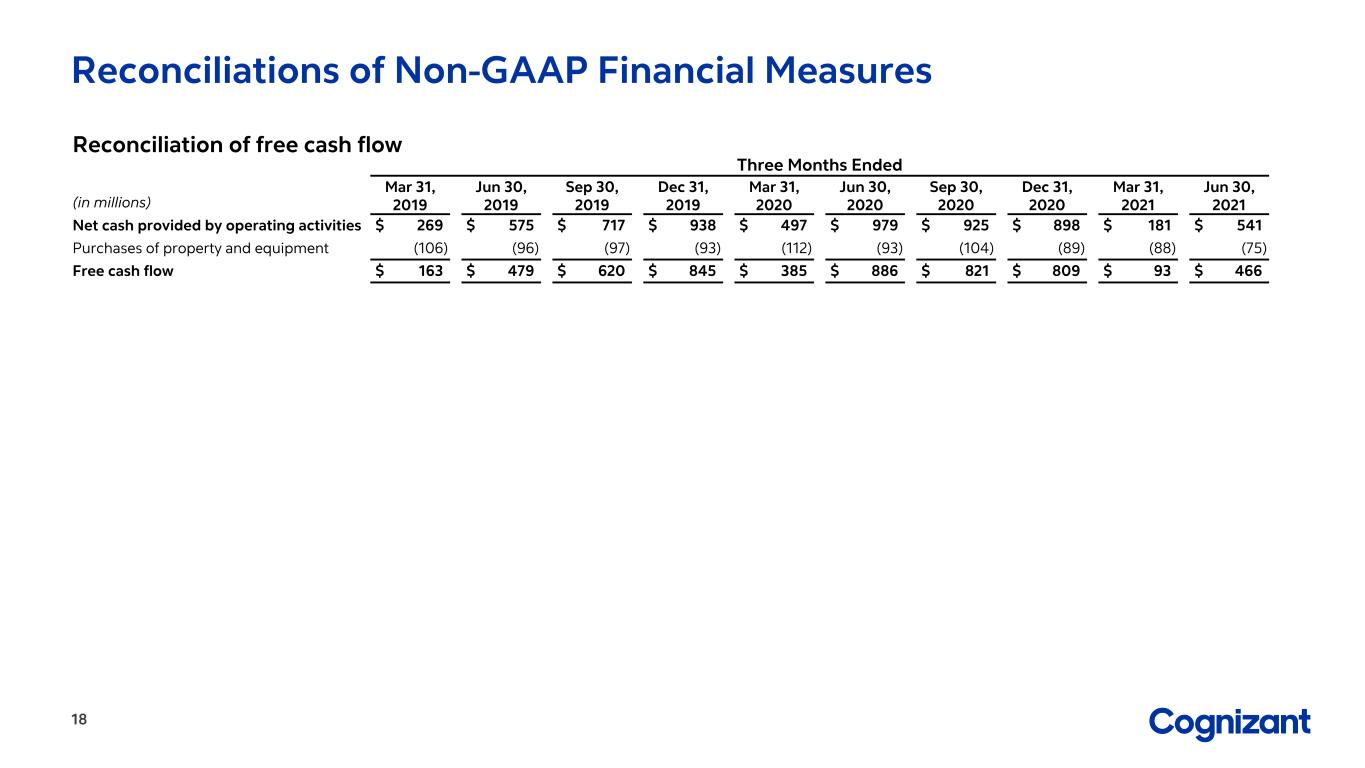
Reconciliation of Free Cash Flow Non-GAAP Financial Measure
| | | | | | | | | | | | | | | | | | | | | | | |
(in millions) | Three Months Ended
June 30, | | Six Months Ended
June 30, |
| 2021 | | 2020 | | 2021 | | 2020 |
| Net cash provided by operating activities | $ | 541 | | | $ | 979 | | | $ | 722 | | | $ | 1,476 | |
Purchases of property and equipment | (75) | | | (93) | | | (163) | | | (205) | |
| Free cash flow | $ | 466 | | | $ | 886 | | | $ | 559 | | | $ | 1,271 | |