ctva-20250507
false000175567200017556722025-05-072025-05-070001755672dei:OtherAddressMember2025-05-072025-05-07

UNITED STATES
SECURITIES AND EXCHANGE COMMISSION
WASHINGTON, D.C. 20549
 
FORM 8-K
 
CURRENT REPORT
PURSUANT TO SECTION 13 OR 15(d) OF
THE SECURITIES EXCHANGE ACT OF 1934
 
Date of Report (Date of Earliest Event Reported): May 7, 2025
Corteva, Inc.
(Exact Name of Registrant as Specified in Its Charter)
 
Delaware 001-38710 82-4979096
(State or other jurisdiction (Commission (I.R.S. Employer
of Incorporation) File Number) Identification No.)
 
9330 Zionsville Road,
Indianapolis, Indiana 46268
974 Centre Road,
Wilmington, Delaware 19805
(Address of principal executive offices)(Zip Code)
 
(833) 267-8382
(Registrant’s telephone number, including area code)
 
Check the appropriate box below if the Form 8-K filing is intended to simultaneously satisfy the filing obligation of the registrant under any of the following provisions:
 
    Written communications pursuant to Rule 425 under the Securities Act (17 CFR 230.425)
 
    Soliciting material pursuant to Rule 14a-12 under the Exchange Act (17 CFR 240.14a-12)
 
    Pre-commencement communications pursuant to Rule 14d-2(b) under the Exchange Act (17 CFR 240.14d-2(b))

    Pre-commencement communications pursuant to Rule 13e-4(c) under the Exchange Act (17 CFR 240.13e-4(c))

Securities registered pursuant to Section 12(b) of the Act: 
Title of each class Trading Symbol(s) Name of each exchange on which registered
Common Stock, par value $0.01 per share CTVA New York Stock Exchange

Indicate by check mark whether the registrant is an emerging growth company as defined in Rule 405 of the Securities Act of 1933 (§230.405 of this chapter) or Rule 12b-2 of the Securities Exchange Act of 1934 (§240.12b-2 of this chapter).
 
Emerging growth company 
 
If an emerging growth company, indicate by check mark if the registrant has elected not to use the extended transition period for complying with any new or revised financial accounting standards provided pursuant to Section 13(a) of the Exchange Act. o


Item 2.02     Results of Operations and Financial Condition
On May 7, 2025, Corteva, Inc. (the "Company") announced its consolidated financial results for the quarter ended March 31, 2025. A copy of the Company’s press release and financial statement schedules are furnished herewith on Form 8-K as Exhibits 99.1 and 99.2, respectively. The information contained in this report, including Exhibits 99.1 and 99.2, is being furnished and shall not be deemed “filed” for purposes of Section 18 of the Securities Exchange Act of 1934, as amended (the “Exchange Act”), or otherwise subject to the liability of that section. In addition, the information contained in this report shall not be deemed to be incorporated by reference into any registration statement or other document filed by the Company under the Securities Act of 1933, as amended, or the Exchange Act except as expressly set forth by specific reference in such filing.


Item 9.01     Financial Statements and Exhibits

(d)    Exhibits.
Press Release dated May 7, 2025
Financial Statement Schedules dated May 7, 2025
104The cover page from the Company’s Current Report on Form 8-K, formatted in Inline XBRL


SIGNATURE
 
Pursuant to the requirements of the Securities Exchange Act of 1934, the Registrant has duly caused this report to be signed on its behalf by the undersigned hereunto duly authorized.
 
 
 CORTEVA, INC.
 (Registrant)
  
 /s/ Brian Titus
 
 Brian Titus
 Vice President and Controller
 
May 7, 2025


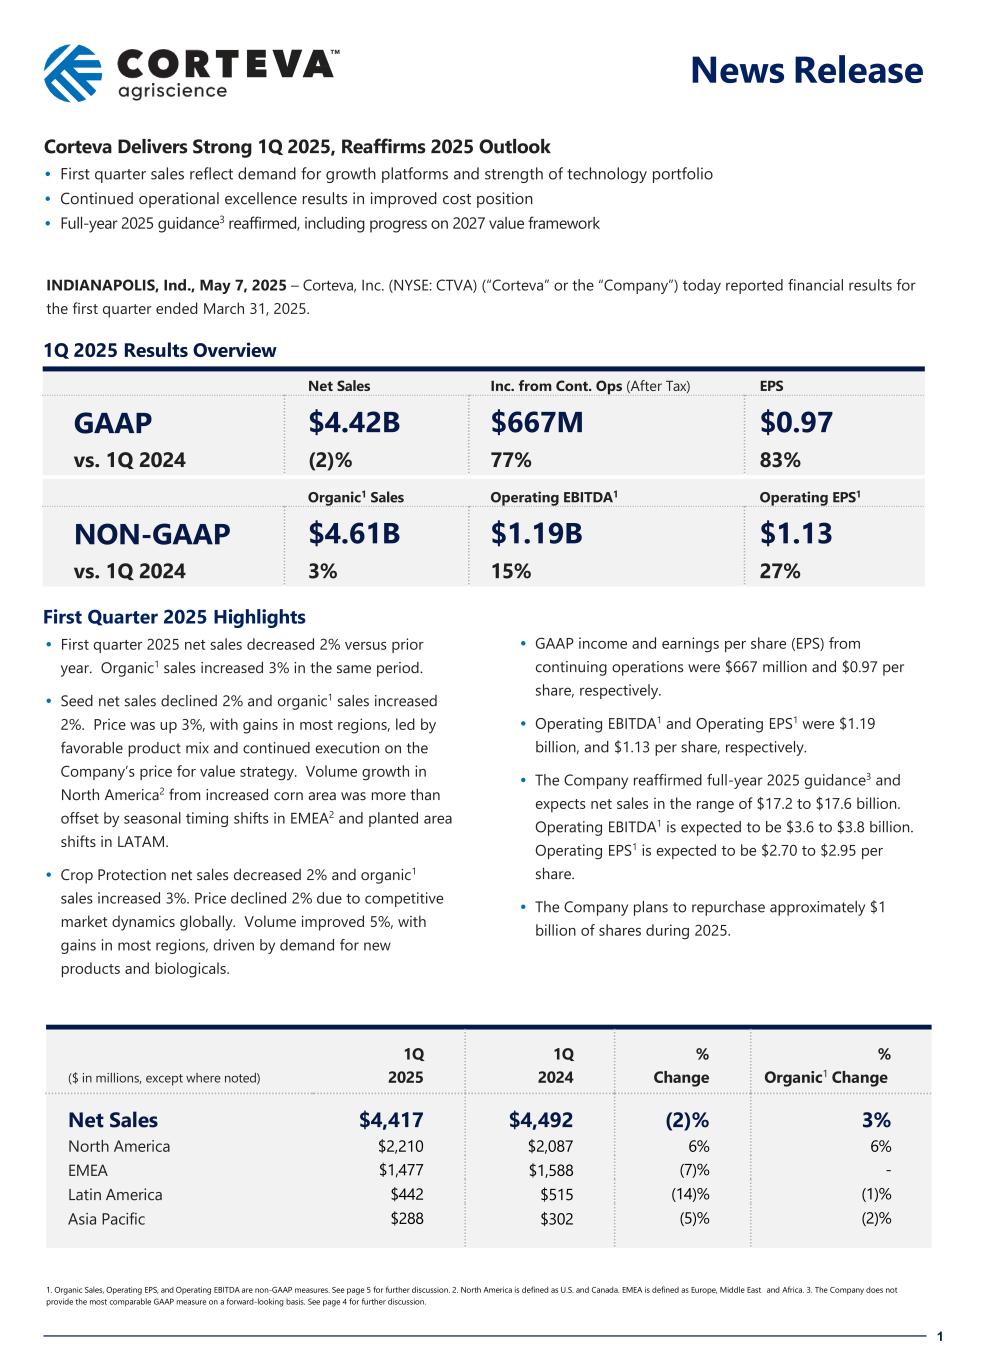
1 News Release Corteva Delivers Strong 1Q 2025, Reaffirms 2025 Outlook • First quarter sales reflect demand for growth platforms and strength of technology portfolio • Continued operational excellence results in improved cost position • Full-year 2025 guidance3 reaffirmed, including progress on 2027 value framework INDIANAPOLIS, Ind., May 7, 2025 – Corteva, Inc. (NYSE: CTVA) (“Corteva” or the “Company”) today reported financial results for the first quarter ended March 31, 2025. 1Q 2025 Results Overview Net Sales Inc. from Cont. Ops (After Tax) EPS GAAP $4.42B $667M $0.97 vs. 1Q 2024 (2)% 77% 83% Organic1 Sales Operating EBITDA1 Operating EPS1 NON-GAAP $4.61B $1.19B $1.13 vs. 1Q 2024 3% 15% 27% First Quarter 2025 Highlights • First quarter 2025 net sales decreased 2% versus prior year. Organic1 sales increased 3% in the same period. • Seed net sales declined 2% and organic1 sales increased 2%. Price was up 3%, with gains in most regions, led by favorable product mix and continued execution on the Company’s price for value strategy. Volume growth in North America2 from increased corn area was more than offset by seasonal timing shifts in EMEA2 and planted area shifts in LATAM. • Crop Protection net sales decreased 2% and organic1 sales increased 3%. Price declined 2% due to competitive market dynamics globally. Volume improved 5%, with gains in most regions, driven by demand for new products and biologicals. • GAAP income and earnings per share (EPS) from continuing operations were $667 million and $0.97 per share, respectively. • Operating EBITDA1 and Operating EPS1 were $1.19 billion, and $1.13 per share, respectively. • The Company reaffirmed full-year 2025 guidance3 and expects net sales in the range of $17.2 to $17.6 billion. Operating EBITDA1 is expected to be $3.6 to $3.8 billion. Operating EPS1 is expected to be $2.70 to $2.95 per share. • The Company plans to repurchase approximately $1 billion of shares during 2025. 1Q 1Q % % ($ in millions, except where noted) 2025 2024 Change Organic1 Change Net Sales $4,417 $4,492 (2)% 3% North America $2,210 $2,087 6% 6% EMEA $1,477 $1,588 (7)% - Latin America $442 $515 (14)% (1)% Asia Pacific $288 $302 (5)% (2)% 1. Organic Sales, Operating EPS, and Operating EBITDA are non-GAAP measures. See page 5 for further discussion. 2. North America is defined as U.S. and Canada. EMEA is defined as Europe, Middle East and Africa. 3. The Company does not provide the most comparable GAAP measure on a forward-looking basis. See page 4 for further discussion.
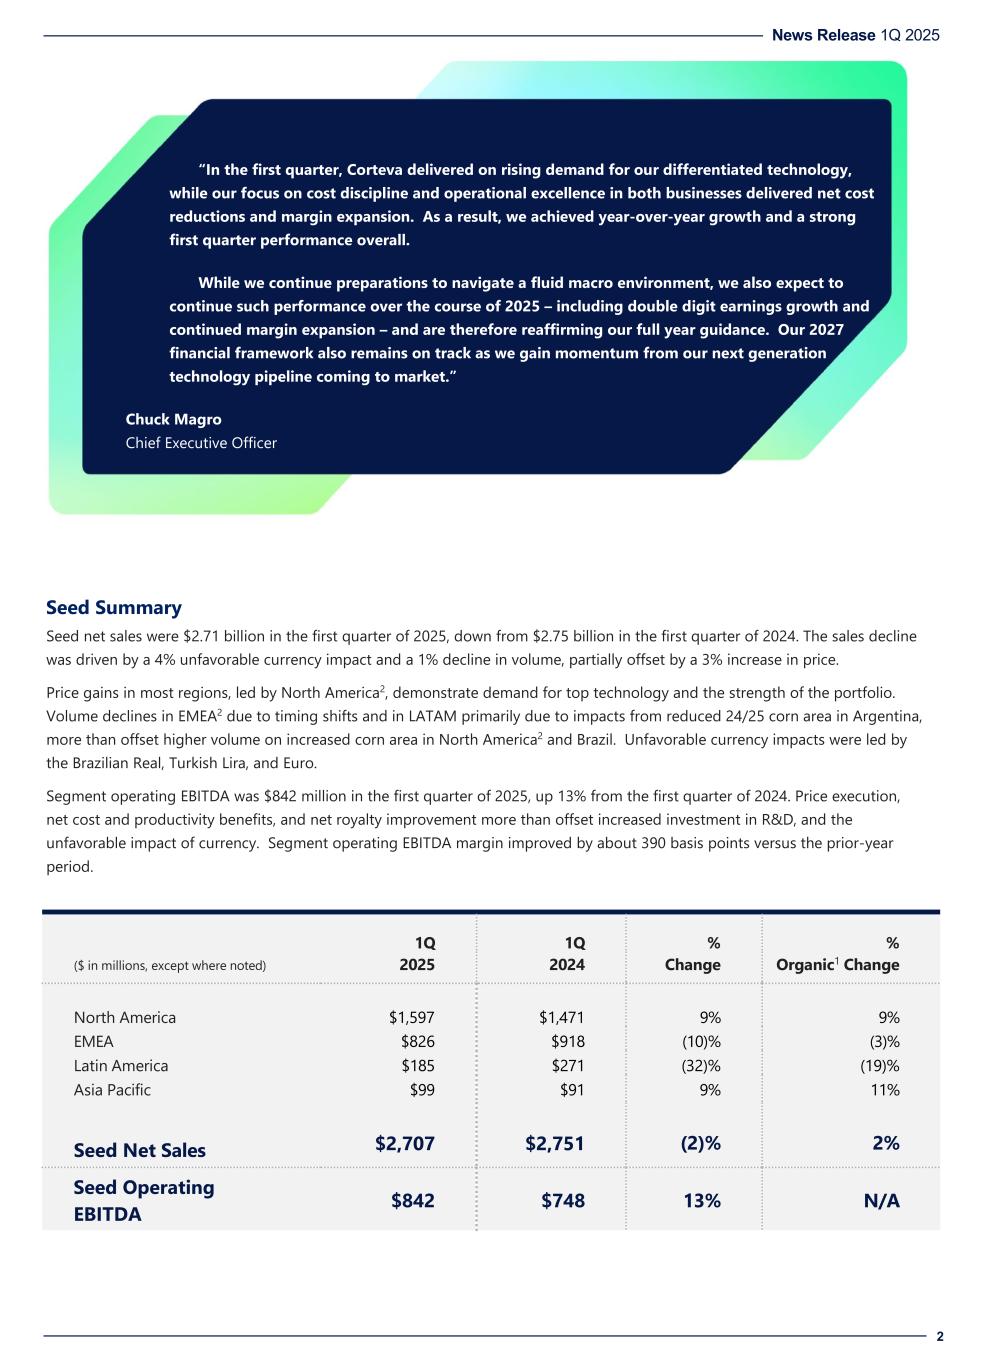

 
News Release 1Q 2025 2 “In the first quarter, Corteva delivered on rising demand for our differentiated technology, while our focus on cost discipline and operational excellence in both businesses delivered net cost reductions and margin expansion. As a result, we achieved year-over-year growth and a strong first quarter performance overall. While we continue preparations to navigate a fluid macro environment, we also expect to continue such performance over the course of 2025 – including double digit earnings growth and continued margin expansion – and are therefore reaffirming our full year guidance. Our 2027 financial framework also remains on track as we gain momentum from our next generation technology pipeline coming to market.” Chuck Magro Chief Executive Officer Seed Summary Seed net sales were $2.71 billion in the first quarter of 2025, down from $2.75 billion in the first quarter of 2024. The sales decline was driven by a 4% unfavorable currency impact and a 1% decline in volume, partially offset by a 3% increase in price. Price gains in most regions, led by North America2, demonstrate demand for top technology and the strength of the portfolio. Volume declines in EMEA2 due to timing shifts and in LATAM primarily due to impacts from reduced 24/25 corn area in Argentina, more than offset higher volume on increased corn area in North America2 and Brazil. Unfavorable currency impacts were led by the Brazilian Real, Turkish Lira, and Euro. Segment operating EBITDA was $842 million in the first quarter of 2025, up 13% from the first quarter of 2024. Price execution, net cost and productivity benefits, and net royalty improvement more than offset increased investment in R&D, and the unfavorable impact of currency. Segment operating EBITDA margin improved by about 390 basis points versus the prior-year period. 1Q 1Q % % ($ in millions, except where noted) 2025 2024 Change Organic1 Change North America $1,597 $1,471 9% 9% EMEA $826 $918 (10)% (3)% Latin America $185 $271 (32)% (19)% Asia Pacific $99 $91 9% 11% Seed Net Sales $2,707 $2,751 (2)% 2% Seed Operating EBITDA $842 $748 13% N/A
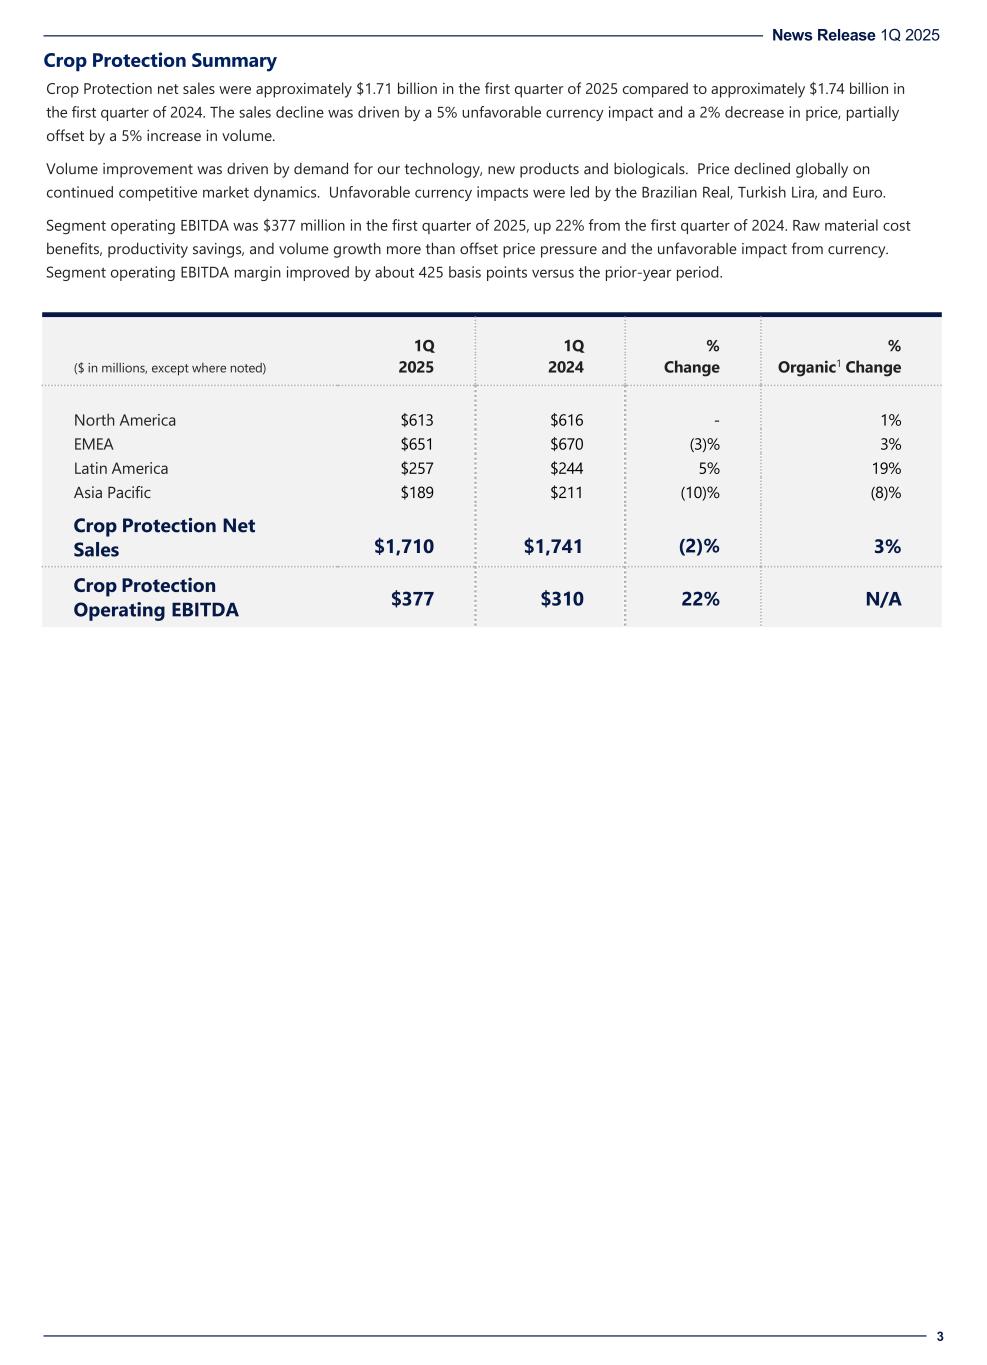

 
News Release 1Q 2025 3 Crop Protection Summary Crop Protection net sales were approximately $1.71 billion in the first quarter of 2025 compared to approximately $1.74 billion in the first quarter of 2024. The sales decline was driven by a 5% unfavorable currency impact and a 2% decrease in price, partially offset by a 5% increase in volume. Volume improvement was driven by demand for our technology, new products and biologicals. Price declined globally on continued competitive market dynamics. Unfavorable currency impacts were led by the Brazilian Real, Turkish Lira, and Euro. Segment operating EBITDA was $377 million in the first quarter of 2025, up 22% from the first quarter of 2024. Raw material cost benefits, productivity savings, and volume growth more than offset price pressure and the unfavorable impact from currency. Segment operating EBITDA margin improved by about 425 basis points versus the prior-year period. 1Q 1Q % % ($ in millions, except where noted) 2025 2024 Change Organic1 Change North America $613 $616 - 1% EMEA $651 $670 (3)% 3% Latin America $257 $244 5% 19% Asia Pacific $189 $211 (10)% (8)% Crop Protection Net Sales $1,710 $1,741 (2)% 3% Crop Protection Operating EBITDA $377 $310 22% N/A
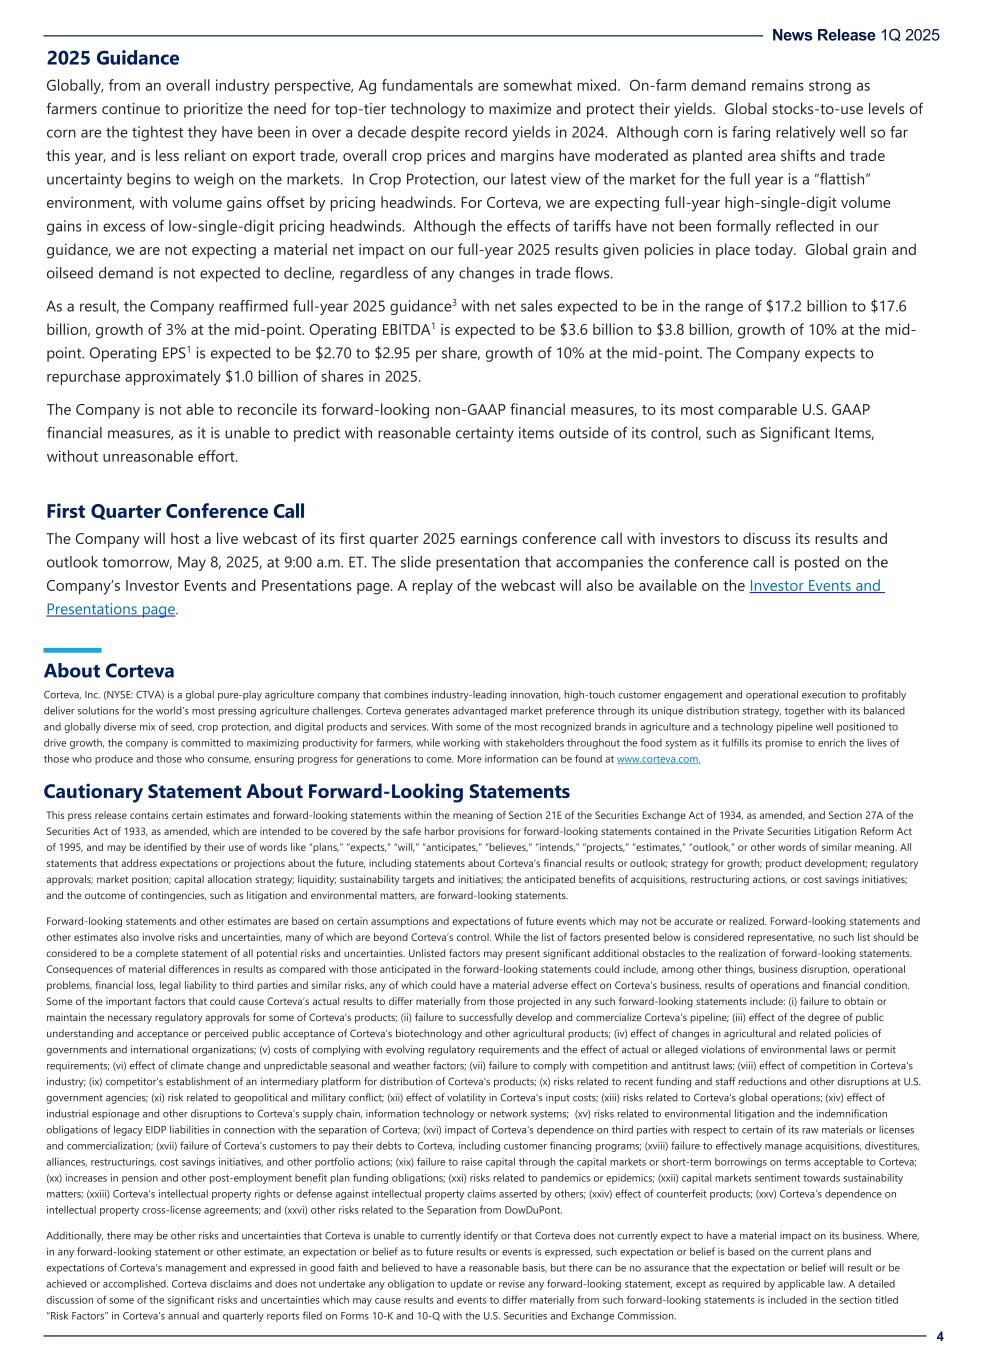

 
News Release 1Q 2025 4 2025 Guidance Globally, from an overall industry perspective, Ag fundamentals are somewhat mixed. On-farm demand remains strong as farmers continue to prioritize the need for top-tier technology to maximize and protect their yields. Global stocks-to-use levels of corn are the tightest they have been in over a decade despite record yields in 2024. Although corn is faring relatively well so far this year, and is less reliant on export trade, overall crop prices and margins have moderated as planted area shifts and trade uncertainty begins to weigh on the markets. In Crop Protection, our latest view of the market for the full year is a “flattish” environment, with volume gains offset by pricing headwinds. For Corteva, we are expecting full-year high-single-digit volume gains in excess of low-single-digit pricing headwinds. Although the effects of tariffs have not been formally reflected in our guidance, we are not expecting a material net impact on our full-year 2025 results given policies in place today. Global grain and oilseed demand is not expected to decline, regardless of any changes in trade flows. As a result, the Company reaffirmed full-year 2025 guidance3 with net sales expected to be in the range of $17.2 billion to $17.6 billion, growth of 3% at the mid-point. Operating EBITDA1 is expected to be $3.6 billion to $3.8 billion, growth of 10% at the mid- point. Operating EPS1 is expected to be $2.70 to $2.95 per share, growth of 10% at the mid-point. The Company expects to repurchase approximately $1.0 billion of shares in 2025. The Company is not able to reconcile its forward-looking non-GAAP financial measures, to its most comparable U.S. GAAP financial measures, as it is unable to predict with reasonable certainty items outside of its control, such as Significant Items, without unreasonable effort. First Quarter Conference Call The Company will host a live webcast of its first quarter 2025 earnings conference call with investors to discuss its results and outlook tomorrow, May 8, 2025, at 9:00 a.m. ET. The slide presentation that accompanies the conference call is posted on the Company’s Investor Events and Presentations page. A replay of the webcast will also be available on the Investor Events and Presentations page. About Corteva Corteva, Inc. (NYSE: CTVA) is a global pure-play agriculture company that combines industry-leading innovation, high-touch customer engagement and operational execution to profitably deliver solutions for the world’s most pressing agriculture challenges. Corteva generates advantaged market preference through its unique distribution strategy, together with its balanced and globally diverse mix of seed, crop protection, and digital products and services. With some of the most recognized brands in agriculture and a technology pipeline well positioned to drive growth, the company is committed to maximizing productivity for farmers, while working with stakeholders throughout the food system as it fulfills its promise to enrich the lives of those who produce and those who consume, ensuring progress for generations to come. More information can be found at www.corteva.com. Cautionary Statement About Forward-Looking Statements This press release contains certain estimates and forward-looking statements within the meaning of Section 21E of the Securities Exchange Act of 1934, as amended, and Section 27A of the Securities Act of 1933, as amended, which are intended to be covered by the safe harbor provisions for forward-looking statements contained in the Private Securities Litigation Reform Act of 1995, and may be identified by their use of words like “plans,” “expects,” “will,” “anticipates,” “believes,” “intends,” “projects,” “estimates,” “outlook,” or other words of similar meaning. All statements that address expectations or projections about the future, including statements about Corteva’s financial results or outlook; strategy for growth; product development; regulatory approvals; market position; capital allocation strategy; liquidity; sustainability targets and initiatives; the anticipated benefits of acquisitions, restructuring actions, or cost savings initiatives; and the outcome of contingencies, such as litigation and environmental matters, are forward-looking statements. Forward-looking statements and other estimates are based on certain assumptions and expectations of future events which may not be accurate or realized. Forward-looking statements and other estimates also involve risks and uncertainties, many of which are beyond Corteva’s control. While the list of factors presented below is considered representative, no such list should be considered to be a complete statement of all potential risks and uncertainties. Unlisted factors may present significant additional obstacles to the realization of forward-looking statements. Consequences of material differences in results as compared with those anticipated in the forward-looking statements could include, among other things, business disruption, operational problems, financial loss, legal liability to third parties and similar risks, any of which could have a material adverse effect on Corteva’s business, results of operations and financial condition. Some of the important factors that could cause Corteva’s actual results to differ materially from those projected in any such forward-looking statements include: (i) failure to obtain or maintain the necessary regulatory approvals for some of Corteva’s products; (ii) failure to successfully develop and commercialize Corteva’s pipeline; (iii) effect of the degree of public understanding and acceptance or perceived public acceptance of Corteva’s biotechnology and other agricultural products; (iv) effect of changes in agricultural and related policies of governments and international organizations; (v) costs of complying with evolving regulatory requirements and the effect of actual or alleged violations of environmental laws or permit requirements; (vi) effect of climate change and unpredictable seasonal and weather factors; (vii) failure to comply with competition and antitrust laws; (viii) effect of competition in Corteva's industry; (ix) competitor’s establishment of an intermediary platform for distribution of Corteva's products; (x) risks related to recent funding and staff reductions and other disruptions at U.S. government agencies; (xi) risk related to geopolitical and military conflict; (xii) effect of volatility in Corteva's input costs; (xiii) risks related to Corteva's global operations; (xiv) effect of industrial espionage and other disruptions to Corteva’s supply chain, information technology or network systems; (xv) risks related to environmental litigation and the indemnification obligations of legacy EIDP liabilities in connection with the separation of Corteva; (xvi) impact of Corteva's dependence on third parties with respect to certain of its raw materials or licenses and commercialization; (xvii) failure of Corteva’s customers to pay their debts to Corteva, including customer financing programs; (xviii) failure to effectively manage acquisitions, divestitures, alliances, restructurings, cost savings initiatives, and other portfolio actions; (xix) failure to raise capital through the capital markets or short-term borrowings on terms acceptable to Corteva; (xx) increases in pension and other post-employment benefit plan funding obligations; (xxi) risks related to pandemics or epidemics; (xxii) capital markets sentiment towards sustainability matters; (xxiii) Corteva’s intellectual property rights or defense against intellectual property claims asserted by others; (xxiv) effect of counterfeit products; (xxv) Corteva’s dependence on intellectual property cross-license agreements; and (xxvi) other risks related to the Separation from DowDuPont. Additionally, there may be other risks and uncertainties that Corteva is unable to currently identify or that Corteva does not currently expect to have a material impact on its business. Where, in any forward-looking statement or other estimate, an expectation or belief as to future results or events is expressed, such expectation or belief is based on the current plans and expectations of Corteva’s management and expressed in good faith and believed to have a reasonable basis, but there can be no assurance that the expectation or belief will result or be achieved or accomplished. Corteva disclaims and does not undertake any obligation to update or revise any forward-looking statement, except as required by applicable law. A detailed discussion of some of the significant risks and uncertainties which may cause results and events to differ materially from such forward-looking statements is included in the section titled “Risk Factors” in Corteva’s annual and quarterly reports filed on Forms 10-K and 10-Q with the U.S. Securities and Exchange Commission.

 
News Release 1Q 2025 5 Regulation G (Non-GAAP Financial Measures) This earnings release includes information that does not conform to U.S. GAAP and are considered non-GAAP measures. These measures may include organic sales, organic growth (including by segment and region), operating EBITDA, operating earnings (loss) per share, and base income tax rate. Management uses these measures internally for planning and forecasting, including allocating resources and evaluating incentive compensation. Management believes that these non-GAAP measures best reflect the ongoing performance of the Company during the periods presented and provide more relevant and meaningful information to investors as they provide insight with respect to ongoing operating results of the Company and a more useful comparison of year over year results. These non-GAAP measures supplement the Company’s U.S. GAAP disclosures and should not be viewed as an alternative to U.S. GAAP measures of performance. Furthermore, such non-GAAP measures may not be consistent with similar measures provided or used by other companies. Reconciliations for these non-GAAP measures to U.S. GAAP are provided in the Selected Financial Information and Non-GAAP Measures starting on page A-5 of the Financial Statement Schedules. Corteva is not able to reconcile its forward-looking non-GAAP financial measures, except for Free Cash Flow, to its most comparable U.S. GAAP financial measures, as it is unable to predict with reasonable certainty items outside of the Company’s control, such as significant items, without unreasonable effort. For significant items reported in the periods presented, refer to page A-8 of the Financial Statement Schedules. Beginning January 1, 2020, the Company presents accelerated prepaid royalty amortization expense as a significant item. Accelerated prepaid royalty amortization represents the non-cash charge associated with the recognition of upfront payments made to Monsanto in connection with the Company’s non-exclusive license in the United States and Canada for Monsanto’s Genuity® Roundup Ready 2 Yield® and Roundup Ready 2 Xtend® herbicide tolerance traits. Due to the ramp-up of Enlist E3TM, Corteva significantly reduced the volume of products with the Roundup Ready 2 Yield® and Roundup Ready 2 Xtend® herbicide tolerance traits beginning in 2021, with expected minimal use of the trait platform thereafter. In 2023 and 2024, the company committed to restructuring activities to optimize the Crop Protection network of manufacturing and external partners, which are expected to be substantially complete in 2026. The company expects to record approximately $150 million to $165 million net pre-tax restructuring charges during 2025 for these activities. Organic sales is defined as price and volume and excludes currency and portfolio and other impacts, including significant items. Operating EBITDA is defined as earnings (loss) (i.e., income (loss) from continuing operations before income taxes) before interest, depreciation, amortization, non-operating benefits (costs), foreign exchange gains (losses), and net unrealized gain or loss from mark-to-market activity for certain foreign currency derivative instruments that do not qualify for hedge accounting, excluding the impact of significant items. Non-operating benefits (costs) consists of non-operating pension and other post- employment benefit (OPEB) credits (costs), tax indemnification adjustments, and environmental remediation and legal costs associated with legacy businesses and sites. Tax indemnification adjustments relate to changes in indemnification balances, as a result of the application of the terms of the Tax Matters Agreement, between Corteva and Dow and/or DuPont that are recorded by the Company as pre-tax income or expense. Operating earnings (loss) per share is defined as “earnings (loss) per common share from continuing operations - diluted” excluding the after-tax impact of significant items, the after-tax impact of non-operating benefits (costs), the after-tax impact of amortization expense associated with intangible assets existing as of the Separation from DowDuPont, and the after-tax impact of net unrealized gain or loss from mark-to-market activity for certain foreign currency derivative instruments that do not qualify for hedge accounting. Although amortization of the Company’s intangible assets is excluded from these non-GAAP measures, management believes it is important for investors to understand that such intangible assets contribute to revenue generation. Amortization of intangible assets that relate to past acquisitions will recur in future periods until such intangible assets have been fully amortized. Any future acquisitions may result in amortization of additional intangible assets. Net unrealized gain or loss from mark-to-market activity for certain foreign currency derivative instruments that do not qualify for hedge accounting represents the non-cash net gain (loss) from changes in fair value of certain undesignated foreign currency derivative contracts. Upon settlement, which is within the same calendar year of execution of the contract, the realized gain (loss) from the changes in fair value of the non-qualified foreign currency derivative contracts will be reported in the relevant non-GAAP financial measures, allowing quarterly results to reflect the economic effects of the foreign currency derivative contracts without the resulting unrealized mark to fair value volatility. Base income tax rate is defined as the effective income tax rate less the effect of exchange gains (losses), significant items, amortization of intangibles (existing as of Separation), mark-to-market (gains) losses on certain foreign currency contracts not designated as hedges, and non-operating (benefits) costs. The Company also uses Free Cash Flow as a non-GAAP measure to evaluate and discuss its liquidity position and ability to generate cash. Free Cash Flow is defined as cash provided by (used for) operating activities – continuing operations, less capital expenditures. Management believes that Free Cash Flow provides investors with meaningful information regarding the company’s ongoing ability to generate cash through core operations, and the company’s ability to service its indebtedness, pay dividends (when declared), make share repurchases, and meet its ongoing cash needs for its operations. ® TM Corteva Agriscience and its affiliated companies. 5/7/2025 Media Contact Bethany Shively +1 804-866-2377 [email protected] Investor Contact Kim Booth +1 302-485-3704 [email protected]


A-1
Corteva, Inc.
Consolidated Statements of Operations
(Dollars in millions, except per share amounts)
Three Months Ended March 31,
20252024
Net sales$4,417 $4,492 
Cost of goods sold2,342 2,550 
Research and development expense335 332 
Selling, general and administrative expenses751 736 
Amortization of intangibles162 177 
Restructuring and asset related charges - net22 75 
Other income (expense) - net15 (99)
Interest expense36 41 
Income (loss) from continuing operations before income taxes784 482 
Provision for (benefit from) income taxes on continuing operations117 106 
Income (loss) from continuing operations after income taxes667 376 
Income (loss) from discontinued operations after income taxes(11)47 
Net income (loss)656 423 
Net income (loss) attributable to noncontrolling interests
Net income (loss) attributable to Corteva$652 $419 
Basic earnings (loss) per share of common stock:
Basic earnings (loss) per share of common stock from continuing operations$0.97 $0.53 
Basic earnings (loss) per share of common stock from discontinued operations(0.02)0.07 
Basic earnings (loss) per share of common stock$0.95 $0.60 
Diluted earnings (loss) per share of common stock:
Diluted earnings (loss) per share of common stock from continuing operations$0.97 $0.53 
Diluted earnings (loss) per share of common stock from discontinued operations(0.02)0.07 
Diluted earnings (loss) per share of common stock$0.95 $0.60 
Average number of shares outstanding used in earnings (loss) per share (EPS) calculation (in millions)
  Basic684.9700.4
  Diluted686.6702.8


A-2
Corteva, Inc.
Consolidated Balance Sheets
(Dollars in millions, except share amounts)
March 31, 2025December 31, 2024March 31, 2024
Assets
Current assets
Cash and cash equivalents$2,008 $3,106 $1,505 
Marketable securities63 153 
Accounts and notes receivable - net8,294 5,676 7,906 
Inventories5,132 5,432 6,183 
Other current assets1,152 820 1,416 
Total current assets16,587 15,097 17,163 
Investment in nonconsolidated affiliates136 134 123 
Property, plant and equipment9,244 9,074 9,013 
Less: Accumulated depreciation5,139 4,975 4,807 
Net property, plant and equipment4,105 4,099 4,206 
Goodwill10,332 10,408 10,553 
Other intangible assets8,718 8,876 9,446 
Deferred income taxes413 401 551 
Other assets1,832 1,810 1,583 
Total Assets$42,123 $40,825 $43,625 
Liabilities and Equity
Current liabilities
Short-term borrowings and finance lease obligations$2,291 $750 $2,148 
Accounts payable3,905 4,039 3,606 
Income taxes payable322 207 311 
Deferred revenue2,631 3,287 2,694 
Accrued and other current liabilities2,332 2,103 2,573 
Total current liabilities11,481 10,386 11,332 
Long-term debt1,792 1,953 2,492 
Other noncurrent liabilities
Deferred income tax liabilities369 478 753 
Pension and other post-employment benefits2,239 2,271 2,453 
Other noncurrent obligations1,715 1,707 1,587 
Total noncurrent liabilities$6,115 $6,409 $7,285 
Commitments and contingent liabilities
Stockholders' equity
Common stock, $0.01 par value; 1,666,667,000 shares authorized; issued at March 31, 2025 - 683,026,000; December 31, 2024 - 685,595,000; and March 31, 2024 - 697,800,000
Additional paid-in capital26,962 27,196 27,468 
Retained earnings (accumulated deficit)587 55 302 
Accumulated other comprehensive income (loss)(3,271)(3,469)(3,010)
Total Corteva stockholders' equity24,285 23,789 24,767 
Noncontrolling interests242 241 241 
Total equity24,527 24,030 25,008 
Total Liabilities and Equity$42,123 $40,825 $43,625 


A-3
Corteva, Inc.
Consolidated Statements of Cash Flows
(Dollars in millions, except per share amounts)

Three Months Ended
March 31,
20252024
Operating activities
Net income (loss)$656 $423 
(Income) loss from discontinued operations after income taxes11(47)
Adjustments to reconcile net income (loss) to cash provided by (used for) operating activities:
Depreciation and amortization296 307 
Provision for (benefit from) deferred income tax(122)(152)
Net periodic pension and OPEB (benefit) cost, net10 41 
Pension and OPEB contributions(51)(53)
Net (gain) loss on sales of property, businesses, consolidated companies and investments(4)(5)
Restructuring and asset related charges - net22 75 
Other net loss75 141 
Changes in assets and liabilities, net
         Accounts and notes receivable(2,505)(2,546)
         Inventories379 618 
         Accounts payable(190)(615)
         Deferred revenue(667)(700)
         Other assets and liabilities(11)(93)
Cash provided by (used for) operating activities - continuing operations$(2,101)$(2,606)
Cash provided by (used for) operating activities - discontinued operations(8)(3)
Cash provided by (used for) operating activities$(2,109)$(2,609)
Investing activities
Capital expenditures$(94)$(148)
Proceeds from sales of property, businesses and consolidated companies - net of cash divested
Purchases of investments— (132)
Proceeds from sales and maturities of investments62 
Other investing activities, net(10)(2)
Cash provided by (used for) investing activities$(34)$(270)
Financing activities
Net change in borrowings (less than 90 days)$745 $656 
Proceeds from debt637 1,675 
Payments on debt(14)(190)
Repurchase of common stock(270)(252)
Proceeds from exercise of stock options35 
Dividends paid to stockholders(116)(112)
Other financing activities, net(22)(19)
Cash provided by (used for) financing activities$995 $1,766 
Effect of exchange rate changes on cash, cash equivalents and restricted cash equivalents21 (31)
Increase (decrease) in cash, cash equivalents and restricted cash equivalents$(1,127)$(1,144)
Cash, cash equivalents and restricted cash equivalents at beginning of period3,422 3,158 
Cash, cash equivalents and restricted cash equivalents at end of period$2,295 $2,014 


A-4
Corteva, Inc.
Consolidated Segment Information
(Dollars in millions, except per share amounts)

Three Months Ended
March 31,
SEGMENT NET SALES - SEED20252024
    Corn$2,069 $2,087 
    Soybean305 292 
    Other oilseeds223 245 
    Other110 127 
Seed$2,707 $2,751 
Three Months Ended
March 31,
SEGMENT NET SALES - CROP PROTECTION20252024
    Herbicides$860 $886 
    Insecticides336 373 
    Fungicides304 295 
    Biologicals84 82 
    Other126 105 
Crop Protection$1,710 $1,741 
Three Months Ended
March 31,
GEOGRAPHIC NET SALES - SEED20252024
North America1
$1,597 $1,471 
EMEA2
826 918 
Latin America185 271 
Asia Pacific99 91 
Rest of World3
1,110 1,280 
Net Sales$2,707 $2,751 
Three Months Ended
March 31,
GEOGRAPHIC NET SALES - CROP PROTECTION20252024
North America1
$613 $616 
EMEA2
651 670 
Latin America257 244 
Asia Pacific189 211 
Rest of World3
1,097 1,125 
Net Sales$1,710 $1,741 
1. Reflects U.S. & Canada
2. Reflects Europe, Middle East, and Africa
3. Reflects EMEA, Latin America, and Asia Pacific


A-5
Corteva, Inc.
Reconciliation of Non-GAAP Measures
(Dollars in millions, except per share amounts)
Three Months Ended
March 31,
2025
Net Sales (GAAP)$4,417 
Add: Impacts from Currency and Portfolio / Other191 
Organic Sales (Non-GAAP)$4,608 
Three Months Ended
March 31,
OPERATING EBITDA20252024
Seed$842 $748 
Crop Protection377 310 
Corporate Expenses(30)(24)
Operating EBITDA (Non-GAAP)$1,189 $1,034 
RECONCILIATION OF INCOME (LOSS) FROM CONTINUING OPERATIONS AFTER INCOME TAXES TO OPERATING EBITDAThree Months Ended
March 31,
20252024
Income (loss) from continuing operations after income taxes (GAAP)$667 $376 
Provision for (benefit from) income taxes on continuing operations117 106 
Income (loss) from continuing operations before income taxes (GAAP)784 482 
Depreciation and amortization296 307 
Interest income(32)(35)
Interest expense36 41 
Exchange (gains) losses - net1
27 59 
Non-operating (benefits) costs - net2
10 52 
Mark-to-market (gains) losses on certain foreign currency contracts not designated as hedges
Significant items (benefit) charge3
59 127 
Operating EBITDA (Non-GAAP)$1,189 $1,034 
1.Refer to page A-12 for pre-tax and after tax impacts of exchange (gains) losses.
2.Non-operating (benefits) costs consists of non-operating pension and other post-employment benefit (OPEB) (credits) costs, tax indemnification adjustments and environmental remediation and legal costs associated with legacy businesses and sites. Tax indemnification adjustments relate to changes in indemnification balances, as a result of the application of the terms of the Tax Matters Agreement, between Corteva and Dow and/or DuPont that are recorded by the company as pre-tax income or expense.
3.Refer to page A-8 for pre-tax and after tax impacts of significant items.


A-6
Corteva, Inc.
Reconciliation of Non-GAAP Measures
(Dollars in millions, except per share amounts)
PRICE - VOLUME - CURRENCY ANALYSIS
REGION
Q1 2025 vs. Q1 2024Percent Change Due To:
Net Sales Change (GAAP)
Organic Change1
(Non-GAAP)
Price &Portfolio /
$%$%Product MixVolumeCurrencyOther
North America$123 %$134 %%%— %— %
EMEA(111)(7)%(8)— %%(2)%(7)%— %
Latin America(73)(14)%(4)(1)%(5)%%(13)%— %
Asia Pacific(14)(5)%(6)(2)%%(4)%(2)%(1)%
Rest of World(198)(8)%(18)(1)%— %(1)%(7)%— %
Total$(75)(2)%$116 %%%(5)%— %
SEED
Q1 2025 vs. Q1 2024Percent Change Due To:
Net Sales Change (GAAP)
Organic Change1
(Non-GAAP)
Price &Portfolio /
$%$%Product MixVolumeCurrencyOther
North America$126 %$129 %%%— %— %
EMEA(92)(10)%(26)(3)%%(6)%(7)%— %
Latin America(86)(32)%(51)(19)%(5)%(14)%(13)%— %
Asia Pacific%10 11 %12 %(1)%(2)%— %
Rest of World(170)(13)%(67)(5)%%(7)%(8)%— %
Total$(44)(2)%$62 %%(1)%(4)%— %
CROP PROTECTION
Q1 2025 vs. Q1 2024Percent Change Due To:
Net Sales Change (GAAP)
Organic Change1
(Non-GAAP)
Price &Portfolio /
$%$%Product MixVolumeCurrencyOther
North America$(3)— %$%(3)%%(1)%— %
EMEA
(19)(3)%18 %— %%(6)%— %
Latin America13 %47 19 %(5)%24 %(14)%— %
Asia Pacific(22)(10)%(16)(8)%(2)%(6)%(2)%— %
Rest of World(28)(2)%49 %(2)%%(6)%— %
Total$(31)(2)%$54 %(2)%%(5)%— %


A-7
Corteva, Inc.
Reconciliation of Non-GAAP Measures
(Dollars in millions, except per share amounts)

SEED PRODUCT LINE
Q1 2025 vs. Q1 2024Percent Change Due To:
Net Sales Change (GAAP)
Organic Change1
(Non-GAAP)
Price &Portfolio /
$%$%Product MixVolumeCurrencyOther
Corn$(18)(1)%$65 %%— %(4)%— %
Soybeans13 %15 %%%(1)%— %
Other oilseeds(22)(9)%(7)(3)%%(7)%(6)%— %
Other(17)(13)%(11)(9)%%(17)%(4)%— %
Total $(44)(2)%$62 %%(1)%(4)%— %
CROP PROTECTION PRODUCT LINE
Q1 2025 vs. Q1 2024Percent Change Due To:
Net Sales Change (GAAP)
Organic Change1
(Non-GAAP)
Price &Portfolio /
$%$%Product MixVolumeCurrencyOther
Herbicides$(26)(3)%$12 %(2)%%(4)%— %
Insecticides(37)(10)%(17)(5)%(1)%(4)%(5)%— %
Fungicides%28 %(4)%13 %(6)%— %
Biologicals%10 %(5)%15 %(8)%— %
Other21 20 %23 22 %%21 %(2)%— %
Total$(31)(2)%$54 %(2)%%(5)%— %

1.Organic sales is defined as price and volume and excludes currency and portfolio and other impacts, including significant items.


A-8
Corteva, Inc.
Significant Items
(Dollars in millions, except per share amounts)
SIGNIFICANT ITEMS BY SEGMENT (PRE-TAX)
Three Months Ended
March 31,
20252024
Seed$(40)$(16)
Crop Protection(14)(97)
Corporate(5)(14)
Total significant items before income taxes$(59)$(127)
SIGNIFICANT ITEMS - PRE-TAX, AFTER TAX, AND EPS IMPACTS
Pre-tax
After tax7
($ Per Share)
202520242025202420252024
1st Quarter
Restructuring and asset related charges - net1
$(22)$(75)$(17)$(56)$(0.02)$(0.08)
Estimated settlement expense2
— (54)— (41)— (0.06)
   Gain (loss) on sale of assets3
— — — 0.01 
   Acquisition-related costs4
— (2)— (1)— — 
   AltEn facility remediation charges5
(37)— (28)— (0.04)— 
   Income tax items6
— — 55 — 0.08 — 
1st Quarter Total
$(59)$(127)$10 $(95)$0.02 $(0.13)

1.First quarter 2025 includes restructuring and asset related benefits (charges) of $(22). The charges primarily relate to the Crop Protection Operations Strategy Restructuring Program.

First quarter 2024 includes restructuring and asset related benefits (charges) of $(75). The charges primarily relate to a $(55) charge associated with the Crop Protection Operations Strategy Restructuring Program and a $(20) charge related to non-cash accelerated prepaid royalty amortization expense related to Roundup Ready 2 Yield® and Roundup Ready 2 Xtend® herbicide tolerance traits.

2.First quarter 2024 includes estimated Lorsban® related charges of $(54).

3.First quarter 2024 includes a benefit of $4 relating related to the 2022 Restructuring Actions consisting of a gain on the sale of assets.

4.First quarter 2024 includes acquisition-related costs relating to third-party integration costs associated with the completed acquisitions of Stoller and Symborg.

5.First quarter 2025 includes a charge relating to the increase in the remediation accrual at the AltEn facility consisting of Corteva's estimated voluntary contribution to the solid waste and wastewater remedial action plans.

6.The tax only significant item benefit for the first quarter 2025 reflects a deferred tax benefit associated with a change in a legal entity's U.S. tax characterization.

7.Unless specifically addressed in notes above, the income tax effect on significant items was calculated based upon the enacted tax laws and statutory income tax rates applicable in the tax jurisdiction(s) of the underlying non-GAAP adjustment.


A-9
Corteva, Inc.
Reconciliation of Non-GAAP Measures
(Dollars in millions, except per share amounts)
Operating Earnings (Loss) Per Share (Non-GAAP)
Operating earnings (loss) per share is defined as earnings (loss) per share from continuing operations – diluted, excluding the after-tax impact of significant items, the after-tax impact of non-operating benefits (costs), the after-tax impact of amortization expense associated with intangible assets existing as of the Separation from DowDuPont, and the after-tax impact of net unrealized gain or loss from mark-to-market activity for certain foreign currency derivative instruments that do not qualify for hedge accounting.
Three Months Ended
March 31,
2025202420252024
$$EPS (diluted)EPS (diluted)
Income (loss) from continuing operations attributable to Corteva common stockholders (GAAP)$663 $372 $0.97 $0.53 
Less: Non-operating benefits (costs), after tax1
(8)(40)(0.01)(0.06)
Less: Amortization of intangibles (existing as of Separation), after tax(109)(117)(0.16)(0.17)
Less: Mark-to-market gains (losses) on certain foreign currency contracts not designated as hedges, after tax(7)(1)(0.01)— 
Less: Significant items benefit (charge), after tax10 (95)0.02 (0.13)
Operating Earnings (Loss) (Non-GAAP)2
$777 $625 $1.13 $0.89 
1.Non-operating benefits (costs) consists of non-operating pension and other post-employment benefit (OPEB) credits (costs), tax indemnification adjustments and environmental remediation and legal costs associated with legacy businesses and sites. Tax indemnification adjustments relate to changes in indemnification balances, as a result of the application of the terms of the Tax Matters Agreement, between Corteva and Dow and/or DuPont that are recorded by the company as pre-tax income or expense.
2.Refer to page A-10 for the Non-GAAP reconciliation of operating EBITDA to operating earnings (loss) per share.


A-10
Corteva, Inc.
Operating EBITDA to Operating Earnings (Loss) Per Share
(Dollars in millions, except per share amounts)

Operating EBITDA to Operating Earnings (Loss) Per Share
Three Months Ended
March 31,
20252024
Operating EBITDA (Non-GAAP)1
$1,189 $1,034 
Depreciation(134)(130)
Amortization of intangibles (post Separation)(20)(23)
Interest income32 35 
Interest expense(36)(41)
(Provision for) benefit from income taxes on continuing operations before significant items, non-operating benefits (costs), amortization of intangibles (existing as of Separation), mark-to-market gains (losses) on certain foreign currency contracts not designated as hedges, and exchange gains (losses) (Non-GAAP)1
(220)(194)
Base income tax rate from continuing operations (Non-GAAP)1
21.3 %22.1 %
Exchange gains (losses), after tax2
(30)(52)
Net (income) loss attributable to non-controlling interests(4)(4)
Operating Earnings (Loss) (Non-GAAP)1
$777 $625 
Diluted Shares (in millions)686.6 702.8 
Operating Earnings (Loss) Per Share (Non-GAAP)1
$1.13 $0.89 
1.     Refer to pages A-5 through A-7, A-9 and A-11 for Non-GAAP reconciliations.
2.     Refer to page A-12 for pre-tax and after tax impacts of exchange gains (losses).


A-11
Corteva, Inc.
Reconciliation of Non-GAAP Measures
(Dollars in millions)

Reconciliation of Base Income Tax Rate to Effective Income Tax Rate
Base income tax rate is defined as the effective income tax rate less the effect of exchange gains (losses), significant items, amortization of intangibles (existing as of Separation), mark-to-market (gains) losses on certain foreign currency contracts not designated as hedges, and non-operating (benefits) costs.
Three Months Ended
March 31,
20252024
Income (loss) from continuing operations before income taxes (GAAP)
$784 $482 
Add: Significant items (benefit) charge1
59 127 
Non-operating (benefits) costs10 52 
Amortization of intangibles (existing as of Separation)142 154 
Mark-to-market (gains) losses on certain foreign currency contracts not designated as hedges
Less: Exchange gains (losses)2
(27)(59)
Income (loss) from continuing operations before income taxes, significant items, non-operating (benefits) costs, amortization of intangibles (existing as of Separation), mark-to-market (gains) losses on certain foreign currency contracts not designated as hedges, and exchange gains (losses) (Non-GAAP)
$1,031 $875 
Provision for (benefit from) income taxes on continuing operations (GAAP)
$117 $106 
Add: Tax benefits on significant items (benefit) charge1
69 32 
Tax benefits on non-operating (benefits) costs12 
Tax benefits on amortization of intangibles (existing as of Separation)33 37 
 Tax benefits on mark-to-market (gains) losses on certain foreign currency contracts not designated as hedges— 
Tax (expenses) benefits on exchange gains (losses)2
(3)
Provision for (benefit from) income taxes on continuing operations before significant items, non-operating (benefits) costs, amortization of intangibles (existing as of Separation), mark-to-market (gains) losses on certain foreign currency contracts not designated as hedges, and exchange gains (losses) (Non-GAAP)
$220 $194 
Effective income tax rate (GAAP)
14.9 %22.0 %
Significant items, non-operating (benefits) costs, amortization of intangibles (existing as of Separation), and mark-to-market (gains) losses on certain foreign currency contracts not designated as hedges effect7.3 %0.9 %
Tax rate from continuing operations before significant items, non-operating (benefits) costs, amortization of intangibles (existing as of Separation), and mark-to-market (gains) losses on certain foreign currency contracts not designated as hedges22.2 %22.9 %
Exchange gains (losses), net effect2
(0.9)%(0.8)%
Base income tax rate from continuing operations (Non-GAAP)
21.3 %22.1 %
1. See page A-8 for further detail on the significant items table.
2. See page A-12 for further details of exchange gains (losses).


A-12
Corteva, Inc.
(Dollars in millions, except per share amounts)

Exchange Gains/Losses
The Company routinely uses foreign currency exchange contracts to offset its net exposures, by currency, related to the foreign currency-denominated monetary assets and liabilities. The objective of this program is to maintain an approximately balanced position in foreign currencies in order to minimize, on an after-tax basis, the effects of exchange rate changes on net monetary asset positions. The hedging program gains (losses) are largely taxable (tax deductible) in the United States (U.S.), whereas the offsetting exchange gains (losses) on the remeasurement of the net monetary asset positions are often not taxable (tax deductible) in their local jurisdictions. The net pre-tax exchange gains (losses) are recorded in other income (expense) - net and the related tax impact is recorded in provision for (benefit from) income taxes on continuing operations in the Consolidated Statements of Operations.
Three Months Ended
March 31,
20252024
Subsidiary Monetary Position Gain (Loss)
Pre-tax exchange gain (loss)$(47)$23 
Local tax (expenses) benefits(1)(10)
Net after-tax impact from subsidiary exchange gain (loss)$(48)$13 
Hedging Program Gain (Loss)
Pre-tax exchange gain (loss)$20 $(82)
Tax (expenses) benefits(2)17 
Net after-tax impact from hedging program exchange gain (loss)$18 $(65)
Total Exchange Gain (Loss)
Pre-tax exchange gain (loss)$(27)$(59)
Tax (expenses) benefits(3)
Net after-tax exchange gain (loss)$(30)$(52)
Non-controlling interest adjustment— 
Net after-tax exchange gain (loss) attributable to Corteva$(30)$(51)
As shown above, the "Total Exchange Gain (Loss)" is the sum of the "Subsidiary Monetary Position Gain (Loss)" and the "Hedging Program Gain (Loss)."