Exhibit 99.1
Annual Key Metrics
1
2019 Highlights
| GROWTH | ||
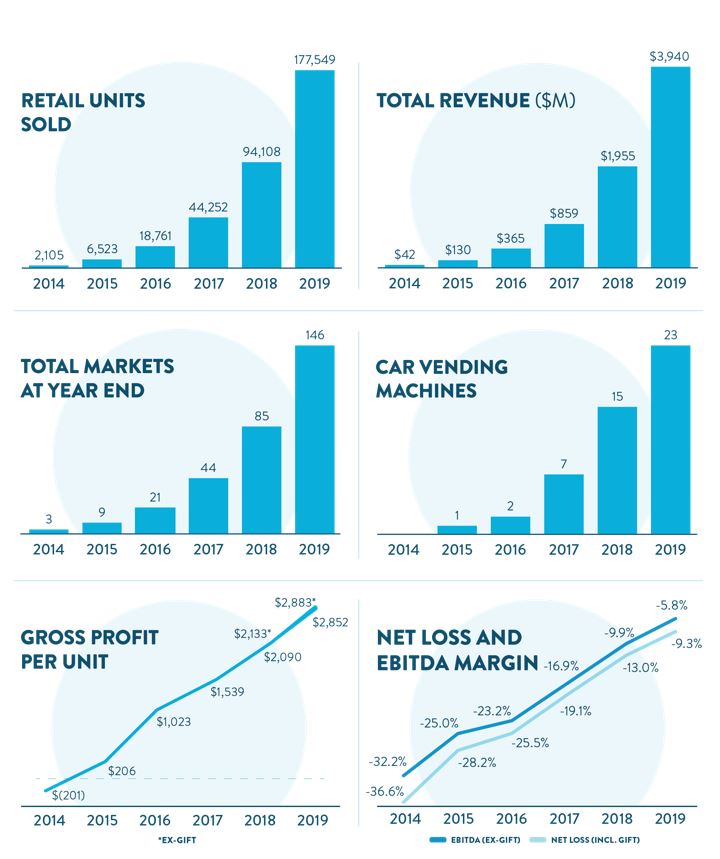
•Revenue of $3.94 billion up 101% YoY, marking our 6th consecutive year of triple digit revenue growth
•Sold more cars in 2019 than our entire history combined
•Became the third largest used automotive retailer in the U.S. while still only having ~0.5% market penetration
•Fastest organic growth of any automotive retailer in U.S. history (+83,441 retail units)
| PROFITABILITY | ||
•Increased gross profit per unit (GPU) by over $750, to over $2,850
•6th consecutive year of over $400 of GPU improvement
•Levered our Net Loss margin (incl. Gift) by 3.7%
•Levered our EBITDA margin ex-Gift by 4.1%
| BUYING CARS FROM CUSTOMERS | ||
•Bought over 104k cars from our customers, up 231% from over 31k last year
•Accelerated total transactions growth to 138% from 132% in 2018
•Sourced 43% of our retail units sold in Q4 from customers, within our long-term range one year after laying out that target
2
Dear Shareholders,
2019 was another incredible year for Carvana. We completed our sixth consecutive year of triple-digit revenue growth, while simultaneously recording six straight years of over $400 in GPU improvement, and six straight years of EBITDA margin leverage. The magnitude and consistency of these results are a testament to the quality of our customer offering, our business model, and our outstanding people.
We grew retail units sold by 89% in 2019 leading to over 83k incremental units. This unit growth represents the largest organic growth in a single year achieved by any automotive retailer in U.S. history.
Our business of buying cars from customers was another remarkable success story for Carvana and a significant contributor to our growth this year. When combining retail sales with standalone vehicle purchases from customers we accelerated our total transactions growth to 138% in 2019, up from 132% in 2018.
Our focus remains on our long-term goals of selling 2 million+ vehicles per year and becoming the largest and most profitable automotive retailer. We are working diligently to achieve these goals while constantly improving upon what we believe is already the best customer experience available when buying or selling a car.
Summary of Q4 2019 and 2019 Results
We refer to items as “including Gift” that include the impact of the compensation expense related to the 100k Milestone Gift to employees, in accordance with GAAP. We also refer to several measures presented “ex-Gift,” which exclude the 100k Milestone Gift impact and are non-GAAP metrics with reconciliations available at the end of this letter. For additional information please refer to the details provided in our Q3 2018 shareholder letter.
Q4 2019: All financial comparisons stated below are versus Q4 2018, unless otherwise noted. Complete financial tables appear at the end of this letter.
Q4 2019 GAAP Results
•Retail units sold totaled 50,370, an increase of 82%
•Revenue totaled $1.104 billion, an increase of 89%
•Total gross profit, including Gift, was $142.5 million, an increase of 154%
•Net loss, including Gift, was $125.7 million, an increase of 46%
•Basic and diluted net loss, including Gift, per Class A share was $0.82 based on 50.2 million shares of Class A common stock outstanding
Q4 2019 Ex-Gift Results, non-GAAP
•Total gross profit per unit ex-Gift was $2,854, an increase of $723
•EBITDA margin ex-Gift was (7.7%), an improvement from (10.8%)
•Adjusted net loss per Class A share, was $0.79, based on 155.6 million adjusted shares of Class A common stock outstanding, assuming the exchange of all outstanding LLC Units for shares of Class A common stock
Q4 2019 Other Results
•Opened 1 vending machine, bringing our end-of-year to 23
•Completed our fourth auto loan securitization, totaling approximately $2 billion in principal sold for the year
3
FY 2019: All financial comparisons stated below are versus FY 2018, unless otherwise noted. Complete financial tables appear at the end of this letter.
FY 2019 GAAP Results
•Retail units sold totaled 177,549, an increase of 89%
•Revenue totaled $3.94 billion, an increase of 101%
•Total gross profit, including Gift, was $506.4 million, an increase of 157%
•Net loss, including Gift, was $364.6 million, an increase of 43%
•Basic and diluted net loss, including Gift, per Class A share was $2.45 based on 46.8 million shares of Class A common stock outstanding
FY 2019 Ex-Gift Results, non-GAAP
•Total gross profit per unit ex-Gift was $2,883, an increase of $750
•EBITDA margin ex-Gift was (5.8%), an improvement from (9.9%)
•Adjusted net loss per Class A share, was $2.29, based on 153.5 million adjusted shares of Class A common stock outstanding, assuming the exchange of all outstanding LLC Units for shares of Class A common stock
Recent Events
We would also like to highlight a few recent notable accomplishments:
•Thus far in Q1 we have opened 15 markets bringing our population coverage to 68.7% from 66.9% at year-end, and opened 1 vending machine, bringing our totals as of February 26, 2020 to 161 markets and 24 vending machines
•Opened our 8th inspection and reconditioning center (IRC) near Charlotte, North Carolina
•Closed $200 million in sale-leaseback financing agreements for Charlotte and our next three IRCs
•Closed two new revolving facilities with up to $1 billion in total capacity for financing auto loans prior to securitization
4
2020 Outlook
We anticipate another year of rapid unit and revenue growth with significant improvement in GPU and EBITDA margin. Beginning in 2020, our guidance and financial reporting will no longer be reported ex-Gift because we expect less than a $500k impact from the 100k Milestone Gift in 2020, nearly all in the first quarter.
Our FY 2020 guidance is as follows. All financial comparisons stated below are versus FY 2019, unless otherwise noted.
•Retail unit sales of 255,000 – 265,000, an increase of 44% – 49%
•Revenue of $5.6 billion – $5.8 billion, an increase of 42% – 47%
•Total gross profit per unit of $3,200 – $3,400, an increase from $2,883 ex-Gift
•EBITDA margin of (3.5%) – (1.5%), an improvement from (5.8%) ex-Gift
•Serve 73%-75% of the U.S. population by year-end, up from 67% at the end of 2019
For more information regarding the non-GAAP financial measures discussed in this letter, please see the reconciliations of our non-GAAP measurements to their most directly comparable GAAP-based financial measurements included at the end of this letter. Guidance for EBITDA margin excludes depreciation and amortization expense and interest expense. We have not reconciled EBITDA margin guidance to GAAP net loss as a result of the uncertainty regarding, and the potential variability of, interest expense. Accordingly, reconciliations of the non-GAAP financial measure guidance above to the corresponding GAAP measures are not available without unreasonable effort. Depreciation and amortization expense, which is a component of the reconciliation between EBITDA margin and GAAP net loss, is expected to be between 1.0% and 1.5% of total revenues for FY 2020.
5
Buying Cars from Customers
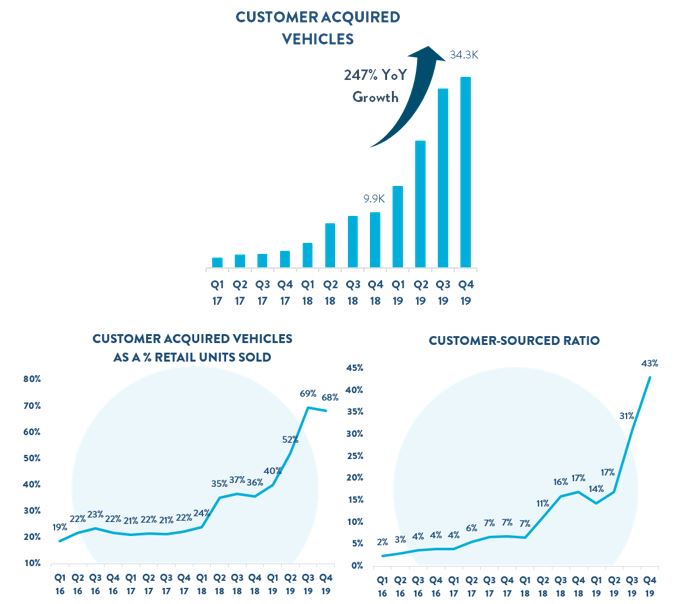
The biggest development in the business this year was our significant progress in buying cars from customers. We bought over 104k cars from customers in 2019, up 231% for the year. This momentum was highlighted in Q4 as total vehicles acquired from customers grew by 247%, which means we bought 68% as many vehicles from customers as we sold to them. Growth in vehicles acquired from customers also fed our retail inventory, diversifying our selection and improving acquisition prices. In Q4, we sourced 43% of retail units sold from customers, up from 17% in Q4 2018 and 31% last quarter.
To support this growth, we invested approximately $60 million in 2019 in incremental SG&A, the majority of which was advertising. In addition, rapidly scaling this product offering led to indirect transitional costs such as operational pinch points crowding out retail deliveries, adjustments required to optimize around increased inventory diversity, and other operational efficiency impacts. As growth ramped exponentially over the year, these impacts were most pronounced in Q4.
At our Analyst Day in November 2018, we outlined a long-term target of sourcing 38% to 52% of our retail units from customers. Just four quarters later, we were within our long-term range with 43% of our retail units sourced from customers in Q4. Our investments in building a platform for buying cars from customers are clearly paying off. The product is resonating with customers, and we expect our investments to pay significant dividends in the medium and long-term.
6
Markets and Cohorts1
2019 was another year of strong growth across our cohorts with penetration increasing in our existing markets and our newly launched markets off to the best start in our history. Several key trends in our cohorts excite us:
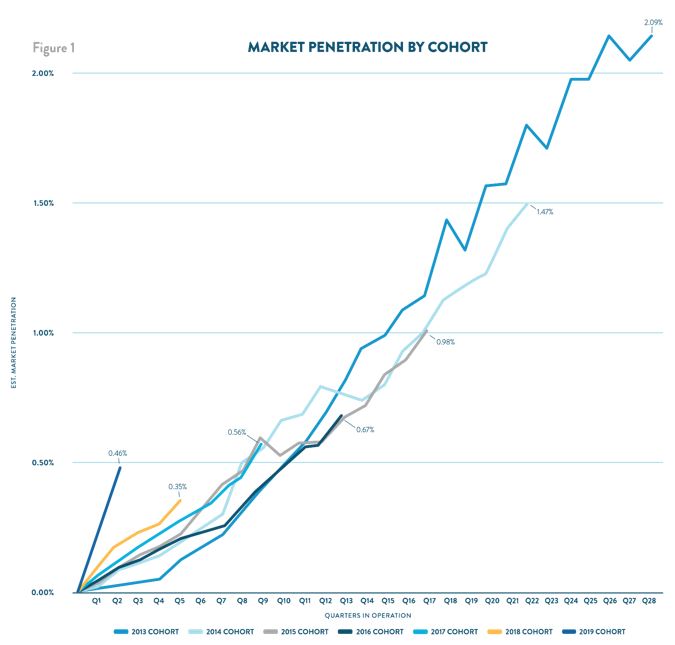
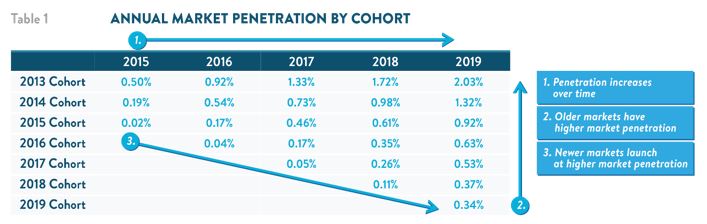
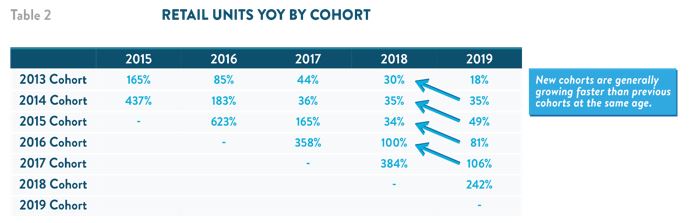
1.Our cohorts are growing rapidly. Our six existing market cohorts (2013-2018) all grew significantly in 2019. On average they grew retail units sold by 84%. Our four oldest cohorts – each more than three years old – grew by nearly 50%, and our oldest cohort of Atlanta grew by 18%, bringing its market penetration above 2% for the full year (Table 1, Table 2).
2.The growth is consistent and broad-based. 90% of our 146 markets are ramping faster than Atlanta at the same age, and 23, 7, and 2 markets have now crossed the milestones of 1.0%, 1.5%, and 2.0% market penetration, respectively. Across markets, we continue to generally see trends similar to those in past years, including newer markets, smaller markets, and more proximate markets ramping even faster than average. The breadth of our market penetration gains and consistency of our growth trends demonstrate the quality of customer experiences we are delivering across geographies and demographic groups.
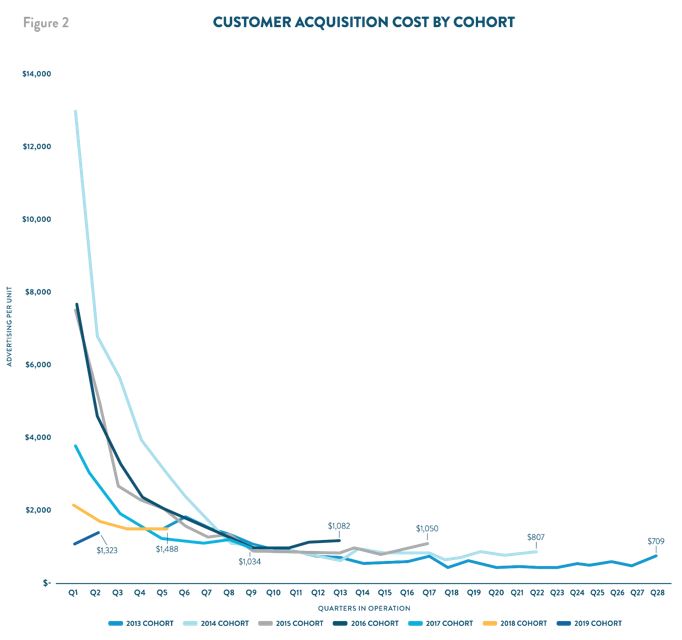
3.Our expansion model is highly replicable. Over the past three years, we have opened 23, 41, and 61 new markets. In each of these years, the newest market cohort has ramped faster and had lower advertising expense per unit than any prior cohort had in its first year (Figure 1, Figure 2). Our first-year market penetration in the 2019 cohort, which includes many smaller and more proximate markets, was significantly higher than any other in our history (Table 1). Our ability to successfully replicate our customer experience in an increasing number of markets over time reflects our model’s scalability and the strong execution of our teams.
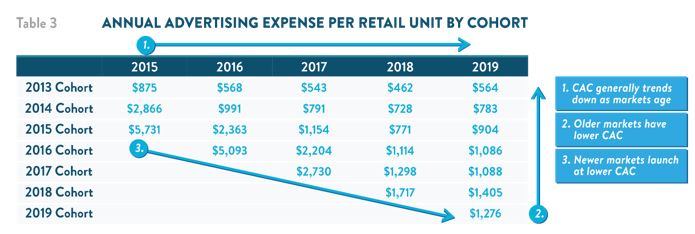
4.We are driving advertising leverage over time. In 2019, newer cohorts continued to lever advertising expense on a per retail unit basis. Our oldest cohorts, however, showed increased advertising expense on the same metric in recent periods, primarily due to increased advertising related to buying cars from customers (Figure 2, Table 3). We expect our markets to continue to lever over time toward our long-term financial model.
These patterns are a testament to our customer offering and the positive feedback inherent in our model. The rapid, consistent, and improving growth trends in our cohorts are driven over time and scale by constantly improving products, growing national brand awareness, increased selection, and an expanding delivery network.
1 The line charts that follow show the market penetration and advertising expense per unit of our seven annual market cohorts (2013 through 2019) by quarters since launch. The charts align performance of all markets in a cohort with their first quarter in operation and include data in quarters where all markets in a cohort were active (e.g. there are two data points for the 2019 cohort, five for the 2018 cohort, etc.). The annual tables in this section include these metrics for the full year 2019. Additional details on methodology are provided in our Annual Report on Form 10-K.
7
8
9
Expansion
We opened a record 61 new markets in 2019, increasing the total percentage of the U.S. population we serve in our 146 markets to 66.9%, up from 58.6% at the end of 2018. We also opened a new vending machine in the fourth quarter and 8 for the full year, bringing our total to 23. We have resumed a rapid pace of market openings in Q1, and we expect to increase our population coverage to 73%-75% while serving more than 250 markets by year-end 2020.
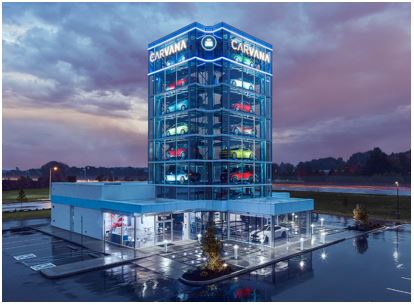
Carvana's Car Vending Machine in Memphis, Tennessee
We also made significant progress in scaling our production capacity in 2019. We ramped production at our fifth inspection and recondition center (IRC) near Indianapolis, added our sixth and seventh IRCs near Cleveland and Nashville, and commenced construction on our eighth near Charlotte, North Carolina. We have now opened our Charlotte IRC and will continue expanding our IRC footprint with a goal of ending the year with facilities capable of producing over 500k vehicles at full utilization. Our IRC pipeline puts us squarely on the path to achieving our long-term goal of 2 million + units.
For a complete list of our market opening history, estimated populations, and estimated total industry used vehicle sales by market, along with additional details on our IRCs, please see: investors.carvana.com/resources/investor-materials.
10
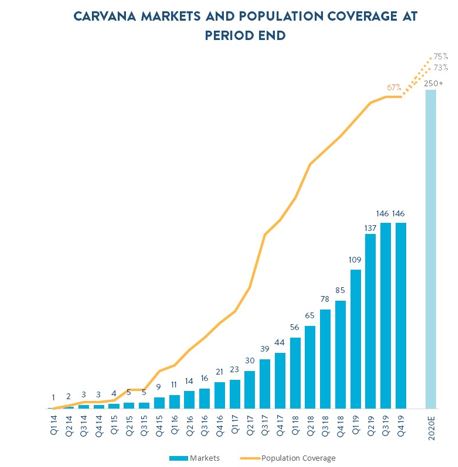
*2020E represents end-of-year total population coverage guidance and expected markets served.
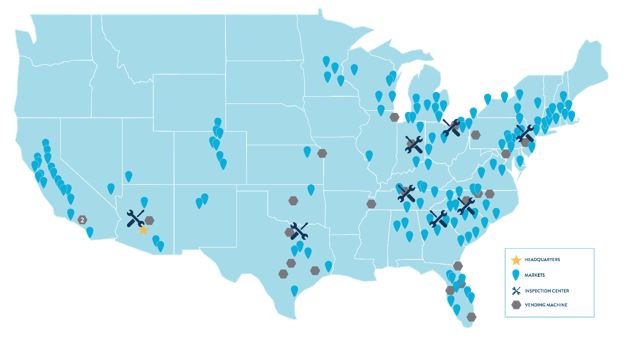
*Represents facilities and market coverage as of February 26, 2020
11
Evolution of Our Securitization Program
2019 was an exceptional year for our finance platform. We launched our first auto loan securitization in Q1 2019, entering the large and liquid securitization market, significantly expanding the investor base for the loans originated on our platform. For the full year 2019, Finance GPU increased by $308 to $962 in 2019, an increase from $654 in 2018.
We are excited about our progress and expect to continue improving the monetization of our finance platform over time. Beginning in 2020, we plan to transition to a two shelf securitization program from a single shelf securitization in 2019. We believe a two shelf securitization program with prime and nonprime pools better matches market comparables and will unlock an expanded investor base, greater liquidity, more efficient capital structures, and lower cost of funds over time.
As part of this transition, we held an additional $110 million in principal balance of loans on our balance sheet at year-end that we expect to sell in securitizations in Q1 2020. This impacted revenue, GPU, EBITDA, and liquidity resources in Q4, with an offsetting impact expected in Q1.
Following year-end, we also closed two new revolving facilities, bringing two new institutional partners to our platform and further diversifying our funding sources with capacity to finance up to $1 billion in loans prior to securitization. These replace similar facilities previously provided by Ally.
These strong positive developments speak to the quality of our finance platform and our continued progress toward our long-term goals.
12
Management Objectives
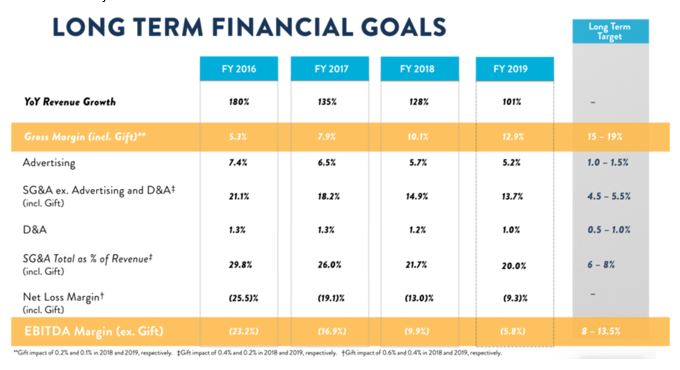
As discussed in previous shareholder letters, our management team focuses on delivering an exceptional and unparalleled customer experience while simultaneously growing the business rapidly and achieving our financial objectives. We firmly believe wowing the customer is the core of our model and drives all other metrics. To realize our long-term vision, our three primary financial objectives remain unchanged: (1) Grow Retail Units and Revenue; (2) Increase Total Gross Profit Per Unit; and (3) Demonstrate Operating Leverage.
Below we present our long-term financial model that we introduced at our Analyst Day on November 29, 2018. We believe this is the appropriate frame through which to evaluate our results and progress towards each of our financial objectives.
13
Objective #1: Grow Retail Units and Revenue
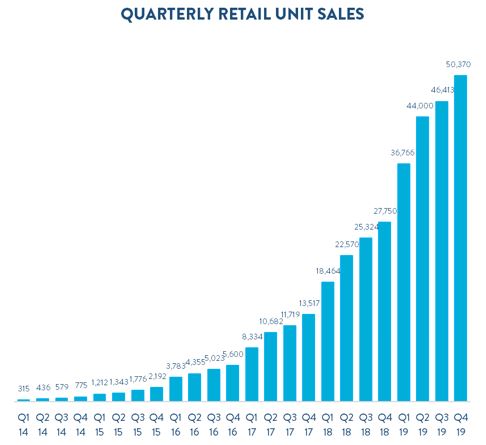
We grew units and revenue significantly again in Q4. Retail units sold increased to 50,370, up 82% from 27,750 in Q4 2018. Revenue in Q4 grew to $1.104 billion, up 89% from $584.8 million in Q4 2018. Our growth in the fourth quarter was broad-based, driven by gains across our markets nationwide.
Objective #2: Increase Total Gross Profit Per Unit
We achieved GPU of over $2,800 in the fourth quarter and full year, an increase of more than $700 in both periods. Our team continues to make progress on a number of GPU drivers to achieve our long-term financial goals, most notably buying cars from customers and monetizing our finance platform.
For Q4 2019:
•Total
◦Total GPU (incl. Gift): $2,830 vs. $2,023 in Q4 2018
◦Total GPU ex-Gift: $2,854 vs. $2,131 in Q4 2018
•Retail
◦Retail GPU (incl. Gift): $1,326 vs. $810 in Q4 2018
◦Retail GPU ex-Gift: $1,349 vs. $914 in Q4 2018
◦Gains in Retail GPU were primarily driven by a greater number of customer-sourced vehicles and incremental shipping revenue
•Wholesale
◦Wholesale GPU (incl. Gift) was $25 vs. $36 in Q4 2018
◦Wholesale GPU ex-Gift was $27 vs. $40 in Q4 2018
14
◦Changes in Wholesale GPU were driven by higher wholesale unit volume (+128%) relative to retail units (+82%), more than offset by lower gross profit per wholesale unit sold driven by continued testing of our car buying platform along with weaker seasonality ($116 incl. Gift and $125 ex-Gift vs. $212 and $236 incl. Gift and ex-Gift, respectively, in Q4 2018)
•Other
◦Other GPU was $1,479 vs. $1,177 in Q4 2018
◦Gains in Other GPU were driven by improved loan monetization from our fourth auto loan securitization, as well as higher attachment of VSC and GAP waiver coverage. Total finance GPU, including gain on loan sale and interest income net of securitization fees and expenses, was $979 in Q4 compared to $733 in Q4 2018. This was lower than $1,078 last quarter due to our decision to hold some loans as part of our transition to a two shelf securitization program in Q1. The remainder of Other GPU increased to $500 in Q4 from $444 in Q4 2018.
For FY 2019:
•Total
◦Total GPU (incl. Gift): $2,852 vs. $2,090 in FY 2018
◦Total GPU ex-Gift: $2,883 vs. $2,133 in FY 2018
◦Our GPU improvements for the year were broad-based, including gains in retail, finance, VSC and GAP, and wholesale. Our gains in retail and wholesale GPU were primarily driven by our significant growth in buying cars customers, and our gains in other GPU were primarily driven by the launch of our securitization program and higher penetration of VSCs and GAP waiver coverage. We expect further gains in all three gross profit components in 2020.
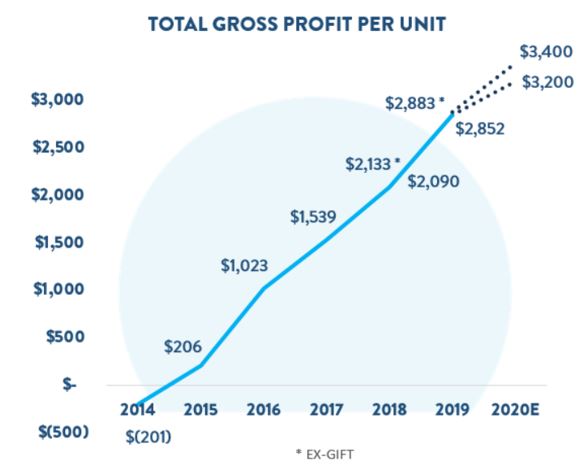
*2020E lines represent high and low end points of annual GPU guidance range, which incl. Gift impact in 2020.
15
Objective #3: Demonstrate Operating Leverage
We continued to demonstrate leverage in the business while making substantial incremental investments required to support the 247% growth in buying cars from customers in Q4 along with our expectations for total transaction growth in 2020. Net loss margin incl. Gift levered by 3.4% and EBITDA margin ex-Gift levered by 3.1% in Q4.
For Q4 2019:
•Total SG&A incl. Gift and ex-Gift each levered by 0.4%, primarily reflecting benefits from scale offset by investments to support buying cars from customers and to relieve operational pinch points
•Compensation and benefits incl. Gift and ex-Gift each levered by 0.8%, primarily reflecting benefits from scale offset by additional hiring to support buying cars from customers
•Advertising levered by 0.1%, which includes the effect of advertising focused on buying cars from customers
•Logistics and market occupancy levered by 0.3%, reflecting improving efficiency and volumes through our fulfillment network
•Other SG&A increased by 0.8%, primarily reflecting expenses related to buying cars from customers, changing inventory mix, and additional investments in technology
For FY 2019:
•Total SG&A levered by 1.7% incl. Gift and 1.5% ex-Gift, primarily reflecting benefits from scale
•Compensation and benefits levered by 0.9% incl. Gift and 0.7% ex-Gift, primarily reflecting benefits from scale offset by additional hiring to support buying cars from customers
•Advertising levered by 0.5%, reflecting leverage in existing markets and lower initial CACs in new markets offset by the introduction of advertising focused on buying cars from customers
•Logistics and market occupancy levered by 0.4%, reflecting improving efficiency and volumes through our fulfillment network
•Other SG&A increased by 0.1%, primarily reflecting expenses related to buying cars from customers, changing inventory mix, and additional investments in technology
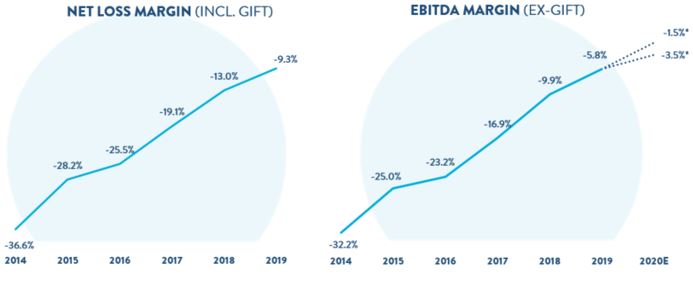
*2020E lines represent high and low end points of annual EBITDA Margin guidance range, which incl. Gift in 2020.
16
Summary
2019 was another incredible year for Carvana and another significant step toward achieving our mission of changing the way people buy cars.
It was a year of significant growth, GPU expansion, and continued leverage in our march toward profitability. It was also a year in which we made significant fundamental progress further vertically integrating our platform. Using our brand, transaction technology, and logistics network to buy cars from our customers is cutting additional cost out of the system and giving us a new way to give even more customers their first Carvana experience.
Our plan is working. We are well on our way to selling 2 million+ cars per year and to becoming the largest and most profitable automotive retailer. We are a team of thousands of incredible people. We are ambitious. We are motivated. We are energized. And we are still just getting started.
Sincerely,
Ernie Garcia, III, Chairman and CEO
Mark Jenkins, CFO
17
Appendix
Conference Call Details
Carvana will host a conference call today, February 26, 2020, at 5:30 p.m. EST (2:30 p.m. PST) to discuss financial results. To participate in the live call, analysts and investors should dial (833) 255-2830 or (412) 902-6715, and ask for “Carvana Earnings.” A live audio webcast of the conference call along with supplemental financial information will also be accessible on the company's website at investors.carvana.com. Following the webcast, an archived version will also be available on the Investor Relations section of the company’s website. A telephonic replay of the conference call will be available until March 4, 2020, by dialing (877) 344-7529 or (412) 317-0088 and entering passcode 10138469#.
Forward Looking Statements
This letter contains forward-looking statements within the meaning of the Private Securities Litigation Reform Act of 1995. These forward-looking statements reflect Carvana’s current expectations and projections with respect to, among other things, its financial condition, results of operations, plans, objectives, future performance, and business. These statements may be preceded by, followed by or include the words "aim," "anticipate," "believe," "estimate," "expect," "forecast," "intend," "likely," "outlook," "plan," "potential," "project," "projection," "seek," "can," "could," "may," "should," "would," "will," the negatives thereof and other words and terms of similar meaning.
Forward-looking statements include all statements that are not historical facts. Such forward-looking statements are subject to various risks and uncertainties. Accordingly, there are or will be important factors that could cause actual outcomes or results to differ materially from those indicated in these statements. Among these factors are risks related to the “Risk Factors” identified in our Annual Report on Form 10-K for 2019.
There is no assurance that any forward-looking statements will materialize. You are cautioned not to place undue reliance on forward-looking statements, which reflect expectations only as of this date. Carvana does not undertake any obligation to publicly update or review any forward-looking statement, whether as a result of new information, future developments, or otherwise.
Use of Non-GAAP Financial Measures
As appropriate, we supplement our results of operations determined in accordance with U.S. generally accepted accounting principles (“GAAP”) with certain non-GAAP financial measurements that are used by management, and which we believe are useful to investors, as supplemental operational measurements to evaluate our financial performance. These measurements should not be considered in isolation or as a substitute for reported GAAP results because they may include or exclude certain items as compared to similar GAAP-based measurements, and such measurements may not be comparable to similarly-titled measurements reported by other companies. Rather, these measurements should be considered as an additional way of viewing aspects of our operations that provide a more complete understanding of our business. We strongly encourage investors to review our consolidated financial statements included in publicly filed reports in their entirety and not rely solely on any one, single financial measurement or communication.
Reconciliations of our non-GAAP measurements to their most directly comparable GAAP-based financial measurements are included at the end of this letter.
Investor Relations Contact Information: Mike Levin, [email protected]
18
CARVANA CO. AND SUBSIDIARIES
CONSOLIDATED BALANCE SHEETS
(In thousands, except per share amounts)
| December 31, | |||||||||||
| 2019 | 2018 | ||||||||||
| ASSETS | |||||||||||
| Current assets: | |||||||||||
| Cash and cash equivalents | $ | 76,016 | $ | 78,861 | |||||||
| Restricted cash | 42,443 | 9,848 | |||||||||
| Accounts receivable, net | 39,864 | 33,120 | |||||||||
| Finance receivables held for sale, net | 286,969 | 105,200 | |||||||||
| Vehicle inventory | 762,696 | 412,243 | |||||||||
| Beneficial interests in securitizations | 98,780 | — | |||||||||
| Other current assets | 52,654 | 23,582 | |||||||||
| Total current assets | 1,359,422 | 662,854 | |||||||||
| Property and equipment, net | 543,471 | 296,839 | |||||||||
Operating lease right-of-use assets, including $44,583 and $0, respectively, from leases with related parties | 123,420 | — | |||||||||
| Intangible assets, net | 7,232 | 8,869 | |||||||||
| Goodwill | 9,353 | 9,353 | |||||||||
Other assets, including $6,138 and $1,895, respectively, due from related parties | 14,850 | 13,098 | |||||||||
| Total assets | $ | 2,057,748 | $ | 991,013 | |||||||
| LIABILITIES & STOCKHOLDERS' EQUITY | |||||||||||
| Current liabilities: | |||||||||||
Accounts payable and accrued liabilities, including $9,549 and $3,891, respectively, due to related parties | $ | 234,443 | $ | 121,415 | |||||||
| Short-term revolving facilities | 568,840 | 196,963 | |||||||||
| Current portion of long-term debt | 48,731 | 11,133 | |||||||||
Other current liabilities, including $4,518 and $0, respectively, from leases with related parties | 12,856 | — | |||||||||
| Total current liabilities | 864,870 | 329,511 | |||||||||
Long-term debt, excluding current portion, including $15,000 held by a related party | 883,060 | 425,349 | |||||||||
Operating lease liabilities, excluding current portion, including $41,829 and $0, respectively, from leases with related parties | 116,071 | — | |||||||||
| Other liabilities | 1,808 | 8,725 | |||||||||
| Total liabilities | 1,865,809 | 763,585 | |||||||||
Commitments and contingencies | |||||||||||
| Stockholders' equity: | |||||||||||
Preferred stock, $0.01 par value - 50,000 shares authorized, and none issued and outstanding as of December 31, 2019 and 2018, respectively | — | — | |||||||||
Class A common stock, $0.001 par value - 500,000 shares authorized, 50,507 and 41,208 shares issued and outstanding as of December 31, 2019 and 2018, respectively | 51 | 41 | |||||||||
Class B common stock, $0.001 par value - 125,000 shares authorized, 101,219 and 104,336 shares issued and outstanding as of December 31, 2019 and 2018, respectively | 101 | 104 | |||||||||
| Additional paid in capital | 280,994 | 147,916 | |||||||||
| Accumulated deficit | (183,034) | (68,375) | |||||||||
| Total stockholders' equity attributable to Carvana Co. | 98,112 | 79,686 | |||||||||
| Non-controlling interests | 93,827 | 147,742 | |||||||||
| Total stockholders' equity | 191,939 | 227,428 | |||||||||
| Total liabilities & stockholders' equity | $ | 2,057,748 | $ | 991,013 | |||||||
19
CARVANA CO. AND SUBSIDIARIES
CONSOLIDATED STATEMENTS OF OPERATIONS
(In thousands, except per share amounts)
| Three Months Ended December 31, | Years Ended December 31, | ||||||||||||||||||||||||||||
| 2019 | 2018 | 2019 | 2018 | ||||||||||||||||||||||||||
| (unaudited) | |||||||||||||||||||||||||||||
| Sales and operating revenues: | |||||||||||||||||||||||||||||
| Used vehicle sales, net | $ | 949,971 | $ | 526,798 | $ | 3,420,601 | $ | 1,785,045 | |||||||||||||||||||||
| Wholesale vehicle sales | 79,112 | 25,389 | 267,586 | 73,584 | |||||||||||||||||||||||||
Other sales and revenues, including $19,291, $9,221, $59,677, and $25,572, respectively, from related parties | 74,505 | 32,651 | 251,709 | 96,838 | |||||||||||||||||||||||||
| Net sales and operating revenues | 1,103,588 | 584,838 | 3,939,896 | 1,955,467 | |||||||||||||||||||||||||
Cost of sales, including $870, $1,229, $4,357, and $4,772, respectively, to related parties | 961,041 | 528,704 | 3,433,482 | 1,758,758 | |||||||||||||||||||||||||
| Gross profit | 142,547 | 56,134 | 506,414 | 196,709 | |||||||||||||||||||||||||
Selling, general and administrative expenses, including $3,985, $2,198, $13,869, and $8,217, respectively, to related parties | 241,663 | 130,652 | 786,717 | 425,258 | |||||||||||||||||||||||||
Interest expense, including $333, $333, $1,331, and $370, respectively, to related parties | 24,653 | 11,663 | 80,606 | 25,018 | |||||||||||||||||||||||||
| Other expense, net | 1,971 | 223 | 3,730 | 1,178 | |||||||||||||||||||||||||
| Net loss before income taxes | (125,740) | (86,404) | (364,639) | (254,745) | |||||||||||||||||||||||||
| Income tax provision | — | — | — | — | |||||||||||||||||||||||||
| Net loss | (125,740) | (86,404) | (364,639) | (254,745) | |||||||||||||||||||||||||
| Net loss attributable to non-controlling interests | (84,607) | (63,978) | (249,980) | (199,269) | |||||||||||||||||||||||||
| Net loss attributable to Carvana Co. | (41,133) | (22,426) | (114,659) | (55,476) | |||||||||||||||||||||||||
| Dividends on Class A convertible preferred stock | — | (256) | — | (4,206) | |||||||||||||||||||||||||
| Accretion of beneficial conversion feature on Class A convertible preferred stock | — | — | — | (1,380) | |||||||||||||||||||||||||
| Net loss attributable to Class A common stockholders | $ | (41,133) | $ | (22,682) | $ | (114,659) | $ | (61,062) | |||||||||||||||||||||
| Net loss per share of Class A common stock, basic and diluted | $ | (0.82) | $ | (0.58) | $ | (2.45) | $ | (2.03) | |||||||||||||||||||||
Weighted-average shares of Class A common stock, basic and diluted(1) | 50,211 | 39,392 | 46,847 | 30,043 | |||||||||||||||||||||||||
(1) Weighted-average shares of Class A common stock outstanding have been adjusted for unvested restricted stock awards.
20
CARVANA CO. AND SUBSIDIARIES
CONSOLIDATED STATEMENTS OF CASH FLOWS
(In thousands)
| For the Years Ended December 31, | |||||||||||||||||
| 2019 | 2018 | 2017 | |||||||||||||||
| Cash Flows from Operating Activities: | |||||||||||||||||
| Net loss | $ | (364,639) | $ | (254,745) | $ | (164,316) | |||||||||||
| Adjustments to reconcile net loss to net cash used in operating activities: | |||||||||||||||||
| Depreciation and amortization expense | 41,265 | 23,539 | 11,568 | ||||||||||||||
| Loss on disposal of property and equipment | 1,714 | 575 | 958 | ||||||||||||||
| Provision for bad debt and valuation allowance | 11,922 | 1,917 | 1,375 | ||||||||||||||
| Gain on loan sales | (137,301) | (51,729) | (21,697) | ||||||||||||||
| Equity-based compensation expense | 33,063 | 24,095 | 5,611 | ||||||||||||||
| Amortization and write-off of debt issuance costs and bond premium | 5,541 | 2,305 | 1,646 | ||||||||||||||
| Originations of finance receivables | (2,625,351) | (1,259,539) | (529,153) | ||||||||||||||
| Proceeds from sale of finance receivables, net | 2,643,912 | 1,633,519 | 527,265 | ||||||||||||||
| Purchase of finance receivables | (161,781) | (387,445) | — | ||||||||||||||
| Principal payments received on finance receivables held for sale | 85,017 | — | — | ||||||||||||||
| Unrealized loss on beneficial interest in securitization | 964 | — | — | ||||||||||||||
| Changes in assets and liabilities: | |||||||||||||||||
| Accounts receivable | (9,741) | (19,212) | (8,715) | ||||||||||||||
| Vehicle inventory | (344,861) | (183,068) | (40,839) | ||||||||||||||
| Other assets | (32,619) | (12,249) | (7,624) | ||||||||||||||
| Accounts payable and accrued liabilities | 97,912 | 68,550 | 16,904 | ||||||||||||||
| Operating lease right-of-use assets | (46,928) | — | — | ||||||||||||||
| Operating lease liabilities | 45,195 | — | — | ||||||||||||||
| Other liabilities | (418) | (853) | 7,093 | ||||||||||||||
| Net cash used in operating activities | (757,134) | (414,340) | (199,924) | ||||||||||||||
| Cash Flows from Investing Activities: | |||||||||||||||||
| Purchases of property and equipment, including $6,282 in 2019 from related parties | (230,538) | (143,668) | (78,490) | ||||||||||||||
| Principal payments received on beneficial interests in securitizations | 2,799 | — | — | ||||||||||||||
| Business acquisitions, net of cash acquired | — | (6,670) | — | ||||||||||||||
| Net cash used in investing activities | (227,739) | (150,338) | (78,490) | ||||||||||||||
| Cash Flows from Financing Activities: | |||||||||||||||||
| Proceeds from short-term revolving facilities | 4,485,917 | 1,848,051 | 949,144 | ||||||||||||||
| Payments on short-term revolving facilities | (4,219,415) | (1,899,880) | (865,665) | ||||||||||||||
Proceeds from issuance of long-term debt, including $25,000(1) in 2018 from related parties | 481,772 | 399,063 | 32,698 | ||||||||||||||
| Payments on long-term debt | (15,683) | (35,522) | (2,259) | ||||||||||||||
| Proceeds from Verde Credit Facility | — | — | 35,000 | ||||||||||||||
| Payments on Verde Credit Facility | — | — | (35,000) | ||||||||||||||
| Payments of debt issuance costs, including $1,000 in 2017 to related parties | (11,445) | (11,390) | (2,055) | ||||||||||||||
| Net proceeds from issuance of Class A common stock | 297,611 | 172,287 | 206,198 | ||||||||||||||
| Net proceeds from issuance of Class A Convertible Preferred Stock | — | (12) | 98,682 | ||||||||||||||
| Proceeds from exercise of stock options | 1,696 | 795 | 48 | ||||||||||||||
| Tax withholdings related to restricted stock units and awards | (5,830) | (2,509) | (704) | ||||||||||||||
| Dividends paid on Class A Convertible Preferred Stock | — | (4,619) | — | ||||||||||||||
| Net cash provided by financing activities | 1,014,623 | 466,264 | 416,087 | ||||||||||||||
| Net increase (decrease) in cash and cash equivalents | 29,750 | (98,414) | 137,673 | ||||||||||||||
| Cash, cash equivalents, and restricted cash at beginning of period | 88,709 | 187,123 | 49,450 | ||||||||||||||
| Cash, cash equivalents, and restricted cash at end of period | $ | 118,459 | $ | 88,709 | $ | 187,123 | |||||||||||
(1) A related party initially acquired $25.0 million of the senior unsecured notes during the year ended December 31, 2018, of which it subsequently disposed of $10.0 million, and held $15.0 million as of both December 31, 2019 and December 31, 2018.
21
CARVANA CO. AND SUBSIDIARIES
RECONCILIATION OF GAAP TO NON-GAAP FINANCIAL MEASURES
(Unaudited)
Adjusted Net Loss and Adjusted Net Loss per Share
Adjusted net loss represents net loss attributable to Carvana Co. assuming the full exchange of all outstanding LLC Units for shares of Class A common stock and excluding the compensation expense associated with the 100k Milestone Gift. Adjusted net loss per share is calculated by dividing adjusted net loss by the weighted-average shares of Class A common stock outstanding assuming (i) the full exchange of all outstanding LLC Units, (ii) shares issued in the IPO were outstanding for the entire period presented and (iii) outstanding LLC Units immediately following the Organizational Transactions related to our IPO, including conversion of the Class C Redeemable Preferred Units, were outstanding for all periods prior to the IPO.
Adjusted net loss and adjusted net loss per share are supplemental measures of operating performance that do not represent and should not be considered alternatives to net loss and net loss per share, as determined under GAAP. We believe that by assuming the full exchange of all outstanding LLC Units and excluding the expense associated with the 100k Milestone Gift for the reasons described above, adjusted net loss and adjusted net loss per share supplement GAAP measures and enable us and our investors to more effectively evaluate our performance period-over-period and relative to our competitors that have different organizational and tax structures because the assumption eliminates the effect of any changes in net income attributable to Carvana Co. driven by increases in our ownership of Carvana Group, LLC as well as the expense associated with the 100k Milestone Gift, which are unrelated to our operating performance.
A reconciliation of adjusted net loss to net loss attributable to Carvana Co., the most directly comparable GAAP measure, and the computation of adjusted net loss per share are as follows (in thousands, except per share amounts):
| Three Months Ended | ||||||||||||||||||||||||||||||||||||||||||||||||||||||||
| Mar 31, 2018 | Jun 30, 2018 | Sep 30, 2018 | Dec 31, 2018 | Mar 31, 2019 | Jun 30, 2019 | Sep 30, 2019 | Dec 31, 2019 | |||||||||||||||||||||||||||||||||||||||||||||||||
| Numerator: | ||||||||||||||||||||||||||||||||||||||||||||||||||||||||
| Net loss attributable to Carvana Co. | $ | (7,043) | $ | (9,965) | $ | (16,042) | $ | (22,426) | $ | (23,115) | $ | (20,323) | $ | (30,088) | $ | (41,133) | ||||||||||||||||||||||||||||||||||||||||
| Net loss attributable to non-controlling interests | (45,629) | (41,285) | (48,377) | (63,978) | (59,481) | (43,736) | (62,156) | (84,607) | ||||||||||||||||||||||||||||||||||||||||||||||||
| Dividends on Class A convertible preferred stock | (1,345) | (1,375) | (1,230) | (256) | — | — | — | — | ||||||||||||||||||||||||||||||||||||||||||||||||
| Accretion of beneficial conversion feature on Class A convertible preferred stock | (1,380) | — | — | — | — | — | — | — | ||||||||||||||||||||||||||||||||||||||||||||||||
| 100k Milestone Gift | — | — | 7,761 | 4,060 | 2,974 | 3,326 | 4,426 | 2,493 | ||||||||||||||||||||||||||||||||||||||||||||||||
| Adjusted net loss attributable to Carvana Co. Class A common stock | $ | (55,397) | $ | (52,625) | $ | (57,888) | $ | (82,600) | $ | (79,622) | $ | (60,733) | $ | (87,818) | $ | (123,247) | ||||||||||||||||||||||||||||||||||||||||
| Denominator: | ||||||||||||||||||||||||||||||||||||||||||||||||||||||||
Weighted-average shares of Class A common stock outstanding (1) | 18,346 | 27,780 | 34,655 | 39,392 | 41,352 | 46,038 | 49,787 | 50,211 | ||||||||||||||||||||||||||||||||||||||||||||||||
| Adjustments: | ||||||||||||||||||||||||||||||||||||||||||||||||||||||||
| Weighted-average assumed exchange of LLC Units for shares of Class A common stock | 118,858 | 114,897 | 111,157 | 109,974 | 108,974 | 106,377 | 105,733 | 105,407 | ||||||||||||||||||||||||||||||||||||||||||||||||
| Adjusted shares of Class A common stock outstanding | 137,204 | 142,677 | 145,812 | 149,366 | 150,326 | 152,415 | 155,520 | 155,618 | ||||||||||||||||||||||||||||||||||||||||||||||||
| Adjusted net loss per share | $ | (0.40) | $ | (0.37) | $ | (0.40) | $ | (0.55) | $ | (0.53) | $ | (0.40) | $ | (0.56) | $ | (0.79) | ||||||||||||||||||||||||||||||||||||||||
(1) Excludes portions of unvested restricted stock awards and vested and unvested stock options outstanding because they were determined to be anti-dilutive.
22
CARVANA CO. AND SUBSIDIARIES
RECONCILIATION OF GAAP TO NON-GAAP FINANCIAL MEASURES (continued)
(Unaudited)
Gross Profit ex-Gift and Gross Profit per Unit ex-Gift
Gross Profit ex-Gift and Gross Profit per Unit ex-Gift are non-GAAP supplemental measures of operating performance that do not represent and should not be considered an alternative to gross profit, as determined by GAAP. Gross Profit ex-Gift is defined as gross profit before compensation expense related to the 100k Milestone Gift included in cost of sales. Gross Profit per Unit ex-Gift is Gross Profit ex-Gift divided by units sold. We use Gross Profit ex-Gift to measure the operating performance of our business and Gross Profit per Unit ex-Gift to measure our operating performance relative to our units sold. We believe that Gross Profit ex-Gift and Gross Profit per Unit ex-Gift are useful measures to us and to our investors because they exclude the expense associated with the 100k Milestone Gift recognized in cost of sales. We expect the 100k Milestone Gift to be a one-time award program for which we will recognize varying amounts of expense beginning in the second half of 2018 and continuing through the first half of 2020, and therefore we believe the related expense does not reflect our core operations, is not included in our past operations, and may not be indicative of our future operations. Additionally, the shares issued to settle the 100k Milestone Gift are offset by share contributions from Mr. Garcia to the Company, therefore we expect the impact on shares outstanding to be nearly zero. We believe that excluding it enables us to more effectively evaluate our performance period-over-period and relative to our competitors.
| Three Months Ended | Years Ended | ||||||||||||||||||||||
| December 31, 2019 | December 31, 2018 | December 31, 2019 | December 31, 2018 | ||||||||||||||||||||
| Used vehicle gross profit | $ | 66,792 | $ | 22,482 | $ | 237,855 | $ | 94,319 | |||||||||||||||
| 100k Milestone Gift in used vehicle cost of sales | 1,139 | 2,889 | 5,092 | 3,870 | |||||||||||||||||||
| Used Vehicle Gross Profit ex-Gift | $ | 67,931 | $ | 25,371 | $ | 242,947 | $ | 98,189 | |||||||||||||||
| Used vehicle unit sales | 50,370 | 27,750 | 177,549 | 94,108 | |||||||||||||||||||
| Used Vehicle Gross Profit per Unit ex-Gift | $ | 1,349 | $ | 914 | $ | 1,368 | $ | 1,043 | |||||||||||||||
| Wholesale vehicle gross profit | $ | 1,250 | $ | 1,001 | $ | 16,850 | $ | 5,552 | |||||||||||||||
| 100k Milestone Gift in wholesale vehicle cost of sales | 91 | 113 | 358 | 133 | |||||||||||||||||||
| Wholesale Vehicle Gross Profit ex-Gift | $ | 1,341 | $ | 1,114 | $ | 17,208 | $ | 5,685 | |||||||||||||||
| Wholesale vehicle unit sales | 10,740 | 4,717 | 39,895 | 15,125 | |||||||||||||||||||
| Wholesale Vehicle Gross Profit per Unit ex-Gift | $ | 125 | $ | 236 | $ | 431 | $ | 376 | |||||||||||||||
| Total gross profit | $ | 142,546 | $ | 56,134 | $ | 506,414 | $ | 196,709 | |||||||||||||||
| 100k Milestone Gift in total cost of sales | 1,230 | 3,002 | 5,450 | 4,003 | |||||||||||||||||||
| Total Gross Profit ex-Gift | $ | 143,776 | $ | 59,136 | $ | 511,864 | $ | 200,712 | |||||||||||||||
| Used vehicle unit sales | 50,370 | 27,750 | 177,549 | 94,108 | |||||||||||||||||||
| Total Gross Profit per Unit ex-Gift | $ | 2,854 | $ | 2,131 | $ | 2,883 | $ | 2,133 | |||||||||||||||
23
CARVANA CO. AND SUBSIDIARIES
RECONCILIATION OF GAAP TO NON-GAAP FINANCIAL MEASURES (continued)
(Unaudited)
EBITDA ex-Gift and EBITDA Margin ex-Gift
EBITDA ex-Gift and EBITDA Margin ex-Gift are non-GAAP supplemental measures of operating performance that do not represent and should not be considered an alternative to net loss or cash flow from operations, as determined by GAAP. EBITDA ex-Gift is defined as net loss before interest expense, income tax expense, depreciation and amortization expense, and the compensation expense related to the 100k Milestone Gift. EBITDA Margin ex-Gift is EBITDA ex-Gift as a percentage of total revenues. We use EBITDA ex-Gift to measure the operating performance of our business and EBITDA Margin ex-Gift to measure our operating performance relative to our total revenues. We believe that EBITDA ex-Gift and EBITDA Margin ex-Gift are useful measures to us and to our investors because they exclude certain financial and capital structure items and the expense associated with the 100k Milestone Gift that we do not believe directly reflect our core operations and may not be indicative of our recurring operations, in part because they may vary widely across time and within our industry independent of the performance of our core operations. In particular, we expect the 100k Milestone Gift to be a one-time award program for which we will recognize varying amounts of expense beginning in the second half of 2018 and continuing through the first half of 2020, and therefore we believe the related expense does not reflect our core operations, is not included in our past operations, and may not be indicative of our future operations. Additionally, the shares issued to settle the 100k Milestone Gift are offset by share contributions from Mr. Garcia to the Company, therefore we expect the impact on shares outstanding to be nearly zero. We believe that excluding these items enables us to more effectively evaluate our performance period-over-period and relative to our competitors. EBITDA ex-Gift and EBITDA Margin ex-Gift may not be comparable to similarly titled measures provided by other companies due to potential differences in methods of calculations. A reconciliation of EBITDA ex-Gift to net loss which includes 100k Milestone Gift expense and is the most directly comparable GAAP measure, and calculation of EBITDA Margin ex-Gift is as follows (dollars in thousands):
| Three Months Ended | |||||||||||||||||||||||||||||||||||||||||||||||
| Mar 31, 2018 | Jun 30, 2018 | Sep 30, 2018 | Dec 31, 2018 | Mar 31, 2019 | Jun 30, 2019 | Sep 30, 2019 | Dec 31, 2019 | ||||||||||||||||||||||||||||||||||||||||
| Net loss | $ | (52,672) | $ | (51,250) | $ | (64,419) | $ | (86,404) | $ | (82,596) | $ | (64,059) | $ | (92,244) | $ | (125,740) | |||||||||||||||||||||||||||||||
| Depreciation and amortization expense | 4,605 | 5,257 | 6,439 | 7,238 | 7,943 | 8,887 | 10,675 | 13,760 | |||||||||||||||||||||||||||||||||||||||
| Interest expense | 3,541 | 4,165 | 5,649 | 11,663 | 15,648 | 19,315 | 20,990 | 24,653 | |||||||||||||||||||||||||||||||||||||||
| 100k Milestone Gift | — | — | 7,761 | 4,060 | 2,974 | 3,326 | 4,426 | 2,493 | |||||||||||||||||||||||||||||||||||||||
| EBITDA ex-Gift | $ | (44,526) | $ | (41,828) | $ | (44,570) | $ | (63,443) | $ | (56,031) | $ | (32,531) | $ | (56,153) | $ | (84,834) | |||||||||||||||||||||||||||||||
| Total revenues | $ | 360,422 | $ | 475,286 | $ | 534,921 | $ | 584,838 | $ | 755,234 | $ | 986,221 | $ | 1,094,854 | $ | 1,103,587 | |||||||||||||||||||||||||||||||
| Net Loss Margin | (14.6) | % | (10.8) | % | (12.0) | % | (14.8) | % | (10.9) | % | (6.5) | % | (8.4) | % | (11.4) | % | |||||||||||||||||||||||||||||||
| EBITDA Margin ex-Gift | (12.4) | % | (8.8) | % | (8.3) | % | (10.8) | % | (7.4) | % | (3.3) | % | (5.1) | % | (7.7) | % | |||||||||||||||||||||||||||||||
24
CARVANA CO. AND SUBSIDIARIES
RECONCILIATION OF GAAP TO NON-GAAP FINANCIAL MEASURES (continued)
(Unaudited)
| For the Years Ended December 31, | ||||||||||||||||||||||||||||||||||||||
| 2019 | 2018 | 2017 | 2016 | 2015 | 2014 | |||||||||||||||||||||||||||||||||
| Net loss | $ | (364,639) | $ | (254,745) | $ | (164,316) | $ | (93,112) | $ | (36,780) | $ | (15,238) | ||||||||||||||||||||||||||
| Depreciation and amortization expense | 41,265 | 23,539 | 11,568 | 4,658 | 2,800 | 1,705 | ||||||||||||||||||||||||||||||||
| Interest expense | 80,606 | 25,018 | 7,659 | 3,587 | 1,412 | 108 | ||||||||||||||||||||||||||||||||
| 100k Milestone Gift | 13,219 | 11,821 | — | — | — | — | ||||||||||||||||||||||||||||||||
| EBITDA ex-Gift | $ | (229,549) | $ | (194,367) | $ | (145,089) | $ | (84,867) | $ | (32,568) | $ | (13,425) | ||||||||||||||||||||||||||
| Total revenues | $ | 3,939,896 | $ | 1,955,467 | $ | 858,870 | $ | 365,148 | $ | 130,392 | $ | 41,679 | ||||||||||||||||||||||||||
| Net Loss Margin | (9.3) | % | (13.0) | % | (19.1) | % | (25.5) | % | (28.2) | % | (36.6) | % | ||||||||||||||||||||||||||
| EBITDA Margin ex-Gift | (5.8) | % | (9.9) | % | (16.9) | % | (23.2) | % | (25.0) | % | (32.2) | % | ||||||||||||||||||||||||||
25
CARVANA CO. AND SUBSIDIARIES
RESULTS OF OPERATIONS
(Unaudited)
| Three Months Ended | ||||||||||||||||||||||||||||||||||||||||||||||||||
| Mar 31, 2018 | Jun 30, 2018 | Sep 30, 2018 | Dec 31, 2018 | Mar 31, 2019 | Jun 30, 2019 | Sep 30, 2019 | Dec 31, 2019 | |||||||||||||||||||||||||||||||||||||||||||
| (dollars in thousands, except per unit amounts) | ||||||||||||||||||||||||||||||||||||||||||||||||||
| Net sales and operating revenues: | ||||||||||||||||||||||||||||||||||||||||||||||||||
| Used vehicle sales, net | $ | 334,056 | $ | 437,922 | $ | 486,269 | $ | 526,798 | $ | 683,829 | $ | 855,785 | $ | 931,016 | $ | 949,971 | ||||||||||||||||||||||||||||||||||
| Wholesale vehicle sales | 10,133 | 16,622 | 21,440 | 25,389 | 33,030 | 63,014 | 92,430 | 79,112 | ||||||||||||||||||||||||||||||||||||||||||
Other sales and revenues (1) | 16,233 | 20,742 | 27,212 | 32,651 | 38,375 | 67,422 | 71,408 | 74,504 | ||||||||||||||||||||||||||||||||||||||||||
| Total net sales and operating revenues | $ | 360,422 | $ | 475,286 | $ | 534,921 | $ | 584,838 | $ | 755,234 | $ | 986,221 | $ | 1,094,854 | $ | 1,103,587 | ||||||||||||||||||||||||||||||||||
| Gross profit (incl. Gift): | ||||||||||||||||||||||||||||||||||||||||||||||||||
| Used vehicle gross profit | $ | 16,645 | $ | 26,641 | $ | 28,549 | $ | 22,482 | $ | 47,122 | $ | 63,378 | $ | 60,563 | $ | 66,792 | ||||||||||||||||||||||||||||||||||
| Wholesale vehicle gross profit | 1,355 | 1,652 | 1,544 | 1,001 | 3,035 | 6,993 | 5,572 | 1,250 | ||||||||||||||||||||||||||||||||||||||||||
Other gross profit (1) | 16,234 | 20,742 | 27,213 | 32,651 | 38,375 | 67,422 | 71,408 | 74,504 | ||||||||||||||||||||||||||||||||||||||||||
| Total gross profit | $ | 34,234 | $ | 49,035 | $ | 57,306 | $ | 56,134 | $ | 88,532 | $ | 137,793 | $ | 137,543 | $ | 142,546 | ||||||||||||||||||||||||||||||||||
Gross profit ex-Gift: (3) | ||||||||||||||||||||||||||||||||||||||||||||||||||
| Used vehicle gross profit ex-Gift | $ | 16,645 | $ | 26,641 | $ | 29,530 | $ | 25,371 | $ | 47,886 | 65,186 | 61,944 | 67,931 | |||||||||||||||||||||||||||||||||||||
| Wholesale vehicle gross profit ex-Gift | 1,355 | 1,652 | 1,564 | 1,114 | 3,057 | 7,096 | 5,714 | 1,341 | ||||||||||||||||||||||||||||||||||||||||||
Other gross profit (1) | 16,234 | 20,742 | 27,213 | 32,651 | 38,375 | 67,422 | 71,408 | 74,504 | ||||||||||||||||||||||||||||||||||||||||||
| Total gross profit ex-Gift | $ | 34,234 | $ | 49,035 | $ | 58,307 | $ | 59,136 | $ | 89,318 | $ | 139,704 | $ | 139,066 | $ | 143,776 | ||||||||||||||||||||||||||||||||||
| Market information: | ||||||||||||||||||||||||||||||||||||||||||||||||||
| Markets, beginning of period | 44 | 56 | 65 | 78 | 85 | 109 | 137 | 146 | ||||||||||||||||||||||||||||||||||||||||||
| Market launches | 12 | 9 | 13 | 7 | 24 | 28 | 9 | — | ||||||||||||||||||||||||||||||||||||||||||
| Markets, end of period | 56 | 65 | 78 | 85 | 109 | 137 | 146 | 146 | ||||||||||||||||||||||||||||||||||||||||||
| Unit sales information: | ||||||||||||||||||||||||||||||||||||||||||||||||||
| Used vehicle unit sales | 18,464 | 22,570 | 25,324 | 27,750 | 36,766 | 44,000 | 46,413 | 50,370 | ||||||||||||||||||||||||||||||||||||||||||
| Wholesale vehicle unit sales | 2,342 | 3,658 | 4,408 | 4,717 | 6,701 | 10,756 | 11,698 | 10,740 | ||||||||||||||||||||||||||||||||||||||||||
| Per unit selling prices: | ||||||||||||||||||||||||||||||||||||||||||||||||||
| Used vehicles | $ | 18,092 | $ | 19,403 | $ | 19,202 | $ | 18,984 | $ | 18,599 | $ | 19,450 | $ | 20,059 | $ | 18,860 | ||||||||||||||||||||||||||||||||||
| Wholesale vehicles | $ | 4,327 | $ | 4,544 | $ | 4,864 | $ | 5,382 | $ | 4,929 | $ | 5,858 | $ | 7,901 | $ | 7,366 | ||||||||||||||||||||||||||||||||||
Per unit gross profit incl. Gift: (2) | ||||||||||||||||||||||||||||||||||||||||||||||||||
| Used vehicle gross profit | $ | 902 | $ | 1,180 | $ | 1,127 | $ | 810 | $ | 1,282 | $ | 1,440 | $ | 1,305 | $ | 1,326 | ||||||||||||||||||||||||||||||||||
| Wholesale vehicle gross profit | $ | 579 | $ | 452 | $ | 350 | $ | 212 | $ | 453 | $ | 650 | $ | 476 | $ | 116 | ||||||||||||||||||||||||||||||||||
| Other gross profit | $ | 879 | $ | 919 | $ | 1,075 | $ | 1,177 | $ | 1,044 | $ | 1,532 | $ | 1,539 | $ | 1,479 | ||||||||||||||||||||||||||||||||||
| Total gross profit | $ | 1,854 | $ | 2,173 | $ | 2,263 | $ | 2,023 | $ | 2,408 | $ | 3,132 | $ | 2,963 | $ | 2,830 | ||||||||||||||||||||||||||||||||||
Per unit gross profit ex-Gift: (2)(3) | ||||||||||||||||||||||||||||||||||||||||||||||||||
| Used vehicle gross profit ex-Gift | $ | 902 | $ | 1,180 | $ | 1,166 | $ | 914 | $ | 1,302 | $ | 1,482 | $ | 1,335 | $ | 1,349 | ||||||||||||||||||||||||||||||||||
| Wholesale vehicle gross profit ex-Gift | $ | 579 | $ | 452 | $ | 355 | $ | 236 | $ | 456 | $ | 660 | $ | 488 | $ | 125 | ||||||||||||||||||||||||||||||||||
| Other gross profit | $ | 879 | $ | 919 | $ | 1,075 | $ | 1,177 | $ | 1,044 | $ | 1,532 | $ | 1,539 | $ | 1,479 | ||||||||||||||||||||||||||||||||||
| Total gross profit ex-Gift | $ | 1,854 | $ | 2,173 | $ | 2,302 | $ | 2,131 | $ | 2,429 | $ | 3,175 | $ | 2,996 | $ | 2,854 | ||||||||||||||||||||||||||||||||||
| (1) Includes a portion of other sales and revenues from related parties. | ||||||||||||||||||||||||||||||||||||||||||||||||||
| (2) All gross profit per unit amounts are per used vehicle sold, except wholesale vehicle gross profit, which is per wholesale vehicle sold. | ||||||||||||||||||||||||||||||||||||||||||||||||||
| (3) Ex-Gift amounts exclude the expense related to the 100k Milestone Gift. See "Reconciliation of GAAP to Non-GAAP Financial Measures" for a reconciliation to the most directly comparable GAAP-based measure, when applicable. | ||||||||||||||||||||||||||||||||||||||||||||||||||
26
CARVANA CO. AND SUBSIDIARIES
COMPONENTS OF SG&A
(Unaudited)
| Three Months Ended | ||||||||||||||||||||||||||||||||||||||||||||||||||
| Mar 31, 2018 | Jun 30, 2018 | Sep 30, 2018 | Dec 31, 2018 | Mar 31, 2019 | Jun 30, 2019 | Sep 30, 2019 | Dec 31, 2019 | |||||||||||||||||||||||||||||||||||||||||||
| (in thousands) | ||||||||||||||||||||||||||||||||||||||||||||||||||
Compensation and benefits (1) | $ | 24,987 | $ | 29,251 | $ | 34,411 | $ | 43,065 | $ | 48,804 | $ | 54,184 | $ | 60,655 | $ | 72,939 | ||||||||||||||||||||||||||||||||||
| 100k Milestone Gift | — | — | 6,760 | 1,058 | 2,188 | 1,415 | 2,903 | 1,263 | ||||||||||||||||||||||||||||||||||||||||||
| Advertising | 25,009 | 26,782 | 27,467 | 31,971 | 39,522 | 50,367 | 55,264 | 58,867 | ||||||||||||||||||||||||||||||||||||||||||
Market occupancy (2) | 2,510 | 2,618 | 3,110 | 3,859 | 4,370 | 4,720 | 5,517 | 6,644 | ||||||||||||||||||||||||||||||||||||||||||
Logistics (3) | 6,318 | 7,826 | 9,913 | 11,140 | 12,249 | 13,643 | 14,068 | 18,090 | ||||||||||||||||||||||||||||||||||||||||||
Other (4) | 24,362 | 29,175 | 34,107 | 39,559 | 48,108 | 57,514 | 69,563 | 83,860 | ||||||||||||||||||||||||||||||||||||||||||
| Total | $ | 83,186 | $ | 95,652 | $ | 115,768 | $ | 130,652 | $ | 155,241 | $ | 181,843 | $ | 207,970 | $ | 241,663 | ||||||||||||||||||||||||||||||||||
(1) Compensation and benefits includes all payroll and related costs, including benefits, payroll taxes, and equity-based compensation, except those related to preparing vehicles for sale, which are included in cost of sales, those related to the development of software products for internal use, which are capitalized to software and depreciated over the estimated useful lives of the related assets, and those related to the 100k Milestone Gift.
(2) Market occupancy costs includes occupancy costs of our vending machines and hubs. It excludes occupancy costs related to reconditioning vehicles which are included in cost of sales and the portion related to corporate occupancy which are included in other costs.
(3) Logistics includes fuel, maintenance, and depreciation related to operating our own transportation fleet and third party transportation fees, except the portion related to inbound transportation, which is included in cost of sales.
(4) Other costs include all other selling, general, and administrative expenses such as IT expenses, corporate occupancy, professional services and insurance, limited warranty, and title and registration.
27
CARVANA CO. AND SUBSIDIARIES
LIQUIDITY RESOURCES
(Unaudited)
| December 31, | |||||||||||
| 2019 | 2018 | ||||||||||
| (in thousands) | |||||||||||
| Cash and cash equivalents | $ | 76,016 | $ | 78,861 | |||||||
Availability under short-term revolving facilities(1) | 279,080 | 253,601 | |||||||||
Availability under sale-leaseback agreements(2)(3) | 104,680 | 77,359 | |||||||||
| Committed liquidity resources available | $ | 459,776 | $ | 409,821 | |||||||
(1) Based on pledging all eligible vehicles and finance receivables under the available capacity in the Floor Plan Facility and Finance Receivable Facilities, excluding the impact to restricted cash requirements.
(2) We have $75.0 million available for sale and lease back transactions under the Master Sale-Leaseback Agreement with VMRE, and an additional $29.7 million and $2.4 million as of December 31, 2019 and December 31, 2018, respectively, available under sale-leaseback arrangements with other parties.
(3) We have $158.7 million and $132.4 million of total unfunded gross real estate assets as of December 31, 2019 and 2018, respectively.
We also had $137.7 million of committed funds for future construction costs of four IRCs in process as of December 31, 2019. In addition, we had $13.5 million of total unpledged beneficial interests in securitizations as of December 31, 2019.
28