UNITED STATES
SECURITIES AND EXCHANGE COMMISSION
Washington, D.C. 20549
 
FORM 8-K
 
CURRENT REPORT


Pursuant to Section 13 or 15(d) of the Securities Exchange Act of 1934
 
Date of Report (Date of earliest event reported): February 21, 2023
 
CURTISS-WRIGHT CORPORATION
(Exact Name of Registrant as Specified in Its Charter)
 
Delaware
 
001-00134
 
13-0612970
(State or Other
Jurisdiction of
Incorporation)
 
(Commission File
Number)
 
(IRS Employer
Identification No.)
 
130 Harbour Place Drive, Suite 300
 
Davidson, NC
28036
(Address of Principal Executive Offices)
(Zip Code)
 
Registrant’s telephone number, including area code: (704) 869-4600
__________
Not applicable
(Former name or former address, if changed since last report)
 
 
Check the appropriate box below if the Form 8-K filing is intended to simultaneously satisfy the filing obligation of the registrant under any of the following provisions (see General Instruction A.2. below):
 
Written communications pursuant to Rule 425 under the Securities Act (17 CFR 230.425)
 
Soliciting material pursuant to Rule 14a-12 under the Exchange Act (17 CFR 240.14a-12)
 
Pre-commencement communications pursuant to Rule 14d-2(b) under the Exchange Act (17 CFR 240.14d-2(b))
 
Pre-commencement communications pursuant to Rule 13e-4(c) under the Exchange Act (17 CFR 240.13e-4(c))

Securities registered pursuant to Section 12(b) of the Act:

Title of each class
Trading Symbol(s)
Name of each exchange on which registered
Common Stock
CW
New York Stock Exchange

Indicate by check mark whether the registrant is an emerging growth company as defined in Rule 405 of the Securities Act of 1933 (17 CFR §230.405) or Rule 12b-2 of the Securities Exchange Act of 1934 (17 CFR §240.12b-2).

                                                                                                                              Emerging growth company         

If an emerging growth company, indicate by check mark if the registrant has elected not to use the extended transition period for complying with any new or revised financial accounting standards provided pursuant to Section 13(a) of the Exchange Act. ☐

SECTION 2 – FINANCIAL INFORMATION
 
ITEM 2.02.    RESULTS OF OPERATIONS AND FINANCIAL CONDITION.

On Tuesday, February 21, 2023, the Company issued a press release announcing financial results for the fourth quarter and full year ended December 31, 2022.  A conference call and webcast presentation will be held on Wednesday, February 22, 2023 at 9:00 am ET for management to discuss the Company’s fourth quarter and full-year 2022 financial performance as well as expectations for 2023 financial performance. Lynn M. Bamford, Chair and Chief Executive Officer, and K. Christopher Farkas, Vice President and Chief Financial Officer, will host the call.  A copy of the press release and the webcast slide presentation are attached hereto as Exhibits 99.1 and 99.2.

The financial press release, access to the webcast, and the accompanying financial presentation will be posted on Curtiss-Wright's website at www.curtisswright.com. In addition, the dial-in number for domestic callers is (800) 274-8461, while international callers can dial (203) 518-9843. The PIN code for all participants is CWQ422. For those unable to join the live presentation, a webcast replay will be available within the Investor Relations section on the Company’s website beginning one hour after the call takes place.

The information contained in this Current Report, including Exhibits 99.1 and 99.2, are being furnished and shall not be deemed to be “filed” for the purposes of Section 18 of the Securities and Exchange Act of 1934 or otherwise subject to the liabilities of that Section. The information in this report shall not be incorporated by reference into any filing of the registrant with the SEC, whether made before or after the date hereof, regardless of any general incorporation language in such filings.

ITEM 9.01    FINANCIAL STATEMENTS AND EXHIBITS.

         (a)  Not applicable.

         (b)  Not applicable.

(c)  Exhibits.

99.1 Press Release dated February 21, 2023

99.2 Presentation shown during investor and securities analyst webcast on February 22, 2023


SIGNATURE

Pursuant to the requirements of the Securities Exchange Act of 1934, the Registrant has caused this report to be signed on its behalf by the undersigned, thereunto duly authorized.


CURTISS-WRIGHT CORPORATION


By:
/s/ K. Christopher Farkas
 
 
     K. Christopher Farkas
 
 
     Vice-President and Chief Financial Officer

Date:    February 22, 2023


EXHIBIT INDEX

Exhibit
Number
Description
   
99.2 Presentation shown during investor and securities analyst webcast on February 22, 2023

Exhibit 99.1

Curtiss-Wright Reports Fourth Quarter and Full-Year 2022 Financial Results; Issues Full-Year 2023 Guidance Reflecting Higher Sales, Operating Margin, EPS and Free Cash Flow

Strong Q4 Results Drive Record FY22 Sales, Profitability and Orders

DAVIDSON, N.C.--(BUSINESS WIRE)--February 21, 2023--Curtiss-Wright Corporation (NYSE: CW) reports financial results for the fourth quarter and full-year ended December 31, 2022.

Fourth Quarter 2022 Highlights:

  • Reported sales of $758 million, operating income of $157 million, operating margin of 20.8%, diluted earnings per share (EPS) of $2.82, and free cash flow (FCF) of $283 million;
  • Adjusted sales of $758 million, up 16% year-over-year;
  • Adjusted operating income of $160 million, up 24%;
  • Adjusted operating margin of 21.1%, up 140 basis points;
  • Adjusted diluted EPS of $2.92, up 21%;
  • Adjusted FCF of $299 million, with 265% FCF conversion; and
  • New orders of $714 million, up 5%, reflecting solid demand in Aerospace & Defense (A&D) and Commercial markets.

Full-Year 2022 Highlights:

  • Reported sales of $2.6 billion, operating income of $423 million, operating margin of 16.6%, diluted EPS of $7.62, and FCF of $257 million;
  • Adjusted sales of $2.6 billion, up 4% year-over-year;
  • Adjusted operating income of $443 million, up 5%;
  • Adjusted operating margin of 17.3%, up 30 basis points;
  • Adjusted diluted EPS of $8.13, up 11%;
  • Adjusted FCF of $296 million, with 94% FCF conversion;
  • Total share repurchases of $50 million; and
  • New orders of $2.9 billion, up 15%; Backlog up 19%.

"Curtiss-Wright delivered record financial performance in the fourth quarter, driven by double-digit organic sales growth in our Aerospace & Defense and Commercial markets, and a strong performance from the recent acquisition of our engineered arresting systems business," said Lynn M. Bamford, Chair and CEO of Curtiss-Wright Corporation. "In addition, we achieved record quarterly Adjusted free cash flow of nearly $300 million, which generated robust free cash flow conversion of 265%."

"Our full-year 2022 results were highlighted by a strong operational performance, as we produced higher sales and operating income in our Aerospace & Industrial and Naval & Power segments. Further, the strength and resilience of our combined portfolio enabled us to minimize the impact of the challenging supply chain environment, as we generated 30 basis points in full-year operating margin expansion to 17.3%, and delivered double-digit EPS growth. Our results also reflected record orders of $2.9 billion and a book-to-bill of 1.15x, driven by strong demand across the portfolio."


“Looking to 2023, we anticipate total sales growth of 4% to 6% principally driven by strong growth in our A&D markets, continued operating margin expansion while maintaining steady investments in our technology, and strong Adjusted free cash flow generation ranging from $360 to $400 million. As a result, we remain well-positioned with line of sight to the 3-year financial targets that we communicated at our 2021 Investor Day.”


Fourth Quarter 2022 Operating Results

(In millions)

Q4-2022

Q4-2021

Change

Reported


Sales

$

758


$

667


14

%

Operating income

$

157


$

105


49

%

Operating margin


20.8

%


15.8

%

500 bps


Adjusted (1)


Sales

$

758


$

655


16

%

Operating income

$

160


$

129


24

%

Operating margin


21.1

%


19.7

%

140 bps

(1)


Reconciliations of Reported to Adjusted operating results are available in the Appendix.

  • Adjusted sales of $758 million increased 16% compared with the prior year, and included a $9 million or 1% headwind from unfavorable foreign currency translation, mainly within our Aerospace & Industrial segment;
  • Total A&D market sales increased 18%, while total Commercial market sales increased 10%;
  • In our A&D markets, our results reflected strong growth of 20% in our defense markets, driven by higher defense electronics revenues, the contribution from the acquisition of our engineered arresting systems business and double-digit sales growth in commercial aerospace;
  • In our Commercial markets, we experienced double-digit sales growth in the general industrial market, as well as high-single digit sales growth within the power & process market, despite the wind down on the China Direct AP1000 program; and
  • Adjusted operating income of $160 million increased 24%, while Adjusted operating margin increased 140 basis points to 21.1%, principally driven by favorable overhead absorption on higher revenues in all three segments, as well as the benefits of our prior year restructuring and ongoing company-wide operational excellence initiatives.

Fourth Quarter 2022 Segment Performance

Aerospace & Industrial

(In millions)

Q4-2022

Q4-2021

Change

Reported


Sales

$

223


$

210


6

%

Operating income

$

41


$

40


2

%

Operating margin


18.2

%


19.0

%

(80 bps)


Adjusted (1)


Sales

$

223


$

208


8

%

Operating income

$

41


$

40


2

%

Operating margin


18.5

%


19.5

%

(100 bps)

(1)


Reconciliations of Reported to Adjusted operating results are available in the Appendix.

  • Adjusted sales of $223 million, up $16 million, or 8% overall, and included a $6 million or 4% headwind from unfavorable foreign currency translation;
  • Higher commercial aerospace market revenue was driven by higher sales of actuation and sensors products on numerous narrowbody and widebody platforms;
  • Lower aerospace defense market revenue reflected the timing of defense market sales of our actuation and sensors products;
  • Strong double-digit revenue growth in the general industrial market reflected continued strong demand for industrial vehicle products serving on-highway, off-highway and specialty platforms, and increased sales of surface treatment services; and
  • Adjusted operating income was $41 million, up 2% from the prior year, while Adjusted operating margin decreased 100 basis points to 18.5%, as favorable absorption on higher sales and the benefits of our ongoing operational excellence initiatives were partially offset by unfavorable mix on actuation products.

Defense Electronics

(In millions)

Q4-2022

Q4-2021

Change

Reported


Sales

$

236


$

199


19

%

Operating income

$

70


$

52


34

%

Operating margin


29.7

%


26.3

%

340 bps


Adjusted (1)


Sales

$

236


$

200


18

%

Operating income

$

70


$

53


33

%

Operating margin


29.7

%


26.5

%

320 bps

(1)


Reconciliations of Reported to Adjusted operating results are available in the Appendix.

  • Adjusted sales of $236 million, up $37 million, or 18%, principally reflected strong growth in defense market sales, despite ongoing supply chain headwinds related to the availability of electronic components;
  • Higher aerospace defense market revenues reflected increased sales of our embedded computing equipment on various fighter jet and helicopter programs;
  • Ground defense market revenue increases reflected higher sales of our tactical communications equipment; and
  • Adjusted operating income was $70 million, up 33% from the prior year, while adjusted operating margin increased 320 basis points to 29.7%, primarily driven by strong absorption on higher defense revenues.

Naval & Power

(In millions)

Q4-2022

Q4-2021

Change

Reported


Sales

$

298


$

258


16

%

Operating income

$

59


$

25


135

%

Operating margin


19.7

%


9.7

%

1,000 bps


Adjusted (1)


Sales

$

298


$

248


20

%

Operating income

$

60


$

48


26

%

Operating margin


20.3

%


19.3

%

100 bps

(1)


Reconciliations of Reported to Adjusted operating results are available in the Appendix.

  • Adjusted sales of $298 million, up $50 million, or 20%;
  • Higher aerospace defense market revenues reflected the contribution from the arresting systems acquisition for arresting systems equipment, principally to international customers;
  • Naval defense market revenue increases reflected the strong ramp up on the Columbia-class submarine program partially offset by timing of revenues on the CVN-80 aircraft carrier program;
  • Higher power & process market revenues reflected strong growth in nuclear aftermarket sales supporting existing operating reactors as well as increased industrial valve sales in the process market. Those increases were partially offset by the wind down of production on the China Direct AP1000 program; and
  • Adjusted operating income was $60 million, up 26% from the prior year, while adjusted operating margin increased 100 basis points to 20.3%, driven by favorable absorption on higher organic revenues, a solid contribution from the arresting systems acquisition and the benefits of our restructuring initiatives.

Free Cash Flow

(In millions)

Q4-2022

Q4-2021

Change

Net cash provided by operating activities

$

292


$

232


26

%

Capital expenditures


(9

)


(13

)

(29

%)

Reported free cash flow

$

283


$

219


29

%

Adjusted free cash flow (1)

$

299


$

219


37

%

(1)


A reconciliation of Reported to Adjusted free cash flow is available in the Appendix.

  • Reported free cash flow of $283 million increased $64 million, primarily due to higher cash earnings and lower taxes;
  • Adjusted free cash flow of $299 million increased $80 million; and
  • Capital expenditures decreased $4 million compared with the prior year.

New Orders and Backlog

  • New orders of $714 million increased 5% in the fourth quarter driven by strong demand for defense electronics products and the contribution from our arresting systems acquisition within our A&D markets, and for nuclear aftermarket products within our Commercial markets;
  • Full-year 2022 new orders of $2.9 billion increased 15% and generated an overall book-to-bill of 1.15x, reflecting growth in our A&D and Commercial markets; and
  • Backlog of $2.6 billion, up 19% from December 31, 2021, reflects strong demand in our Defense and Commercial Aerospace markets.

Share Repurchase and Dividends

  • During the fourth quarter, the Company repurchased 74,816 shares of its common stock for approximately $12 million;
  • During full-year 2022, the Company repurchased 0.3 million shares for $50 million; and
  • The Company also declared a quarterly dividend of $0.19 a share.

Other Items – Completion of Financing of $300 Million in Senior Notes

  • On October 27, 2022, the Company announced the successful completion of a private placement debt offering of $300 million for senior notes, consisting of $200 million 4.49% notes due 2032 and $100 million 4.64% notes due 2034.

Full-Year 2023 Guidance

The Company's full-year 2023 Adjusted financial guidance(1) is as follows:

($ in millions, except EPS)

2023 Adjusted
Non-GAAP Guidance

% Chg vs 2022

Total Sales

$2,655 - $2,710

Up 4% - 6%

Operating Income

$463 - $477

Up 5% - 8%

Operating Margin

17.4% - 17.6%

Up 10 - 30 bps

Diluted EPS

$8.65 - $8.90

Up 6% - 10%

Free Cash Flow

$360 - $400

Up 22% - 36%

(1)


Reconciliations of Reported to Adjusted 2022 operating results and 2023 financial guidance are available in the Appendix, and exclude first year purchase accounting costs in both periods associated with acquisitions.

**********

A more detailed breakdown of the Company’s 2023 financial guidance by segment and by market, as well as all reconciliations of Reported GAAP amounts to Adjusted non-GAAP amounts, can be found in the accompanying schedules. Historical financial results are available in the Investor Relations section of Curtiss-Wright’s website.

Conference Call & Webcast Information

The Company will host a conference call to discuss fourth quarter and full-year 2022 financial results and expectations for 2023 guidance at 9:00 a.m. ET on Wednesday, February 22, 2023. A live webcast of the call and the accompanying financial presentation, as well as a webcast replay of the call, will be made available on the internet by visiting the Investor Relations section of the Company’s website at www.curtisswright.com.

(Tables to Follow)


CURTISS-WRIGHT CORPORATION and SUBSIDIARIES

CONSOLIDATED STATEMENTS OF EARNINGS (UNAUDITED)

($'s in thousands, except per share data)


Three Months Ended


Year Ended


December 31,


December 31,


2022


2021


2022


2021


Product sales

$

646,263


$

556,911


$

2,135,882


$

2,109,617


Service sales


111,402


109,847


421,143


396,314


Total net sales


757,665


666,758


2,557,025


2,505,931


Cost of product sales


399,389


340,432


1,348,569


1,330,191


Cost of service sales


65,792


64,454


253,847


242,384


Total cost of sales


465,181


404,886


1,602,416


1,572,575


Gross profit


292,484


261,872


954,609


933,356


Research and development expenses


19,032


21,814


80,836


88,489


Selling expenses


31,199


27,729


121,586


116,956


General and administrative expenses


85,008


96,532


324,093


326,140


Loss on divestiture


4,651


Impairment of assets held for sale


10,432


19,088


Operating income


157,245


105,365


423,443


382,683


Interest expense


13,665


10,146


46,980


40,240


Other income, net


1,434


3,157


12,732


12,067


Earnings before income taxes


145,014


98,376


389,195


354,510


Provision for income taxes


(35,991

)


(21,797

)


(94,847

)


(87,351

)

Net earnings

$

109,023


$

76,579


$

294,348


$

267,159


Net earnings per share:


Basic earnings per share

$

2.85


$

1.95


$

7.67


$

6.61


Diluted earnings per share

$

2.82


$

1.94


$

7.62


$

6.58


Dividends per share

$

0.19


$

0.18


$

0.75


$

0.71


Weighted average shares outstanding:


Basic


38,296


39,309


38,386


40,417


Diluted


38,633


39,524


38,649


40,602


CURTISS-WRIGHT CORPORATION and SUBSIDIARIES

CONSOLIDATED BALANCE SHEETS (UNAUDITED)

($'s in thousands, except par value)


December 31,


December 31,


2022


2021


Assets


Current assets:


Cash and cash equivalents

$

256,974


$

171,004


Receivables, net


724,603


647,148


Inventories, net


483,113


411,567


Assets held for sale


10,988


Other current assets


52,623


67,101


Total current assets


1,517,313


1,307,808


Property, plant, and equipment, net


342,708


360,031


Goodwill


1,544,635


1,463,026


Other intangible assets, net


620,897


538,077


Operating lease right-of-use assets, net


153,855


143,613


Prepaid pension asset


222,627


256,422


Other assets


47,567


34,568


Total assets

$

4,449,602


$

4,103,545


Liabilities


Current liabilities:


Current portion of long-term and short-term debt

$

202,500


$


Accounts payable


266,525


211,640


Accrued expenses


177,536


147,701


Deferred revenue


242,483


260,157


Liabilities held for sale


12,655


Other current liabilities


82,395


102,714


Total current liabilities


971,439


734,867


Long-term debt


1,051,900


1,050,610


Deferred tax liabilities


123,001


147,349


Accrued pension and other postretirement benefit costs


58,348


91,329


Long-term operating lease liability


132,275


127,152


Long-term portion of environmental reserves


12,547


13,656


Other liabilities


107,973


112,092


Total liabilities


2,457,483


2,277,055


Stockholders' equity


Common stock, $1 par value

$

49,187


$

49,187


Additional paid in capital


134,553


127,104


Retained earnings


3,174,396


2,908,827


Accumulated other comprehensive loss


(258,916

)


(190,465

)

Less: cost of treasury stock


(1,107,101

)


(1,068,163

)

Total stockholders' equity


1,992,119


1,826,490


Total liabilities and stockholders' equity

$

4,449,602


$

4,103,545


Use and Definitions of Non-GAAP Financial Information (Unaudited)

The Corporation supplements its financial information determined under U.S. generally accepted accounting principles (GAAP) with certain non-GAAP financial information. Curtiss-Wright believes that these Adjusted (non-GAAP) measures provide investors with improved transparency in order to better measure Curtiss-Wright’s ongoing operating and financial performance and better comparisons of our key financial metrics to our peers. These non-GAAP measures should not be considered in isolation or as a substitute for the related GAAP measures, and other companies may define such measures differently. Curtiss-Wright encourages investors to review its financial statements and publicly filed reports in their entirety and not to rely on any single financial measure. Reconciliations of “Reported” GAAP amounts to “Adjusted” non-GAAP amounts are furnished within this release.

The following definitions are provided:

Adjusted Sales, Operating Income, Operating Margin, Net Earnings and Diluted EPS

These Adjusted financials are defined as Reported Sales, Operating Income, Operating Margin, Net Earnings and Diluted Earnings per Share under GAAP excluding: (i) the impact of first year purchase accounting costs associated with acquisitions, specifically one-time inventory step-up, backlog amortization, deferred revenue adjustments and transaction costs; (ii) the sale or divestiture of a business or product line; (iii) pension settlement charges; and (iv) significant legal settlements, impairment costs, and costs associated with shareholder activism, as applicable.


CURTISS-WRIGHT CORPORATION and SUBSIDIARIES

RECONCILIATION OF AS REPORTED TO ADJUSTED (UNAUDITED)

($'s in thousands)


Three Months Ended


Three Months Ended


December 31, 2022


December 31, 2021


% Change


As Reported


Adjustments


Adjusted


As Reported


Adjustments


Adjusted


As Reported


Adjusted

Sales:


Aerospace & Industrial (1)

$

223,258


$


$

223,258


$

209,994


$

(2,418

)


$

207,576


6

%


8

%

Defense Electronics (2)


236,456


236,456


199,259


360


199,619


19

%


18

%

Naval & Power (4)


297,951


297,951


257,505


(9,401

)


248,104


16

%


20

%


Total sales

$

757,665


$


$

757,665


$

666,758


$

(11,459

)


$

655,299


14

%


16

%


Operating income (expense):


Aerospace & Industrial (1)(3)

$

40,599


$

703


$

41,302


$

39,943


$

493


$

40,436


2

%


2

%

Defense Electronics (2)


70,230


70,230


52,433


442


52,875


34

%


33

%

Naval & Power (3)(4)(5)


58,717


1,724


60,441


25,025


22,802


47,827


135

%


26

%


Total segments

$

169,546


$

2,427


$

171,973


$

117,401


$

23,737


$

141,138


44

%


22

%

Corporate and other


(12,301

)


(12,301

)


(12,036

)


(22

)


(12,058

)


2

%


2

%


Total operating income

$

157,245


$

2,427


$

159,672


$

105,365


$

23,715


$

129,080


49

%


24

%


Operating margins:

As Reported


Adjusted


As Reported


Adjusted


As Reported


Adjusted

Aerospace & Industrial


18.2

%


18.5

%


19.0

%


19.5

%


(80 bps)


(100 bps)

Defense Electronics


29.7

%


29.7

%


26.3

%


26.5

%


340 bps


320 bps

Naval & Power


19.7

%


20.3

%


9.7

%


19.3

%


1,000 bps


100 bps

Total Curtiss-Wright


20.8

%


21.1

%


15.8

%


19.7

%


500 bps


140 bps


Segment margins


22.4

%


22.7

%


17.6

%


21.5

%


480 bps


120 bps

(1) Excludes our build-to-print actuation product line supporting the Boeing 737 Max program, which we substantially exited in the fourth quarter of 2020.

(2) Excludes first year purchase accounting adjustments in the prior period.

(3) Excludes first year purchase accounting adjustments in the current period.

(4) Excludes the results of operations from our German valves business, which was sold in January 2022, including an impairment loss in the prior period.

(5) Excludes one-time legal settlement costs in the prior period.


CURTISS-WRIGHT CORPORATION and SUBSIDIARIES

RECONCILIATION OF AS REPORTED TO ADJUSTED (UNAUDITED)

($'s in thousands)


Year Ended


Year Ended


December 31, 2022


December 31, 2021


% Change


As Reported


Adjustments


Adjusted


As Reported


Adjustments


Adjusted


As Reported


Adjusted

Sales:


Aerospace & Industrial (1)

$

836,035


$


$

836,035


$

786,334


$

(11,182

)


$

775,152


6

%


8

%

Defense Electronics (2)


690,262


690,262


724,326


3,600


727,926


(5

)%


(5

)%

Naval & Power (4)


1,030,728


1,030,728


995,271


(29,869

)


965,402


4

%


7

%


Total sales

$

2,557,025


$


$

2,557,025


$

2,505,931


$

(37,451

)


$

2,468,480


2

%


4

%


Operating income (expense):


Aerospace & Industrial (1)(3)

$

136,996


$

703


$

137,699


$

121,817


$

(1,586

)


$

120,231


12

%


15

%

Defense Electronics (2)


154,568


154,568


159,089


5,134


164,223


(3

)%


(6

)%

Naval & Power (3)(4)(6)


177,582


14,056


191,638


141,660


34,139


175,799


25

%


9

%


Total segments

$

469,146


$

14,759


$

483,905


$

422,566


$

37,687


$

460,253


11

%


5

%

Corporate and other (5)


(45,703

)


4,876


(40,827

)


(39,883

)


53


(39,830

)


15

%


3

%


Total operating income

$

423,443


$

19,635


$

443,078


$

382,683


$

37,739


$

420,422


11

%


5

%


Operating margins:

As Reported


Adjusted


As Reported


Adjusted


As Reported


Adjusted

Aerospace & Industrial


16.4

%


16.5

%


15.5

%


15.5

%


90 bps


100 bps

Defense Electronics


22.4

%


22.4

%


22.0

%


22.6

%


40 bps


(10 bps)

Naval & Power


17.2

%


18.6

%


14.2

%


18.2

%


300 bps


40 bps

Total Curtiss-Wright


16.6

%


17.3

%


15.3

%


17.0

%


130 bps


30 bps


Segment margins


18.3

%


18.9

%


16.9

%


18.6

%


140 bps


30 bps

(1) Excludes our build-to-print actuation product line supporting the Boeing 737 Max program, which we substantially exited in the fourth quarter of 2020.

(2) Excludes first year purchase accounting adjustments in the prior period.

(3) Excludes first year purchase accounting adjustments in the current period.

(4) Excludes the results of operations from our German valves business, which was sold in January 2022, including a loss on divestiture in the current period and an impairment loss in the prior period.

(5) Excludes costs associated with shareholder activism in the current period.

(6) Excludes one-time legal settlement costs in the prior period.


CURTISS-WRIGHT CORPORATION and SUBSIDIARIES

RECONCILIATION OF AS REPORTED SALES TO ADJUSTED SALES BY END MARKET (UNAUDITED)

($'s in thousands)


Three Months Ended


Three Months Ended


December 31, 2022


December 31, 2021


% Change


As Reported


Adjustments


Adjusted
Sales


As Reported


Adjustments


Adjusted
Sales


Change in As
Reported
Sales

Change in
Adjusted
Sales

Aerospace & Defense markets:


Aerospace Defense


$

172,763


$


$

172,763


$

124,815


$


$

124,815


38

%

38

%

Ground Defense (1)


81,348


81,348


61,199


360


61,559


33

%

32

%

Naval Defense


183,418


183,418


179,259


179,259


2

%

2

%

Commercial Aerospace (2)


77,178


77,178


71,437


(2,418

)


69,019


8

%

12

%

Total Aerospace & Defense


$

514,707


$


$

514,707


$

436,710


$

(2,058

)


$

434,652


18

%

18

%


Commercial markets:


Power & Process (3)


131,598


131,598


129,916


(9,401

)


120,515


1

%

9

%

General Industrial


111,360


111,360


100,132


100,132


11

%

11

%

Total Commercial


$

242,958


$


$

242,958


$

230,048


$

(9,401

)


$

220,647


6

%

10

%


Total Curtiss-Wright


$

757,665


$


$

757,665


$

666,758


$

(11,459

)


$

655,299


14

%

16

%


Year Ended


Year Ended


December 31, 2022


December 31, 2021


% Change


As Reported


Adjustments


Adjusted
Sales


As Reported


Adjustments


Adjusted
Sales


Change in As
Reported
Sales

Change in
Adjusted
Sales

Aerospace & Defense markets:


Aerospace Defense


$

479,743


$


$

479,743


$

452,661


$


$

452,661


6

%

6

%

Ground Defense (1)


219,739


219,739


220,290


3,600


223,890


0

%

(2

%)

Naval Defense


694,015


694,015


710,688


710,688


(2

%)

(2

%)

Commercial Aerospace (2)


276,519


276,519


267,722


(11,182

)


256,540


3

%

8

%

Total Aerospace & Defense


$

1,670,016


$


$

1,670,016


$

1,651,361


$

(7,582

)


$

1,643,779


1

%

2

%


Commercial markets:


Power & Process (3)


472,300


472,300


473,489


(29,869

)


443,620


0

%

6

%

General Industrial


414,709


414,709


381,081


381,081


9

%

9

%

Total Commercial


$

887,009


$


$

887,009


$

854,570


$

(29,869

)


$

824,701


4

%

8

%


Total Curtiss-Wright


$

2,557,025


$


$

2,557,025


$

2,505,931


$

(37,451

)


$

2,468,480


2

%

4

%

(1) Excludes first year purchase accounting adjustments in the prior period.

(2) Excludes our build-to-print actuation product line supporting the Boeing 737 MAX program, which we substantially exited in the fourth quarter of 2020.

(3) Excludes the prior period results of our German valves business, which was sold in January 2022.


CURTISS-WRIGHT CORPORATION and SUBSIDIARIES

RECONCILIATION OF AS REPORTED TO ADJUSTED DILUTED EARNINGS PER SHARE (UNAUDITED)


Three Months Ended


Year Ended


December 31,


December 31,


2022


2021


2022


2021


Diluted earnings per share - As Reported

$

2.82


$

1.94


$

7.62


$

6.58


First year purchase accounting adjustments


0.05


0.02


0.18


0.11


Divested German valves business


0.11


0.14


0.30


Costs associated with shareholder activism


0.10


Pension settlement charges


0.05


0.09


0.06


Charges related to legal settlement


0.32


0.31


Exit of build-to-print actuation product line


0.01


(0.02

)

Diluted earnings per share - Adjusted (1)

$

2.92


$

2.40


$

8.13


$

7.34


(1) All adjustments are presented net of income taxes.

Organic Sales and Organic Operating Income

The Corporation discloses organic sales and organic operating income because the Corporation believes it provides investors with insight as to the Company’s ongoing business performance. Organic sales and organic operating income are defined as sales and operating income, excluding contributions from acquisitions and results of operations from divested businesses or product lines during the last twelve months, impairment of assets held for sale and corresponding loss from sale of our industrial valves business in Germany, and foreign currency fluctuations.


Three Months Ended


December 31,


2022 vs. 2021


Aerospace & Industrial


Defense Electronics


Naval & Power


Total Curtiss-Wright


Sales


Operating
income


Sales


Operating
income


Sales


Operating
income


Sales


Operating
income

As Reported

6

%


2

%


19

%


34

%


16

%


135

%


14

%


49

%

Less: Acquisitions/divestiture

1

%


0

%


0

%


0

%


(9

%)


(17

%)


(3

%)


(4

%)

Impairment of assets held for sale

0

%


0

%


0

%


0

%


0

%


(42

%)


0

%


(10

%)

Foreign currency

4

%


(1

%)


0

%


(5

%)


1

%


(2

%)


1

%


(4

%)

Organic

11

%


(1

%)


19

%


29

%


8

%


74

%


12

%


31

%


Year Ended


December 31,


2022 vs. 2021


Aerospace & Industrial


Defense Electronics


Naval & Power


Total Curtiss-Wright


Sales


Operating
income


Sales


Operating
income


Sales


Operating
income


Sales


Operating
income

As Reported

6

%


12

%


(5

%)


(3

%)


4

%


25

%


2

%


11

%

Less: Acquisitions/divestiture

1

%


1

%


0

%


0

%


(1

%)


0

%


0

%


0

%

Loss on divestiture/impairment of assets held for sale

0

%


0

%


0

%


0

%


0

%


(10

%)


0

%


(4

%)

Foreign currency

3

%


1

%


1

%


(3

%)


0

%


0

%


1

%


(1

%)

Organic

10

%


14

%


(4

%)


(6

%)


3

%


15

%


3

%


6

%


Free Cash Flow and Free Cash Flow Conversion

The Corporation discloses free cash flow because it measures cash flow available for investing and financing activities. Free cash flow represents cash available to repay outstanding debt, invest in the business, acquire businesses, return capital to shareholders and make other strategic investments. Free cash flow is defined as net cash provided by operating activities less capital expenditures. Adjusted free cash flow for 2022 excludes: (i) payments associated with the Westinghouse legal settlement and (ii) executive pension payments. The Corporation discloses adjusted free cash flow conversion because it measures the proportion of net earnings converted into free cash flow and is defined as adjusted free cash flow divided by adjusted net earnings.

CURTISS-WRIGHT CORPORATION and SUBSIDIARIES

NON-GAAP FINANCIAL DATA (UNAUDITED)

($'s in thousands)


Three Months Ended


Year Ended


December 31,


December 31,


2022


2021


2022


2021


Net cash provided by operating activities

$

292,389


$

231,907


$

294,776


$

387,668


Capital expenditures


(9,428

)


(13,250

)


(38,217

)


(41,108

)

Free cash flow

$

282,961


$

218,657


$

256,559


$

346,560


Westinghouse legal settlement


15,000


Pension payment to former executives


15,753


23,967


Adjusted free cash flow

$

298,714


$

218,657


$

295,526


$

346,560


Adjusted free cash flow conversion


265

%


230

%


94

%


116

%


CURTISS-WRIGHT CORPORATION

2023 Guidance

As of February 21, 2023

($'s in millions, except per share data)


2022
Reported
(GAAP)


2022
Adjustments
(Non-
GAAP)(1,3)


2022
Adjusted
(Non-
GAAP)(1,3)


2023
Reported Guidance
(GAAP)


2023
Adjustments
(Non-
GAAP)(2,3)


2023
Adjusted Guidance
(Non-GAAP)(2,3)


Low

High


Low

High


2023 Chg
vs 2022
Adjusted

Sales:


Aerospace & Industrial

$

836


$


$

836


$

845


$

860


$


$

845


$

860


1 - 3%

Defense Electronics


690


690


725


750


725


750


5 - 9%

Naval & Power


1,031


1,031


1,085


1,100


1,085


1,100


5 - 7%

Total sales

$

2,557


$


$

2,557


$

2,655


$

2,710


$


$

2,655


$

2,710


4 to 6%


Operating income:


Aerospace & Industrial

$

137


$

1


$

138


$

143


$

148


$


$

143


$

148


4 - 7%

Defense Electronics


155


155


165


172


165


172


7 - 11%

Naval & Power


178


14


192


182


186


8


190


194


(1) - 1%

Total segments


469


15


484


490


506


8


498


514


Corporate and other


(46

)


5


(41

)


(35

)


(38

)


(35

)


(38

)


Total operating income

$

423


$

20


$

443


$

455


$

469


$

8


$

463


$

477


5 to 8%


Interest expense

$

(47

)


$


$

(47

)


$

(52

)

$

(54

)


$


$

(52

)

$

(54

)


Other income, net


13


4


17


27


28


27


28


Earnings before income taxes


389


24


413


430


443


8


438


451


Provision for income taxes


(95

)


(4

)


(99

)


(103

)


(106

)


(2

)


(105

)


(108

)


Net earnings

$

294


$

20


$

314


$

327


$

336


$

6


$

333


$

343


Diluted earnings per share

$

7.62


$

0.51


$

8.13


$

8.49


$

8.74


$

0.16


$

8.65


$

8.90


6 to 10%

Diluted shares outstanding


38.6


38.6


38.5


38.5


38.5


38.5


Effective tax rate


24.4

%


24.0

%


24.0

%


24.0

%


24.0

%


24.0

%


Operating margins:


Aerospace & Industrial


16.4

%


16.5

%


17.0

%


17.2

%


17.0

%


17.2

%


50 to 70 bps

Defense Electronics


22.4

%


22.4

%


22.7

%


22.9

%


22.7

%


22.9

%


30 to 50 bps

Naval & Power


17.2

%


18.6

%


16.7

%


16.9

%


17.5

%


17.7

%


(110) to (90) bps

Total operating margin


16.6

%


17.3

%


17.1

%


17.3

%


17.4

%


17.6

%


10 to 30 bps


Free cash flow

$

257


$

39


$

296


$

350


$

390


$

10


$

360


$

400


Notes: Full year amounts may not add due to rounding.


(1) 2022 Adjusted financials exclude the impact of first year purchase accounting adjustments, the loss on sale of our German valves business, costs associated with shareholder activism and pension settlement charges related to the retirement of two former executives.

(2) 2023 Adjusted financials exclude the impact of first year purchase accounting adjustments.

(3) Free Cash Flow is defined as cash flow from operations less capital expenditures. 2022 Adjusted Free Cash Flow excluded one-time pension settlement payments of $24 million and a legal settlement payment of $15 million. 2023 Adjusted Free Cash Flow guidance excludes a legal settlement payment of $10 million.


CURTISS-WRIGHT CORPORATION

2023 Sales Growth Guidance by End Market

As of February 21, 2023


2023 % Change
vs 2022 Adjusted(1)


% Total Sales


Aerospace & Defense Markets


Aerospace Defense

9 - 11%


20%

Ground Defense

4 - 6%


9%

Naval Defense

4 - 6%


27%

Commercial Aerospace

5 - 7%


11%

Total Aerospace & Defense

6 - 8%


67%


Commercial Markets


Power & Process

Flat


18%

General Industrial

2 - 4%


16%

Total Commercial

0 - 2%


33%


Total Curtiss-Wright Sales

4 - 6%


100%

Note: Sales percentages may not add due to rounding.


(1) 2023 and 2022 Sales include the contribution from the engineered arresting systems business, acquired on June 30, 2022, to the Aerospace Defense market.


About Curtiss-Wright Corporation

Curtiss-Wright Corporation (NYSE:CW) is a global integrated business that provides highly engineered products, solutions and services mainly to Aerospace & Defense markets, as well as critical technologies in demanding Commercial Power, Process and Industrial markets. We leverage a workforce of approximately 8,100 highly skilled employees who develop, design and build what we believe are the best engineered solutions to the markets we serve. Building on the heritage of Glenn Curtiss and the Wright brothers, Curtiss-Wright has a long tradition of providing innovative solutions through trusted customer relationships. For more information, visit www.curtisswright.com.

Certain statements made in this press release, including statements about future revenue, financial performance guidance, quarterly and annual revenue, net income, operating income growth, future business opportunities, cost saving initiatives, the successful integration of the Company’s acquisitions, and future cash flow from operations, are forward-looking statements within the meaning of the Private Securities Litigation Reform Act of 1995. These statements present management's expectations, beliefs, plans and objectives regarding future financial performance, and assumptions or judgments concerning such performance. Any discussions contained in this press release, except to the extent that they contain historical facts, are forward-looking and accordingly involve estimates, assumptions, judgments and uncertainties. Such forward-looking statements are subject to certain risks and uncertainties that could cause actual results to differ materially from those expressed or implied. Readers are cautioned not to place undue reliance on these forward-looking statements, which speak only as of the date hereof. Such risks and uncertainties include, but are not limited to: a reduction in anticipated orders; an economic downturn; changes in the competitive marketplace and/or customer requirements; a change in government spending; an inability to perform customer contracts at anticipated cost levels; and other factors that generally affect the business of aerospace, defense contracting, electronics, marine, and industrial companies. Such factors are detailed in the Company's Annual Report on Form 10-K for the fiscal year ended December 31, 2022, and subsequent reports filed with the Securities and Exchange Commission.

This press release and additional information are available at www.curtisswright.com.

Contacts

Jim Ryan
(704) 869-4621
[email protected]

Exhibit 99.2

 FEBRUARY 22, 2023  Q4 2022 EARNINGS CONFERENCE CALL  Conference Call Dial-in numbers:  (800) 274-8461 (domestic)  (203) 518-9843 (international)  Conference code: CWQ422 
 

 SAFE HARBOR STATEMENT  Please note that the information provided in this presentation is accurate as of the date of the original presentation. The presentation will remain posted on this website from one to twelve months following the initial presentation, but content will not be updated to reflect new information that may become available after the original presentation posting. The presentation contains forward-looking statements within the meaning of Section 27A of the Securities Act of 1933, as amended ("Securities Act"), Section 21E of the Securities Exchange Act of 1934, as amended ("Exchange Act"), and the Private Securities Litigation Reform Act of 1995. Such forward-looking statements only speak as of the date of this report and Curtiss-Wright Corporation assumes no obligation to update the information included in this report. Such forward-looking statements include, among other things, management's estimates of future performance, revenue and earnings, our management's growth objectives, our management’s ability to integrate our acquisition, and our management's ability to produce consistent operating improvements. These forward-looking statements are based on expectations as of the time the statements were made only, and are subject to a number of risks and uncertainties which could cause us to fail to achieve our then-current financial projections and other expectations, including the impact of a global pandemic or national epidemic.   This presentation also includes certain non-GAAP financial measures with reconciliations to GAAP financial measures being made available in the earnings release and this presentation that are posted to our website and furnished with the SEC. We undertake no duty to update this information. More information about potential factors that could affect our business and financial results is included in our filings with the Securities and Exchange Commission, including our Annual Reports on Form 10-K and Quarterly Reports on Form 10-Q, including, among other sections, under the captions, "Risk Factors" and "Management's Discussion and Analysis of Financial Condition and Results of Operations," which is on file with the SEC and available at the SEC's website at www.sec.gov.  2 
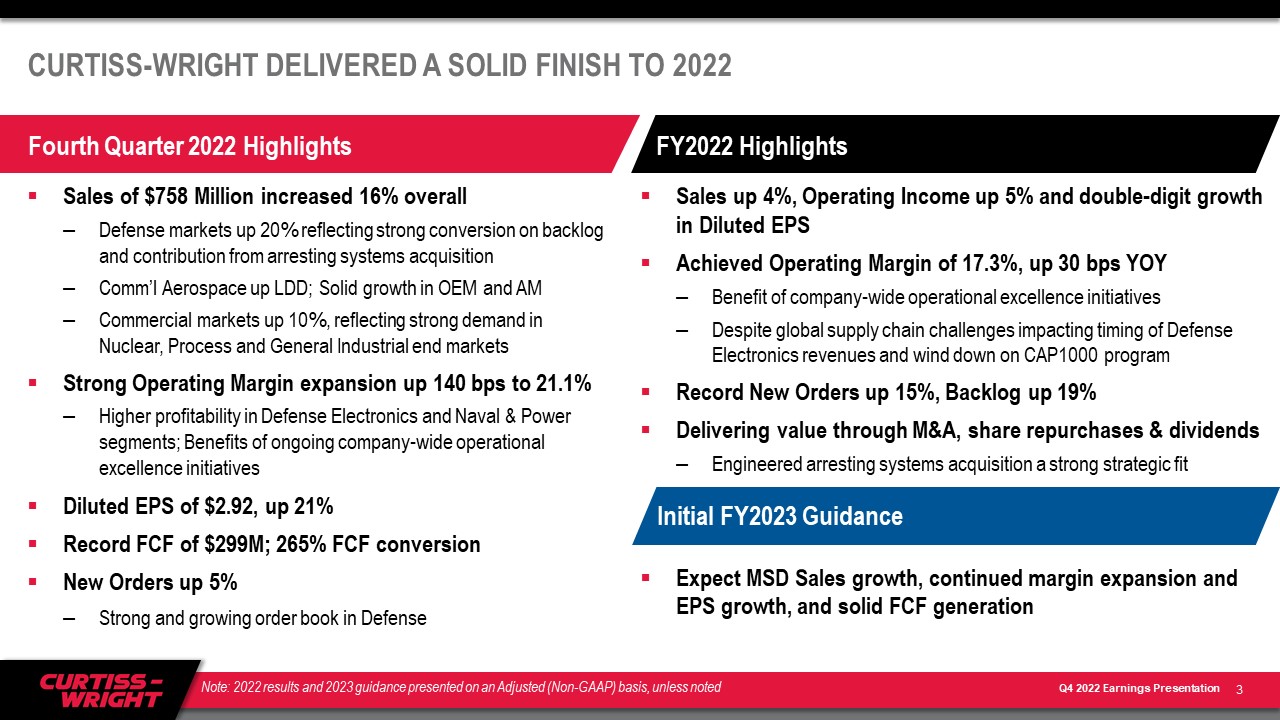
 

 CURTISS-WRIGHT DELIVERED A SOLID FINISH TO 2022  Sales up 4%, Operating Income up 5% and double-digit growth in Diluted EPS   Achieved Operating Margin of 17.3%, up 30 bps YOY  Benefit of company-wide operational excellence initiatives   Despite global supply chain challenges impacting timing of Defense Electronics revenues and wind down on CAP1000 program  Record New Orders up 15%, Backlog up 19%  Delivering value through M&A, share repurchases & dividends  Engineered arresting systems acquisition a strong strategic fit  Expect MSD Sales growth, continued margin expansion and EPS growth, and solid FCF generation   Sales of $758 Million increased 16% overall  Defense markets up 20% reflecting strong conversion on backlog and contribution from arresting systems acquisition  Comm’l Aerospace up LDD; Solid growth in OEM and AM  Commercial markets up 10%, reflecting strong demand in Nuclear, Process and General Industrial end markets  Strong Operating Margin expansion up 140 bps to 21.1%  Higher profitability in Defense Electronics and Naval & Power segments; Benefits of ongoing company-wide operational excellence initiatives  Diluted EPS of $2.92, up 21%  Record FCF of $299M; 265% FCF conversion  New Orders up 5%  Strong and growing order book in Defense  3  Fourth Quarter 2022 Highlights   FY2022 Highlights   Initial FY2023 Guidance  Note: 2022 results and 2023 guidance presented on an Adjusted (Non-GAAP) basis, unless noted 
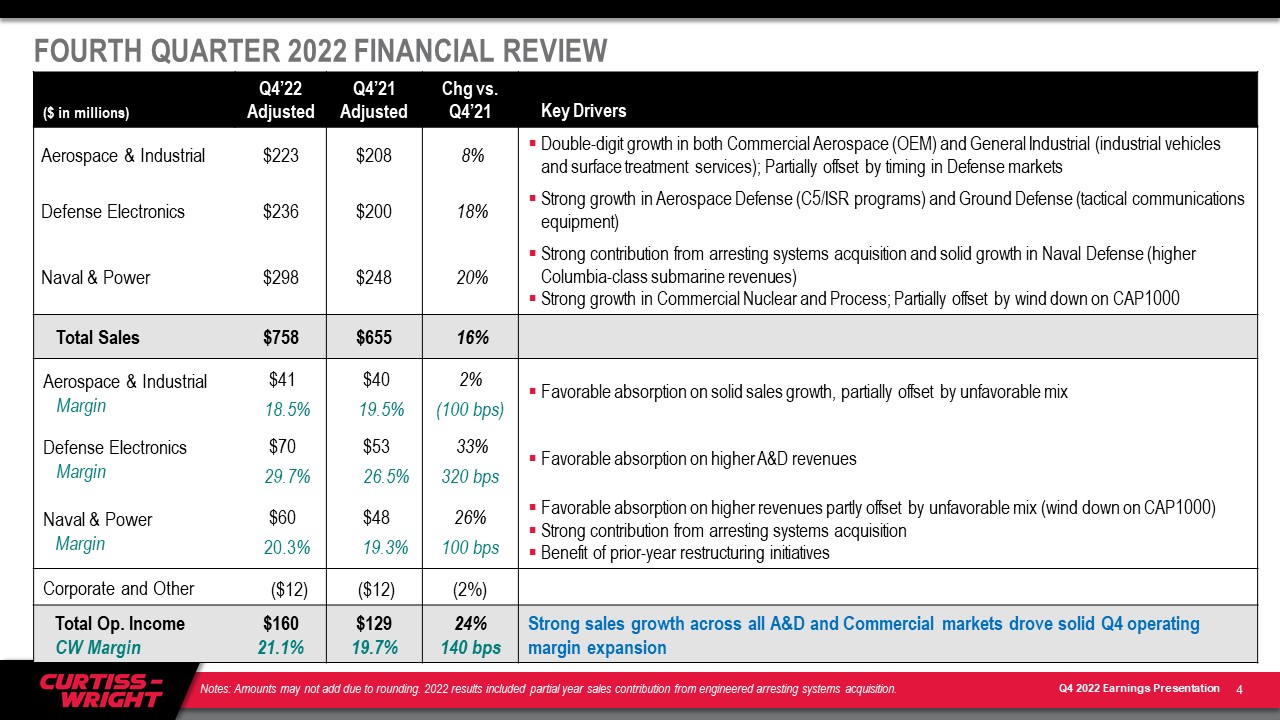
 

 FOURTH QUARTER 2022 FINANCIAL REVIEW  ($ in millions)  Q4’22 Adjusted  Q4’21 Adjusted  Chg vs. Q4’21  Key Drivers  Aerospace & Industrial   $223  $208   8%  Double-digit growth in both Commercial Aerospace (OEM) and General Industrial (industrial vehicles and surface treatment services); Partially offset by timing in Defense markets   Defense Electronics   $236  $200   18%  Strong growth in Aerospace Defense (C5/ISR programs) and Ground Defense (tactical communications equipment)  Naval & Power   $298  $248   20%  Strong contribution from arresting systems acquisition and solid growth in Naval Defense (higher Columbia-class submarine revenues)  Strong growth in Commercial Nuclear and Process; Partially offset by wind down on CAP1000  Total Sales  $758  $655   16%  Aerospace & Industrial   Margin   $41   18.5%   $40   19.5%  2%  (100 bps)  Favorable absorption on solid sales growth, partially offset by unfavorable mix  Defense Electronics   Margin   $70   29.7%   $53 26.5%   33%  320 bps  Favorable absorption on higher A&D revenues  Naval & Power   Margin   $60   20.3%   $48   19.3%  26%  100 bps  Favorable absorption on higher revenues partly offset by unfavorable mix (wind down on CAP1000)  Strong contribution from arresting systems acquisition   Benefit of prior-year restructuring initiatives  Corporate and Other  ($12)   ($12)  (2%)  Total Op. Income  CW Margin  $160  21.1%  $129  19.7%  24%  140 bps  Strong sales growth across all A&D and Commercial markets drove solid Q4 operating margin expansion  4  Notes: Amounts may not add due to rounding. 2022 results included partial year sales contribution from engineered arresting systems acquisition. 
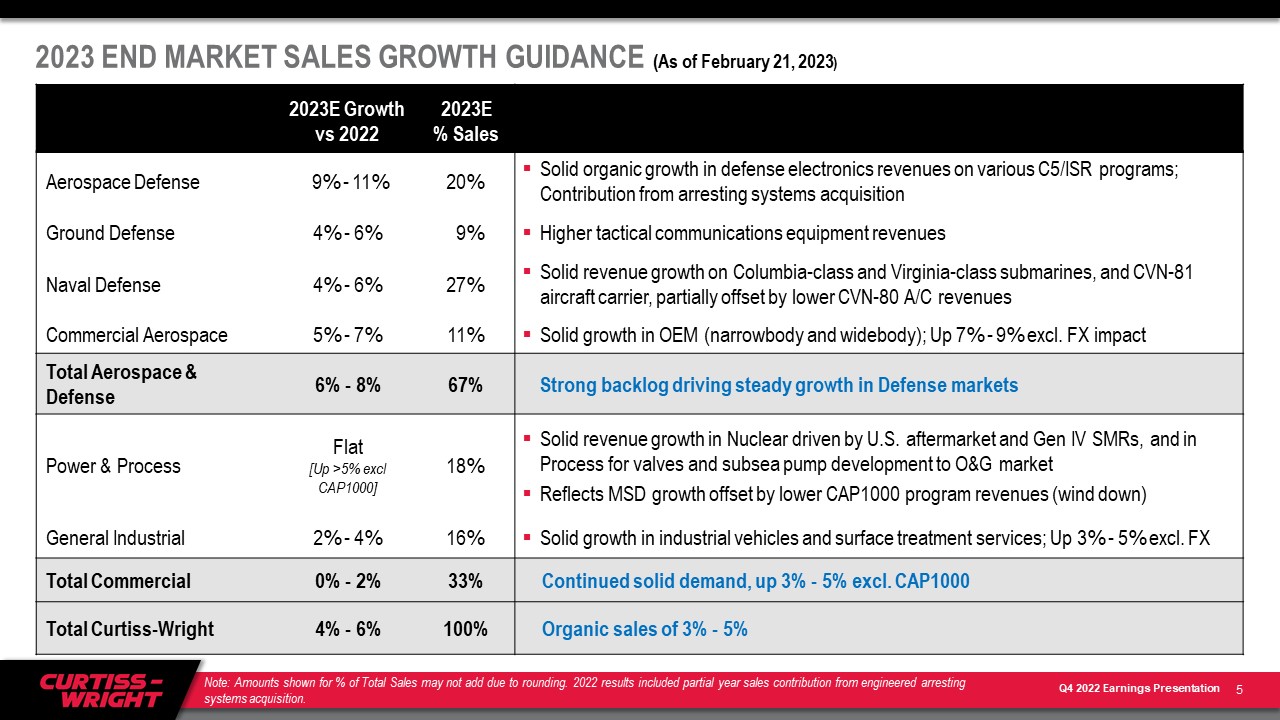
 

 2023 END MARKET SALES GROWTH GUIDANCE (As of February 21, 2023)  2023E Growth vs 2022   2023E % Sales  Aerospace Defense   9% - 11%  20%  Solid organic growth in defense electronics revenues on various C5/ISR programs; Contribution from arresting systems acquisition  Ground Defense  4% - 6%   9%  Higher tactical communications equipment revenues  Naval Defense  4% - 6%  27%  Solid revenue growth on Columbia-class and Virginia-class submarines, and CVN-81 aircraft carrier, partially offset by lower CVN-80 A/C revenues  Commercial Aerospace  5% - 7%  11%  Solid growth in OEM (narrowbody and widebody); Up 7% - 9% excl. FX impact  Total Aerospace & Defense  6% - 8%  67%  Strong backlog driving steady growth in Defense markets  Power & Process  Flat   [Up >5% excl CAP1000]  18%  Solid revenue growth in Nuclear driven by U.S. aftermarket and Gen IV SMRs, and in Process for valves and subsea pump development to O&G market  Reflects MSD growth offset by lower CAP1000 program revenues (wind down)   General Industrial   2% - 4%  16%  Solid growth in industrial vehicles and surface treatment services; Up 3% - 5% excl. FX  Total Commercial  0% - 2%  33%  Continued solid demand, up 3% - 5% excl. CAP1000  Total Curtiss-Wright  4% - 6%  100%  Organic sales of 3% - 5%  5  Note: Amounts shown for % of Total Sales may not add due to rounding. 2022 results included partial year sales contribution from engineered arresting systems acquisition. 
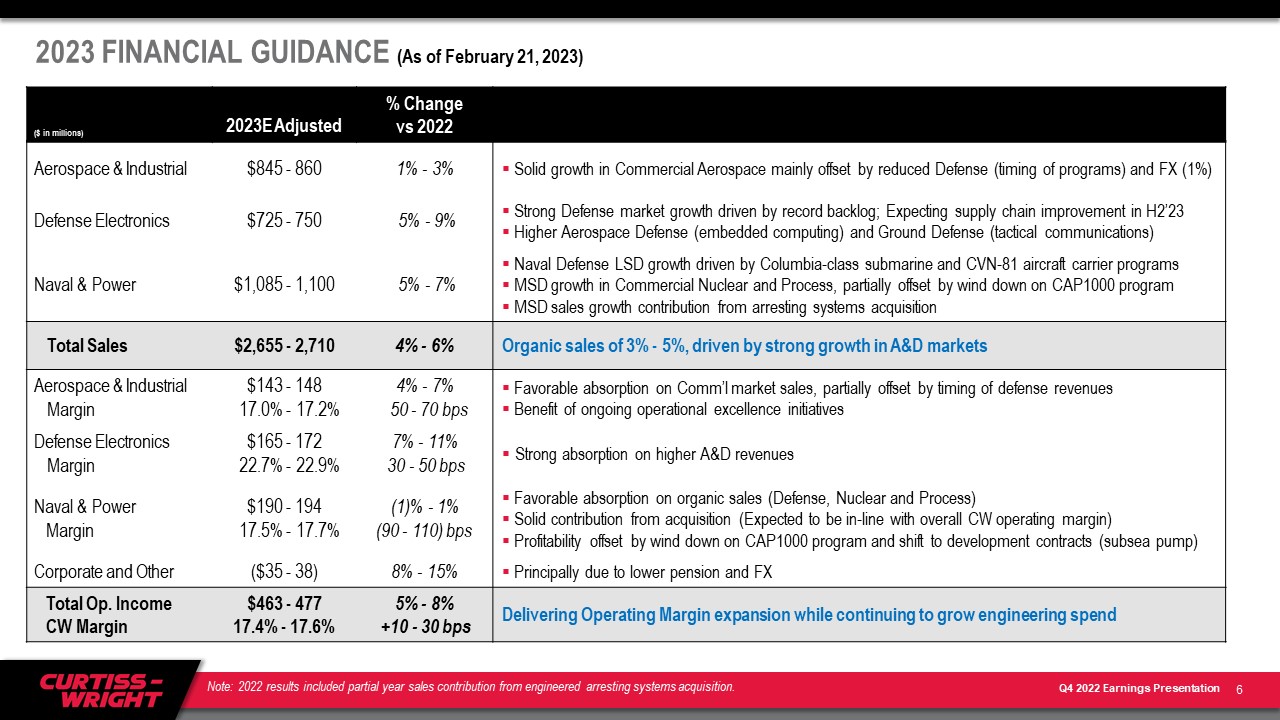
 

 ($ in millions)  2023E Adjusted  % Change vs 2022  Aerospace & Industrial  $845 - 860  1% - 3%  Solid growth in Commercial Aerospace mainly offset by reduced Defense (timing of programs) and FX (1%)  Defense Electronics  $725 - 750   5% - 9%  Strong Defense market growth driven by record backlog; Expecting supply chain improvement in H2’23   Higher Aerospace Defense (embedded computing) and Ground Defense (tactical communications)  Naval & Power  $1,085 - 1,100   5% - 7%  Naval Defense LSD growth driven by Columbia-class submarine and CVN-81 aircraft carrier programs  MSD growth in Commercial Nuclear and Process, partially offset by wind down on CAP1000 program  MSD sales growth contribution from arresting systems acquisition  Total Sales  $2,655 - 2,710  4% - 6%  Organic sales of 3% - 5%, driven by strong growth in A&D markets  Aerospace & Industrial  Margin  $143 - 148   17.0% - 17.2%  4% - 7%   50 - 70 bps  Favorable absorption on Comm’l market sales, partially offset by timing of defense revenues  Benefit of ongoing operational excellence initiatives  Defense Electronics  Margin  $165 - 172   22.7% - 22.9%  7% - 11%   30 - 50 bps  Strong absorption on higher A&D revenues  Naval & Power  Margin  $190 - 194    17.5% - 17.7%  (1)% - 1%  (90 - 110) bps  Favorable absorption on organic sales (Defense, Nuclear and Process)  Solid contribution from acquisition (Expected to be in-line with overall CW operating margin)  Profitability offset by wind down on CAP1000 program and shift to development contracts (subsea pump)  Corporate and Other  ($35 - 38)  8% - 15%  Principally due to lower pension and FX  Total Op. Income  CW Margin  $463 - 477  17.4% - 17.6%  5% - 8%   +10 - 30 bps  Delivering Operating Margin expansion while continuing to grow engineering spend   2023 FINANCIAL GUIDANCE (As of February 21, 2023)  6   Note: 2022 results included partial year sales contribution from engineered arresting systems acquisition. 
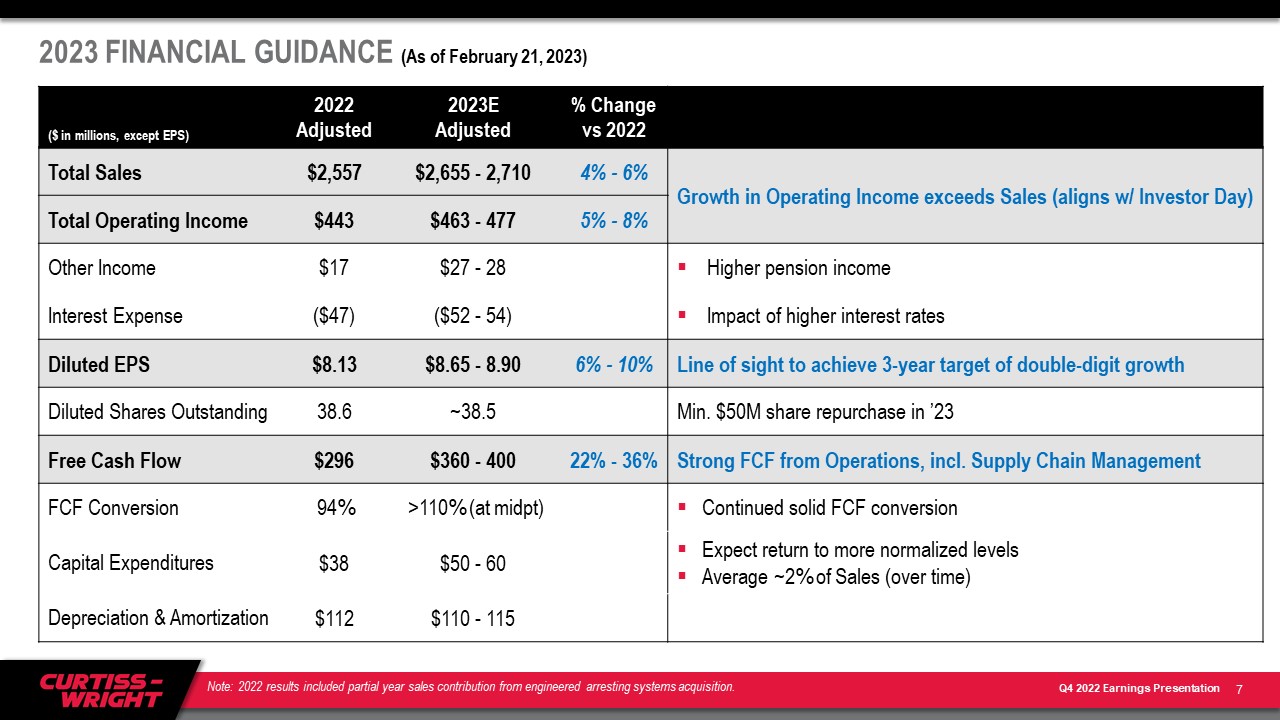
 

 2023 FINANCIAL GUIDANCE (As of February 21, 2023)  ($ in millions, except EPS)  2022 Adjusted  2023E   Adjusted  % Change vs 2022  Total Sales  $2,557  $2,655 - 2,710  4% - 6%  Growth in Operating Income exceeds Sales (aligns w/ Investor Day)  Total Operating Income  $443  $463 - 477  5% - 8%   Growth in operating income exceeds sales (aligned w/ Investor Day)  Other Income  $17  $27 - 28  Higher pension income  Interest Expense  ($47)  ($52 - 54)  Impact of higher interest rates  Diluted EPS  $8.13  $8.65 - 8.90  6% - 10%  Line of sight to achieve 3-year target of double-digit growth  Diluted Shares Outstanding  38.6  ~38.5  Min. $50M share repurchase in ’23  Free Cash Flow  $296  $360 - 400  22% - 36%  Strong FCF from Operations, incl. Supply Chain Management  FCF Conversion   94%   >110% (at midpt)  Continued solid FCF conversion   Capital Expenditures  $38  $50 - 60  Expect return to more normalized levels  Average ~2% of Sales (over time)  Depreciation & Amortization  $112  $110 - 115  7   Note: 2022 results included partial year sales contribution from engineered arresting systems acquisition.  
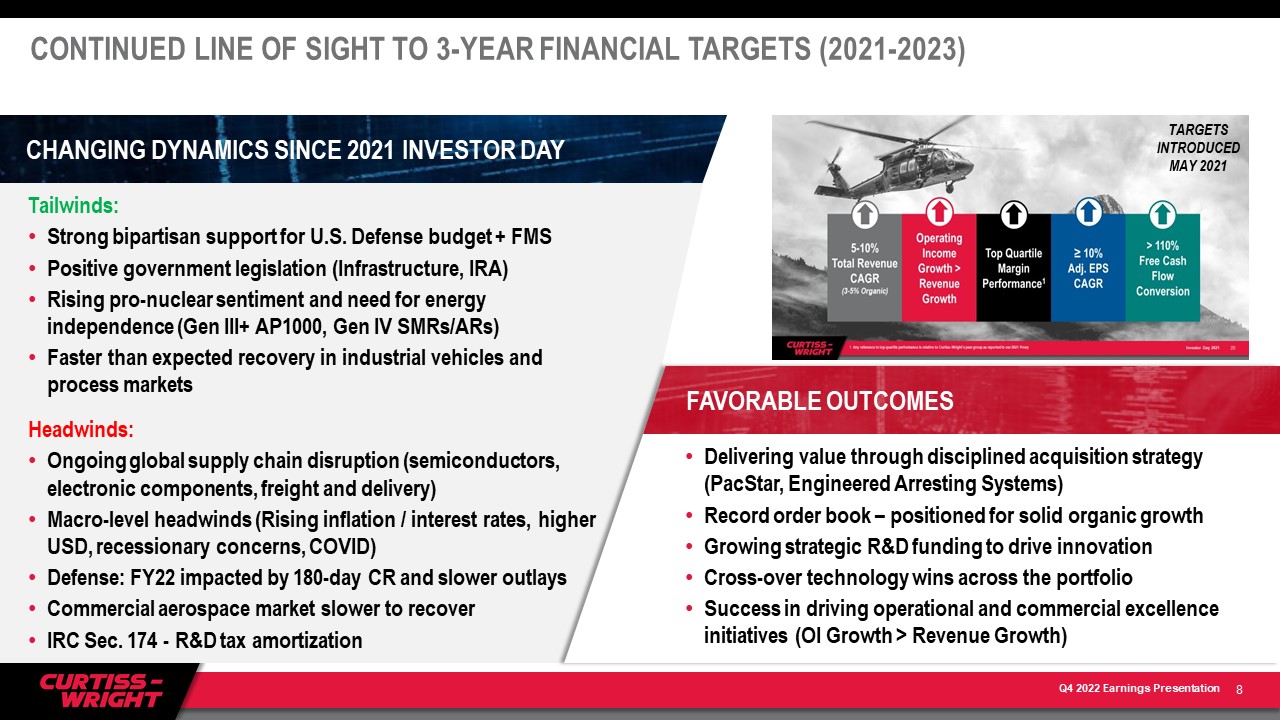
 

 8  CONTINUED LINE OF SIGHT TO 3-YEAR FINANCIAL TARGETS (2021-2023)  CHANGING DYNAMICS SINCE 2021 INVESTOR DAY  FAVORABLE OUTCOMES  Tailwinds:  Strong bipartisan support for U.S. Defense budget + FMS  Positive government legislation (Infrastructure, IRA)  Rising pro-nuclear sentiment and need for energy independence (Gen III+ AP1000, Gen IV SMRs/ARs)  Faster than expected recovery in industrial vehicles and process markets  Headwinds:  Ongoing global supply chain disruption (semiconductors, electronic components, freight and delivery)  Macro-level headwinds (Rising inflation / interest rates, higher USD, recessionary concerns, COVID)  Defense: FY22 impacted by 180-day CR and slower outlays  Commercial aerospace market slower to recover  IRC Sec. 174 - R&D tax amortization  Delivering value through disciplined acquisition strategy (PacStar, Engineered Arresting Systems)  Record order book – positioned for solid organic growth  Growing strategic R&D funding to drive innovation  Cross-over technology wins across the portfolio  Success in driving operational and commercial excellence initiatives (OI Growth > Revenue Growth)  TARGETS INTRODUCED MAY 2021 
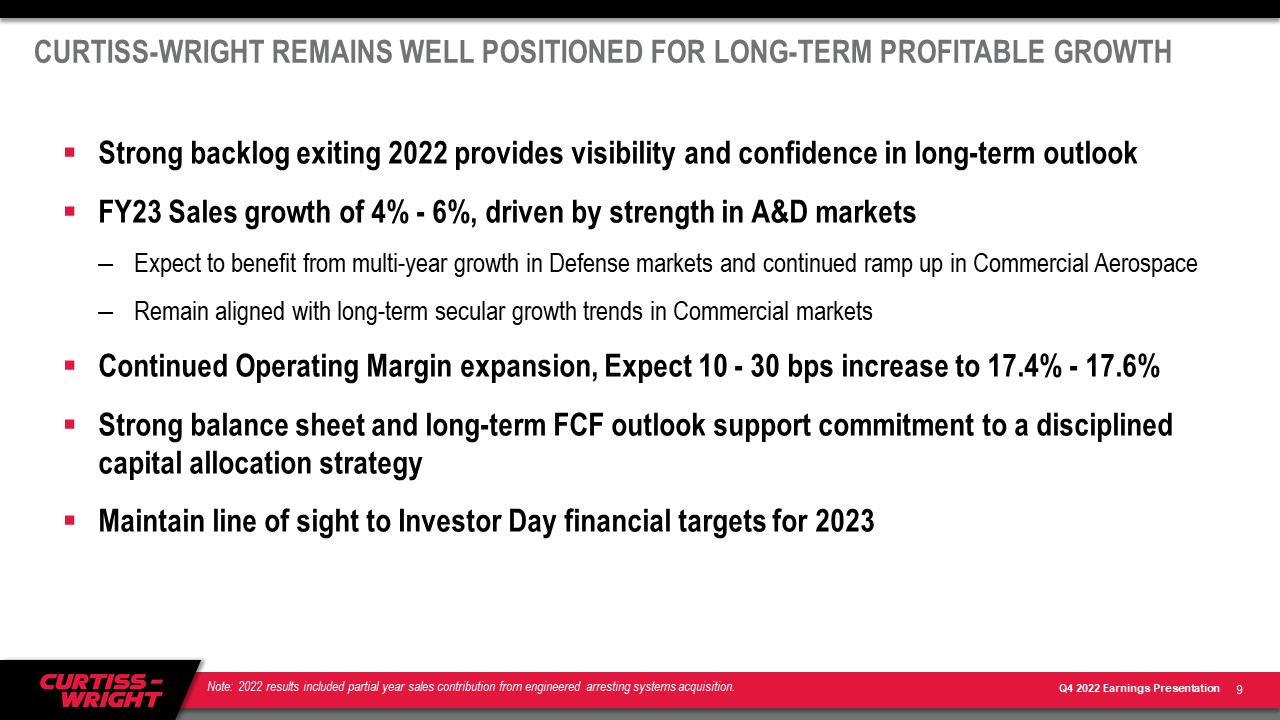
 

 CURTISS-WRIGHT REMAINS WELL POSITIONED FOR LONG-TERM PROFITABLE GROWTH  9  Strong backlog exiting 2022 provides visibility and confidence in long-term outlook   FY23 Sales growth of 4% - 6%, driven by strength in A&D markets  Expect to benefit from multi-year growth in Defense markets and continued ramp up in Commercial Aerospace   Remain aligned with long-term secular growth trends in Commercial markets  Continued Operating Margin expansion, Expect 10 - 30 bps increase to 17.4% - 17.6%  Strong balance sheet and long-term FCF outlook support commitment to a disciplined capital allocation strategy  Maintain line of sight to Investor Day financial targets for 2023    Note: 2022 results included partial year sales contribution from engineered arresting systems acquisition.  
 

 Appendix  10 
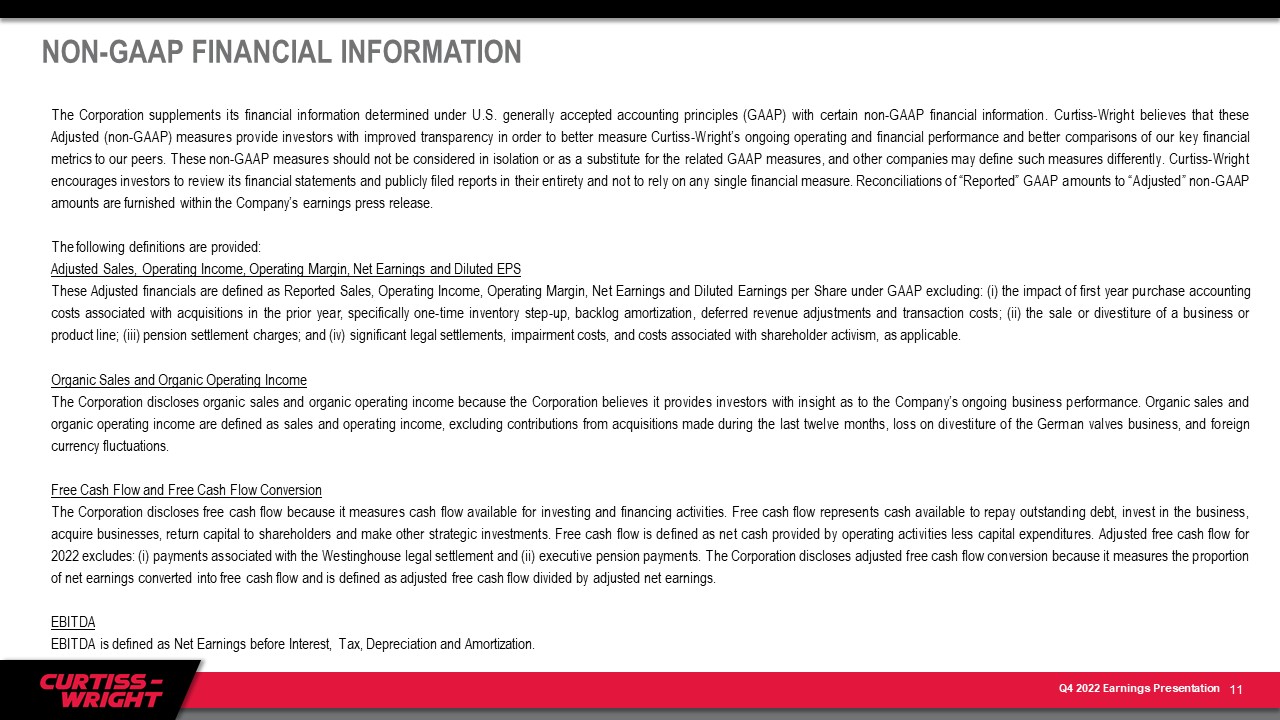
 

 NON-GAAP FINANCIAL INFORMATION  The Corporation supplements its financial information determined under U.S. generally accepted accounting principles (GAAP) with certain non-GAAP financial information. Curtiss-Wright believes that these Adjusted (non-GAAP) measures provide investors with improved transparency in order to better measure Curtiss-Wright’s ongoing operating and financial performance and better comparisons of our key financial metrics to our peers. These non-GAAP measures should not be considered in isolation or as a substitute for the related GAAP measures, and other companies may define such measures differently. Curtiss-Wright encourages investors to review its financial statements and publicly filed reports in their entirety and not to rely on any single financial measure. Reconciliations of “Reported” GAAP amounts to “Adjusted” non-GAAP amounts are furnished within the Company’s earnings press release.     The following definitions are provided:  Adjusted Sales, Operating Income, Operating Margin, Net Earnings and Diluted EPS  These Adjusted financials are defined as Reported Sales, Operating Income, Operating Margin, Net Earnings and Diluted Earnings per Share under GAAP excluding: (i) the impact of first year purchase accounting costs associated with acquisitions in the prior year, specifically one-time inventory step-up, backlog amortization, deferred revenue adjustments and transaction costs; (ii) the sale or divestiture of a business or product line; (iii) pension settlement charges; and (iv) significant legal settlements, impairment costs, and costs associated with shareholder activism, as applicable.   Organic Sales and Organic Operating Income  The Corporation discloses organic sales and organic operating income because the Corporation believes it provides investors with insight as to the Company’s ongoing business performance. Organic sales and organic operating income are defined as sales and operating income, excluding contributions from acquisitions made during the last twelve months, loss on divestiture of the German valves business, and foreign currency fluctuations.   Free Cash Flow and Free Cash Flow Conversion  The Corporation discloses free cash flow because it measures cash flow available for investing and financing activities. Free cash flow represents cash available to repay outstanding debt, invest in the business, acquire businesses, return capital to shareholders and make other strategic investments. Free cash flow is defined as net cash provided by operating activities less capital expenditures. Adjusted free cash flow for 2022 excludes: (i) payments associated with the Westinghouse legal settlement and (ii) executive pension payments. The Corporation discloses adjusted free cash flow conversion because it measures the proportion of net earnings converted into free cash flow and is defined as adjusted free cash flow divided by adjusted net earnings.   EBITDA  EBITDA is defined as Net Earnings before Interest, Tax, Depreciation and Amortization.   11 
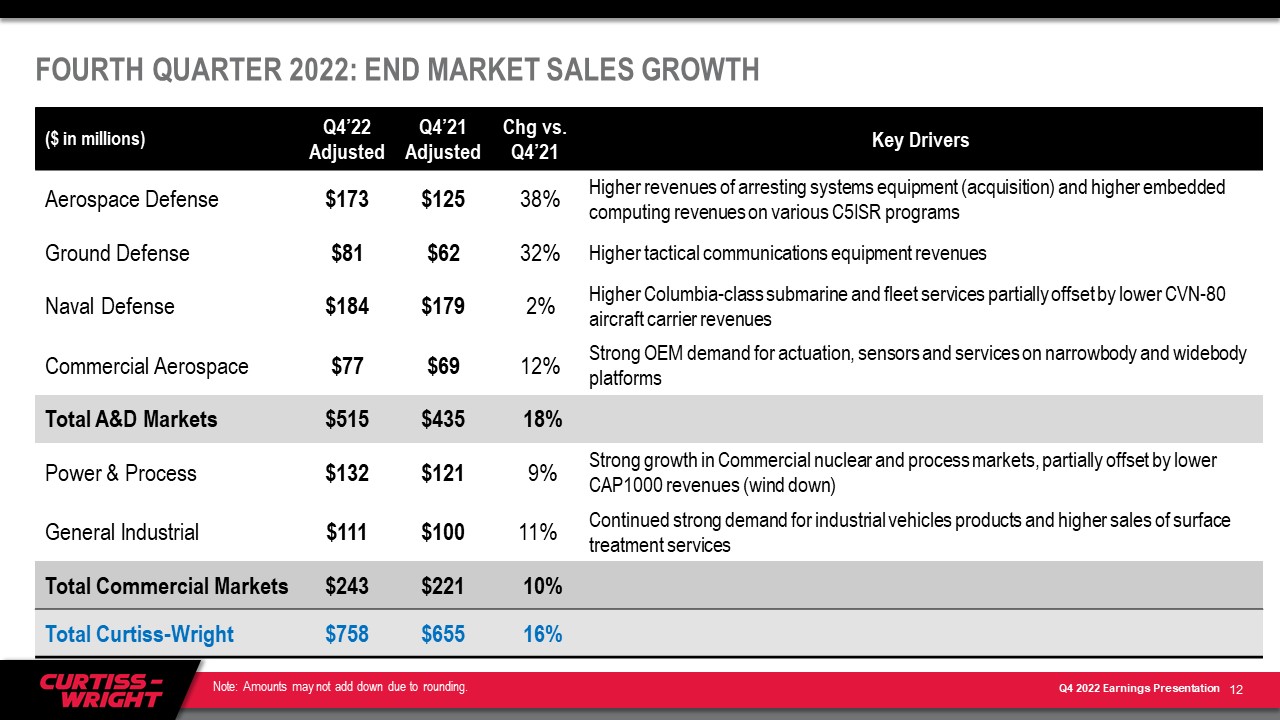
 

 FOURTH QUARTER 2022: END MARKET SALES GROWTH  ($ in millions)  Q4’22 Adjusted  Q4’21 Adjusted  Chg vs. Q4’21  Key Drivers  Aerospace Defense  $173  $125   38%  Higher revenues of arresting systems equipment (acquisition) and higher embedded computing revenues on various C5ISR programs  Ground Defense  $81  $62   32%  Higher tactical communications equipment revenues  Naval Defense  $184  $179   2%  Higher Columbia-class submarine and fleet services partially offset by lower CVN-80 aircraft carrier revenues  Commercial Aerospace  $77  $69   12%  Strong OEM demand for actuation, sensors and services on narrowbody and widebody platforms  Total A&D Markets  $515  $435   18%  Power & Process  $132  $121   9%  Strong growth in Commercial nuclear and process markets, partially offset by lower CAP1000 revenues (wind down)  General Industrial   $111  $100   11%  Continued strong demand for industrial vehicles products and higher sales of surface treatment services  Total Commercial Markets  $243  $221   10%  Total Curtiss-Wright  $758  $655   16%  12  Note: Amounts may not add down due to rounding. 
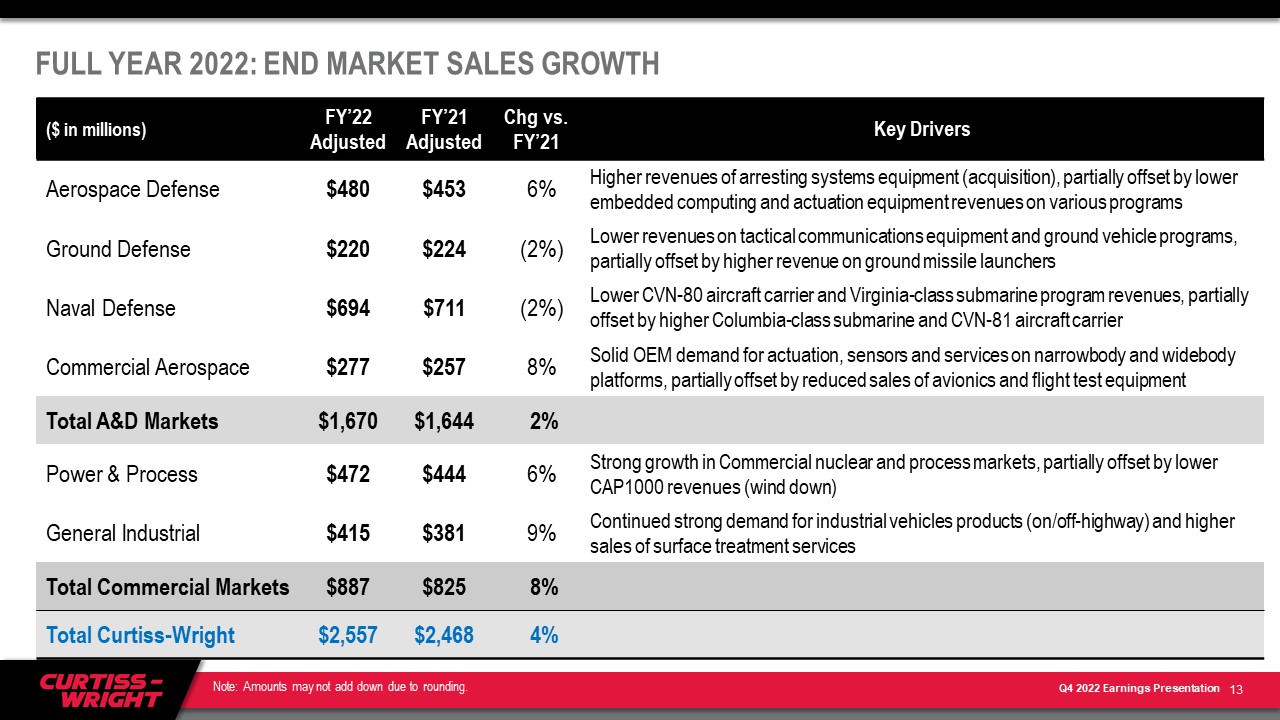
 

 FULL YEAR 2022: END MARKET SALES GROWTH  ($ in millions)  FY’22 Adjusted  FY’21 Adjusted  Chg vs. FY’21  Key Drivers  Aerospace Defense  $480  $453   6%  Higher revenues of arresting systems equipment (acquisition), partially offset by lower embedded computing and actuation equipment revenues on various programs  Ground Defense  $220  $224   (2%)  Lower revenues on tactical communications equipment and ground vehicle programs, partially offset by higher revenue on ground missile launchers  Naval Defense  $694  $711   (2%)  Lower CVN-80 aircraft carrier and Virginia-class submarine program revenues, partially offset by higher Columbia-class submarine and CVN-81 aircraft carrier  Commercial Aerospace  $277  $257   8%  Solid OEM demand for actuation, sensors and services on narrowbody and widebody platforms, partially offset by reduced sales of avionics and flight test equipment  Total A&D Markets  $1,670  $1,644   2%  Power & Process  $472  $444   6%  Strong growth in Commercial nuclear and process markets, partially offset by lower CAP1000 revenues (wind down)  General Industrial   $415  $381   9%  Continued strong demand for industrial vehicles products (on/off-highway) and higher sales of surface treatment services  Total Commercial Markets  $887  $825   8%  Total Curtiss-Wright  $2,557  $2,468   4%  13  Note: Amounts may not add down due to rounding. 
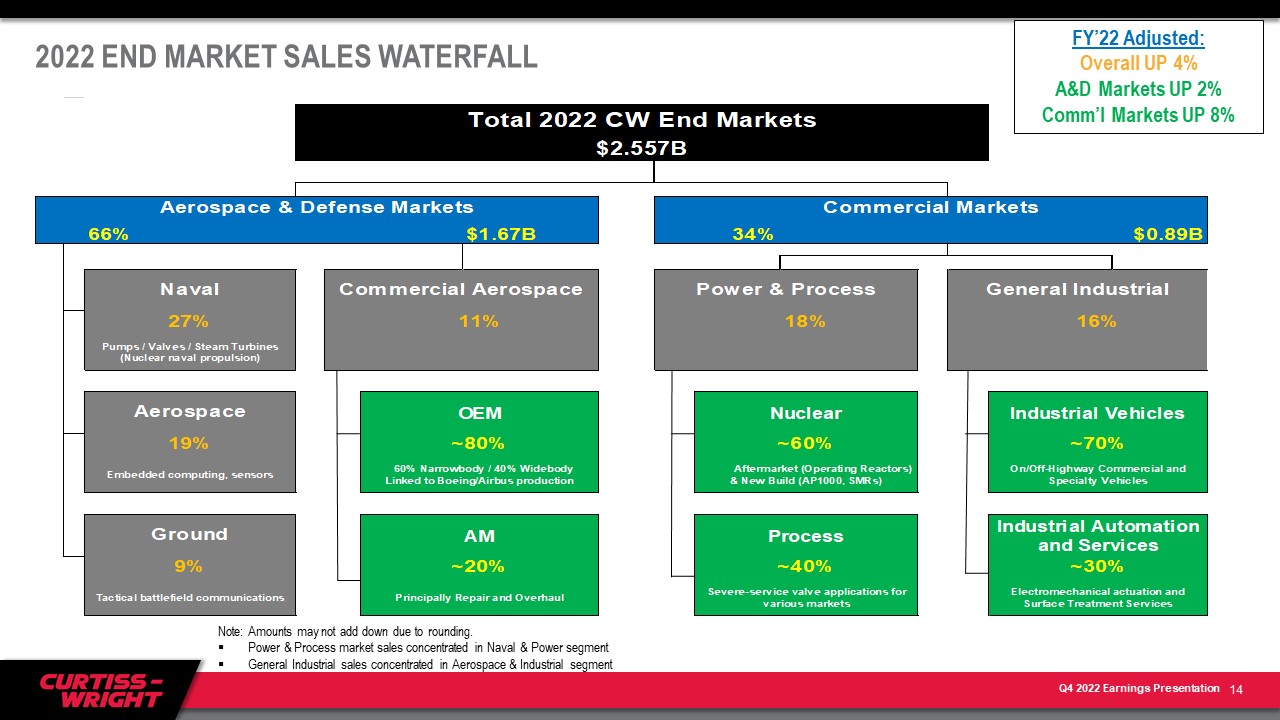
 

 2022 END MARKET SALES WATERFALL   FY’22 Adjusted:  Overall UP 4%  A&D Markets UP 2%  Comm’l Markets UP 8%  Note: Amounts may not add down due to rounding.  Power & Process market sales concentrated in Naval & Power segment  General Industrial sales concentrated in Aerospace & Industrial segment  14 
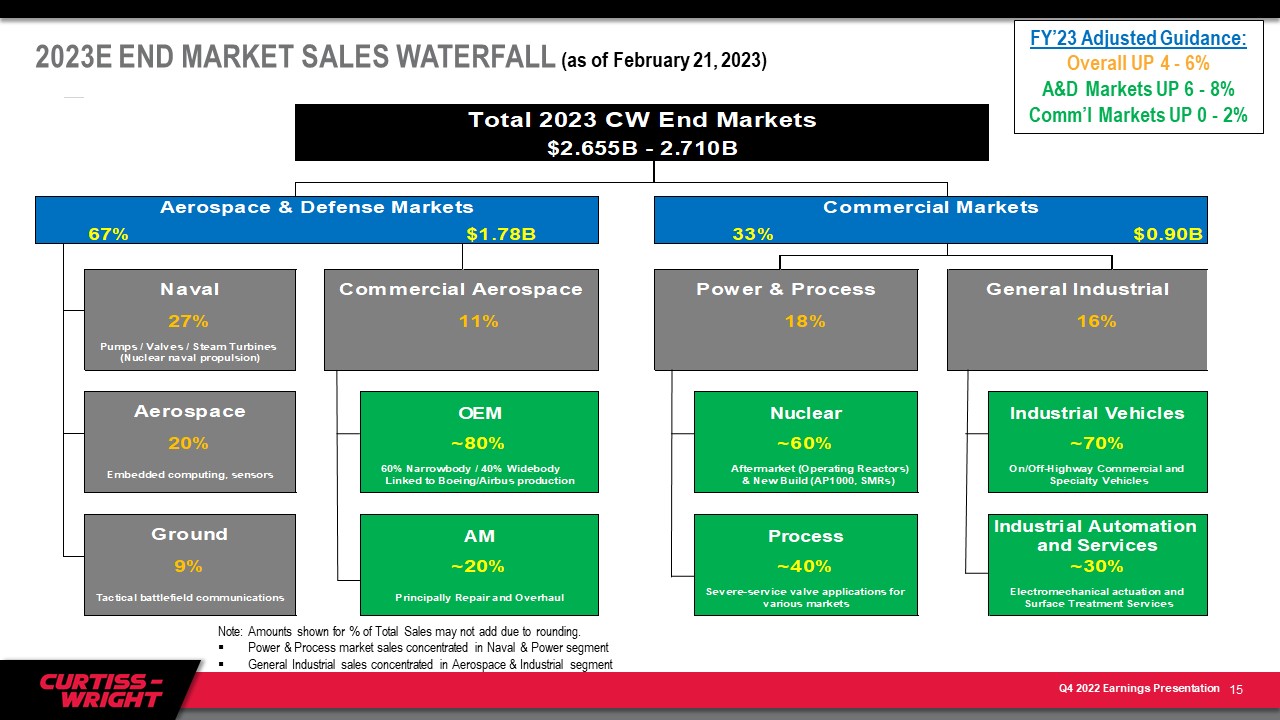
 

 2023E END MARKET SALES WATERFALL (as of February 21, 2023)  FY’23 Adjusted Guidance:  Overall UP 4 - 6%  A&D Markets UP 6 - 8%  Comm’l Markets UP 0 - 2%  Note: Amounts shown for % of Total Sales may not add due to rounding.  Power & Process market sales concentrated in Naval & Power segment  General Industrial sales concentrated in Aerospace & Industrial segment  15