Q4 2024 Earnings Presentation February 13, 2025 Q4 2024 EARNINGS CONFERENCE CALL Webcast Login: curtisswright.com/investor-relations/ Conference Call Dial-in numbers: (800) 343-5172 (domestic) (203) 518-9856 (international) Conference code: CWQ424
Q4 2024 Earnings Presentation SAFE HARBOR STATEMENT Please note that the information provided in this presentation is accurate as of the date of the original presentation. The presentation will remain posted on this website from one to twelve months following the initial presentation, but content will not be updated to reflect new information that may become available after the original presentation posting. The presentation contains forward-looking statements within the meaning of Section 27A of the Securities Act of 1933, as amended ("Securities Act"), Section 21E of the Securities Exchange Act of 1934, as amended ("Exchange Act"), and the Private Securities Litigation Reform Act of 1995. Such forward-looking statements only speak as of the date of this report and Curtiss-Wright Corporation assumes no obligation to update the information included in this report. Such forward-looking statements include, among other things, management's estimates of future performance, revenue and earnings, our management's growth objectives, our management’s ability to integrate our acquisition, and our management's ability to produce consistent operating improvements. These forward-looking statements are based on expectations as of the time the statements were made only, and are subject to a number of risks and uncertainties which could cause us to fail to achieve our then-current financial projections and other expectations, including the impact of a global pandemic or national epidemic. This presentation also includes certain non-GAAP financial measures with reconciliations to GAAP financial measures being made available in the earnings release and this presentation that are posted to our website and furnished with the SEC. We undertake no duty to update this information. More information about potential factors that could affect our business and financial results is included in our filings with the Securities and Exchange Commission, including our Annual Reports on Form 10-K and Quarterly Reports on Form 10-Q, including, among other sections, under the captions, "Risk Factors" and "Management's Discussion and Analysis of Financial Condition and Results of Operations," which is on file with the SEC and available at the SEC's website at www.sec.gov. 2
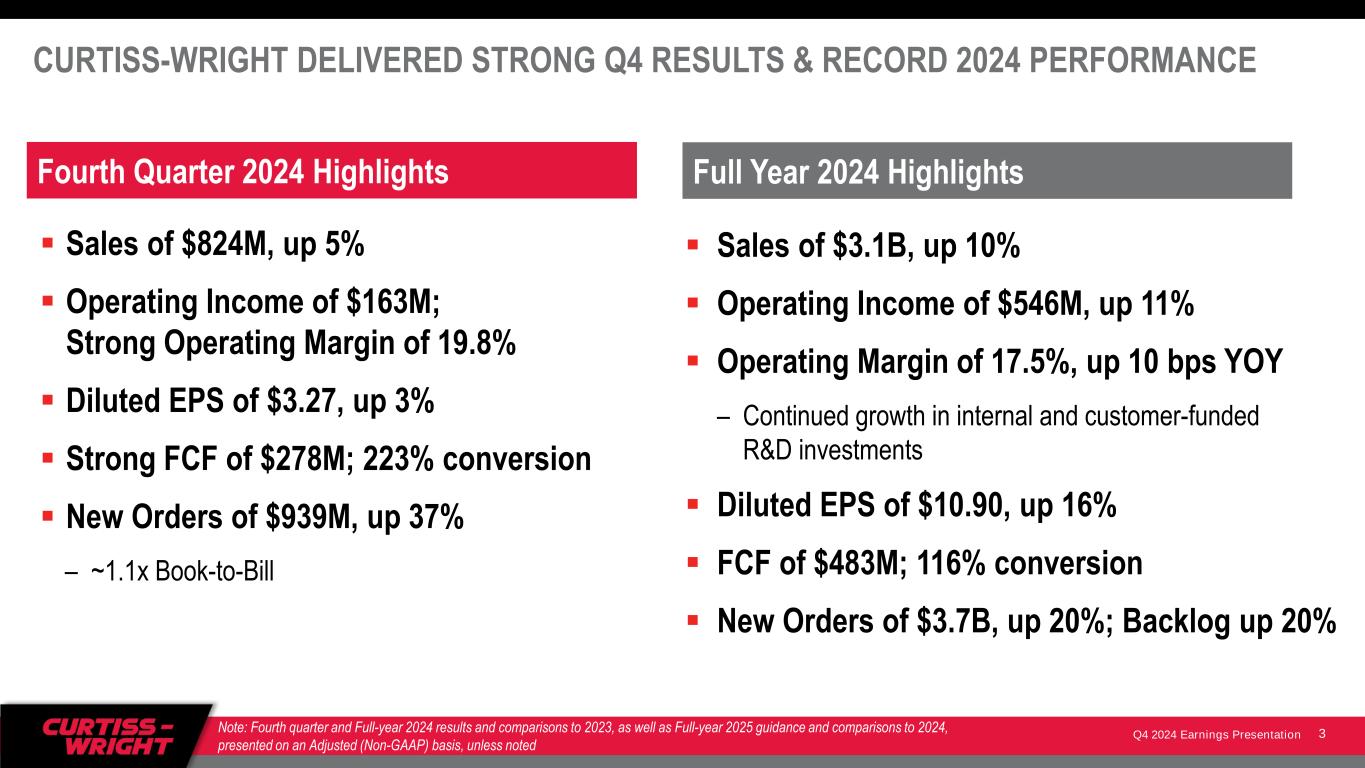
Q4 2024 Earnings Presentation CURTISS-WRIGHT DELIVERED STRONG Q4 RESULTS & RECORD 2024 PERFORMANCE ▪ Sales of $824M, up 5% ▪ Operating Income of $163M; Strong Operating Margin of 19.8% ▪ Diluted EPS of $3.27, up 3% ▪ Strong FCF of $278M; 223% conversion ▪ New Orders of $939M, up 37% – ~1.1x Book-to-Bill Note: Fourth quarter and Full-year 2024 results and comparisons to 2023, as well as Full-year 2025 guidance and comparisons to 2024, presented on an Adjusted (Non-GAAP) basis, unless noted ▪ Sales of $3.1B, up 10% ▪ Operating Income of $546M, up 11% ▪ Operating Margin of 17.5%, up 10 bps YOY – Continued growth in internal and customer-funded R&D investments ▪ Diluted EPS of $10.90, up 16% ▪ FCF of $483M; 116% conversion ▪ New Orders of $3.7B, up 20%; Backlog up 20% Full Year 2024 Highlights Fourth Quarter 2024 Highlights 3
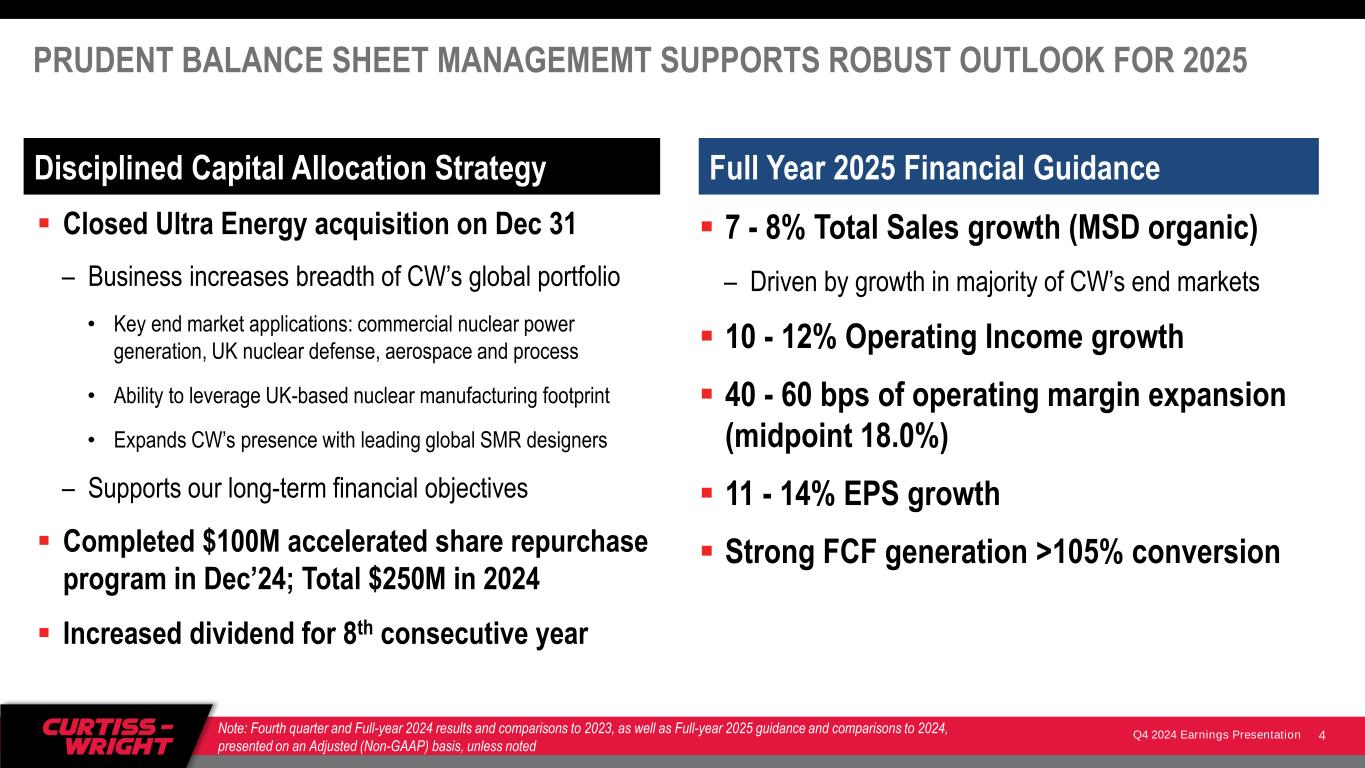
Q4 2024 Earnings Presentation PRUDENT BALANCE SHEET MANAGEMEMT SUPPORTS ROBUST OUTLOOK FOR 2025 ▪ Closed Ultra Energy acquisition on Dec 31 – Business increases breadth of CW’s global portfolio • Key end market applications: commercial nuclear power generation, UK nuclear defense, aerospace and process • Ability to leverage UK-based nuclear manufacturing footprint • Expands CW’s presence with leading global SMR designers – Supports our long-term financial objectives ▪ Completed $100M accelerated share repurchase program in Dec’24; Total $250M in 2024 ▪ Increased dividend for 8th consecutive year Note: Fourth quarter and Full-year 2024 results and comparisons to 2023, as well as Full-year 2025 guidance and comparisons to 2024, presented on an Adjusted (Non-GAAP) basis, unless noted ▪ 7 - 8% Total Sales growth (MSD organic) – Driven by growth in majority of CW’s end markets ▪ 10 - 12% Operating Income growth ▪ 40 - 60 bps of operating margin expansion (midpoint 18.0%) ▪ 11 - 14% EPS growth ▪ Strong FCF generation >105% conversion Full Year 2025 Financial GuidanceDisciplined Capital Allocation Strategy 4
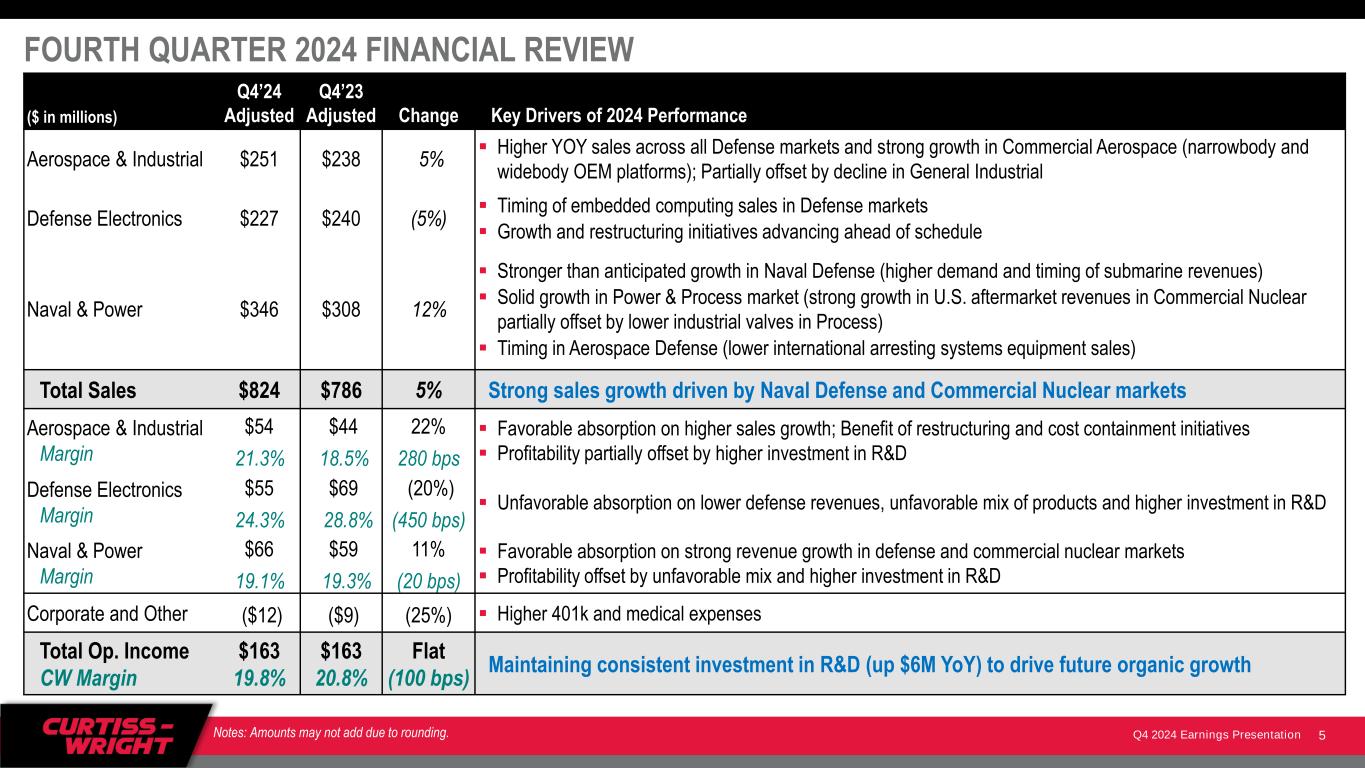
Q4 2024 Earnings Presentation FOURTH QUARTER 2024 FINANCIAL REVIEW ($ in millions) Q4’24 Adjusted Q4’23 Adjusted Change Key Drivers of 2024 Performance Aerospace & Industrial $251 $238 5% ▪ Higher YOY sales across all Defense markets and strong growth in Commercial Aerospace (narrowbody and widebody OEM platforms); Partially offset by decline in General Industrial Defense Electronics $227 $240 (5%) ▪ Timing of embedded computing sales in Defense markets ▪ Growth and restructuring initiatives advancing ahead of schedule Naval & Power $346 $308 12% ▪ Stronger than anticipated growth in Naval Defense (higher demand and timing of submarine revenues) ▪ Solid growth in Power & Process market (strong growth in U.S. aftermarket revenues in Commercial Nuclear partially offset by lower industrial valves in Process) ▪ Timing in Aerospace Defense (lower international arresting systems equipment sales) Total Sales $824 $786 5% Strong sales growth driven by Naval Defense and Commercial Nuclear markets Aerospace & Industrial Margin $54 21.3% $44 18.5% 22% 280 bps ▪ Favorable absorption on higher sales growth; Benefit of restructuring and cost containment initiatives ▪ Profitability partially offset by higher investment in R&D Defense Electronics Margin $55 24.3% $69 28.8% (20%) (450 bps) ▪ Unfavorable absorption on lower defense revenues, unfavorable mix of products and higher investment in R&D Naval & Power Margin $66 19.1% $59 19.3% 11% (20 bps) ▪ Favorable absorption on strong revenue growth in defense and commercial nuclear markets ▪ Profitability offset by unfavorable mix and higher investment in R&D Corporate and Other ($12) ($9) (25%) ▪ Higher 401k and medical expenses Total Op. Income CW Margin $163 19.8% $163 20.8% Flat (100 bps) Maintaining consistent investment in R&D (up $6M YoY) to drive future organic growth 5Notes: Amounts may not add due to rounding.
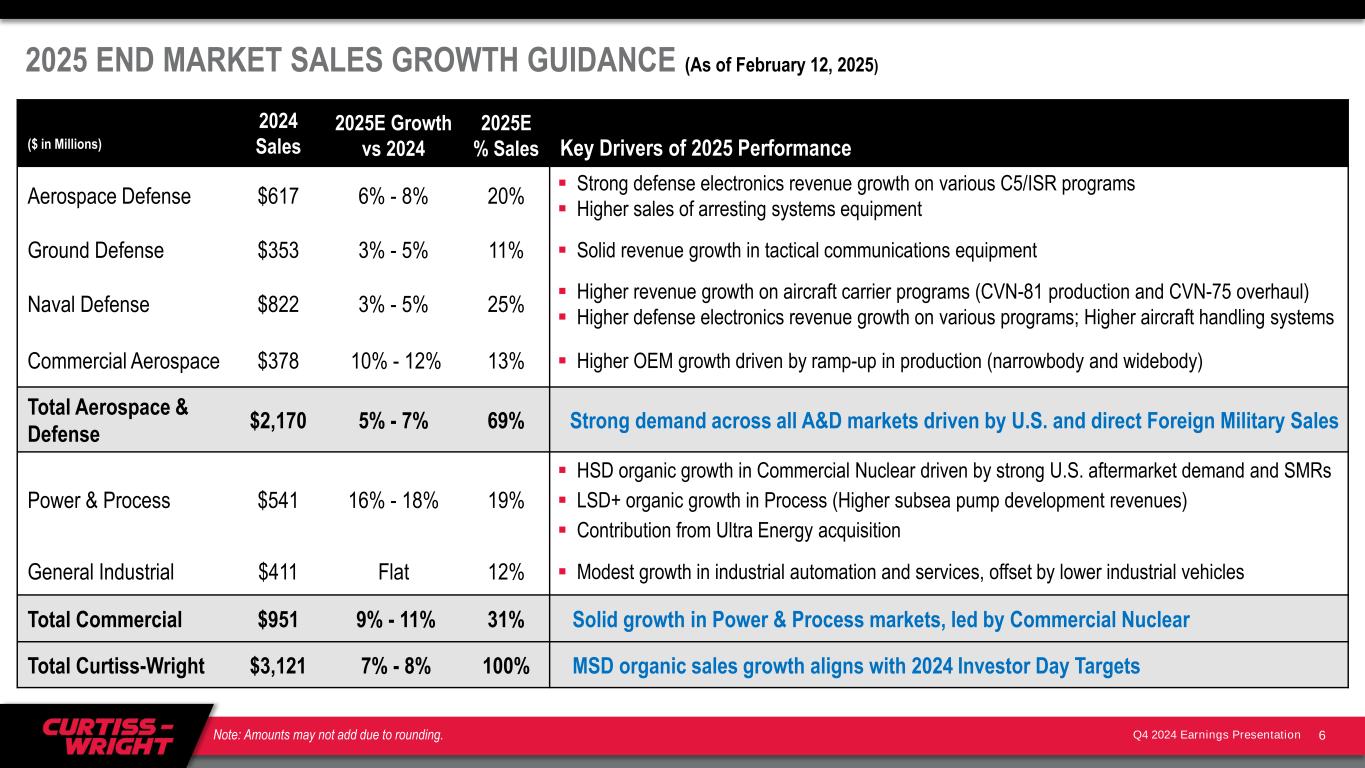
Q4 2024 Earnings Presentation 2025 END MARKET SALES GROWTH GUIDANCE (As of February 12, 2025) ($ in Millions) 2024 Sales 2025E Growth vs 2024 2025E % Sales Key Drivers of 2025 Performance Aerospace Defense $617 6% - 8% 20% ▪ Strong defense electronics revenue growth on various C5/ISR programs ▪ Higher sales of arresting systems equipment Ground Defense $353 3% - 5% 11% ▪ Solid revenue growth in tactical communications equipment Naval Defense $822 3% - 5% 25% ▪ Higher revenue growth on aircraft carrier programs (CVN-81 production and CVN-75 overhaul) ▪ Higher defense electronics revenue growth on various programs; Higher aircraft handling systems Commercial Aerospace $378 10% - 12% 13% ▪ Higher OEM growth driven by ramp-up in production (narrowbody and widebody) Total Aerospace & Defense $2,170 5% - 7% 69% Strong demand across all A&D markets driven by U.S. and direct Foreign Military Sales Power & Process $541 16% - 18% 19% ▪ HSD organic growth in Commercial Nuclear driven by strong U.S. aftermarket demand and SMRs ▪ LSD+ organic growth in Process (Higher subsea pump development revenues) ▪ Contribution from Ultra Energy acquisition General Industrial $411 Flat 12% ▪ Modest growth in industrial automation and services, offset by lower industrial vehicles Total Commercial $951 9% - 11% 31% Solid growth in Power & Process markets, led by Commercial Nuclear Total Curtiss-Wright $3,121 7% - 8% 100% MSD organic sales growth aligns with 2024 Investor Day Targets 6Note: Amounts may not add due to rounding.
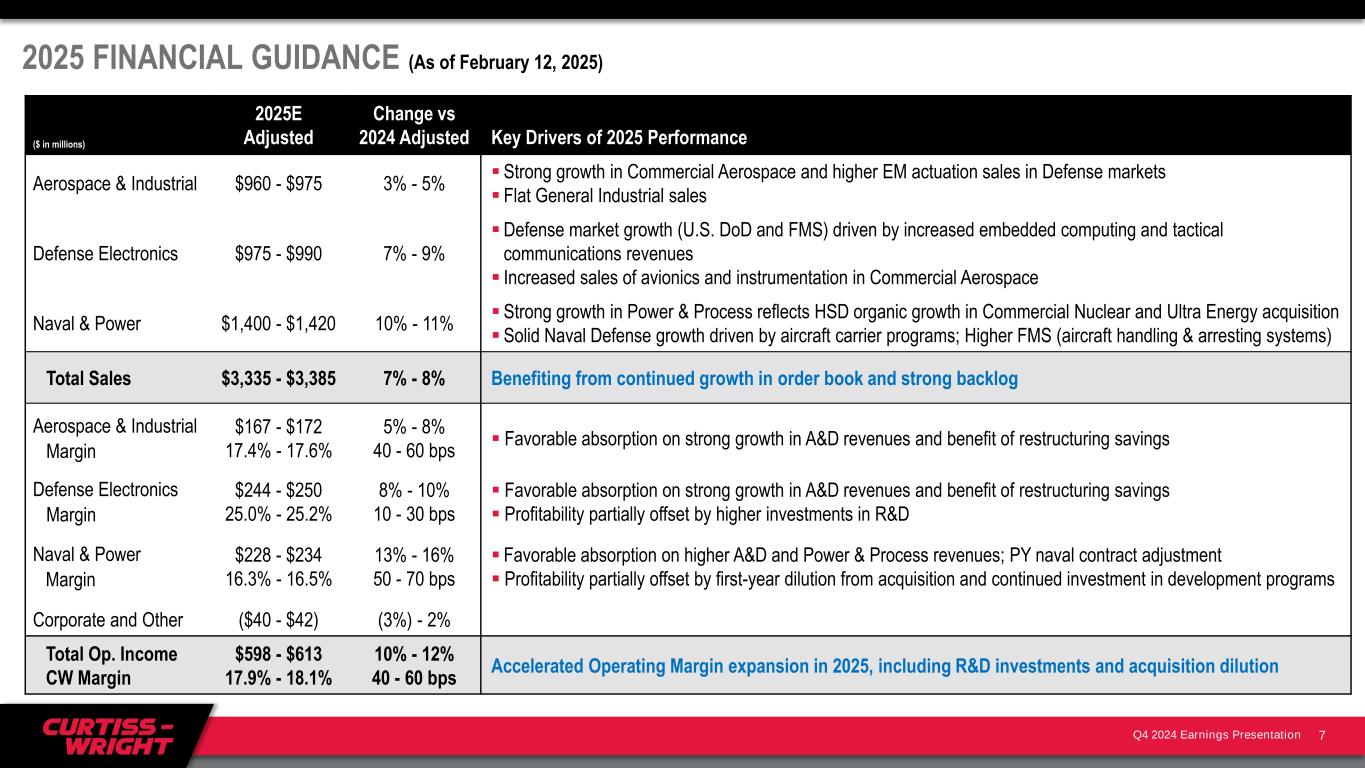
Q4 2024 Earnings Presentation ($ in millions) 2025E Adjusted Change vs 2024 Adjusted Key Drivers of 2025 Performance Aerospace & Industrial $960 - $975 3% - 5% ▪ Strong growth in Commercial Aerospace and higher EM actuation sales in Defense markets ▪ Flat General Industrial sales Defense Electronics $975 - $990 7% - 9% ▪Defense market growth (U.S. DoD and FMS) driven by increased embedded computing and tactical communications revenues ▪ Increased sales of avionics and instrumentation in Commercial Aerospace Naval & Power $1,400 - $1,420 10% - 11% ▪ Strong growth in Power & Process reflects HSD organic growth in Commercial Nuclear and Ultra Energy acquisition ▪ Solid Naval Defense growth driven by aircraft carrier programs; Higher FMS (aircraft handling & arresting systems) Total Sales $3,335 - $3,385 7% - 8% Benefiting from continued growth in order book and strong backlog Aerospace & Industrial Margin $167 - $172 17.4% - 17.6% 5% - 8% 40 - 60 bps ▪ Favorable absorption on strong growth in A&D revenues and benefit of restructuring savings Defense Electronics Margin $244 - $250 25.0% - 25.2% 8% - 10% 10 - 30 bps ▪ Favorable absorption on strong growth in A&D revenues and benefit of restructuring savings ▪ Profitability partially offset by higher investments in R&D Naval & Power Margin $228 - $234 16.3% - 16.5% 13% - 16% 50 - 70 bps ▪ Favorable absorption on higher A&D and Power & Process revenues; PY naval contract adjustment ▪ Profitability partially offset by first-year dilution from acquisition and continued investment in development programs Corporate and Other ($40 - $42) (3%) - 2% Total Op. Income CW Margin $598 - $613 17.9% - 18.1% 10% - 12% 40 - 60 bps Accelerated Operating Margin expansion in 2025, including R&D investments and acquisition dilution 2025 FINANCIAL GUIDANCE (As of February 12, 2025) 7
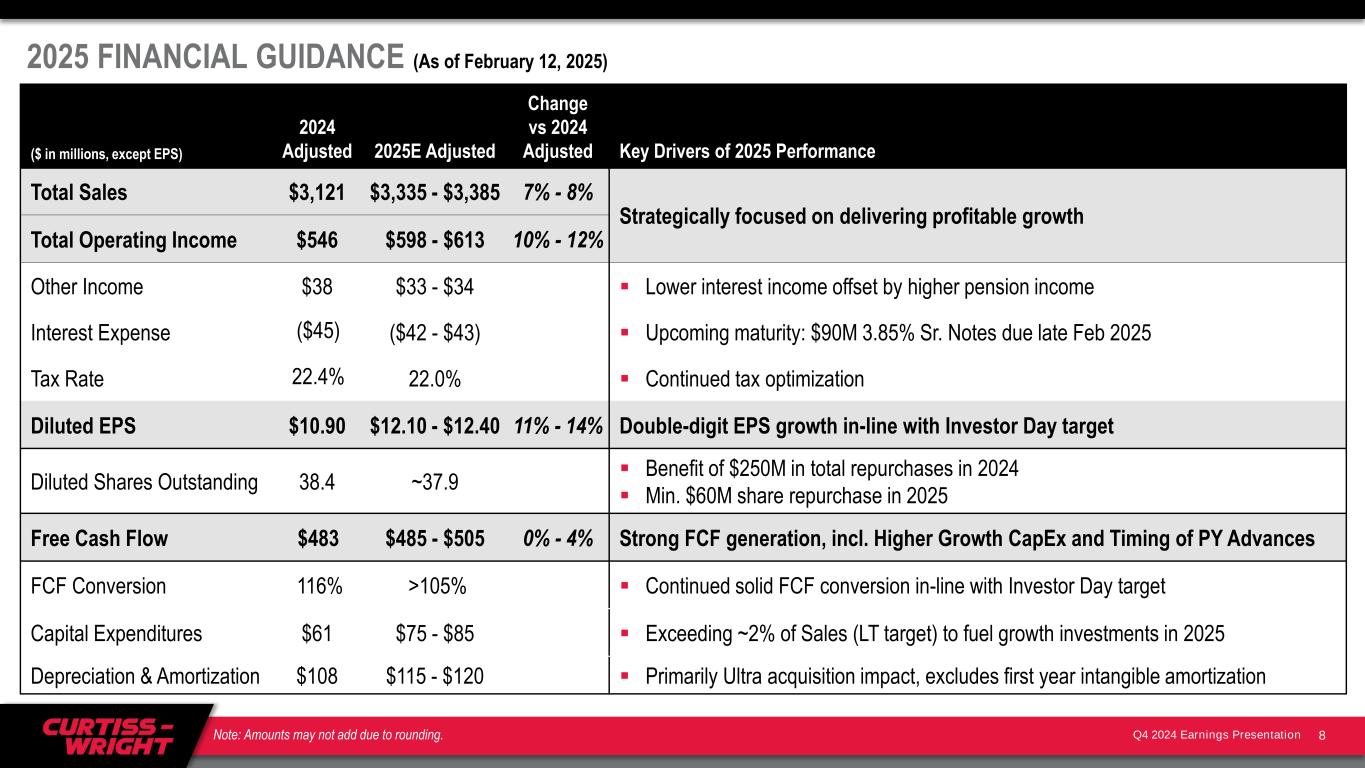
Q4 2024 Earnings Presentation 2025 FINANCIAL GUIDANCE (As of February 12, 2025) ($ in millions, except EPS) 2024 Adjusted 2025E Adjusted Change vs 2024 Adjusted Key Drivers of 2025 Performance Total Sales $3,121 $3,335 - $3,385 7% - 8% Strategically focused on delivering profitable growth Total Operating Income $546 $598 - $613 10% - 12% Other Income $38 $33 - $34 ▪ Lower interest income offset by higher pension income Interest Expense ($45) ($42 - $43) ▪ Upcoming maturity: $90M 3.85% Sr. Notes due late Feb 2025 Tax Rate 22.4% 22.0% ▪ Continued tax optimization Diluted EPS $10.90 $12.10 - $12.40 11% - 14% Double-digit EPS growth in-line with Investor Day target Diluted Shares Outstanding 38.4 ~37.9 ▪ Benefit of $250M in total repurchases in 2024 ▪ Min. $60M share repurchase in 2025 Free Cash Flow $483 $485 - $505 0% - 4% Strong FCF generation, incl. Higher Growth CapEx and Timing of PY Advances FCF Conversion 116% >105% ▪ Continued solid FCF conversion in-line with Investor Day target Capital Expenditures $61 $75 - $85 ▪ Exceeding ~2% of Sales (LT target) to fuel growth investments in 2025 Depreciation & Amortization $108 $115 - $120 ▪ Primarily Ultra acquisition impact, excludes first year intangible amortization 8Note: Amounts may not add due to rounding.
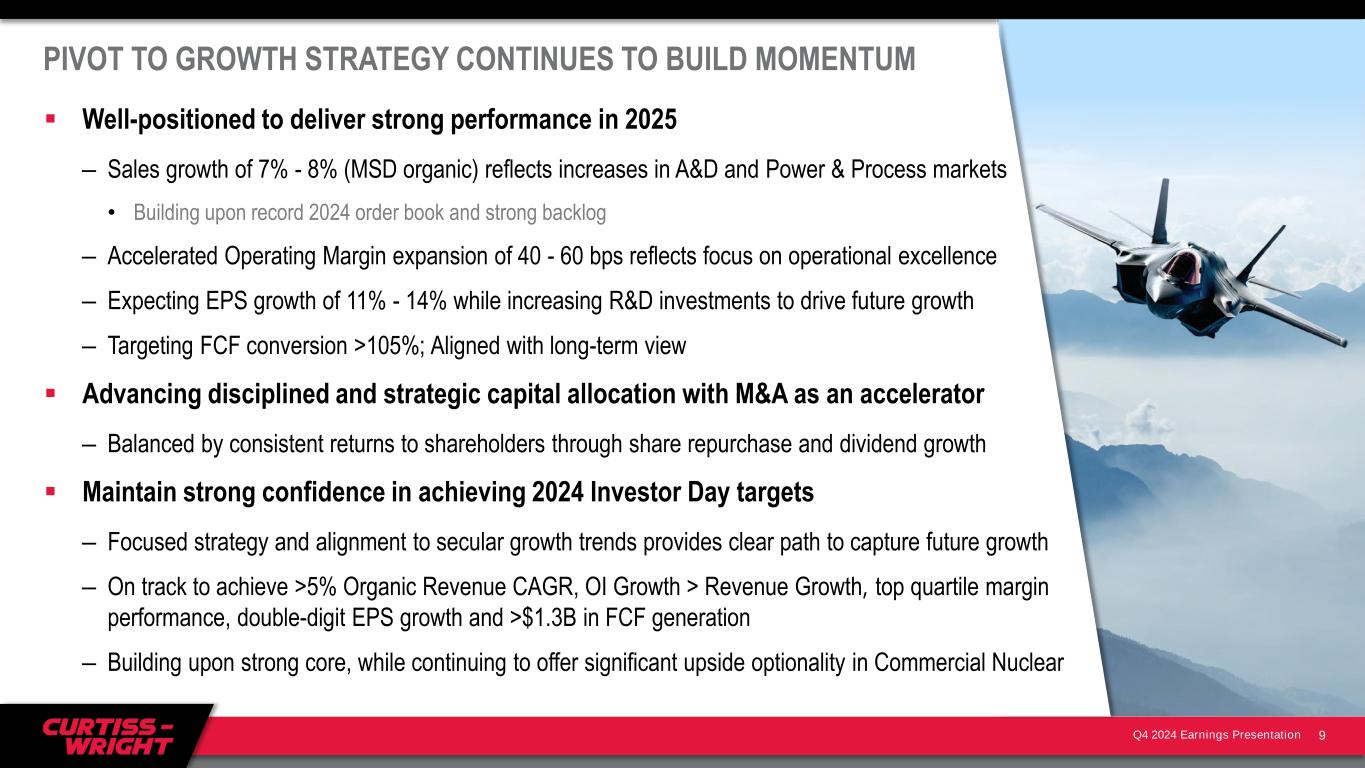
Q4 2024 Earnings Presentation PIVOT TO GROWTH STRATEGY CONTINUES TO BUILD MOMENTUM 9 ▪ Well-positioned to deliver strong performance in 2025 – Sales growth of 7% - 8% (MSD organic) reflects increases in A&D and Power & Process markets • Building upon record 2024 order book and strong backlog – Accelerated Operating Margin expansion of 40 - 60 bps reflects focus on operational excellence – Expecting EPS growth of 11% - 14% while increasing R&D investments to drive future growth – Targeting FCF conversion >105%; Aligned with long-term view ▪ Advancing disciplined and strategic capital allocation with M&A as an accelerator – Balanced by consistent returns to shareholders through share repurchase and dividend growth ▪ Maintain strong confidence in achieving 2024 Investor Day targets – Focused strategy and alignment to secular growth trends provides clear path to capture future growth – On track to achieve >5% Organic Revenue CAGR, OI Growth > Revenue Growth, top quartile margin performance, double-digit EPS growth and >$1.3B in FCF generation – Building upon strong core, while continuing to offer significant upside optionality in Commercial Nuclear
Q4 2024 Earnings Presentation Appendix 10
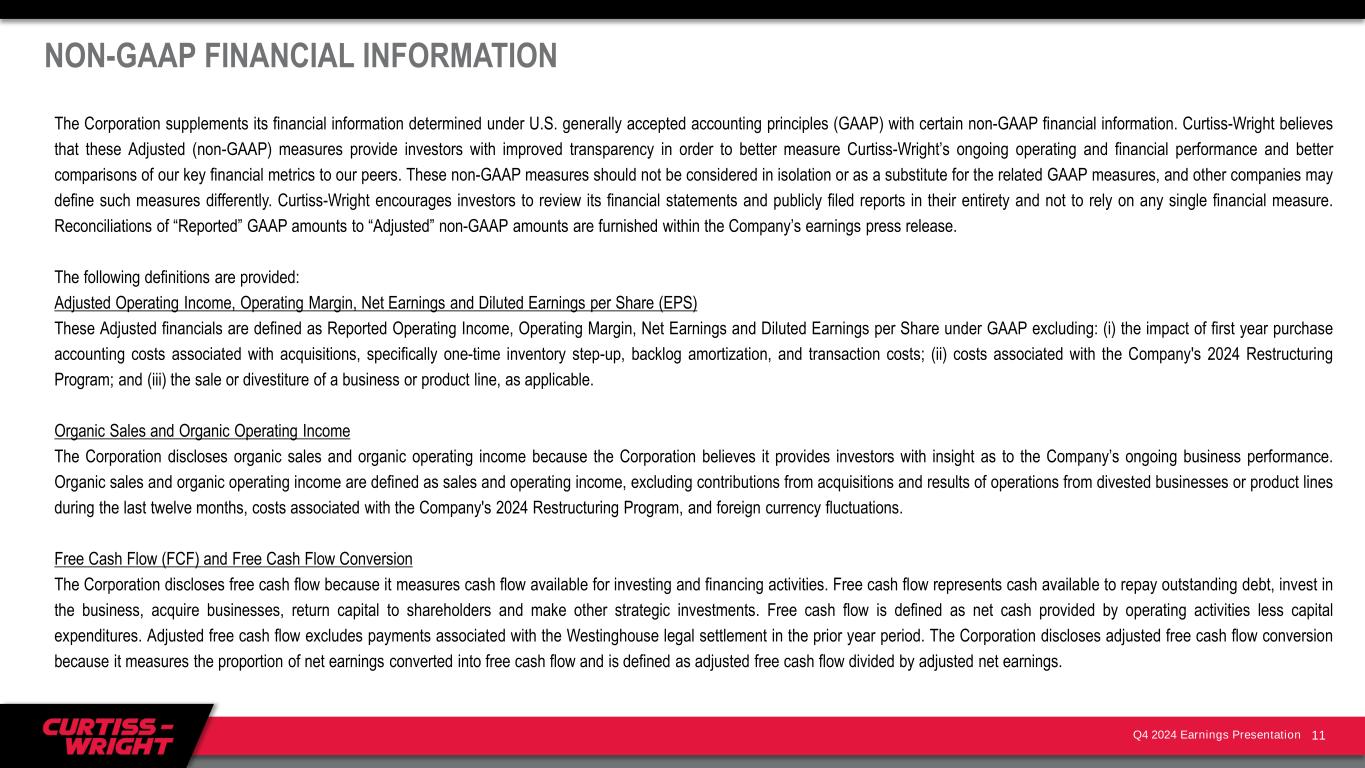
Q4 2024 Earnings Presentation NON-GAAP FINANCIAL INFORMATION The Corporation supplements its financial information determined under U.S. generally accepted accounting principles (GAAP) with certain non-GAAP financial information. Curtiss-Wright believes that these Adjusted (non-GAAP) measures provide investors with improved transparency in order to better measure Curtiss-Wright’s ongoing operating and financial performance and better comparisons of our key financial metrics to our peers. These non-GAAP measures should not be considered in isolation or as a substitute for the related GAAP measures, and other companies may define such measures differently. Curtiss-Wright encourages investors to review its financial statements and publicly filed reports in their entirety and not to rely on any single financial measure. Reconciliations of “Reported” GAAP amounts to “Adjusted” non-GAAP amounts are furnished within the Company’s earnings press release. The following definitions are provided: Adjusted Operating Income, Operating Margin, Net Earnings and Diluted Earnings per Share (EPS) These Adjusted financials are defined as Reported Operating Income, Operating Margin, Net Earnings and Diluted Earnings per Share under GAAP excluding: (i) the impact of first year purchase accounting costs associated with acquisitions, specifically one-time inventory step-up, backlog amortization, and transaction costs; (ii) costs associated with the Company's 2024 Restructuring Program; and (iii) the sale or divestiture of a business or product line, as applicable. Organic Sales and Organic Operating Income The Corporation discloses organic sales and organic operating income because the Corporation believes it provides investors with insight as to the Company’s ongoing business performance. Organic sales and organic operating income are defined as sales and operating income, excluding contributions from acquisitions and results of operations from divested businesses or product lines during the last twelve months, costs associated with the Company's 2024 Restructuring Program, and foreign currency fluctuations. Free Cash Flow (FCF) and Free Cash Flow Conversion The Corporation discloses free cash flow because it measures cash flow available for investing and financing activities. Free cash flow represents cash available to repay outstanding debt, invest in the business, acquire businesses, return capital to shareholders and make other strategic investments. Free cash flow is defined as net cash provided by operating activities less capital expenditures. Adjusted free cash flow excludes payments associated with the Westinghouse legal settlement in the prior year period. The Corporation discloses adjusted free cash flow conversion because it measures the proportion of net earnings converted into free cash flow and is defined as adjusted free cash flow divided by adjusted net earnings. 11
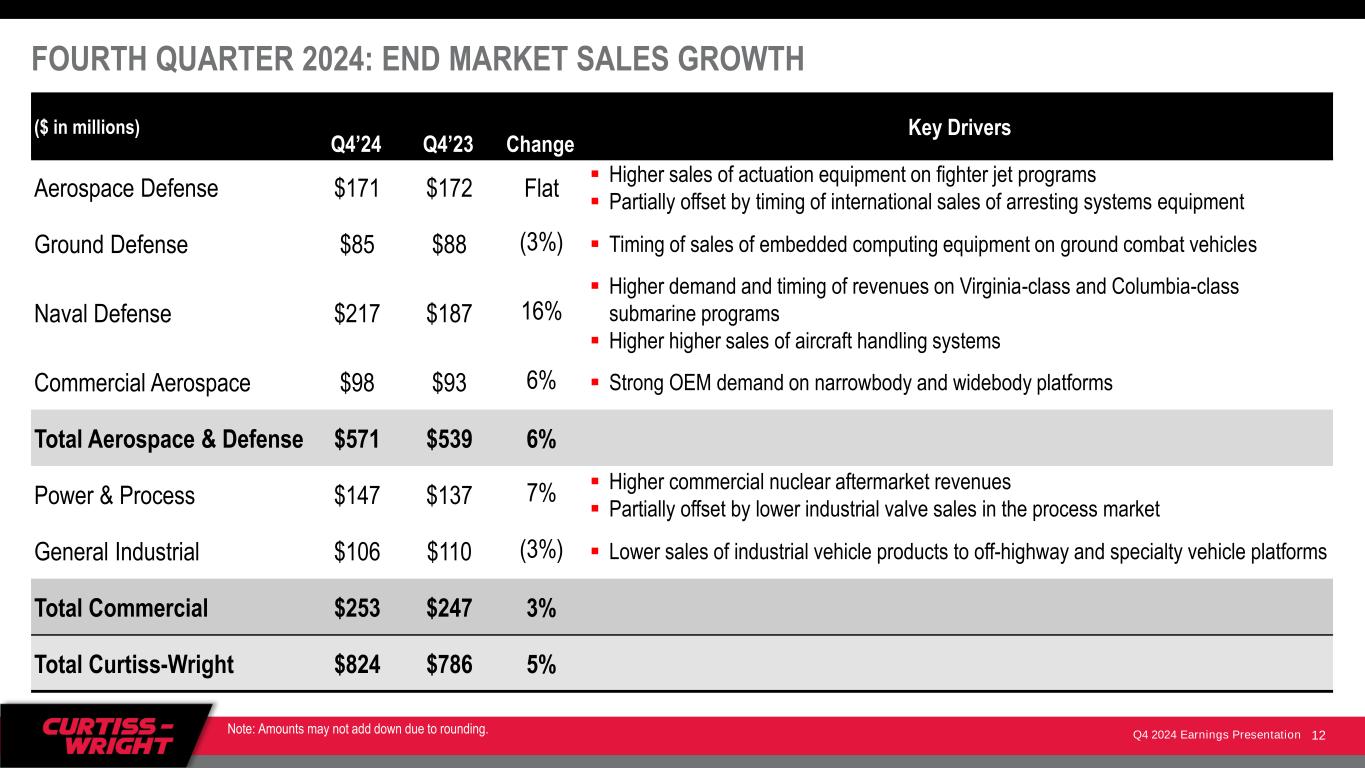
Q4 2024 Earnings Presentation FOURTH QUARTER 2024: END MARKET SALES GROWTH ($ in millions) Q4’24 Q4’23 Change Key Drivers Aerospace Defense $171 $172 Flat ▪ Higher sales of actuation equipment on fighter jet programs ▪ Partially offset by timing of international sales of arresting systems equipment Ground Defense $85 $88 (3%) ▪ Timing of sales of embedded computing equipment on ground combat vehicles Naval Defense $217 $187 16% ▪ Higher demand and timing of revenues on Virginia-class and Columbia-class submarine programs ▪ Higher higher sales of aircraft handling systems Commercial Aerospace $98 $93 6% ▪ Strong OEM demand on narrowbody and widebody platforms Total Aerospace & Defense $571 $539 6% Power & Process $147 $137 7% ▪ Higher commercial nuclear aftermarket revenues ▪ Partially offset by lower industrial valve sales in the process market General Industrial $106 $110 (3%) ▪ Lower sales of industrial vehicle products to off-highway and specialty vehicle platforms Total Commercial $253 $247 3% Total Curtiss-Wright $824 $786 5% 12 Note: Amounts may not add down due to rounding.
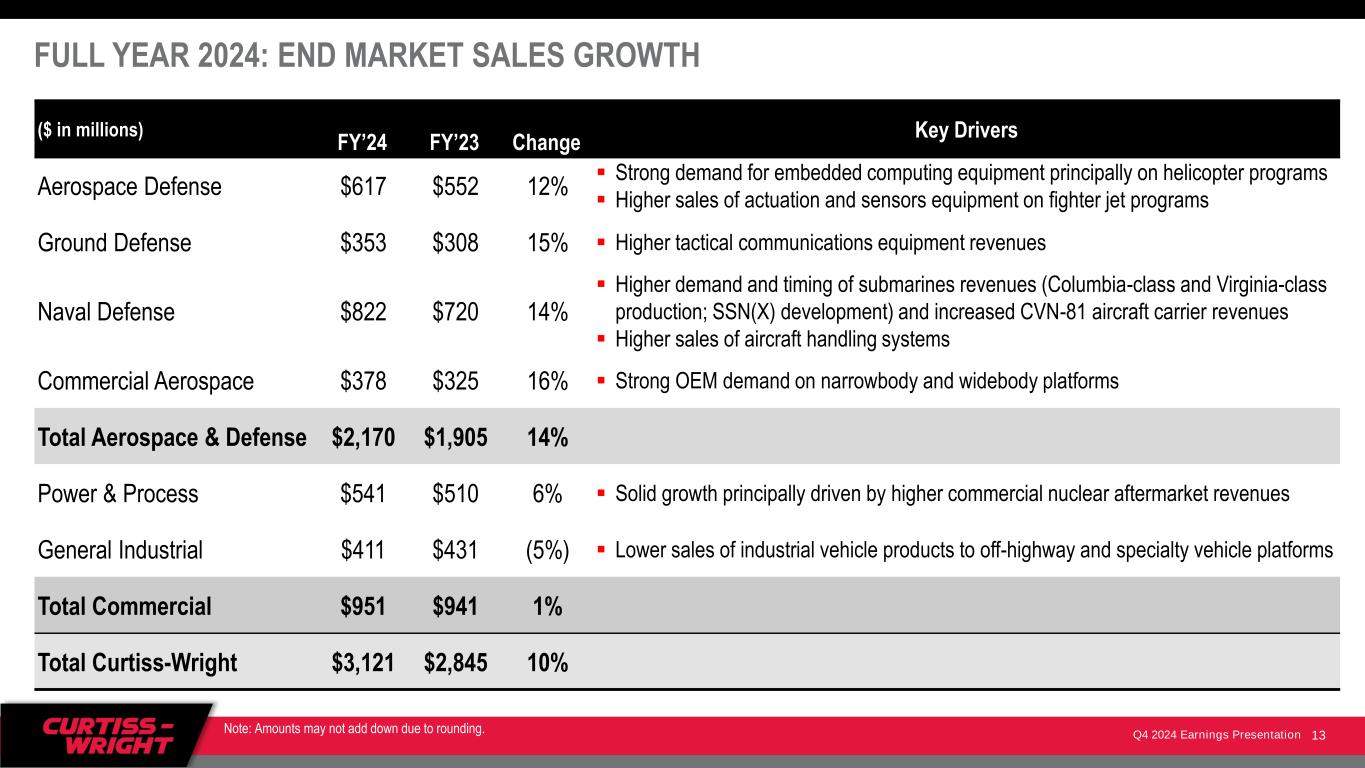
Q4 2024 Earnings Presentation FULL YEAR 2024: END MARKET SALES GROWTH ($ in millions) FY’24 FY’23 Change Key Drivers Aerospace Defense $617 $552 12% ▪ Strong demand for embedded computing equipment principally on helicopter programs ▪ Higher sales of actuation and sensors equipment on fighter jet programs Ground Defense $353 $308 15% ▪ Higher tactical communications equipment revenues Naval Defense $822 $720 14% ▪ Higher demand and timing of submarines revenues (Columbia-class and Virginia-class production; SSN(X) development) and increased CVN-81 aircraft carrier revenues ▪ Higher sales of aircraft handling systems Commercial Aerospace $378 $325 16% ▪ Strong OEM demand on narrowbody and widebody platforms Total Aerospace & Defense $2,170 $1,905 14% Power & Process $541 $510 6% ▪ Solid growth principally driven by higher commercial nuclear aftermarket revenues General Industrial $411 $431 (5%) ▪ Lower sales of industrial vehicle products to off-highway and specialty vehicle platforms Total Commercial $951 $941 1% Total Curtiss-Wright $3,121 $2,845 10% 13 Note: Amounts may not add down due to rounding.
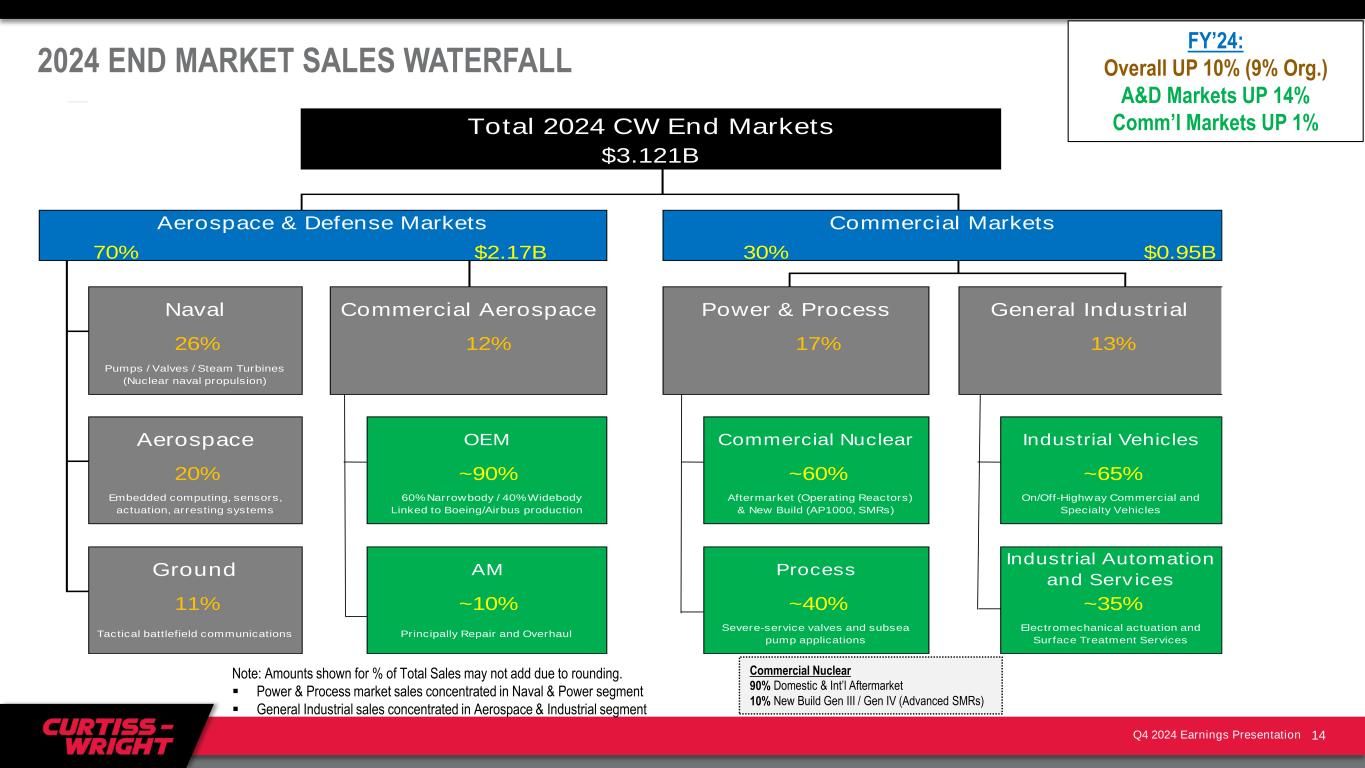
Q4 2024 Earnings Presentation 70% $2.17B 30% $0.95B Industrial Vehicles Tactical battlefield communications Principally Repair and Overhaul Aerospace & Defense Markets Commercial Markets 26% 12% 20% 11% ~90% ~10% Embedded computing, sensors, actuation, arresting systems 60% Narrowbody / 40% Widebody Linked to Boeing/Airbus production Aerospace OEM Total 2024 CW End Markets $3.121B General IndustrialNaval Commercial Aerospace Power & Process Pumps / Valves / Steam Turbines (Nuclear naval propulsion) Ground AM ~35% 17% 13% ~60% Severe-service valves and subsea pump applications ~65% Electromechanical actuation and Surface Treatment Services Aftermarket (Operating Reactors) & New Build (AP1000, SMRs) On/Off-Highway Commercial and Specialty Vehicles Commercial Nuclear Process Industrial Automation and Services ~40% 2024 END MARKET SALES WATERFALL FY’24: Overall UP 10% (9% Org.) A&D Markets UP 14% Comm’l Markets UP 1% Note: Amounts shown for % of Total Sales may not add due to rounding. ▪ Power & Process market sales concentrated in Naval & Power segment ▪ General Industrial sales concentrated in Aerospace & Industrial segment 14 Commercial Nuclear 90% Domestic & Int’l Aftermarket 10% New Build Gen III / Gen IV (Advanced SMRs)
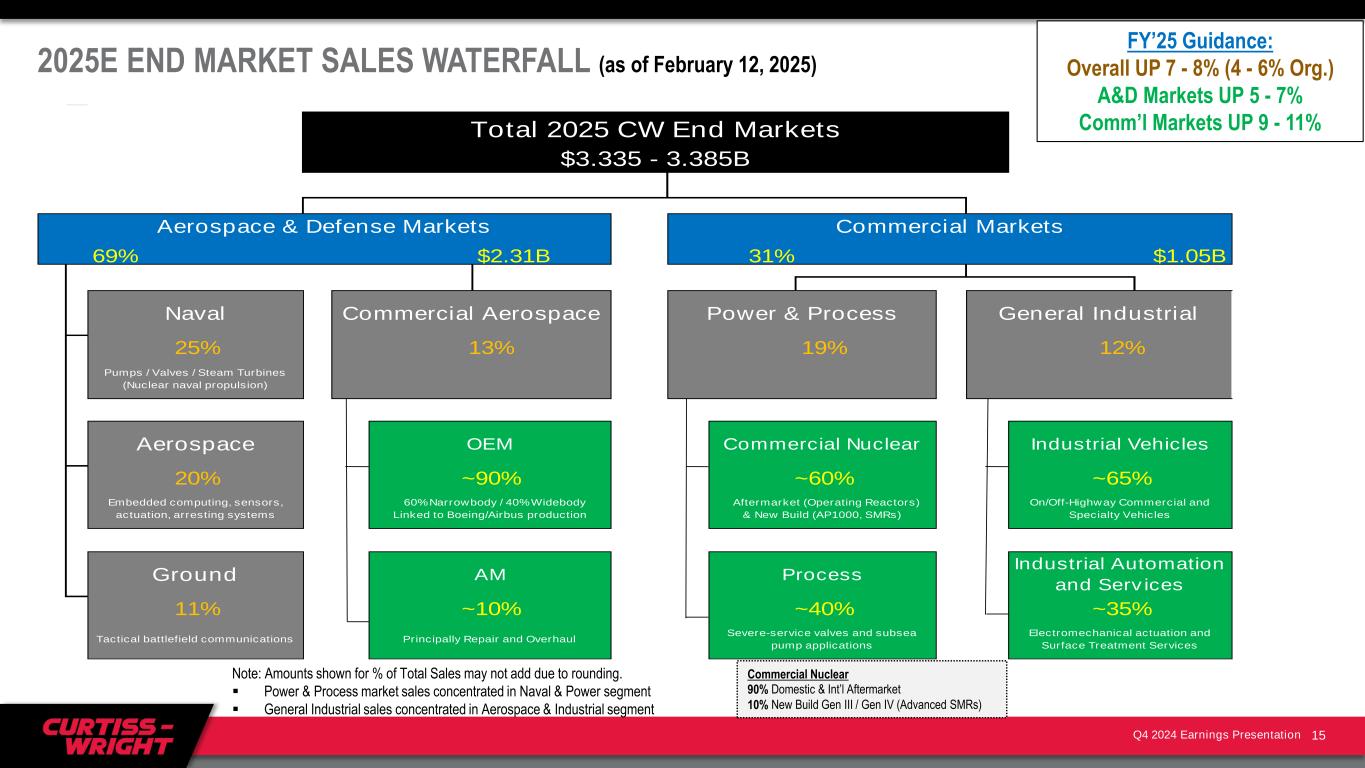
Q4 2024 Earnings Presentation 69% $2.31B 31% $1.05B Industrial Vehicles 19% 12% ~60% Severe-service valves and subsea pump applications ~65% Electromechanical actuation and Surface Treatment Services Aftermarket (Operating Reactors) & New Build (AP1000, SMRs) On/Off-Highway Commercial and Specialty Vehicles Commercial Nuclear Process Industrial Automation and Services ~40% Pumps / Valves / Steam Turbines (Nuclear naval propulsion) Ground AM ~35% Total 2025 CW End Markets $3.335 - 3.385B General IndustrialNaval Commercial Aerospace Power & Process Tactical battlefield communications Principally Repair and Overhaul Aerospace & Defense Markets Commercial Markets 25% 13% 20% 11% ~90% ~10% Embedded computing, sensors, actuation, arresting systems 60% Narrowbody / 40% Widebody Linked to Boeing/Airbus production Aerospace OEM 2025E END MARKET SALES WATERFALL (as of February 12, 2025) FY’25 Guidance: Overall UP 7 - 8% (4 - 6% Org.) A&D Markets UP 5 - 7% Comm’l Markets UP 9 - 11% Note: Amounts shown for % of Total Sales may not add due to rounding. ▪ Power & Process market sales concentrated in Naval & Power segment ▪ General Industrial sales concentrated in Aerospace & Industrial segment 15 Commercial Nuclear 90% Domestic & Int’l Aftermarket 10% New Build Gen III / Gen IV (Advanced SMRs)