Exhibit 99.1

October 27, 2022
For immediate release
CALIFORNIA WATER SERVICE GROUP ANNOUNCES
THIRD QUARTER 2022 RESULTS
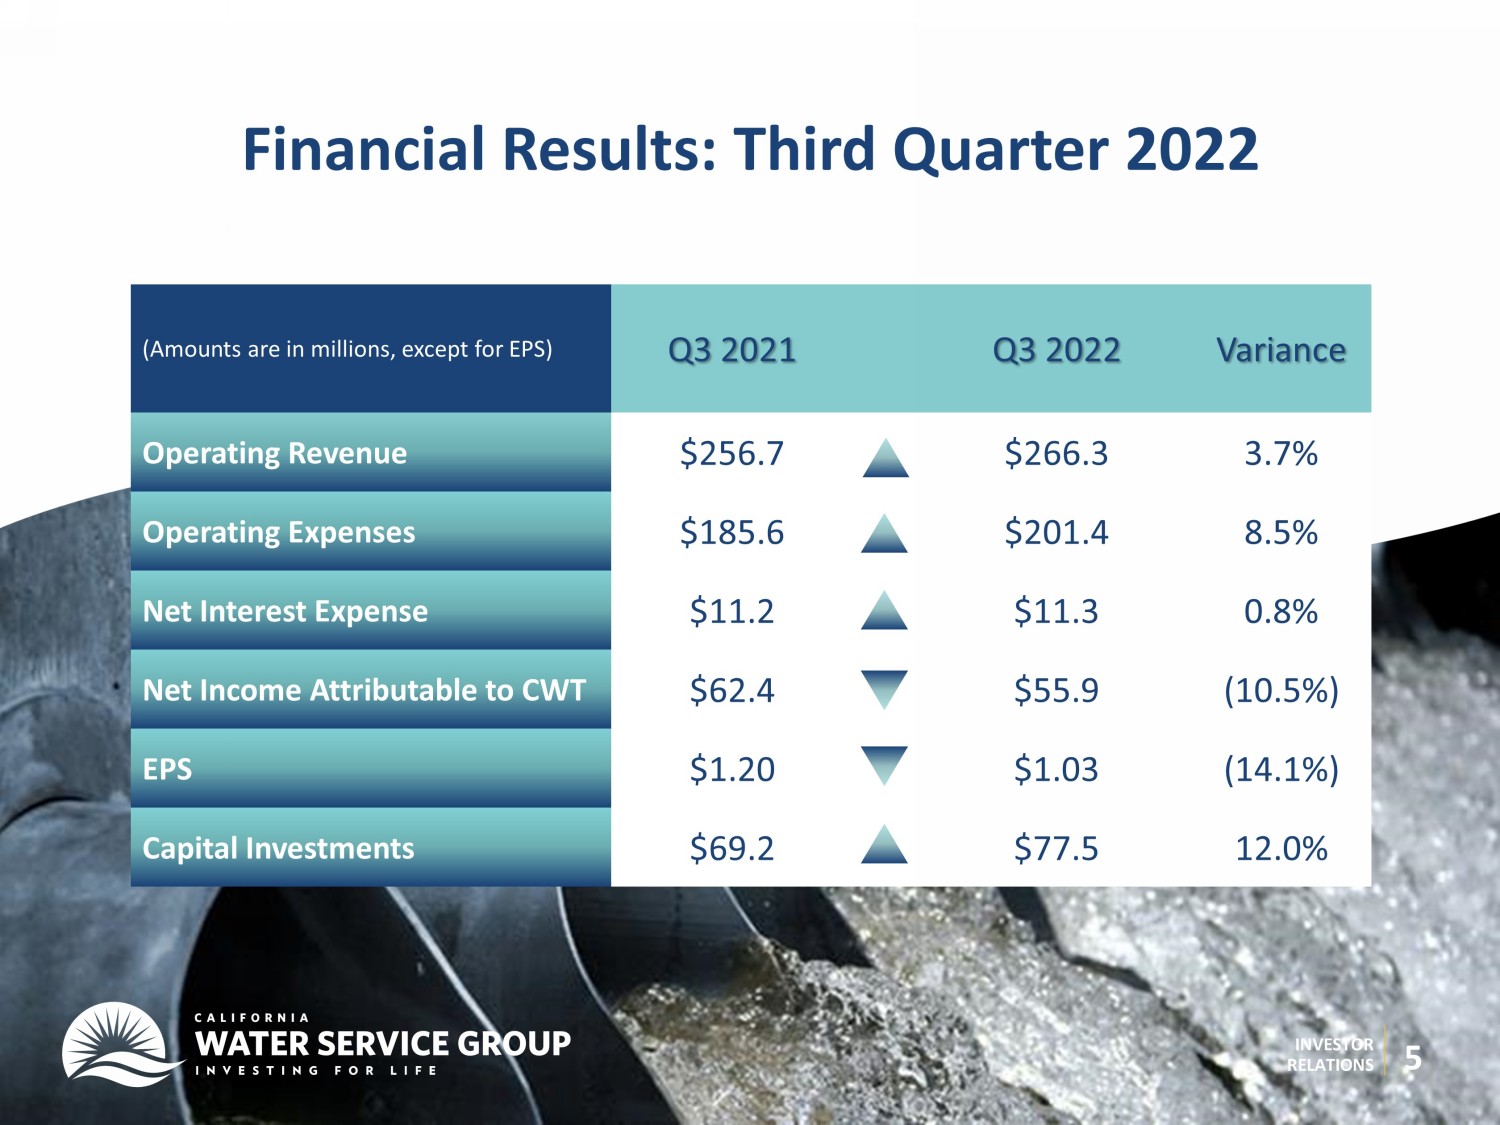
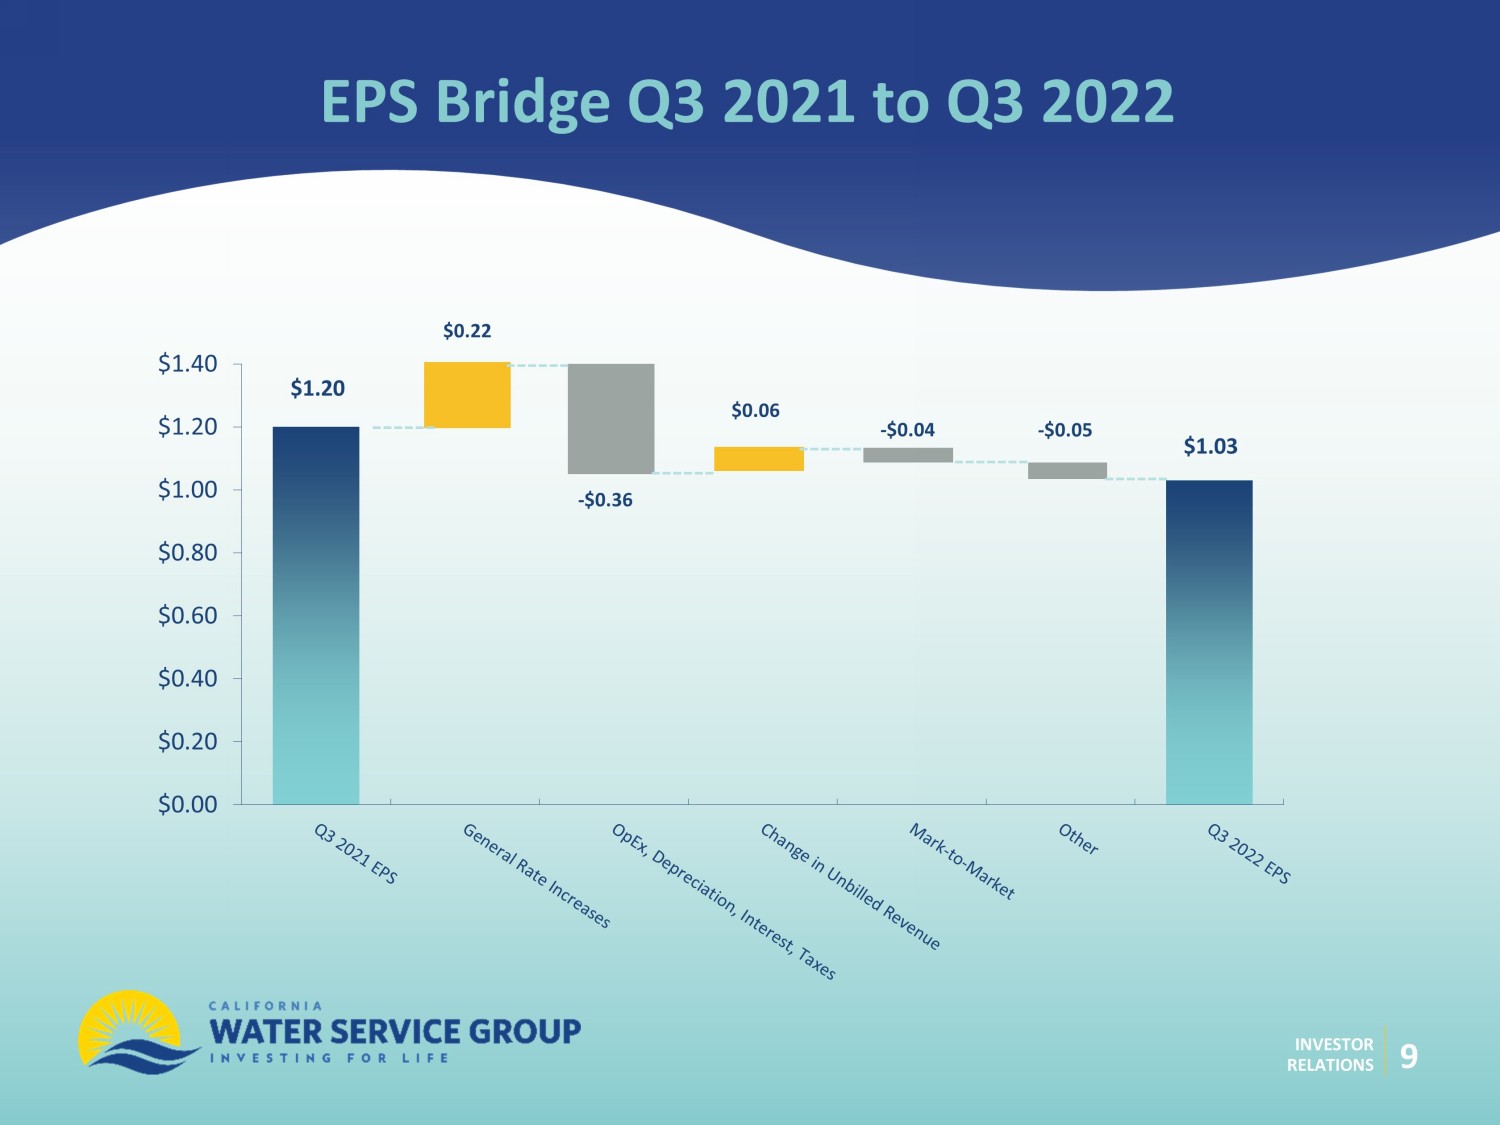
SAN JOSE, CA – California Water Service Group (NYSE: CWT) ( “Group”) today announced net income attributable to Group of $55.9 million or $1.03 earnings per diluted common share for the third quarter of 2022, compared to a net income attributable to Group of $62.4 million or $1.20 earnings per diluted common share for the third quarter of 2021.
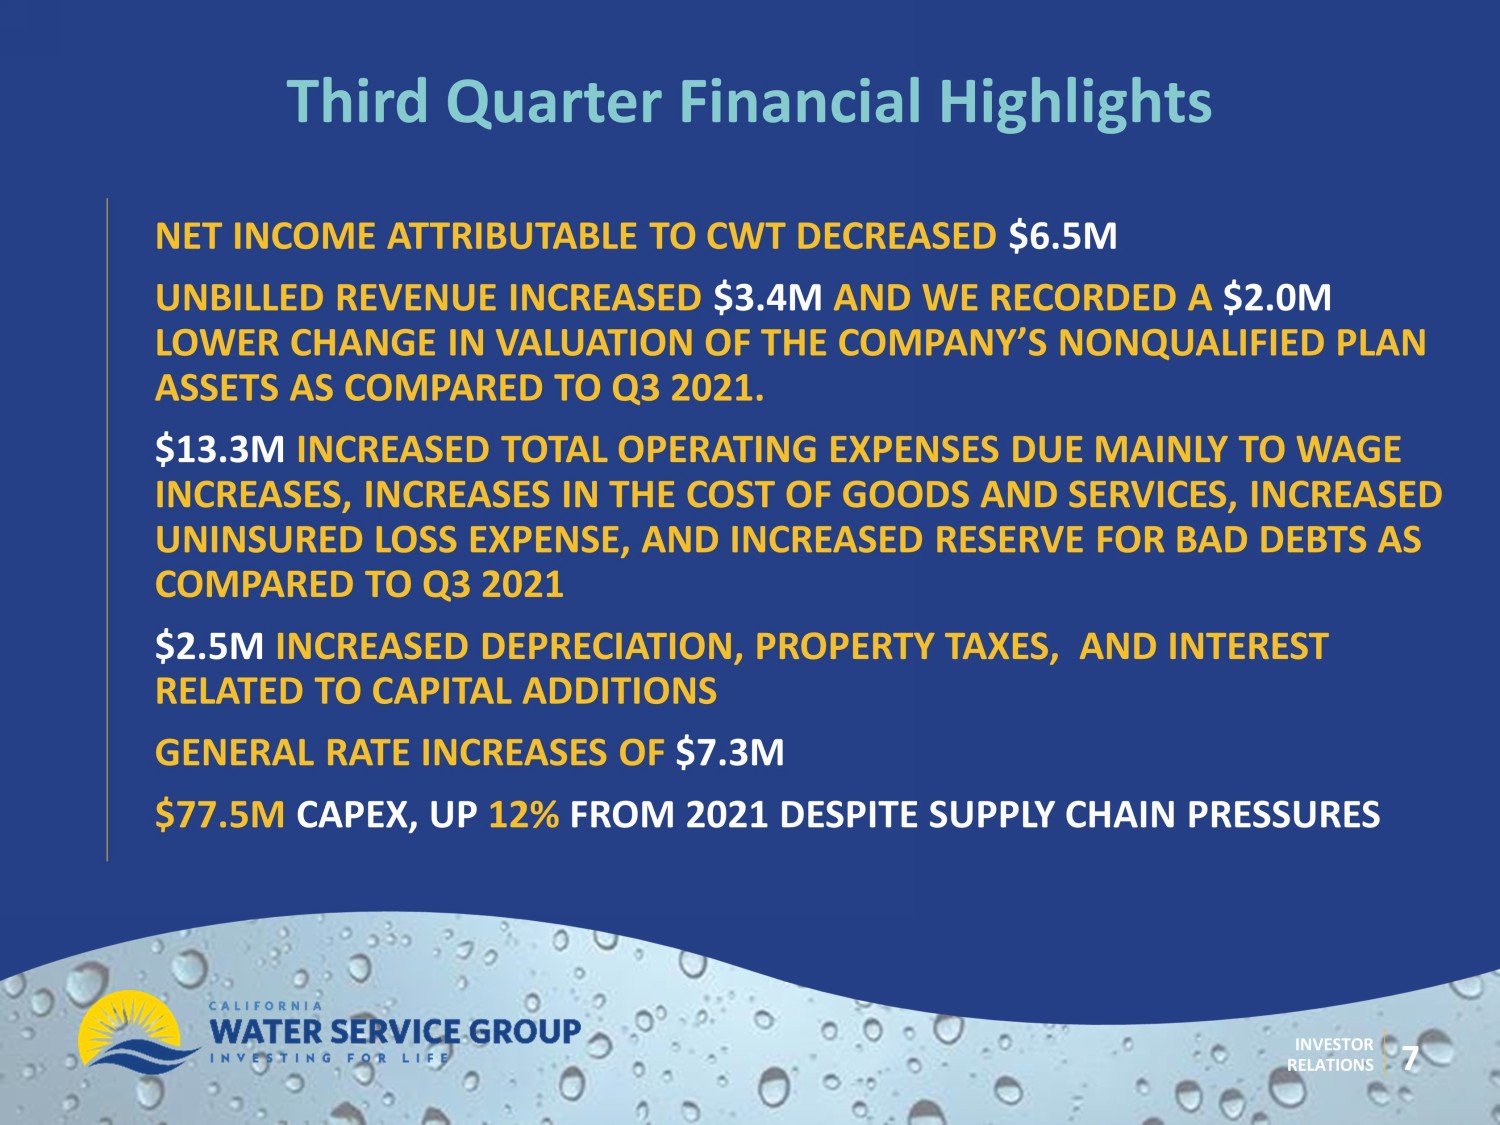
The $6.5 million decrease in net income was primarily due to an increase in total operating expenses of $15.8 million, driven mostly by increases in water production costs of $3.8 million, administrative and general expenses of $2.6 million, other operations expenses of $2.0 million, depreciation and amortization expense of $1.6 million, and income taxes of $4.2 million. Additionally, there was a $2.0 million decrease in unrealized gains on non-qualified benefit plan investments during the third quarter of 2022 compared to the third quarter of 2021. The expense increases were partially offset by an increase in operating revenue of $9.6 million, driven primarily by rate increases of $12.3 million and accrued unbilled revenue increase of $3.4 million, which was partially offset by decreases from changes in regulatory balancing account revenue of $4.7 million and changes in deferred revenue of $3.8 million.
The change in accrued unbilled revenue was driven by weather and timing of when meter reads were completed during the month of September 2022 compared to September 2021. The change in unrealized gains on non-qualified benefit plan investments was caused by unfavorable market conditions.
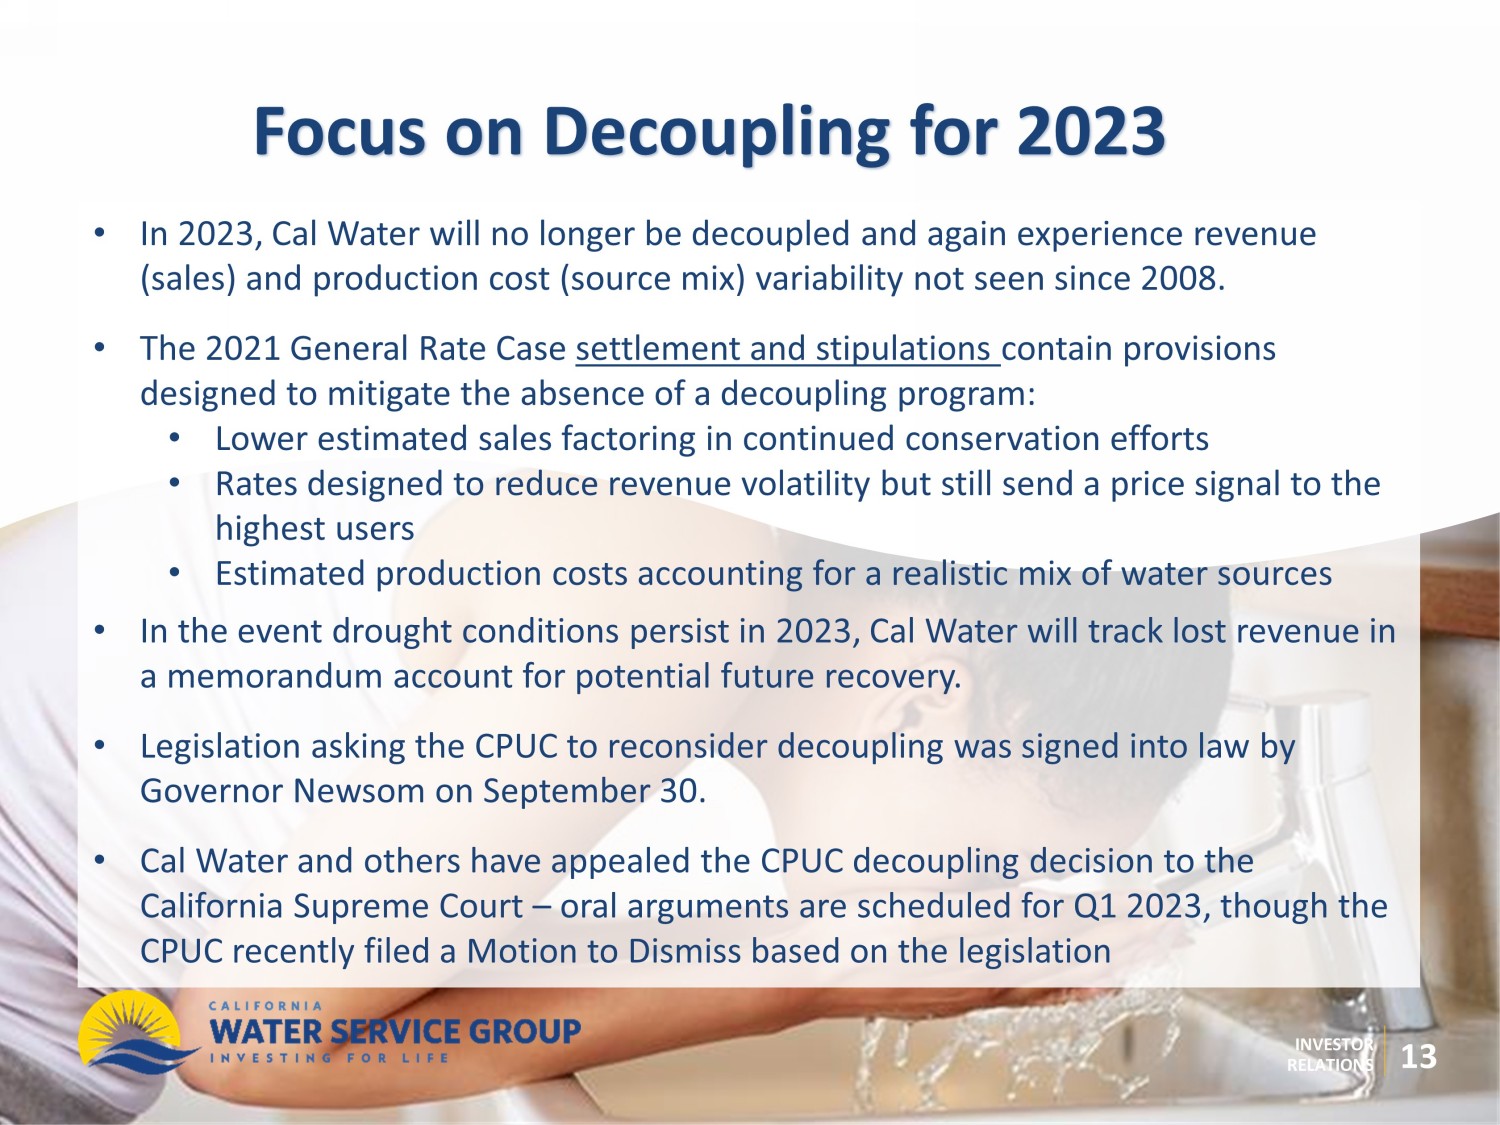
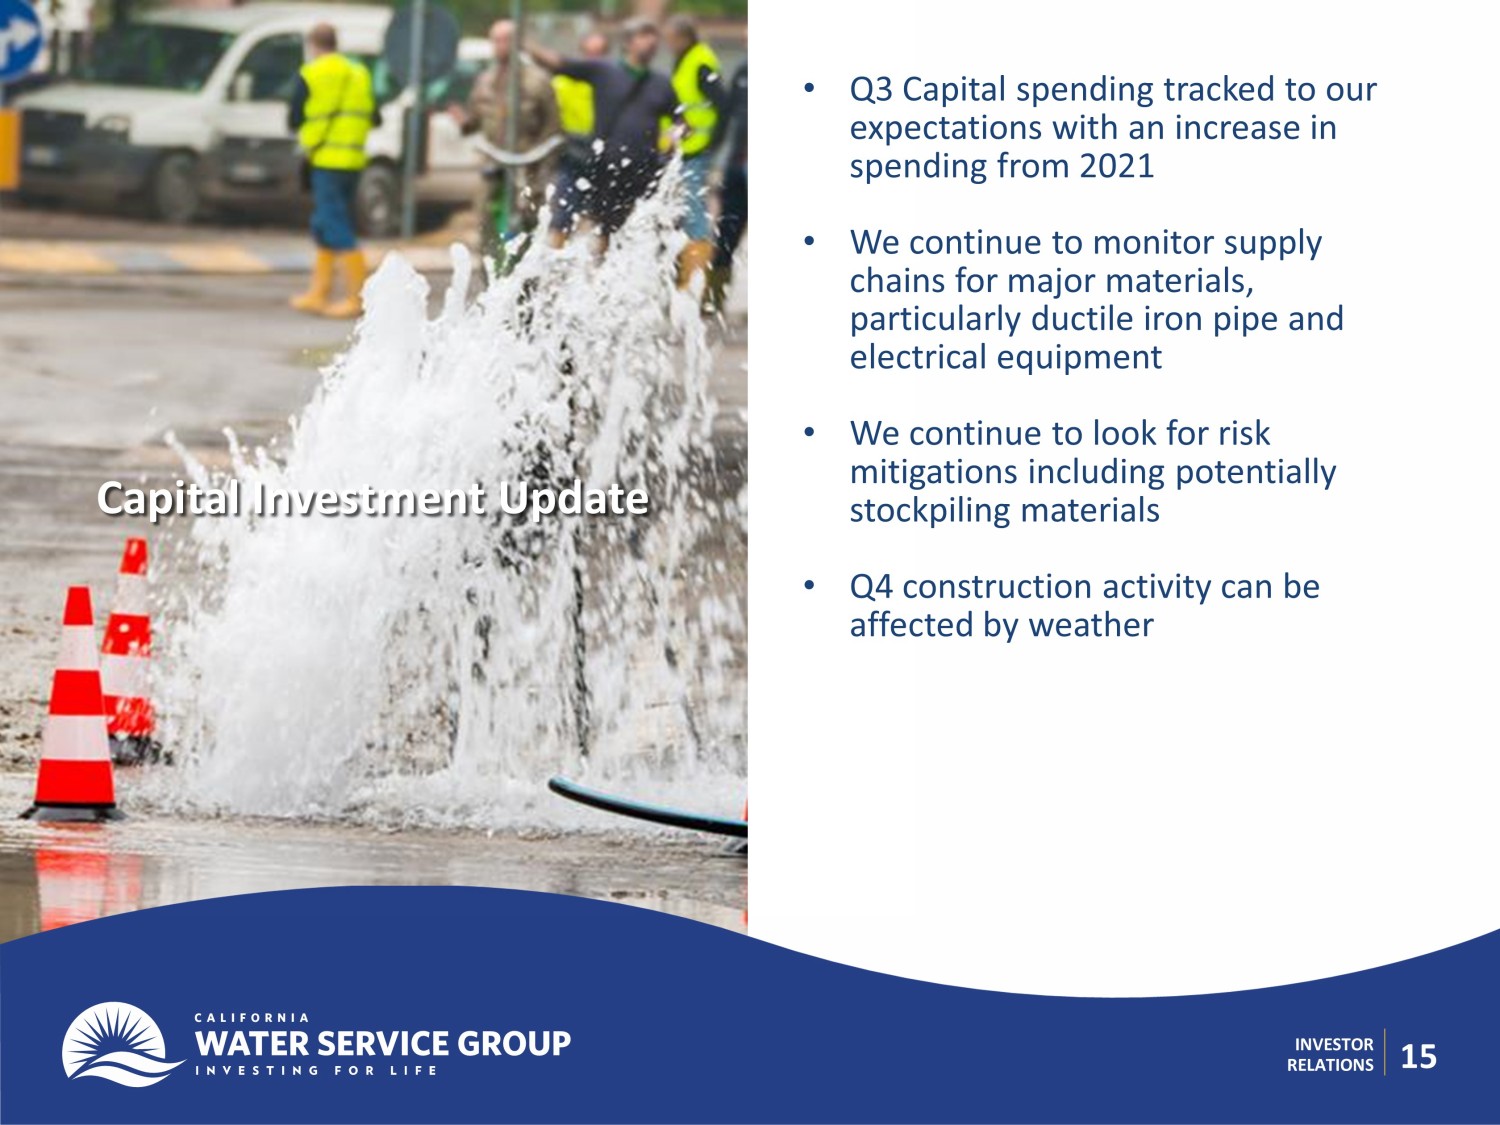
During the third quarter of 2022, the company invested $77.5 million in infrastructure improvements, up 12% from the third quarter of 2021. According to President and Chief Executive Officer Martin A. Kropelnicki, results were in line with company expectations. “We anticipated that regulatory delays and inflation would impact our financial performance and the third quarter was no exception. While we wait for important decisions from the California Public Utilities Commission, we are focused on investing in our water systems, responding to historic drought conditions, and managing controllable expenses,” he said. “There were many accomplishments in the quarter to be proud of, including the passage of a California law that reintroduces the possibility of decoupling sales from revenues, continuing improvement in our customers’ water conservation efforts, growth in our capital investments, and growth in Texas,” he said.
Additional Financial Results for the third quarter of 2022
Operating revenue increased 3.7% to $266.3 million in the third quarter of 2022, an increase of $9.6 million compared to $256.7 million in the third quarter of 2021. The increase was due primarily to rate increases of $12.3 million and accrued unbilled revenue increase of $3.4 million, which was partially offset by decreases from changes in regulatory balancing account revenue of $4.7 million and changes in deferred revenue of $3.8 million.
Total operating expenses increased $15.8 million, or 8.5%, to $201.4 million in the third quarter of 2022 compared to the prior year.
Water production costs increased $3.8 million, or 4.5%, to $88.8 million in the third quarter of 2022, primarily due to an increase in purchased water and power rates.
Administrative and general expenses increased $2.6 million, or 8.5%, to $33.3 million in the third quarter of 2022, primarily due to increases of $1.5 million in uninsured loss costs and $1.0 million in employee labor costs.
Other operations expenses increased $2.0 million, or 8.1%, to $26.7 million in the third quarter of 2022, mostly due to increases of $2.5 million in bad debt costs, $0.8 million in conservation program expenses, and $0.5 million in employee labor costs, which was partially offset by a reduction in costs associated with deferred Water Revenue Adjustment Mechanism (WRAM) and Modified Cost Balancing Account (MCBA) operating revenue. Changes in conservation program expenses in regulated California operations generally do not affect net income, as the company has been allowed by the California Public Utilities Commission (CPUC) to record these costs in a balancing account for future recovery.
Depreciation and amortization expense increased $1.6 million, or 5.9%, to $28.8 million in the third quarter of 2022 due to utility plant placed in service in 2021.
Income taxes increased $4.2 million to $5.9 million in the third quarter of 2022 mostly due to a $4.0 million decrease in Tax Cuts and Jobs Act refunds to ratepayers in the third quarter of 2022 as compared to the prior year.
Property and other taxes increased $0.9 million, or 10.5%, to $9.4 million in the third quarter of 2022, due primarily to an increase in our assessed property values for utility plant placed in service.
Net other income decreased $0.5 million, or 20.3%, to $2.1 million in the third quarter of 2022, due primarily to a $2.0 million decrease in unrealized gains on certain non-qualified benefit plan investments, which was partially offset by a $1.9 million increase in other components of net periodic benefit credit.
Year-to-Date Results
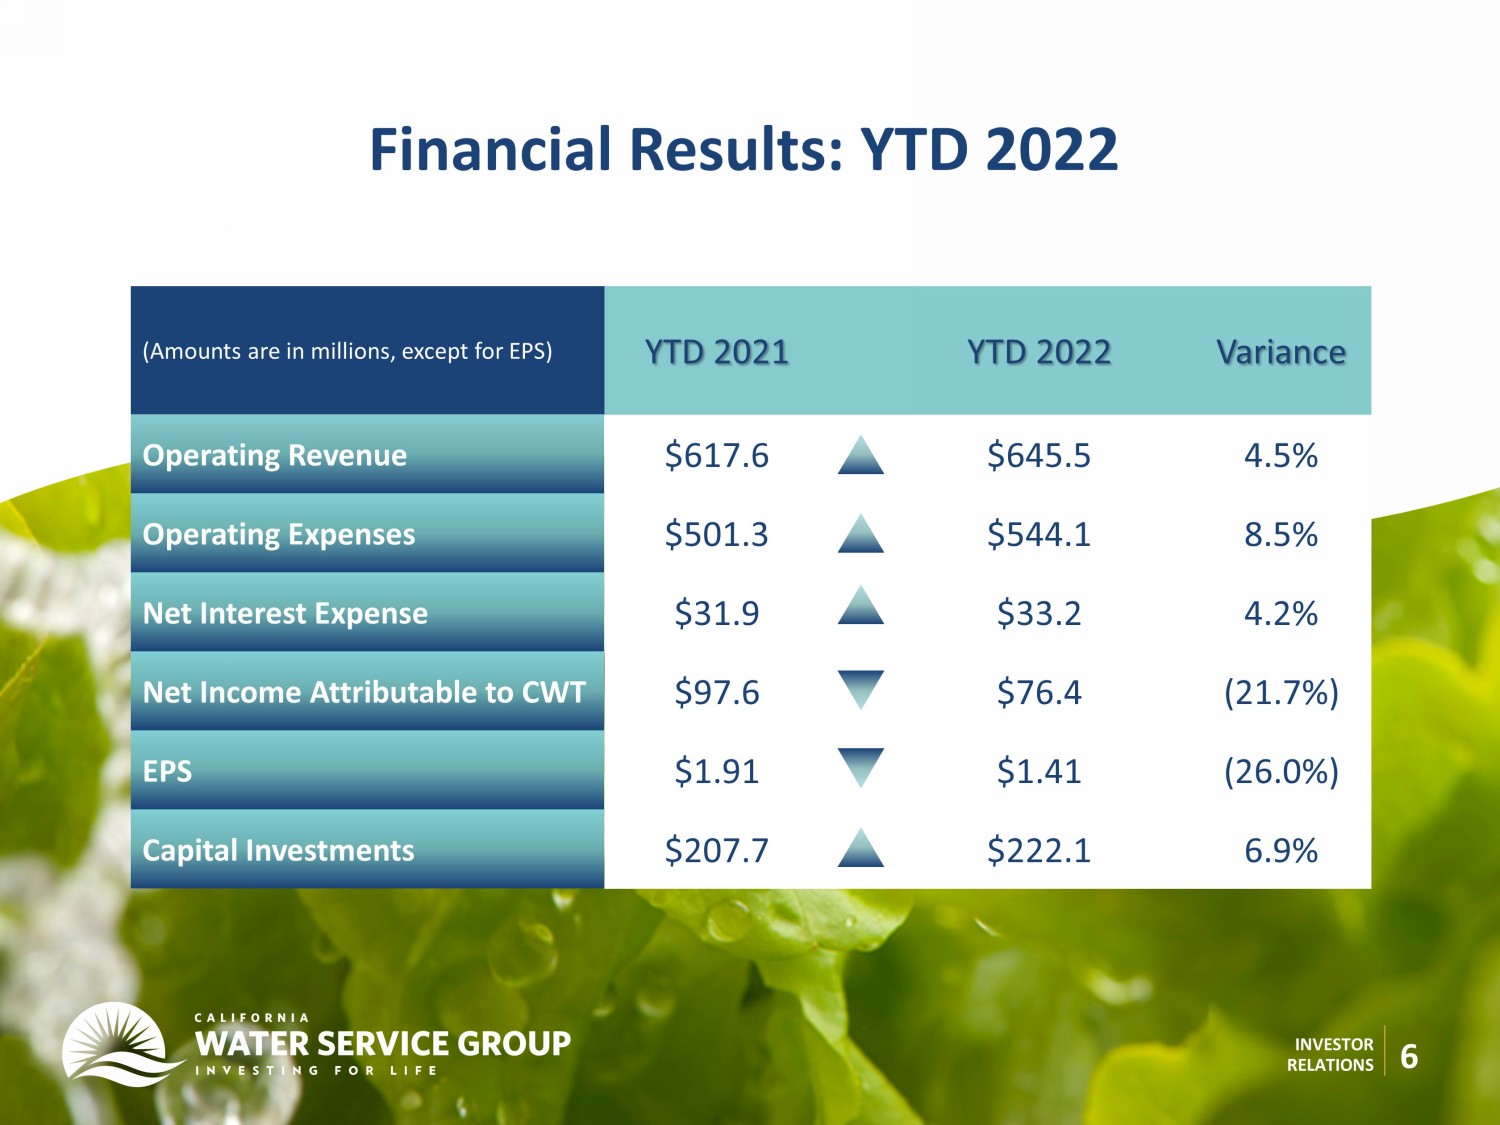
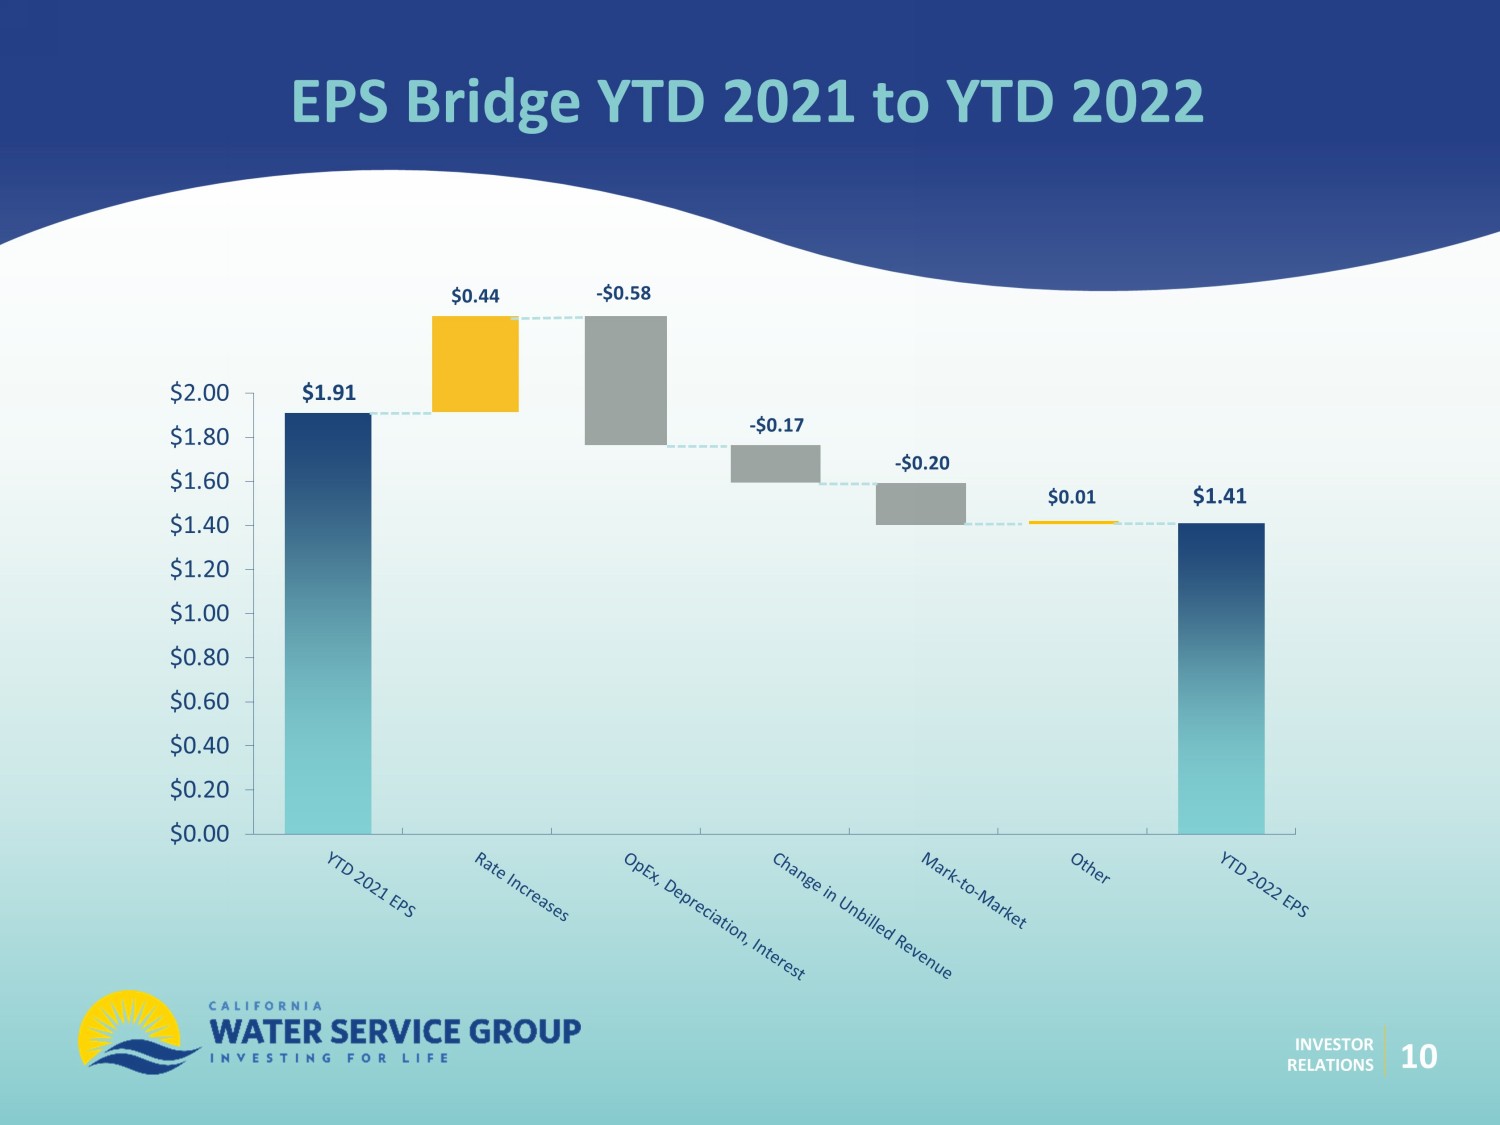
For the nine month period ended September 30, 2022, net income attributable to Group was $76.4 million or $1.41 earnings per diluted common share, compared to net income attributable to Group of $97.6 million or $1.91 earnings per diluted common share for the nine month period ended September 30, 2021.
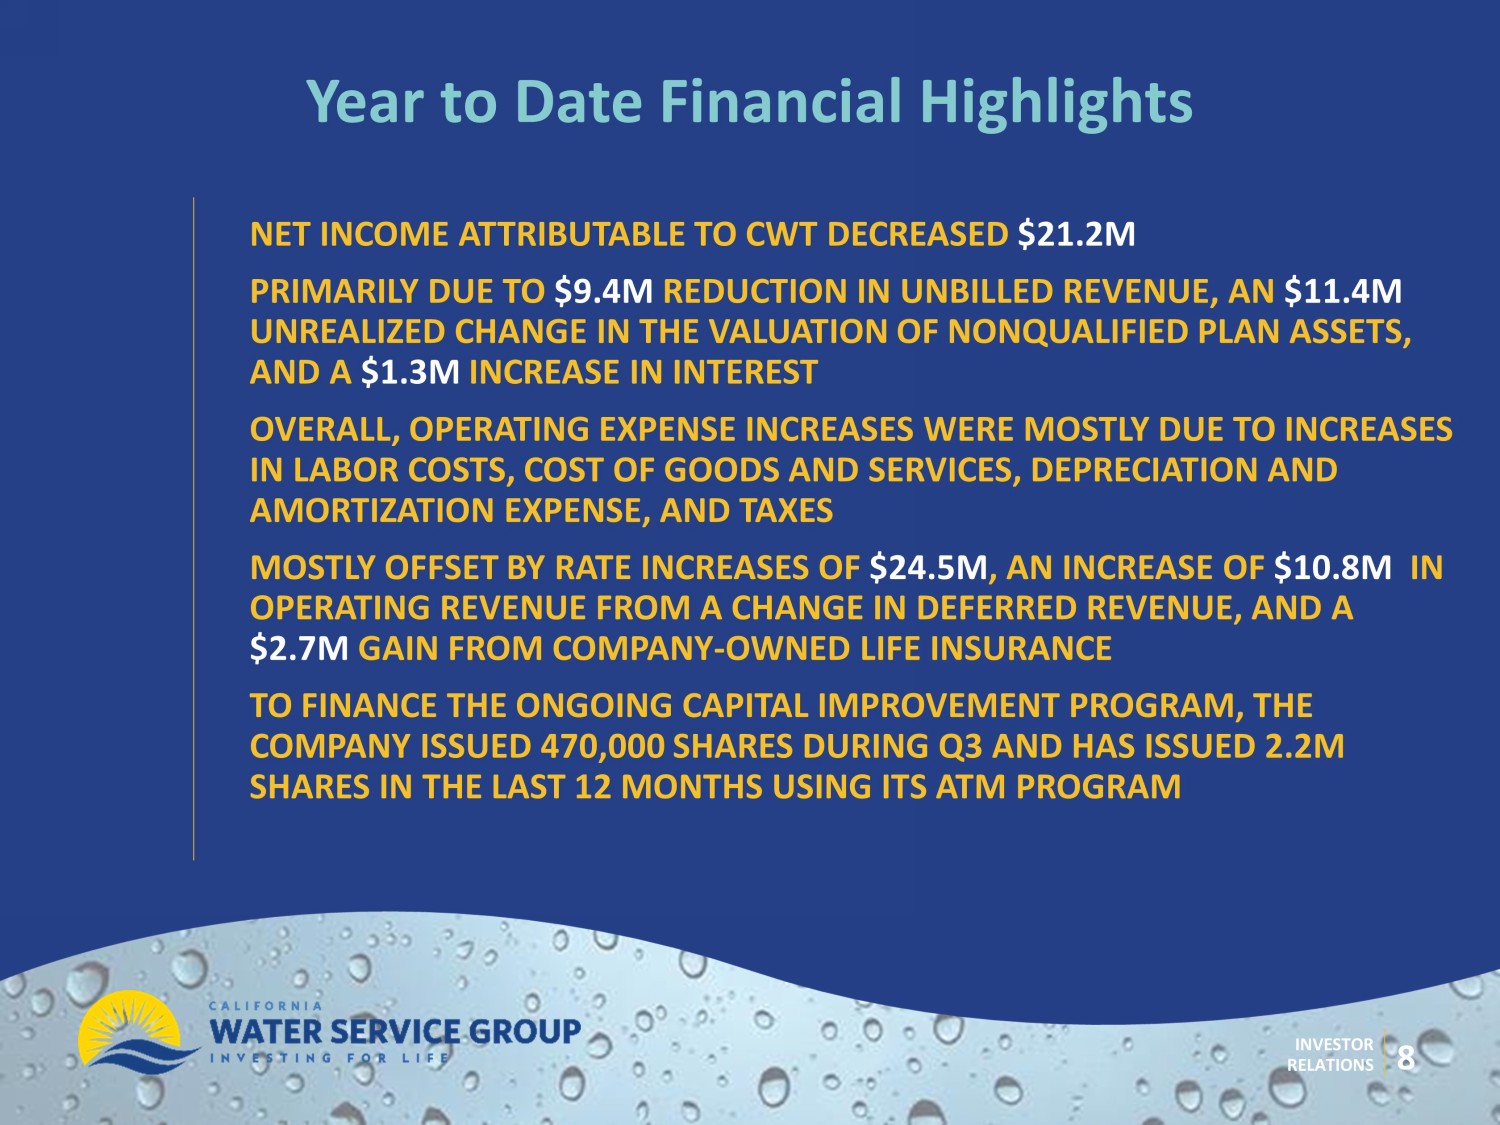
The $21.2 million decrease in net income was primarily due to a decrease of $11.4 million in unrealized gains on certain non-qualified benefit plan investments, a decrease of $9.4 million in accrued unbilled revenue, and an increase of $1.3 million of financing costs. Additionally, the increase in total operating expenses of $42.8 million, driven primarily by increases in water production costs of $6.5 million, administrative and general expenses of $6.6 million, other operations expenses of $18.6 million, maintenance expenses of $2.3 million, depreciation and amortization expense of $4.9 million, income taxes of $2.4 million, and property and other taxes of $1.7 million. These operating expense increases were offset by rate increases of $24.5 million, an increase of $10.8 million in operating revenue from a change in deferred revenue, and a $2.7 million gain from company-owned life insurance.
The change in accrued unbilled revenue was driven by weather and timing of when meter reads were completed during the month of September 2022 compared to September 2021. In the first nine months of 2022, accrued unbilled revenue added $10.7 million to revenue compared to $20.1 million in the same period last year. We expect the difference between 2022 and 2021 annual accrued unbilled revenue to be less than $2.0 million by the end of the year. Changes to unrealized gains on certain benefit plan investments were caused by unfavorable market conditions.
Liquidity and Financing
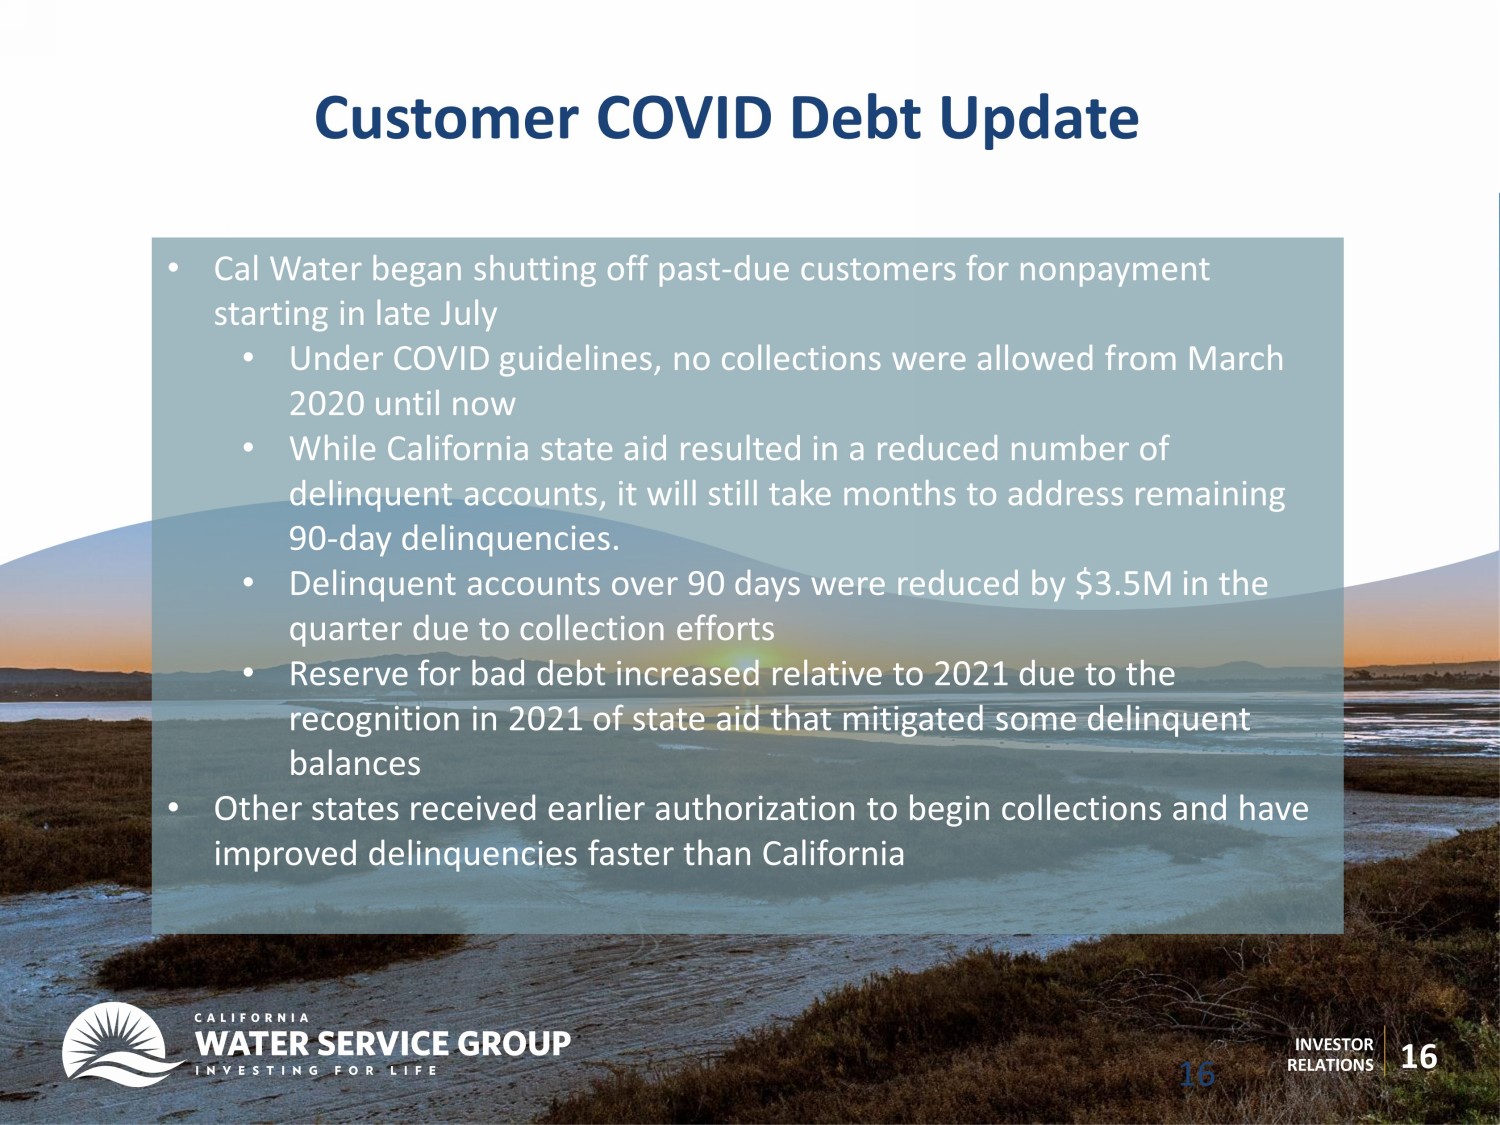
The company maintained $90.5 million of cash as of September 30, 2022 and had additional short-term borrowing capacity of more than $480.0 million, subject to meeting the borrowing conditions on the company’s line of credit facilities. Aged accounts receivable past due more than 60 days decreased from $20.6 million as of June 30, 2022 to $15.8 million as of September 30, 2022 mostly due to regulatory approval to begin collection efforts during the month of July 2022.
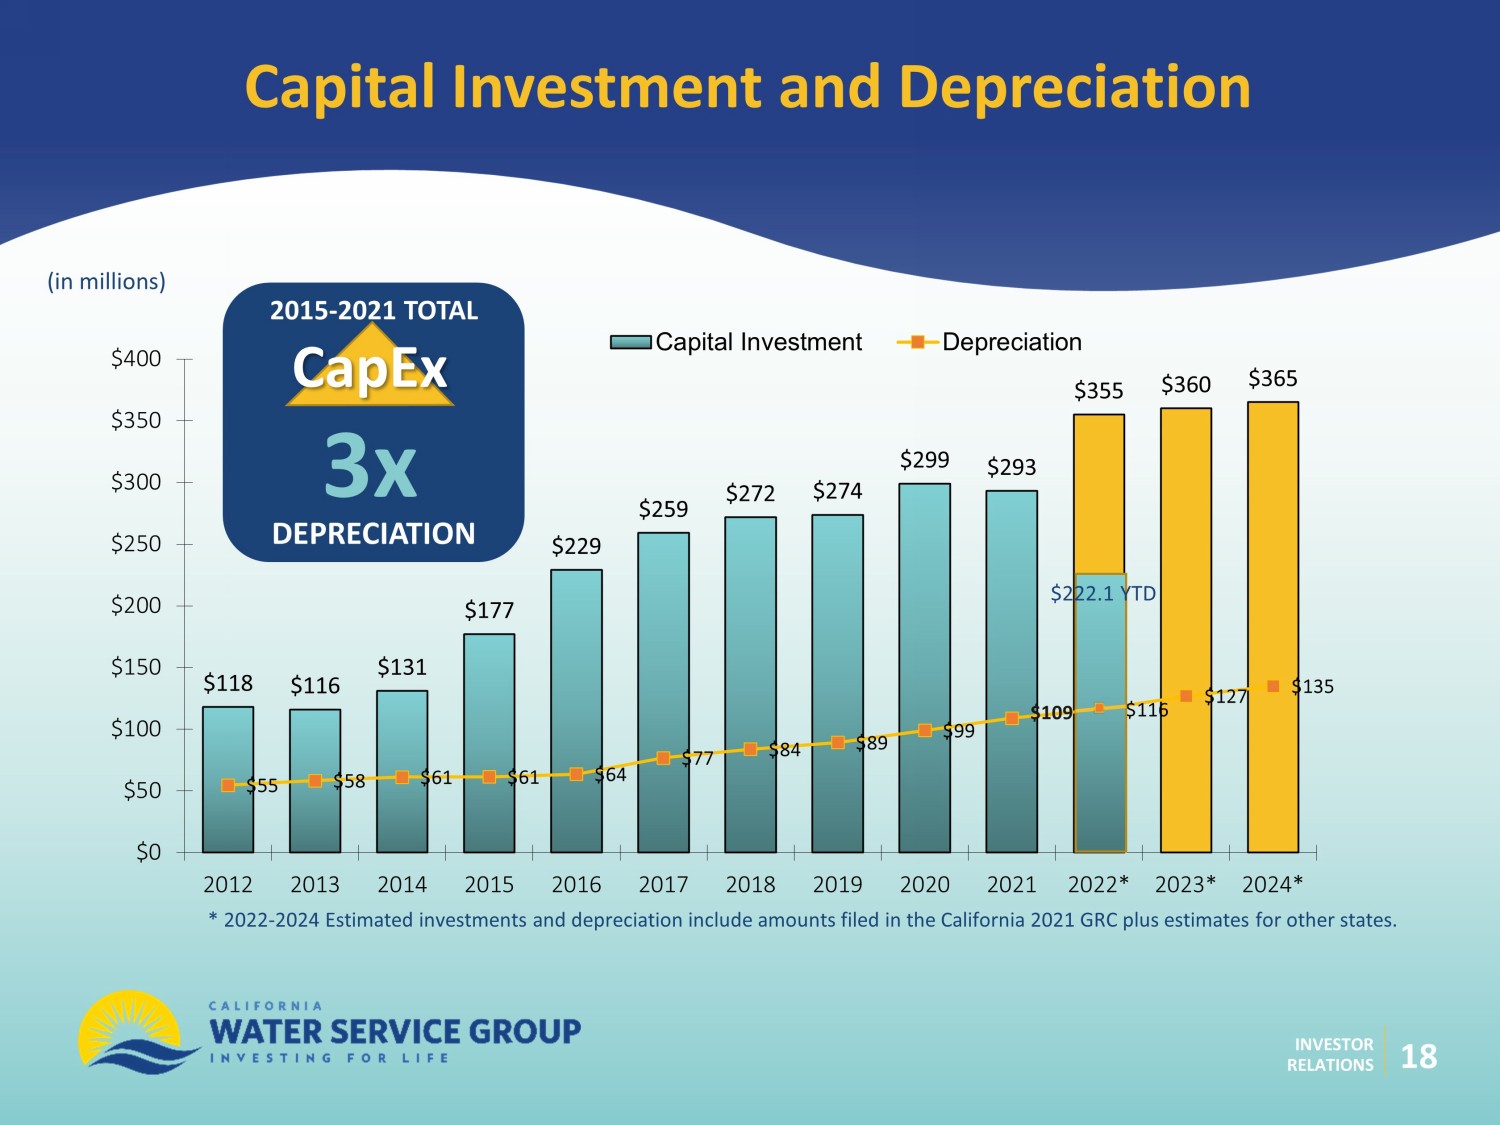
The company invested $222.1 million in infrastructure improvements during the nine month period ended September 30, 2022, up 6.9% for the same period last year. For 2022, the company's capital program will be dependent in part on the timing and nature of regulatory approvals in connection with our California general rate case (GRC) filing. The company proposed to the CPUC spending $1.0 billion on new capital projects in 2022-2024. We evaluate new capital project expenditures in California in the context of the pending GRC and these may change as the case moves forward.
On October 26, 2022, the Board of Directors approved a quarterly cash dividend of $0.25 per share of common stock.
WRAM and MCBA
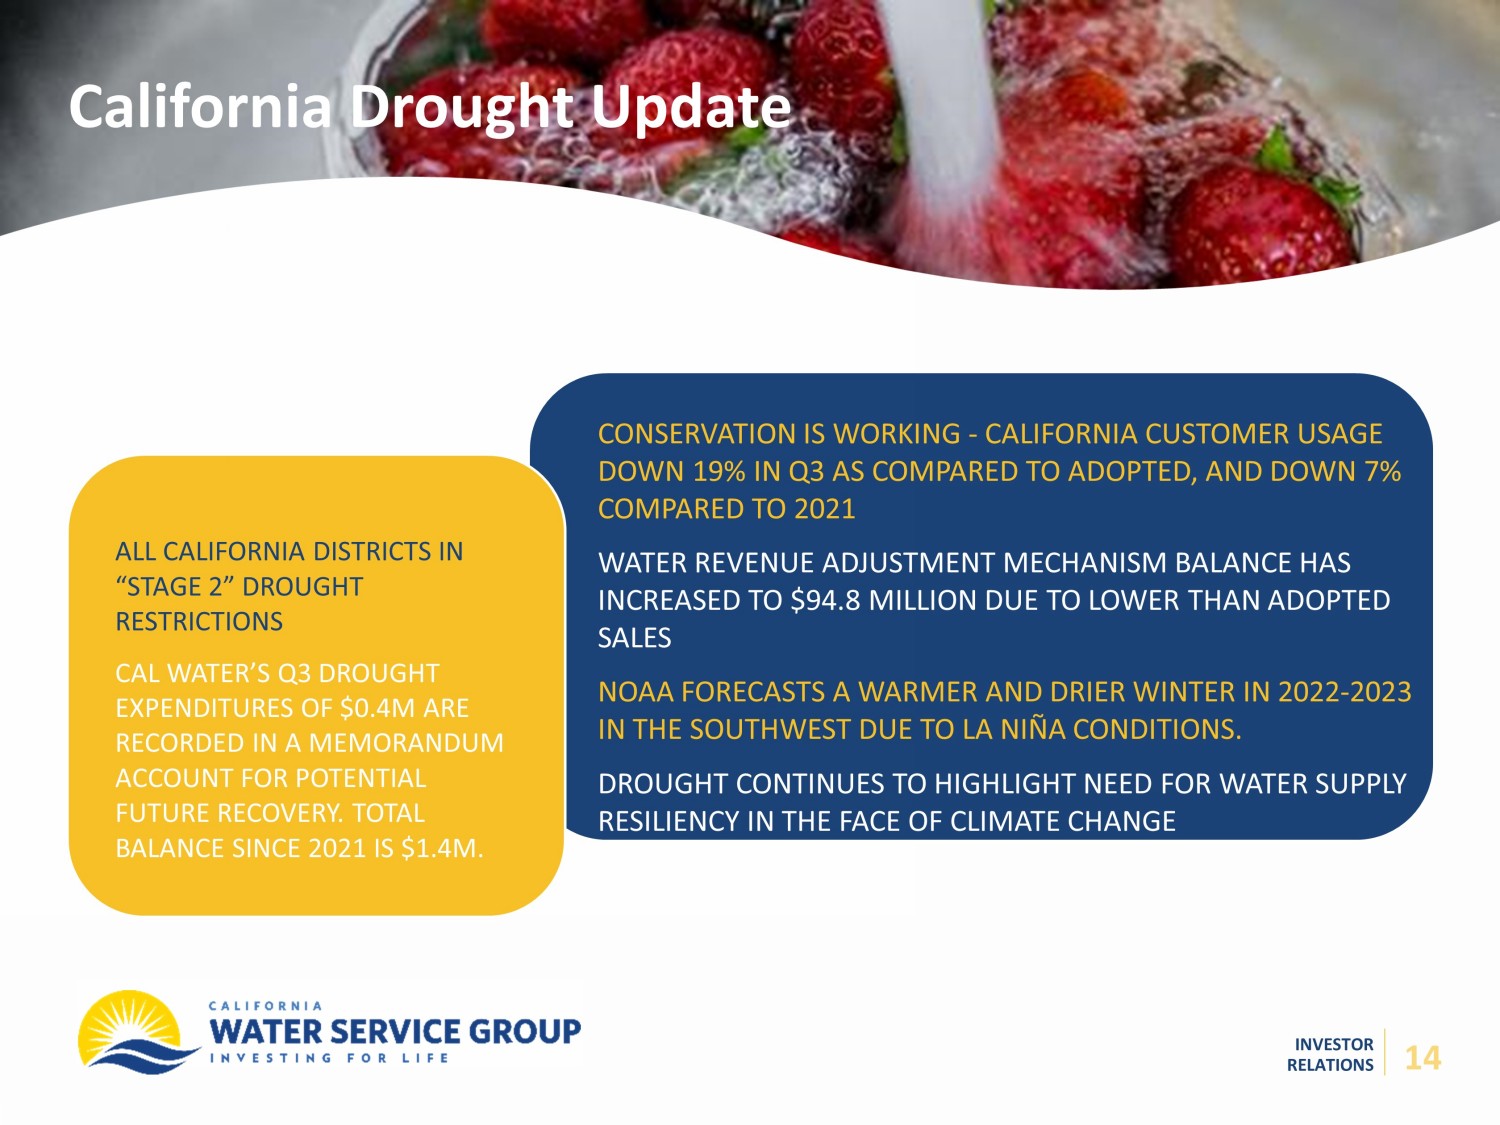
The under-collected net receivable balance in the WRAM and MCBA balancing account was $94.8 million as of September 30, 2022, an increase of 22.4% or $17.3 million from the balance of $77.4 million as of June 30, 2022.
Other Information
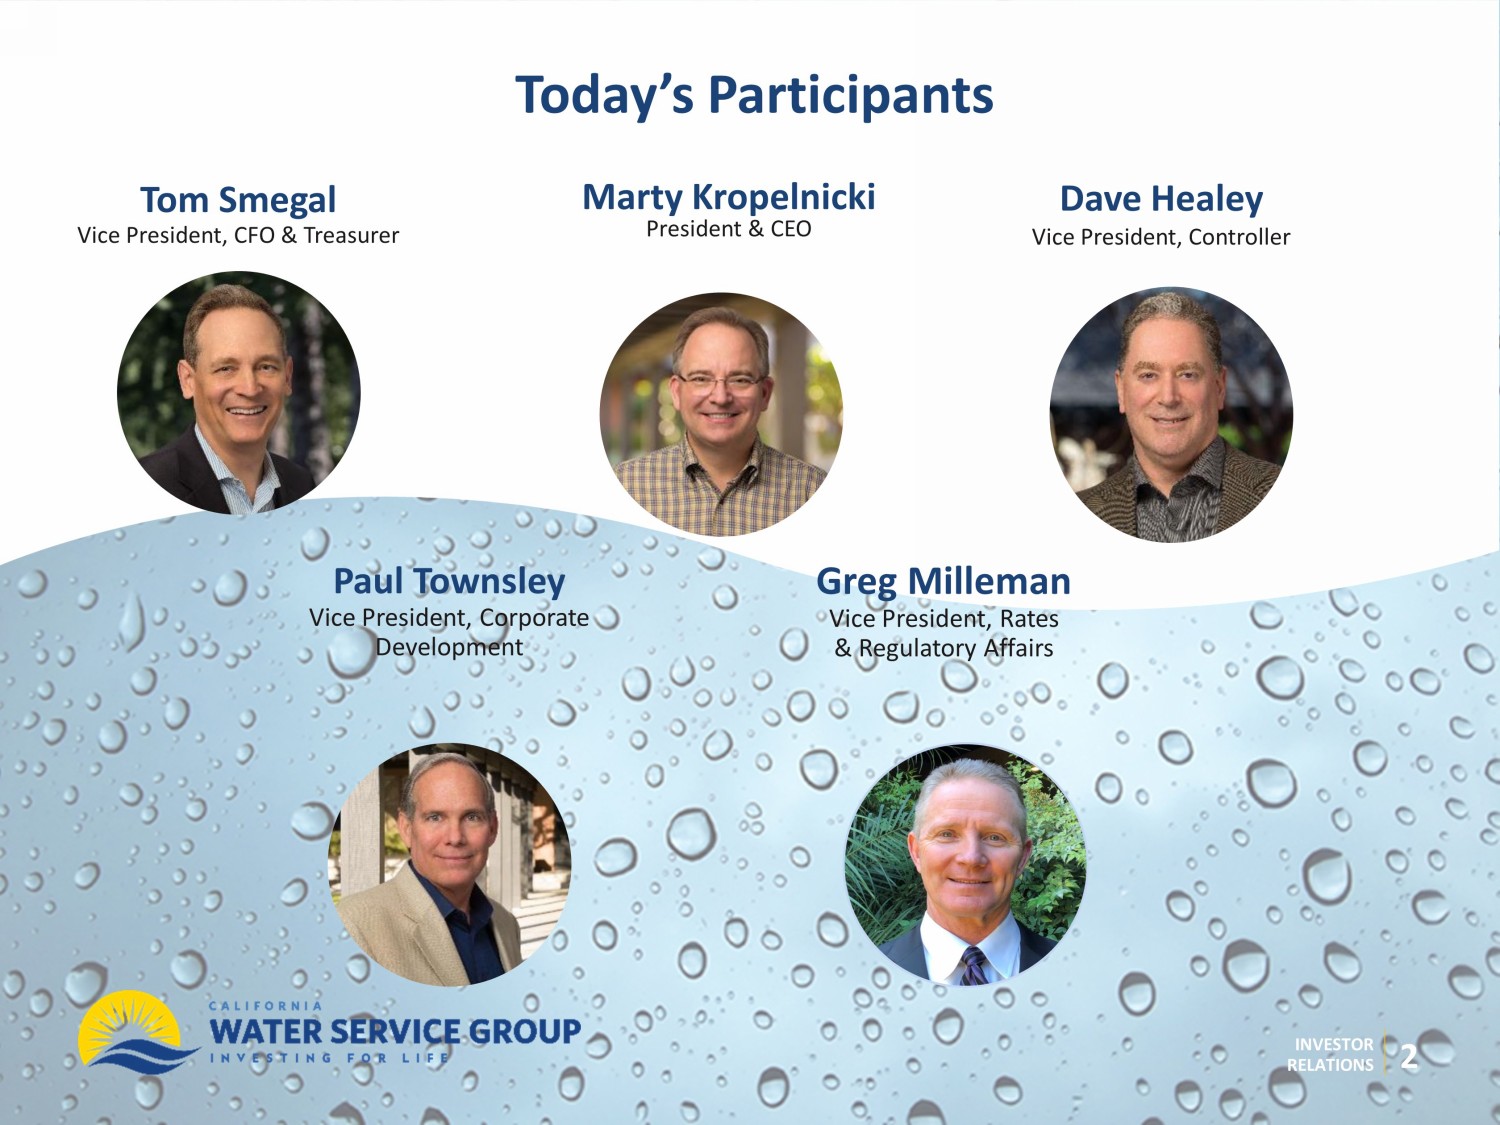
All stockholders and interested investors are invited to listen to the 2022 third quarter conference call on October 27, 2022 at 8:00 a.m. PT (11:00 a.m. ET) by dialing 1-800-715-9871 or 1-646-307-1963 and keying in ID #5254006. Please dial in at least 15 minutes in advance of the call to ensure a timely connection. A replay of the call will be available from noon PT (3:00 p.m. ET) on October 27, 2022 through December 26, 2022, at 1-800-770-2030 or 1-609-800-9909, ID #5254006. The replay will also be available under the investor relations tab at www.calwatergroup.com. Prior to the call, the company will post a slide presentation on its website. The presentation can be found at www.calwatergroup.com/docs/q32022slides.pdf after 6:00 a.m. PT. The call will be hosted by President and Chief Executive Officer Martin A. Kropelnicki, Vice President and Chief Financial Officer Thomas F. Smegal III, and Vice President and Corporate Controller David B. Healey.
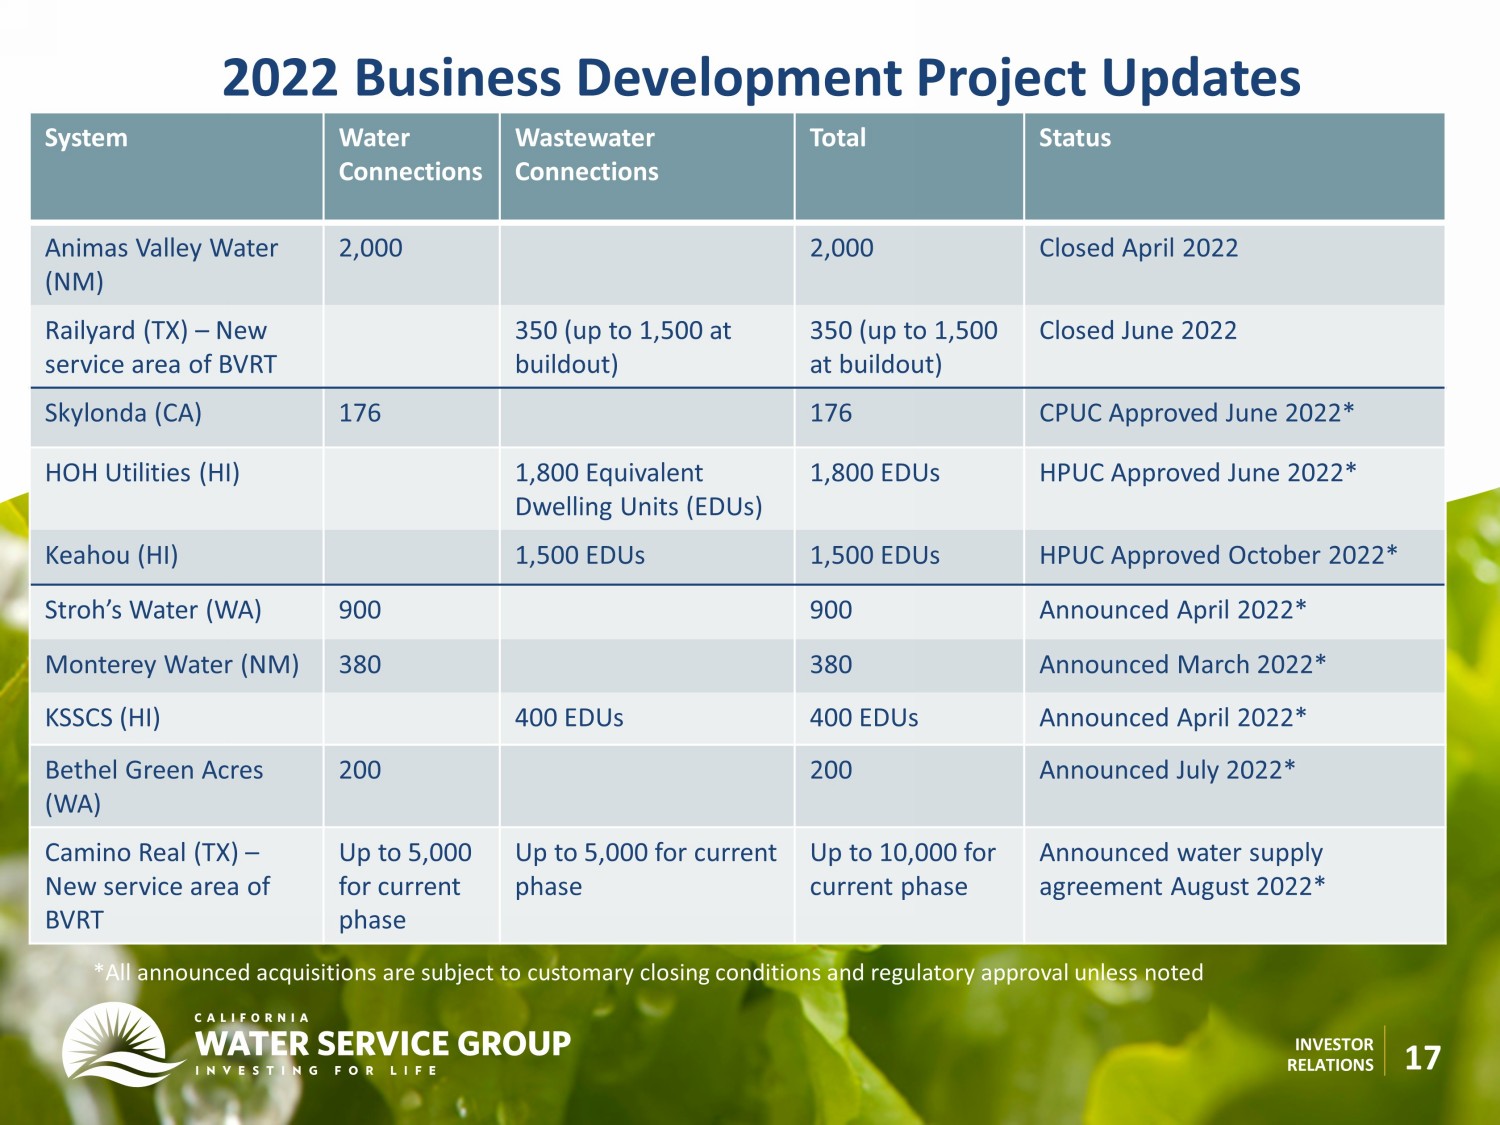
California Water Service Group is the parent company of regulated utilities California Water Service, Hawaii Water Service, New Mexico Water Service, and Washington Water Service, as well as Texas Water Service, a utility holding company. Together, these companies provide regulated and non-regulated water and wastewater service to more than 2.1 million people in California, Hawaii, New Mexico, Washington, and Texas. California Water Service Group’s common stock trades on the New York Stock Exchange under the symbol “CWT.” Additional information is available online at www.calwatergroup.com.
This news release contains forward-looking statements within the meaning established by the Private Securities Litigation Reform Act of 1995 ("Act"). The forward-looking statements are intended to qualify under provisions of the federal securities laws for "safe harbor" treatment established by the Act. Forward-looking statements are based on currently available information, expectations, estimates, assumptions and projections, and our management’s beliefs, assumptions, judgments and expectations about us, the water utility industry and general economic conditions, including statements regarding the anticipated impact on our business of the ongoing COVID-19 pandemic and related public health measures. These statements are not statements of historical fact. When used in our documents, statements that are not historical in nature, including words like will, would, expects, intends, plans, believes, may, estimates, assumes, anticipates, projects, progress, predicts, hopes, targets, forecasts or variations of these words or similar expressions are intended to identify forward-looking statements. The forward-looking statements are not guarantees of future performance. They are based on numerous assumptions that we believe are reasonable, but they are open to a wide range of uncertainties and business risks. Consequently, actual results may vary materially from what is contained in a forward-looking statement. Factors that may cause actual results to be different than those expected or anticipated include, but are not limited to: the impact of the ongoing COVID-19 pandemic and related public health measures; our ability to invest or apply the proceeds from the issuance of common stock in an accretive manner; governmental and regulatory commissions' decisions, including decisions on proper disposition of property; consequences of eminent domain actions relating to our water systems; changes in regulatory commissions' policies and procedures, such as the CPUC’s decision in 2020 to preclude companies from proposing fully decoupled WRAMs in their next GRC filing (which impacted our 2021 GRC filing related to our operations commencing in 2023); the outcome and timeliness of regulatory commissions' actions concerning rate relief and other matters, including with respect to our 2021 GRC filing and our Cost of Capital filing; increased risk of inverse condemnation losses as a result of climate change and drought; our ability to renew leases to operate water systems owned by others on beneficial terms; changes in California State Water Resources Control Board water quality standards; changes in environmental compliance and water quality requirements; electric power interruptions, especially as a result of Public Safety Power Shutoff (PSPS) programs; housing and customer growth; the impact of opposition to rate increases; our ability to recover costs; availability of water supplies; issues with the implementation, maintenance or security of our information technology systems; civil disturbances or terrorist threats or acts; the adequacy of our efforts to mitigate physical and cyber security risks and threats; the ability of our enterprise risk management processes to identify or address risks adequately; labor relations matters as we negotiate with the unions; changes in customer water use patterns and the effects of conservation, including as a result of drought conditions; our ability to complete, in a timely manner or at all, successfully integrate and achieve anticipated benefits from announced acquisitions; the impact of weather, climate change, natural disasters, and actual or threatened public health emergencies, including disease outbreaks, on our operations, water quality, water availability, water sales and operating results and the adequacy of our emergency preparedness; restrictive covenants in or changes to the credit ratings on our current or future debt that could increase our financing costs or affect our ability to borrow, make payments on debt or pay dividends; risks associated with expanding our business and operations geographically; the impact of stagnating or worsening business and economic conditions, including inflationary pressures, general economic slowdown or a recession, increasing interest rates, and changes in monetary policy; and other risks and unforeseen events described in our SEC filings. When considering forward-looking statements, you should keep in mind the cautionary statements included in this paragraph, as well as the Annual 10-K, Quarterly 10-Q, and other reports filed from time-to-time with the Securities and Exchange Commission (SEC). We are not under any obligation, and we expressly disclaim any obligation, to update or alter any forward-looking statements, whether as a result of new information, future events or otherwise.
##
Contact
Tom Smegal
(408) 367-8200 (analysts)
Shannon Dean
(408) 367-8243 (media)
CALIFORNIA WATER SERVICE GROUP
CONDENSED CONSOLIDATED BALANCE SHEETS
Unaudited
(In thousands, except per share data)
| September 30, | December 31, | |||||||
| 2022 | 2021 | |||||||
| ASSETS | ||||||||
| Utility plant: | ||||||||
| Utility plant | $ | 4,422,312 | $ | 4,197,344 | ||||
| Less accumulated depreciation and amortization | (1,434,700 | ) | (1,350,482 | ) | ||||
| Net utility plant | 2,987,612 | 2,846,862 | ||||||
| Current assets: | ||||||||
| Cash and cash equivalents | 90,458 | 78,380 | ||||||
| Restricted cash | 22,984 | 2,273 | ||||||
| Receivables: | ||||||||
| Customers, net | 79,239 | 60,785 | ||||||
| Regulatory balancing accounts | 54,654 | 78,597 | ||||||
| Other, net | 22,496 | 18,452 | ||||||
| Unbilled revenue, net | 43,417 | 32,760 | ||||||
| Materials and supplies at weighted average cost | 10,994 | 9,511 | ||||||
| Taxes, prepaid expenses, and other assets | 14,923 | 19,700 | ||||||
| Total current assets | 339,165 | 300,458 | ||||||
| Other assets: | ||||||||
| Regulatory assets | 298,362 | 285,692 | ||||||
| Goodwill | 36,814 | 36,814 | ||||||
| Other assets | 144,445 | 153,445 | ||||||
| Total other assets | 479,621 | 475,951 | ||||||
| TOTAL ASSETS | $ | 3,806,398 | $ | 3,623,271 | ||||
| CAPITALIZATION AND LIABILITIES | ||||||||
| Capitalization: | ||||||||
| Common stock, $.01 par value; 136,000 shares authorized, 54,824 and 53,716 outstanding in 2022 and 2021, respectively | $ | 548 | $ | 537 | ||||
| Additional paid-in capital | 711,004 | 651,121 | ||||||
| Retained earnings | 561,907 | 525,936 | ||||||
| Noncontrolling interests | 4,873 | 5,386 | ||||||
| Total equity | 1,278,332 | 1,182,980 | ||||||
| Long-term debt, net | 1,053,944 | 1,055,794 | ||||||
| Total capitalization | 2,332,276 | 2,238,774 | ||||||
| Current liabilities: | ||||||||
| Current maturities of long-term debt, net | 5,790 | 5,192 | ||||||
| Short-term borrowings | 70,000 | 35,000 | ||||||
| Accounts payable | 157,911 | 144,369 | ||||||
| Regulatory balancing accounts | 9,684 | 17,547 | ||||||
| Accrued interest | 17,338 | 6,542 | ||||||
| Accrued expenses and other liabilities | 61,824 | 47,926 | ||||||
| Total current liabilities | 322,547 | 256,576 | ||||||
| Deferred income taxes | 312,193 | 298,945 | ||||||
| Pension | 96,063 | 92,287 | ||||||
| Regulatory liabilities and other | 256,611 | 252,938 | ||||||
| Advances for construction | 199,277 | 198,086 | ||||||
| Contributions in aid of construction | 287,431 | 285,665 | ||||||
| Commitments and contingencies | ||||||||
| TOTAL CAPITALIZATION AND LIABILITIES | $ | 3,806,398 | $ | 3,623,271 | ||||
CALIFORNIA WATER SERVICE GROUP
CONDENSED CONSOLIDATED STATEMENTS OF OPERATIONS
Unaudited
(In thousands, except per share data)
For the Three Months ended:
| September 30, | September 30, | |||||||
| 2022 | 2021 | |||||||
| Operating revenue | $ | 266,307 | $ | 256,723 | ||||
| Operating expenses: | ||||||||
| Operations: | ||||||||
| Water production costs | 88,750 | 84,951 | ||||||
| Administrative and general | 33,328 | 30,712 | ||||||
| Other operations | 26,676 | 24,686 | ||||||
| Maintenance | 8,433 | 7,739 | ||||||
| Depreciation and amortization | 28,844 | 27,232 | ||||||
| Income taxes | 5,890 | 1,705 | ||||||
| Property and other taxes | 9,440 | 8,546 | ||||||
| Total operating expenses | 201,361 | 185,571 | ||||||
| Net operating income | 64,946 | 71,152 | ||||||
| Other income and expenses: | ||||||||
| Non-regulated revenue | 4,573 | 5,813 | ||||||
| Non-regulated expenses | (6,905 | ) | (5,779 | ) | ||||
| Other components of net periodic benefit credit | 3,737 | 1,853 | ||||||
| Allowance for equity funds used during construction | 1,004 | 898 | ||||||
| Income tax expense on other income and expenses | (353 | ) | (207 | ) | ||||
| Net other income | 2,056 | 2,578 | ||||||
| Interest expense: | ||||||||
| Interest expense | 11,891 | 11,737 | ||||||
| Allowance for borrowed funds used during construction | (572 | ) | (506 | ) | ||||
| Net interest expense | 11,319 | 11,231 | ||||||
| Net income | 55,683 | 62,499 | ||||||
| Net (loss) income attributable to noncontrolling interests | (189 | ) | 70 | |||||
| Net income attributable to California Water Service Group | $ | 55,872 | $ | 62,429 | ||||
| Earnings per share of common stock | ||||||||
| Basic | $ | 1.03 | $ | 1.20 | ||||
| Diluted | $ | 1.03 | $ | 1.20 | ||||
| Weighted average shares outstanding | ||||||||
| Basic | 54,444 | 51,823 | ||||||
| Diluted | 54,487 | 51,823 | ||||||
| Dividends per share of common stock | $ | 0.25 | $ | 0.23 | ||||
CALIFORNIA WATER SERVICE GROUP
CONDENSED CONSOLIDATED STATEMENTS OF OPERATIONS
Unaudited
(In thousands, except per share data)
For the Nine Months ended:
| September 30, | September 30, | |||||||
| 2022 | 2021 | |||||||
| Operating revenue | $ | 645,494 | $ | 617,583 | ||||
| Operating expenses: | ||||||||
| Operations: | ||||||||
| Water production costs | 221,195 | 214,688 | ||||||
| Administrative and general | 99,425 | 92,837 | ||||||
| Other operations | 81,945 | 63,318 | ||||||
| Maintenance | 23,389 | 21,118 | ||||||
| Depreciation and amortization | 86,387 | 81,516 | ||||||
| Income taxes | 5,927 | 3,576 | ||||||
| Property and other taxes | 25,853 | 24,213 | ||||||
| Total operating expenses | 544,121 | 501,266 | ||||||
| Net operating income | 101,373 | 116,317 | ||||||
| Other income and expenses: | ||||||||
| Non-regulated revenue | 16,772 | 16,759 | ||||||
| Non-regulated expenses | (22,432 | ) | (12,354 | ) | ||||
| Other components of net periodic benefit credit | 11,516 | 7,520 | ||||||
| Allowance for equity funds used during construction | 3,021 | 2,290 | ||||||
| Income tax expense on other income and expenses | (1,210 | ) | (1,077 | ) | ||||
| Net other income | 7,667 | 13,138 | ||||||
| Interest expense: | ||||||||
| Interest expense | 34,972 | 33,165 | ||||||
| Allowance for borrowed funds used during construction | (1,724 | ) | (1,253 | ) | ||||
| Net interest expense | 33,248 | 31,912 | ||||||
| Net income | 75,792 | 97,543 | ||||||
| Net loss attributable to noncontrolling interests | (650 | ) | (79 | ) | ||||
| Net income attributable to California Water Service Group | $ | 76,442 | $ | 97,622 | ||||
| Earnings per share of common stock | ||||||||
| Basic | $ | 1.41 | $ | 1.91 | ||||
| Diluted | $ | 1.41 | $ | 1.91 | ||||
| Weighted average shares outstanding | ||||||||
| Basic | 54,063 | 51,119 | ||||||
| Diluted | 54,104 | 51,119 | ||||||
| Dividends per share of common stock | $ | 0.75 | $ | 0.69 | ||||