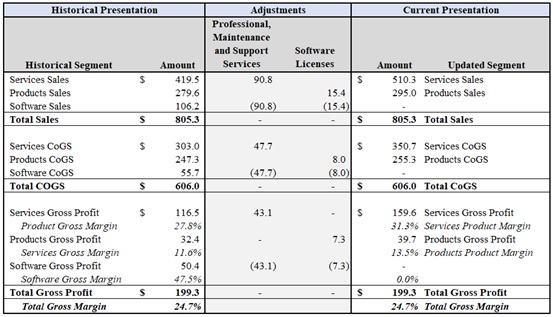
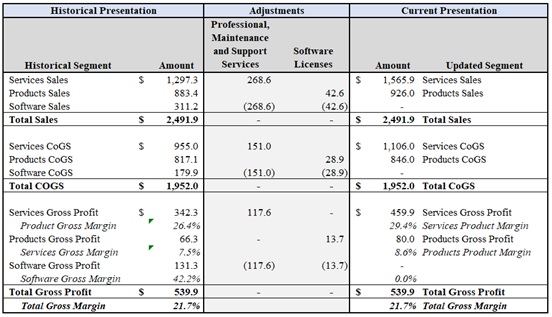
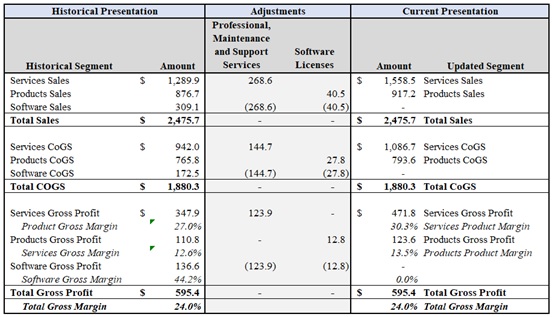
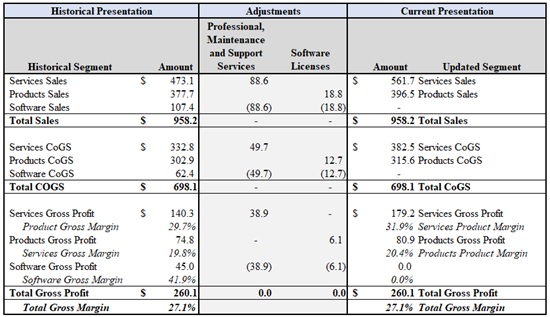
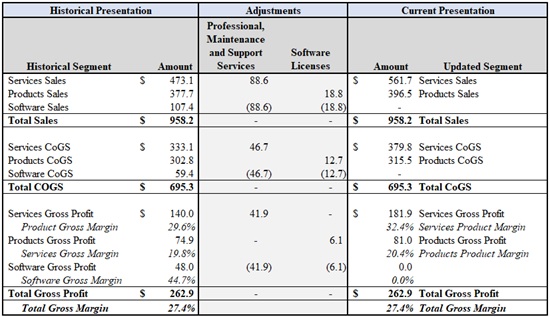
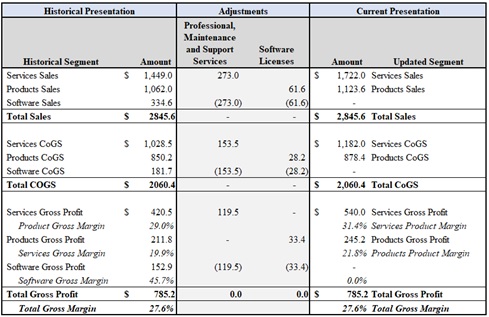
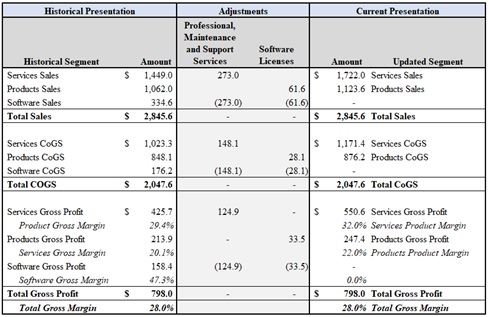
Exhibit 99.1
 |
press release
|
|
Media contact:
|
Investor contact:
|
|
Mike Jacobsen, APR
|
Christine Marchuska, CAIA
|
|
+1 330 490 4498
|
+1 607 206 9212
|
FOR IMMEDIATE RELEASE:
November 8, 2022
Diebold Nixdorf Reports 2022 Third Quarter Financial Results
Please visit http://www.dieboldnixdorf.com/earnings for a comprehensive shareholder letter and additional content
HUDSON, Ohio - Diebold Nixdorf (NYSE:DBD) today reported its third quarter 2022 financial results.
Key Highlights
|
•
|
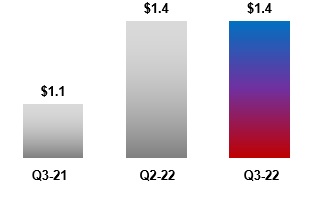
Stable demand, evidenced by product backlog of ~$1.4 billion at the end of Q3
|
|
•
|
New operating model well underway, having executed and identified ~$170 million of savings, and modeling an additional ~$25 million of savings from the company's
previously disclosed cost savings plan
|
|
•
|
Entered into a Transaction Support Agreement (TSA) with lenders to refinance debt
|
Octavio Marquez, Diebold Nixdorf president and chief executive officer, said: "Since March of this year, our fundamental objectives have remained focused on taking important steps to
strengthen our business and competitive position. In the third quarter, while the macroeconomic environment presented widely discussed challenges, the combination of stable demand, industry-leading solutions, progress with the TSA, and our ongoing
cost reductions and operational improvements contributed to Diebold Nixdorf's ongoing confidence in our strategic operating model. We have solid financial fundamentals and have consistently seen steady demand for our product and solution set."
Business Highlights
|
•
|
Banking
|
|
◦
|
Continued shift from legacy systems to DN Series™ ATMs as the latter, specifically cash recyclers, composed the vast majority of total new Banking orders in North
America in Q3
|
|
◦
|
Secured an ~$8 million deal with Banco Azteca, replacing its existing ATM fleet with DN Series plus Vynamic suite
|
|
◦
|
Won an ~$3 million deal with Kapital Bank in Uzbekistan - expanding its ATM network with DN Series to fully meet its vision to offer a large range of innovative
services and banking products
|
|
•
|
Retail
|
|
◦
|
Self-checkout (SCO) products continue to drive our Retail business with consistent demand for these solutions, specifically in Europe
|
|
◦
|
Secured an ~$10 million deal with one of Europe’s leading fuel and convenience retailers for Vynamic FCx platform, Vynamic software and services for
implementation and maintenance for more than 1,300 sites in Spain and Portugal during 2023 and 2024
|
|
◦
|
Won an ~$5 million deal over several entities which are part of a large European conglomerate for SCO, ePOS replacement and additional DN retail solutions
|
TSA update
As previously announced, last month the company entered into a TSA with the holders of over a majority of our term loans and each series of our outstanding secured and
unsecured notes. Following the initial execution of the TSA, additional eligible creditors have executed joinders thereto, and as a result, the percentage of the company’s term loans held by holders who are party to the TSA has increased from
approximately 79% to approximately 97% today, and the percentage of the company’s 2024 senior notes that are held by holders who are party to the TSA has increased from approximately 59% to approximately 83% today.
Page 1 of 15
Jeffrey Rutherford, Diebold Nixdorf executive vice president and chief financial officer,
said: "Overall supply chain material availability and logistics are improving; however, our models assumed a quicker normalization of supplier relationships than
we are currently experiencing. However, it is also worth noting that this is more of a short-term challenge as we seek to normalize our working capital management, including with respect to our supplier relationships. In Q4, the conversion of backlog
to revenue recognition will continue to be challenging and we could see as much as 15% risk of unit-to-revenue conversion and its corresponding attached services and software. Note a 15% variance in units would equate to approximately $100 million in
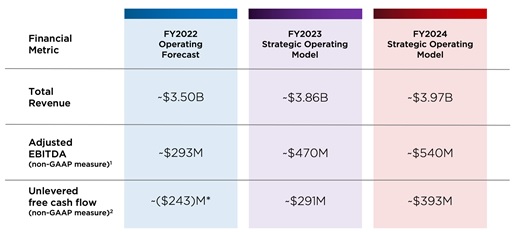
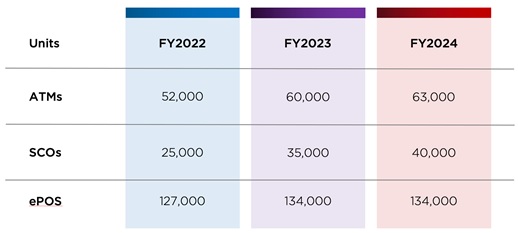
revenue and approximately $30 million in adjusted EBITDA, depending on geography, customer and product mix. We expect that units that are not revenue recognized in Q4 will shift to 2023. Please see our Shareholder Letter for our Operating Forecast
and Strategic Operating Model."
Overview Presentation and Conference Call
More information on Diebold Nixdorf's quarterly earnings is available on its Investor Relations website. Octavio Marquez, president and chief executive officer, and Jeffrey
Rutherford, executive vice president and chief financial officer, will discuss the company's financial performance during a conference call today at 8:30 a.m. (ET). The call / webcast is available at http://www.dieboldnixdorf.com/earnings. The replay
of the webcast can be accessed on the website for up to three months after the call.
About Diebold Nixdorf
Diebold Nixdorf, Incorporated (NYSE: DBD) automates, digitizes and transforms the way people bank and shop. As a partner to the majority of the world’s top 100 financial
institutions and top 25 global retailers, our integrated solutions connect digital and physical channels conveniently, securely and efficiently for millions of consumers each day. The company has a presence in more than 100 countries with
approximately 22,000 employees worldwide. Visit www.DieboldNixdorf.com for more information.
Twitter: @DieboldNixdorf
LinkedIn: www.linkedin.com/company/diebold
Facebook: www.facebook.com/DieboldNixdorf
YouTube: www.youtube.com/dieboldnixdorf
Disclaimer
This press release does not constitute an offer to sell or buy, nor the solicitation of an offer to sell or buy, any securities referred to herein. Any solicitation or
offer will only be made pursuant to an offering memorandum and disclosure statement and only to such persons and in such jurisdictions as is permitted under applicable law.
Page 2 of 15
Non-GAAP Financial Measures and Other Information
To supplement our condensed consolidated financial statements presented in accordance with GAAP, the company considers certain financial measures that are not prepared in
accordance with GAAP, including Non-GAAP results, adjusted diluted earnings per share, free cash flow (use) and unlevered free cash flow (use), net debt, EBITDA, adjusted EBITDA and constant currency results. The company calculates constant currency
by translating the prior year results at current year exchange rates. The company uses these Non-GAAP financial measures, in addition to GAAP financial measures, to evaluate our operating and financial performance and to compare such performance to
that of prior periods and to the performance of our competitors. Also, the company uses these Non-GAAP financial measures in making operational and financial decisions and in establishing operational goals. The company also believes providing these
Non-GAAP financial measures to investors, as a supplement to GAAP financial measures, helps investors evaluate our operating and financial performance and trends in our business, consistent with how management evaluates such performance and trends.
The company also believes these Non-GAAP financial measures may be useful to investors in comparing its performance to the performance of other companies, although its Non-GAAP financial measures are specific to the company and the Non-GAAP financial
measures of other companies may not be calculated in the same manner. We provide EBITDA and Adjusted EBITDA because we believe that investors and securities analysts will find EBITDA and adjusted EBITDA to be useful measures for evaluating our
operating performance and comparing our operating performance with that of similar companies that have different capital structures and for evaluating our ability to meet our future debt service, capital expenditure and working capital requirements.
We consider free cash flow (use) to be a liquidity measure that provides useful information to management and investors about the amount of cash generated by the business that, after the purchase of property and equipment and capitalized software
development, changes in cash of assets held for sale and the use of cash for M&A and the legal settlement for impaired cloud implementation costs, and excluding the use/proceeds of cash for the settlement of foreign exchange derivative
instruments, can be used for debt servicing, strategic opportunities, including investing in the business, making strategic acquisitions, strengthening the balance sheet and paying dividends. Unlevered free cash flow (use) provides incremental
visibility into the company's liquidity by excluding cash used for interest payments from free cash flow (use). For more information, please refer to the section, "Notes for Non-GAAP Measures."
Forward-Looking Statements
This press release contains statements that are not historical information and are "forward-looking statements" within the meaning of the Private Securities Litigation
Reform Act of 1995. Forward-looking statements give current expectations or forecasts of future events and are not guarantees of future performance. These forward-looking statements include, but are not limited to, projections, statements regarding
the company's expected future performance (including expected results of operations and financial guidance), future financial condition, potential impact of the ongoing coronavirus (COVID-19) pandemic, anticipated operating results, strategy plans,
future liquidity and financial position.
Statements can generally be identified as forward looking because they include words such as “believes,” “anticipates,” “expects,” “intends,” “plans,” “will,” “estimates,”
“potential,” “target,” “predict,” “project,” “seek,” and variations thereof or “could,” “should” or words of similar meaning. Statements that describe the company's future plans, objectives or goals are also forward-looking statements, which reflect
the current views of the company with respect to future events and are subject to assumptions, risks and uncertainties that could cause actual results to differ materially. Although the company believes that these forward-looking statements are based
upon reasonable assumptions regarding, among other things, the economy, its knowledge of its business, and key performance indicators that impact the company, these forward-looking statements involve risks, uncertainties and other factors that may
cause actual results to differ materially from those expressed in or implied by the forward-looking statements.
Page 3 of 15
Readers are cautioned not to place undue reliance on these forward-looking statements, which speak only as of the date hereof.
The factors that may affect the company's results include, among others:
|
•
|
our ability to successfully complete the transactions contemplated by the TSA, including the ability to negotiate and execute definitive documentation, the
receipt of required consents to any or all of such transactions, satisfaction of any conditions in any such documentation and the availability of alternative transactions;
|
|
•
|
the overall impact of the global supply chain complexities on the company and its business, including delays in sourcing key components as well as longer
transport times, especially for container ships and U.S. trucking, given the company’s reliance on suppliers, subcontractors and availability of raw materials and other components;
|
|
•
|
our ability to successfully convert our backlog into sales, including our ability to overcome supply chain and liquidity challenges;
|
|
•
|
the ultimate impact of the ongoing COVID-19 pandemic and other public health emergencies, including further adverse effects to the company’s supply chain,
maintenance of increased order backlog, and the effects of any COVID-19 related cancellations;
|
|
•
|
the company's ability to successfully meet its cost-reduction goals and continue to achieve benefits from its cost-reduction initiatives and other strategic
initiatives, such as the current $150m+ cost savings plan;
|
|
•
|
the success of the company’s new products, including its DN Series line and EASY family of retail checkout solutions, and EV charging service business;
|
|
•
|
the impact of a cybersecurity breach or operational failure on the company's business;
|
|
•
|
the company's ability to generate sufficient cash to service its debt or to comply with the covenants contained in the agreements governing its debt and to
successfully refinance its debt;
|
|
•
|
the company’s ability to attract, retain and motivate key employees;
|
|
•
|
the company’s reliance on suppliers, subcontractors and availability of raw materials and other components;
|
|
•
|
changes in the company's intention to further repatriate cash and cash equivalents and short-term investments residing in international tax jurisdictions, which
could negatively impact foreign and domestic taxes;
|
|
•
|
the company's success in divesting, reorganizing or exiting non-core and/or non-accretive businesses and its ability to successfully manage acquisitions,
divestitures, and alliances;
|
|
•
|
the ultimate outcome of the appraisal proceedings initiated in connection with the implementation of the Domination and Profit Loss Transfer Agreement with the
former Diebold Nixdorf AG (which was dismissed in the company’s favor at the lower court level in May 2022) and the merger/squeeze-out;
|
|
•
|
the impact of market and economic conditions, including the bankruptcies, restructuring or consolidations of financial institutions, which could reduce the
company’s customer base and/or adversely affect its customers' ability to make capital expenditures, as well as adversely impact the availability and cost of credit;
|
|
•
|
the impact of competitive pressures, including pricing pressures and technological developments;
|
|
•
|
changes in political, economic or other factors such as currency exchange rates, inflation rates (including the impact of possible currency devaluations in
countries experiencing high inflation rates), recessionary or expansive trends, hostilities or conflicts (including the conflict between Russia and Ukraine), disruption in energy supply, taxes and regulations and laws affecting the
worldwide business in each of the company's operations;
|
|
•
|
the company's ability to maintain effective internal controls;
|
|
•
|
unanticipated litigation, claims or assessments, as well as the outcome/impact of any current/pending litigation, claims or assessments;
|
|
•
|
the effect of changes in law and regulations or the manner of enforcement in the U.S. and internationally and the company’s ability to comply with government
regulations.
|
|
•
|
and other factors included in the company’s filings with the SEC, including its Annual Report on Form 10-K for the year ended December 31, 2021, its Quarterly
Report on Form 10-Q for the quarterly period ended June 30, 2022, and in other documents the company files with the SEC.
|
Except to the extent required by applicable law or regulation, the company undertakes no obligation to update these forward-looking statements to reflect future events
or circumstances or to reflect the occurrence of unanticipated events.
You should consider these factors carefully in evaluating forward-looking statements and are cautioned not to place undue reliance on such statements.
Page 4 of 15
Summary Financial Results
|
Three months ended
|
||||||||||||||||||||||||
|
September 30, 2022
|
September 30, 2021
|
% Change
|
||||||||||||||||||||||
|
($ in millions, except per share data)
|
GAAP
|
Non-GAAP1
|
GAAP
|
Non-GAAP1
|
GAAP
|
Non-GAAP
|
||||||||||||||||||
|
Total net sales
|
$
|
810.4
|
$
|
805.3
|
$
|
958.2
|
$
|
958.2
|
(15.4
|
)
|
(16.0
|
)
|
||||||||||||
|
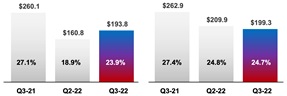
Gross profit
|
$
|
193.8
|
$
|
199.3
|
$
|
260.1
|
$
|
262.9
|
(25.5
|
)
|
(24.2
|
)
|
||||||||||||
|
Operating profit
|
$
|
5.5
|
$
|
60.0
|
$
|
38.7
|
$
|
81.3
|
(85.8
|
)
|
(26.2
|
)
|
||||||||||||
|
Operating margin
|
0.7
|
%
|
7.5
|
%
|
4.0
|
%
|
8.5
|
%
|
(330)
|
bps |
(100)
|
bps |
||||||||||||
|
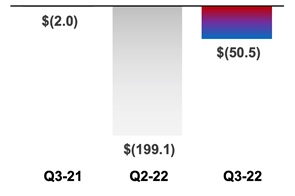
Net income (loss)
|
$
|
(50.5
|
)
|
$
|
(9.7
|
) |
$
|
(2.0
|
)
|
$
|
26.9
|
N/M
|
|
N/M
|
|
|||||||||
|
Diluted earnings (loss) per share2
|
$
|
(0.63
|
)
|
$
|
(0.12
|
)
|
$
|
(0.03
|
)
|
$
|
0.34
|
N/M
|
|
N/M
|
|
|||||||||
|
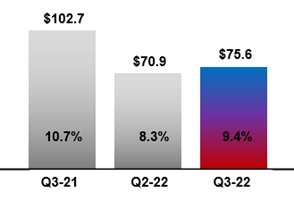
Adjusted EBITDA
|
$
|
75.6
|
$
|
102.7
|
(26.4
|
)
|
||||||||||||||||||
|
•
|
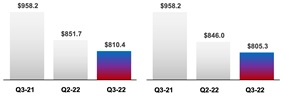
Total net sales decreased 15.4%, or $147.8 million YoY, primarily due to the foreign currency translation impact of the declining value of the Euro in comparison to the U.S. dollar and longer lead times resulting from global supply chain and logistics issues.
|
|
•
|
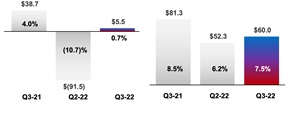
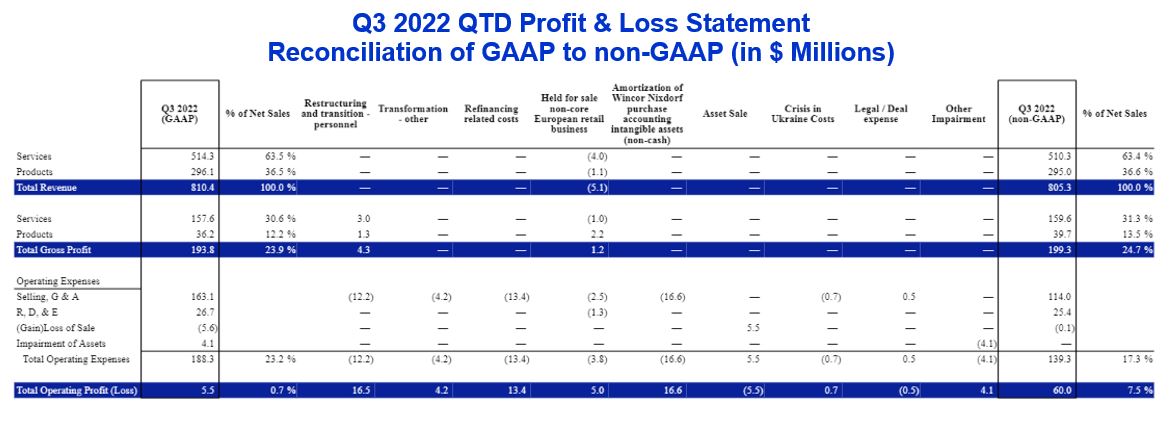
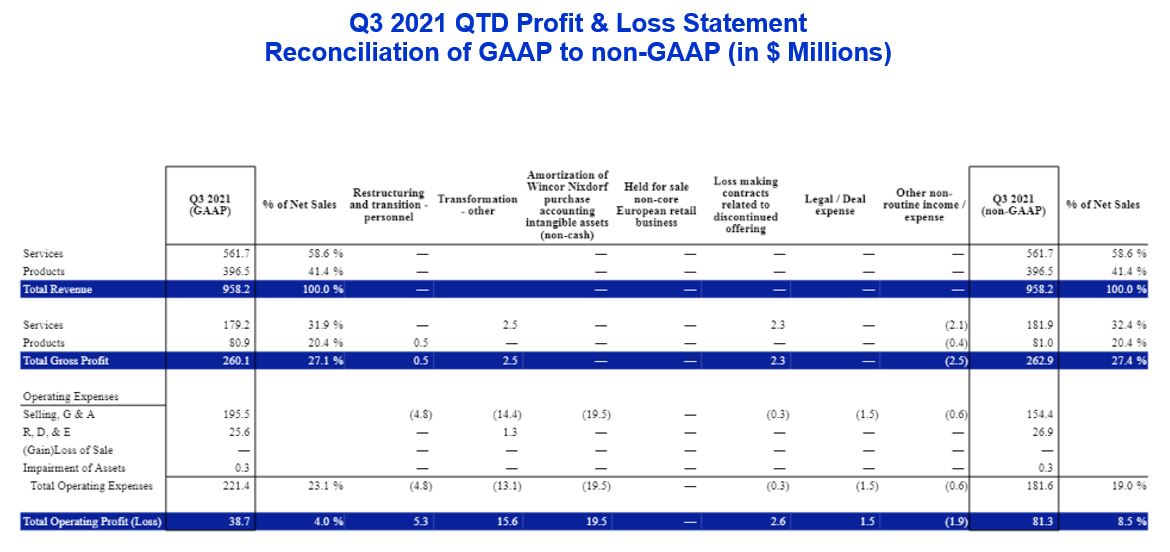
Non-GAAP operating profit declined 26.2% to $60.0 million and Non-GAAP operating margin decreased 100 bps to 7.5%; due
primarily to revenue delays and net inflationary costs.
|
|
Q3 2022
|
Q3 2021
|
YTD
9/30/2022
|
YTD
9/30/2021
|
TTM
9/30/2022
|
||||||||||||||||
|
Net cash (used) provided by operating activities (GAAP measure)
|
$
|
(176.2
|
)
|
$
|
(147.9
|
)
|
$
|
(482.8
|
)
|
$
|
(291.6
|
)
|
$
|
(67.9
|
)
|
|||||
|
Excluding the impact of changes in cash of assets held
for sale and the use of cash for M&A activities
|
3.4
|
5.6
|
6.8
|
13.2
|
14.6
|
|||||||||||||||
|
Excluding the use of cash for the settlement of foreign
exchange derivative instruments
|
(0.1
|
)
|
0.1
|
0.6
|
4.6
|
0.5
|
||||||||||||||
|
Excluding the use of cash for the legal settlement
related to the impaired cloud-based ERP
implementation fees
|
5.6
|
—
|
10.6
|
—
|
10.6
|
|||||||||||||||
|
Capital expenditures
|
(5.7
|
)
|
(4.9
|
)
|
(13.8
|
)
|
(11.1
|
)
|
(19.6
|
)
|
||||||||||
|
Capitalized software development
|
(6.6
|
)
|
(10.4
|
)
|
(24.0
|
)
|
(21.6
|
)
|
(33.5
|
)
|
||||||||||
|
Free cash flow (use) (Non-GAAP measure)
|
$
|
(179.6
|
)
|
$
|
(157.5
|
)
|
$
|
(502.6
|
)
|
$
|
(306.5
|
)
|
$
|
(95.3
|
)
|
|||||
|
Add back: cash interest
|
$
|
63.9
|
$
|
60.7
|
$
|
150.4
|
$
|
147.7
|
$
|
177.8
|
||||||||||
|
Unlevered free cash flow (use)
(Non-GAAP measure)
|
$
|
(115.7
|
)
|
$
|
(96.8
|
)
|
$
|
(352.2
|
)
|
$
|
(158.8
|
)
|
$
|
82.5
|
||||||
|
•
|
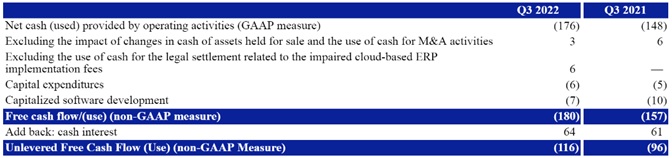
Free cash use of $179.6 million in the quarter was unfavorable by $22.1 million versus the prior year quarter reflecting reduced profitability and timing of disbursements, partially offset by improved collections.
|
1 - See note 1 below for GAAP to Non-GAAP adjustments to net sales, gross profit and operating expenses, which include selling and administrative expense,
research, development and engineering expense, gain/loss on sale of assets, net, and impairment of assets; note 2 for adjusted EBITDA; and note 3 for adjusted net income/loss and adjusted EPS.
2 - Represents Diluted earnings (loss) per share attributable to Diebold Nixdorf, Incorporated.
Page 5 of 15
Financial Results of Operations and Segments
|
GAAP Revenue Summary by Reportable Segment & Business Line - Unaudited
|
||||||||||||||||||||
|
Three months ended September 30, 2022 compared to three months ended September 30, 2021
|
||||||||||||||||||||
|
Three months ended
|
||||||||||||||||||||
|
September 30
|
||||||||||||||||||||
|
($ in millions)
|
2022
|
2021
|
2021 in CC3
|
% Change
|
% Change in CC
|
|||||||||||||||
|
Banking
|
||||||||||||||||||||
|
Services
|
$
|
379.9
|
$
|
414.6
|
$
|
392.3
|
(8.4
|
)%
|
(3.2
|
)%
|
||||||||||
|
Products
|
200.4
|
255.5
|
236.9
|
(21.6
|
)%
|
(15.4
|
)%
|
|||||||||||||
|
Total Banking Revenue
|
$
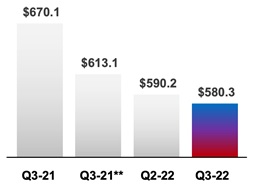
|
580.3
|
$
|
670.1
|
$
|
629.2
|
(13.4
|
)%
|
(7.8
|
)%
|
||||||||||
|
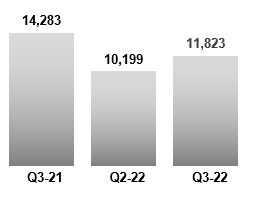
ATM Units Sold
|
11,823
|
14,283
|
(17.2
|
)%
|
||||||||||||||||
|
Retail
|
||||||||||||||||||||
|
Services
|
$
|
134.4
|
$
|
147.1
|
$
|
128.4
|
(8.6
|
)%
|
4.7
|
%
|
||||||||||
|
Products
|
95.7
|
141.0
|
124.3
|
(32.1
|
)%
|
(23.0
|
)%
|
|||||||||||||
|
Total Retail Revenue
|
$
|
230.1
|
$
|
288.1
|
$
|
252.7
|
(20.1
|
)%
|
(8.9
|
)%
|
||||||||||
|
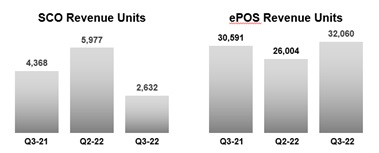
SCO Units Sold
|
2,632
|
4,368
|
(39.7
|
)%
|
||||||||||||||||
|
ePOS Units Sold
|
32,060
|
30,591
|
4.8
|
%
|
||||||||||||||||
|
Total by Business Line
|
||||||||||||||||||||
|
Services
|
$
|
514.3
|
$
|
561.7
|
$
|
520.7
|
(8.4
|
)%
|
(1.2
|
)%
|
||||||||||
|
Products
|
296.1
|
396.5
|
361.2
|
(25.3
|
)%
|
(18.0
|
)%
|
|||||||||||||
|
Total Revenue
|
$
|
810.4
|
$
|
958.2
|
$
|
881.9
|
(15.4
|
)%
|
(8.1
|
)%
|
||||||||||
|
Nine months ended September 30, 2022 compared to nine months ended September 30, 2021
|
||||||||||||||||||||
|
Nine months ended
|
||||||||||||||||||||
|
September 30
|
||||||||||||||||||||
|
($ in millions)
|
2022
|
2021
|
2021 in CC3
|
% Change
|
% Change in CC
|
|||||||||||||||
|
Banking
|
||||||||||||||||||||
|
Services
|
$
|
1,152.9
|
$
|
1,255.9
|
$
|
1,207.5
|
(8.2
|
)%
|
(4.5
|
)%
|
||||||||||
|
Products
|
580.4
|
692.2
|
652.9
|
(16.2
|
)%
|
(11.1
|
)%
|
|||||||||||||
|
Total Banking Revenue
|
$
|
1,733.3
|
$
|
1,948.1
|
$
|
1,860.4
|
(11.0
|
)%
|
(6.8
|
)%
|
||||||||||
|
ATM Units Sold
|
31,715
|
36,819
|
(13.9
|
)%
|
||||||||||||||||
|
Retail
|
||||||||||||||||||||
|
Services
|
$
|
413.0
|
$
|
466.1
|
$
|
422.2
|
(11.4
|
)%
|
(2.2
|
)%
|
||||||||||
|
Products
|
345.6
|
431.4
|
393.6
|
(19.9
|
)%
|
(12.2
|
)%
|
|||||||||||||
|
Total Retail Revenue
|
$
|
758.6
|
$
|
897.5
|
$
|
815.8
|
(15.5
|
)%
|
(7.0
|
)%
|
||||||||||
|
SCO Units Sold
|
15,272
|
15,288
|
(0.1
|
)%
|
||||||||||||||||
|
ePOS Units Sold
|
92,501
|
96,924
|
(4.6
|
)%
|
||||||||||||||||
|
Total by Business Line
|
||||||||||||||||||||
|
Services
|
$
|
1,565.9
|
$
|
1,722.0
|
$
|
1,629.7
|
(9.1
|
)%
|
(3.9
|
)%
|
||||||||||
|
Products
|
926.0
|
1,123.6
|
1,046.5
|
(17.6
|
)%
|
(11.5
|
)%
|
|||||||||||||
|
Total Revenue
|
$
|
2,491.9
|
$
|
2,845.6
|
$
|
2,676.2
|
(12.4
|
)%
|
(6.9
|
) %
|
||||||||||
|
3 - The company calculates constant currency by translating the prior-year period results at current year exchange rates.
|
||||||||||||||||||||
Page 6 of 15
|
GAAP and Non-GAAP Profit/Loss Summary - Unaudited
|
||||||||||||||||||||||||
|
Three months ended September 30, 2022 compared to three months ended September 30, 2021
|
||||||||||||||||||||||||
|
Three months ended
|
||||||||||||||||||||||||
|
September 30, 2022
|
September 30, 2021
|
Change
|
||||||||||||||||||||||
|
($ in millions)
|
GAAP
|
Non-GAAP4,5
|
GAAP
|
Non-GAAP4,5
|
GAAP
|
Non-GAAP
|
||||||||||||||||||
|
Services
|
$
|
514.3
|
$
|
510.3
|
$
|
561.7
|
$
|
561.7
|
$
|
(47.4
|
)
|
$
|
(51.4
|
)
|
||||||||||
|
Products
|
296.1
|
295.0
|
396.5
|
396.5
|
(100.4
|
)
|
(101.5
|
)
|
||||||||||||||||
|
Total net sales
|
$
|
810.4
|
$
|
805.3
|
$
|
958.2
|
$
|
958.2
|
$
|
(147.8
|
)
|
$
|
(152.9
|
)
|
||||||||||
|
Services
|
$
|
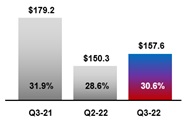
157.6
|
$
|
159.6
|
$
|
179.2
|
$
|
181.9
|
$
|
(21.6
|
)
|
$
|
(22.3
|
)
|
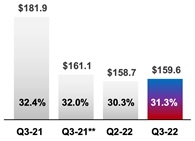
||||||||||
|
Products
|
36.2
|
39.7
|
80.9
|
81.0
|
(44.7
|
)
|
(41.3
|
)
|
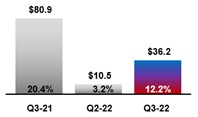
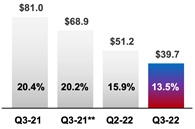
||||||||||||||||
|
Total gross profit
|
$
|
193.8
|
$
|
199.3
|
$
|
260.1
|
$
|
262.9
|
$
|
(66.3
|
)
|
$
|
(63.6
|
)
|
||||||||||
|
Services
|
30.6
|
%
|
31.3
|
%
|
31.9
|
%
|
32.4
|
%
|
(130)bps
|
(110)bps
|
||||||||||||||
|
Products
|
12.2
|
%
|
13.5
|
%
|
20.4
|
%
|
20.4
|
%
|
(820)bps
|
(690) bps
|
||||||||||||||
|
Total gross margin
|
23.9
|
%
|
24.7
|
%
|
27.1
|
%
|
27.4
|
%
|
(320)bps
|
(270) bps
|
||||||||||||||
|
Operating expenses
|
$
|
188.3
|
$
|
139.3
|
$
|
221.4
|
$
|
181.6
|
$
|
(33.1
|
)
|
$
|
(42.3
|
)
|
||||||||||
|
Operating profit (loss)
|
$
|
5.5
|
$
|
60.0
|
$
|
38.7
|
$
|
81.3
|
$
|
(33.2
|
)
|
$
|
(21.3
|
)
|
||||||||||
|
Operating margin
|
0.7
|
%
|
7.5
|
%
|
4.0
|
%
|
8.5
|
%
|
(330) bps
|
(100) bps
|
||||||||||||||
|
Nine months ended September 30, 2022 compared to nine months ended September 30, 2021
|
||||||||||||||||||||||||
|
Nine months ended
|
||||||||||||||||||||||||
|
September 30, 2022
|
September 30, 2021
|
Change
|
||||||||||||||||||||||
|
($ in millions)
|
GAAP
|
Non-GAAP4,5
|
GAAP
|
Non-GAAP4,5
|
GAAP
|
Non-GAAP
|
||||||||||||||||||
|
Services
|
$
|
1,565.9
|
$
|
1,558.5
|
$
|
1,722.0
|
$
|
1,722.0
|
$
|
(156.1
|
)
|
$
|
(163.5
|
)
|
||||||||||
|
Products
|
926.0
|
917.2
|
1,123.6
|
1,123.6
|
(197.6
|
)
|
(206.4
|
)
|
||||||||||||||||
|
Total net sales
|
$
|
2,491.9
|
$
|
2,475.7
|
$
|
2,845.6
|
$
|
2,845.6
|
$
|
(353.7
|
)
|
$
|
(369.9
|
)
|
||||||||||
|
Services
|
$
|
459.9
|
$
|
471.8
|
$
|
540.0
|
$
|
550.6
|
$
|
(80.1
|
)
|
$
|
(78.8
|
)
|
||||||||||
|
Products
|
80.0
|
123.6
|
245.2
|
247.4
|
(165.2
|
)
|
(123.8
|
)
|
||||||||||||||||
|
Total gross profit
|
$
|
539.9
|
$
|
595.4
|
$
|
785.2
|
$
|
798.0
|
$
|
(245.3
|
)
|
$
|
(202.6
|
)
|
||||||||||
|
Services
|
29.4
|
%
|
30.3
|
%
|
31.4
|
%
|
32.0
|
%
|
(200) bps
|
(170) bps
|
||||||||||||||
|
Products
|
8.6
|
%
|
13.5
|
%
|
21.8
|
%
|
22.0
|
%
|
|
(1,320) bps
|
|
(850) bps
|
||||||||||||
|
Total gross margin
|
21.7
|
%
|
24.0
|
%
|
27.6
|
%
|
28.0
|
%
|
(590) bps
|
(400) bps
|
||||||||||||||
|
Operating expenses
|
$
|
709.3
|
$
|
484.0
|
$
|
697.4
|
$
|
574.7
|
$
|
11.9
|
$
|
(90.7
|
)
|
|||||||||||
|
Operating profit (loss)
|
$
|
(169.4
|
$
|
111.4
|
$
|
87.8
|
$
|
223.3
|
$
|
(257.2
|
)
|
$
|
(111.9
|
)
|
||||||||||
|
Operating margin
|
(6.8
|
4.5
|
%
|
3.1
|
%
|
7.8
|
%
|
(990) bps
|
(330) bps
|
|||||||||||||||
|
4 - See note 1 below for GAAP to Non-GAAP adjustments to net sales, gross profit and operating expenses, which include selling and administrative
expense, research, development and engineering expense, gain/loss on sales of assets, net, and impairment of assets.
|
|
|
5 - Consistent with the presentation in the second quarter of 2022, excludes the results of the non-core European retail business that is held for sale,
which represents a change to the initially published first quarter information. 2021 has not been revised. Refer to note 1 below for further information.
|
Page 7 of 15
|
Profit/Loss Summary by Segment - Unaudited6
|
||||||||||||||||
|
Three months ended September 30, 2022 compared to three months ended September 30, 2021
|
||||||||||||||||
| Three months ended |
||||||||||||||||
|
September 30, 2022
|
September 30, 2021
|
|||||||||||||||
|
Banking
|
Retail5
|
Banking
|
Retail5
|
|||||||||||||
|
($ in millions)
|
||||||||||||||||
|
Services
|
$
|
379.9
|
$
|
130.4
|
$
|
414.6
|
$
|
147.1
|
||||||||
|
Products
|
200.4
|
94.6
|
255.5
|
141.0
|
||||||||||||
|
Total net sales
|
$
|
580.3
|
$
|
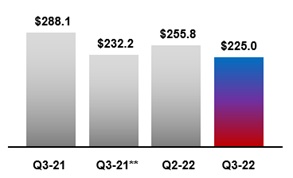
225.0
|
$
|
670.1
|
$
|
288.1
|
||||||||
|
Services
|
$
|
117.8
|
$
|
41.8
|
$
|
135.7
|
$
|
46.2
|
||||||||
|
Products
|
25.7
|
14.0
|
48.1
|
32.9
|
||||||||||||
|
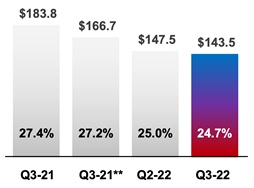
Total gross profit
|
$
|
143.5
|
$
|
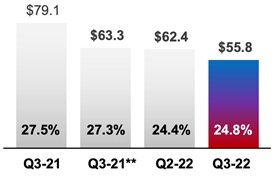
55.8
|
$
|
183.8
|
$
|
79.1
|
||||||||
|
Services
|
31.0
|
%
|
32.1
|
%
|
32.7
|
%
|
31.4
|
%
|
||||||||
|
Products
|
12.8
|
%
|
14.8
|
%
|
18.8
|
%
|
23.3
|
%
|
||||||||
|
Total gross margin
|
24.7
|
%
|
24.8
|
%
|
27.4
|
%
|
27.5
|
%
|
||||||||
|
Segment operating expenses
|
$
|
60.4
|
$
|
24.7
|
$
|
74.2
|
$
|
35.5
|
||||||||
|
Operating profit
|
$
|
83.1
|
$
|
31.1
|
$
|
109.6
|
$
|
43.6
|
||||||||
|
Operating margin
|
14.3
|
%
|
13.8
|
%
|
16.4
|
%
|
15.1
|
%
|
||||||||
|
Segment operating profit
|
$
|
114.2
|
$
|
153.2
|
||||||||||||
|
Corporate charges7
|
54.2
|
71.9
|
||||||||||||||
|
Consolidated operating profit
|
$
|
60.0
|
$
|
81.3
|
||||||||||||
|
Nine months ended September 30, 2022 compared to nine months ended September 30, 2021
|
||||||||||||||||
| Nine months ended |
||||||||||||||||
|
September 30, 2022
|
September 30, 2021
|
|||||||||||||||
|
Banking
|
Retail5
|
Banking
|
Retail5
|
|||||||||||||
|
($ in millions)
|
||||||||||||||||
|
Services
|
$
|
1,152.9
|
$
|
405.6
|
$
|
1,255.9
|
$
|
466.1
|
||||||||
|
Products
|
580.4
|
336.8
|
692.2
|
431.4
|
||||||||||||
|
Total net sales
|
$
|
1,733.3
|
$
|
742.4
|
$
|
1,948.1
|
$
|
897.5
|
||||||||
|
Services
|
$
|
348.1
|
$
|
123.7
|
$
|
404.6
|
$
|
146.0
|
||||||||
|
Products
|
68.8
|
54.8
|
155.7
|
91.7
|
||||||||||||
|
Total gross profit
|
$
|
416.9
|
$
|
178.5
|
$
|
560.3
|
$
|
237.7
|
||||||||
|
Services
|
30.2
|
%
|
30.5
|
%
|
32.2
|
%
|
31.3
|
%
|
||||||||
|
Products
|
11.9
|
%
|
16.3
|
%
|
22.5
|
%
|
21.3
|
%
|
||||||||
|
Total gross margin
|
24.1
|
%
|
24.0
|
%
|
28.8
|
%
|
26.5
|
%
|
||||||||
|
Segment operating expenses
|
$
|
207.5
|
$
|
88.5
|
$
|
240.0
|
$
|
112.8
|
||||||||
|
Operating profit
|
$
|
209.4
|
$
|
90.0
|
$
|
320.3
|
$
|
124.9
|
||||||||
|
Operating margin
|
12.1
|
%
|
12.1
|
%
|
16.4
|
%
|
13.9
|
%
|
||||||||
|
Segment operating profit
|
$
|
299.4
|
$
|
445.2
|
||||||||||||
|
Corporate charges7
|
188.0
|
221.9
|
||||||||||||||
|
Consolidated operating profit
|
$
|
111.4
|
$
|
223.3
|
||||||||||||
|
6 - The Non-GAAP adjustments shown in Note 1 below are not assigned to a segment, as these adjustments relate to items that are considered non-routine in
nature and thus do not impact the way in which the business is managed or performance is assessed.
|
||||||||||||||||
|
7 - Corporate charges are not reflected in the segment operating results, as these expenses are managed separately and not included in the segment
results used to manage the business and assess performance. The unassigned corporate charges consist primarily of finance, IT, HR and legal expenditures.
|
||||||||||||||||
Page 8 of 15
DIEBOLD NIXDORF, INCORPORATED AND SUBSIDIARIES
CONDENSED CONSOLIDATED STATEMENTS OF OPERATIONS - UNAUDITED
(IN MILLIONS, EXCEPT EARNINGS PER SHARE)
|
|
Q3 2022
|
Q3 2021
|
YTD
9/30/2022
|
YTD
9/30/2021
|
||||||||||||
|
Net sales
|
||||||||||||||||
|
Services
|
$
|
514.3
|
$
|
561.7
|
$
|
1,565.9
|
$
|
1,722.0
|
||||||||
|
Products
|
296.1
|
396.5
|
926.0
|
1,123.6
|
||||||||||||
|
Total
|
810.4
|
958.2
|
2,491.9
|
2,845.6
|
||||||||||||
|
Cost of sales
|
||||||||||||||||
|
Services
|
356.7
|
382.5
|
1,106.0
|
1,182.0
|
||||||||||||
|
Products
|
259.9
|
315.6
|
846.0
|
878.4
|
||||||||||||
|
Total
|
616.6
|
698.1
|
1,952.0
|
2,060.4
|
||||||||||||
|
Gross profit
|
193.8
|
260.1
|
539.9
|
785.2
|
||||||||||||
|
Gross margin
|
23.9
|
%
|
27.1
|
%
|
21.7
|
%
|
27.6
|
%
|
||||||||
|
Operating expenses
|
||||||||||||||||
|
Selling and administrative expense
|
163.1
|
195.5
|
557.9
|
603.7
|
||||||||||||
|
Research, development and engineering expense
|
26.7
|
25.6
|
92.1
|
95.3
|
||||||||||||
|
(Gain) loss on sale of assets, net
|
(5.6
|
)
|
—
|
(5.4
|
)
|
(1.9
|
)
|
|||||||||
|
Impairment of assets
|
4.1
|
0.3
|
64.7
|
0.3
|
||||||||||||
|
Total
|
188.3
|
221.4
|
709.3
|
697.4
|
||||||||||||
|
Percent of net sales
|
23.2
|
%
|
23.1
|
%
|
28.5
|
%
|
24.5
|
%
|
||||||||
|
Operating profit (loss)
|
5.5
|
38.7
|
(169.4
|
)
|
87.8
|
|||||||||||
|
Operating margin
|
0.7
|
%
|
4.0
|
%
|
(6.8
|
%)
|
3.1
|
%
|
||||||||
|
Other income (expense)
|
||||||||||||||||
|
Interest income
|
3.6
|
1.0
|
5.9
|
5.0
|
||||||||||||
|
Interest expense
|
(50.7
|
)
|
(51.3
|
)
|
(148.4
|
)
|
(149.7
|
)
|
||||||||
|
Foreign exchange gain (loss), net
|
5.3
|
4.4
|
2.9
|
0.9
|
||||||||||||
|
Miscellaneous, net
|
(9.7
|
)
|
4.6
|
(2.5
|
)
|
6.6
|
||||||||||
|
Total other (expense)
|
(51.5
|
)
|
(41.3
|
)
|
(142.1
|
)
|
(137.2
|
)
|
||||||||
|
Loss before taxes
|
(46.0
|
)
|
(2.6
|
)
|
(311.5
|
)
|
(49.4
|
)
|
||||||||
|
Income tax expense (benefit)
|
3.9
|
(1.1
|
)
|
119.0
|
(11.1
|
)
|
||||||||||
|
Equity in loss of unconsolidated subsidiaries
|
(0.6
|
)
|
(0.5
|
)
|
(3.0
|
)
|
(2.1
|
)
|
||||||||
|
Net loss
|
(50.5
|
)
|
(2.0
|
)
|
(433.5
|
)
|
(40.4
|
)
|
||||||||
|
Net income (loss) attributable to noncontrolling interests
|
(0.7
|
)
|
0.1
|
(1.4
|
)
|
0.1
|
||||||||||
|
Net loss attributable to Diebold Nixdorf, Incorporated
|
$
|
(49.8
|
)
|
$
|
(2.1
|
)
|
$
|
(432.1
|
)
|
$
|
(40.5
|
)
|
||||
|
|
||||||||||||||||
|
Basic and diluted weighted-average shares outstanding
|
79.1
|
78.3
|
78.9
|
78.2
|
||||||||||||
|
Basic and diluted loss per share attributable to Diebold Nixdorf, Incorporated
|
$
|
(0.63
|
)
|
$
|
(0.03
|
)
|
$
|
(5.48
|
)
|
$
|
(0.52
|
)
|
||||
Page 9 of 15
DIEBOLD NIXDORF, INCORPORATED AND SUBSIDIARIES
CONDENSED CONSOLIDATED BALANCE SHEETS - UNAUDITED
(IN MILLIONS)
|
|
9/30/2022
|
12/31/2021
|
||||||
|
ASSETS
|
||||||||
|
Current assets
|
||||||||
|
Cash, cash equivalents, and restricted cash
|
$
|
128.4
|
$
|
388.9
|
||||
|
Short-term investments
|
14.6
|
34.3
|
||||||
|
Trade receivables, less allowances for doubtful accounts
|
537.6
|
595.2
|
||||||
|
Inventories
|
666.2
|
544.2
|
||||||
|
Other current assets
|
330.5
|
324.7
|
||||||
|
Total current assets
|
1,677.3
|
1,887.3
|
||||||
|
Securities and other investments
|
7.2
|
11.0
|
||||||
|
Property, plant and equipment, net
|
112.3
|
138.1
|
||||||
|
Goodwill
|
649.6
|
743.6
|
||||||
|
Customer relationships, net
|
211.3
|
301.7
|
||||||
|
Other assets
|
249.7
|
425.5
|
||||||
|
Total assets
|
$
|
2,907.4
|
$
|
3,507.2
|
||||
|
|
||||||||
|
LIABILITIES AND EQUITY
|
||||||||
|
Current liabilities
|
||||||||
|
Notes payable8
|
$
|
2,435.6
|
$
|
47.1
|
||||
|
Accounts payable
|
623.8
|
706.3
|
||||||
|
Deferred revenue
|
316.1
|
322.4
|
||||||
|
Other current liabilities
|
525.4
|
673.6
|
||||||
|
Total current liabilities
|
3,900.9
|
1,749.4
|
||||||
|
|
||||||||
|
Long-term debt
|
— |
2,245.6
|
||||||
|
Long-term liabilities
|
324.2
|
349.2
|
||||||
|
|
||||||||
|
Total Diebold Nixdorf, Incorporated shareholders' equity
|
(1,329.4
|
)
|
(845.1
|
)
|
||||
|
Noncontrolling interests
|
11.7
|
8.1
|
||||||
|
Total equity
|
(1,317.7
|
)
|
(837.0
|
)
|
||||
|
Total liabilities and equity
|
$
|
2,907.4
|
$
|
3,507.2
|
||||
|
8-$2,117.1 of Term Loan B and Senior Notes debt, with maturity dates subsequent to September 30, 2023, has been classified as current because it could
be called if the Company is unable to consummate the Transactions contemplated by the Transaction Support Agreement prior to December 31, 2022 or future reporting periods, and is also unable to obtain a waiver extension with respect to the
breached net leverage ratio covenant. While the Company expects the transactions contemplated by the Transaction Support Agreement will be consummated, there can be no assurance that such conditions will be satisfied.
|
||||||||||||||||
Page 10 of 15
DIEBOLD NIXDORF, INCORPORATED AND SUBSIDIARIES
CONDENSED CONSOLIDATED STATEMENTS OF CASH FLOWS - UNAUDITED
(IN MILLIONS)
|
|
YTD 9/30/2022
|
YTD 9/30/2021
|
||||||
|
Cash flow from operating activities
|
||||||||
|
Net loss
|
$
|
(433.5
|
)
|
$
|
(40.4
|
)
|
||
|
Adjustments to reconcile net loss to cash flow used by operating activities:
|
||||||||
|
Depreciation and amortization
|
42.3
|
55.2
|
||||||
|
Amortization of Wincor Nixdorf purchase accounting intangible assets
|
52.8
|
59.3
|
||||||
|
Amortization of deferred financing costs into interest expense
|
12.0
|
13.0
|
||||||
|
Share-based compensation
|
9.6
|
12.7
|
||||||
|
(Gain) loss on sale of assets, net
|
(5.4
|
)
|
(1.9
|
)
|
||||
|
Deferred income taxes
|
112.8
|
(21.6
|
)
|
|||||
|
Net pension settlements
|
(14.3
|
)
|
—
|
|||||
|
Impairment of assets
|
64.7
|
0.3
|
||||||
|
Other
|
2.7
|
—
|
||||||
|
Changes in certain assets and liabilities
|
||||||||
|
Trade receivables
|
(2.5
|
)
|
(50.9
|
)
|
||||
|
Inventories
|
(186.5
|
)
|
(150.3
|
)
|
||||
|
Accounts payable
|
(18.9
|
)
|
95.6
|
|||||
|
Income taxes
|
(34.7
|
)
|
(25.5
|
)
|
||||
|
Deferred revenue
|
14.5
|
(87.2
|
)
|
|||||
|
Warranty liability
|
(5.2
|
)
|
(1.4
|
)
|
||||
|
Sales tax and net value added tax
|
(24.9
|
)
|
(35.7
|
)
|
||||
|
Accrued salaries, wages and commissions
|
(59.1
|
)
|
1.5
|
|||||
|
Restructuring accrual
|
21.2
|
(22.4
|
)
|
|||||
|
Pension and post retirement benefits
|
15.2
|
(5.8
|
)
|
|||||
|
Certain other assets and liabilities
|
(45.6
|
)
|
(86.1
|
)
|
||||
|
Net cash used by operating activities
|
(482.8
|
)
|
(291.6
|
)
|
||||
|
Cash flow from investing activities
|
||||||||
|
Capital expenditures
|
(13.8
|
)
|
(11.1
|
)
|
||||
|
Capitalized software development
|
(24.0
|
)
|
(21.6
|
)
|
||||
|
Proceeds from divestitures, net of cash divested
|
10.5
|
5.8
|
||||||
|
Net short-term investment activity
|
23.0
|
20.6
|
||||||
|
Proceeds from sale of assets
|
3.5
|
1.7
|
||||||
|
Net cash provided (used) by investing activities
|
(0.8
|
)
|
(4.6
|
)
|
||||
|
Cash flow from financing activities
|
||||||||
|
Revolving credit facility borrowings, net
|
240.0
|
187.9
|
||||||
|
Other debt borrowings
|
12.4
|
9.9
|
||||||
|
Other debt repayments
|
(12.3
|
)
|
(13.6
|
)
|
||||
|
Contributions from noncontrolling interest holders
|
—
|
12.7
|
||||||
|
Other
|
(6.6
|
)
|
(7.1
|
)
|
||||
|
Net cash provided by financing activities
|
233.5
|
189.8
|
||||||
|
Effect of exchange rate changes on cash, cash equivalents and restricted cash
|
(12.5
|
)
|
(4.3
|
)
|
||||
|
Change in cash, cash equivalents and restricted cash
|
(262.6
|
)
|
(110.7
|
)
|
||||
|
Add: Cash included in assets held for sale at beginning of period
|
3.1
|
2.7
|
||||||
|
Less: Cash included in assets held for sale at end of period
|
1.0
|
0.6
|
||||||
|
Cash, cash equivalents and restricted cash at the beginning of the period
|
388.9
|
324.5
|
||||||
|
Cash, cash equivalents and restricted cash at the end of the period
|
$
|
128.4
|
$
|
215.9
|
||||
Page 11 of 15
Notes for Non-GAAP Measures
To supplement our condensed consolidated financial statements presented in accordance with GAAP, the company utilizes certain financial measures that are not prepared in
accordance with GAAP, including Non-GAAP results, EBITDA and Adjusted EBITDA, adjusted earnings per share, free cash flow (use) and net debt.
|
1.
|
Profit and loss summary ($ in millions):
|
Three months ended September 30, 2022 compared to three months ended September 30, 2021
| Q3 2022 | Q3 2021 |
|||||||||||||||||||||||||||||||||||||||||||||||
|
Net
Sales
|
Gross
Profit
|
% of
Sales
|
OPEX
|
OP
|
% of
Sales
|
Net
Sales
|
Gross
Profit
|
% of
Sales
|
OPEX
|
OP
|
% of
Sales
|
|||||||||||||||||||||||||||||||||||||
|
GAAP results
|
$
|
810.4
|
$
|
193.8
|
23.9
|
%
|
$
|
188.3
|
$
|
5.5
|
0.7
|
%
|
$
|
958.2
|
$
|
260.1
|
27.1
|
%
|
$
|
221.4
|
$
|
38.7
|
4.0
|
%
|
||||||||||||||||||||||||
|
Restructuring and transition -
personnel
|
—
|
4.3
|
(12.2
|
)
|
16.5
|
—
|
0.5
|
(4.8
|
)
|
5.3
|
||||||||||||||||||||||||||||||||||||||
|
Transformation - other
|
—
|
—
|
(4.2
|
)
|
4.2
|
—
|
2.5
|
(13.1
|
)
|
15.6
|
||||||||||||||||||||||||||||||||||||||
|
Refinancing related costs
|
—
|
—
|
(13.4
|
)
|
13.4
|
—
|
—
|
—
|
—
|
|||||||||||||||||||||||||||||||||||||||
|
Held for sale non-core
European retail business
|
(5.1
|
)
|
1.2
|
(3.8
|
)
|
5.0
|
—
|
—
|
—
|
—
|
||||||||||||||||||||||||||||||||||||||
|
Amortization of Wincor Nixdorf
purchase accounting
intangible assets (non-cash)
|
—
|
—
|
(16.6
|
)
|
16.6
|
—
|
—
|
(19.5
|
)
|
19.5
|
||||||||||||||||||||||||||||||||||||||
|
Non-routine income/expense:
|
||||||||||||||||||||||||||||||||||||||||||||||||
|
Divestitures and asset sales
|
—
|
—
|
5.5
|
(5.5
|
)
|
—
|
—
|
—
|
||||||||||||||||||||||||||||||||||||||||
|
Crisis in Ukraine costs
|
—
|
—
|
(0.7
|
)
|
0.7
|
—
|
—
|
—
|
—
|
|||||||||||||||||||||||||||||||||||||||
|
Loss making contracts
related to discontinued
offering
|
—
|
—
|
—
|
—
|
—
|
2.3
|
(0.3
|
)
|
2.6
|
|||||||||||||||||||||||||||||||||||||||
|
Legal/deal expense
|
—
|
—
|
0.5
|
(0.5
|
)
|
—
|
—
|
(1.5
|
)
|
1.5
|
||||||||||||||||||||||||||||||||||||||
|
Other
|
—
|
—
|
—
|
—
|
—
|
(2.5
|
)
|
(0.6
|
)
|
(1.9
|
)
|
|||||||||||||||||||||||||||||||||||||
|
Other impairment
|
—
|
—
|
(4.1
|
)
|
4.1
|
—
|
—
|
—
|
—
|
|||||||||||||||||||||||||||||||||||||||
|
Non-routine (income)
expenses, net
|
—
|
—
|
1.2
|
(1.2
|
)
|
—
|
(0.2
|
)
|
(2.4
|
)
|
2.2
|
|||||||||||||||||||||||||||||||||||||
|
Non-GAAP results
|
$
|
805.3
|
$
|
199.3
|
24.7
|
%
|
$
|
139.3
|
$
|
60.0
|
7.5
|
%
|
$
|
958.2
|
$
|
262.9
|
27.4
|
%
|
$
|
181.6
|
$
|
81.3
|
8.5
|
%
|
||||||||||||||||||||||||
| Q3
2022 |
Q3 2021 | ||||||||||||||||||||||
|
Services
|
Products
|
Total
|
Services
|
Products
|
Total
|
||||||||||||||||||
|
GAAP Gross profit
|
$
|
157.6
|
$
|
36.2
|
$
|
193.8
|
$
|
179.2
|
$
|
80.9
|
$
|
260.1
|
|||||||||||
|
Restructuring and transition - personnel
|
3.0
|
1.3
|
4.3
|
—
|
0.5
|
0.5
|
|||||||||||||||||
|
Transformation - other
|
—
|
—
|
—
|
2.5
|
—
|
2.5
|
|||||||||||||||||
|
Held for sale non-core European retail business
|
(1.0
|
)
|
2.2
|
1.2
|
—
|
—
|
—
|
||||||||||||||||
|
Non-routine income/expense:
|
|||||||||||||||||||||||
|
Loss making contract related to discontinued offering
|
—
|
—
|
—
|
2.3
|
—
|
2.3
|
|||||||||||||||||
|
Other
|
—
|
—
|
—
|
(2.1
|
)
|
(0.4
|
)
|
(2.5
|
)
|
||||||||||||||
|
Non-routine (income) expenses, net
|
—
|
—
|
—
|
0.2
|
(0.4
|
)
|
(0.2
|
)
|
|||||||||||||||
|
Non-GAAP Gross profit
|
$
|
159.6
|
$
|
39.7
|
$
|
199.3
|
$
|
181.9
|
$
|
81.0
|
$
|
262.9
|
|||||||||||
Page 12 of 15
Nine months ended September 30, 2022 compared to nine months ended September 30, 2021
|
YTD 9/30/2022
|
YTD 9/30/2021
|
|||||||||||||||||||||||||||||||||||||||||||||||
|
Net
Sales
|
Gross
Profit
|
% of
Sales |
OPEX
|
OP
|
% of
Sales
|
Net
Sales
|
Gross
Profit
|
% of
Sales
|
OPEX
|
OP
|
% of
Sales
|
|||||||||||||||||||||||||||||||||||||
|
GAAP results
|
$
|
2,491.9
|
$
|
539.9
|
21.7
|
%
|
$
|
709.3
|
$
|
(169.4
|
)
|
(6.8
|
)%
|
$
|
2,845.6
|
$
|
785.2
|
27.6
|
%
|
$
|
697.4
|
$
|
87.8
|
3.1
|
%
|
|||||||||||||||||||||||
|
Restructuring and transition -
personnel
|
—
|
17.4
|
(66.5
|
)
|
83.9
|
—
|
12.1
|
(16.3
|
)
|
28.4
|
||||||||||||||||||||||||||||||||||||||
|
Transformation - other
|
—
|
—
|
(15.0
|
)
|
15.0
|
—
|
2.5
|
(43.5
|
)
|
46.0
|
||||||||||||||||||||||||||||||||||||||
|
Refinancing related costs
|
—
|
—
|
(13.4
|
)
|
13.4
|
—
|
—
|
—
|
—
|
|||||||||||||||||||||||||||||||||||||||
|
Held for sale non-core
European retail business
|
(16.2
|
)
|
2.6
|
(14.1
|
)
|
16.7
|
—
|
—
|
—
|
—
|
||||||||||||||||||||||||||||||||||||||
|
Amortization of Wincor Nixdorf
purchase accounting
intangible assets (non-cash)
|
—
|
—
|
(52.8
|
)
|
52.8
|
—
|
—
|
(59.3
|
)
|
59.3
|
||||||||||||||||||||||||||||||||||||||
|
Non-routine income/expense:
|
||||||||||||||||||||||||||||||||||||||||||||||||
|
Divestitures and asset sales
|
—
|
—
|
5.5
|
(5.5
|
)
|
—
|
—
|
1.9
|
(1.9
|
)
|
||||||||||||||||||||||||||||||||||||||
|
Crisis in Ukraine Costs
|
—
|
—
|
(3.2
|
)
|
3.2
|
—
|
—
|
—
|
—
|
|||||||||||||||||||||||||||||||||||||||
|
Loss making contracts
related to discontinued
offering
|
—
|
—
|
—
|
—
|
—
|
2.3
|
(0.3
|
)
|
2.6
|
|||||||||||||||||||||||||||||||||||||||
|
Legal/deal expense
|
—
|
—
|
(1.4
|
)
|
1.4
|
—
|
—
|
(3.8
|
)
|
3.8
|
||||||||||||||||||||||||||||||||||||||
|
Other
|
—
|
1.1
|
0.3
|
0.8
|
—
|
(4.1
|
)
|
(1.4
|
)
|
(2.7
|
)
|
|||||||||||||||||||||||||||||||||||||
|
North America ERP
impairment
|
—
|
—
|
(38.4
|
)
|
38.4
|
—
|
—
|
—
|
—
|
|||||||||||||||||||||||||||||||||||||||
|
Inventory charge for legacy
products
|
—
|
34.4
|
—
|
34.4
|
—
|
—
|
—
|
—
|
||||||||||||||||||||||||||||||||||||||||
|
Russia/Ukraine Impairment
|
—
|
—
|
(16.8
|
)
|
16.8
|
—
|
—
|
—
|
—
|
|||||||||||||||||||||||||||||||||||||||
|
Other Impairment
|
—
|
—
|
(9.5
|
)
|
9.5
|
—
|
—
|
—
|
—
|
|||||||||||||||||||||||||||||||||||||||
|
Non-routine (income)
expenses, net
|
—
|
35.5
|
(63.5
|
)
|
99.0
|
—
|
(1.8
|
)
|
(3.6
|
)
|
1.8
|
|||||||||||||||||||||||||||||||||||||
|
Non-GAAP results
|
$
|
2,475.7
|
$
|
595.4
|
24.0
|
%
|
$
|
484.0
|
$
|
111.4
|
4.5
|
%
|
$
|
2,845.6
|
$
|
798.0
|
28.0
|
%
|
$
|
574.7
|
$
|
223.3
|
7.8
|
%
|
||||||||||||||||||||||||
|
YTD 9/30/2022
|
YTD 9/30/2021
|
|||||||||||||||||||||||
|
Services
|
Products
|
Total
|
Services
|
Products
|
Total
|
|||||||||||||||||||
|
GAAP Gross Profit
|
$
|
459.9
|
$
|
80.0
|
$
|
539.9
|
$
|
540.0
|
$
|
245.2
|
$
|
785.2
|
||||||||||||
|
Restructuring - personnel
|
7.4
|
10.0
|
17.4
|
10.2
|
1.9
|
12.1
|
||||||||||||||||||
|
Restructuring and transformation - other
|
—
|
—
|
—
|
2.5
|
—
|
2.5
|
||||||||||||||||||
|
Held for sale non-core European retail business
|
3.4
|
(0.8
|
)
|
2.6
|
—
|
—
|
—
|
|||||||||||||||||
|
Non-routine income/expense:
|
||||||||||||||||||||||||
|
Loss making contract related to discontinued offering
|
—
|
—
|
—
|
2.3
|
—
|
2.3
|
||||||||||||||||||
|
Other
|
1.1
|
—
|
1.1
|
(4.4
|
)
|
0.3
|
(4.1
|
)
|
||||||||||||||||
|
Inventory charge for legacy products
|
—
|
34.4
|
34.4
|
—
|
—
|
—
|
||||||||||||||||||
|
Non-routine expenses, net
|
1.1
|
34.4
|
35.5
|
(2.1
|
)
|
0.3
|
(1.8
|
)
|
||||||||||||||||
|
Non-GAAP Gross Profit
|
$
|
471.8
|
$
|
123.6
|
$
|
595.4
|
$
|
550.6
|
$
|
247.4
|
$
|
798.0
|
||||||||||||
Restructuring - personnel incurred in 2022 relates to the cost savings initiative focused on operational simplification and automation of processes, and the expenses include
severance and payroll expense of employees transitioning out of the organization. Costs of third-parties assisting with the execution of the program are categorized as Transformation - other. Restructuring and transformation expenses incurred in 2021
are consistent in nature with 2022, but relate to the DN Now initiative focused on transitioning to a shared service model which culminated in the fourth quarter of 2021. Refinancing related costs are initial fees paid to advisors that do not qualify
for capitalization. Held for sale non-core European retail business relates to the 2022 results of a majority-owned business that the company is committed to deconsolidate, that beginning in 2022 is excluded from the metrics used to evaluate the core
business and assign resources, and which will be autonomous following completion of a data center project which commenced in 2022. The 2021 results of the non-core European retail business have not been adjusted. The Wincor Nixdorf intangible asset
amortization relates to the intangible assets established in purchase accounting as management believes that this is useful information. The inventory charge for legacy products relates to excess and obsolete inventory as a result of a decision to
streamline the company's product portfolio. Divestitures and asset sales relates primarily to a building sale and IT asset sale in the third quarter of 2022, and the divestitures of non-core businesses in 2021. Crisis in Ukraine costs primarily
relate to humanitarian efforts for our employees and their families, as well as expenses incurred in connection with the economic sanctions levied and steps taken to-date to liquidate our Russian distribution subsidiary. Legal and deal expense
primarily relates to third-party expenses and fees paid by the company for M&A activity. North America ERP impairment is the decision made by new leadership to indefinitely suspend the North America ERP implementation and strategically shift the
digital transformation initiatives to the Company's distribution subsidiaries which have a much greater opportunity for process standardization and related cost reductions. Russia/Ukraine impairment relates to the charges taken for trade receivables
from customers in the region that are doubtful of being collected, inventory specifically for customers in the region and other assets which are not recoverable. Other impairment is the write-down of right-of-use assets and related leasehold
improvements for facilities identified for closure and impairment of discontinued internally developed software.
Page 13 of 15
|
2.
|
Reconciliation of GAAP net loss to EBITDA and Adjusted EBITDA (Non-GAAP measures) ($ in millions):
|
|
Q3 2022
|
Q3 2021
|
YTD
9/30/2022
|
YTD
9/30/2021
|
TTM
9/30/2022
|
||||||||||||||||
|
Net loss
|
$
|
(50.5
|
)
|
$
|
(2.0
|
)
|
$
|
(433.5
|
)
|
$
|
(40.4
|
)
|
$
|
(471.2
|
)
|
|||||
|
Income tax expense (benefit)
|
3.9
|
(1.1
|
)
|
119.0
|
(11.1
|
)
|
157.8
|
|||||||||||||
|
Interest income
|
(3.6
|
)
|
(1.0
|
)
|
(5.9
|
)
|
(5.0
|
)
|
(7.0
|
)
|
||||||||||
|
Interest expense
|
50.7
|
51.3
|
148.4
|
149.7
|
194.0
|
|||||||||||||||
|
Depreciation and amortization
|
29.9
|
36.2
|
95.1
|
114.5
|
129.7
|
|||||||||||||||
|
EBITDA
|
30.4
|
83.4
|
(76.9
|
)
|
207.7
|
3.3
|
||||||||||||||
|
Share-based compensation
|
2.7
|
4.7
|
9.6
|
12.7
|
10.7
|
|||||||||||||||
|
Amortization of cloud-based software implementation costs
|
0.6
|
—
|
1.6
|
—
|
1.6
|
|||||||||||||||
|
Foreign exchange (gain) loss, net
|
(5.3
|
)
|
(4.4
|
)
|
(2.9
|
)
|
(0.9
|
)
|
—
|
|||||||||||
|
Miscellaneous (gain) loss, net
|
9.7
|
(4.6
|
)
|
2.5
|
(6.6
|
)
|
5.7
|
|||||||||||||
|
Equity in loss of unconsolidated subsidiaries
|
0.6
|
0.5
|
3.0
|
2.1
|
0.6
|
|||||||||||||||
|
Restructuring and transformation expenses
|
20.7
|
20.9
|
98.1
|
72.5
|
122.6
|
|||||||||||||||
|
Refinancing related costs
|
13.4
|
—
|
13.4
|
—
|
13.4
|
|||||||||||||||
|
Non-routine (income) expense, net
|
(1.2
|
)
|
2.2
|
99.0
|
1.8
|
115.7
|
||||||||||||||
|
Held for sale non-core European retail business
|
4.0
|
—
|
14.0
|
—
|
14.0
|
|||||||||||||||
|
Adjusted EBITDA
|
$
|
75.6
|
$
|
102.7
|
$
|
161.4
|
$
|
289.3
|
$
|
287.6
|
||||||||||
|
Adjusted EBITDA % revenue
|
9.4
|
%
|
10.7
|
%
|
6.5
|
%
|
10.2
|
%
|
8.1
|
%
|
||||||||||
The company defines EBITDA as net loss excluding income tax benefit/expense, net interest expense, and depreciation and amortization expense. Consistent with the company's current
credit agreement, Adjusted EBITDA is EBITDA excluding the effects of the following items: share-based compensation, amortization of cloud-based software implementation costs, foreign exchange gain/loss net, miscellaneous net, equity in earnings of
unconsolidated subsidiaries, restructuring and transformation expenses, refinancing related costs, non-routine expenses and the adjusted EBITDA loss of our held for sale non-core European retail business, as outlined in Note 1 of the Non-GAAP
measures. To remain comparable to the U.S. GAAP depreciation and amortization measures, the company excluded the amortization of Wincor Nixdorf purchase accounting intangible assets from non-routine expenses, net in the Adjusted EBITDA reconciliation
of $16.6 and $19.5 for the three months ended September 30, 2022 and 2021 and $52.8 and $59.3 for the nine months ended September 30, 2022 and 2021. Additionally, $0.8 of restructuring-related share-based compensation activity was excluded from
restructuring and transformation expenses for the nine months ended September 30, 2022 and $1.9 of accelerated depreciation expense for the nine months ended September 30, 2021 was excluded from restructuring and transformation expenses. Deferred
financing fee amortization is included in interest expense; as a result, the company excluded from the depreciation and amortization caption $3.7 and $4.3 for the three months ended September 30, 2022 and 2021 and $12.0 and $13.0 for the nine months
ended September 30, 2022 and 2021. $1.0 and $2.7 of depreciation and amortization expense was excluded from Held for sale non-core European retail business for the three and nine months ended September 30, 2022, respectively.
These are Non-GAAP financial measures used by management to enhance the understanding of our operating results. EBITDA and Adjusted EBITDA are key measures we use to evaluate our
operational performance. We provide EBITDA and Adjusted EBITDA because we believe that investors and securities analysts will find EBITDA and Adjusted EBITDA to be useful measures for evaluating our operating performance and comparing our operating
performance with that of similar companies that have different capital structures and for evaluating our ability to meet our future debt service, capital expenditures, and working capital requirements. However, EBITDA and Adjusted EBITDA should not
be considered as alternatives to net income as a measure of operating results or as alternatives to cash flows from operating activities as a measure of liquidity in accordance with GAAP.
Page 14 of 15
|
3.
|
Reconciliation of GAAP net loss and net loss attributable to Diebold Nixdorf, Incorporated to Non-GAAP net income (loss) and net income (loss) attributable to
Diebold Nixdorf, Incorporated, and diluted GAAP EPS to Non-GAAP EPS ($ in millions, except per share data):
|
| Q3 2022 |
Q3 2021 |
YTD 9/30/2022 |
YTD 9/30/2021 |
|||||||||||||||||||||||||||||
|
|
$ |
per share
|
|
$ |
per share
|
|
$ |
per share
|
|
$ |
per share
|
|||||||||||||||||||||
|
Net loss
|
$
|
(50.5
|
)
|
$
|
(0.64
|
)
|
$
|
(2.0
|
)
|
$
|
(0.03
|
)
|
$
|
(433.5
|
)
|
$
|
(5.49
|
)
|
$
|
(40.4
|
)
|
$
|
(0.52
|
)
|
||||||||
|
Net income (loss) attributable to
noncontrolling interests
|
(0.7
|
)
|
(0.01
|
)
|
0.1
|
—
|
(1.4
|
)
|
(0.01
|
)
|
0.1
|
—
|
||||||||||||||||||||
|
Net loss attributable to Diebold
Nixdorf, Incorporated
|
$
|
(49.8
|
)
|
$
|
(0.63
|
)
|
$
|
(2.1
|
)
|
$
|
(0.03
|
)
|
$
|
(432.1
|
)
|
$
|
(5.48
|
)
|
$
|
(40.5
|
)
|
$
|
(0.52
|
)
|
||||||||
|
Restructuring and transformation
expenses
|
20.7
|
0.26
|
20.9
|
0.27
|
98.9
|
1.25
|
74.4
|
0.95
|
||||||||||||||||||||||||
|
Refinancing related costs
|
13.4
|
0.17
|
—
|
—
|
13.4
|
0.17
|
—
|
—
|
||||||||||||||||||||||||
|
Held for sale non-core European
retail business
|
5.0
|
0.06
|
—
|
—
|
16.7
|
0.21
|
—
|
—
|
||||||||||||||||||||||||
|
Amortization of Wincor Nixdorf
purchase accounting intangible
assets (non-cash)
|
16.6
|
0.21
|
19.5
|
0.25
|
52.8
|
0.67
|
59.3
|
0.76
|
||||||||||||||||||||||||
|
Non-routine (income) expense:
|
||||||||||||||||||||||||||||||||
|
Divestitures and asset sales
|
(5.5
|
)
|
(0.07
|
)
|
—
|
—
|
(5.5
|
)
|
(0.07
|
)
|
(1.9
|
)
|
(0.02
|
)
|
||||||||||||||||||
|
Crisis in Ukraine costs
|
0.7
|
0.01
|
—
|
—
|
3.2
|
0.04
|
—
|
—
|
||||||||||||||||||||||||
|
Loss making contracts related to
discontinued offering
|
—
|
—
|
2.6
|
0.03
|
—
|
—
|
2.6
|
0.03
|
||||||||||||||||||||||||
|
Legal/deal expense
|
(0.5
|
)
|
(0.01
|
)
|
1.5
|
0.02
|
1.4
|
0.02
|
3.8
|
0.05
|
||||||||||||||||||||||
|
Other
|
—
|
—
|
(1.9
|
)
|
(0.02
|
)
|
0.8
|
0.01
|
(2.7
|
)
|
(0.04
|
)
|
||||||||||||||||||||
|
North America ERP Impairment
|
—
|
—
|
—
|
—
|
38.4
|
0.49
|
—
|
—
|
||||||||||||||||||||||||
|
Inventory charge for legacy
products
|
—
|
—
|
—
|
—
|
34.4
|
0.44
|
—
|
—
|
||||||||||||||||||||||||
|
Russia/Ukraine Impairment
|
—
|
—
|
—
|
—
|
16.8
|
0.21
|
—
|
—
|
||||||||||||||||||||||||
|
Other Impairment
|
4.1
|
0.05
|
—
|
—
|
9.5
|
0.12
|
—
|
—
|
||||||||||||||||||||||||
|
Non-routine (income) expense, net
|
(1.2
|
)
|
(0.02
|
)
|
2.2
|
0.03
|
99.0
|
1.26
|
1.8
|
0.02
|
||||||||||||||||||||||
|
Valuation allowance
|
—
|
—
|
—
|
—
|
127.4
|
1.61
|
—
|
—
|
||||||||||||||||||||||||
|
Tax impact (inclusive of allocation of
discrete tax items)
|
(13.7
|
)
|
(0.17
|
)
|
(13.7
|
)
|
(0.17
|
)
|
(80.7
|
)
|
(1.03
|
)
|
(36.9
|
)
|
(0.47
|
)
|
||||||||||||||||
|
Total adjusted net income (loss)
(Non-GAAP measure)
|
$
|
(9.7
|
)
|
$
|
(0.12
|
)
|
$
|
26.9
|
$
|
0.34
|
$
|
(106.0
|
)
|
$
|
(1.34
|
)
|
$
|
58.2
|
$
|
0.73
|
||||||||||||
|
Net income (loss) attributable to noncontrolling interests
|
(0.7
|
)
|
(0.01
|
)
|
0.1
|
—
|
(1.4
|
)
|
(0.01
|
)
|
0.1
|
—
|
||||||||||||||||||||
|
Total adjusted net income (loss) attributable to
Diebold Nixdorf,
Incorporated (Non-GAAP measure)
|
$
|
(9.0
|
)
|
$
|
(0.11
|
)
|
$
|
26.8
|
$
|
0.34
|
$
|
(104.6
|
)
|
$
|
(1.33
|
)
|
$
|
58.1
|
$
|
0.73
|
||||||||||||
Refer to note 1 for additional information on non-routine (income) expense for the periods presented.
|
4.
|
Net debt is calculated as follows ($ in millions):
|
|
September 30,
2022
|
December 31,
2021 |
September 30,
2021
|
||||||||||
|
Cash, cash equivalents, restricted cash and short-term investments (GAAP measure)
|
$
|
143.0
|
$
|
423.2
|
$
|
229.6
|
||||||
|
Cash included in assets held for sale
|
1.0
|
3.1
|
0.6
|
|||||||||
|
Debt instruments
|
(2,435.6
|
)
|
(2,292.7
|
)
|
(2,496.2
|
)
|
||||||
|
Net debt (Non-GAAP measure)
|
$
|
(2,291.6
|
)
|
$
|
(1,866.4
|
)
|
$
|
(2,266.0
|
)
|
|||
We believe that given the significant cash, cash equivalents and short-term investments on its balance sheet that net cash against outstanding debt is a meaningful measure.
###
Page 15 of 15