Exhibit 99.1
Designer Brands Inc. Reports Second Quarter 2022 Financial Results
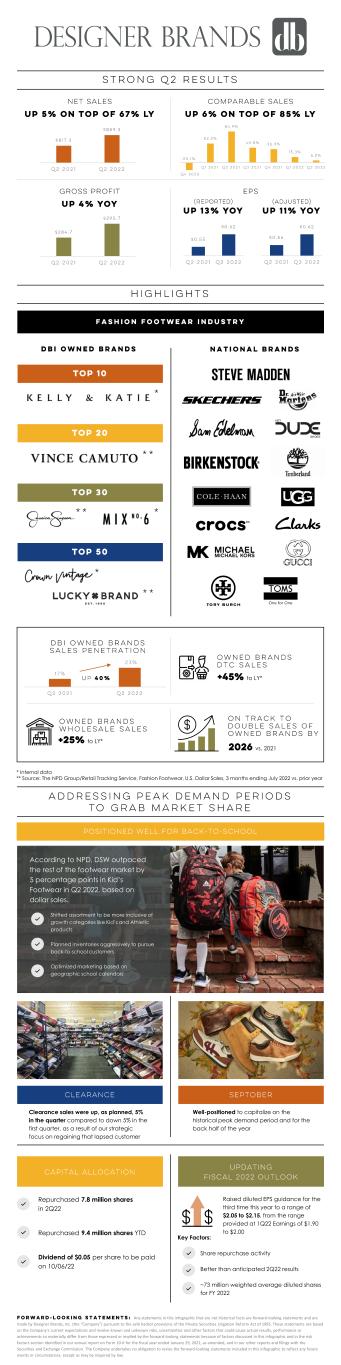
Comparable sales up 6.2% on top of comparable sales of 84.9% for the second quarter of 2021
Net sales from our Owned Brands increased 40.4% over the same period last year
Six of our Owned Brands would fall within the top 50 fashion footwear brands in the second quarter
Full year 2022 diluted EPS guidance raised to a range of $2.05 to $2.15 from $1.90 to $2.00
COLUMBUS, Ohio, August 31, 2022 - Designer Brands Inc. (NYSE: DBI) (the "Company" and "Designer Brands"), one of the world's largest designers, producers, and retailers of footwear and accessories, announced financial results for the three months ended July 30, 2022.
Roger Rawlins, Chief Executive Officer, stated, "Our second quarter was a continuation of the strength we have seen in both our direct-to-consumer and wholesale channels and we were pleased with our topline results. We are seeing this trend continue into the third quarter as our back-to-school season, a new holiday period for Designer Brands, has been performing well, supported by an increased assortment of athletic and kid’s products.
"We continue to successfully execute against our long-term plan to double sales of our Owned Brands by 2026 while maintaining sales of our top National Brand partners. The recent addition of Le Tigre to our portfolio of brands, coupled with our recently announced partnership with Reebok, supports our plan to build a very relevant and highly demanded Owned Brands assortment. Our brand building strategy continues to drive strong financial results and has enabled us to repurchase 7.8 million common shares in the second quarter. As we look forward, we are well-positioned for the back half of the year and are confident in our ability to deliver our updated 2022 guidance."
Second Quarter Operating Results (all comparisons are to the second quarter of 2021)
•Net sales increased 5.1% to $859.3 million.
•Comparable sales increased 6.2%.
•Gross profit increased to $295.7 million versus $284.7 million last year, and gross margin as a percentage of net sales was 34.4% as compared to 34.8% last year.
•Reported net income was $46.2 million, or diluted earnings per share ("EPS") of $0.62.
•Adjusted net income was $46.1 million, or adjusted diluted EPS of $0.62.
Liquidity Highlights
•Cash and cash equivalents totaled $50.8 million at the end of the second quarter of 2022 compared to $46.5 million at the end of the same period last year, with $157.7 million remaining available for borrowings under our senior secured asset-based revolving credit facility ("ABL Revolver"). Debt totaled $387.4 million at the end of the second quarter of 2022 compared to $247.1 million at the end of the same period last year. We anticipate receiving approximately $160.0 million in the near future from the Internal Revenue Service as a result of the Coronavirus Aid, Relief, and Economic Security Act.
•The Company ended the quarter with more normalized inventory levels of $694.0 million compared to $504.3 million at the same period last year with accelerated receipts to support fall season demand.
Return to Shareholders
•During the second quarter of 2022, Designer Brands repurchased 7.8 million Class A common shares (10.8% of Class A and Class B common shares at the beginning of the quarter) at an aggregate cost of $105.8 million under its share repurchase program.
•During the six months ended July 30, 2022, we repurchased 9.4 million Class A common shares (12.8% of Class A and Class B common shares at the beginning of the fiscal year) at an aggregate cost of $128.5 million, with $206.4 million of Class A common shares that remain authorized under the program as of July 30, 2022.
• A dividend of $0.05 per share of Class A and Class B common shares will be paid on October 6, 2022 to shareholders of record at the close of business on September 22, 2022.
Store Openings and Closings
During the second quarter of 2022, we closed 4 stores in the U.S. and 2 stores in Canada with no new stores opened, resulting in a total of 506 U.S. stores and 138 Canadian stores as of July 30, 2022. In May 2022, we opened our new "Warehouse Reimagined" format at a Houston-area DSW store.
Updated 2022 Financial Outlook
The Company is updating the following guidance for the full year 2022: | | | | | | | | | | | | | | |
| Metric | | Previous Guidance | | Current Guidance |
| Designer Brands Comparable Sales Growth | | Mid-single digits | | Mid-single digits |
| Diluted EPS | | $1.90 - $2.00 | | $2.05 - $2.15 |
Webcast and Conference Call
The Company is hosting a conference call today at 8:30 a.m. Eastern Time. Investors and analysts interested in participating in the call are invited to dial 1-888-317-6003, or the international dial-in, 1-412-317-6061, and reference conference ID number 0992621 approximately ten minutes prior to the start of the conference call. The conference call will also be broadcast live over the internet and can be accessed through the following link:
https://app.webinar.net/92W8GVxERKJ
For those unable to listen to the live webcast, an archived version will be available via the same website address until September 1, 2022. A replay of the teleconference will be available by dialing the following numbers:
U.S.: 1-877-344-7529
Canada: 1-855-669-9658
International: 1-412-317-0088
Passcode: 8228598
About Designer Brands
Designer Brands is one of the world’s largest designers, producers and retailers of the most recognizable footwear brands and accessories, transforming and defining the footwear industry by inspiring self-expression across every facet of its enterprise. Through its portfolio of world-class owned brands, led by the industry-setting Vince Camuto brand, Designer Brands delivers on-trend footwear and accessories through its robust direct-to-consumer omni-channel infrastructure, featuring a billion-dollar digital commerce business and nearly 650 stores across the U.S. and Canada. Its retailing operations under the DSW Designer Shoe Warehouse and The Shoe Company banners deliver current, in-line footwear and accessories from most of the largest national brands in the industry and hold leading market share positions in key product categories across Women’s, Men’s and Kid’s in the U.S. and Canada. Designer Brands also distributes its owned brands through select wholesale relationships while leveraging its design and sourcing expertise to build private label product for national retailers. Designer Brands is also committed to being a difference maker in the world, taking steps forward to advance diversity, equity, and inclusion in the footwear industry and supporting our global community and the health of our planet through donating more than six million pairs of shoes to the global non-profit Soles4Souls. More information can be found at www.designerbrands.com.
Safe Harbor Statement under the Private Securities Litigation Reform Act of 1995
Certain statements in this press release may constitute forward-looking statements and are made pursuant to the safe harbor provisions of the Private Securities Litigation Reform Act of 1995. You can identify these forward-looking statements by the use of forward-looking words such as "outlook," "could," "believes," "expects," "potential," "continues," "may," "will," "should," "would," "seeks," "approximately," "predicts," "intends," "plans," "estimates," "anticipates," or the negative version of those words or other comparable words. These statements are based on the Company's current views and expectations and involve known and unknown risks, uncertainties, and other factors that may cause actual results, performance, or achievements to be materially different from any future results, performance, or achievements expressed or implied by the forward-looking statements. These factors include, but are not limited to: risks and uncertainties related to the ongoing coronavirus ("COVID-19") pandemic, any future COVID-19 resurgence, and any other adverse public health developments; risks that recent inflationary pressures, including higher freight costs, could have on our results of operations and customer demand based on pricing actions and operating measures taken to mitigate the impact of inflation; uncertain general economic conditions, including inflation and supply chain
pressures, domestic and global political and social conditions and the potential impact of geopolitical turmoil or conflict, and the related impacts to consumer discretionary spending; our ability to execute on our long-term strategic plans; our ability to anticipate and respond to fashion trends, consumer preferences, and changing customer expectations; our ability to maintain strong relationships with our vendors, manufacturers, licensors, and retailer customers; risks related to losses or disruptions associated with our distribution systems, including our distribution centers and fulfillment center and stores, whether as a result of the COVID-19 pandemic, reliance on third-party providers, or otherwise; our reliance on our loyalty programs and marketing to drive traffic, sales, and customer loyalty; risks related to cyber security threats and privacy or data security breaches or the potential loss or disruption of our information systems; our ability to protect our reputation and to maintain the brands we license; our competitiveness with respect to style, price, brand availability, and customer service; risks related to our international operations, including international trade, our reliance on foreign sources for merchandise, exposure to political, economic, operational, and compliance and other risks, and fluctuations in foreign currency exchange rates; our ability to comply with privacy laws and regulations, as well as other legal obligations; risks associated with climate change and other corporate responsibility issues; and uncertainties related to future legislation, regulatory reform, policy changes, or interpretive guidance on existing legislation. Risks and other factors that could cause our actual results to differ materially from our forward-looking statements are described in the Company's Annual Report on Form 10-K for the fiscal year ended January 29, 2022 and in our other filings with the Securities and Exchange Commission. All forward-looking statements speak only as of the time when made. Except as may be required by law, the Company undertakes no obligation to update or revise the forward-looking statements included in this press release to reflect any future events or circumstances.
DESIGNER BRANDS INC.
SEGMENT RESULTS
(unaudited)
| | | | | | | | | | | | | | | | | | | | | | | | | | | | | | | | | | | | | |
| Net Sales | | |
| Three months ended | | | | | | |
| (dollars in thousands) | July 30, 2022 | | July 31, 2021 | | Change | | |
| Amount | | % of Segment Net Sales | | Amount | | % of Segment Net Sales | | Amount | | % | | |
| Segment net sales: | | | | | | | | | | | | | |
| U.S. Retail | $ | 734,063 | | | 83.5 | % | | $ | 723,093 | | | 87.0 | % | | $ | 10,970 | | | 1.5 | % | | |
| Canada Retail | 78,284 | | | 8.9 | % | | 57,585 | | | 6.9 | % | | 20,699 | | | 35.9 | % | | |
| Brand Portfolio | 66,351 | | | 7.6 | % | | 50,529 | | | 6.1 | % | | 15,822 | | | 31.3 | % | | |
| | | | | | | | | | | | | |
| Total segment net sales | 878,698 | | | 100.0 | % | | 831,207 | | | 100.0 | % | | 47,491 | | | 5.7 | % | | |
| Elimination of intersegment net sales | (19,379) | | | | | (13,872) | | | | | (5,507) | | | 39.7 | % | | |
| Consolidated net sales | $ | 859,319 | | | | | $ | 817,335 | | | | | $ | 41,984 | | | 5.1 | % | | |
| | | | | | | | | | | | | | | | | | | | | | | | | | | | | | | | | | | | | |
| Six months ended | | | | | | |
| (dollars in thousands) | July 30, 2022 | | July 31, 2021 | | Change | | |
| Amount | | % of Segment Net Sales | | Amount | | % of Segment Net Sales | | Amount | | % | | |
| Segment net sales: | | | | | | | | | | | | | |
| U.S. Retail | $ | 1,436,808 | | | 82.8 | % | | $ | 1,343,751 | | | 86.7 | % | | $ | 93,057 | | | 6.9 | % | | |
| Canada Retail | 134,599 | | | 7.8 | % | | 98,189 | | | 6.3 | % | | 36,410 | | | 37.1 | % | | |
| Brand Portfolio | 163,807 | | | 9.4 | % | | 107,956 | | | 7.0 | % | | 55,851 | | | 51.7 | % | | |
| Total segment net sales | 1,735,214 | | | 100.0 | % | | 1,549,896 | | | 100.0 | % | | 185,318 | | | 12.0 | % | | |
| Elimination of intersegment net sales | (45,352) | | | | | (29,406) | | | | | (15,946) | | | 54.2 | % | | |
| Consolidated net sales | $ | 1,689,862 | | | | | $ | 1,520,490 | | | | | $ | 169,372 | | | 11.1 | % | | |
| | | | | | | | | | | | | | | | | | | | | | | | | | | | | |
| Net Sales by Brand Category |
| (in thousands) | U.S. Retail | | Canada Retail | | Brand Portfolio | | Eliminations | | Consolidated |
| Three months ended July 30, 2022 | | | | | | | | | |
Owned Brands:(1) | | | | | | | | | |
| Direct-to-consumer | $ | 147,877 | | | $ | — | | | $ | 7,793 | | | $ | — | | | $ | 155,670 | |
| External customer wholesale and commission income | — | | | — | | | 39,179 | | | — | | | 39,179 | |
| Intersegment wholesale and commission income | — | | | — | | | 19,379 | | | (19,379) | | | — | |
| Total Owned Brands | 147,877 | | | — | | | 66,351 | | | (19,379) | | | 194,849 | |
| National brands | 586,186 | | | — | | | — | | | — | | | 586,186 | |
Canada Retail(2) | — | | | 78,284 | | | — | | | — | | | 78,284 | |
| Total net sales | $ | 734,063 | | | $ | 78,284 | | | $ | 66,351 | | | $ | (19,379) | | | $ | 859,319 | |
| Three months ended July 31, 2021 | | | | | | | | | |
Owned Brands:(1) | | | | | | | | | |
| Direct-to-consumer | $ | 102,152 | | | $ | — | | | $ | 5,437 | | | $ | — | | | $ | 107,589 | |
| External customer wholesale and commission income | — | | | — | | | 31,220 | | | — | | | 31,220 | |
| Intersegment wholesale and commission income | — | | | — | | | 13,872 | | | (13,872) | | | — | |
| Total Owned Brands | 102,152 | | | — | | | 50,529 | | | (13,872) | | | 138,809 | |
| National brands | 620,941 | | | — | | | — | | | — | | | 620,941 | |
Canada Retail(2) | — | | | 57,585 | | | — | | | — | | | 57,585 | |
| Total net sales | $ | 723,093 | | | $ | 57,585 | | | $ | 50,529 | | | $ | (13,872) | | | $ | 817,335 | |
| Six months ended July 30, 2022 | | | | | | | | | |
Owned Brands:(1) | | | | | | | | | |
| Direct-to-consumer | $ | 287,032 | | | $ | — | | | $ | 14,320 | | | $ | — | | | $ | 301,352 | |
| External customer wholesale and commission income | — | | | — | | | 104,135 | | | — | | | 104,135 | |
| Intersegment wholesale and commission income | — | | | — | | | 45,352 | | | (45,352) | | | — | |
| Total Owned Brands | 287,032 | | | — | | | 163,807 | | | (45,352) | | | 405,487 | |
| National brands | 1,149,776 | | | — | | | — | | | — | | | 1,149,776 | |
Canada Retail(2) | — | | | 134,599 | | | — | | | — | | | 134,599 | |
| Total net sales | $ | 1,436,808 | | | $ | 134,599 | | | $ | 163,807 | | | $ | (45,352) | | | $ | 1,689,862 | |
| Six months ended July 31, 2021 | | | | | | | | | |
Owned Brands:(1) | | | | | | | | | |
| Direct-to-consumer | $ | 185,418 | | | $ | — | | | $ | 10,890 | | | $ | — | | | $ | 196,308 | |
| External customer wholesale and commission income | — | | | — | | | 67,660 | | | — | | | 67,660 | |
| Intersegment wholesale and commission income | — | | | — | | | 29,406 | | | (29,406) | | | — | |
| Total Owned Brands | 185,418 | | | — | | | 107,956 | | | (29,406) | | | 263,968 | |
| National brands | 1,158,333 | | | — | | | — | | | — | | | 1,158,333 | |
Canada Retail(2) | — | | | 98,189 | | | — | | | — | | | 98,189 | |
| Total net sales | $ | 1,343,751 | | | $ | 98,189 | | | $ | 107,956 | | | $ | (29,406) | | | $ | 1,520,490 | |
(1) Owned Brands refers to those brands we have rights to sell through ownership or license arrangements.
(2) We currently do not report the Canada Retail segment net sales by brand categories.
| | | | | | | | | | | | | | | | | | | | | | | |
| Comparable Sales |
| Three months ended | | Six months ended |
| July 30, 2022 | | July 31, 2021 | | July 30, 2022 | | July 31, 2021 |
| Change in comparable sales: | | | | | | | |
| U.S. Retail segment | 2.7 | % | | 94.3 | % | | 7.8 | % | | 74.5 | % |
| Canada Retail segment | 47.3 | % | | 14.6 | % | | 44.8 | % | | 12.6 | % |
| Brand Portfolio segment - direct-to-consumer channel | 43.3 | % | | 10.6 | % | | 31.5 | % | | 8.6 | % |
| | | | | | | |
| Total | 6.2 | % | | 84.9 | % | | 10.4 | % | | 68.1 | % |
| | | | | | | | | | | | | | | | | | | | | | | |
| Store Count |
| (square footage in thousands) | July 30, 2022 | | July 31, 2021 |
| Number of Stores | | Square Footage | | Number of Stores | | Square Footage |
| U.S. Retail segment - DSW stores | 506 | | | 10,237 | | | 515 | | | 10,491 | |
| Canada Retail segment: | | | | | | | |
| The Shoe Company stores | 113 | | | 596 | | | 116 | | | 611 | |
| DSW stores | 25 | | | 496 | | | 27 | | | 536 | |
| 138 | | | 1,092 | | | 143 | | | 1,147 | |
| Total number of stores | 644 | | | 11,329 | | | 658 | | | 11,638 | |
| | | | | | | | | | | | | | | | | | | | | | | | | | | | | | | | | | | | | | | | | |
Gross Profit |
| Three months ended | | | | | | |
(dollars in thousands) | July 30, 2022 | | July 31, 2021 | | Change |
| Amount | | % of Segment Net Sales | | Amount | | % of Segment Net Sales | | Amount | | % | | Basis Points |
| Segment gross profit: | | | | | | | | | | | | | |
| U.S. Retail | $ | 251,143 | | | 34.2 | % | | $ | 256,893 | | | 35.5 | % | | $ | (5,750) | | | (2.2) | % | | (130) | |
| Canada Retail | 30,974 | | | 39.6 | % | | 18,768 | | | 32.6 | % | | 12,206 | | | 65.0 | % | | 700 | |
| Brand Portfolio | 12,294 | | | 18.5 | % | | 8,533 | | | 16.9 | % | | 3,761 | | | 44.1 | % | | 160 | |
| | | | | | | | | | | | | |
| Total segment gross profit | 294,411 | | | 33.5 | % | | 284,194 | | | 34.2 | % | | 10,217 | | | 3.6 | % | | (70) | |
| Net recognition of intersegment gross profit | 1,259 | | | | | 487 | | | | | 772 | | | | | |
| Consolidated gross profit | $ | 295,670 | | | 34.4 | % | | $ | 284,681 | | | 34.8 | % | | $ | 10,989 | | | 3.9 | % | | (40) | |
| | | | | | | | | | | | | | | | | | | | | | | | | | | | | | | | | | | | | | | | | |
| Six months ended | | | | | | |
(dollars in thousands) | July 30, 2022 | | July 31, 2021 | | Change |
| Amount | | % of Segment Net Sales | | Amount | | % of Segment Net Sales | | Amount | | % | | Basis Points |
| Segment gross profit: | | | | | | | | | | | | | |
| U.S. Retail | $ | 484,210 | | | 33.7 | % | | $ | 450,006 | | | 33.5 | % | | $ | 34,204 | | | 7.6 | % | | 20 | |
| Canada Retail | 49,847 | | | 37.0 | % | | 29,603 | | | 30.1 | % | | 20,244 | | | 68.4 | % | | 690 | |
| Brand Portfolio | 36,136 | | | 22.1 | % | | 20,459 | | | 19.0 | % | | 15,677 | | | 76.6 | % | | 310 | |
| Total segment gross profit | 570,193 | | | 32.9 | % | | 500,068 | | | 32.3 | % | | 70,125 | | | 14.0 | % | | 60 | |
| Net recognition of intersegment gross profit | 1,222 | | | | | 724 | | | | | 498 | | | | | |
| Consolidated gross profit | $ | 571,415 | | | 33.8 | % | | $ | 500,792 | | | 32.9 | % | | $ | 70,623 | | | 14.1 | % | | 90 | |
| | | | | | | | | | | | | | | |
| Intersegment Eliminations |
| Three months ended | | |
| (in thousands) | July 30, 2022 | | July 31, 2021 | | | | |
| Recognition (elimination) of intersegment activity: | | | | | | | |
| Net sales recognized by Brand Portfolio segment | $ | (19,379) | | | $ | (13,872) | | | | | |
| Cost of sales: | | | | | | | |
| Cost of sales recognized by Brand Portfolio segment | 12,554 | | | 9,707 | | | | | |
| Recognition of intersegment gross profit for inventory previously purchased that was subsequently sold to external customers during the current period | 8,084 | | | 4,652 | | | | | |
| $ | 1,259 | | | $ | 487 | | | | | |
| | | | | | | | | | | |
| Six months ended |
| (in thousands) | July 30, 2022 | | July 31, 2021 |
| Recognition (elimination) of intersegment activity: | | | |
| Net sales recognized by Brand Portfolio segment | $ | (45,352) | | | $ | (29,406) | |
| Cost of sales: | | | |
| Cost of sales recognized by Brand Portfolio segment | 30,723 | | | 20,642 | |
| Recognition of intersegment gross profit for inventory previously purchased that was subsequently sold to external customers during the current period | 15,851 | | | 9,488 | |
| $ | 1,222 | | | $ | 724 | |
DESIGNER BRANDS INC.
CONDENSED CONSOLIDATED STATEMENTS OF OPERATIONS
(unaudited and in thousands, except per share amounts)
| | | | | | | | | | | | | | | | | | | | | | | |
| Three months ended | | Six months ended |
| July 30, 2022 | | July 31, 2021 | | July 30, 2022 | | July 31, 2021 |
| Net sales | $ | 859,319 | | | $ | 817,335 | | | $ | 1,689,862 | | | $ | 1,520,490 | |
| Cost of sales | (563,649) | | | (532,654) | | | (1,118,447) | | | (1,019,698) | |
| Gross profit | 295,670 | | | 284,681 | | | 571,415 | | | 500,792 | |
| Operating expenses | (228,690) | | | (224,385) | | | (452,116) | | | (425,199) | |
| Income from equity investments | 2,435 | | | 2,290 | | | 4,380 | | | 3,998 | |
| Impairment charges | (1,816) | | | (1,174) | | | (2,888) | | | (1,174) | |
| Operating profit | 67,599 | | | 61,412 | | | 120,791 | | | 78,417 | |
| Interest expense, net | (2,752) | | | (8,072) | | | (5,704) | | | (16,886) | |
| Loss on extinguishment of debt and write-off of debt issuance costs | — | | | — | | | (12,862) | | | — | |
| Non-operating income (expenses), net | 37 | | | (244) | | | 43 | | | 562 | |
| Income before income taxes | 64,884 | | | 53,096 | | | 102,268 | | | 62,093 | |
| Income tax provision | (18,671) | | | (10,236) | | | (29,873) | | | (2,207) | |
| Net income | $ | 46,213 | | | $ | 42,860 | | | $ | 72,395 | | | $ | 59,886 | |
| Diluted earnings per share | $ | 0.62 | | | $ | 0.55 | | | $ | 0.96 | | | $ | 0.78 | |
| Weighted average diluted shares | 73,942 | | | 77,619 | | | 75,369 | | | 77,271 | |
DESIGNER BRANDS INC.
CONDENSED CONSOLIDATED BALANCE SHEETS
(unaudited and in thousands)
| | | | | | | | | | | | | | | | | |
| July 30, 2022 | | January 29, 2022 | | July 31, 2021 |
| ASSETS | | | | | |
| Current Assets: | | | | | |
| Cash and cash equivalents | $ | 50,799 | | | $ | 72,691 | | | $ | 46,458 | |
| | | | | |
| Receivables, net | 204,880 | | | 199,826 | | | 199,371 | |
| Inventories | 694,010 | | | 586,429 | | | 504,316 | |
| Prepaid expenses and other current assets | 51,558 | | | 55,270 | | | 53,616 | |
| Total current assets | 1,001,247 | | | 914,216 | | | 803,761 | |
| Property and equipment, net | 242,147 | | | 256,786 | | | 271,401 | |
| Operating lease assets | 646,062 | | | 647,221 | | | 676,665 | |
| Goodwill | 93,655 | | | 93,655 | | | 93,655 | |
| Intangible assets, net | 20,237 | | | 15,527 | | | 15,905 | |
| Equity investments | 61,957 | | | 55,578 | | | 55,149 | |
| Other assets | 37,134 | | | 31,651 | | | 29,513 | |
| Total assets | $ | 2,102,439 | | | $ | 2,014,634 | | | $ | 1,946,049 | |
| LIABILITIES AND SHAREHOLDERS' EQUITY | | | | | |
| Current Liabilities | | | | | |
| Accounts payable | $ | 337,543 | | | $ | 340,877 | | | $ | 299,322 | |
| Accrued expenses | 210,469 | | | 215,812 | | | 222,055 | |
| Current maturities of long-term debt | — | | | — | | | 62,500 | |
| Current operating lease liabilities | 192,130 | | | 202,228 | | | 190,853 | |
| Total current liabilities | 740,142 | | | 758,917 | | | 774,730 | |
| Long-term debt | 387,441 | | | 225,536 | | | 184,569 | |
| Non-current operating lease liabilities | 588,064 | | | 593,429 | | | 645,136 | |
| Other non-current liabilities | 25,844 | | | 24,356 | | | 30,502 | |
| Total shareholders' equity | 360,948 | | | 412,396 | | | 311,112 | |
| Total liabilities and shareholders' equity | $ | 2,102,439 | | | $ | 2,014,634 | | | $ | 1,946,049 | |
DESIGNER BRANDS INC.
NON-GAAP RECONCILIATIONS
(unaudited and in thousands, except per share amounts)
| | | | | | | | | | | | | | | | | | | | | | | |
| Three months ended | | Six months ended |
| July 30, 2022 | | July 31, 2021 | | July 30, 2022 | | July 31, 2021 |
| Operating expenses | $ | (228,690) | | | $ | (224,385) | | | $ | (452,116) | | | $ | (425,199) | |
| Non-GAAP adjustments: | | | | | | | |
| Restructuring expenses | 992 | | | 1,094 | | | 1,606 | | | 2,836 | |
| Target acquisition costs | — | | | 5,333 | | | — | | | 5,333 | |
| | | | | | | |
| Adjusted operating expenses | $ | (227,698) | | | $ | (217,958) | | | $ | (450,510) | | | $ | (417,030) | |
| Operating profit | $ | 67,599 | | | $ | 61,412 | | | $ | 120,791 | | | $ | 78,417 | |
| Non-GAAP adjustments: | | | | | | | |
| Restructuring expenses | 992 | | | 1,094 | | | 1,606 | | | 2,836 | |
| Target acquisition costs | — | | | 5,333 | | | — | | | 5,333 | |
| | | | | | | |
| Impairment charges | 1,816 | | | 1,174 | | | 2,888 | | | 1,174 | |
| Total non-GAAP adjustments | 2,808 | | | 7,601 | | | 4,494 | | | 9,343 | |
| Adjusted operating profit | $ | 70,407 | | | $ | 69,013 | | | $ | 125,285 | | | $ | 87,760 | |
| Net income | $ | 46,213 | | | $ | 42,860 | | | $ | 72,395 | | | $ | 59,886 | |
| Non-GAAP adjustments: | | | | | | | |
| Restructuring expenses | 992 | | | 1,094 | | | 1,606 | | | 2,836 | |
| Target acquisition costs | — | | | 5,333 | | | — | | | 5,333 | |
| | | | | | | |
Impairment charges | 1,816 | | | 1,174 | | | 2,888 | | | 1,174 | |
| Loss on extinguishment of debt and write-off of debt issuance costs | — | | | — | | | 12,862 | | | — | |
| Foreign currency transaction losses (gains) | (37) | | | 244 | | | (43) | | | (562) | |
| Total non-GAAP adjustments before tax effect | 2,771 | | | 7,845 | | | 17,313 | | | 8,781 | |
| Tax effect of non-GAAP adjustments | (735) | | | (1,871) | | | (4,374) | | | (2,179) | |
| Valuation allowance change on deferred tax assets | (2,135) | | | (5,395) | | | (2,495) | | | (13,577) | |
| Total adjustments, after tax | (99) | | | 579 | | | 10,444 | | | (6,975) | |
| Adjusted net income | $ | 46,114 | | | $ | 43,439 | | | $ | 82,839 | | | $ | 52,911 | |
| Diluted earnings per share | $ | 0.62 | | | $ | 0.55 | | | $ | 0.96 | | | $ | 0.78 | |
| Adjusted diluted earnings per share | $ | 0.62 | | | $ | 0.56 | | | $ | 1.10 | | | $ | 0.68 | |
Non-GAAP Measures
To supplement amounts presented in our unaudited condensed consolidated financial statements determined in accordance with accounting principles generally accepted in the United States ("GAAP"), the Company uses certain non-GAAP financial measures, including adjusted operating expenses, adjusted operating profit, adjusted net income, and adjusted diluted earnings per share as shown in the table above. These measures adjust for the effects of: (1) restructuring expenses; (2) target acquisition costs; (3) impairment charges; (4) loss on extinguishment of debt and write-off of debt issuance costs; (5) foreign currency transaction losses (gains); (6) the net tax effect of
such items; and (7) the change in the valuation allowance on deferred tax assets. The unaudited reconciliation of adjusted results should not be construed as an alternative to the reported results determined in accordance with GAAP. These financial measures are not based on any standardized methodology and are not necessarily comparable to similar measures presented by other companies. The Company believes these non-GAAP measures provide useful information to both management and investors to increase comparability to prior periods by adjusting for certain items that may not be indicative of core operating measures and to better identify trends in our business. The adjusted financial results are used by management to, and allow investors to, evaluate the operating performance of the Company on a comparable basis, when reviewed in conjunction with the Company’s GAAP statements. These amounts are not determined in accordance with GAAP and therefore should not be used exclusively in evaluating the Company’s business and operations.
Comparable Sales Performance Metric
We consider the change in comparable sales from the same previous year period, a primary metric commonly used throughout the retail industry, to be an important indicator of the performance of our retail and direct-to-consumer businesses. We include in our comparable sales metric stores in operation for at least 14 months at the beginning of the fiscal year. Stores are added to the comparable base at the beginning of the year and are dropped for comparative purposes in the quarter in which they are closed. Comparable sales include stores temporarily closed as a result of the COVID-19 pandemic as management continues to believe that this metric is meaningful to monitor our performance. Comparable sales also include e-commerce sales. Comparable sales for the Canada Retail segment exclude the impact of foreign currency translation and are calculated by translating current period results at the foreign currency exchange rate used in the comparable period of the prior year. Comparable sales for the Brand Portfolio segment include the direct-to-consumer e-commerce site www.vincecamuto.com. The calculation of comparable sales varies across the retail industry and, as a result, the calculations of other retail companies may not be consistent with our calculation.