
ddd-20200226
0000910638false00009106382020-02-262020-02-26

UNITED STATES
SECURITIES AND EXCHANGE COMMISSION
Washington, D.C. 20549
FORM 8-K
CURRENT REPORT
Pursuant to Section 13 OR 15(d) of The Securities Exchange Act of 1934

February 26, 2020

Date of Report (date of earliest event reported)

3D SYSTEMS CORPORATION
(Exact name of registrant as specified in its charter)
Delaware
001-34220
95-4431352
(State or other jurisdiction of incorporation or organization)
(Commission File Number)
(I.R.S. Employer Identification No.)
333 Three D Systems Circle
Rock Hill
South Carolina
29730
(Address of Principal Executive Offices)
(Zip Code)
(803) 326-3900
Registrant's telephone number, including area code

Check the appropriate box below if the Form 8-K filing is intended to simultaneously satisfy the filing obligation of the registrant under any of the following provisions (see General Instruction A.2. below):

Written communications pursuant to Rule 425 under the Securities Act (17 CFR 230.425)

Soliciting material pursuant to Rule 14a-12 under the Exchange Act (17 CFR 240.14a-12)

Pre-commencement communications pursuant to Rule 14d-2(b) under the Exchange Act (17 CFR 240.14d-2(b))

Pre-commencement communications pursuant to Rule 13e-4(c) under the Exchange Act (17 CFR 240.13e-4(c))

Indicate by check mark whether the registrant is an emerging growth company as defined in Rule 405 of the Securities Act of 1933 (§230.405 of this chapter) or Rule 12b-2 of the Securities Exchange Act of 1934 (§240.12b-2 of this chapter).
Emerging growth company

If an emerging growth company, indicate by check mark if the registrant has elected not to use the extended transition period for complying with any new or revised financial accounting standards provided pursuant to Section 13(a) of the Exchange Act.
o

Securities registered pursuant to Section 12(b) of the Act:
Title of each classTrading Symbol(s)Name of each exchange on which registered
Common stock, par value $0.001 per shareDDDNew York Stock Exchange


Item 2.02. Results of Operations and Financial Condition.

On February 26, 2020, 3D Systems Corporation (the “Company”) issued a press release announcing the Company’s results of operations for the fourth quarter and twelve months ended December 31, 2019. A copy of the Company’s press release is furnished herewith as Exhibit 99.1 and is incorporated into this Item 2.02 by reference. The information in this Item (and in such press release) shall not be deemed “filed” with the Securities and Exchange Commission (“SEC”) for purposes of the Securities Exchange Act of 1934, as amended, nor incorporated by reference in any registration statement filed by the Company under the Securities Act of 1933, as amended (the “Securities Act”).

Item 7.01. Regulation FD Disclosure.

Included in the press release mentioned above is an announcement that the Company plans to hold a conference call and webcast at 4:30 p.m., Eastern Time, Wednesday, February 26, 2020, to discuss its fourth quarter and twelve months ended December 31, 2019 financial results and other matters relating to the Company’s plans and operations. A copy of this press release, which contains additional information regarding how to access the conference call and webcast and how to listen to a recorded playback of the call after it is completed, is furnished herewith as Exhibit 99.1 and incorporated by reference herein. The slides to be presented on the webcast are furnished herewith as Exhibit 99.2 and incorporated by reference herein. The information contained in this Item 7.01, including Exhibit 99.1 and Exhibit 99.2 incorporated by reference, shall not be deemed “filed” with the SEC nor incorporated by reference in any registration statement filed by the Company under the Securities Act.

Item 9.01. Financial Statements and Exhibits.

(d) Exhibits.

Press Release issued by the Company, dated February 26, 2020, announcing results for the fourth quarter and twelve months ended December 31, 2019.
Investor information to be presented by the Company on February 26, 2020.


SIGNATURES
Pursuant to the requirements of the Securities Exchange Act of 1934, the registrant has duly caused this report to be signed on its behalf by the undersigned hereunto duly authorized.

 3D SYSTEMS CORPORATION
  
  /s/ Andrew M. Johnson
  (Signature)
  Name: Andrew M. Johnson
  
Title: Executive Vice President, Chief Legal Officer and Secretary
Date: February 26, 2020


EXHIBIT 99.1

3D Systems Reports
Fourth Quarter and Full Year 2019 Financial Results


ROCK HILL, South Carolina - February 26, 2020 - 3D Systems Corporation (NYSE:DDD) announced today its financial results for the fourth quarter and full year ended December 31, 2019.

For the fourth quarter of 2019, the company reported GAAP revenue of $164.6 million, compared to $180.7 million in the same period last year. Printer revenue decreased by 22.8 percent due to the delay in factory metals printing shipments, timing of large enterprise customer orders and the softer macro industrial environment. Materials revenue increased 7.3 percent, healthcare solutions revenue decreased 5.9 percent including a large enterprise customer and decreased 2.3 percent excluding this same customer, on demand services revenue decreased 17.2 percent and software revenue decreased 10.2 percent. The company reported fourth quarter 2019 GAAP loss of $0.04 per share compared to a GAAP loss of $0.04 per share in the same period last year, and non-GAAP earnings of $0.05 per share compared to non-GAAP earnings of $0.10 per share in the same period last year.

For the full year 2019, the company reported GAAP revenue of $629.1 million compared to $687.7 million for the prior year. Printer revenue decreased 24.3 percent, again due to the delay in factory metals printing shipments, timing of large enterprise customer orders and the softer macro industrial environment. Materials revenue decreased 0.6 percent, healthcare solutions revenue decreased 3.5 percent including a large enterprise customer and increased 9.8 percent excluding this same customer, on demand services revenue decreased 13.5 percent and software revenue decreased 2.7 percent. The company reported full year 2019 GAAP loss of $0.61 per share compared to a GAAP loss of $0.41 per share in the prior year, and non-GAAP loss of $0.08 per share compared to non-GAAP earnings of $0.15 per share in the prior year.

"In 2019 we demonstrated how our digital manufacturing strategy has come alive, with customers realizing the benefits of our production solutions across a range of industries and creating over 200 million production parts using 3D Systems’ solutions. Despite macroeconomic headwinds, I’m pleased with the growth in materials in the second half and our continued focus on cost structure," commented Vyomesh Joshi ("VJ"), president and chief executive officer, 3D Systems. "Now in 2020 we believe we have the right products and solutions, including our planned shipment of factory metals printers in the second quarter, to accelerate the adoption of additive manufacturing technology and drive profitable revenue growth."

For the fourth quarter 2019, the company reported GAAP gross profit margin of 43.6 percent compared to 45.7 percent in the same period last year. Non-GAAP gross profit margin was 43.8 percent in the fourth quarter compared to 46.3 percent in the same period last year.

For the full year, the company reported GAAP gross profit margin of 44.2 percent compared to 47.2 percent in the prior year. Non-GAAP gross profit margin was 45.0 percent for the full year compared to 47.4 percent in the prior year.

For the fourth quarter of 2019, GAAP operating expenses decreased 14.6 percent to $76.5 million compared to $89.6 million in the same period last year. GAAP SG&A expenses decreased 10.3 percent to $59.3 million. GAAP R&D expenses decreased 27.2 percent to $17.1 million. Non-GAAP operating expenses in the fourth quarter decreased 12.3 percent to $66.4 million compared to $75.7 million in the same period last year, as a result of execution of the company's cost reduction plans.


For the full year 2019, GAAP operating expenses decreased 8.8 percent to $335.1 million compared to $367.6 million in the prior year. GAAP SG&A expenses decreased 6.6 percent to $254.4 million. GAAP R&D expenses decreased 15.2 percent to $80.8 million. Non-GAAP operating expenses for the full year decreased 9.0 percent to $280.3 million compared to $307.9 million in the prior year, as a result of execution of the company's cost reduction plans.

The company generated $21.5 million of cash from operations during the fourth quarter. Cash generation was driven by improvements in working capital, including planned reductions of inventory.

The company had $133.7 million of unrestricted cash on hand at December 31, 2019.


Q4 and FY 2019 Conference Call and Webcast
The company expects to file its Annual Report on Form 10-K for the year ended December 31, 2019 with the Securities and Exchange Commission on February 26, 2020. 3D Systems plans to hold a conference call and simultaneous webcast to discuss these results today, Wednesday, February 26, 2020, which may be accessed as follows:

Date: Wednesday, February 26, 2020
Time: 4:30 p.m. Eastern Time
Listen via webcast: www.3dsystems.com/investor
Participate via telephone: 201-689-8345

A replay of the webcast will be available approximately two hours after the live presentation at www.3dsystems.com/investor.


Forward-Looking Statements
Certain statements made in this release that are not statements of historical or current facts are forward-looking statements within the meaning of the Private Securities Litigation Reform Act of 1995. Forward-looking statements involve known and unknown risks, uncertainties and other factors that may cause the actual results, performance or achievements of the company to be materially different from historical results or from any future results or projections expressed or implied by such forward-looking statements. In many cases, forward looking statements can be identified by terms such as “believes,” “belief,” “expects,” “may,” “will,” “estimates,” “intends,” “anticipates” or “plans” or the negative of these terms or other comparable terminology. Forward-looking statements are based upon management’s beliefs, assumptions and current expectations and may include comments as to the company’s beliefs and expectations as to future events and trends affecting its business and are necessarily subject to uncertainties, many of which are outside the control of the company. The factors described under the headings “Forward-Looking Statements” and “Risk Factors” in the company’s periodic filings with the Securities and Exchange Commission, as well as other factors, could cause actual results to differ materially from those reflected or predicted in forward-looking statements. Although management believes that the expectations reflected in the forward-looking statements are reasonable, forward-looking statements are not, and should not be relied upon as a guarantee of future performance or results, nor will they necessarily prove to be accurate indications of the times at which such performance or results will be achieved. The forward-looking statements included are made only as the date of the statement. 3D Systems undertakes no obligation to update or review any forward-looking statements made by management or on its behalf, whether as a result of future developments, subsequent events or circumstances or otherwise.

Presentation of Information in this Press Release
To facilitate a better understanding of the impact that strategic acquisitions, non-recurring charges and certain non-cash expenses had on its financial results, the company reported non-GAAP measures excluding the impact of amortization of intangibles, non-cash interest expense, acquisition and severance expenses, stock-based compensation expense, litigation settlements and charges related to strategic decisions and portfolio realignment. A reconciliation of GAAP to non-GAAP results is provided in the accompanying schedule.

About 3D Systems
3D Systems provides comprehensive 3D products and services, including 3D printers, print materials, on-demand manufacturing services and digital design tools. Its ecosystem supports advanced applications from the product design shop to the factory floor to the operating room. 3D Systems’ precision healthcare capabilities include simulation, Virtual Surgical Planning, and printing of medical and dental devices as well as patient-specific surgical instruments. As the originator of 3D printing and a shaper of future 3D solutions, 3D Systems has spent its 30 year history enabling professionals and companies to optimize their designs, transform their workflows, bring innovative products to market and drive new business models.

More information on the company is available at www.3dsystems.com

Tables Follow


3D Systems Corporation
Unaudited Condensed Consolidated Balance Sheets
December 31, 2019 and December 31, 2018

(In thousands, except par value) December 31, 2019December 31, 2018
ASSETS
Current assets:
Cash and cash equivalents$133,665  $109,998  
Accounts receivable, net of reserves — $8,762 (2019) and $8,423 (2018)109,408  126,618  
Inventories111,106  133,161  
Prepaid expenses and other current assets18,991  27,697  
Total current assets373,170  397,474  
Property and equipment, net a
92,940  107,718  
Intangible assets, net48,338  68,275  
Goodwill223,176  221,334  
Right of use assets36,890  —  
Deferred income tax asset5,408  4,217  
Other assets27,390  26,814  
Total assets$807,312  $825,832  
LIABILITIES AND EQUITY
Current liabilities:
Current portion of long term debt$2,506  $—  
Current right of use liabilities9,569  —  
Current portion of capitalized lease obligations—  654  
Accounts payable49,851  66,722  
Accrued and other liabilities63,095  59,265  
Customer deposits5,712  4,987  
Deferred revenue32,231  32,432  
Total current liabilities162,964  164,060  
Long-term debt, net of deferred financing costs45,215  25,000  
Long-term right of use liabilities35,402  —  
Long-term portion of capitalized lease obligations—  6,392  
Deferred income tax liability4,027  6,190  
Other liabilities45,808  39,331  
Total liabilities293,416  240,973  
Redeemable noncontrolling interests ("RNCI")—  8,872  
Commitments and contingencies
Stockholders’ equity:
Common stock, $0.001 par value, authorized 220,000 shares; issued 121,266 (2019) and 118,650 (2018)120  117  
Additional paid-in capital1,371,564  1,355,503  
Treasury stock, at cost — 3,670 shares (2019) and 2,946 shares (2018)(18,769) (15,572) 
Accumulated deficit(793,709) (722,701) 
Accumulated other comprehensive loss(37,047) (38,978) 
Total 3D Systems Corporation stockholders' equity522,159  578,369  
Noncontrolling interests(8,263) (2,382) 
Total stockholders’ equity513,896  575,987  
Total liabilities, redeemable noncontrolling interests and stockholders’ equity$807,312  $825,832  

(a) Prior year balance includes $4,466 of capitalized lease assets accounted for under ASC 840.


3D Systems Corporation
Unaudited Condensed Consolidated Statements of Operations
Quarter and Year Ended December 31, 2019 and 2018

Quarter Ended December 31,Year Ended December 31,
(in thousands, except per share amounts)2019201820192018
Revenue:
Products$103,966  $113,062  $384,577  $429,215  
Services60,604  67,650  244,517  258,445  
Total revenue164,570  180,712  629,094  687,660  
Cost of sales:
Products63,012  61,731  229,821  229,793  
Services29,802  36,428  121,232  133,473  
Total cost of sales92,814  98,159  351,053  363,266  
Gross profit71,756  82,553  278,041  324,394  
Operating expenses:
Selling, general and administrative59,319  66,062  254,355  272,287  
Research and development17,136  23,510  80,790  95,298  
Total operating expenses76,455  89,572  335,145  367,585  
Loss from operations(4,699) (7,019) (57,104) (43,191) 
Interest and other (expense) income, net(1,222) (1,172) (7,996) (37) 
Loss before income taxes(5,921) (8,191) (65,100) (43,228) 
Benefit (provision) for income taxes1,260  4,051  (4,532) (2,035) 
Net loss(4,661) (4,140) (69,632) (45,263) 
Less: net income attributable to noncontrolling interests53  (4) 248  242  
Net loss attributable to 3D Systems Corporation$(4,714) $(4,136) $(69,880) $(45,505) 
Net loss per share available to 3D Systems Corporation common stockholders - basic and diluted$(0.04) $(0.04) $(0.61) $(0.41) 


3D Systems Corporation
Unaudited Condensed Consolidated Statements of Cash Flows
Year Ended December 31, 2019 and 2018
Year Ended December 31,
(in thousands)20192018
Cash flows from operating activities:
Net loss$(69,632) $(45,263) 
Adjustments to reconcile net loss to net cash provided by operating activities:
Depreciation and amortization50,396  59,293  
Stock-based compensation23,587  29,253  
Provision for bad debts1,308  1,824  
Loss on the disposition of property, equipment and other assets2,282  —  
Provision for deferred income taxes(3,354) (2,990) 
Impairment of assets1,728  1,998  
Changes in operating accounts:
Accounts receivable15,071  599  
Inventories18,447  (34,035) 
Prepaid expenses and other current assets9,150  40,922  
Accounts payable(16,846) 11,559  
Deferred revenue and customer deposits677  (2,383) 
Accrued and other current liabilities960  (47,851) 
All other operating activities(2,193) (8,130) 
Net cash provided by operating activities31,581  4,796  
Cash flows from investing activities:
Purchases of property and equipment(23,985) (40,694) 
Proceeds from sale of assets1,620  333  
Purchase of noncontrolling interest(2,500) —  
Other investing activities(2,007) (1,466) 
Net cash used in investing activities(26,872) (41,827) 
Cash flows from financing activities:
Proceeds from borrowings100,000  25,000  
Repayment of borrowings/long term debt(76,768) —  
Payments related to net-share settlement of stock based compensation(3,194) (7,367) 
Payments on earnout consideration—  (2,675) 
Other financing activities(1,338) (694) 
Net cash provided by financing activities18,700  14,264  
Effect of exchange rate changes on cash, cash equivalents and restricted cash289  (3,145) 
Net increase (decrease) in cash, cash equivalents and restricted cash23,698  (25,912) 
Cash, cash equivalents and restricted cash at the beginning of the period a
110,919  136,831  
Cash, cash equivalents and restricted cash at the end of the period a
$134,617  $110,919  

(a)The amounts for cash and cash equivalents shown above include restricted cash of $952 and $921 as of December 31, 2019 and 2018, respectively, which were included in other assets, net in the condensed consolidated balance sheets.

3D Systems Corporation
Loss Per Share
Quarter and Year Ended December 31, 2019 and 2018


Quarter Ended December 31,Year Ended December 31,
(in thousands, except per share amounts)2019201820192018
Numerator for basic and diluted net loss per share:
Net loss attributable to 3D Systems Corporation$(4,714) $(4,136) $(69,880) $(45,505) 
Denominator for basic and diluted net loss per share:
Weighted average shares114,476  113,016  113,811  112,327  
Net loss per share - basic and diluted$(0.04) $(0.04) $(0.61) $(0.41) 


3D Systems Corporation
Unaudited Reconciliations of GAAP to Non-GAAP Measures
Quarter and Year Ended December 31, 2019 and 2018

Quarter Ended December 31,Year Ended December 31,
(in millions, except per share amounts)2019201820192018
GAAP Net loss attributable to 3D Systems Corporation$(4.7) $(4.1) $(69.9) $(45.5) 
Adjustments:
Amortization, stock-based compensation & other (1)8.2  13.9  43.9  58.7  
Legal, acquisition and divestiture related (2)0.5  0.1  7.4  (2.0) 
Cost optimization plan, including severance costs (3)0.7  1.5  7.7  4.0  
Impairment of cost-method investments (4)0.9  —  1.2  1.4  
Non-GAAP net income attributable to 3D Systems Corporation$5.5  $11.4  $(9.6) $16.5  
Non-GAAP net income per share available to 3D Systems common stock holders - basic and diluted (5)$0.05  $0.10  $(0.08) $0.15  
(1) For the quarter ended December 31, 2019, the adjustment included $0.1 in COGS and $8.1 in SG&A. For the quarter ended December 31, 2018, the adjustment included $(0.2) in COGS and $14.1 in SG&A. For the year ended December 31, 2019, the adjustment included $0.4 in COGS and $43.4 in SG&A. For the year ended December 31, 2018, the adjustment included $0.1 in COGS and $58.6 in SG&A.
(2) For the quarter ended December 31, 2019, the adjustment included $0.1 in COGS and $1.4 in SG&A . For the year ended December 31, 2019, the adjustment included $(2.8) in Revenues, $4.1 in COGS, $5.5 in SG&A, and $0.7 in other income (expense). For the quarter ended December 31, 2018 the adjustment included $0.6 in COGS,$(1.0) in SG&A, and $0.5 in other income (expense) and for the year ended December 31, 2018, the adjustment included $0.6 in COGS, in SG&A $(1.7) and $(0.9) in other income (expense).
(3) For the quarter ended December 31, 2019, the adjustment included $0.6 in SG&A. For the quarter ended December 31, 2018, the adjustment included $0.7 in COGS and $0.8 in SG&A. For the year ended December 31, 2019, the adjustment included $1.8 in COGS, $5.6 in SG&A and $0.3 in R&D. For the year ended December 31, 2018, the adjustment included $1.1 in COGS, $2.4 in SG&A and $0.5 in R&D.
(4) For the quarter and year ended December 31, 2019 the adjustment included $0.9 and $1.2 in interest and other income (expense), net, respectively. For the year ended December 31, 2018, the adjustment included $1.4 in interest and other income (expense), net.
(5) Denominator based on weighted average shares used in the GAAP EPS calculation.

* Tables may not foot due to rounding; amounts calculated based on dollars in thousands.


EXHIBIT 99.2 Fourth Quarter & Full Year 2019 Financial Results February 26, 2020

 
Welcome and Participants Vyomesh Joshi President and Chief Executive Officer Todd Booth To participate via phone, Executive Vice President and Chief Financial Officer please dial: Andrew Johnson 1-201-689-8345 Executive Vice President and Chief Legal Officer Melanie Solomon Investor Relations 2

 
Forward Looking Statements This presentation contains certain statements that are not statements of historical or current facts are forward-looking statements within the meaning of the Private Securities Litigation Reform Act of 1995. Forward-looking statements include statements concerning plans, objectives, goals, strategies, expectations, intentions, projections, developments, future events, performance or products, underlying assumptions, and other statements which are other than statements of historical facts. In some cases, you can identify forward-looking statements by terms such as “believes,” “beliefs,” ''may,'' ''will,'' ''should,'' expects,'' ''intends,'' ''plans,'' ''anticipates,'' ''estimates,'' ''predicts,'' ''projects,'' ''potential,'' ''continue,'' and other similar terminology or the negative of these terms. From time to time, we may publish or otherwise make available forward-looking statements of this nature. All such forward-looking statements, whether written or oral, and whether made by us or on our behalf, are expressly qualified by the cautionary statements described on this message including those set forth below. Forward-looking statements are based upon management’s beliefs, assumptions and current expectations concerning future events and trends, using information currently available, and are necessarily subject to uncertainties, many of which are outside our control. In addition, we undertake no obligation to update or revise any forward-looking statements made by us or on our behalf, whether as a result of future developments, subsequent events or circumstances, or otherwise, or to reflect the occurrence or likelihood of unanticipated events, and we disclaim any such obligation. Forward-looking statements are only predictions that relate to future events or our future performance and are subject to known and unknown risks, uncertainties, assumptions, and other factors, many of which are beyond our control, that may cause actual results, outcomes, levels of activity, performance, developments, or achievements to be materially different from any future results, outcomes, levels of activity, performance, developments, or achievements expressed, anticipated, or implied by these forward-looking statements. Although we believe that the expectations reflected in the forward-looking statements are reasonable, forward-looking statements are not, and should not be relied upon as a guarantee of future performance or results, nor will they necessarily prove to be accurate indications of the times at or by which any such performance or results will be achieved. 3D System’s actual results could differ materially from those stated or implied in forward-looking statements. Past performance is not necessarily indicative of future results. We do not undertake any obligation to and do not intend to update any forward-looking statements whether as a result of future developments, subsequent events or circumstances or otherwise. Further, we encourage you to review “Risk Factors” in Part 1 of our Annual Report on Form 10-K and Part II of our quarterly reports on Form 10-Q filed with the SEC as well as other information about us in our filings with the SEC. These are available at www.SEC.gov. 3

 
Vyomesh Joshi (VJ) President & Chief Executive Officer
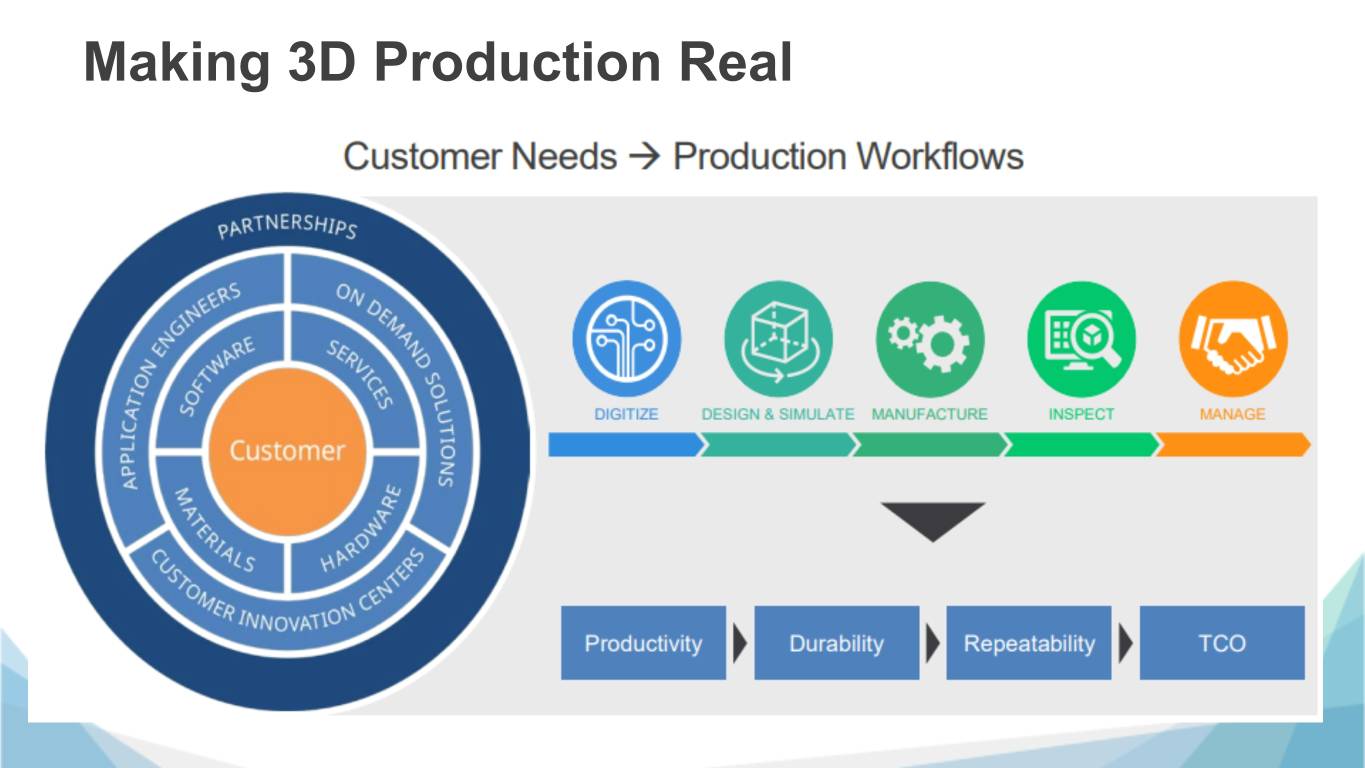

 
Making 3D Production Real
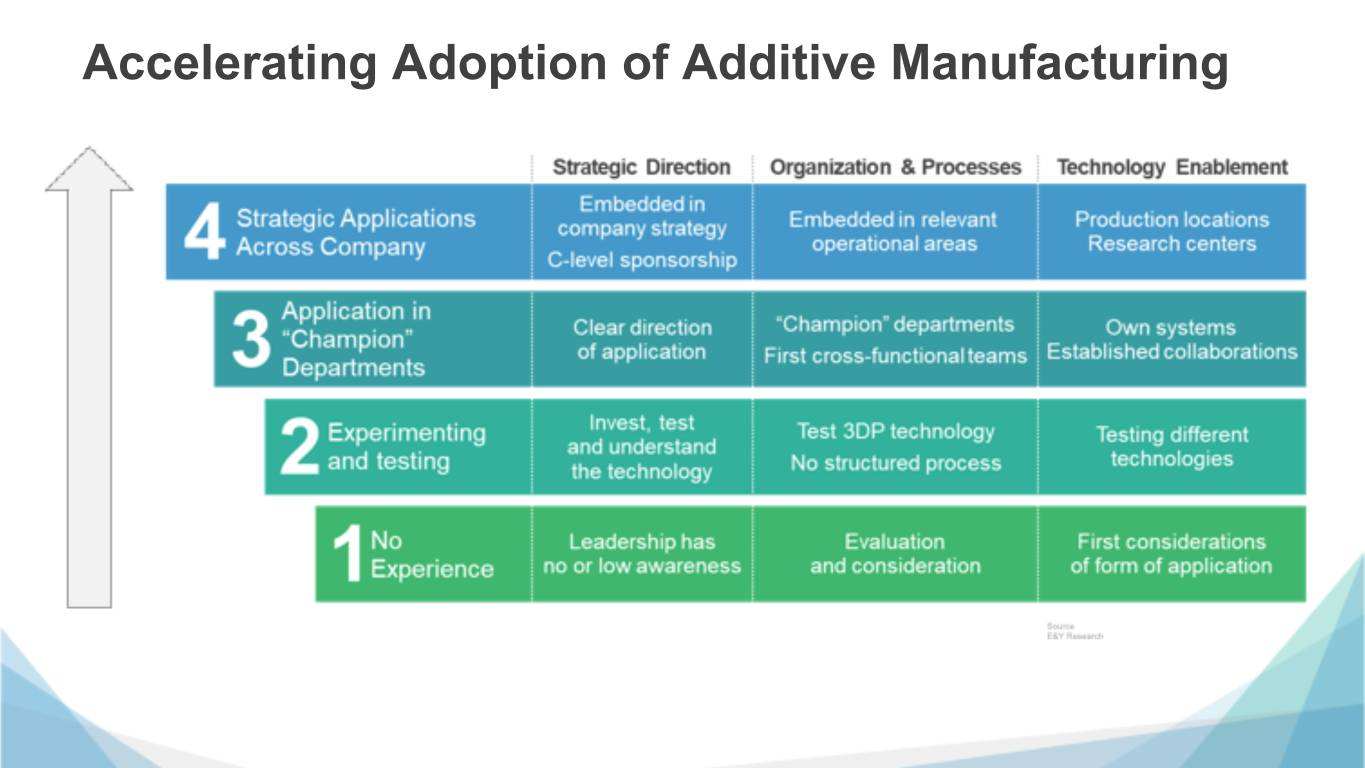

 
Accelerating Adoption of Additive Manufacturing
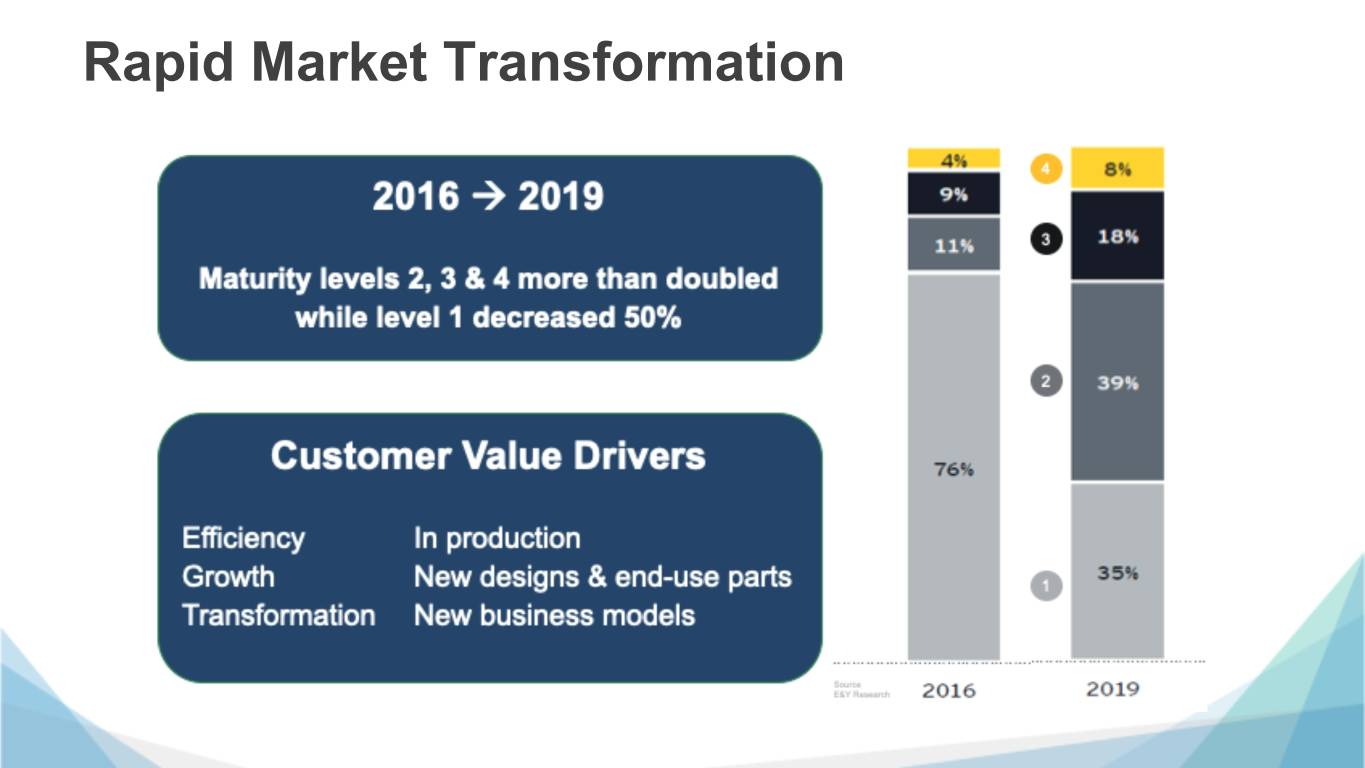

 
Rapid Market Transformation
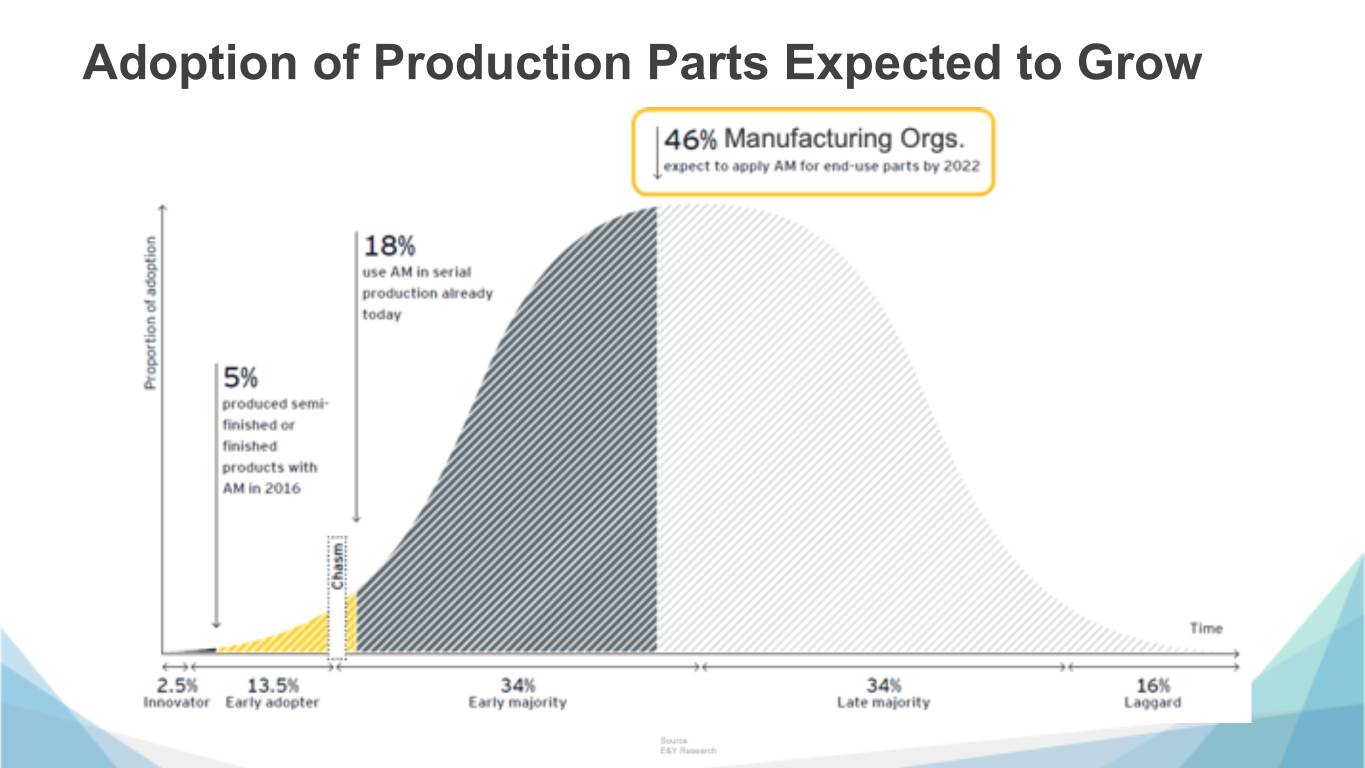

 
Adoption of Production Parts Expected to Grow
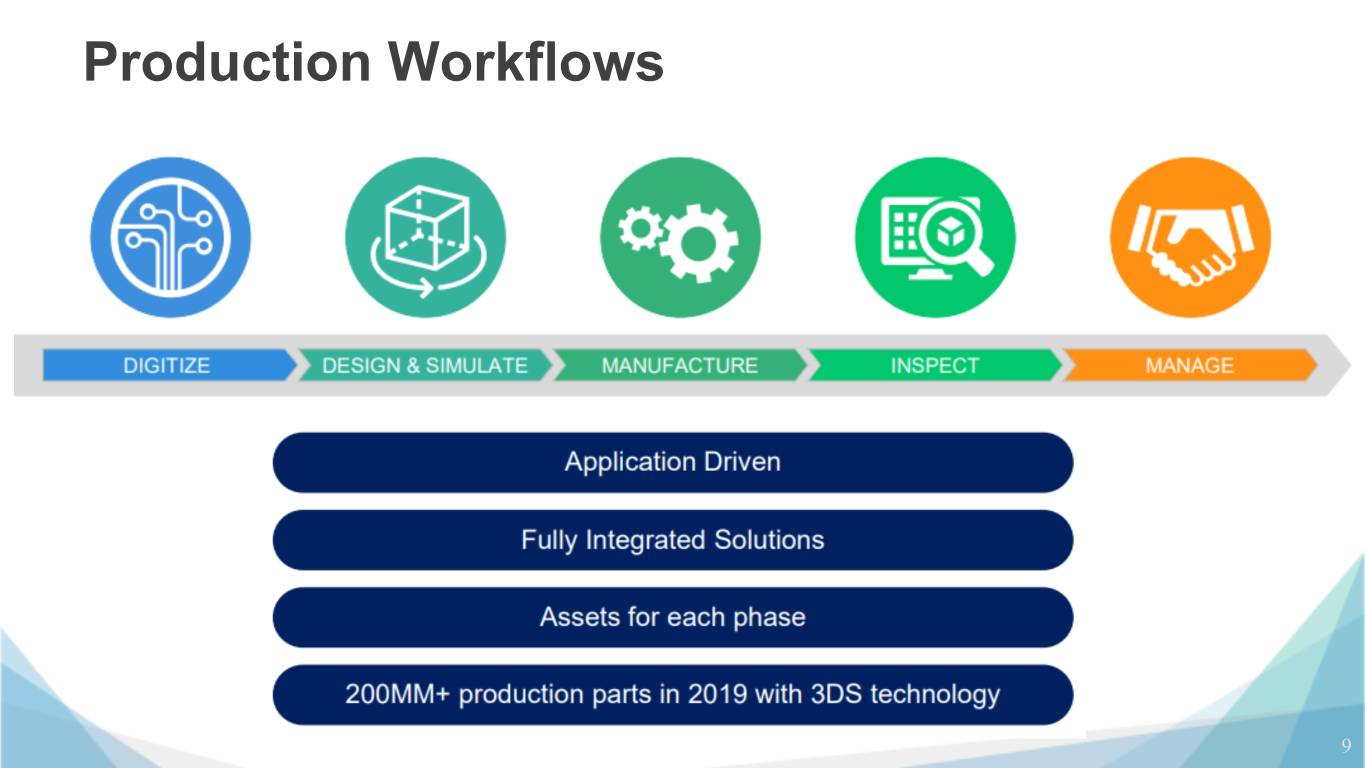

 
Production Workflows 9
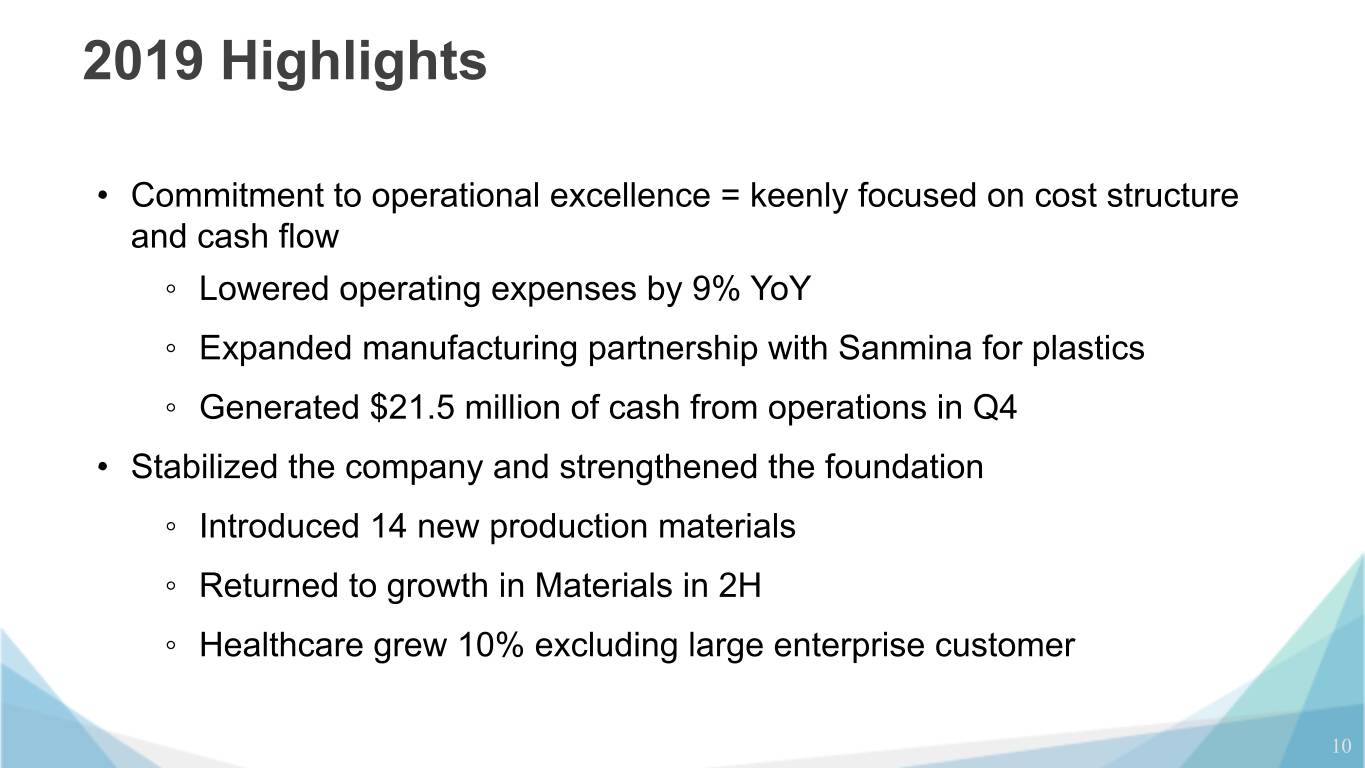

 
2019 Highlights • Commitment to operational excellence = keenly focused on cost structure and cash flow ◦ Lowered operating expenses by 9% YoY ◦ Expanded manufacturing partnership with Sanmina for plastics ◦ Generated $21.5 million of cash from operations in Q4 • Stabilized the company and strengthened the foundation ◦ Introduced 14 new production materials ◦ Returned to growth in Materials in 2H ◦ Healthcare grew 10% excluding large enterprise customer 10
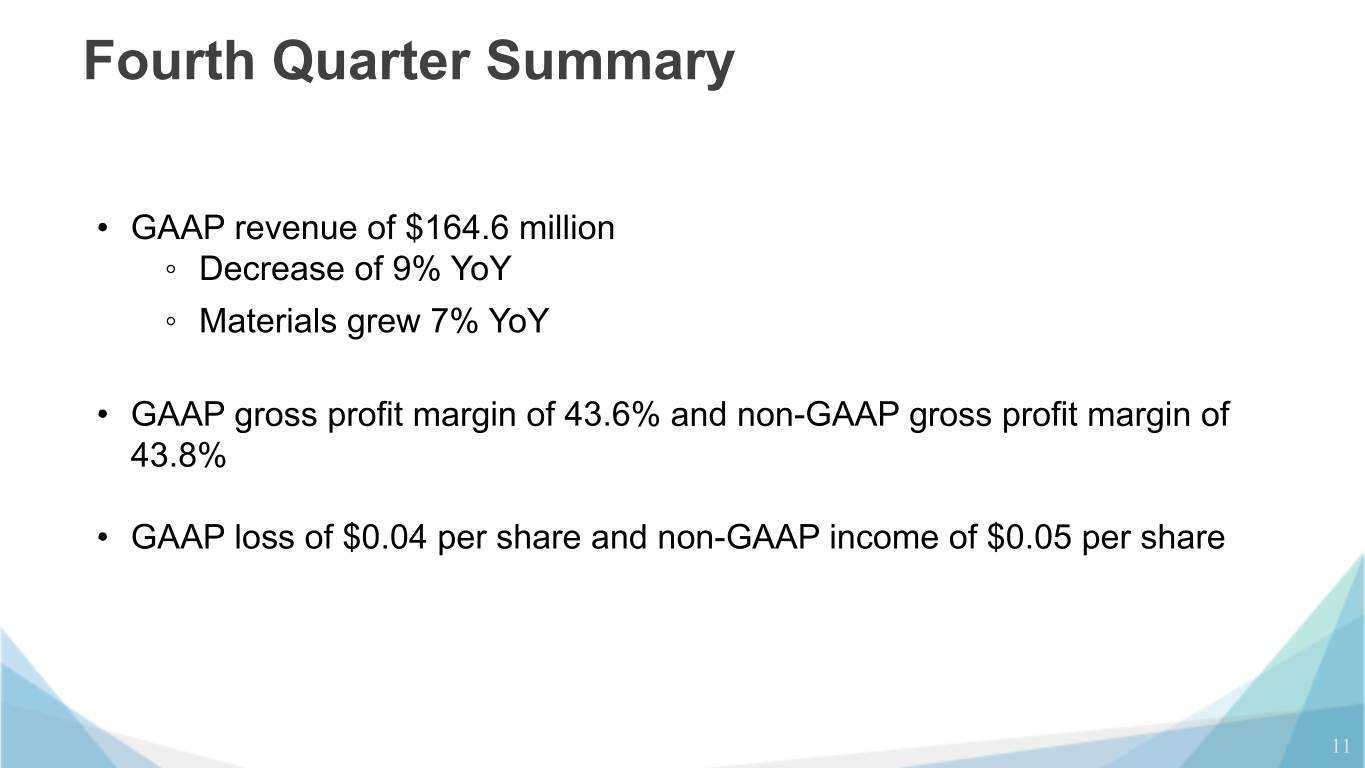

 
Fourth Quarter Summary • GAAP revenue of $164.6 million ◦ Decrease of 9% YoY ◦ Materials grew 7% YoY • GAAP gross profit margin of 43.6% and non-GAAP gross profit margin of 43.8% • GAAP loss of $0.04 per share and non-GAAP income of $0.05 per share 11
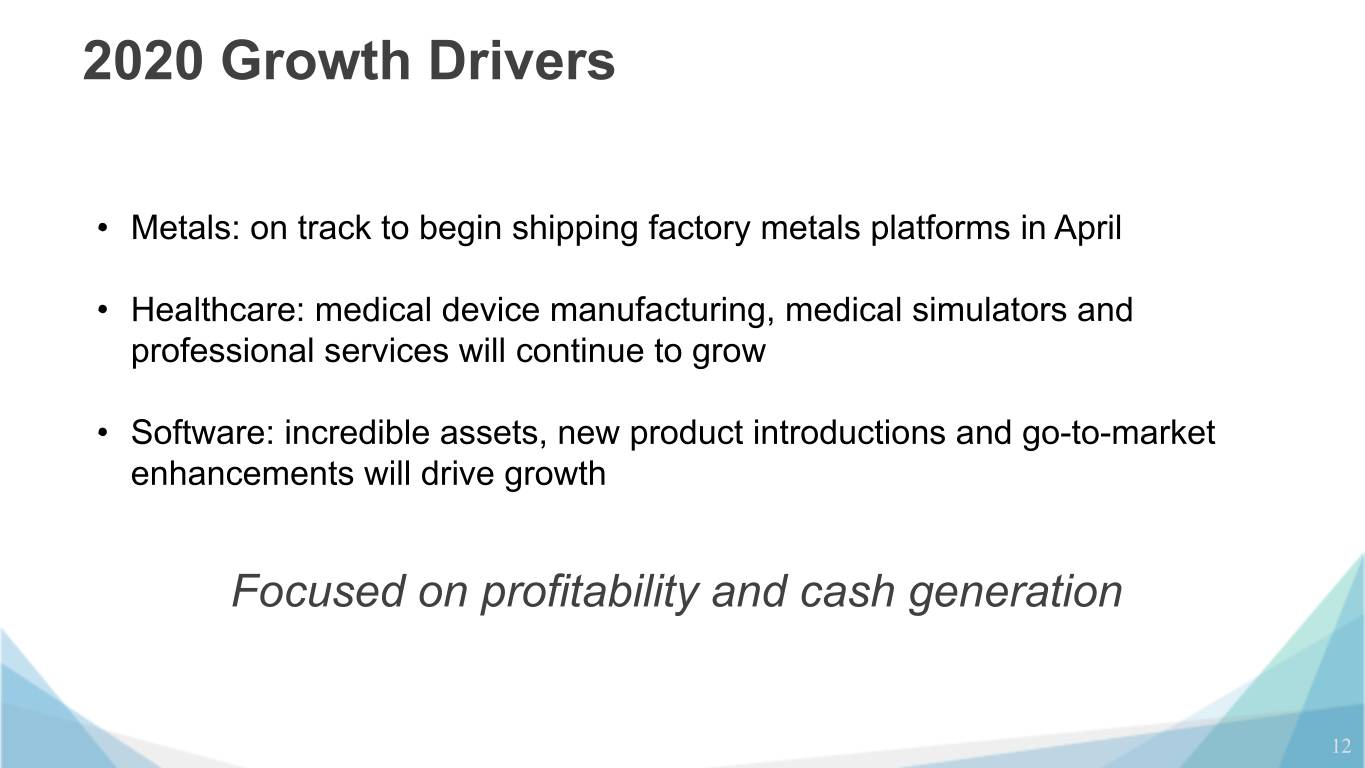

 
2020 Growth Drivers • Metals: on track to begin shipping factory metals platforms in April • Healthcare: medical device manufacturing, medical simulators and professional services will continue to grow • Software: incredible assets, new product introductions and go-to-market enhancements will drive growth Focused on profitability and cash generation 12

 
Todd Booth Executive Vice President & Chief Financial Officer
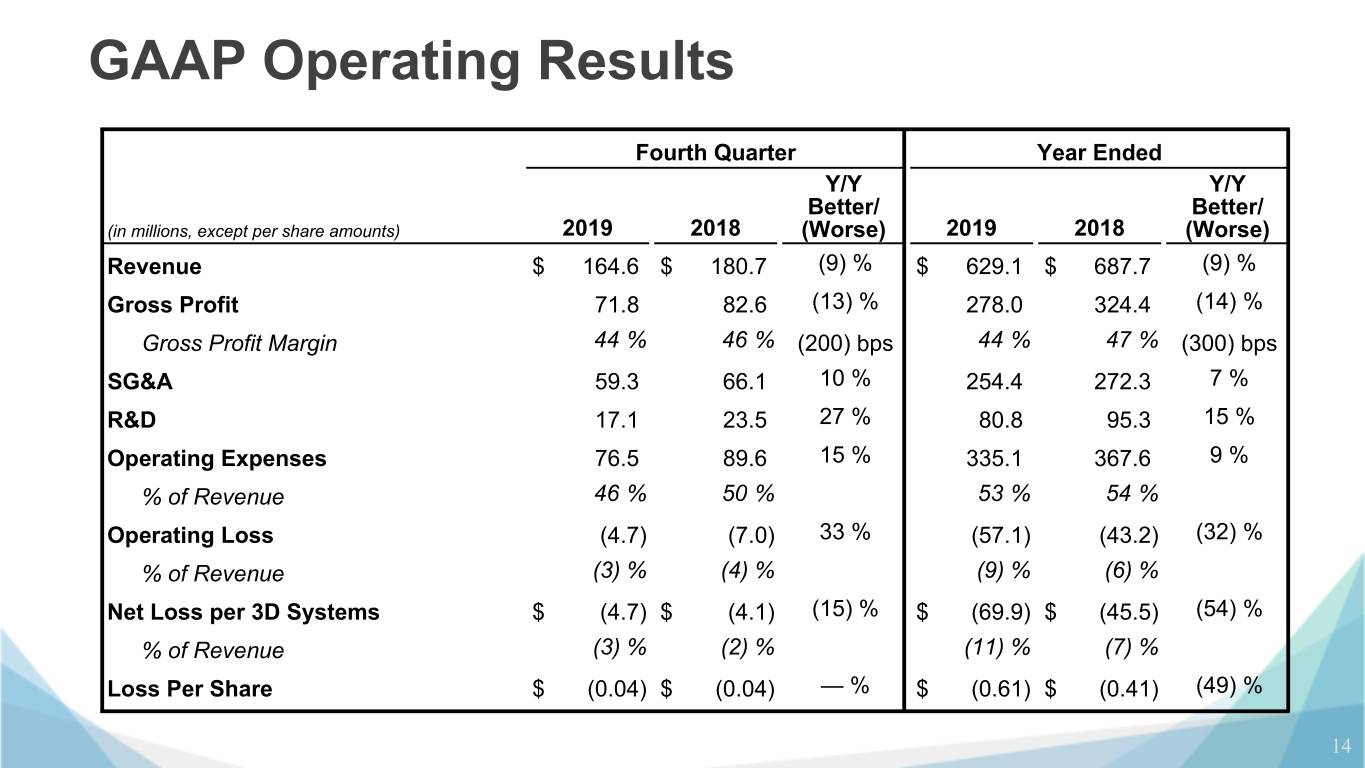

 
GAAP Operating Results Fourth Quarter Year Ended Y/Y Y/Y Better/ Better/ (in millions, except per share amounts) 2019 2018 (Worse) 2019 2018 (Worse) Revenue $ 164.6 $ 180.7 (9) % $ 629.1 $ 687.7 (9) % Gross Profit 71.8 82.6 (13) % 278.0 324.4 (14) % Gross Profit Margin 44 % 46 % (200) bps 44 % 47 % (300) bps SG&A 59.3 66.1 10 % 254.4 272.3 7 % R&D 17.1 23.5 27 % 80.8 95.3 15 % Operating Expenses 76.5 89.6 15 % 335.1 367.6 9 % % of Revenue 46 % 50 % 53 % 54 % Operating Loss (4.7) (7.0) 33 % (57.1) (43.2) (32) % % of Revenue (3) % (4) % (9) % (6) % Net Loss per 3D Systems $ (4.7) $ (4.1) (15) % $ (69.9) $ (45.5) (54) % % of Revenue (3) % (2) % (11) % (7) % Loss Per Share $ (0.04) $ (0.04) — % $ (0.61) $ (0.41) (49) % 14
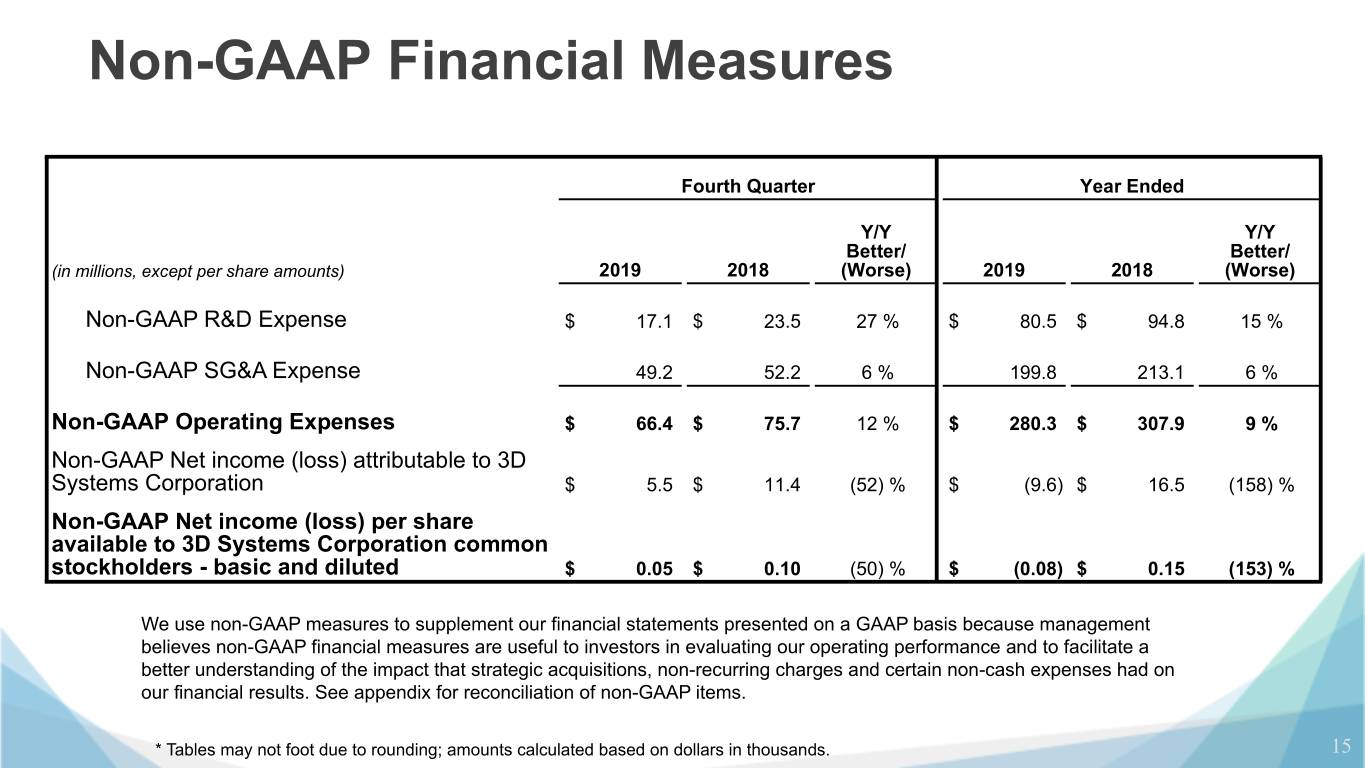

 
Non-GAAP Financial Measures Fourth Quarter Year Ended Y/Y Y/Y Better/ Better/ (in millions, except per share amounts) 2019 2018 (Worse) 2019 2018 (Worse) Non-GAAP R&D Expense $ 17.1 $ 23.5 27 % $ 80.5 $ 94.8 15 % Non-GAAP SG&A Expense 49.2 52.2 6 % 199.8 213.1 6 % Non-GAAP Operating Expenses $ 66.4 $ 75.7 12 % $ 280.3 $ 307.9 9 % Non-GAAP Net income (loss) attributable to 3D Systems Corporation $ 5.5 $ 11.4 (52) % $ (9.6) $ 16.5 (158) % Non-GAAP Net income (loss) per share available to 3D Systems Corporation common stockholders - basic and diluted $ 0.05 $ 0.10 (50) % $ (0.08) $ 0.15 (153) % We use non-GAAP measures to supplement our financial statements presented on a GAAP basis because management believes non-GAAP financial measures are useful to investors in evaluating our operating performance and to facilitate a better understanding of the impact that strategic acquisitions, non-recurring charges and certain non-cash expenses had on our financial results. See appendix for reconciliation of non-GAAP items. * Tables may not foot due to rounding; amounts calculated based on dollars in thousands. 15
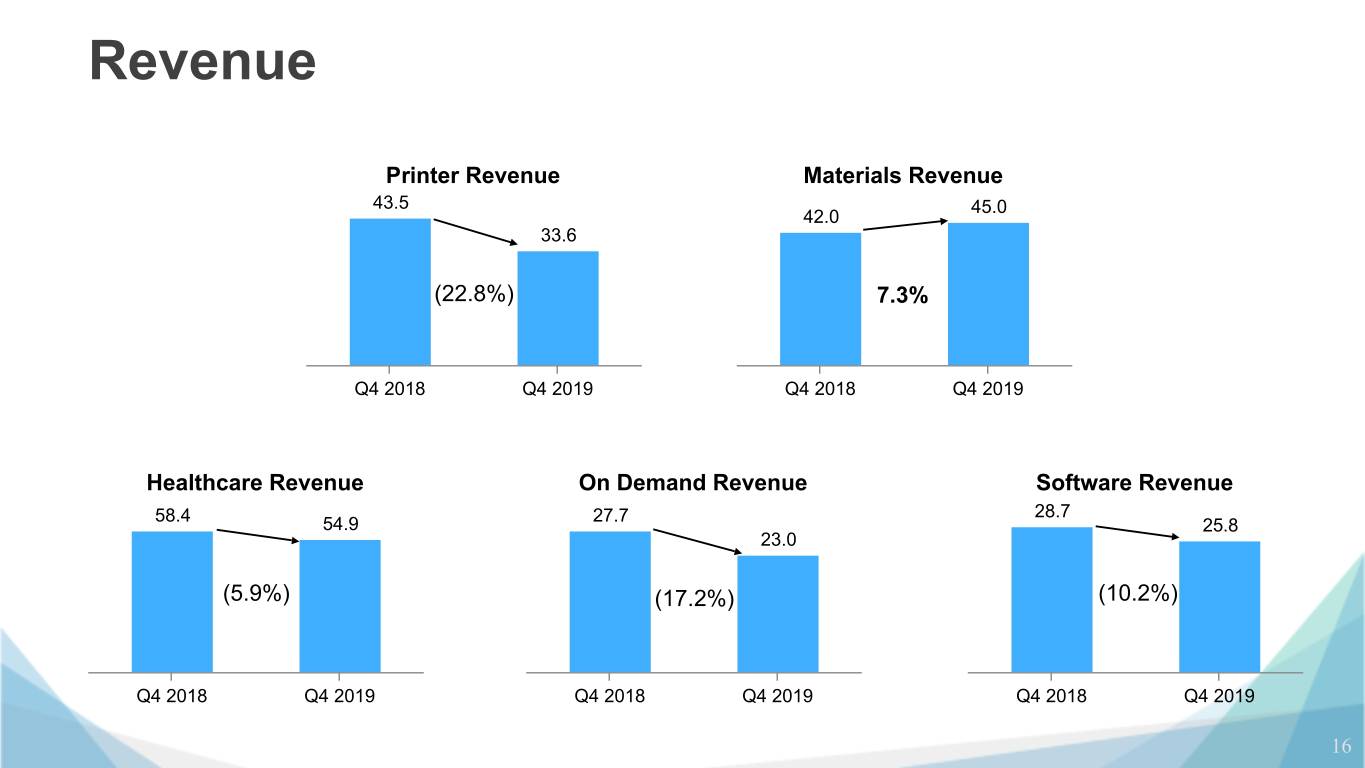

 
Revenue Printer Revenue Materials Revenue 43.5 45.0 42.0 33.6 (22.8%) 7.3% Q4 2018 Q4 2019 Q4 2018 Q4 2019 Healthcare Revenue On Demand Revenue Software Revenue 58.4 27.7 28.7 54.9 25.8 23.0 (5.9%) (17.2%) (10.2%) Q4 2018 Q4 2019 Q4 2018 Q4 2019 Q4 2018 Q4 2019 16
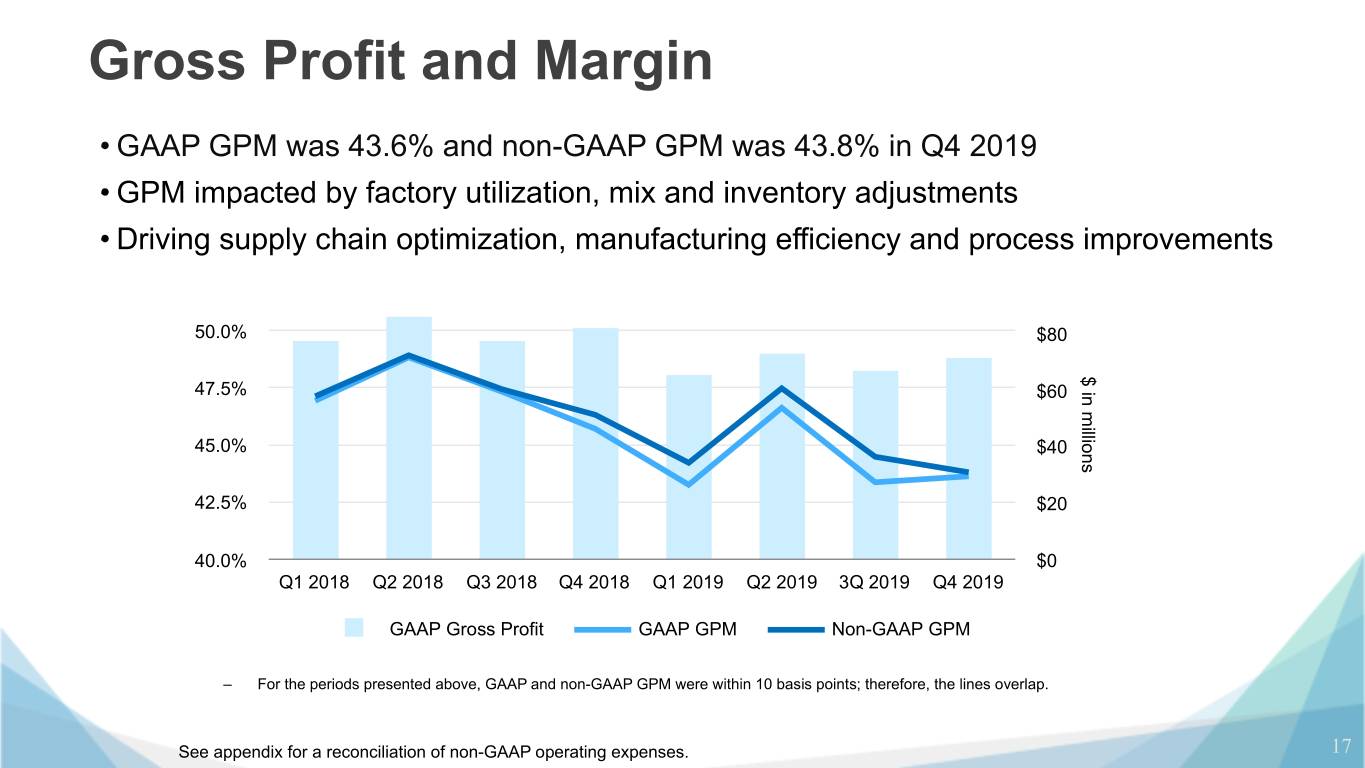

 
Gross Profit and Margin • GAAP GPM was 43.6% and non-GAAP GPM was 43.8% in Q4 2019 • GPM impacted by factory utilization, mix and inventory adjustments • Driving supply chain optimization, manufacturing efficiency and process improvements 50.0% $80 $ in millions 47.5% $60 45.0% $40 42.5% $20 40.0% $0 Q1 2018 Q2 2018 Q3 2018 Q4 2018 Q1 2019 Q2 2019 3Q 2019 Q4 2019 GAAP Gross Profit GAAP GPM Non-GAAP GPM – For the periods presented above, GAAP and non-GAAP GPM were within 10 basis points; therefore, the lines overlap. See appendix for a reconciliation of non-GAAP operating expenses. 17
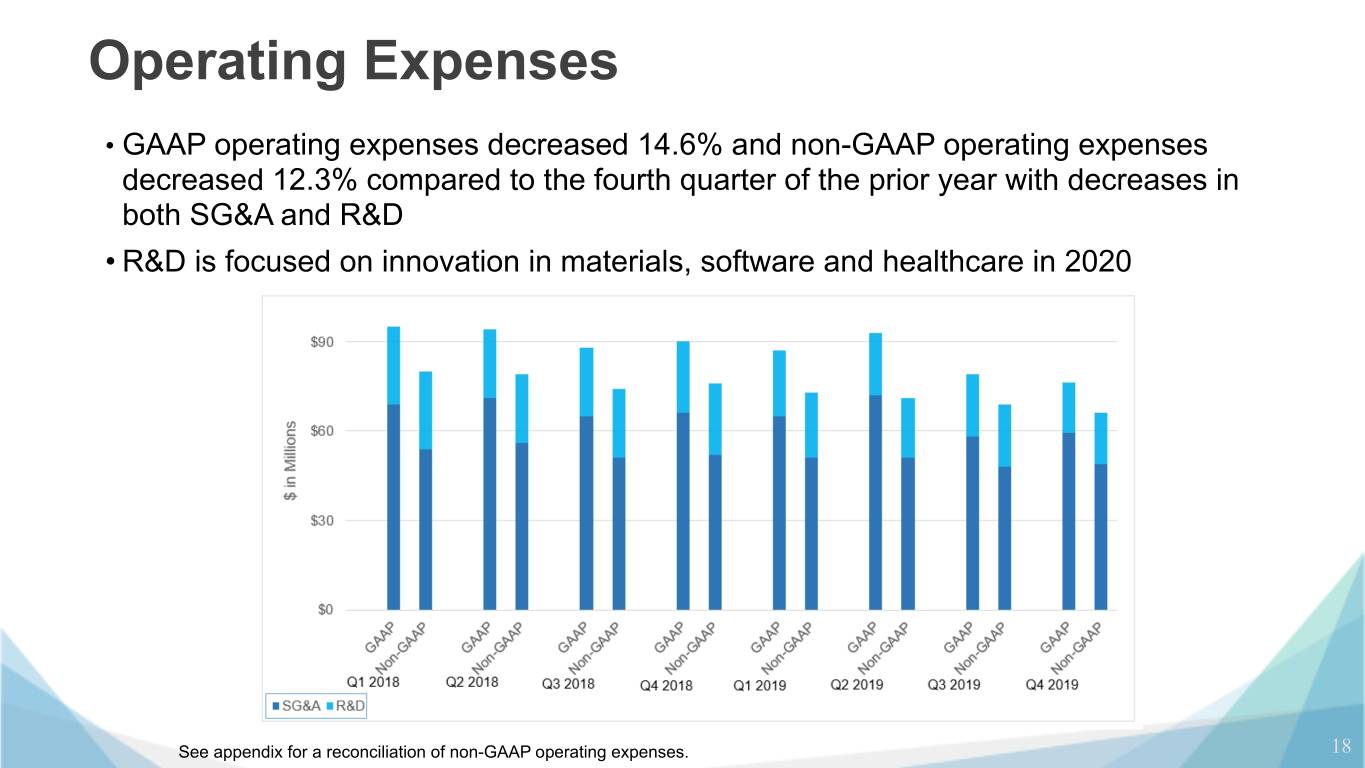

 
Operating Expenses • GAAP operating expenses decreased 14.6% and non-GAAP operating expenses decreased 12.3% compared to the fourth quarter of the prior year with decreases in both SG&A and R&D • R&D is focused on innovation in materials, software and healthcare in 2020 See appendix for a reconciliation of non-GAAP operating expenses. 18

 
Balance Sheet and Cash • Ended 2019 with $133.7 million of unrestricted cash, after paying down $10.8 million on the term loan • Generated $21.5 million of cash from operations • Working capital performance improved sequentially, as we reduced inventory by $11.6 million • While cash use and generation will fluctuate, we are pleased with the cash results in the fourth quarter 19

 
Vyomesh Joshi (VJ) President & Chief Executive Officer

 
Conclusion • Spent the last 4 years improving product, processes, cost structure and culture ◦ Improved quality and reliability ◦ Net promoter score increased to 65 ◦ Confident that we have the right products and team to execute strategy • Committed to working with the board to find appropriate successor and assist with the transition • Focus on innovative production workflows including hardware platforms, materials, software and professional services will drive profitable revenue growth in 2020 21

 
Q&A Session 1-201-689-8345

 
Thank You

 
Appendix
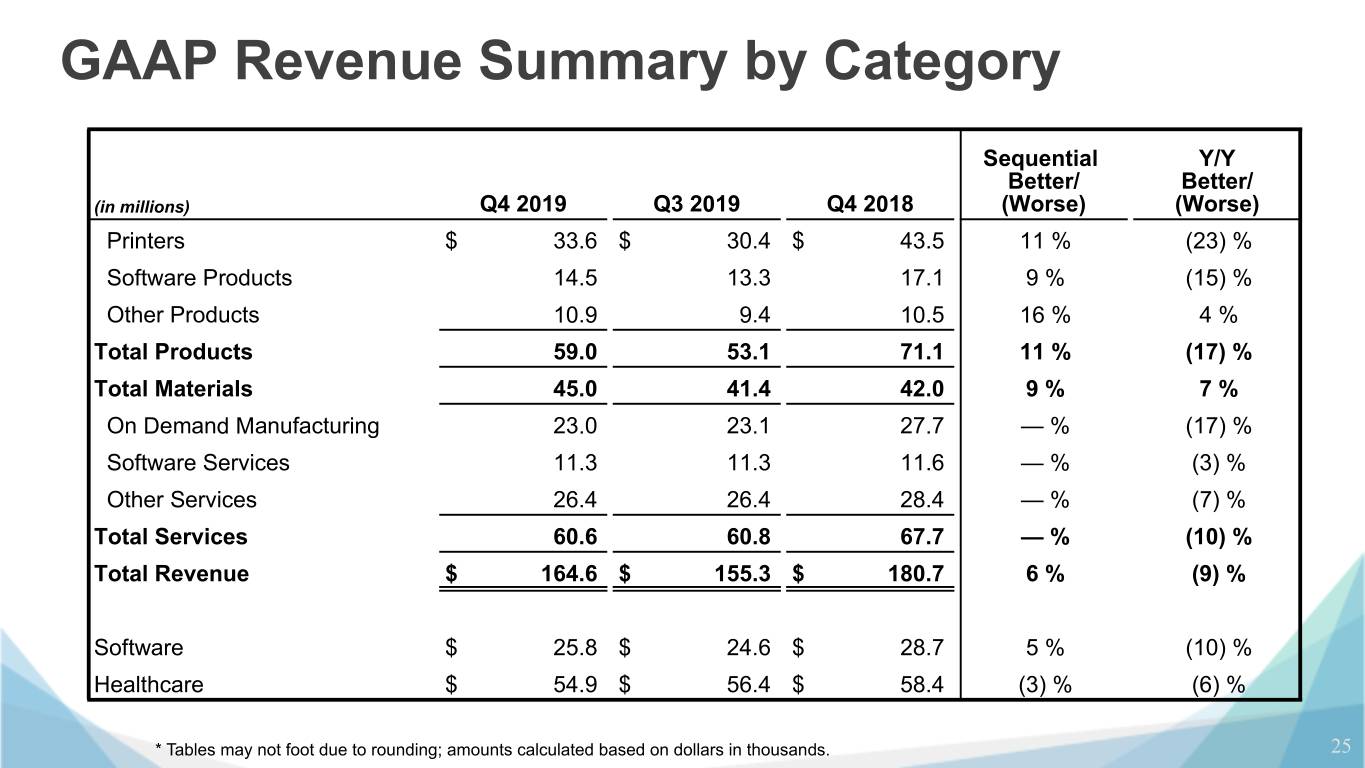

 
GAAP Revenue Summary by Category Sequential Y/Y Better/ Better/ (in millions) Q4 2019 Q3 2019 Q4 2018 (Worse) (Worse) Printers $ 33.6 $ 30.4 $ 43.5 11 % (23) % Software Products 14.5 13.3 17.1 9 % (15) % Other Products 10.9 9.4 10.5 16 % 4 % Total Products 59.0 53.1 71.1 11 % (17) % Total Materials 45.0 41.4 42.0 9 % 7 % On Demand Manufacturing 23.0 23.1 27.7 — % (17) % Software Services 11.3 11.3 11.6 — % (3) % Other Services 26.4 26.4 28.4 — % (7) % Total Services 60.6 60.8 67.7 — % (10) % Total Revenue $ 164.6 $ 155.3 $ 180.7 6 % (9) % Software $ 25.8 $ 24.6 $ 28.7 5 % (10) % Healthcare $ 54.9 $ 56.4 $ 58.4 (3) % (6) % * Tables may not foot due to rounding; amounts calculated based on dollars in thousands. 25
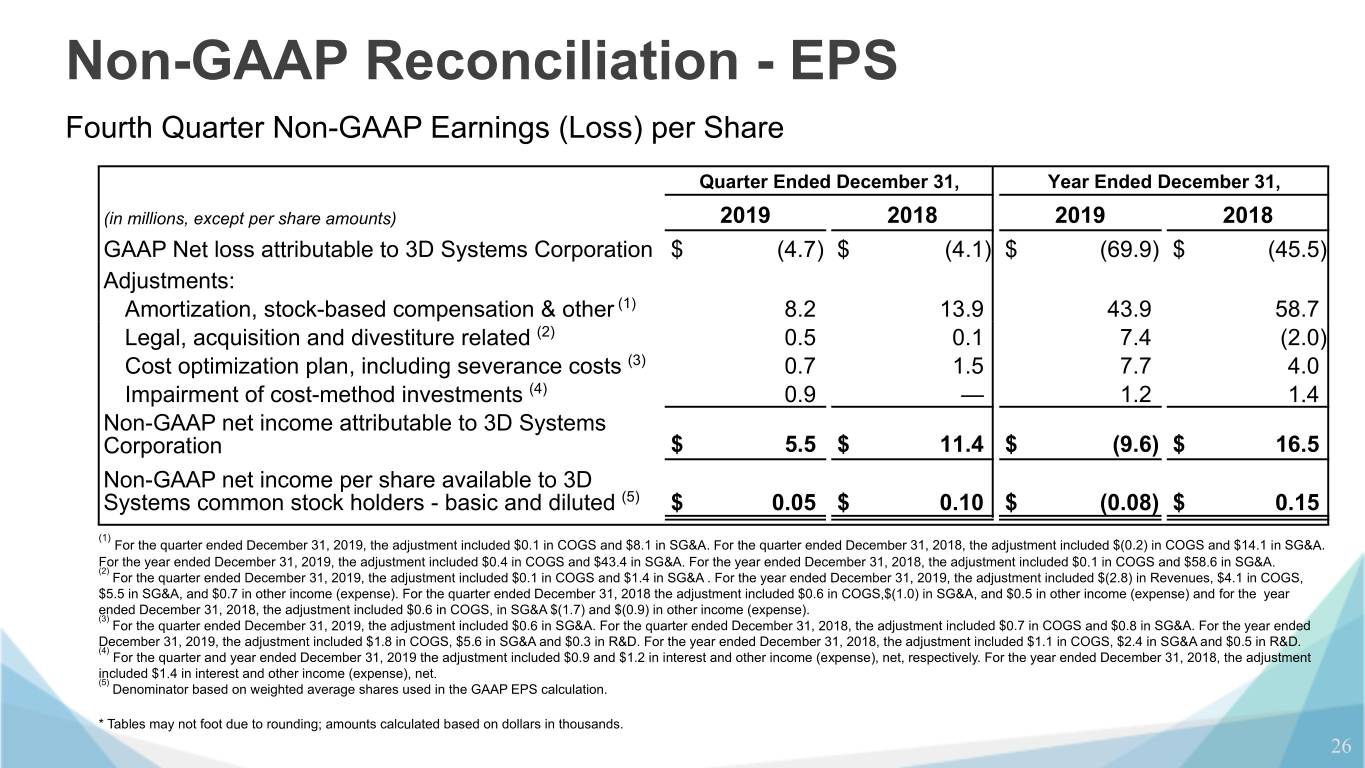

 
Non-GAAP Reconciliation - EPS Fourth Quarter Non-GAAP Earnings (Loss) per Share Quarter Ended December 31, Year Ended December 31, (in millions, except per share amounts) 2019 2018 2019 2018 GAAP Net loss attributable to 3D Systems Corporation $ (4.7) $ (4.1) $ (69.9) $ (45.5) Adjustments: Amortization, stock-based compensation & other (1) 8.2 13.9 43.9 58.7 Legal, acquisition and divestiture related (2) 0.5 0.1 7.4 (2.0) Cost optimization plan, including severance costs (3) 0.7 1.5 7.7 4.0 Impairment of cost-method investments (4) 0.9 — 1.2 1.4 Non-GAAP net income attributable to 3D Systems Corporation $ 5.5 $ 11.4 $ (9.6) $ 16.5 Non-GAAP net income per share available to 3D Systems common stock holders - basic and diluted (5) $ 0.05 $ 0.10 $ (0.08) $ 0.15 (1) For the quarter ended December 31, 2019, the adjustment included $0.1 in COGS and $8.1 in SG&A. For the quarter ended December 31, 2018, the adjustment included $(0.2) in COGS and $14.1 in SG&A. For the year ended December 31, 2019, the adjustment included $0.4 in COGS and $43.4 in SG&A. For the year ended December 31, 2018, the adjustment included $0.1 in COGS and $58.6 in SG&A. (2) For the quarter ended December 31, 2019, the adjustment included $0.1 in COGS and $1.4 in SG&A . For the year ended December 31, 2019, the adjustment included $(2.8) in Revenues, $4.1 in COGS, $5.5 in SG&A, and $0.7 in other income (expense). For the quarter ended December 31, 2018 the adjustment included $0.6 in COGS,$(1.0) in SG&A, and $0.5 in other income (expense) and for the year ended December 31, 2018, the adjustment included $0.6 in COGS, in SG&A $(1.7) and $(0.9) in other income (expense). (3) For the quarter ended December 31, 2019, the adjustment included $0.6 in SG&A. For the quarter ended December 31, 2018, the adjustment included $0.7 in COGS and $0.8 in SG&A. For the year ended December 31, 2019, the adjustment included $1.8 in COGS, $5.6 in SG&A and $0.3 in R&D. For the year ended December 31, 2018, the adjustment included $1.1 in COGS, $2.4 in SG&A and $0.5 in R&D. (4) For the quarter and year ended December 31, 2019 the adjustment included $0.9 and $1.2 in interest and other income (expense), net, respectively. For the year ended December 31, 2018, the adjustment included $1.4 in interest and other income (expense), net. (5) Denominator based on weighted average shares used in the GAAP EPS calculation. * Tables may not foot due to rounding; amounts calculated based on dollars in thousands. 26
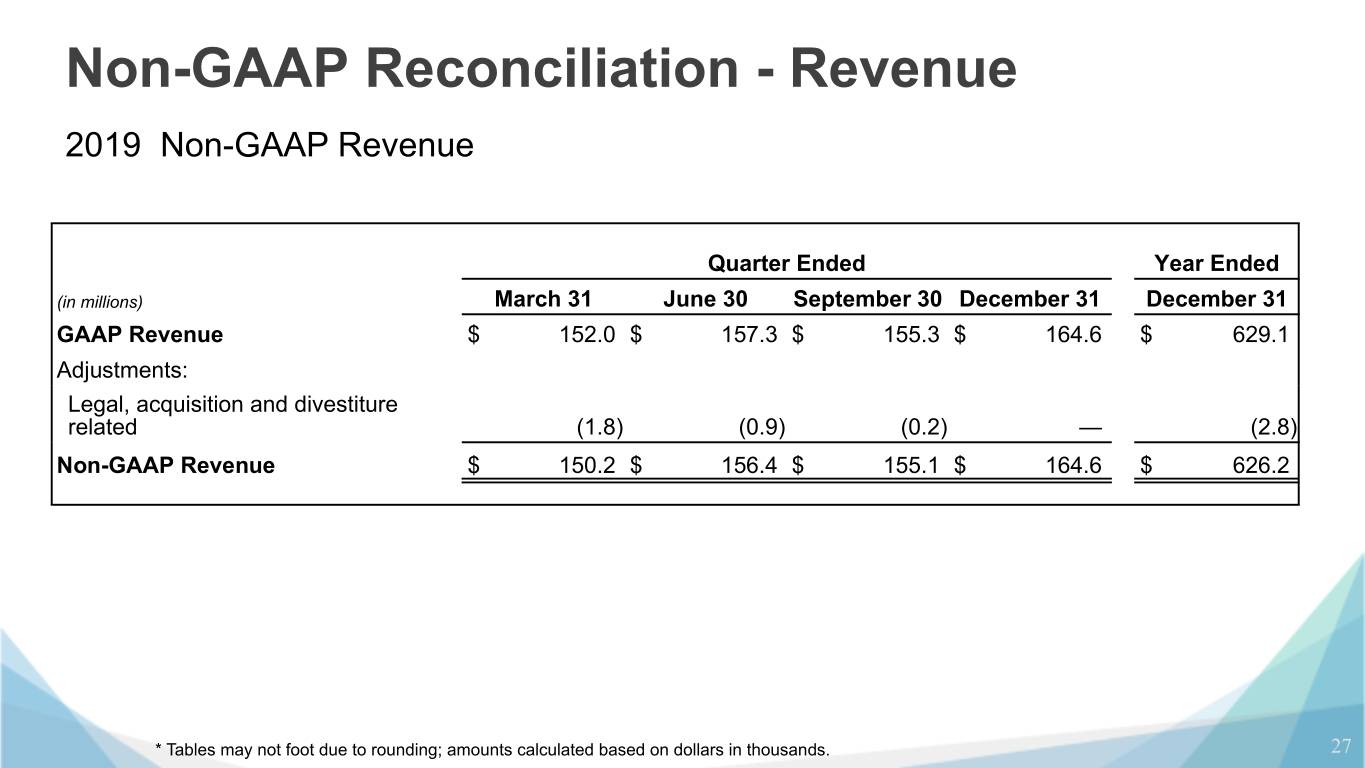

 
Non-GAAP Reconciliation - Revenue 2019 Non-GAAP Revenue Quarter Ended Year Ended (in millions) March 31 June 30 September 30 December 31 December 31 GAAP Revenue $ 152.0 $ 157.3 $ 155.3 $ 164.6 $ 629.1 Adjustments: Legal, acquisition and divestiture related (1.8) (0.9) (0.2) — (2.8) Non-GAAP Revenue $ 150.2 $ 156.4 $ 155.1 $ 164.6 $ 626.2 * Tables may not foot due to rounding; amounts calculated based on dollars in thousands. 27
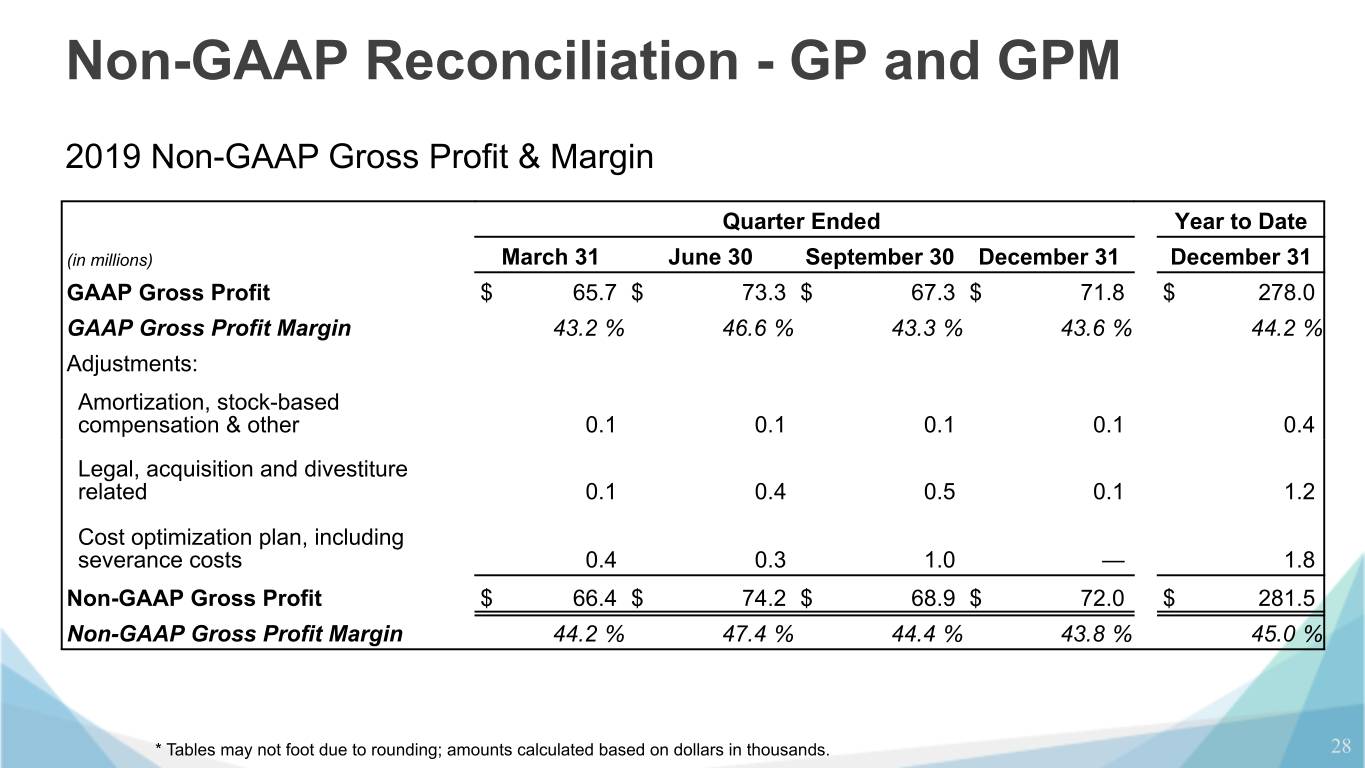

 
Non-GAAP Reconciliation - GP and GPM 2019 Non-GAAP Gross Profit & Margin Quarter Ended Year to Date (in millions) March 31 June 30 September 30 December 31 December 31 GAAP Gross Profit $ 65.7 $ 73.3 $ 67.3 $ 71.8 $ 278.0 GAAP Gross Profit Margin 43.2 % 46.6 % 43.3 % 43.6 % 44.2 % Adjustments: Amortization, stock-based compensation & other 0.1 0.1 0.1 0.1 0.4 Legal, acquisition and divestiture related 0.1 0.4 0.5 0.1 1.2 Cost optimization plan, including severance costs 0.4 0.3 1.0 — 1.8 Non-GAAP Gross Profit $ 66.4 $ 74.2 $ 68.9 $ 72.0 $ 281.5 Non-GAAP Gross Profit Margin 44.2 % 47.4 % 44.4 % 43.8 % 45.0 % * Tables may not foot due to rounding; amounts calculated based on dollars in thousands. 28
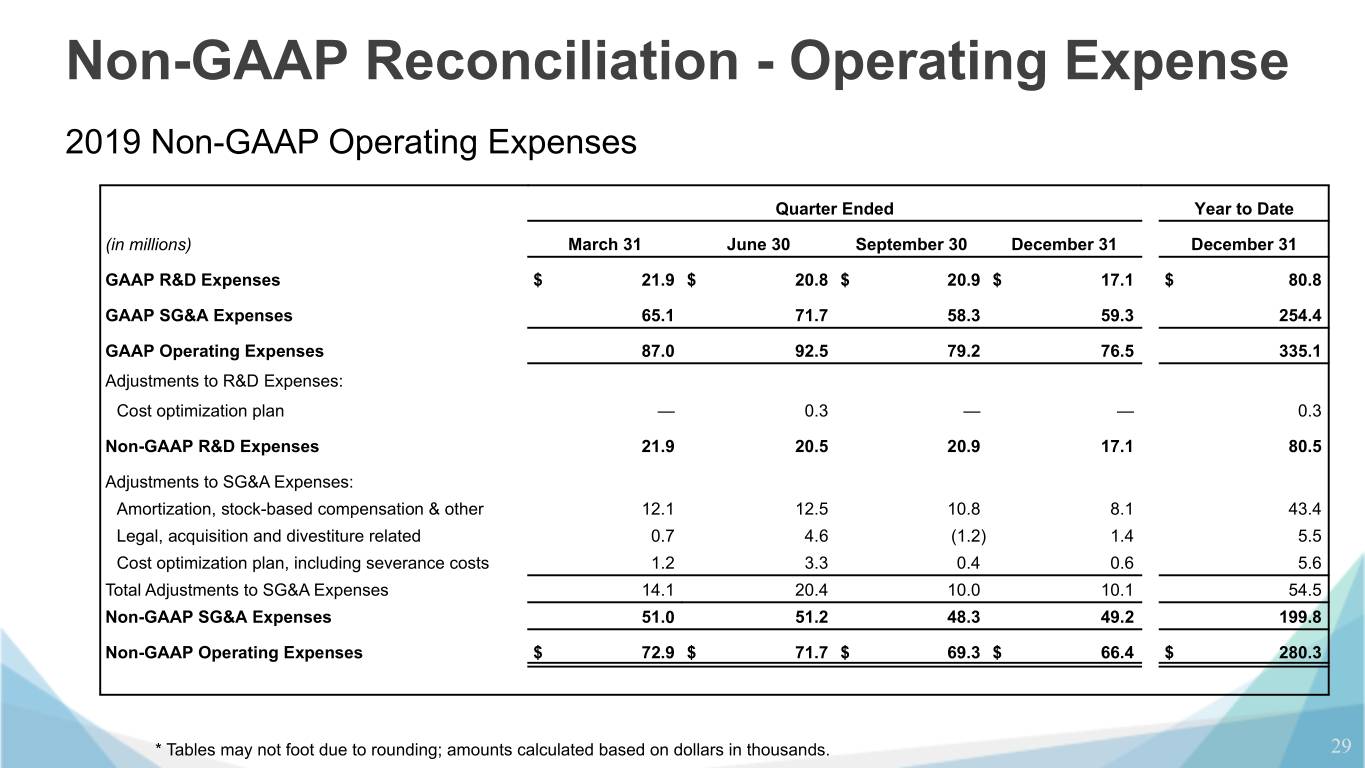

 
Non-GAAP Reconciliation - Operating Expense 2019 Non-GAAP Operating Expenses Quarter Ended Year to Date (in millions) March 31 June 30 September 30 December 31 December 31 GAAP R&D Expenses $ 21.9 $ 20.8 $ 20.9 $ 17.1 $ 80.8 GAAP SG&A Expenses 65.1 71.7 58.3 59.3 254.4 GAAP Operating Expenses 87.0 92.5 79.2 76.5 335.1 Adjustments to R&D Expenses: Cost optimization plan — 0.3 — — 0.3 Non-GAAP R&D Expenses 21.9 20.5 20.9 17.1 80.5 Adjustments to SG&A Expenses: Amortization, stock-based compensation & other 12.1 12.5 10.8 8.1 43.4 Legal, acquisition and divestiture related 0.7 4.6 (1.2) 1.4 5.5 Cost optimization plan, including severance costs 1.2 3.3 0.4 0.6 5.6 Total Adjustments to SG&A Expenses 14.1 20.4 10.0 10.1 54.5 Non-GAAP SG&A Expenses 51.0 51.2 48.3 49.2 199.8 Non-GAAP Operating Expenses $ 72.9 $ 71.7 $ 69.3 $ 66.4 $ 280.3 * Tables may not foot due to rounding; amounts calculated based on dollars in thousands. 29
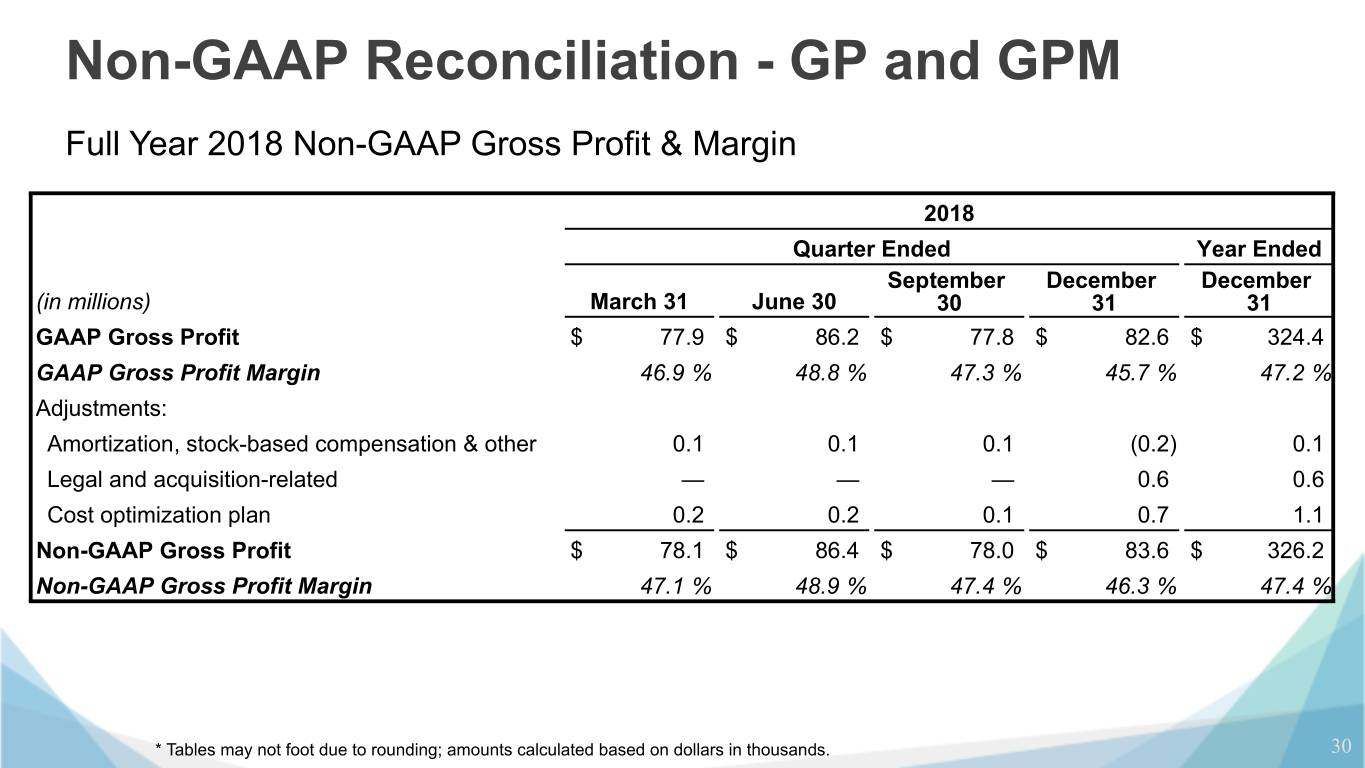

 
Non-GAAP Reconciliation - GP and GPM Full Year 2018 Non-GAAP Gross Profit & Margin 2018 Quarter Ended Year Ended September December December (in millions) March 31 June 30 30 31 31 GAAP Gross Profit $ 77.9 $ 86.2 $ 77.8 $ 82.6 $ 324.4 GAAP Gross Profit Margin 46.9 % 48.8 % 47.3 % 45.7 % 47.2 % Adjustments: Amortization, stock-based compensation & other 0.1 0.1 0.1 (0.2) 0.1 Legal and acquisition-related — — — 0.6 0.6 Cost optimization plan 0.2 0.2 0.1 0.7 1.1 Non-GAAP Gross Profit $ 78.1 $ 86.4 $ 78.0 $ 83.6 $ 326.2 Non-GAAP Gross Profit Margin 47.1 % 48.9 % 47.4 % 46.3 % 47.4 % * Tables may not foot due to rounding; amounts calculated based on dollars in thousands. 30
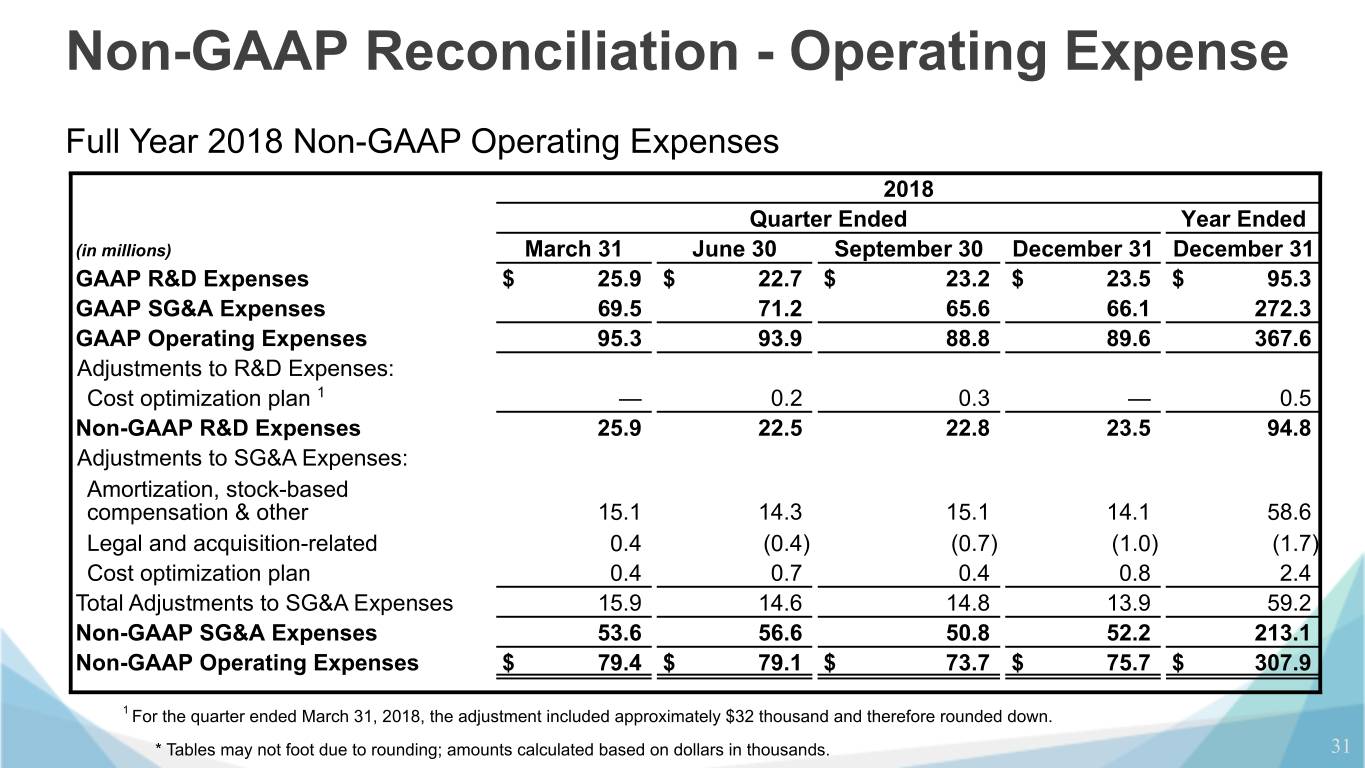

 
Non-GAAP Reconciliation - Operating Expense Full Year 2018 Non-GAAP Operating Expenses 2018 Quarter Ended Year Ended (in millions) March 31 June 30 September 30 December 31 December 31 GAAP R&D Expenses $ 25.9 $ 22.7 $ 23.2 $ 23.5 $ 95.3 GAAP SG&A Expenses 69.5 71.2 65.6 66.1 272.3 GAAP Operating Expenses 95.3 93.9 88.8 89.6 367.6 Adjustments to R&D Expenses: Cost optimization plan 1 — 0.2 0.3 — 0.5 Non-GAAP R&D Expenses 25.9 22.5 22.8 23.5 94.8 Adjustments to SG&A Expenses: Amortization, stock-based compensation & other 15.1 14.3 15.1 14.1 58.6 Legal and acquisition-related 0.4 (0.4) (0.7) (1.0) (1.7) Cost optimization plan 0.4 0.7 0.4 0.8 2.4 Total Adjustments to SG&A Expenses 15.9 14.6 14.8 13.9 59.2 Non-GAAP SG&A Expenses 53.6 56.6 50.8 52.2 213.1 Non-GAAP Operating Expenses $ 79.4 $ 79.1 $ 73.7 $ 75.7 $ 307.9 1 For the quarter ended March 31, 2018, the adjustment included approximately $32 thousand and therefore rounded down. * Tables may not foot due to rounding; amounts calculated based on dollars in thousands. 31

 
Thank You