0001022079
false
0001022079
2021-03-11
2021-03-11
iso4217:USD
xbrli:shares
iso4217:USD
xbrli:shares
UNITED STATES
SECURITIES AND EXCHANGE COMMISSION
WASHINGTON, DC 20549
FORM 8-K
CURRENT REPORT PURSUANT TO SECTION
13 OR 15(d) OF
THE SECURITIES EXCHANGE ACT OF 1934
Date of Report (Date
of Earliest Event Reported): March 11, 2021
Quest Diagnostics Incorporated
(Exact Name of Registrant as Specified in Its
Charter)
Delaware
(State or other jurisdiction of incorporation)
| 001-12215 |
|
16-1387862 |
| (Commission File Number) |
|
(I.R.S. Employer Identification No.) |
| |
|
|
| 500 Plaza Drive |
|
|
| Secaucus, NJ |
|
07094 |
| (Address of principal executive offices) |
|
(Zip Code) |
(973) 520-2700
(Registrant’s telephone number, including
area code)
Check the appropriate box below if the
Form 8-K filing is intended to simultaneously satisfy the filing obligation of the registrant under any of the following provisions
(see General Instruction A.2. below):
| ☐ | Written communications pursuant to Rule 425 under the Securities Act (17 CFR 230.425) |
| ☐ | Soliciting material pursuant to Rule 14a-12 under the Exchange Act (17 CFR 240.14a-12) |
| ☐ | Pre-commencement communications pursuant to Rule 14d-2(b) under the Exchange Act (17 CFR 240.14d-2(b)) |
| ☐ | Pre-commencement communications pursuant to Rule 13e-4(c) under the Exchange Act (17 CFR 240.13e-4(c)) |
Securities registered pursuant to Section
12(b) of the Act:
| Title of each class |
Trading Symbol(s) |
Name of each exchange on which registered |
| Common Stock, $0.01 Par Value |
DGX |
New York Stock Exchange |
Indicate by check mark whether the registrant
is an emerging growth company as defined in Rule 405 of the Securities Act of 1933 (§230.405 of this chapter) or Rule 12b-2
of the Securities Exchange Act of 1934 (§240.12b-2 of this chapter).
Emerging growth company ☐
If an emerging growth company, indicate
by check mark if the registrant has elected not to use the extended transition period for complying with any new or revised financial
accounting standards provided pursuant to Section 13(a) of the Exchange Act. ☐
Item 7.01. Regulation FD Disclosure
On March 11, 2021, Quest Diagnostics
Incorporated (the “Company”) will host an Investor Day at which management will present on, among other things, the
Company’s strategy and plans to drive shareholder value and its views on the industry. In connection with Investor Day, the
Company issued a press release on March 11, 2021 in which it described, among other things, the following:
| · | The Company’s long-term outlook: |
| ◦ | Although COVID-19 testing will continue in 2022 as the Company moves from primarily clinical uses to increased
testing in support of “Return-to-Life” activities, COVID-19 testing revenues are expected to step down meaningfully
in 2022. |
| ◦ | Base business revenues (which excludes COVID-19 testing) are expected to fully recover by the end
of 2021. |
| ◦ | Expected compound annual growth rate (“CAGR”) from 2022 - 24 for revenues in its base business is expected
to be 4-5% and adjusted diluted earnings per share (“EPS”) is expected to be 7-9% for the total Company. |
| · | The Company’s perspective on COVID-19 testing and strategic initiatives underway to accelerate the Company’s growth,
including: |
| ◦ | Taking advantage of expanded access to 90% of commercially insured lives across the U.S. |
| ◦ | Strengthening the company’s relationships with hospital health systems |
| ◦ | Increasing market share in advanced diagnostics through innovation |
| ◦ | Building on the company’s growth in consumer testing |
| ◦ | Supporting return to work, school and life activities with COVID-19 testing |
| ◦ | Delivering more than a 2% revenue CAGR on the base business through strategically aligned accretive
acquisitions |
| · | The Company’s strategy to drive operational excellence and continue to generate savings of approximately 3% per year. |
| · | The Company’s capital deployment strategy, including its focus on returning a majority of free cash flow to shareholders
through share repurchases and dividends. In the first half of 2021 the Company plans to repurchase $900 million of its common stock. |
In 2020 and 2021, the Company plans to
invest an additional combined $75 million into the business for growth, with most of the investment occurring in 2021.
The Company’s outlook for the first
half of 2021 remains unchanged: net revenues are expected to be between $4.85 billion and $5.15 billion; reported diluted EPS is
expected to be between $5.07 and $6.07; adjusted diluted EPS is expected to be between $5.90 and $6.90; cash provided by operations
is expected to be at least $800 million; and capital expenditures are expected to be approximately $200 million.
A copy of the press release and related conference call slides
used by members of management of the Company are furnished as Exhibits 99.1, 99.2, 99.3, 99.4 and 99.5 to this Current Report
on Form 8-K and are incorporated into this Item 7.01 of this Current Report on Form 8-K by reference.
The information in the preceding paragraphs, as well as
Exhibits 99.1, 99.2, 99.3, 99.4 and 99.5, shall not be deemed “filed” for purposes of Section 18 of the
Securities Exchange Act of 1934, as amended (the “Exchange Act”), or otherwise subject to the liabilities of that
section. It may only be incorporated by reference into another filing under the Exchange Act or the Securities Act of 1933, as
amended (the “Securities Act”) if such subsequent filing specifically references this Current Report on Form
8-K.
The statements in the following presentations which are not
historical facts may be forward-looking statements. Readers are cautioned not to place undue reliance on forward-looking statements,
which speak only as of the date that they are made and which reflect management’s current estimates, projections, expectations
or beliefs and which involve risks and uncertainties that could cause actual results and outcomes to be materially different. Risks
and uncertainties that may affect the future results of the company include, but are not limited to, impacts of the COVID-19 pandemic
and measures taken in response, adverse results from pending or future government investigations, lawsuits or private actions,
the competitive environment, the complexity of billing, reimbursement and revenue recognition for clinical laboratory testing,
changes in government regulations, changing relationships with customers, payers, suppliers or strategic partners and other factors
discussed in the company’s most recently filed Annual Report on Form 10-K and in any of the company’s subsequently
filed Quarterly Reports on Form 10-Q and Current Reports on Form 8-K, including those discussed in the “Business,”
“Risk Factors,” “Cautionary Factors that May Affect Future Results” and “Management’s Discussion
and Analysis of Financial Condition and Results of Operations” sections of those reports.
The Company continues to believe that the impact of the COVID-19
pandemic on future operating results, cash flows and/or its financial condition will be primarily driven by: the pandemic’s
severity and duration; healthcare insurer, government and client payer reimbursement rates for COVID-19 molecular tests; the pandemic’s
impact on the U.S. healthcare system and the U.S. economy; and the timing, scope and effectiveness of federal, state and local
governmental responses to the pandemic which are drivers beyond the Company’s knowledge and control.
Item
9.01. Financial Statements and Exhibits
Signature
Pursuant to the
requirements of the Securities Exchange Act of 1934, the registrant has duly caused this report to be signed on its behalf by the
undersigned hereunto duly authorized.
March 11, 2021
| |
QUEST DIAGNOSTICS INCORPORATED |
| |
|
|
| |
By: |
/s/ William J. O’Shaughnessy, Jr. |
| |
|
William J. O’Shaughnessy, Jr. |
| |
|
Deputy General Counsel and |
| |
|
Corporate Secretary |
Exhibit 99.1
Quest Diagnostics Updates Strategic
Growth Drivers
and Provides Long-Term Outlook at
2021 Virtual Investor Day
| • | Company to repurchase $900 million of its shares in first half of 2021 |
| • | Long-term outlook 2022-24 compound annual growth rate (CAGR): Base business revenues (which excludes COVID-19 testing) expected
to grow 4-5% and adjusted diluted earnings per share (EPS) for the total company expected to grow 7-9% |
| • | Invigorate savings of 3% annually expected to continue |
| • | COVID-19 testing is expected to continue into 2022 at lower levels as it moves from primarily clinical uses to testing in support
of "Return-to-Life" activities |
| • | Outlook for first half of 2021 remains unchanged |
SECAUCUS, N.J., March 11, 2021 -- At a virtual meeting with
analysts and investors at its Investor Day, members of the senior management team of Quest Diagnostics Incorporated (NYSE: DGX),
the world's leading provider of diagnostic information services, will report on progress made on the company’s two-point
strategy to accelerate growth and drive operational excellence, and provide a new long-term financial outlook.
“Our response to the COVID-19 pandemic demonstrated our
agility and capability for innovation,” said Steve Rusckowski, Chairman, CEO and President. “Earnings from COVID-19
testing continue to help fund investments in the business, which will enable us to further accelerate growth and drive operational
excellence. Our base business is poised to fully recover by the end of 2021. We have raised our long-term outlook to a 4-5% revenue
CAGR for our base business and a 7-9% earnings CAGR for the total company.”
At the meeting, members of the company’s senior
management team will provide perspective on COVID-19 and base business testing trends and highlight the strategic initiatives underway to
accelerate the company’s growth, including:
| • | Taking advantage of expanded access to 90% of commercially insured lives across the U.S. |
| • | Strengthening the company’s relationships with hospital health systems |
| • | Increasing market share in advanced diagnostics through innovation |
| • | Building on the company’s growth in consumer testing |
| • | Supporting return to work, school and life activities with COVID-19 testing |
| • | Delivering more than a 2% revenue CAGR on the base business through strategically aligned accretive acquisitions |
In addition, the Quest Diagnostics management team will discuss
the company’s strategy to drive operational excellence and continue to generate savings of approximately 3% per year.
The company will discuss its capital deployment strategy,
including its focus on returning a majority of free cash flow to shareholders through share repurchases and dividends. In the first
half of 2021 the company plans to execute $900 million in share repurchases of its common stock.
Outlook for First Half of 2021
The Company's outlook for the first half of 2021 remains unchanged
as follows:
| | |
Low | |
High |
| Net revenues | |
| $4.85 billion | | |
| $5.15 billion | |
| Net revenues increase | |
| 32.9 | % | |
| 41.1 | % |
| Reported diluted EPS | |
$ | 5.07 | | |
$ | 6.07 | |
| Adjusted diluted EPS | |
$ | 5.90 | | |
$ | 6.90 | |
| Cash provided by operations | |
| At least $800 million | |
| Capital expenditures | |
| Approximately $200 million | |
The additional table attached below includes reconciliations
of non-GAAP adjusted measures to GAAP measures.
Note on Non-GAAP Financial Measures
As used in this press release the term "reported"
refers to measures under accounting principles generally accepted in the United States ("GAAP"). The term "adjusted"
refers to non-GAAP operating performance measures that exclude special items such as restructuring and integration charges, amortization
expense, excess tax benefits ("ETB") associated with stock-based compensation, costs associated with donations, contributions
and other financial support through Quest for Health Equity, the company's recently announced initiative with the Quest Diagnostics
Foundation to reduce health disparities in underserved communities, and other items.
The company has provided a compound annual growth rate projection
for 2022 to 2024 of 7-9% for adjusted diluted EPS, which is a non-GAAP measure. The company is unable to present a reconciliation
of adjusted diluted EPS to reported diluted EPS, the most comparable GAAP measure due to the inherent uncertainty and variability
in the nature and amount of special items referenced above, and the amount of these items could be significant in any of the associated
periods.
Non-GAAP adjusted measures are presented because management
believes those measures are useful adjuncts to GAAP results. Non-GAAP adjusted measures should not be considered as an alternative
to the corresponding measures determined under GAAP. Management may use these non-GAAP measures to evaluate our performance period
over period and relative to competitors, to analyze the underlying trends in our business, to establish operational budgets and
forecasts and for incentive compensation purposes. We believe that these non- GAAP measures are useful to investors and analysts
to evaluate our performance period over period and relative to competitors, as well as to analyze the underlying trends in our
business and to assess our performance.
Webcast Attendance
The virtual event will begin at 9:00 am ET. To access the
live webcast, including audio, video and presentation slides, interested parties must register in advance here.
Securities analysts and institutional investors are advised to register in advance.
Investors and analysts who register will have an opportunity
to ask questions in live Q&A sessions with speakers. Participants who would like to ask a question can dial 888-455-0391 within
the U.S. and Canada, or (773) 756-0467 internationally, using the passcode "7895081."
Interested parties unable to watch the live webcast will be
able to view and listen to an archived copy of the webcast, which will be available on the Quest
Diagnostics Investor Relations website following the conclusion of the event. Anyone listening to the webcast is encouraged
to read the company's periodic reports, on file with the Securities and Exchange Commission, including the discussion of risk
factors and historical results of operations and financial condition in those reports.
About Quest Diagnostics
Quest Diagnostics empowers people to take action to improve
health outcomes. Derived from the world's largest database of clinical lab results, our diagnostic insights reveal new avenues
to identify and treat disease, inspire healthy behaviors and improve health care management. Quest Diagnostics annually serves
one in three adult Americans and half the physicians and hospitals in the United States, and our nearly 50,000 employees understand
that, in the right hands and with the right context, our diagnostic insights can inspire actions that transform lives. www.QuestDiagnostics.com.
The statements in this press release which are not historical
facts may be forward-looking statements, including statements regarding our projected results for future periods. Readers are
cautioned not to place undue reliance on forward-looking statements, which speak only as of the date that they are made and which
reflect management's current estimates, projections, expectations or beliefs and which involve risks and uncertainties that could
cause actual results and outcomes to be materially different. Risks and uncertainties that may affect the future results of the
company include, but are not limited to, impacts of the COVID-19 pandemic and measures taken in response, adverse results from
pending or future government investigations, lawsuits or private actions, the competitive environment, the complexity of billing,
reimbursement and revenue recognition for clinical laboratory testing, changes in government regulations, changing relationships
with customers, payers, suppliers or strategic partners and other factors discussed in the company's most recently filed Annual
Report on Form 10- K and in any of the company's subsequently filed Quarterly Reports on Form 10-Q and Current Reports on Form
8-K, including those discussed in the "Business," "Risk Factors," "Cautionary Factors that May Affect
Future Results" and "Management's Discussion and Analysis of Financial Condition and Results of Operations" sections
of those reports.
This earnings release, including the attached financial tables,
is available online in the Newsroom section at www.QuestDiagnostics.com.
Contacts:
Shawn Bevec (Investors):
973-520-2900
Dennis Moynihan (Media):
973-520-2800
ADDITIONAL TABLES FOLLOW
| 1) | The outlook for adjusted diluted EPS represents management’s estimates for the first half of 2021 before the impact of
special items. Further impacts to earnings related to special items may occur throughout 2021. Additionally, the amount of ETB associated with stock-based compensation is dependent upon employee stock option exercises and the
company's stock price, which are difficult to predict. The following table reconciles our first half of 2021 outlook for adjusted
diluted EPS to the corresponding amounts determined under GAAP: |
| | |
Low | |
High |
| Diluted EPS | |
$ | 5.07 | | |
$ | 6.07 | |
| Restructuring and integration charges (a) | |
| 0.33 | | |
| 0.33 | |
| Amortization expense (b) | |
| 0.32 | | |
| 0.32 | |
| Costs associated with Quest for Health Equity (c) | |
| 0.28 | | |
| 0.28 | |
| ETB | |
| (0.10 | ) | |
| (0.10 | ) |
| Adjusted diluted EPS | |
$ | 5.90 | | |
$ | 6.90 | |
| (a) | Represents estimated pre-tax charges of $60 million primarily associated with systems conversions and integration costs incurred
in connection with further restructuring and integrating our business. Income tax benefits were calculated using a combined statutory
income tax rate of 25.5%. |
| (b) | Represents the estimated impact of amortization expense for first half of 2021 on the calculation of adjusted diluted EPS.
Amortization expense used in the calculation is as follows (dollars in millions): |
| Amortization of intangible assets | |
$ | 54 | |
| Amortization expense included in equity in earnings of equity method investees, net of taxes | |
| 5 | |
| Total pre-tax amortization expense | |
$ | 59 | |
| Total amortization expense, net of an estimated tax benefit using a combined statutory income tax rate of 25.5% | |
$ | 44 | |
| (c) | Represents estimated pre-tax charges of $50 million associated with donations, contributions and other financial support through
Quest for Health Equity, the company's recently announced initiative with the Quest Diagnostics Foundation to reduce health disparities
in underserved communities. Income tax benefits were calculated using a combined statutory income tax rate of 25.5%. |
Exhibit 99.2

Poised for Growth in a Post - Pandemic World Steve Rusckowski Chairman, CEO and President
SAFE HARBOR DISCLOSURE The statements in the following presentations which are not historical facts may be forward - looking statements . Readers are cautioned not to place undue reliance on forward - looking statements, which speak only as of the date that they are made and which reflect management’s current estimates, projections, expectations or beliefs and which involve risks and uncertainties that could cause actual results and outcomes to be materially different . Risks and uncertainties that may affect the future results of the company include, but are not limited to, impacts of the COVID - 19 pandemic and measures taken in response, adverse results from pending or future government investigations, lawsuits or private actions, the competitive environment, the complexity of billing, reimbursement and revenue recognition for clinical laboratory testing, changes in government regulations, changing relationships with customers, payers, suppliers or strategic partners and other factors discussed in the company's most recently filed Annual Report on Form 10 - K and in any of the company's subsequently filed Quarterly Reports on Form 10 - Q and Current Reports on Form 8 - K, including those discussed in the “Business,” “Risk Factors,” “Cautionary Factors that May Affect Future Results” and “Management’s Discussion and Analysis of Financial Condition and Results of Operations” sections of those reports . The Company continues to believe that the impact of the COVID - 19 pandemic on future operating results, cash flows and/or its financial condition will be primarily driven by : the pandemic’s severity and duration ; healthcare insurer, government and client payer reimbursement rates for COVID - 19 molecular tests ; the pandemic’s impact on the U . S . healthcare system and the U . S . economy ; and the timing, scope and effectiveness of federal, state and local governmental responses to the pandemic which are drivers beyond the Company’s knowledge and control .
What you’ll hear today Quest’s role as the leader in diagnostic information services Latest perspectives on COVID - 19 testing Drivers of accelerating growth Long - term outlook beyond 2022 DM75
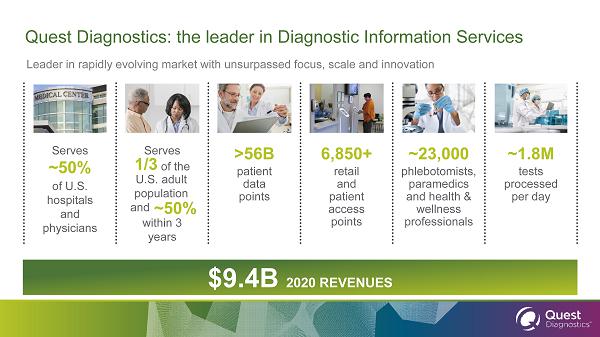
$9.4B 2020 REVENUES Leader in rapidly evolving market with unsurpassed focus, scale and innovation Quest Diagnostics: the leader in Diagnostic Information Services Serves ~50% of U.S. hospitals and physicians U.S. adult population and ~50% Serves within 3 years 1/3 of the 6,850+ retail and patient access points >56B patient data points ~23,000 phlebotomists, paramedics and health & wellness professionals ~1.8M tests processed per day
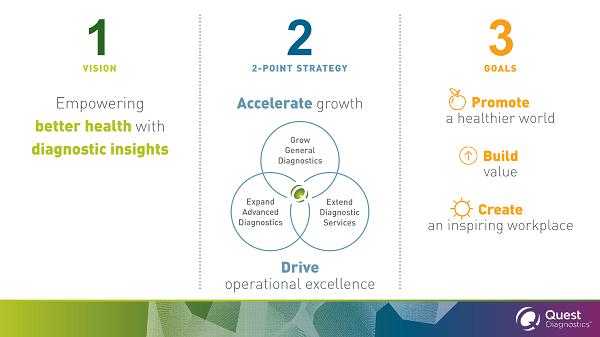
1 3 2
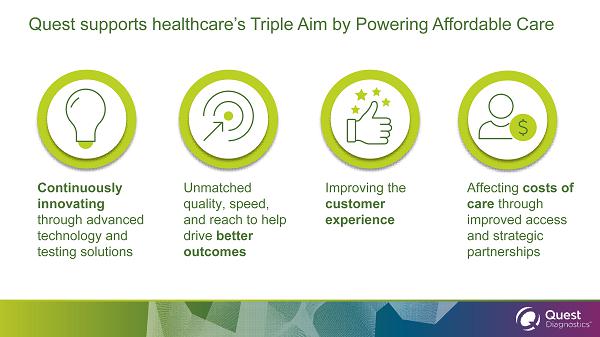
Quest supports healthcare’s Triple Aim by Powering Affordable Care Continuously innovating through advanced technology and testing solutions Unmatched quality, speed, and reach to help drive better outcomes Improving the customer experience through seamless and insightful resources Affecting costs of care through improved access and strategic partnerships
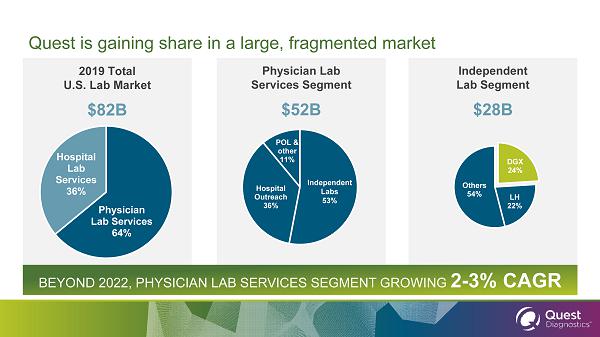
BEYOND 2022, PHYSICIAN LAB SERVICES SEGMENT GROWING 2 - 3% CAGR DGX 24% LH 22% Others 54% Hospital Outreach 36% POL & other 11% Independent Labs 53% Physician Lab Services 64% Hospital Lab Services 36% Quest is gaining share in a large, fragmented market 2019 Total U.S. Lab Market Physician Lab Services Segment Independent Lab Segment $82B $52B $28B
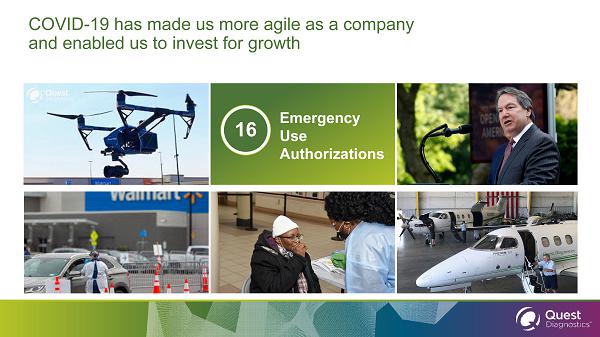
COVID - 19 has made us more agile as a company and enabled us to invest for growth Emergency Use Authorizations 16
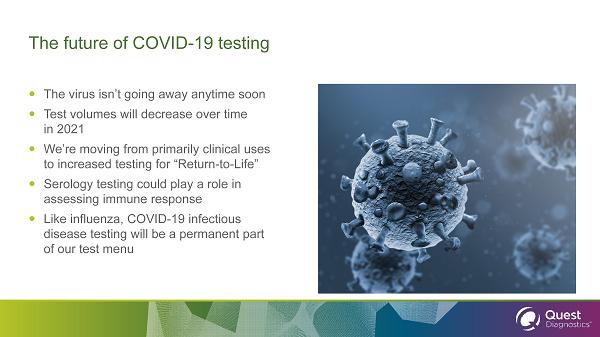
The future of COVID - 19 testing The virus isn’t going away anytime soon Test volumes will decrease over time in 2021 We’re moving from primarily clinical uses to increased testing for “Return - to - Life” Serology testing could play a role in assessing immune response Like influenza, COVID - 19 infectious disease testing will be a permanent part of our test menu
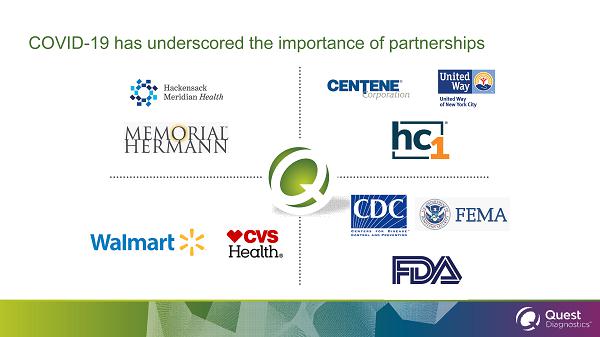
COVID - 19 has underscored the importance of partnerships
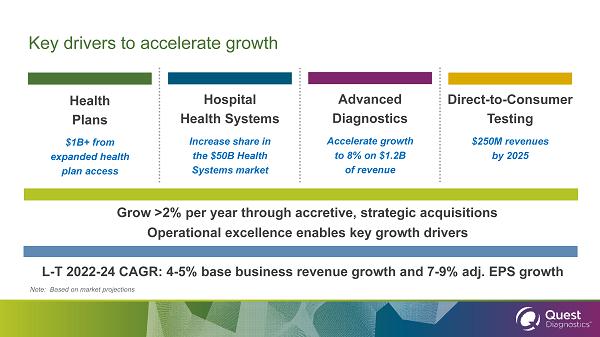
Key drivers to accelerate growth Note: Based on market projections Operational excellence enables key growth drivers Grow >2% per year through accretive, strategic acquisitions Health Plans $1B+ from expanded health plan access Hospital Health Systems Increase share in the $50B Health Systems market Advanced Diagnostics Accelerate growth to 8% on $1.2B of revenue $250M revenues by 2025 Direct - to - Consumer Testing L - T 2022 - 24 CAGR: 4 - 5% base business revenue growth and 7 - 9% adj. EPS growth
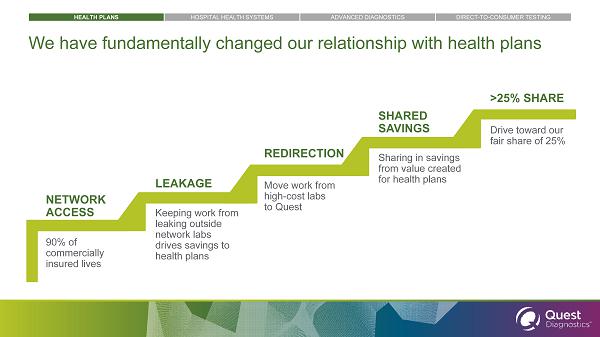
90% of commercially insured lives Keeping work from leaking outside network labs drives savings to health plans Move work from high - cost labs to Quest Sharing in savings from value created for health plans Drive toward our fair share of 25% We have fundamentally changed our relationship with health plans NETWORK ACCESS LEAKAGE REDIRECTION SHARED SAVINGS >25% SHARE HEALTH PLANS HOSPITAL HEALTH SYSTEMS ADVANCED DIAGNOSTICS DIRECT - TO - CONSUMER TESTING
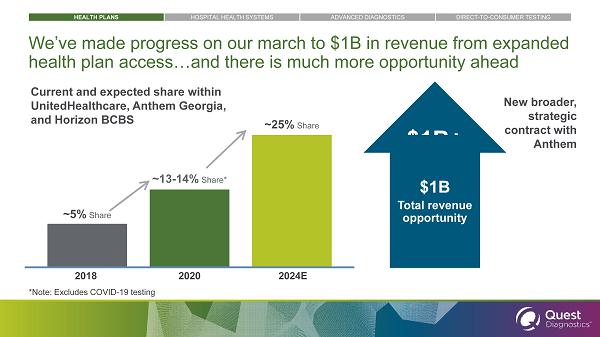
We’ve made progress on our march to $1B in revenue from expanded health plan access…and there is much more opportunity ahead Current and expected share within UnitedHealthcare, Anthem Georgia, and Horizon BCBS 2018 2020 ~5% Share ~ 13 - 14 % Share* $1B+ total revenue opportunity 2024E ~25% Share $1B Total revenue opportunity New broader, strategic contract with Anthem HEALTH PLANS HOSPITAL HEALTH SYSTEMS ADVANCED DIAGNOSTICS DIRECT - TO - CONSUMER TESTING *Note: Excludes COVID - 19 testing
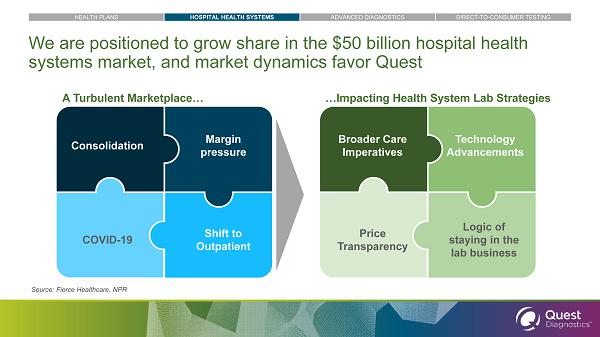
Consolidation Margin pressure Shift to Outpatient COVID - 19 Broader Care Imperatives Technology Advancements Logic of staying in the lab business Price Transparency A Turbulent Marketplace… …Impacting Health System Lab Strategies Source: Fierce Healthcare, NPR We are positioned to grow share in the $50 billion hospital health systems market, and market dynamics favor Quest HEALTH PLANS HOSPITAL HEALTH SYSTEMS ADVANCED DIAGNOSTICS DIRECT - TO - CONSUMER TESTING
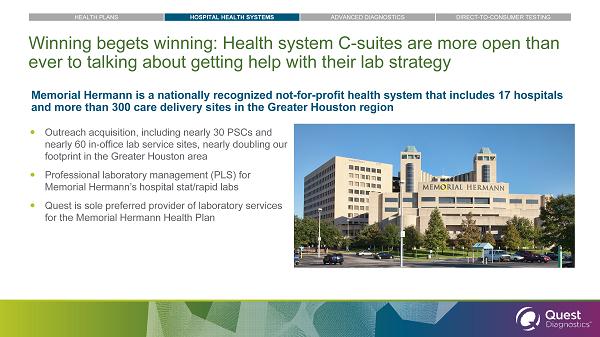
Winning begets winning: Health system C - suites are more open than ever to talking about getting help with their lab strategy Memorial Hermann is a nationally recognized not - for - profit health system that includes 17 hospitals and more than 300 care delivery sites in the Greater Houston region Outreach acquisition, including nearly 30 PSCs and nearly 60 in - office lab service sites, nearly doubling our footprint in the Greater Houston area Professional laboratory management (PLS) for Memorial Hermann’s hospital stat/rapid labs Quest is sole preferred provider of laboratory services for the Memorial Hermann Health Plan HEALTH PLANS HOSPITAL HEALTH SYSTEMS ADVANCED DIAGNOSTICS DIRECT - TO - CONSUMER TESTING
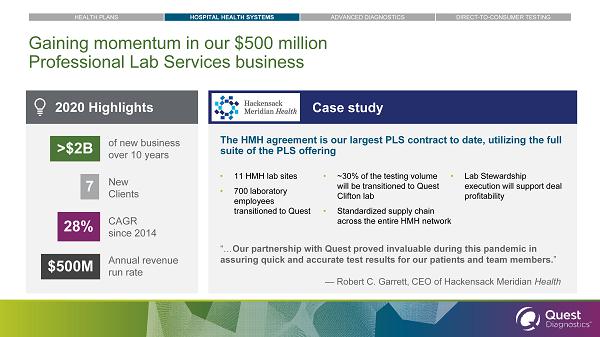
Gaining momentum in our $500 million Professional Lab Services business 7 New Clients 28% CAGR since 2014 $500M Annual revenue run rate • 11 HMH lab sites • 700 laboratory employees transitioned to Quest “… Our partnership with Quest proved invaluable during this pandemic in assuring quick and accurate test results for our patients and team members. ” — Robert C. Garrett, CEO of Hackensack Meridian Health >$2B of new business over 10 years The HMH agreement is our largest PLS contract to date, utilizing the full suite of the PLS offering • Lab Stewardship execution will support deal profitability 2020 Highlights Case study • ~30% of the testing volume will be transitioned to Quest Clifton lab • Standardized supply chain across the entire HMH network HEALTH PLANS HOSPITAL HEALTH SYSTEMS ADVANCED DIAGNOSTICS DIRECT - TO - CONSUMER TESTING
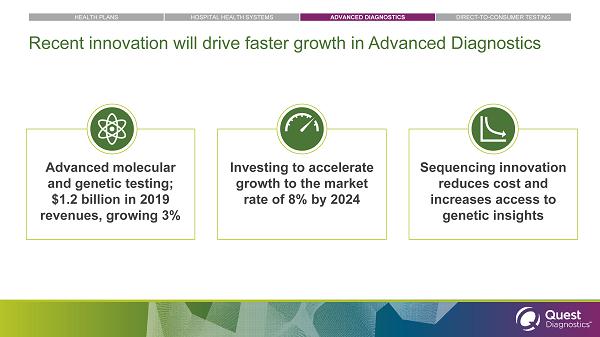
Recent innovation will drive faster growth in Advanced Diagnostics Advanced molecular and genetic testing; $1.2 billion in 2019 revenues, growing 3% Investing to accelerate growth to the market rate of 8% by 2024 Sequencing innovation reduces cost and increases access to genetic insights HEALTH PLANS HOSPITAL HEALTH SYSTEMS ADVANCED DIAGNOSTICS DIRECT - TO - CONSUMER TESTING
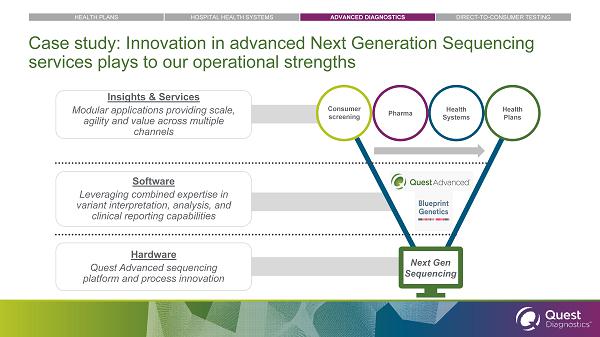
Case study: Innovation in advanced Next Generation Sequencing services plays to our operational strengths Software Leveraging combined expertise in variant interpretation, analysis, and clinical reporting capabilities Hardware Quest Advanced sequencing platform and process innovation Insights & Services Modular applications providing scale, agility and value across multiple channels Health Plans Health Systems Next Gen Sequencing HEALTH PLANS HOSPITAL HEALTH SYSTEMS ADVANCED DIAGNOSTICS DIRECT - TO - CONSUMER TESTING Pharma Consumer screening
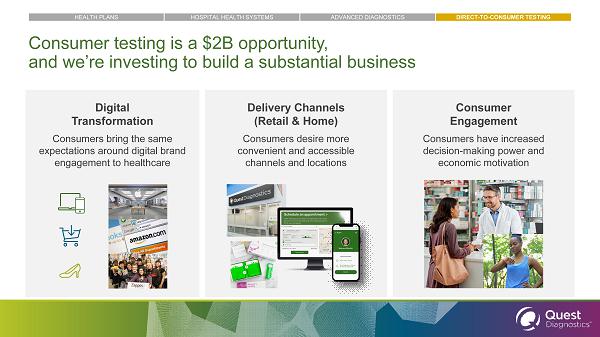
Consumer testing is a $2B opportunity, and we’re investing to build a substantial business Digital Transformation Consumers bring the same expectations around digital brand engagement to healthcare Delivery Channels (Retail & Home) Consumers desire more convenient and accessible channels and locations Consumer Engagement Consumers have increased decision - making power and economic motivation HEALTH PLANS HOSPITAL HEALTH SYSTEMS ADVANCED DIAGNOSTICS DIRECT - TO - CONSUMER TESTING
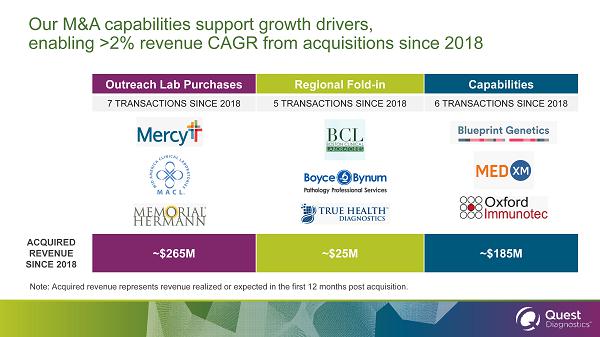
Our M&A capabilities support growth drivers, enabling >2% revenue CAGR from acquisitions since 2018 Outreach Lab Purchases Regional Fold - in Capabilities 7 TRANSACTIONS SINCE 2018 5 TRANSACTIONS SINCE 2018 6 TRANSACTIONS SINCE 2018 ACQUIRED REVENUE SINCE 2018 ~$265M ~$25M ~$185M Note: Acquired revenue represents revenue realized or expected in the first 12 months post acquisition.
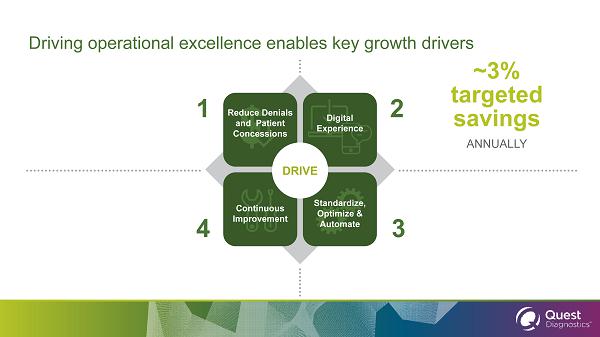
$ DRIVE 1 2 Reduce Denials and Patient Concessions Digital Experience Standardize, Optimize & Automate Continuous Improvement 4 3 ~3% targeted savings ANNUALLY Driving operational excellence enables key growth drivers
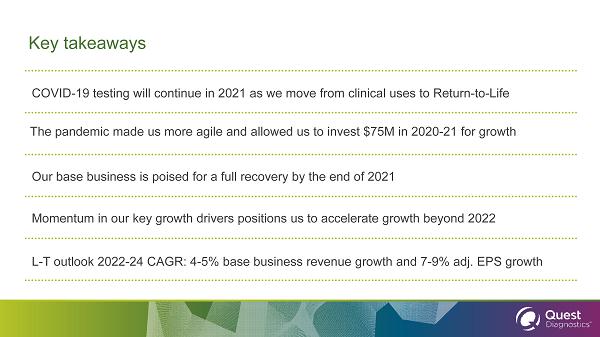
Key takeaways COVID - 19 testing will continue in 2021 as we move from clinical uses to Return - to - Life Our base business is poised for a full recovery by the end of 2021 Momentum in our key growth drivers positions us to accelerate growth beyond 2022 L - T outlook 2022 - 24 CAGR: 4 - 5% base business revenue growth and 7 - 9% adj. EPS growth The pandemic made us more agile and allowed us to invest $75M in 2020 - 21 for growth
Appendix Non - GAAP Reconciliations
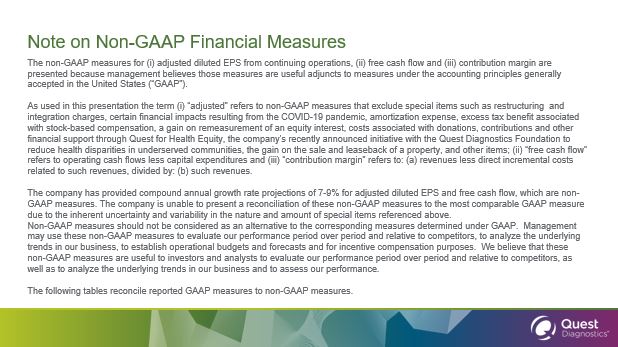
Note on Non - GAAP Financial Measures
The non-GAAP measures for (i) adjusted diluted EPS from
continuing operations, (ii) free cash flow and (iii) contribution margin are presented because management believes those measures
are useful adjuncts to measures under the accounting principles generally accepted in the United States (“GAAP”).
As used in this presentation the term (i) “adjusted”
refers to non-GAAP measures that exclude special items such as restructuring and integration charges, certain financial impacts
resulting from the COVID-19 pandemic, amortization expense, excess tax benefit associated with stock-based compensation, a gain
on remeasurement of an equity interest, costs associated with donations, contributions and other financial support through Quest
for Health Equity, the company's recently announced initiative with the Quest Diagnostics Foundation to reduce health disparities
in underserved communities, the gain on the sale and leaseback of a property, and other items; (ii) “free cash flow”
refers to operating cash flows less capital expenditures and (iii) “contribution margin” refers to: (a) revenues less
direct incremental costs related to such revenues, divided by: (b) such revenues.
The company has provided compound annual growth rate projections of 7 - 9% for adjusted diluted EPS and free cash flow, which are non - GAAP measures. The company is unable to present a reconciliation of these non - GAAP measures to the most comparable GAAP measure due to the inherent uncertainty and variability in the nature and amount of special items referenced above. Non - GAAP measures should not be considered as an alternative to the corresponding measures determined under GAAP. Management may use these non - GAAP measures to evaluate our performance period over period and relative to competitors, to analyze the underlying trends in our business, to establish operational budgets and forecasts and for incenti ve compensation purposes. We believe that these non - GAAP measures are useful to investors and analysts to evaluate our performance period over period and relative to competitors, as well as to analyze the underlying trends in our business and t o a ssess our performance. The following tables reconcile reported GAAP measures to non - GAAP measures.
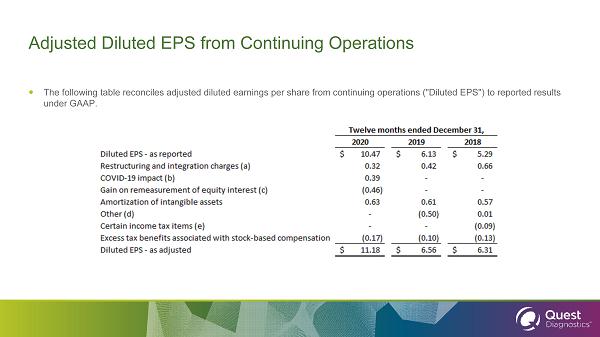
Adjusted Diluted EPS from Continuing Operations The following table reconciles adjusted diluted earnings per share from continuing operations ("Diluted EPS") to reported res ult s under GAAP.
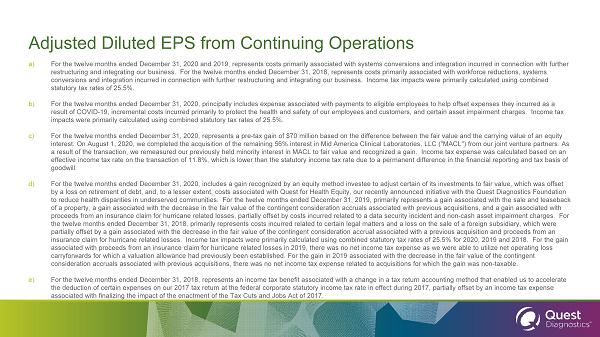
Adjusted Diluted EPS from Continuing Operations a) For the twelve months ended December 31, 2020 and 2019, represents costs primarily associated with systems conversions and in teg ration incurred in connection with further restructuring and integrating our business. For the twelve months ended December 31, 2018, represents costs primarily associate d with workforce reductions, systems conversions and integration incurred in connection with further restructuring and integrating our business. Income tax impacts were primarily calculated using combined statutory tax rates of 25.5%. b) For the twelve months ended December 31, 2020, principally includes expense associated with payments to eligible employees to he lp offset expenses they incurred as a result of COVID - 19, incremental costs incurred primarily to protect the health and safety of our employees and customers, and ce rtain asset impairment charges. Income tax impacts were primarily calculated using combined statutory tax rates of 25.5%. c) For the twelve months ended December 31, 2020, represents a pre - tax gain of $70 million based on the difference between the fair value and the carrying value of an equity interest. On August 1, 2020, we completed the acquisition of the remaining 56% interest in Mid America Clinical Laboratories, LL C ("MACL") from our joint venture partners. As a result of the transaction, we remeasured our previously held minority interest in MACL to fair value and recognized a gain. I ncome tax expense was calculated based on an effective income tax rate on the transaction of 11.8%, which is lower than the statutory income tax rate due to a permanent d iff erence in the financial reporting and tax basis of goodwill. d) For the twelve months ended December 31, 2020, includes a gain recognized by an equity method investee to adjust certain of its investments to fair value, which was offset by a loss on retirement of debt, and, to a lesser extent, costs associated with Quest for Health Equity, our recently announc ed initiative with the Quest Diagnostics Foundation to reduce health disparities in underserved communities. For the twelve months ended December 31, 2019, primarily represents a gain associated with the sale and leaseback of a property, a gain associated with the decrease in the fair value of the contingent consideration accruals associated with pr evious acquisitions, and a gain associated with proceeds from an insurance claim for hurricane related losses, partially offset by costs incurred related to a data security inc ident and non - cash asset impairment charges. For the twelve months ended December 31, 2018, primarily represents costs incurred related to certain legal matters and a loss on th e sale of a foreign subsidiary, which were partially offset by a gain associated with the decrease in the fair value of the contingent consideration accrual associated wit h a previous acquisition and proceeds from an insurance claim for hurricane related losses. Income tax impacts were primarily calculated using combined statutory tax rates o f 25.5% for 2020, 2019 and 2018. For the gain associated with proceeds from an insurance claim for hurricane related losses in 2019, there was no net income tax expense as we were able to utilize net operating loss carryforwards for which a valuation allowance had previously been established. For the gain in 2019 associated with the decre ase in the fair value of the contingent consideration accruals associated with previous acquisitions, there was no net income tax expense related to acquisitions for wh ich the gain was non - taxable. e) For the twelve months ended December 31, 2018, represents an income tax benefit associated with a change in a tax return acco unt ing method that enabled us to accelerate the deduction of certain expenses on our 2017 tax return at the federal corporate statutory income tax rate in effect during 201 7, partially offset by an income tax expense associated with finalizing the impact of the enactment of the Tax Cuts and Jobs Act of 2017.
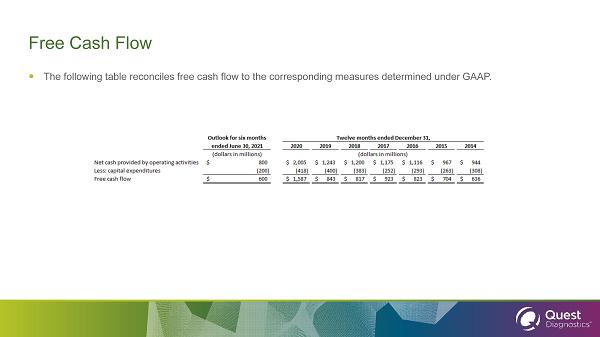
Free Cash Flow The following table reconciles free cash flow to the corresponding measures determined under GAAP.
Exhibit 99.3

Optimizing Operations to Drive Growth Jim Davis Executive Vice President, General Diagnostics
SAFE HARBOR DISCLOSURE The statements in the following presentations which are not historical facts may be forward - looking statements . Readers are cautioned not to place undue reliance on forward - looking statements, which speak only as of the date that they are made and which reflect management’s current estimates, projections, expectations or beliefs and which involve risks and uncertainties that could cause actual results and outcomes to be materially different . Risks and uncertainties that may affect the future results of the company include, but are not limited to, impacts of the COVID - 19 pandemic and measures taken in response, adverse results from pending or future government investigations, lawsuits or private actions, the competitive environment, the complexity of billing, reimbursement and revenue recognition for clinical laboratory testing, changes in government regulations, changing relationships with customers, payers, suppliers or strategic partners and other factors discussed in the company's most recently filed Annual Report on Form 10 - K and in any of the company's subsequently filed Quarterly Reports on Form 10 - Q and Current Reports on Form 8 - K, including those discussed in the “Business,” “Risk Factors,” “Cautionary Factors that May Affect Future Results” and “Management’s Discussion and Analysis of Financial Condition and Results of Operations” sections of those reports . The Company continues to believe that the impact of the COVID - 19 pandemic on future operating results, cash flows and/or its financial condition will be primarily driven by : the pandemic’s severity and duration ; healthcare insurer, government and client payer reimbursement rates for COVID - 19 molecular tests ; the pandemic’s impact on the U . S . healthcare system and the U . S . economy ; and the timing, scope and effectiveness of federal, state and local governmental responses to the pandemic which are drivers beyond the Company’s knowledge and control .
What you’ll hear today Quest’s role in the pandemic and opportunities ahead Operational excellence drives improved health outcomes and cost savings Enhancements in the consumer and provider journeys Opportunities to continue generating 3% annual savings
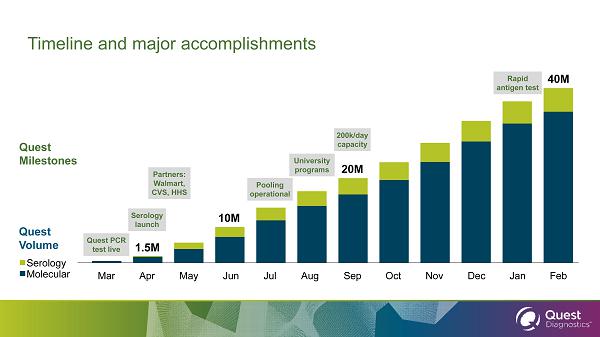
Timeline and major accomplishments 10M 20M 40M 1.5M Feb May Jan Nov Quest PCR test live Mar Aug Jun Pooling operational Serology launch 200k/day capacity Rapid antigen test Partners: Walmart, CVS, HHS University programs Apr Jul Sep Oct Dec Serology Molecular Quest Volume Quest Milestones
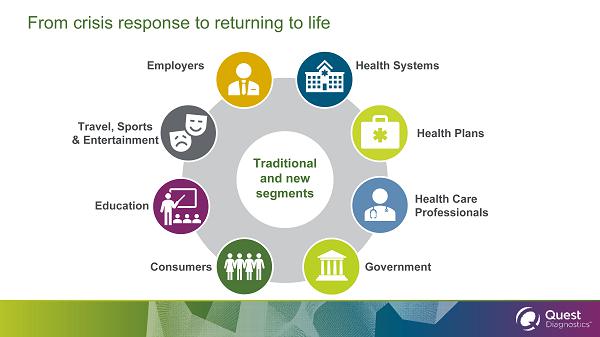
From crisis response to returning to life Health Care Professionals Health Systems Health Plans Traditional and n ew s egments Government Employers Consumers Education Travel, Sports & Entertainment .
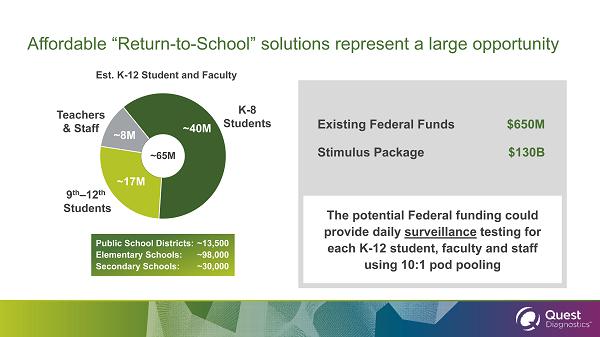
Affordable “Return - to - School” solutions represent a large opportunity The potential Federal funding could provide daily surveillance testing for each K - 12 student, faculty and staff using 10:1 pod pooling Existing Federal Funds $650M Stimulus Package $130B Public School Districts: ~13,500 Elementary Schools: ~98,000 Secondary Schools: ~30,000 Est. K - 12 Student and Faculty ~65M ~40M K - 8 Students ~17M 9 th – 12 th Students ~8M Teachers & Staff
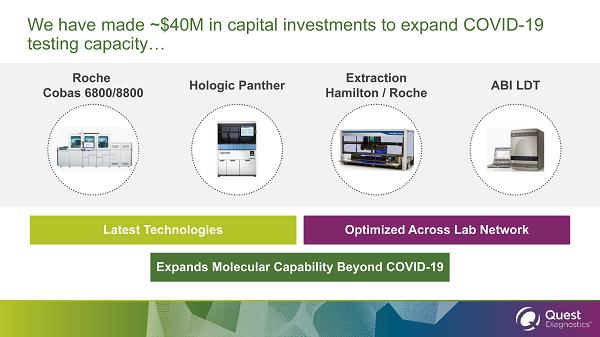
We have made ~$40M in capital investments to expand COVID - 19 testing capacity… Roche Cobas 6800/8800 Hologic Panther Extraction Hamilton / Roche ABI LDT Latest Technologies Expands Molecular Capability Beyond COVID - 19 Optimized Across Lab Network
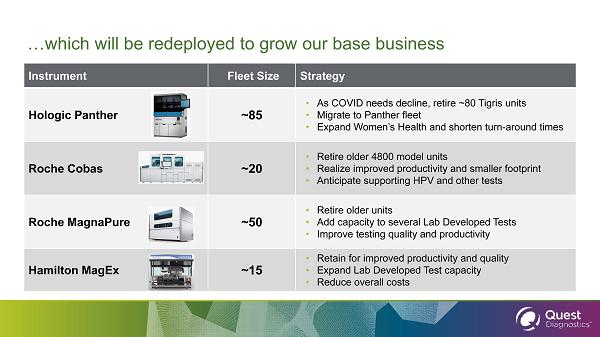
…which will be redeployed to grow our base business Instrument Fleet Size Strategy Hologic Panther ~85 • As COVID needs decline, retire ~80 Tigris units • Migrate to Panther fleet • Expand Women’s Health and shorten turn - around times Roche Cobas ~20 • Retire older 4800 model units • Realize improved productivity and smaller footprint • Anticipate supporting HPV and other tests Roche MagnaPure ~50 • Retire older units • Add capacity to several Lab Developed Tests • Improve testing quality and productivity Hamilton MagEx ~15 • Retain for improved productivity and quality • Expand Lab Developed Test capacity • Reduce overall costs
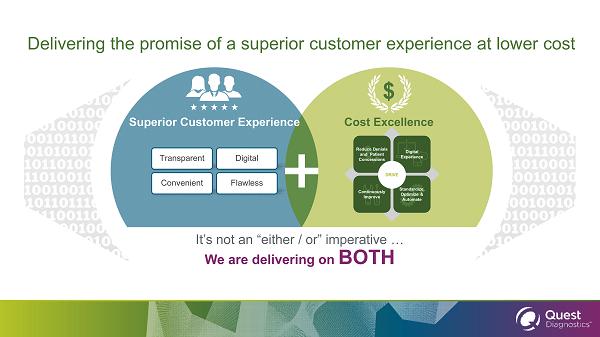
Transparent Digital Convenient Flawless Superior Customer Experience Cost Excellence $ Confidential | Internal Use Only It’s not an “either / or” imperative … We are delivering on BOTH Delivering the promise of a superior customer experience at lower cost
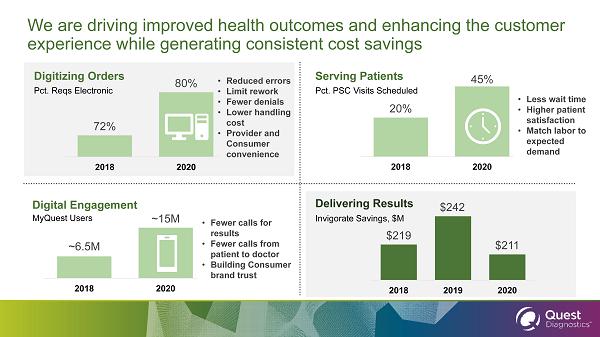
We are driving improved health outcomes and enhancing the customer experience while generating consistent cost savings 72% 80% 2018 2020 Digitizing Orders 20% 45% 2018 2020 Serving Patients Pct. Reqs Electronic Pct. PSC Visits Scheduled ~ 6.5 M ~15M 2018 2020 Digital Engagement MyQuest Users $219 $242 $211 2018 2019 2020 Delivering Results Invigorate Savings, $M • Less wait time • Higher patient satisfaction • Match labor to expected demand • Fewer calls for results • Fewer calls from patient to doctor • Building Consumer brand trust • Reduced errors • Limit rework • Fewer denials • Lower handling cost • Provider and Consumer convenience
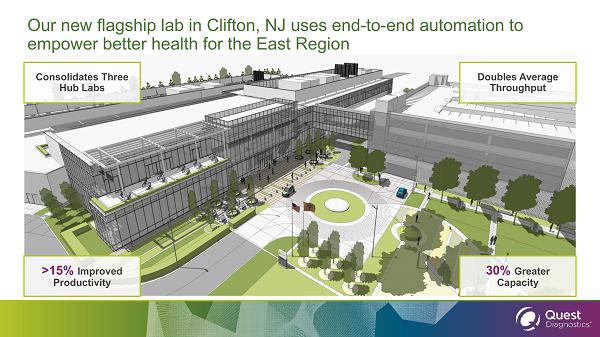
Our new flagship lab in Clifton, NJ uses end - to - end automation to empower better health for the East Region >15% Improved Productivity Doubles Average Throughput 30% Greater Capacity Consolidates Three Hub Labs
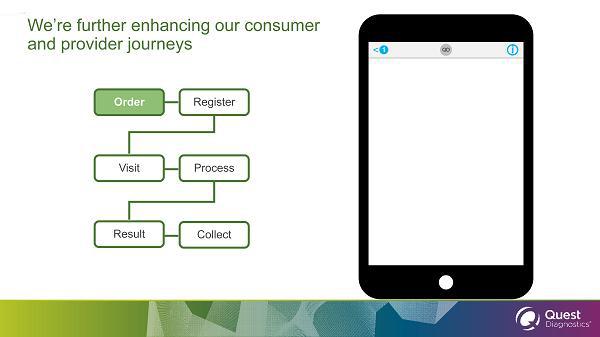
Ms. Williams, your doctor has placed an order with us. Please click here to make an appointment. Welcome to Quest Diagnostics, Ms. Williams. Ms. Williams, based on your location and preferences, we suggest Friday at 8 AM for your appointment. Can you verify your insurance information so we can check if there will be any out - of - pocket expense? Wed, May 19, 1:34 PM 1 < i QD Order We’re further enhancing our consumer and provider journeys Order Register Visit Process Result Collect DM27
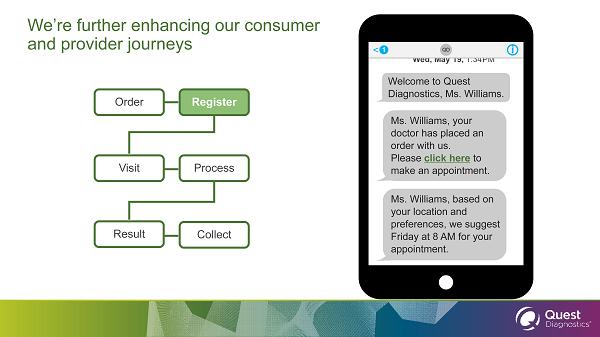
Ms. Williams, your doctor has placed an order with us. Please click here to make an appointment. Welcome to Quest Diagnostics, Ms. Williams. Ms. Williams, based on your location and preferences, we suggest Friday at 8 AM for your appointment. Can you verify your insurance information so we can check if there will be any out - of - pocket expense? Wed, May 19, 1:34 PM 1 < i QD Order We’re further enhancing our consumer and provider journeys Register Visit Process Result Collect
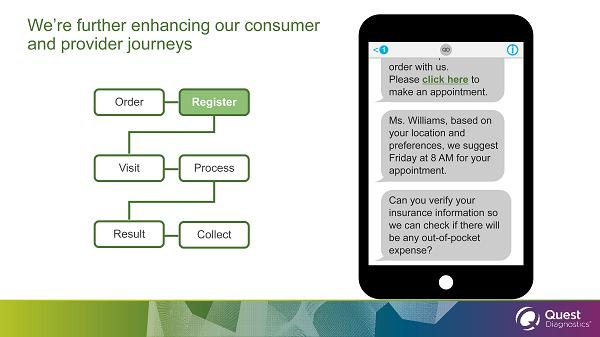
Ms. Williams, your doctor has placed an order with us. Please click here to make an appointment. Welcome to Quest Diagnostics, Ms. Williams. Ms. Williams, based on your location and preferences, we suggest Friday at 8 AM for your appointment. Can you verify your insurance information so we can check if there will be any out - of - pocket expense? We estimate your bill at $12.34 for the four tests ordered. Would you like to place a credit card on file for when your claim is processed? 1 < i QD Order We’re further enhancing our consumer and provider journeys Register Visit Process Result Collect
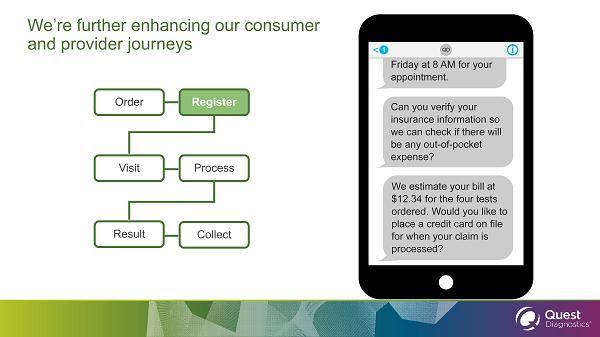
make an appointment. Ms. Williams, based on your location and preferences, we suggest Friday at 8 AM for your appointment. Can you verify your insurance information so we can check if there will be any out - of - pocket expense? We estimate your bill at $12.34 for the four tests ordered. Would you like to place a credit card on file for when your claim is processed? Good Morning Ms. Williams, tomorrow is your appointment at 8 AM at Jersey City PSC. Thu, May 20, 8:30 AM 1 < i QD Order We’re further enhancing our consumer and provider journeys Register Visit Process Result Collect
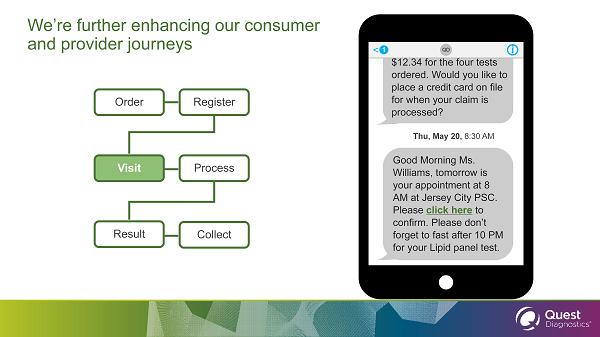
we can check if there will be any out - of - pocket expense? We estimate your bill at $12.34 for the four tests ordered. Would you like to place a credit card on file for when your claim is processed? Good Morning Ms. Williams, tomorrow is your appointment at 8 AM at Jersey City PSC. Please click here to confirm. Please don’t forget to fast after 10 PM for your Lipid panel test. Ms. Williams, your specimen arrived in our Clifton Lab. We hope you had a good visit to our Thu, May 20, 8:30 AM Fri, May 21, 3:42 PM 1 < i QD Order We’re further enhancing our consumer and provider journeys Register Visit Process Result Collect
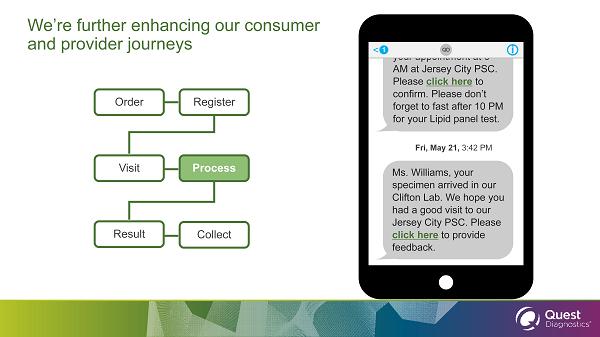
Good Morning Ms. Williams, tomorrow is your appointment at 8 AM at Jersey City PSC. Please click here to confirm. Please don’t forget to fast after 10 PM for your Lipid panel test. Ms. Williams, your specimen arrived in our Clifton Lab. We hope you had a good visit to our Jersey City PSC. Please click here to provide feedback. Ms. Williams, your tests have been completed. Please go to your myQuest app to see Thu, May 20, 8:30 AM Fri, May 21, 3:42 PM Sat, May 22, 8:00 AM 1 < i QD Order We’re further enhancing our consumer and provider journeys Register Visit Process Result Collect
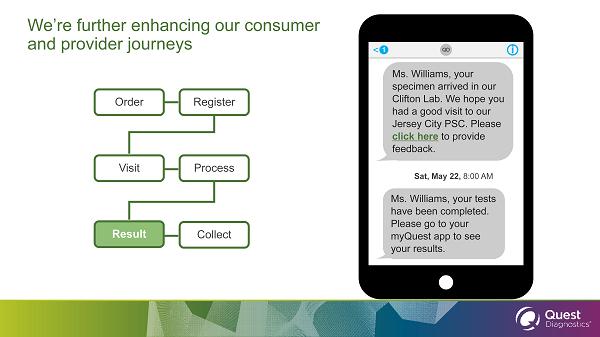
confirm. Please don’t forget to fast after 10 PM for your Lipid panel test. Ms. Williams, your specimen arrived in our Clifton Lab. We hope you had a good visit to our Jersey City PSC. Please click here to provide feedback. Ms. Williams, your tests have been completed. Please go to your myQuest app to see your results. Your claim has been processed by your Health Plan. Your Health Plan paid $78, Fri, May 21, 3:42 PM Sat, May 22, 8:00 AM Mon, May 24, 11:18 AM 1 < i QD Order We’re further enhancing our consumer and provider journeys Register Visit Process Result Collect
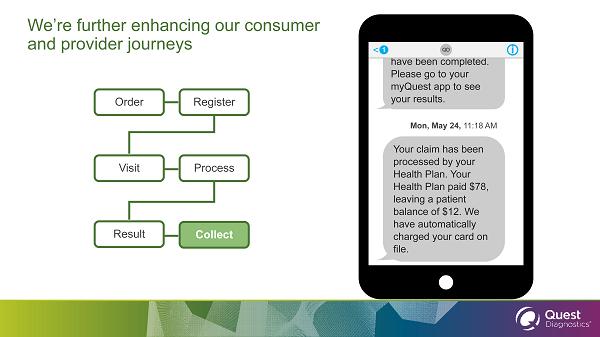
feedback. Ms. Williams, your tests have been completed. Please go to your myQuest app to see your results. Your claim has been processed by your Health Plan. Your Health Plan paid $78, leaving a patient balance of $12. We have automatically charged your card on file. Sat, May 22, 8:00 AM Mon, May 24, 11:18 AM 1 < i QD Order We’re further enhancing our consumer and provider journeys Register Visit Process Result Collect
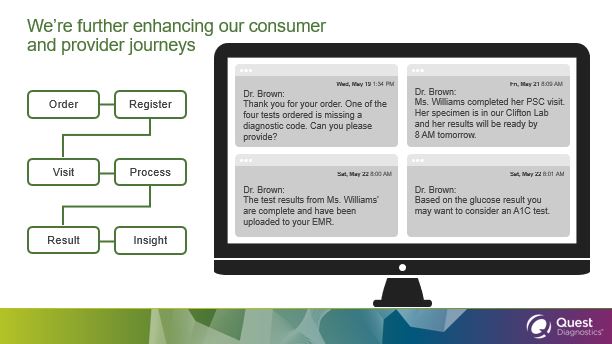
We’re further enhancing our consumer and provider journeys Dr. Brown: Ms. Williams completed her PSC visit. Her specimen is in our Clifton Lab and her results will be ready by 8 AM tomorrow. Fri, May 21 8:09 AM Dr. Brown: The test results from Ms. Williams’ are complete and have been uploaded to your EMR. Sat, May 22 8:00 AM Dr. Brown: Based on the glucose result you may want to consider an A1C test. Sat, May 22 8:01 AM Order Register Visit Process Result Insight Dr. Brown: Thank you for your order. One of the four tests ordered is missing a diagnostic code. Can you please provide? Wed, May 19 1:34 PM DM23 DM26
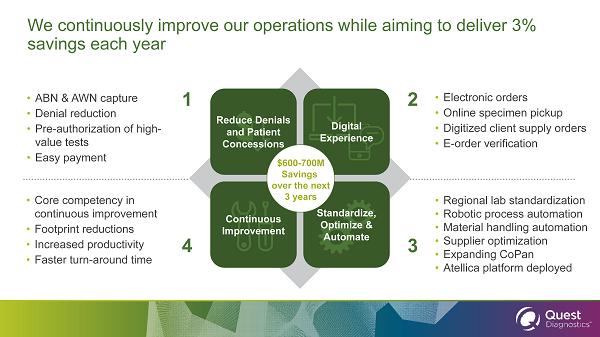
We continuously improve our operations while aiming to deliver 3% savings each year $ 1 2 Reduce Denials and Patient Concessions Digital Experience Standardize, Optimize & Automate Continuous Improvement 4 3 • ABN & AWN capture • Denial reduction • Pre - authorization of high - value tests • Easy payment • Core competency in continuous i mprovement • Footprint reductions • Increased productivity • Faster turn - around time • Regional lab standardization • Robotic process a utomation • Material handling automation • Supplier optimization • Expanding CoPa n • Atellica platform deployed • Electronic orders • Online specimen p ickup • Digitized client supply orders • E - order verification $600 - 700M Savings o ver the next 3 years
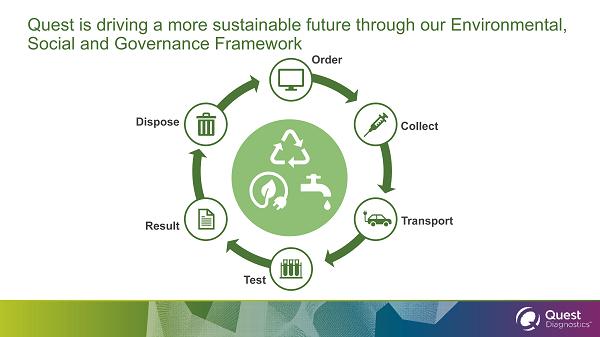
Quest is driving a more sustainable future through our Environmental, Social and Governance Framework Test Order Collect Transport Result Dispose
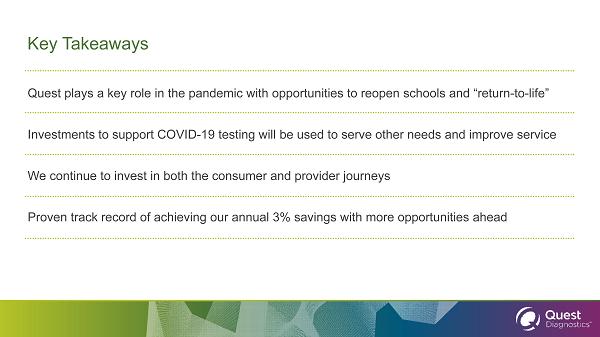
Key Takeaways Quest plays a key role in the pandemic with opportunities to reopen schools and “return - to - life” Investments to support COVID - 19 testing will be used to serve other needs and improve service We continue to invest in both the consumer and provider journeys Proven track record of achieving our annual 3% savings with more opportunities ahead
Exhibit 99.4


Direct - to - Consumer Opportunity Cathy Doherty SVP, Clinical Franchises & Marketing
SAFE HARBOR DISCLOSURE The statements in the following presentations which are not historical facts may be forward - looking statements . Readers are cautioned not to place undue reliance on forward - looking statements, which speak only as of the date that they are made and which reflect management’s current estimates, projections, expectations or beliefs and which involve risks and uncertainties that could cause actual results and outcomes to be materially different . Risks and uncertainties that may affect the future results of the company include, but are not limited to, impacts of the COVID - 19 pandemic and measures taken in response, adverse results from pending or future government investigations, lawsuits or private actions, the competitive environment, the complexity of billing, reimbursement and revenue recognition for clinical laboratory testing, changes in government regulations, changing relationships with customers, payers, suppliers or strategic partners and other factors discussed in the company's most recently filed Annual Report on Form 10 - K and in any of the company's subsequently filed Quarterly Reports on Form 10 - Q and Current Reports on Form 8 - K, including those discussed in the “Business,” “Risk Factors,” “Cautionary Factors that May Affect Future Results” and “Management’s Discussion and Analysis of Financial Condition and Results of Operations” sections of those reports . The Company continues to believe that the impact of the COVID - 19 pandemic on future operating results, cash flows and/or its financial condition will be primarily driven by : the pandemic’s severity and duration ; healthcare insurer, government and client payer reimbursement rates for COVID - 19 molecular tests ; the pandemic’s impact on the U . S . healthcare system and the U . S . economy ; and the timing, scope and effectiveness of federal, state and local governmental responses to the pandemic which are drivers beyond the Company’s knowledge and control .
What you’ll hear today Consumers are increasingly engaged in their health, including diagnostics Consumer - initiated testing market is positioned for breakout growth Targeted marketing and enhanced digital experience will drive performance QuestDirect is a robust dynamic offering that can capture this opportunity
Leading the way in personal diagnostics OUR CONSUMER VISION
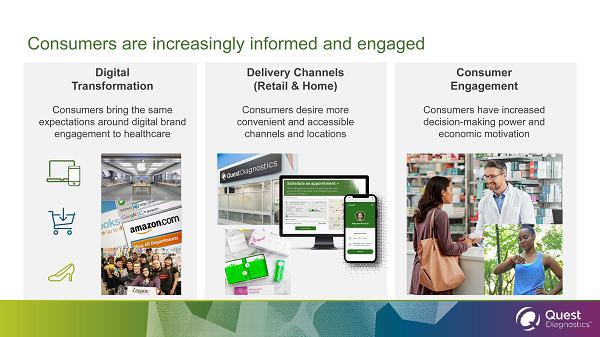
Consumers are increasingly informed and engaged Digital Transformation Consumers bring the same expectations around digital brand engagement to healthcare Delivery Channels (Retail & Home) Consumers desire more convenient and accessible channels and locations Consumer Engagement Consumers have increased decision - making power and economic motivation
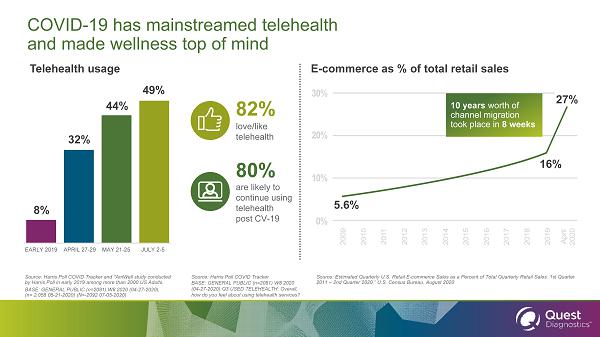
16% COVID - 19 has mainstreamed telehealth and made wellness top of mind Telehealth usage E - commerce as % of total retail sales Source: Harris Poll COVID Tracker and * AmWell study conducted by Harris Poll in early 2019 among more than 2000 US Adults. BASE: GENERAL PUBLIC (n=2081) W8 2020 (04 - 27 - 2020), (n= 2,058 05 - 21 - 2020) (N= - 2092 07 - 05 - 2020) EARLY 2019 APRIL 27 - 29 MAY 21 - 25 JULY 2 - 5 8% 32% 44% 49% 5.6% 27% 10 years worth of channel migration took place in 8 weeks Source: Estimated Quarterly U.S. Retail E - commerce Sales as a Percent of Total Quarterly Retail Sales: 1st Quarter 2011 – 2nd Quarter 2020,” U.S. Census Bureau, August 2020 82% love/like telehealth 80% are likely to continue using telehealth post CV - 19 Source: Harris Poll COVID Tracker BASE: GENERAL PUBLIC (n=2081) W8 2020 (04 - 27 - 2020) Q3 USED TELEHEALTH: Overall, how do you feel about using telehealth services?
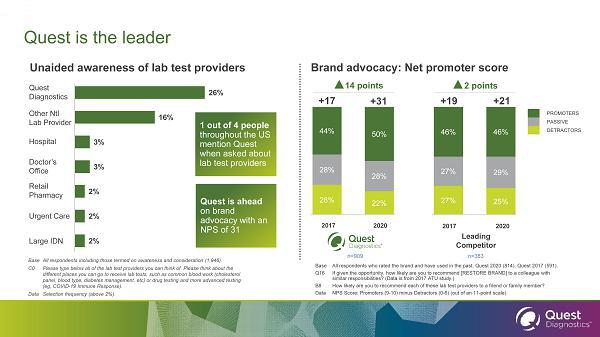
Quest is ahead on brand advocacy with an NPS of 31 1 out of 4 people throughout the US mention Quest when asked about lab test providers Quest is the leader Unaided awareness of lab test providers Brand advocacy: Net promoter score 26% 16% 3% 3% 2% 2% 2% Quest Diagnostics Other Ntl Lab Provider Hospital Doctor's Office Retail Pharmacy Urgent Care Large IDN Base All respondents including those termed on awareness and consideration (1,946). C0 Please type below all of the lab test providers you can think of. Please think about the different places you can go to receive lab tests, such as common blood work (cholesterol panel, blood type, diabetes management, etc ) or drug testing and more advanced testing ( eg , COVID - 19 Immune Response). Data Selection frequency (above 2%). 28% 22% 28% 28% 44% 50% 46% 46% 27% 29% 27% 25% 14 points 2020 2017 2020 2017 n=383 n=909 2 points Base All respondents who rated the brand and have used in the past: Quest 2020 (814), Quest 2017 (591). Q16 If given the opportunity, how likely are you to recommend [RESTORE BRAND] to a colleague with similar responsibilities? (Data is from 2017 ATU study.) B8 How likely are you to recommend each of these lab test providers to a friend or family member? Data NPS Score: Promoters (9 - 10) minus Detractors (0 - 6) (out of an 11 - point scale). Leading Competitor +17 +31 +19 +21 PROMOTERS PASSIVE DETRACTORS Quest Diagnostics Other Ntl Lab Provider Hospital Doctor’s Office Retail Pharmacy Urgent Care Large IDN BSC1
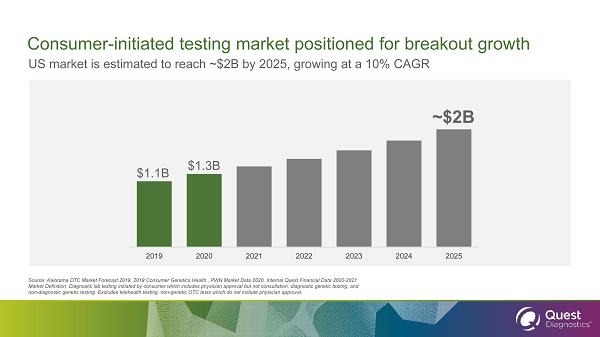
2019 2020 2021 2022 2023 2024 2025 US market is estimated to reach ~$2B by 2025, growing at a 10% CAGR Consumer - initiated testing market positioned for breakout growth Source: Kalorama DTC Market Forecast 2019, 2019 Consumer Genetics Health , PWN Market Data 2020, Internal Quest Financial Dat a 2 020 - 2021 Market Definition: Diagnostic lab testing initiated by consumer which includes physician approval but not consultation, diagn ost ic genetic testing, and non - diagnostic genetic testing. Excludes telehealth testing, non - genetic OTC tests which do not include physician approval. ~$2B $1.1B $1.3B

We’ve built a compelling product offering to appeal to the market
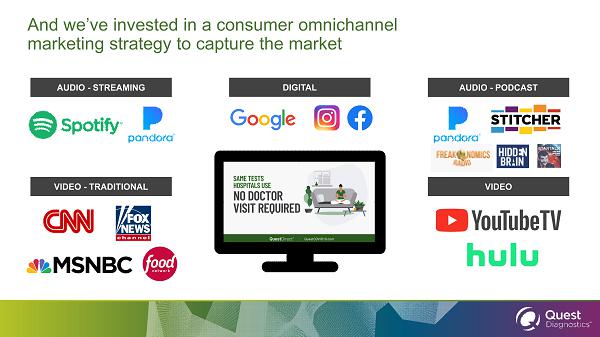
And we’ve invested in a consumer omnichannel marketing strategy to capture the market AUDIO - STREAMING VIDEO - TRADITIONAL AUDIO - PODCAST VIDEO DIGITAL
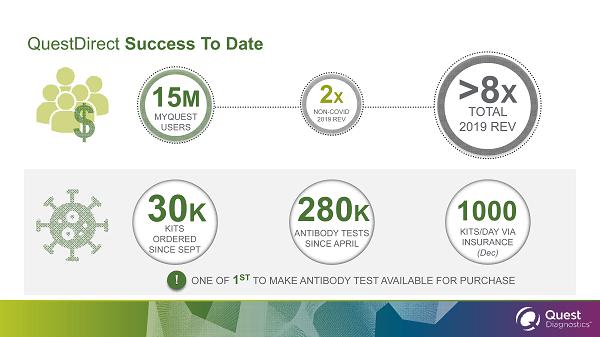
QuestDirect Success To Date 15 M MYQUEST USERS 2 X NON - COVID 2019 REV >8 X TOTAL 2019 REV 30 K KITS ORDERED SINCE SEPT 280 K ANTIBODY TESTS SINCE APRIL 1000 KITS/DAY VIA INSURANCE (Dec) ONE OF 1 ST TO MAKE ANTIBODY TEST AVAILABLE FOR PURCHASE !
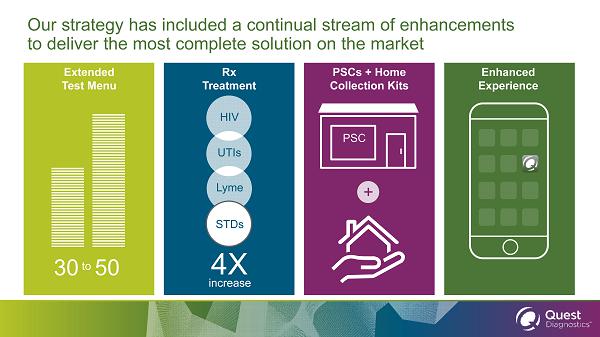
Our strategy has included a continual stream of enhancements to deliver the most complete solution on the market Extended Test Menu 30 50 to Rx Treatment 4X increase HIV UTIs Lyme STDs PSCs + Home Collection Kits + PSC Enhanced Experience
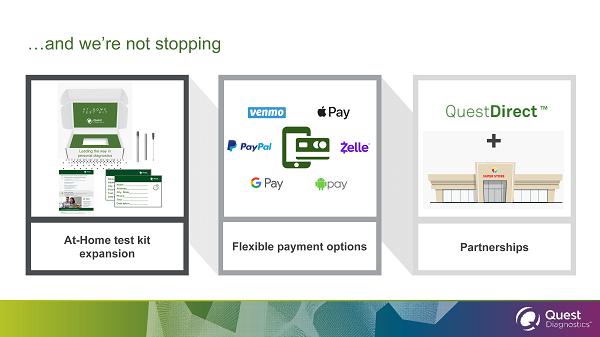
…and we’re not stopping Partnerships At - Home test kit expansion Flexible payment options AT HOME TEST KIT Leading the way in personal diagnostics Name _____________________________ Address ___________________________ City, State _________________________ Phone ______________________________ Test _______________________________ Date taken __________________________ Name ___________________ Address_________________ City, State_______________ Phone___________________ Test ___________________ Date taken ______________________ +
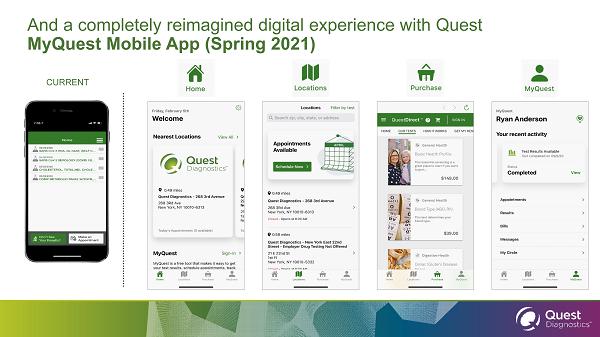
CURRENT And a completely reimagined digital experience with Quest MyQuest Mobile App (Spring 2021)
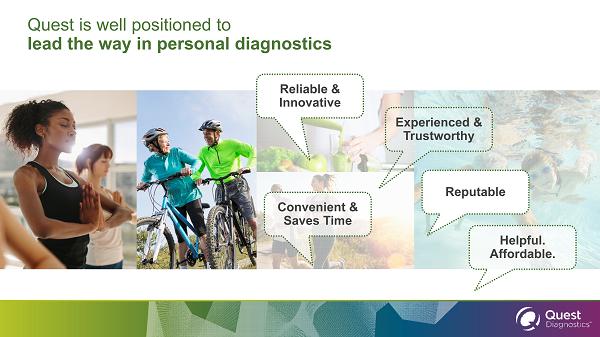
Quest is well positioned to lead the way in personal diagnostics Reliable & Innovative Experienced & Trustworthy Convenient & Saves Time Reputable Helpful. Affordable.
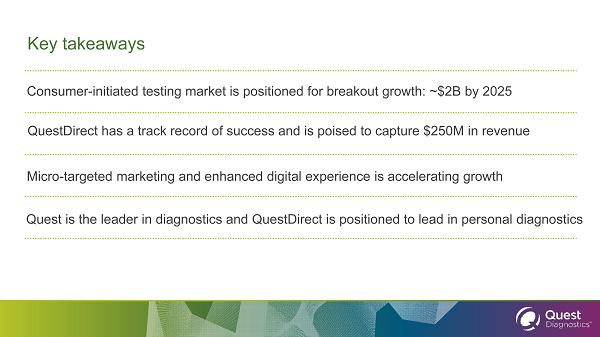
Key takeaways Consumer - initiated testing market is positioned for breakout growth: ~$2B by 2025 Micro - targeted marketing and enhanced digital experience is accelerating growth Quest is the leader in diagnostics and QuestDirect is positioned to lead in personal diagnostics QuestDirect has a track record of success and is poised to capture $250M in revenue
Exhibit 99.5

Quest by the Numbers Mark Guinan Executive Vice President and Chief Financial Officer
SAFE HARBOR DISCLOSURE The statements in the following presentations which are not historical facts may be forward - looking statements . Readers are cautioned not to place undue reliance on forward - looking statements, which speak only as of the date that they are made and which reflect management’s current estimates, projections, expectations or beliefs and which involve risks and uncertainties that could cause actual results and outcomes to be materially different . Risks and uncertainties that may affect the future results of the company include, but are not limited to, impacts of the COVID - 19 pandemic and measures taken in response, adverse results from pending or future government investigations, lawsuits or private actions, the competitive environment, the complexity of billing, reimbursement and revenue recognition for clinical laboratory testing, changes in government regulations, changing relationships with customers, payers, suppliers or strategic partners and other factors discussed in the company's most recently filed Annual Report on Form 10 - K and in any of the company's subsequently filed Quarterly Reports on Form 10 - Q and Current Reports on Form 8 - K, including those discussed in the “Business,” “Risk Factors,” “Cautionary Factors that May Affect Future Results” and “Management’s Discussion and Analysis of Financial Condition and Results of Operations” sections of those reports . The Company continues to believe that the impact of the COVID - 19 pandemic on future operating results, cash flows and/or its financial condition will be primarily driven by : the pandemic’s severity and duration ; healthcare insurer, government and client payer reimbursement rates for COVID - 19 molecular tests ; the pandemic’s impact on the U . S . healthcare system and the U . S . economy ; and the timing, scope and effectiveness of federal, state and local governmental responses to the pandemic which are drivers beyond the Company’s knowledge and control .
What you’ll hear today Review of 2018 - 2020 performance Capital deployment – past & future Setting a baseline for future growth beyond 2022 Framing the assumptions for our long - term outlook Long - term outlook
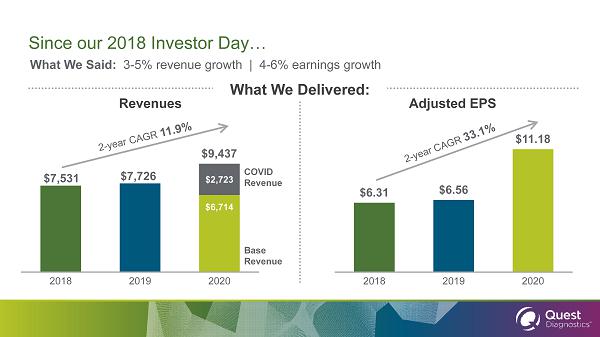
What We Said: 3 - 5% revenue growth | 4 - 6% earnings growth Since our 2018 Investor Day… $7,531 $7,726 $6,714 $2,723 2018 2019 2020 $6.31 $6.56 $11.18 2018 2019 2020 Revenues Adjusted EPS What We Delivered: $9,437 Base Revenue COVID Revenue
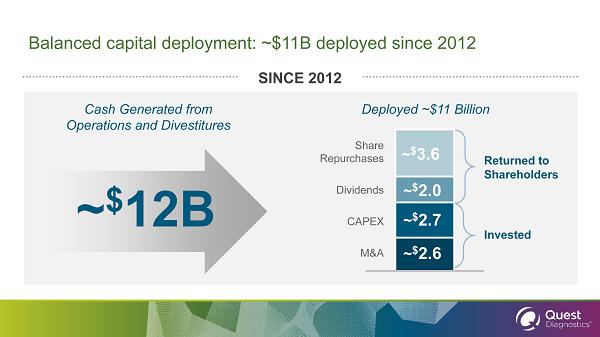
Balanced capital deployment: ~$11B deployed since 2012 ~ $ 2.0 CAPEX Cash Generated from Operations and Divestitures ~ $ 2.6 ~ $ 2.7 ~ $ 3.6 M&A Dividends Share Repurchases Deployed ~$11 Billion Returned to Shareholders Invested SINCE 2012 ~ $ 12B
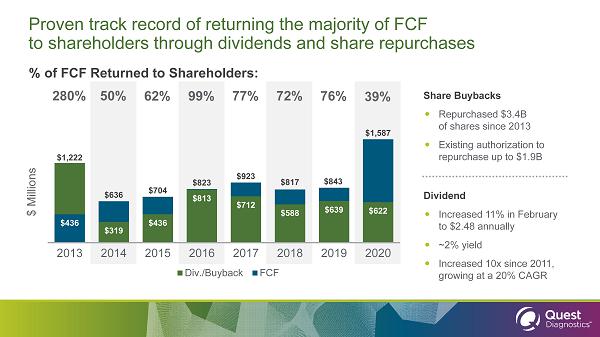
Proven track record of returning the majority of FCF to shareholders through dividends and share repurchases Share Buybacks Repurchased $3.4B of shares since 2013 Existing authorization to repurchase up to $1.9B Dividend Increased 11% in February to $2.48 annually ~2% yield Increased 10x since 2011, growing at a 20% CAGR $436 $319 $436 $813 $712 $588 $639 $622 $1,222 $636 $704 $823 $923 $817 $843 $1,587 2013 2014 2015 2016 2017 2018 2019 2020 Div./Buyback FCF % of FCF Returned to Shareholders: 50% 62% 99% 280% 77% 72% $ Millions 76% 39%
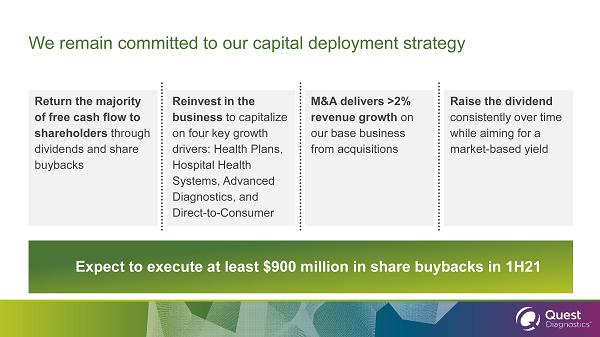
Return the majority of free cash flow to shareholders through dividends and share buybacks M&A delivers >2% revenue growth on our base business from acquisitions Reinvest in the business to capitalize on four key growth drivers: Health Plans, Hospital Health Systems, Advanced Diagnostics, and Direct - to - Consumer Raise the dividend consistently over time while aiming for a market - based yield Expect to execute at least $900 million in share buybacks in 1H21 We remain committed to our capital deployment strategy
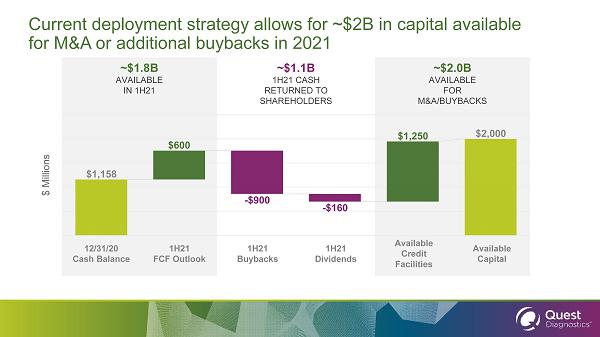
Current deployment strategy allows for ~$2B in capital available for M&A or additional buybacks in 2021 ~$2.0B AVAILABLE FOR M&A/BUYBACKS ~$1.1B 1H21 CASH RETURNED TO SHAREHOLDERS ~$1.8B AVAILABLE IN 1H21 Available Credit Facilities 12/31/20 Cash Balance 1H21 FCF Outlook 1H21 Buybacks 1H21 Dividends Available Capital
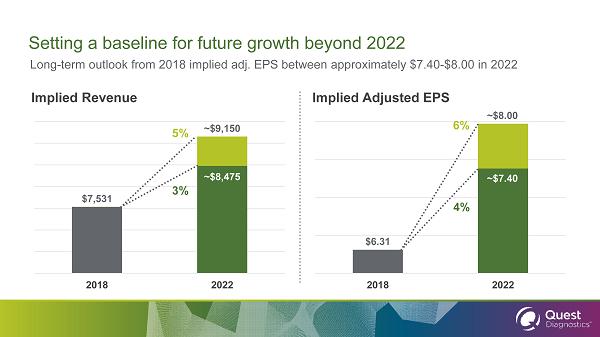
Setting a baseline for future growth beyond 2022 Long - term outlook from 2018 implied adj. EPS between approximately $7.40 - $8.00 in 2022 Implied Revenue Implied Adjusted EPS 2018 2022 2018 2022 3% 5% 4% 6% $7,531 ~$9,150 $6.31 ~$8.00 ~$8,475 ~$7.40
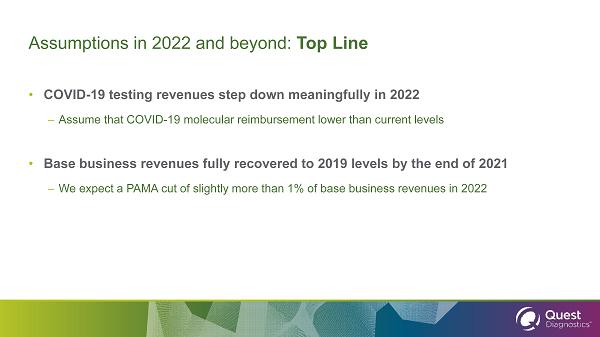
Assumptions in 2022 and beyond: Top Line • COVID - 19 testing revenues step down meaningfully in 2022 – Assume that COVID - 19 molecular reimbursement lower than current levels • Base business revenues fully recovered to 2019 levels by the end of 2021 – We expect a PAMA cut of slightly more than 1% of base business revenues in 2022
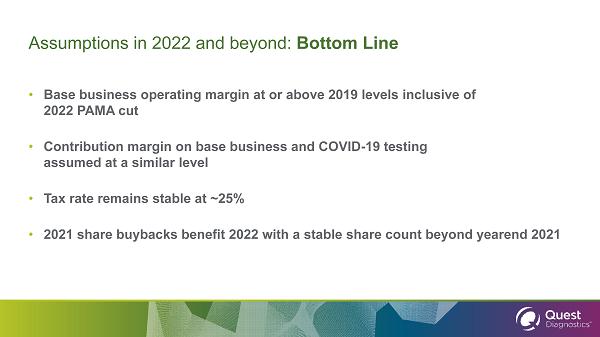
Assumptions in 2022 and beyond: Bottom Line • Base business operating margin at or above 2019 levels inclusive of 2022 PAMA cut • Contribution margin on base business and COVID - 19 testing assumed at a similar level • Tax rate remains stable at ~25% • 2021 share buybacks benefit 2022 with a stable share count beyond yearend 2021
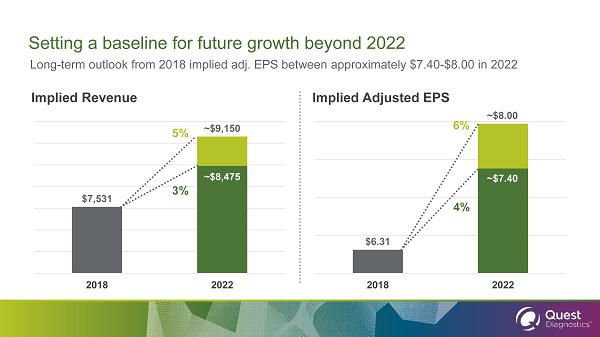
Setting a baseline for future growth beyond 2022 Long - term outlook from 2018 implied adj. EPS between approximately $7.40 - $8.00 in 2022 Implied Revenue Implied Adjusted EPS 2018 2022 2018 2022 3% 5% 4% 6% $7,531 ~$9,150 $6.31 ~$8.00 ~$8,475 ~$7.40
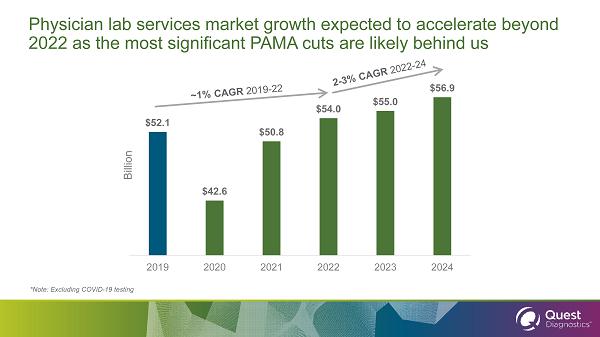
*Note: Excluding COVID - 19 testing Physician lab services market growth expected to accelerate beyond 2022 as the most significant PAMA cuts are likely behind us $52.1 $42.6 $50.8 $54.0 $55.0 $56.9 2019 2020 2021 2022 2023 2024 Billion
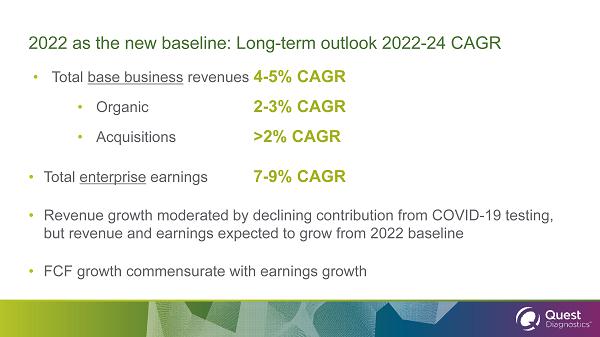
2022 as the new baseline: Long - term outlook 2022 - 24 CAGR • Total base business revenues 4 - 5% CAGR • Organic 2 - 3% CAGR • Acquisitions >2% CAGR • Total enterprise earnings 7 - 9% CAGR • Revenue growth moderated by declining contribution from COVID - 19 testing, but revenue and earnings expected to grow from 2022 baseline • FCF growth commensurate with earnings growth
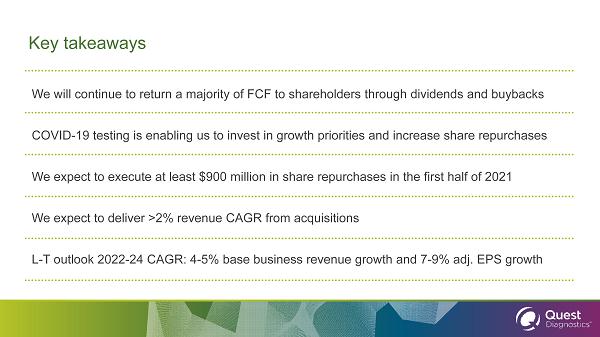
Key takeaways We will continue to return a majority of FCF to shareholders through dividends and buybacks COVID - 19 testing is enabling us to invest in growth priorities and increase share repurchases We expect to execute at least $900 million in share repurchases in the first half of 2021 We expect to deliver >2% revenue CAGR from acquisitions L - T outlook 2022 - 24 CAGR: 4 - 5% base business revenue growth and 7 - 9% adj. EPS growth
Appendix Non - GAAP Reconciliations
Note on Non - GAAP Financial Measures
The non-GAAP measures for (i) adjusted diluted EPS from
continuing operations, (ii) free cash flow and (iii) contribution margin are presented because management believes those measures
are useful adjuncts to measures under the accounting principles generally accepted in the United States (“GAAP”).
As used in this presentation the term (i) “adjusted”
refers to non-GAAP measures that exclude special items such as restructuring and integration charges, certain financial impacts
resulting from the COVID-19 pandemic, amortization expense, excess tax benefit associated with stock-based compensation, a gain
on remeasurement of an equity interest, costs associated with donations, contributions and other financial support through Quest
for Health Equity, the company's recently announced initiative with the Quest Diagnostics Foundation to reduce health disparities
in underserved communities, the gain on the sale and leaseback of a property, and other items; (ii) “free cash flow”
refers to operating cash flows less capital expenditures and (iii) “contribution margin” refers to: (a) revenues less
direct incremental costs related to such revenues, divided by: (b) such revenues.
The company has provided compound annual growth rate projections of 7 - 9% for adjusted diluted EPS and free cash flow, which are non - GAAP measures. The company is unable to
present a reconciliation of these non - GAAP measures to the most comparable GAAP measure due to the inherent uncertainty and
variability in the nature and amount of special items referenced above. Non - GAAP measures should not be considered as an
alternative to the corresponding measures determined under GAAP. Management may use these non - GAAP measures to evaluate
our performance period over period and relative to competitors, to analyze the underlying trends in our business, to establish
operational budgets and forecasts and for incenti ve compensation purposes. We believe that these non - GAAP measures are useful
to investors and analysts to evaluate our performance period over period and relative to competitors, as well as to analyze the
underlying trends in our business and t o a ssess our performance. The following tables reconcile reported GAAP measures to non - GAAP
measures.
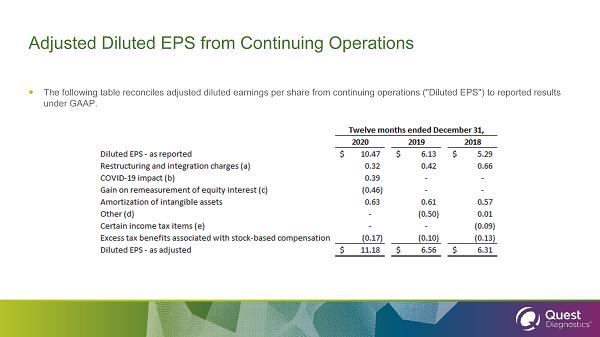
Adjusted Diluted EPS from Continuing Operations The following table reconciles adjusted diluted earnings per share from continuing operations ("Diluted EPS") to reported res ult s under GAAP.
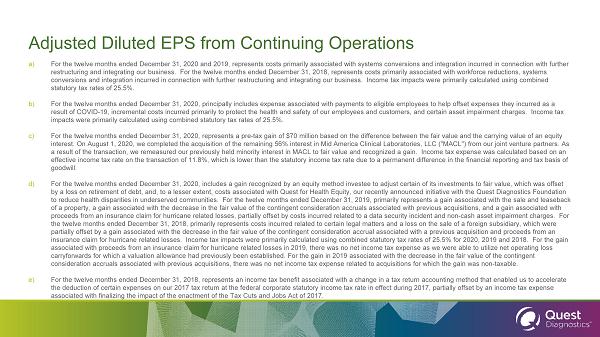
Adjusted Diluted EPS from Continuing Operations a) For the twelve months ended December 31, 2020 and 2019, represents costs primarily associated with systems conversions and in teg ration incurred in connection with further restructuring and integrating our business. For the twelve months ended December 31, 2018, represents costs primarily associate d with workforce reductions, systems conversions and integration incurred in connection with further restructuring and integrating our business. Income tax impacts were primarily calculated using combined statutory tax rates of 25.5%. b) For the twelve months ended December 31, 2020, principally includes expense associated with payments to eligible employees to he lp offset expenses they incurred as a result of COVID - 19, incremental costs incurred primarily to protect the health and safety of our employees and customers, and ce rtain asset impairment charges. Income tax impacts were primarily calculated using combined statutory tax rates of 25.5%. c) For the twelve months ended December 31, 2020, represents a pre - tax gain of $70 million based on the difference between the fair value and the carrying value of an equity interest. On August 1, 2020, we completed the acquisition of the remaining 56% interest in Mid America Clinical Laboratories, LL C ("MACL") from our joint venture partners. As a result of the transaction, we remeasured our previously held minority interest in MACL to fair value and recognized a gain. I ncome tax expense was calculated based on an effective income tax rate on the transaction of 11.8%, which is lower than the statutory income tax rate due to a permanent d iff erence in the financial reporting and tax basis of goodwill. d) For the twelve months ended December 31, 2020, includes a gain recognized by an equity method investee to adjust certain of its investments to fair value, which was offset by a loss on retirement of debt, and, to a lesser extent, costs associated with Quest for Health Equity, our recently announc ed initiative with the Quest Diagnostics Foundation to reduce health disparities in underserved communities. For the twelve months ended December 31, 2019, primarily represents a gain associated with the sale and leaseback of a property, a gain associated with the decrease in the fair value of the contingent consideration accruals associated with pr evious acquisitions, and a gain associated with proceeds from an insurance claim for hurricane related losses, partially offset by costs incurred related to a data security inc ident and non - cash asset impairment charges. For the twelve months ended December 31, 2018, primarily represents costs incurred related to certain legal matters and a loss on th e sale of a foreign subsidiary, which were partially offset by a gain associated with the decrease in the fair value of the contingent consideration accrual associated wit h a previous acquisition and proceeds from an insurance claim for hurricane related losses. Income tax impacts were primarily calculated using combined statutory tax rates o f 25.5% for 2020, 2019 and 2018. For the gain associated with proceeds from an insurance claim for hurricane related losses in 2019, there was no net income tax expense as we were able to utilize net operating loss carryforwards for which a valuation allowance had previously been established. For the gain in 2019 associated with the decre ase in the fair value of the contingent consideration accruals associated with previous acquisitions, there was no net income tax expense related to acquisitions for wh ich the gain was non - taxable. e) For the twelve months ended December 31, 2018, represents an income tax benefit associated with a change in a tax return acco unt ing method that enabled us to accelerate the deduction of certain expenses on our 2017 tax return at the federal corporate statutory income tax rate in effect during 201 7, partially offset by an income tax expense associated with finalizing the impact of the enactment of the Tax Cuts and Jobs Act of 2017.
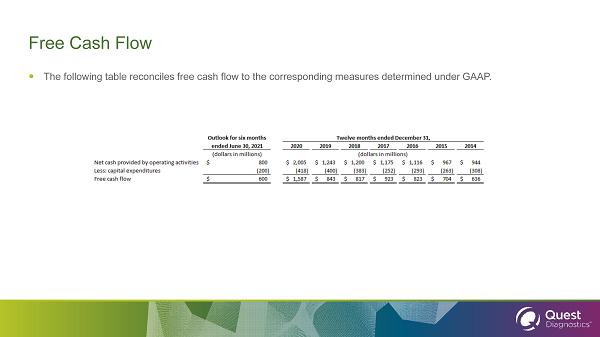
Free Cash Flow The following table reconciles free cash flow to the corresponding measures determined under GAAP.