false
0001022079
0001022079
2025-03-19
2025-03-19
iso4217:USD
xbrli:shares
iso4217:USD
xbrli:shares
UNITED STATES
SECURITIES AND EXCHANGE COMMISSION
WASHINGTON, DC 20549
FORM 8-K
CURRENT REPORT PURSUANT TO SECTION 13 OR 15(d)
OF
THE SECURITIES EXCHANGE ACT OF 1934
Date of Report (Date of Earliest
Event Reported): March 19, 2025
Quest Diagnostics Incorporated
(Exact Name of Registrant as Specified in
Its Charter)
Delaware
(State or other jurisdiction of incorporation)
| 001-12215 |
|
16-1387862 |
| (Commission File Number) |
|
(I.R.S. Employer Identification No.) |
| |
|
|
| 500 Plaza Drive |
|
|
| Secaucus, NJ |
|
07094 |
| (Address of principal executive offices) |
|
(Zip Code) |
|
| |
|
(973) 520-2700 |
|
| (Registrant's telephone number, including area code) |
Check the appropriate box below if the Form 8-K filing is intended
to simultaneously satisfy the filing obligation of the registrant under any of the following provisions (see General Instruction
A.2. below):
☐
Written communications pursuant to Rule 425 under the Securities Act (17 CFR 230.425)
☐
Soliciting material pursuant to Rule 14a-12 under the Exchange Act (17 CFR 240.14a-12)
☐
Pre-commencement communications pursuant to Rule 14d-2(b) under the Exchange Act (17 CFR 240.14d-2(b))
☐
Pre-commencement communications pursuant to Rule 13e-4(c) under the Exchange Act (17 CFR 240.13e-4(c))
Securities registered pursuant to Section 12(b) of the Act:
| Title of each class |
Trading Symbol(s) |
Name of each exchange on which registered |
| Common Stock, $0.01 Par Value |
DGX |
New York Stock Exchange |
Indicate by check mark whether the registrant is an emerging growth
company as defined in Rule 405 of the Securities Act of 1933 (§230.405 of this chapter) or Rule 12b-2 of the Securities Exchange
Act of 1934 (§240.12b-2 of this chapter).
Emerging growth
company ☐
If an emerging growth company, indicate
by check mark if the registrant has elected not to use the extended transition period for complying with any new or revised financial
accounting standards provided pursuant to Section 13(a) of the Exchange Act. ☐
Item 7.01. Regulation FD Disclosure
On March 19, 2025, Quest Diagnostics Incorporated
(the “Company”) hosted an Investor Day during which members of the leadership team discussed the Company's strategies to drive
sustainable growth and deliver long-term shareholder value.
A copy of the presentation materials that were
used by members of the Company’s leadership team are furnished as Exhibits 99.1, 99.2, 99.3 and 99.4 to this Current Report on Form
8-K and are incorporated into this Item 7.01 of this Current Report on Form 8-K by reference. The Investor Day presentation materials
include information regarding the matters discussed by the Company at Investor Day.
The information in the preceding paragraphs,
as well as Exhibits 99.1, 99.2, 99.3 and 99.4, shall not be deemed “filed” for purposes of Section 18 of the Securities Exchange
Act of 1934, as amended (the “Exchange Act”), or otherwise subject to the liabilities of that section. It may only be incorporated
by reference into another filing under the Exchange Act or the Securities Act of 1933, as amended, if such subsequent filing specifically
references this Current Report on Form 8-K.
The statements in the Investor Day presentation
materials which are not historical facts may be forward-looking statements. Readers are cautioned not to place undue reliance on forward-looking
statements, which speak only as of the date that they are made and which reflect management's current estimates, projections, expectations
or beliefs and which involve risks and uncertainties that could cause actual results and outcomes to be materially different. Risks and
uncertainties that may affect the future results of the company include, but are not limited to, adverse results from pending or future
government investigations, lawsuits or private actions, the competitive environment, the complexity of billing, reimbursement and revenue
recognition for clinical laboratory testing, changes in government regulations, changing relationships with customers, payers, suppliers
or strategic partners, acquisitions and other factors discussed in the Company's most recently filed Annual Report on Form 10-K and in
any of the Company's subsequently filed Quarterly Reports on Form 10-Q and Current Reports on Form 8-K, including those discussed in the
"Business," "Risk Factors," "Cautionary Factors that May Affect Future Results" and "Management's Discussion
and Analysis of Financial Condition and Results of Operations" sections of those reports.
Item 9.01. Financial Statements and Exhibits
Signature
Pursuant to the requirements of the Securities
Exchange Act of 1934, the registrant has duly caused this report to be signed on its behalf by the undersigned hereunto duly authorized.
March 19, 2025
| QUEST DIAGNOSTICS INCORPORATED |
| |
|
| By: |
/s/ Sean D. Mersten |
| |
Sean D. Mersten |
| |
Vice President and Corporate Secretary |
| |
|
Investor Day 2025
Quest Diagnostics
Driving Sustainable Growth, Delivering Long-term Value
Jim Davis Chairman, CEO, and President
Investor Day 2025 Quest Diagnostics
Safe harbor disclosure
The statements in this presentation which are not historical facts may be forward-looking statements. Readers are cautioned not to place undue reliance on forward-looking statements, which speak only as of the date that they are made and which reflect management's current estimates, projections, expectations or beliefs and which involve risks and uncertainties that could cause actual results and outcomes to be materially different. Risks and uncertainties that may affect the future results of the company include, but are not limited to, adverse results from pending or future government investigations, lawsuits or private actions, the competitive environment, the complexity of billing, reimbursement and revenue recognition for clinical laboratory testing, changes in government regulations, changing relationships with customers, payers, suppliers or strategic partners, acquisitions and other factors discussed in the company's most recently filed Annual Report on Form 10-K and in any of the company's subsequently filed Quarterly Reports on Form 10-Q and Current Reports on Form 8-K, including those discussed in the "Business," "Risk Factors," "Cautionary Factors that May Affect Future Results," and "Management's Discussion and Analysis of Financial Condition and Results of Operations" sections of those reports.
In the following presentation, references to adjusted EPS refer to adjusted diluted EPS. Any references to operating margin(s) refer to adjusted operating income as a percentage of net revenues. Any references to free cash flow refer to cash flow from operations less capital expenditures. Adjusted EPS, operating margin and free cash flow are non-GAAP financial
measures. Please see the explanation of these non-GAAP measures, including the
comparable GAAP measure, at the end this presentation and on Investor Relations
page on our website.
3 Investor Day 2025 Quest Diagnostics
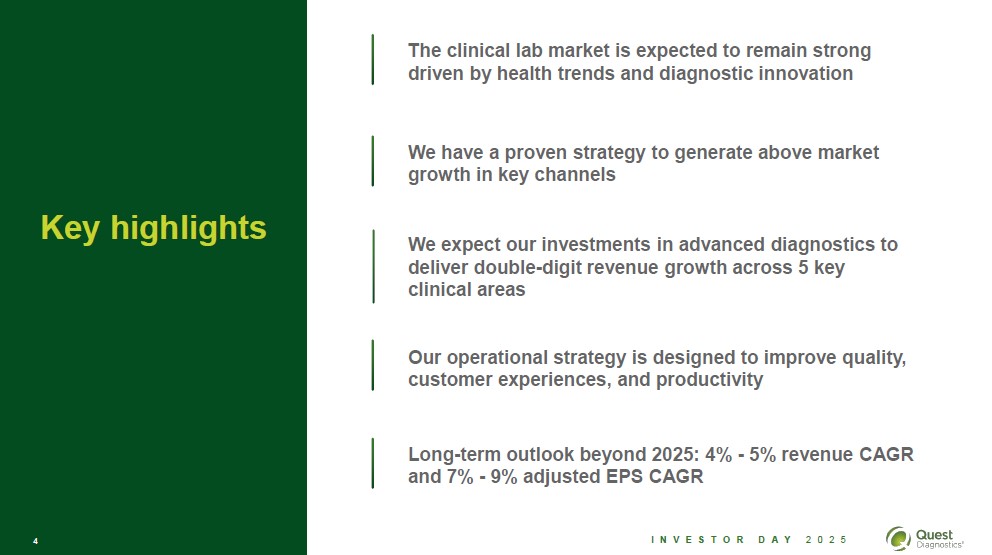
Key highlights
The clinical lab market is expected to remain strong driven by health trends and diagnostic innovation
We have a proven strategy to generate above average growth in key channels
We expect our investments in advanced diagnostics to deliver double-digit revenue growth across 5 key clinical areas
Our operational strategy is designed to improve quality, customer experiences, and productivity
Long-term outlook beyond 2025: 4% - 5% revenue CAGR and 7% - 9% adjusted EPS CAGR
4 Investor Day 2025 Quest Diagnostics
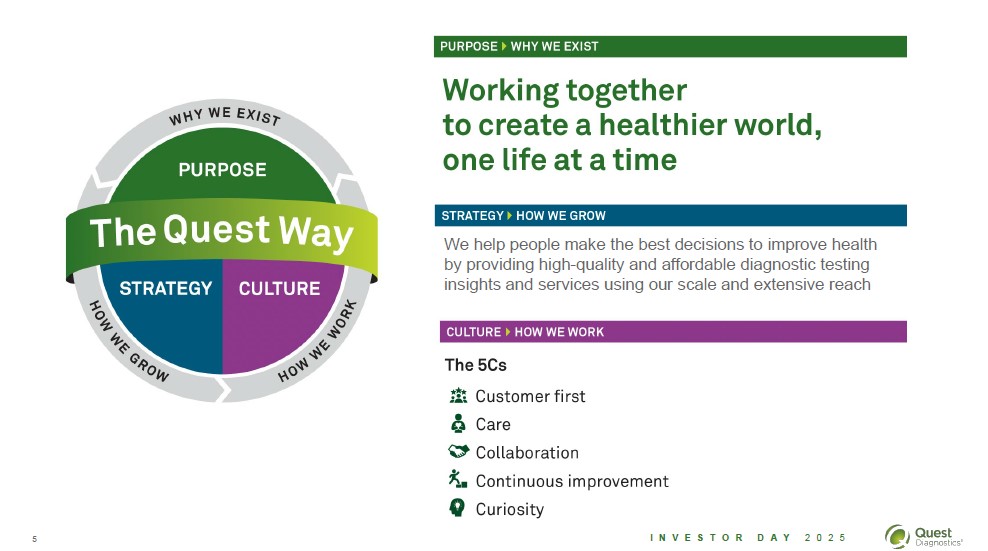
Why we exist Purpose The Quest Way Strategy Culture How we grow How we work
Purpose Why we exist
Working together to create a healthier world, one life at a time
Strategy How we grow
We help people make the best decisions to improve health by providing high-quality and affordable diagnostic testing insights and services using our scale and extensive reach
Culture How we work
The 5Cs Customer first Care Collaboration Continuous improvement Curiosity
5 Investor Day 2025 Quest Diagnostics
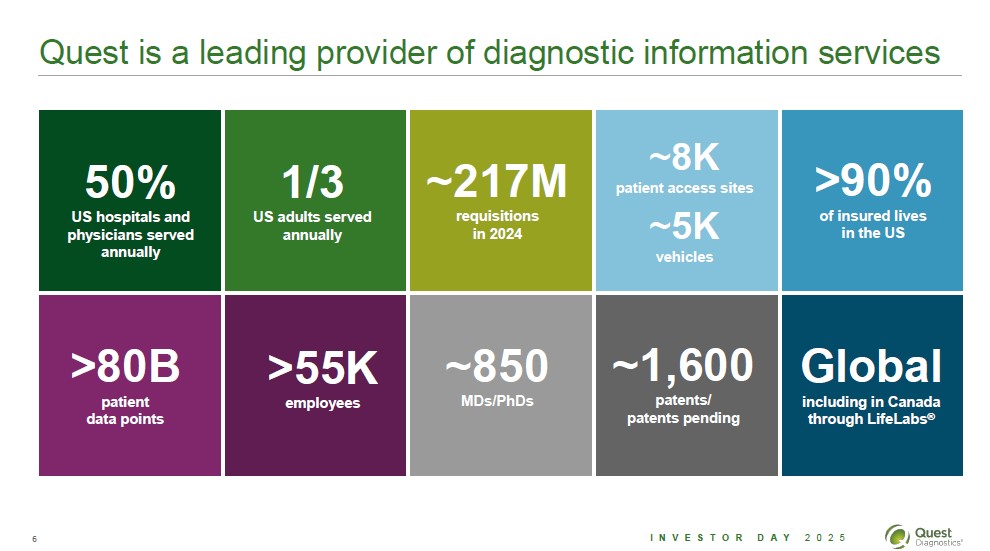
Quest is a leading provider of diagnostic information services
50% US hospitals and physicians served annually
1/3 US adults served annually
~217M requisitions in 2024
~8K patient access sites ~5K vehicles
>90% of insured lives in the US
>80B patient data points
>55K employees
~850 MDs/PhDs
~1,600 patents/patents pending
Global including in Canada through LifeLabs®
6 Investor Day 2025 Quest Diagnostics
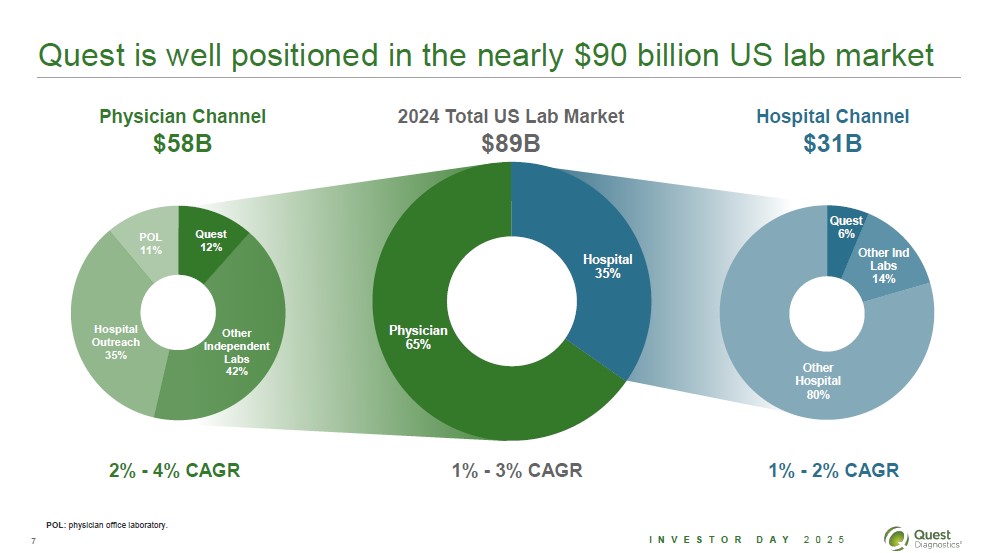
Quest is well positioned in the nearly $90 billion US lab market
Physician Channel $58B 2024 Total US Lab Market $89B Hospital Channel $31B
POL 11% Quest 12% Other Independent Labs 42% Hospital Outreach 35% Physician 65% Hospital 35% Quest 6% Other Ind Labs 14% Other Hospital 80%
2%-4% CAGR 1%-3% CAGR 1%-2% CAGR
POL: physician office laboratory.
7 Investor Day 2025 Quest Diagnostics
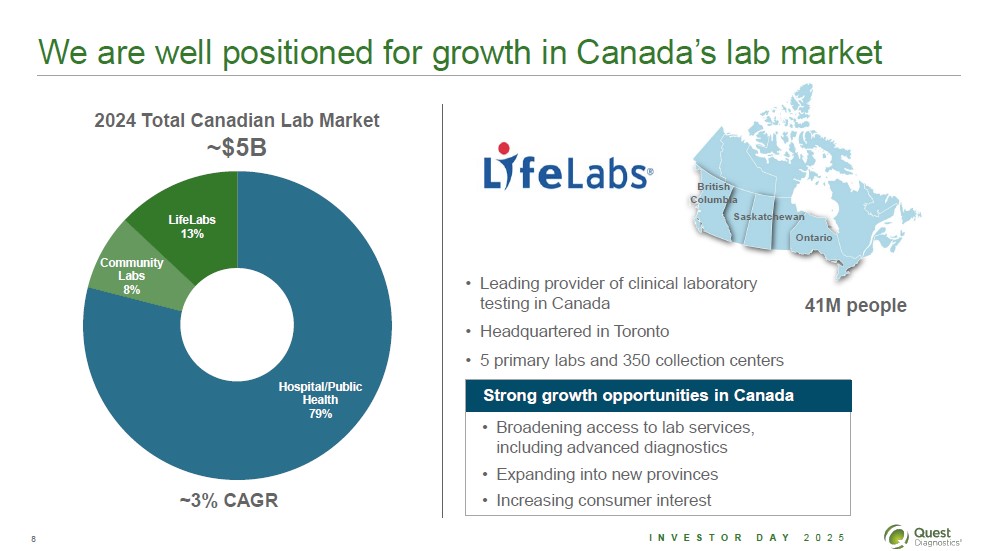
We are well positioned for growth in Canada's lab market
2024 Total Canadian Lab Market ~$5B
Hospital/Public Health 79% Community Labs 8% LifeLabs 13% ~3% CAGR
LifeLabs British Columbia Ontario Saskatchewan 41M people
Leading provider of clinical laboratory testing in Canada
Headquartered in Toronto
5 primary labs and 350 collection centers
Strong growth opportunities in Canada
Broadening access to lab services, including advanced diagnostics
Expanding into new provinces
Increasing consumer interest
8 Investor Day 2025 Quest Diagnostics
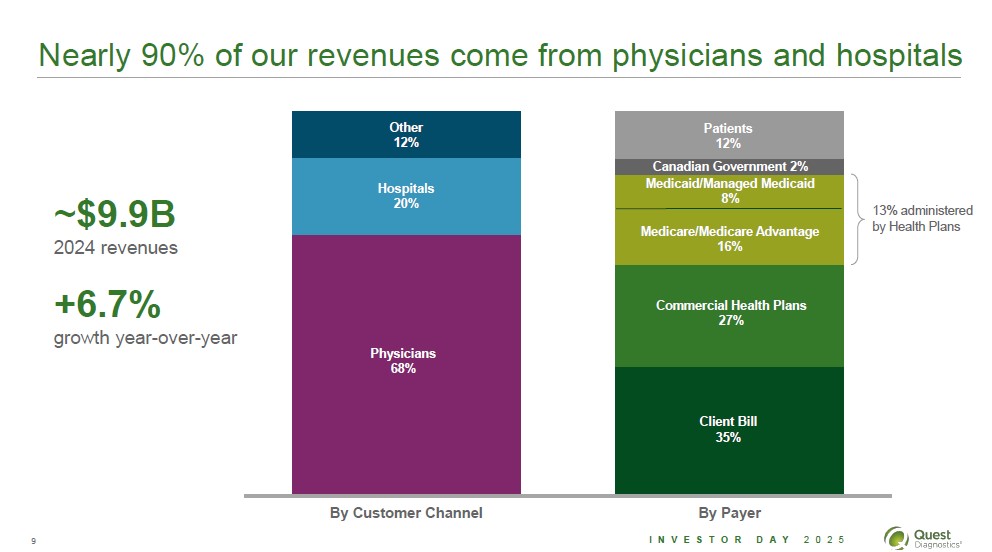
Nearly 90% of our revenues come from physicians and hospitals
~$9.9B 2024 revenues +6.7% growth year-over-year
Other 12% Hospitals 20% Physicians 68% By Customer Channel
Patients 12% Canadian Government 2% Medicaid/Managed Medicaid 8% Medicare/Medicare Advantage 16% Commercial Health Plans 27% Client Bill 35% By Payer
13% administered by Health Plans
9 Investor Day 2025 Quest Diagnostics
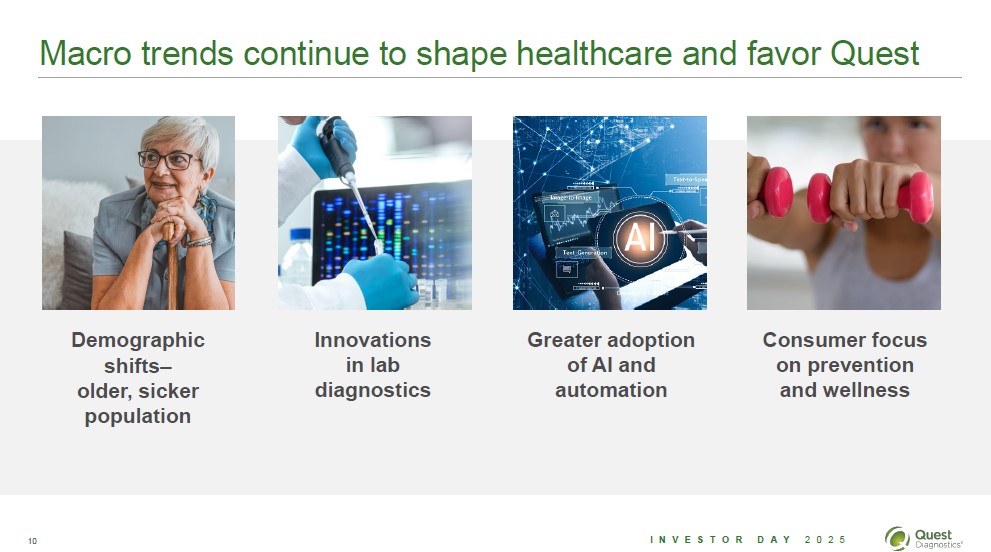
Macro trends continue to shape healthcare and favor Quest
Demographic shifts-older, sicker population
Innovations in lab diagnostics
Greater adoption of AI and automation
Consumer focus on prevention and wellness
10 Investor Day 2025 Quest Diagnostics
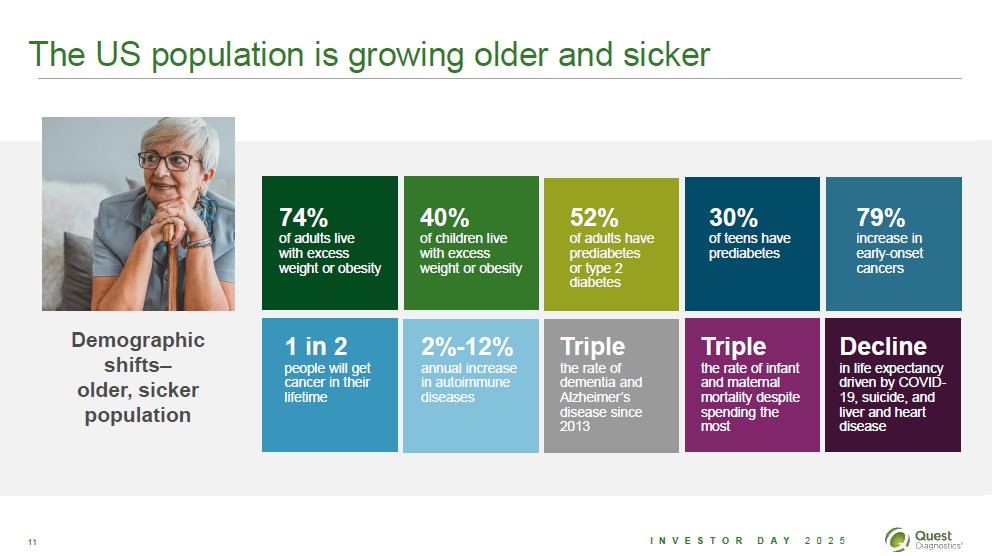
The US population is growing older and sicker
Demographic shifts-older, sicker population
74% of adults live with excess weight or obesity 40% of children live with excess weight of obesity 52% of adults have prediabetes or type 2 diabetes 30% of teens have prediabetes 79% increase in early-onset cancers
1 in 2 people with get cancer in their lifetime 2%-12% annual increase in autoimmune diseases Triple the rate of dementia and Alzheimer's disease since 2013 Triple the rate of infant and maternal mortality despite spending the most Decline in life expectancy driven by COVID-19, suicide, and liver and heart disease
11 Investor Day 2025 Quest Diagnotics
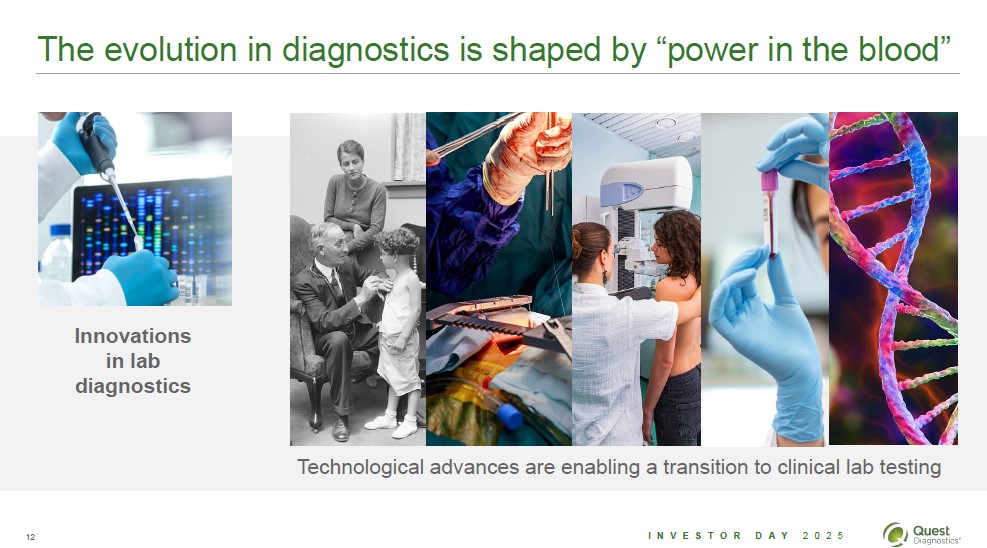
The evolution in diagnostics is shaped by "power in the blood"
Innovations in lab diagnostics
Technological advances are enabling a transition to clinical lab testing
12 Investor Day 2025 Quest Diagnostics
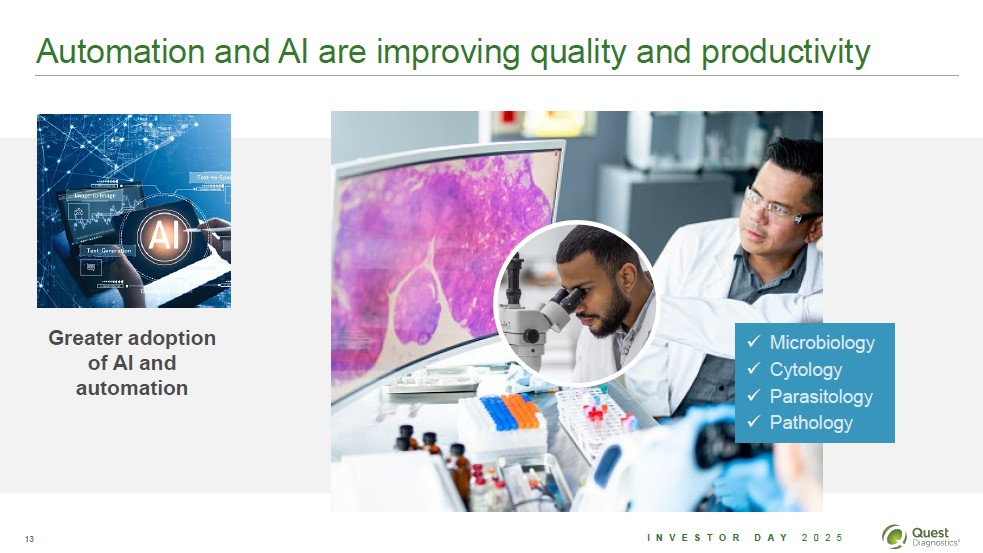
Automation and AI are improving quality and productivity
Greater adoption of AI and automation
Microbiology Cytology Parasitology Pathology
13 Investor Day 2025 Quest Diagnostics
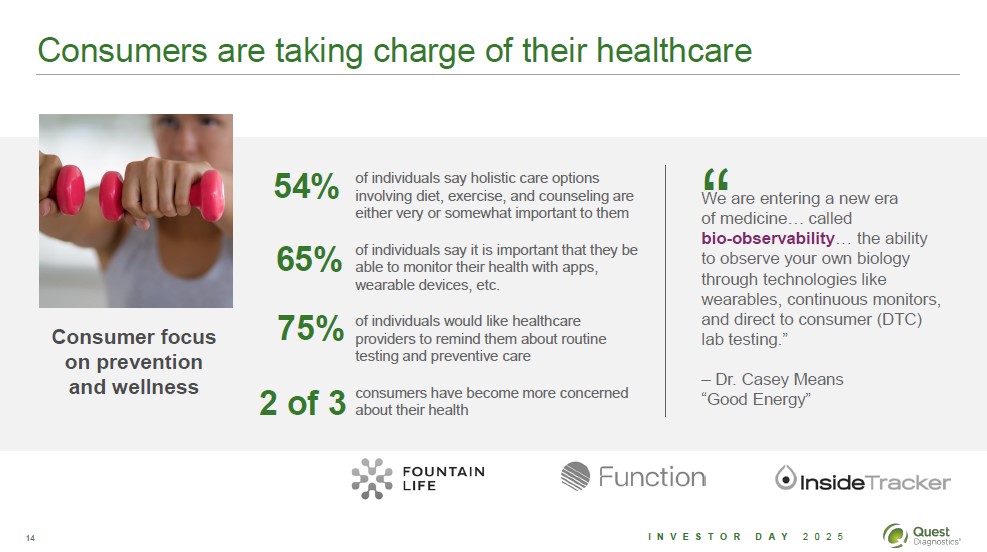
Consumers are taking charge of their healthcare
Consumer focus on prevention and wellness
54% of individuals say holistic care options involving diet, exercise, and counseling are either very or somewhat important to them
65% of individuals say it is important that they be able to monitor their health with apps, wearable devices, etc.
75% of individuals would like healthcare providers to remind them about routine testing and preventive care
2 of 3 consumers have become more concerned about their health
"We are entering a new era of medicine… called bio-observability… the ability to observe your own biology through technologies like wearables, continuous monitors, and direct to consumer (DTC) lab testing." - Dr. Casey Means "Good Energy"
Fountain Life Function InsideTracker
14 Investor Day 2025 Quest Diagnostics
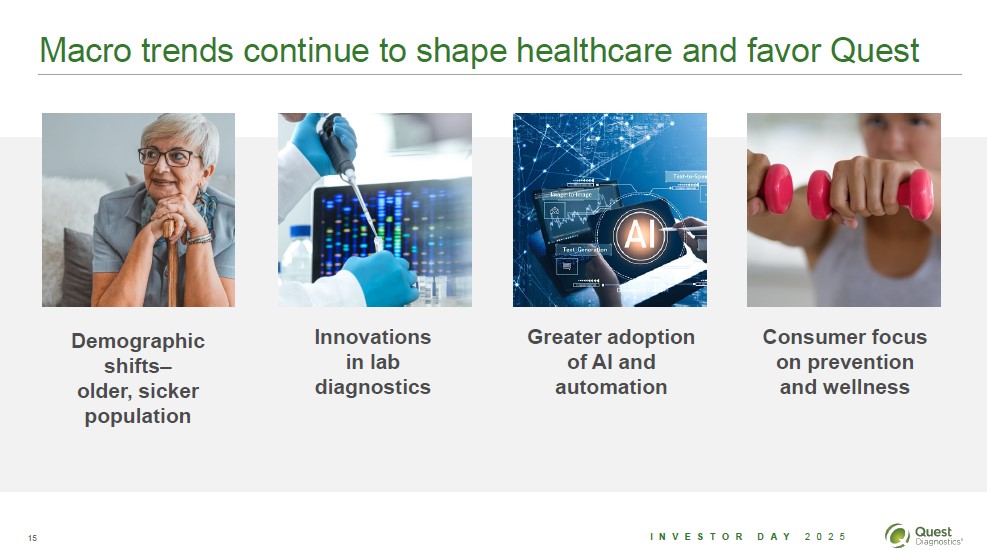
Macro trends continue to shape healthcare and favor Quest
Demographic shifts-older, sicker population
Innovations in lab diagnostics
Greater adoption of AI and automation
Consumer focus on prevention and wellness
15 Investor Day 2025 Quest Diagnostics
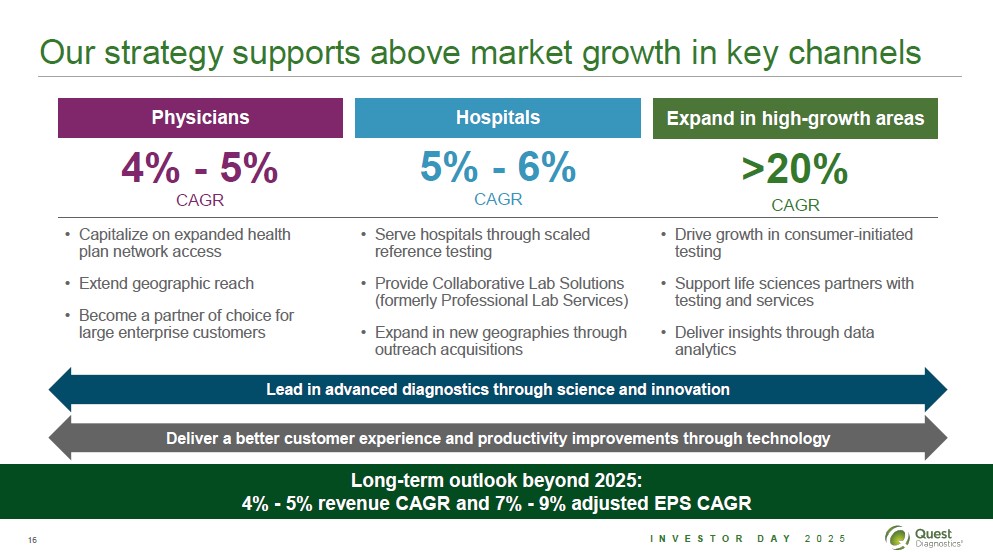
Our strategy supports above market growth in key channels
Physicians Hospitals Expand in high-growth areas
4% - 5% CAGR 5% - 6% CAGR >20% CAGR
Capitalize on expanded health plan network access Extend geographic reach Become a partner of choice for large enterprise customers
Serve hospitals through scaled reference testing Provide Collaborative Lab Solutions (formerly Professional Lab Services) Expand in new geographies through outreach acquisitions
Drive growth in consumer-initiated testing Support life sciences partners with testing and services Deliver insights through data analytics
Lead in advanced diagnostics through science and innovation
Deliver a better customer experience and productivity improvements through technology
Long-term outlook beyond 2025: 4% - 5% revenue CAGR and 7% - 9% adjusted EPS CAGR
16 Investor Day 2025 Quest Diagnostics
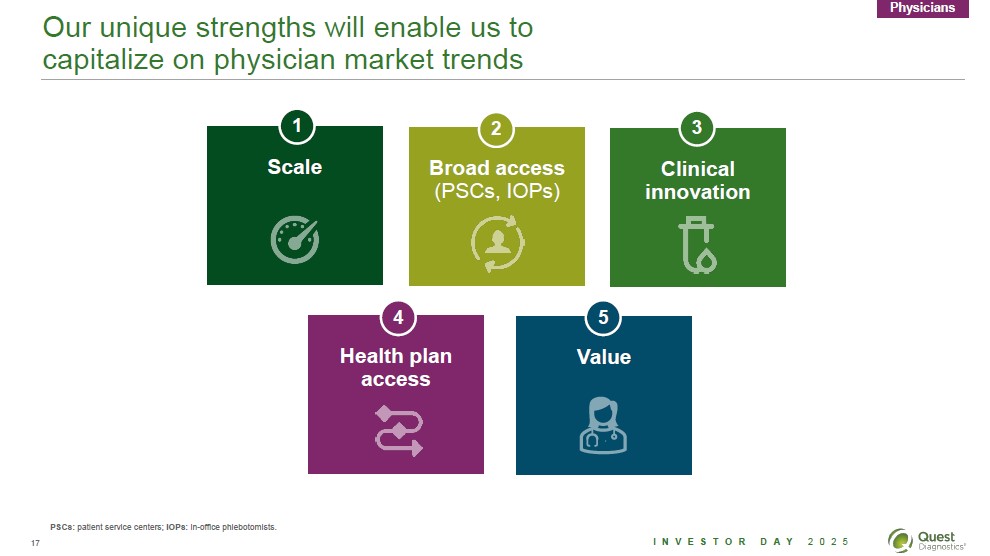
Our unique strengths will enable us to capitalize on physician market trends
1 Scale 2 Broad access (PSCs, IOPs) 3 Clinical innovation 4 Health plan access 5 Value
PSCs: patient service centers; IOPs: in-office phlebotomists.
17 Investor Dat 2025 Quest Diagnostics
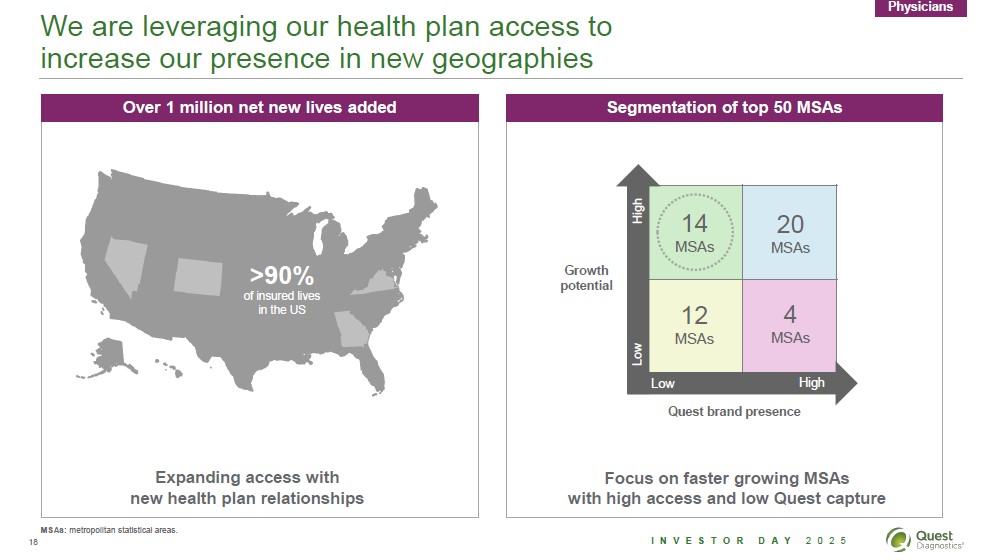
We are leveraging our health plan access to increase our presence in new geographies Physicians
Over 1 million net new lives added Segmentation of top 50 MSAs
>90% of insured lives in the US Expanding access with new health plan relationships
Growth potential Low High Low High Quest brand presence 14 MSAs 20 MSAs 12 MSAs 4 MSAs Focus on faster growing MSAs with high access and low Quest capture
MSAs: metropolitan statistical areas.
18 Quest Diagnostics
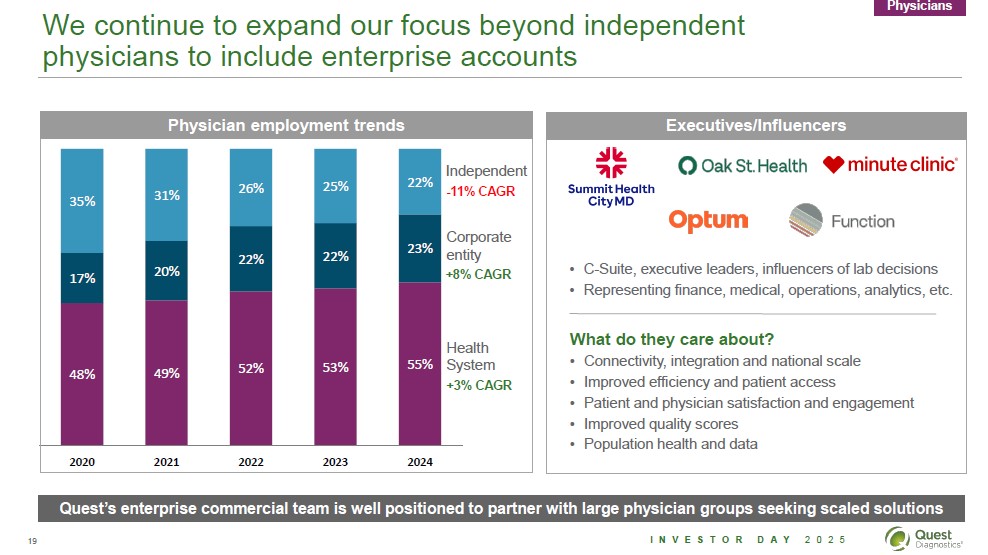
We continue to expand our focus beyond independent physicians to include enterprise accounts Physicians
Physician employment trends Executives/Influencers
35% 17% 48% 2020
31% 20% 49% 2021
26% 22% 52% 2022
25% 22%53% 2023
22% 23% 55% 2024
Independent -11% CAGR Corporate entity +8% CAGR Health System +3% CAGR
Summit Health City MD Oak St. Health minute clinic Optum Function
C-Suite, executive leaders, influencers of lab decisions
Representing finance, medical, operations, analytics, etc.
What do they care about?
Improved efficiency and patient access
Patient and physician satisfaction and engagement
Improved quality scores
Connectivity, integration and national scale
Population health and data
Quest's enterprise commercial team is well positioned to partner with large physician groups seeking scaled solutions
Source: PAI Physician Employment Study April 2024
19 Investor Day Quest Diagnostics
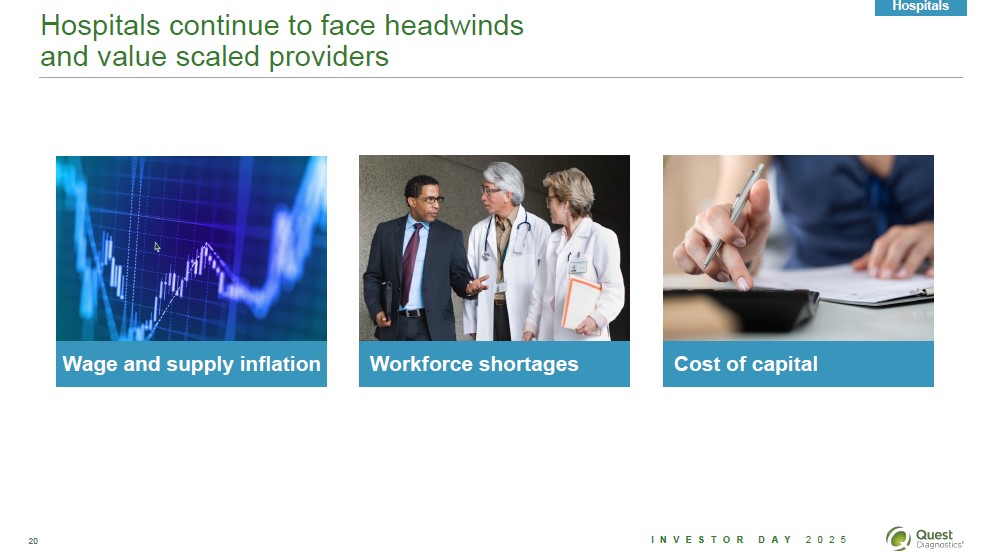
Hospitals continue to face headwinds and value scaled providers Hospitals
Wage and supply inflation Workforce shortages Cost of capital
20 Investor Day Quest Diagnostics
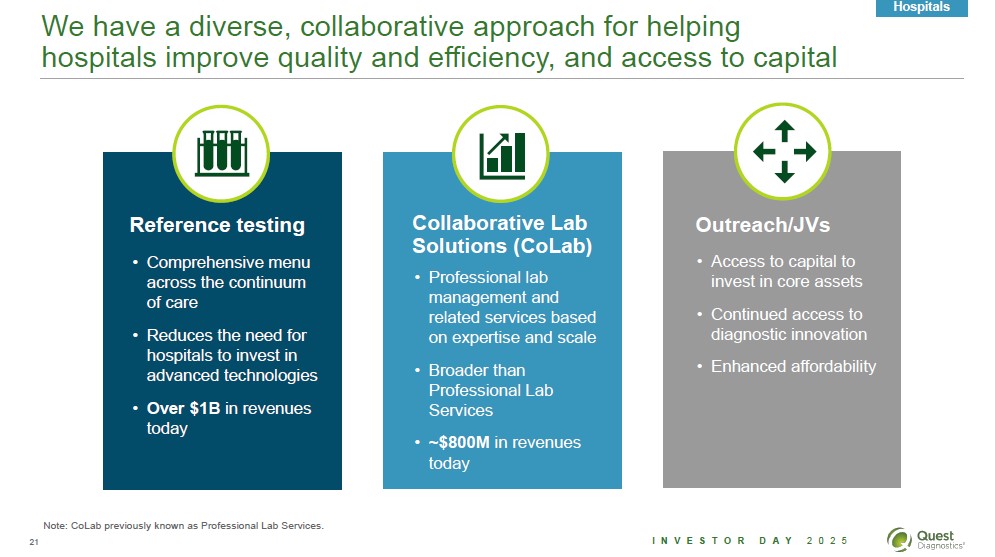
We have a diverse, collaborative approach for helping hospitals improve quality, efficiency, and access to capital Hospitals
Reference testing Comprehensive menu across continuum of care Reduces the need for hospitals to invest in advanced technologies Over $1B in revenues today
Collaborative Lab Solutions (CoLab) Professional lab management and related services based on expertise and scale Broader than Professional Lab Services ~800M in revenues today
Outreach/JVs Access to capital to invest in core assets Continued access to diagnostics innovation Enhanced affordability
Note: CoLab previously known as Professional Lab Services.
21 Investor Day 2025 Quest Diagnostics
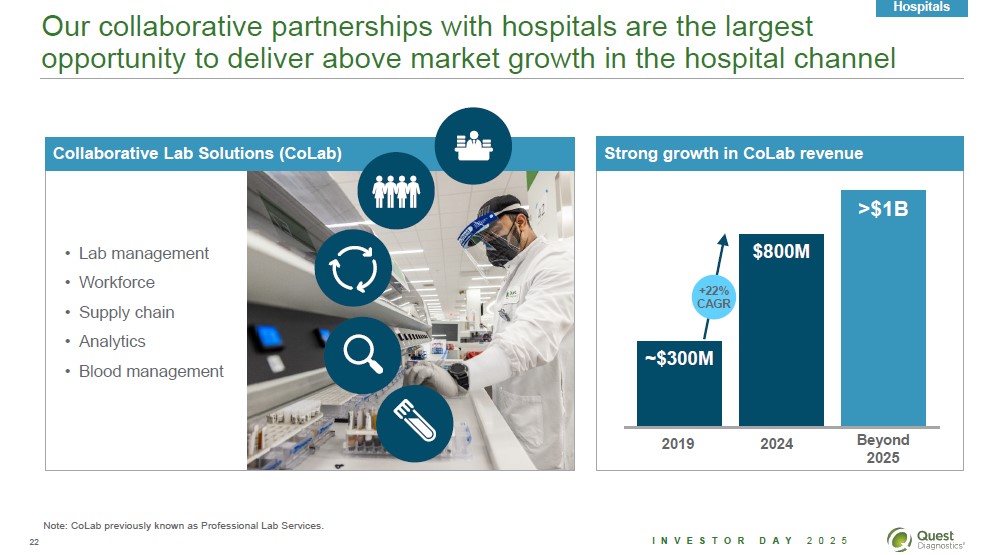
Our collaborative partnerships with hospitals are the largest opportunity to deliver above market growth in the hospital channel Hospitals
Collaborative Lab Solutions (CoLab) Strong growth in CoLab revenue
Lab management Workforce Supply chain Analytics Blood collection
~300M 2019 +22% CAGR $800M 2024 >$1B Beyond 2025
Note: CoLab previously known as Professional Lab Services.
22 Investor Day 2025 Quest Diagnostics
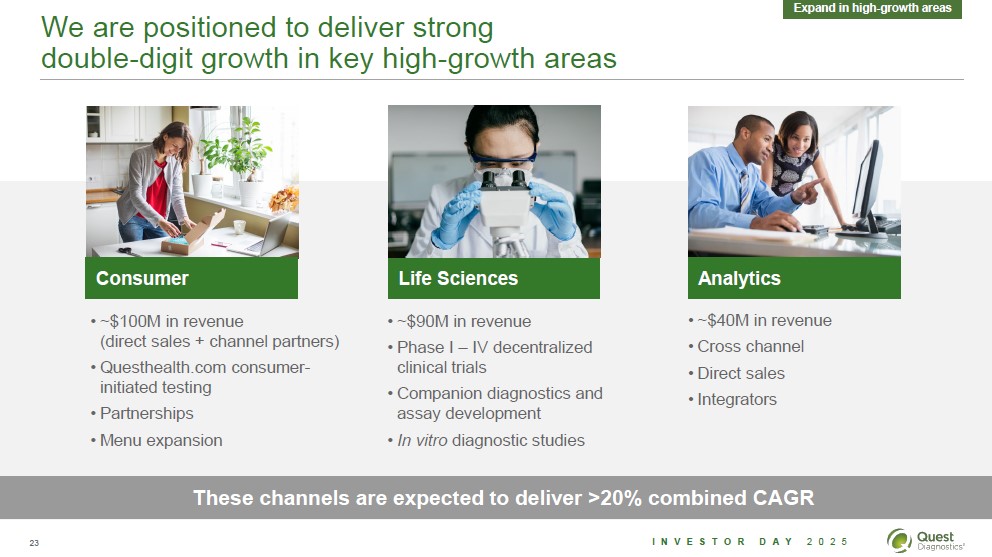
We are positioned to deliver strong double-digit growth in key high-growth areas Expan in high-growth areas
Consumer ~$100M in revenue (Direct sales + channel partners) Questhealth.com consumer-initiated testing Partnerships Menu expansion
Life Sciences ~$90M in revenue Phase I - IV decentralized clinical trials Companion diagnostics and assay development In vitro diagnostic studies
Analytics ~$40M in revenue Cross channel Direct sales Integrators
These channels are expected to deliver >20% combined CAGR
23 Investor Day 2025 Quest Diagnostics
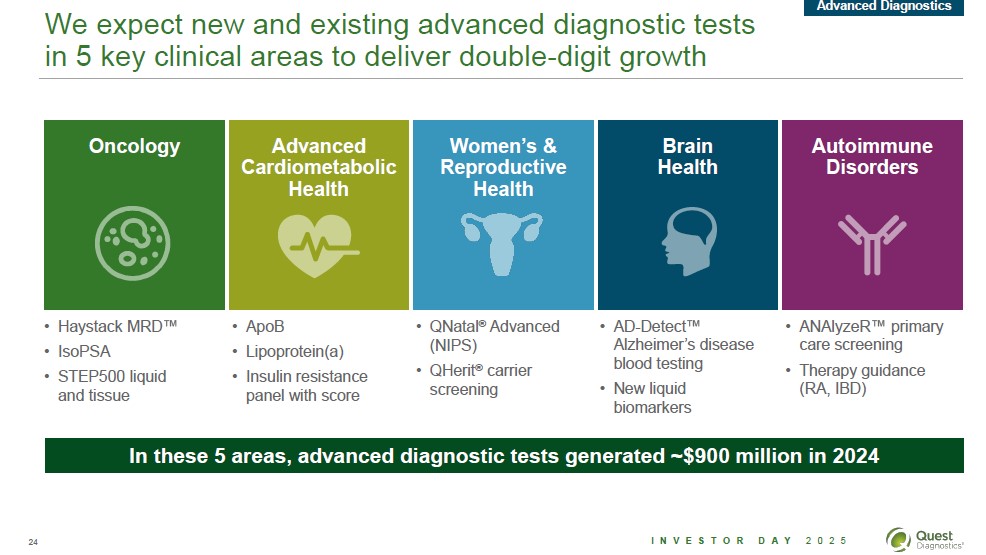
We expect new and existing advanced diagnostic tests in 5key clinical areas to deliver double-digit growth Advanced Diagnostics
Oncology Advanced Cardiometabolic Health Women's and Reproductive Health Brain Health Autoimmune Disorders
Haystack MRDTM IsoPSA STEP500 liquid and tissue
ApoB Lipoprotein(a) Insulin resistance panel with score
QNatalR Advanced (NIPS) QHeritR carrier screening
AD-DetectTM Alzheimer's disease blood testing New liquid biomarkers
ANAlyzeRTM primary care screening Therapy guidance (RA, IBD)
Portfolio of new and existing advanced diagnostic tests generated ~900 million in 2024
24 Investor Day 2025 Quest Diagnostics
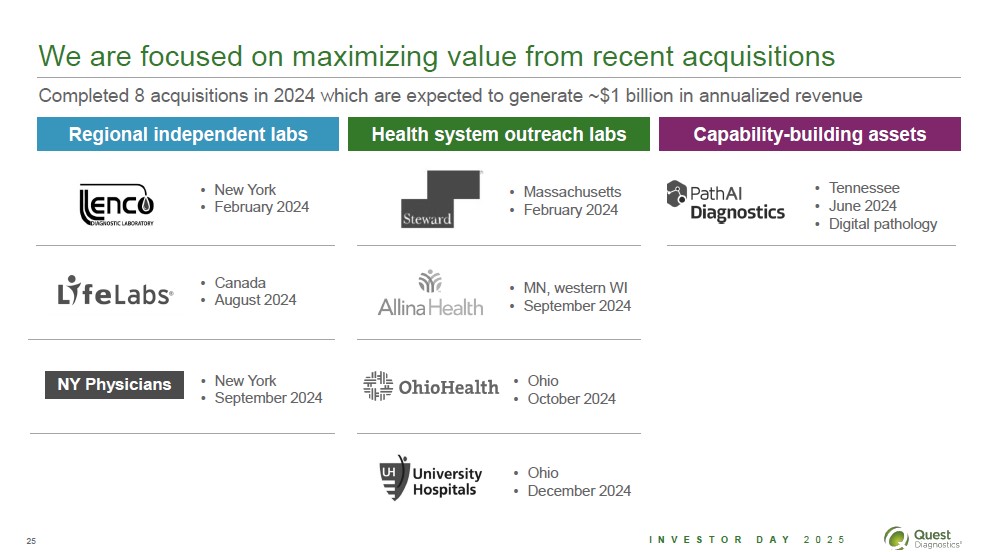
We are focused on maximizing value from recent acquisitions
Completed 8 acquisitions in 2024 which are expected to generate ~$1 billion in annualized revenue
Regional independent labs Health system outreach labs Capability-building assets
Lenco Diagnostic Laboratory Greater New York region February 2024
Steward Massachusetts February 2024
PathAI Diagnostics Tennessee June 2024 Digital pathology
LifeLabs Canda August 2024
Alina Health MN, western WI September 2024
NY Physicians New York September 2024
OhioHealth Ohio October 2024
University Hospitals Ohio December 2024
25 Investor Day 2025 Quest Diagnostics
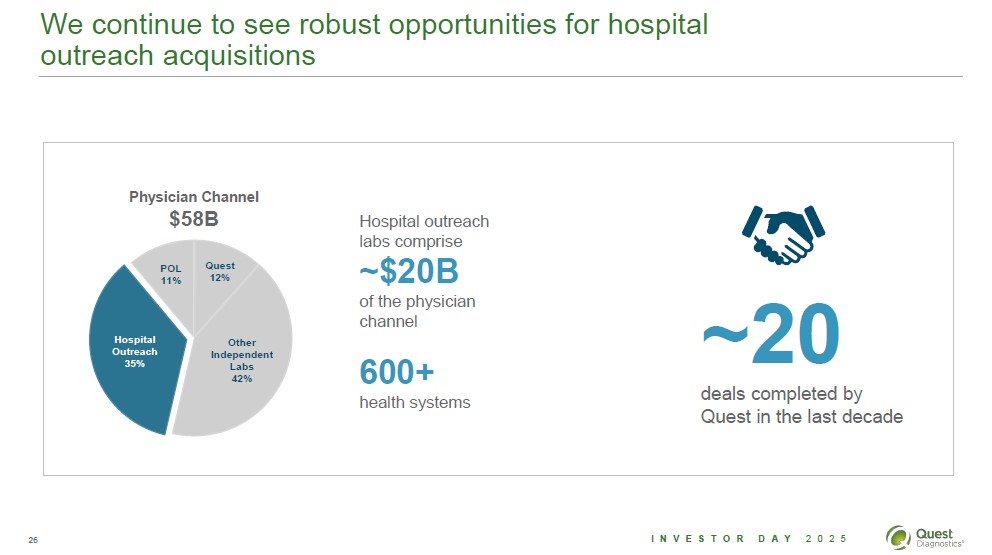
We continue to see robust opportunities for hospital outreach acquisitions
Physician Channel $58B POL 11% Quest 12% Other Independent Labs 42% Hospital Outreach 35% Hospital outreach labs comprise ~$20B of the physician channel 600+ health systems ~20 deals completed by Quest in the last decade
26 Investor Day 2025 Quest Diagnostics
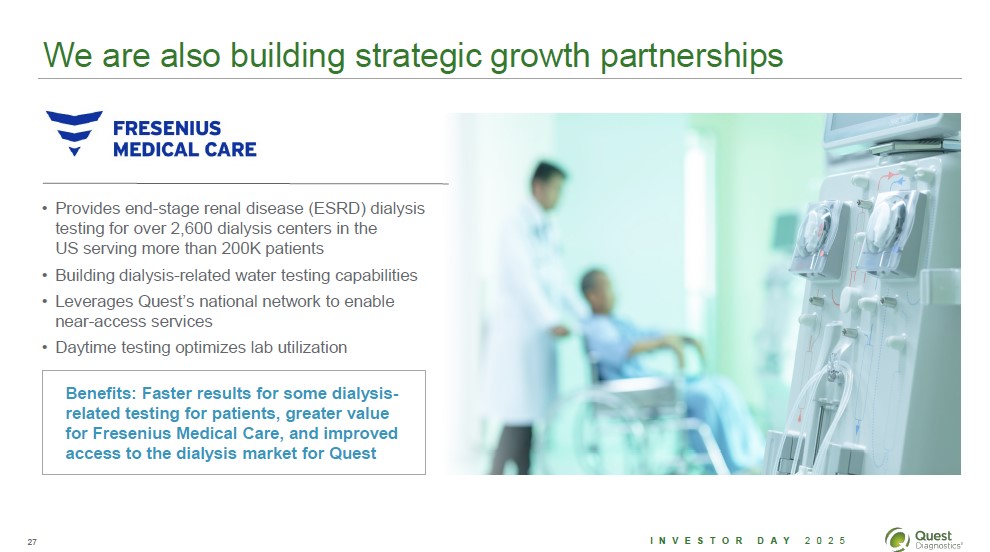
We are also building strategic growth partnerships
Fresenius Medical Care Provides end-stage renal disease (ESRD) dialysis testing for over 2,600 dialysis centers in the US serving more than 200K patients Building dialysis-related water testing capabilities Leverage Quest's national network to enable near-access services Daytime testing optimizes lab utilization
Benefits: Faster results for some dialysis-related testing for patients, greater value for Fresenius Medical Care, and improved access to the dialysis market for Quest
27 Investor Day 2025 Quest Diagnostics
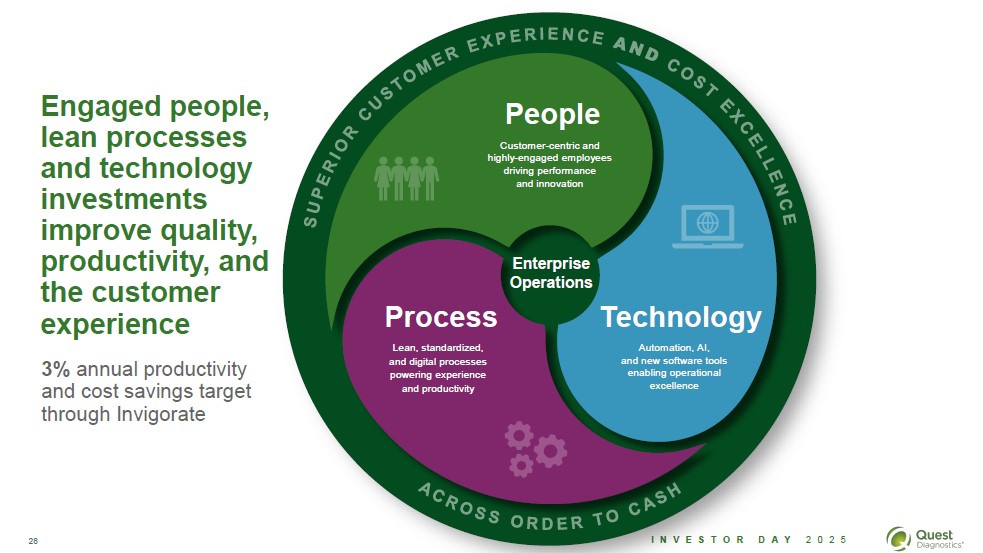
Engaged people, lean processes and technology investments improve quality, productivity, and the customer experience
3% annual productivity and cost savings target through Invigorate
Superior customer experience and cost excellence
People Customer-centric and highly-engaged employees driving performance and innovation
Enterprise Operations
Process Lean, standardized, and digital processes powering experience and productivity
Technology Automation, AI, and new software tools enabling operational excellence
Across order to cash
28 Investor Day 2025 Quest Diagnostics
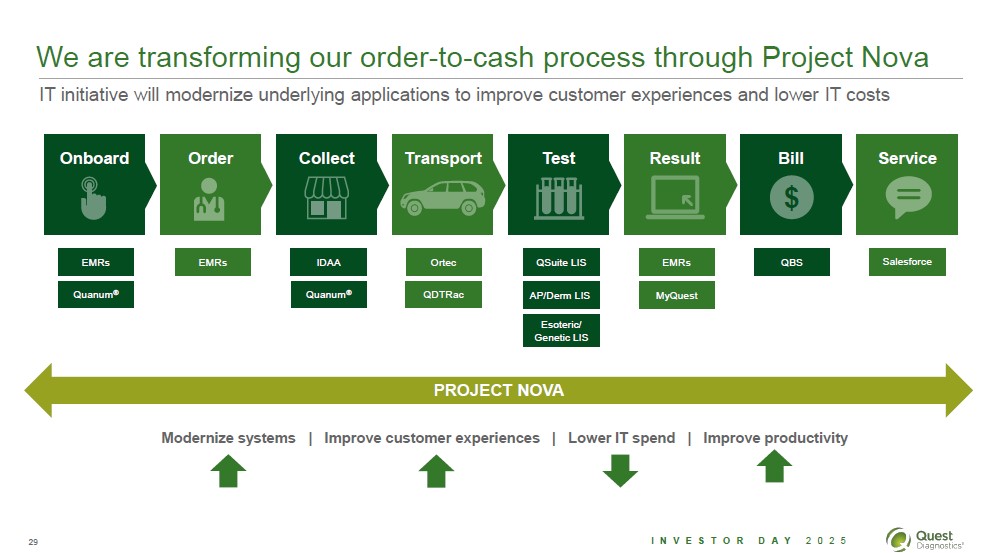
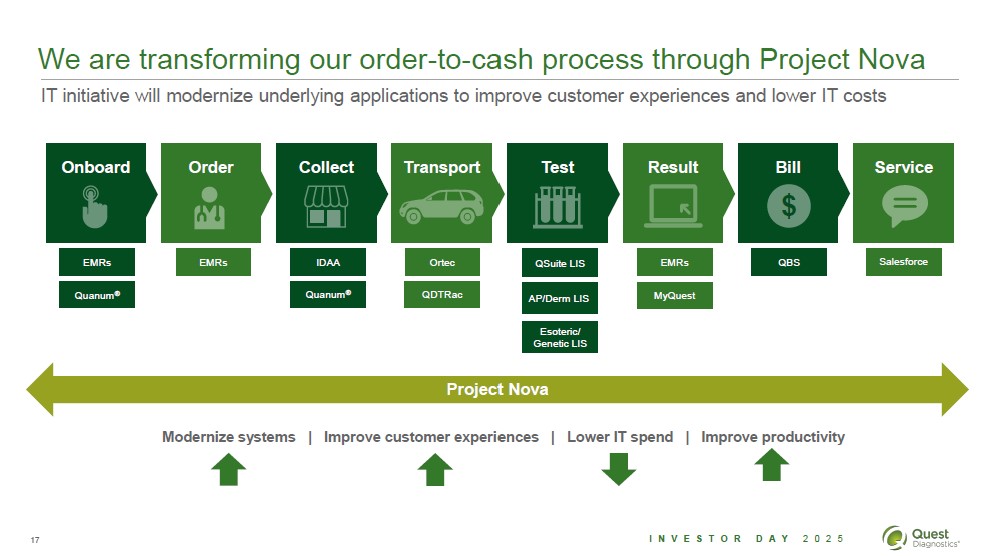
We are transforming our order-to-cash process through Project Nova
IT initiative will modernize underlying applications to improve customer experiences and lower IT costs
Onboard Order Collect Transport Test Result Bill Service
EHRs Quanum®
EHRs
IDAA Quanum®
Ortec QDTRac
QSuite LIS AP/Derm LIS Esoteric/Genetic LIS
EHRs MyQuest
QBS
Salesforce
Project Nova
Modernize systems Improve customer experiences Lower IT spend Improve productivity
29 Investor Day 2025 Quest Diagnostics
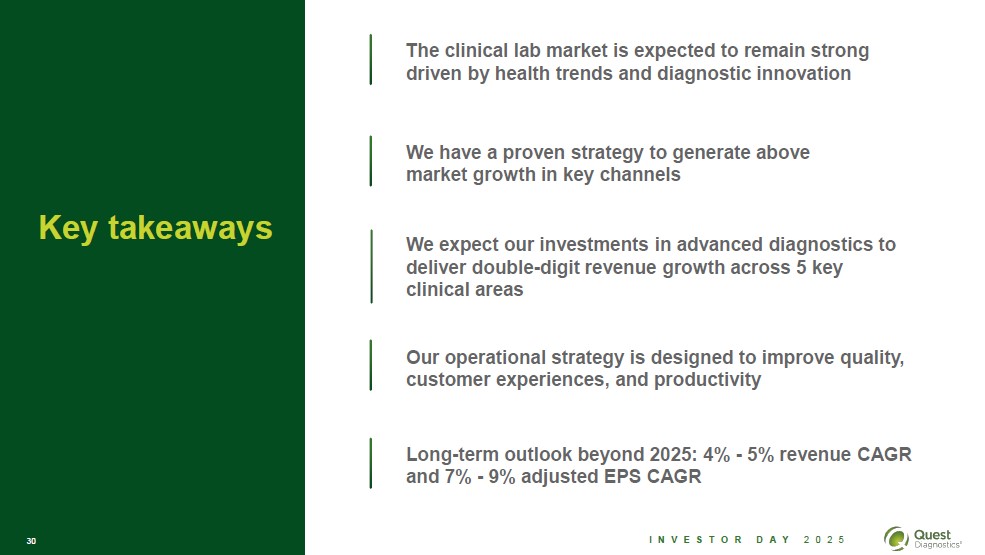
Key takeaways
The clinical lab market is expected to remain strong driven by health trends and diagnostic innovation
We have a proven strategy to generate above average growth in key channels
We expect our investments in advanced diagnostics to deliver double-digit revenue growth across 5 key clinical areas
Our operational strategy is designed to improve quality, customer experiences, and productivity
Long-term outlook beyond 2025: 4% - 5% revenue CAGR and 7% - 9% adjusted EPS CAGR
30 Investor Day 2025 Quest Diagnostics
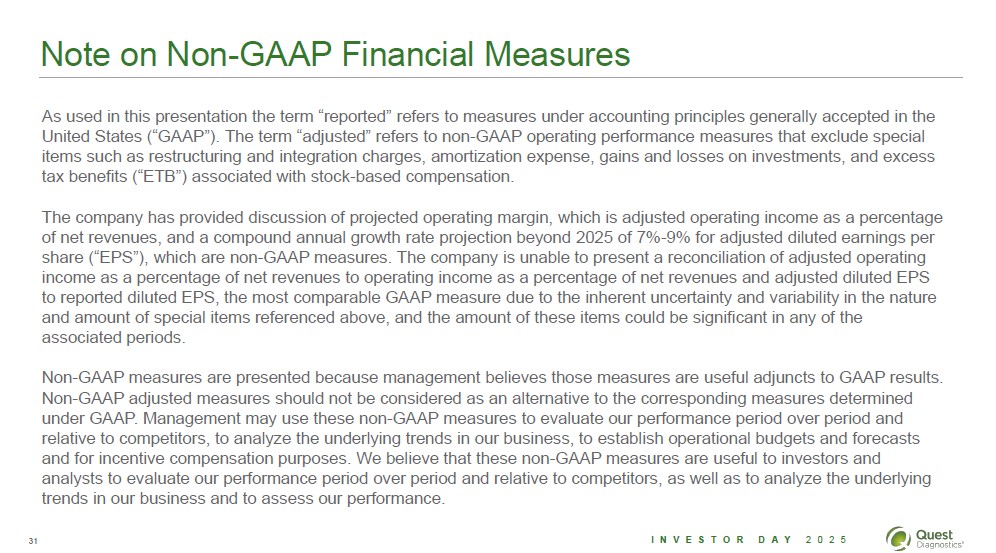
Note on Non-GAAP Financial Measures
As used in this presentation the term "reported" refers to measures under accounting principles generally accepted in the United States ("GAAP"). The term "adjusted" refers to non-GAAP operating performance measures that exclude special items such as restructuring and integration charges, amortization expense, gains and losses on investments, and excess tax benefits ("ETB") associated with stock-based compensation.
The company has provided discussion of projected operating margin, which is
adjusted operating income as a percentage of net revenues, and a compound annual
growth rate projection beyond 2025 of 7%-9% for adjusted diluted earnings per
share ("EPS"), which are non-GAAP measures. The company is unable to present a
reconciliation of adjusted operating income as a percentage of net revenues to
operating income as a percentage of net revenues and adjusted diluted EPS to
reported diluted EPS, the most comparable GAAP measure due to the inherent
uncertainty and variability in the nature and amount of special items referenced
above, and the amount of these items could be significant in any of the
associated periods. The company has provided a compound annual growth rate projection beyond 2025 of 7%-9% for adjusted diluted earnings per share ("EPS"), which is a non-GAAP measure. The company is unable to present a reconciliation of adjusted diluted EPS to reported diluted EPS, the most comparable GAAP measure due to the inherent uncertainty and variability in the nature and amount of special items referenced above, and the amount of these items could be significant in any of the associated periods.
Non-GAAP adjusted measures are presented because management believes those measures are useful adjuncts to GAAP results. Non-GAAP adjusted measures should not be considered as an alternative to the corresponding measures determined under GAAP. Management may use these non-GAAP measures to evaluate our performance period over period and relative to competitors, to analyze the underlying trends in our business, to establish operational budgets and forecasts and for incentive compensation purposes. We believe that these non-GAAP measures are useful to investors and analysts to evaluate our performance period over period and relative to competitors, as well as to analyze the underlying trends in our business and to assess our performance.
31 Investor Day 2025 Quest Diagnostics
Karthik Kuppusamy, PhD Senior Vice President, Clinical Solutions
Diagnostic Innovation as a Growth Driver
Investor Day 2025 Quest Diagnostics
2 INVESTOR DAY 2025 Quest Diagnostics
Safe harbor disclosure
The statements in this presentation which are not historical facts may be forward-looking statements. Readers are cautioned not to place undue reliance on forward-looking statements, which speak only as of the date that they are made and which reflect management's current estimates, projections, expectations or beliefs and which involve risks and uncertainties that could cause actual results and outcomes to be materially different. Risks and uncertainties that may affect the future results of the company include, but are not limited to, adverse results from pending or future government investigations, lawsuits or private actions, the competitive environment, the complexity of billing, reimbursement and revenue recognition for clinical laboratory testing, changes in government regulations, changing relationships with customers, payers, suppliers or strategic partners, acquisitions and other factors discussed in the company's most recently filed Annual Report on Form 10-K and in any of the company's subsequently filed Quarterly Reports on Form 10-Q and Current Reports on Form 8-K, including those discussed in the "Business," "Risk Factors," "Cautionary Factors that May Affect Future Results," and "Management's Discussion and Analysis of Financial Condition and Results of Operations" sections of those reports.
2 INVESTOR DAY 2025 Quest Diagnostics
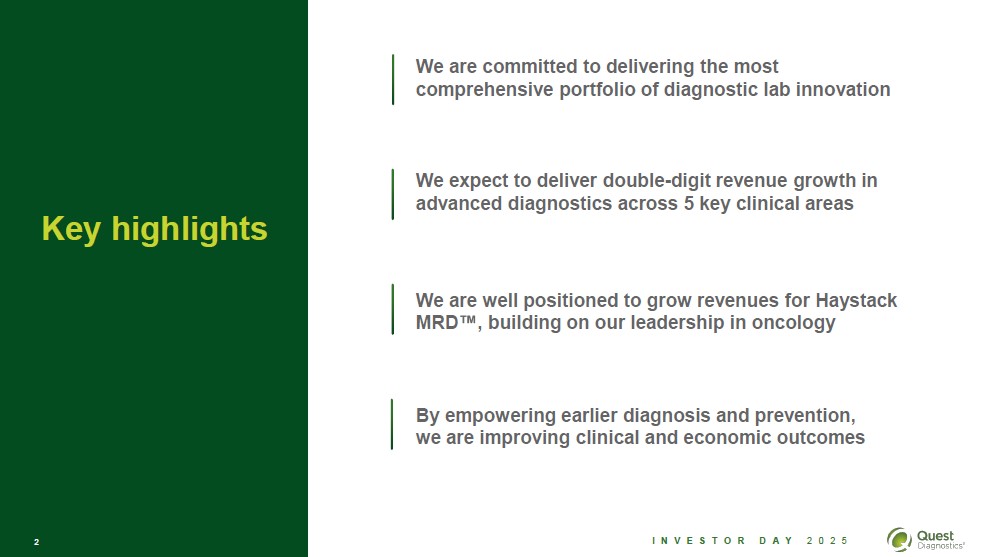
Key highlights
We expect to deliver double-digit revenue growth in advanced diagnostics across 5 key clinical areas
We are well positioned to grow revenues for Haystack MRD, building on our leadership in oncology
We are committed to delivering the most comprehensive portfolio of diagnostic lab innovation
By empowering earlier diagnosis and prevention, we are improving clinical and economic outcomes
3 INVESTOR DAY 2025 Quest Diagnostics
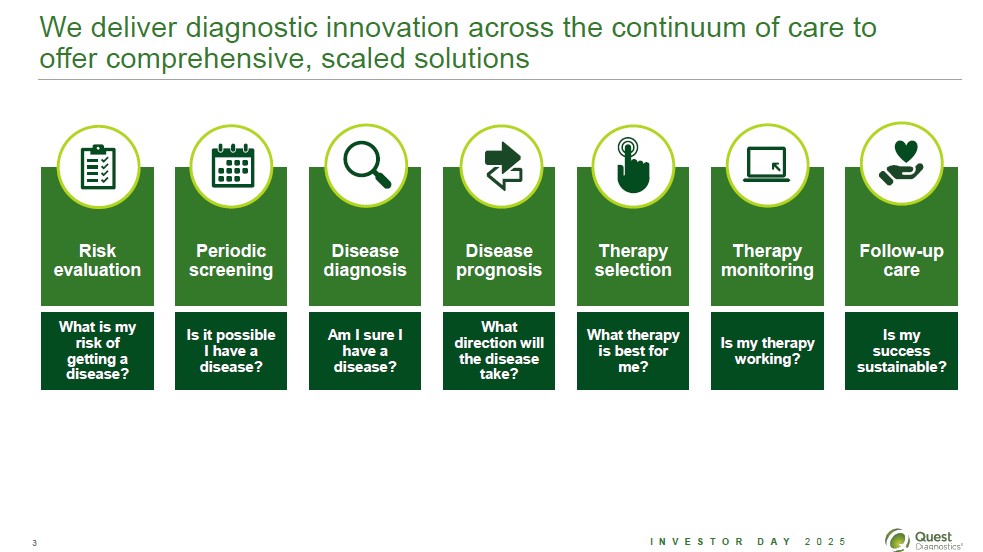
We deliver diagnostic innovation across the continuum of care to offer comprehensive, scaled solutions
Risk evaluation
Periodic screening
Disease diagnosis
Therapy selection
Therapy monitoring
Follow-up care
What is my risk of getting a disease?
Is it possible I have a disease?
Am I sure I have a disease?
What therapy is best for me?
Is my therapy working?
Is my success sustainable?
Disease prognosis
What direction will the disease take?
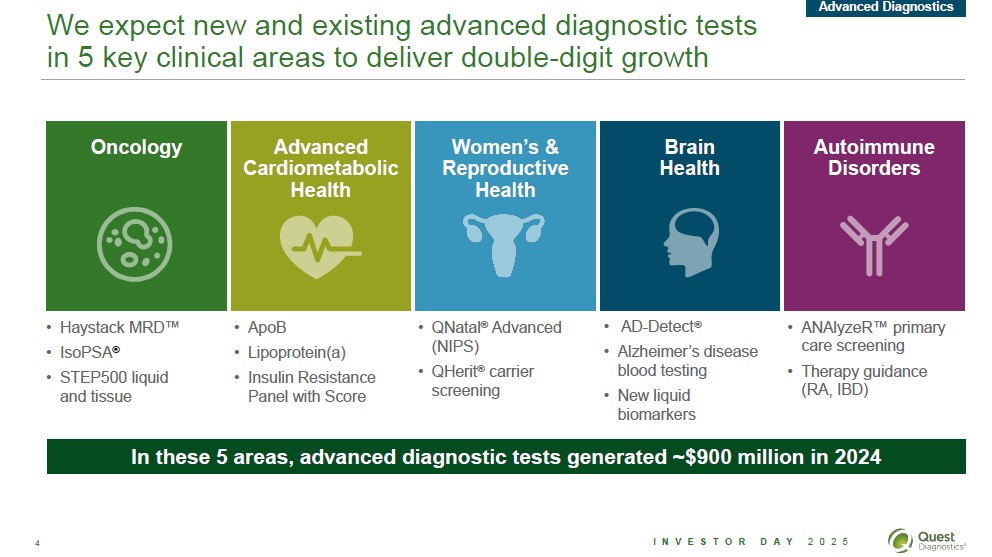
4 INVESTOR DAY 2025 Quest Diagnostics
Oncology
Advanced Cardiometabolic Health
Women's and Reproductive Health
Brain Health
Autoimmune Disorders
We expect new and existing advanced diagnostic tests in 5 key clinical areas to deliver double-digit growth
Haystack MRD
IsoPSA
STEP500 liquid and tissue
QNatal Advanced (NIPS)
QHerit carrier screening
AD-Detect
Alzheimer's disease blood testing
New liquid biomarkers
ANAlyzeR primary care screening
Therapy guidance (RA, IBD)
In these 5 areas, advanced diagnostic tests generated ~$900 million in 2024
ApoB
Lipoprotein(a)
Insulin Resistance Panel with Score
Advanced Diagnostics
5 INVESTOR DAY 2025 Quest Diagnostics
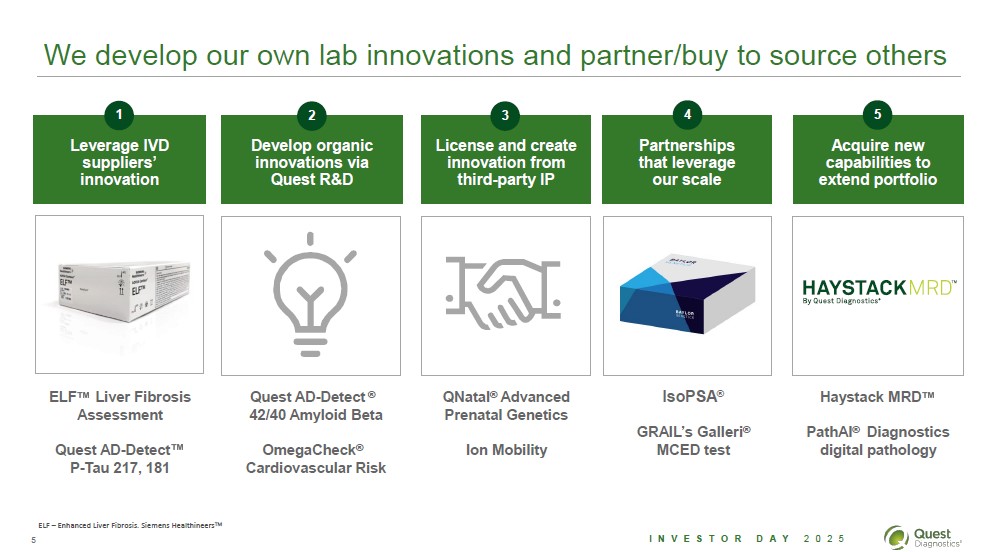
We develop our own lab innovations and partner/buy to source others
Leverage IVD suppliers' innovation
ELF Liver Fibrosis Assessment
Quest AD-Detect
P-Tau 217, 181
1
Develop organic innovations via Quest RandD
Quest AD-Detect 42/40 Amyloid Beta
OmegaCheck Cardiovascular Risk
2
License and create innovation from third-party IP
QNatal Advanced Prenatal Genetics
Ion Mobility
3
Partnerships that leverage our scale
IsoPSA
GRAIL's Galleri
MCED test
4
Acquire new capabilities to extend portfolio
Haystack MRD
PathAI Diagnostics digital pathology
5
ELF - Enhanced Liver Fibrosis. Siemens Healthineers
HAYSTACKMRD
By Quest Diagnostics
Diagnostic innovation as a growth driver
Yuri Fesko, MD, Senior Vice President and Chief Medical Officer
Dan Edelstein, Vice President and General Manager, Haystack MRD
Mouris Saghir, PhD, Vice President and General Manager, Cardiometabolic, Endocrine, and Wellness
Kathleen Valentine, Vice President and General Manager, Women's and Reproductive Health and Core Neurology
Panel discussion
Investor Day 2025 Quest Diagnostics
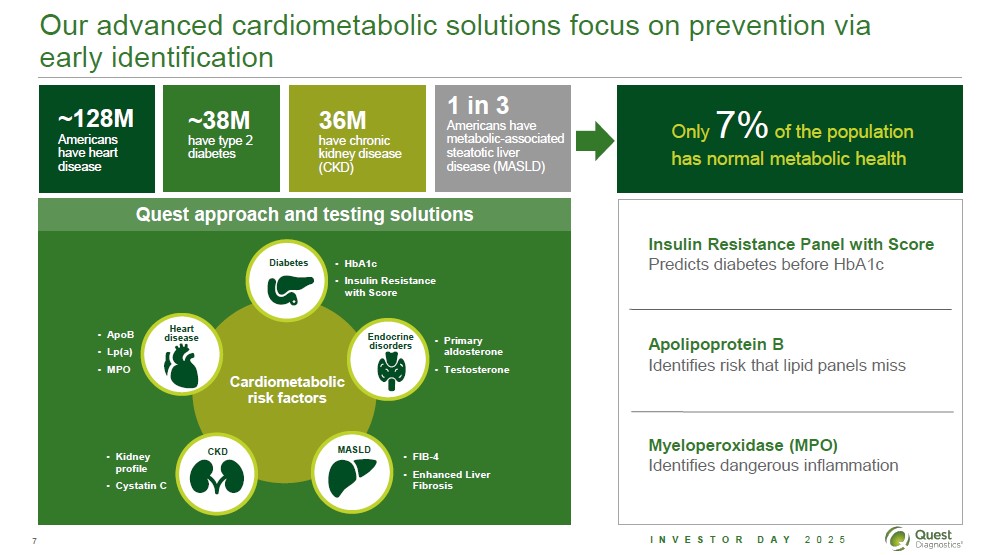
Our advanced cardiometabolic solutions focus on prevention via early identification
~128M Americans have heart disease
~38M have type 2 diabetes
36M have chronic kidney disease (CKD)
1 in 3 Americans have metabolic-associated steatotic liver disease (MASLD)
Only 7% of the population has normal metabolic health
Quest approach and testing solutions
HbA1c
Insulin Resistance with Score
FIB-4
Enhanced Liver Fibrosis
Kidney profile
Cystatin C
ApoB
Lp(a)
MPO
Primary aldosterone
Testosterone
Diabetes
Heart disease
Endocrine disorders
MASLD
CKD
Insulin Resistance Panel with Score Predicts diabetes before HbA1c
Apolipoprotein B Identifies risk that lipid panels miss
Myeloperoxidase (MPO) Identifies dangerous inflammation
7 INVESTOR DAY 2025 Quest Diagnostics
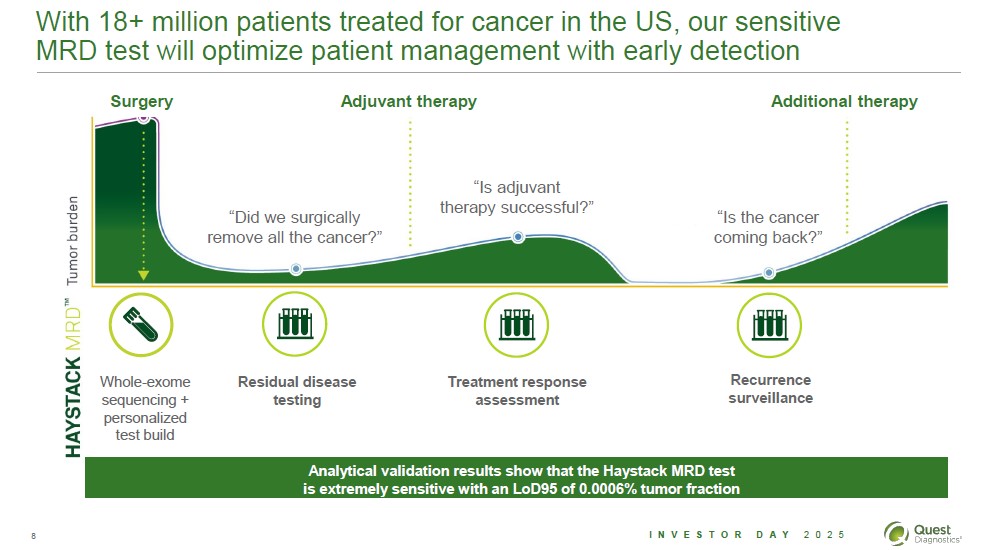
With 18+ million patients treated for cancer in the US, our sensitive MRD test will optimize patient management with early detection
Surgery
Adjuvant therapy
Additional therapy
"Is adjuvant therapy successful?"
Whole-exome sequencing + personalized test build
Treatment response assessment
Residual disease testing
Recurrence surveillance
Analytical validation results show that the Haystack MRD testis extremely sensitive with an LoD95 of 0.0006% tumor fraction
"Is the cancer coming back?"
"Did we surgically remove all the cancer?"
HAYSTACK MRD Tumor burden
8 INVESTOR DAY 2025 Quest Diagnostics
9 INVESTOR DAY 2025 Quest Diagnostics
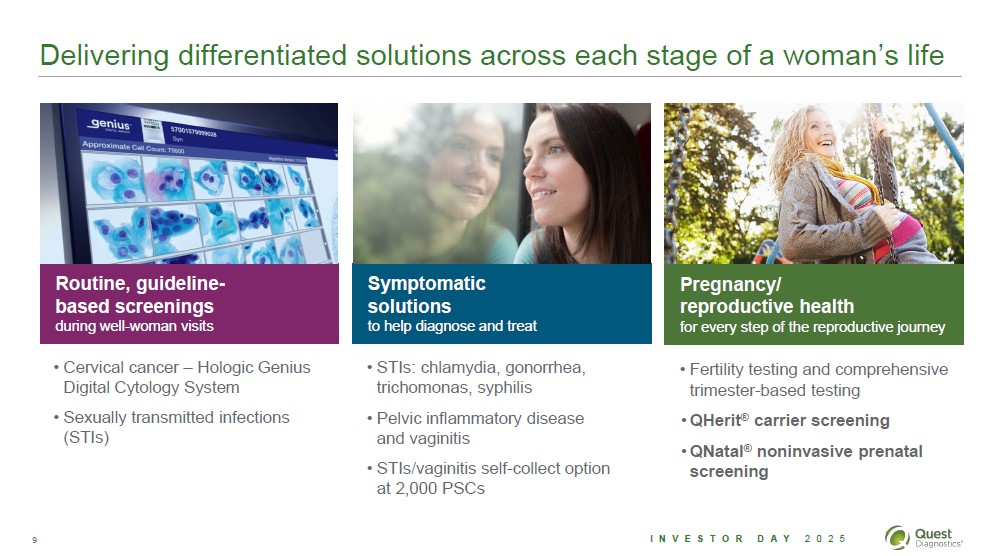
Delivering differentiated solutions across each stage of a woman's life
Fertility testing and comprehensive trimester-based testing
QHerit carrier screening
QNatal noninvasive prenatal screening
STIs: chlamydia, gonorrhea, trichomonas, syphilis
Pelvic inflammatory disease and vaginitis
STIs/vaginitis self-collect option at 2,000 PSCs
Cervical cancer - Hologic Genius Digital Cytology System
Sexually transmitted infections (STIs)
Routine, guideline-based screenings during well-woman visits
Pregnancy/reproductive health
for every step of the reproductive journey
Symptomatic solutions to help diagnose and treat
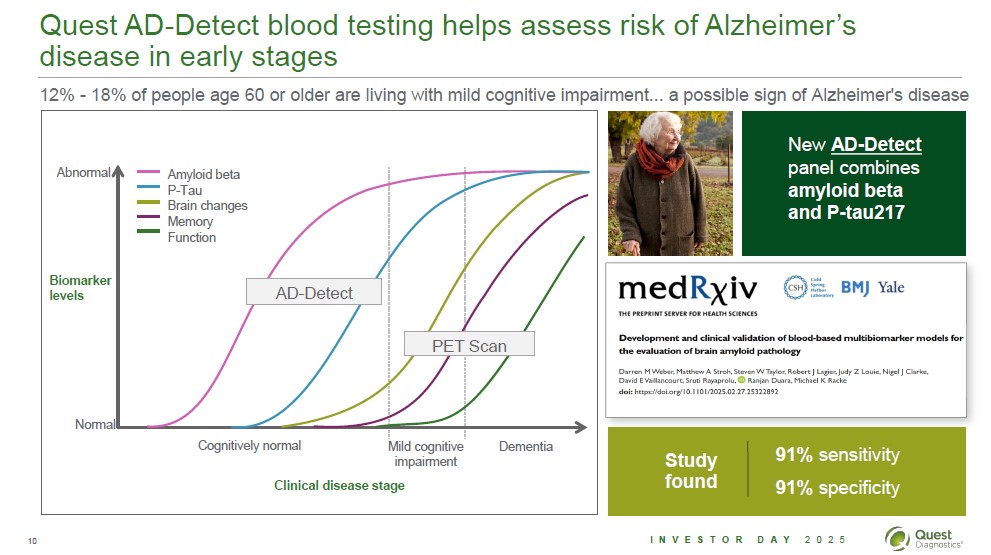
Quest AD-Detect blood testing helps assess risk of Alzheimer's disease in early stages
12% - 18% of people age 60 or older are living with mild cognitive impairment... a possible sign of Alzheimer's disease
New AD-Detect panel combines amyloid beta and P-tau217
Normal
Abnormal
Cognitively normal
Mild cognitive impairment
Dementia
Clinical disease stage
Biomarker levels
Amyloid beta
P-Tau
Brain changes
Memory
Function
PET Scan
AD-Detect
Study found
91% sensitivity
91% specificity
medRxiv CSH Cold Spring Harbor BMJ Yale
THE PREPRINT SERVER FOR HEALTH SCIENCES
Development and clinical validation of blood-based multibiomarker models for the evaluation of brain amyloid pathology
Darren M Weber, Matthew A Stroh, Steven W Taylor, Robert J Lagier, Judy Z Louie, Nigel J Clarke, David E Vaillancourt, Sruti Rayaprolu, ID Ranjan Duara, Michael K Racke
doi: https://doi.org/10.1101/2025.02.27.25322892
10 INVESTOR DAY 2025 Quest Diagnostics
11 INVESTOR DAY 2025 Quest Diagnostics
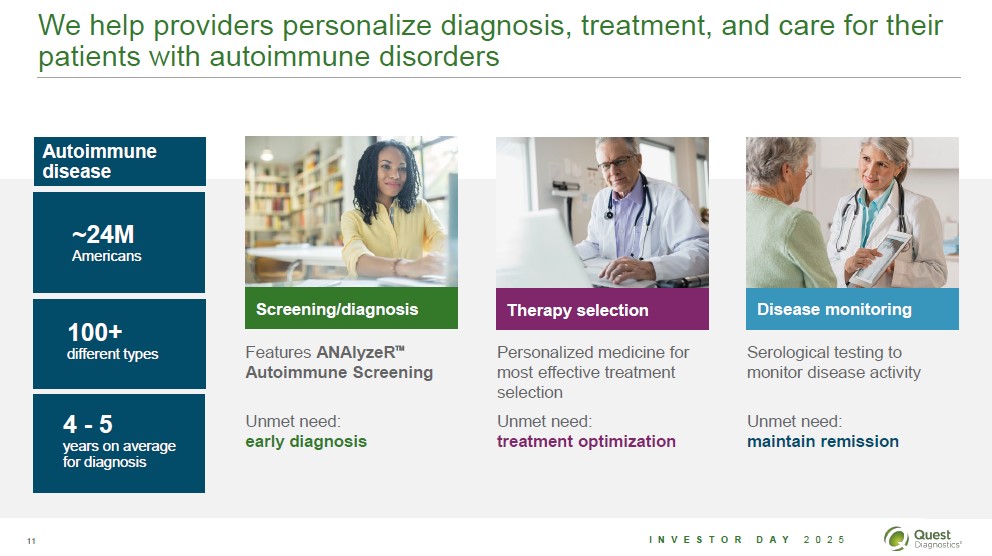
We help providers personalize diagnosis, treatment, and care for their patients with autoimmune disorders
Features ANAlyzeR Autoimmune Screening
Unmet need: early diagnosis
Screening/diagnosis
Personalized medicine for most effective treatment selection
Unmet need: treatment optimization
Therapy selection
Serological testing to monitor disease activity
Unmet need: maintain remission
Disease monitoring
~24M Americans
100+ different types
4 - 5 years on average for diagnosis
Autoimmune disease
12 INVESTOR DAY 2025 Quest Diagnostics
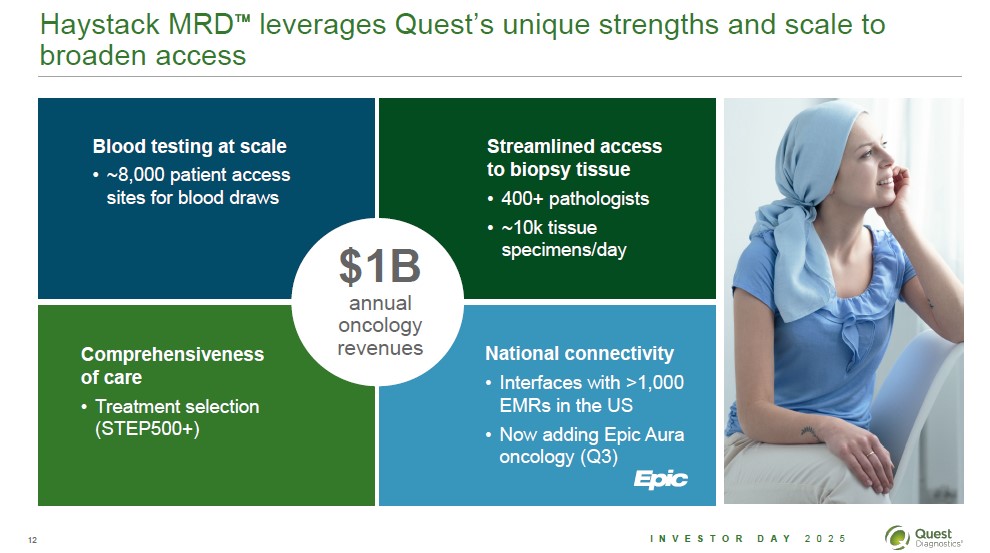
Haystack MRD leverages Quest's unique strengths and scale to broaden access
National connectivity
Interfaces with >1,000 EMRs in the US
Now adding Epic Aura oncology (Q3)
Epic
$1B annual oncology revenues
Blood testing at scale
~8,000 patient access sites for blood draws
Streamlined access to biopsy tissue
400+ pathologists
~10k tissue specimens/day
Comprehensiveness of care
Treatment selection (STEP500+)
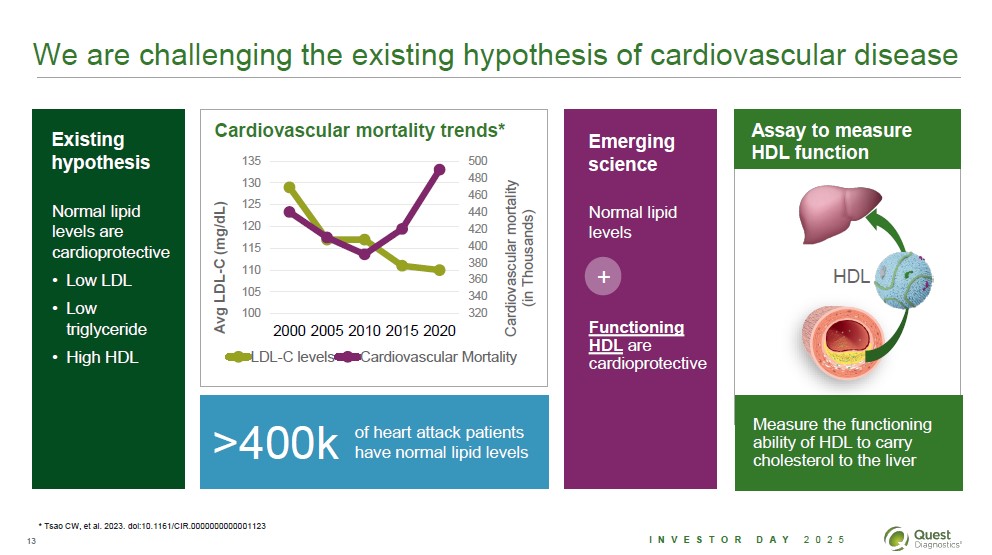
We are challenging the existing hypothesis of cardiovascular disease
>400k
Normal lipid levels are cardioprotective
Low LDL
Low triglyceride
High HDL
Existing
hypothesis
Normal lipid levels
+
Functioning HDL are cardioprotective
Emerging science
However
Measure the functioning ability of HDL to carry cholesterol to the liver
HDL
Assay to measure HDL function
Cardiovascular mortality trends*
320
340
360
380
400
420
440
460
480
500
100
105
110
115
120
125
130
135
2000
2005
2010
2015
2020
Cardiovascular mortality (in Thousands)
Avg LDL-C (mg/dL)
LDL-C levels
Cardiovascular Mortality
of heart attack patients have normal lipid levels
* Tsao CW, et al. 2023. doi:10.1161/CIR.0000000000001123
13 INVESTOR DAY 2025 Quest Diagnostics
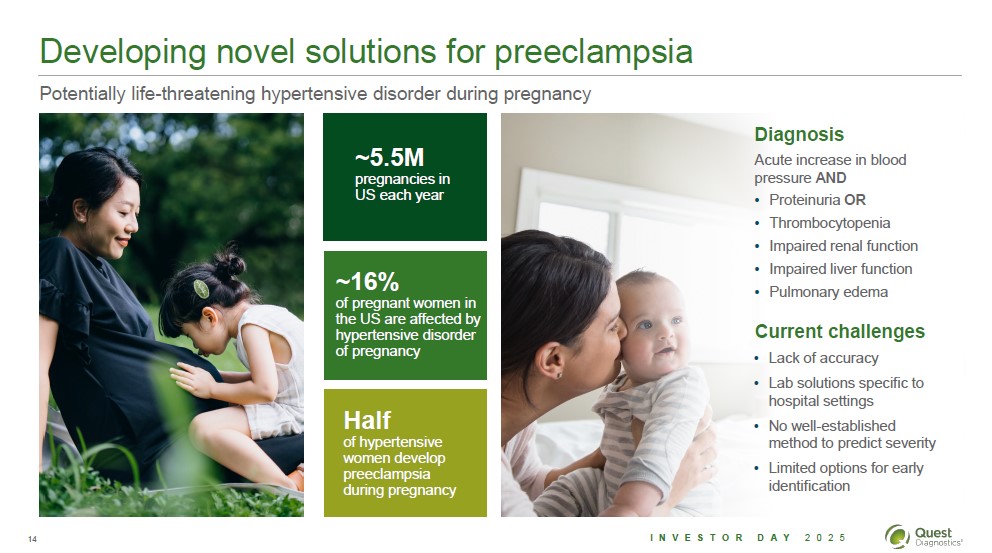
Developing novel solutions for preeclampsia
Potentially life-threatening hypertensive disorder during pregnancy
~16%
of pregnant women in
the US are affected by
hypertensive disorder
of pregnancy
Half
of hypertensive
women develop
preeclampsia
during pregnancy
~5.5M
pregnancies in
US each year
Diagnosis
Acute increase in blood
pressure AND
Proteinuria OR
Thrombocytopenia
Impaired renal function
Impaired liver function
Pulmonary edema
Current challenges
Lack of accuracy
Lab solutions specific to
hospital settings
No well-established
method to predict severity
Limited options for early
Identification
14 INVESTOR DAY 2025 Quest Diagnostics
15 INVESTOR DAY 2025 Quest Diagnostics
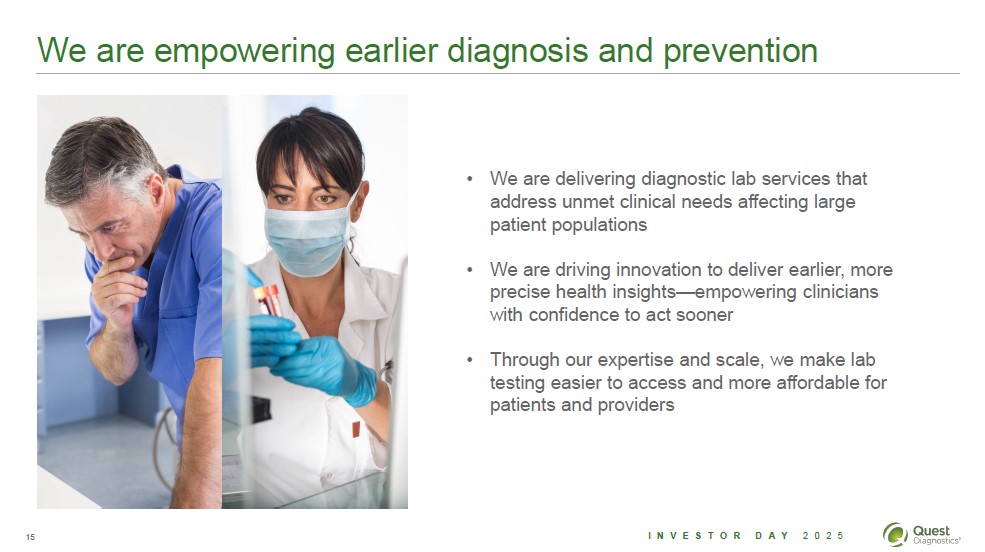
We are empowering earlier diagnosis and prevention
We are delivering diagnostic lab services that
address unmet clinical needs affecting large
patient populations
We are driving innovation to deliver earlier, more
precise health insights-empowering clinicians
with confidence to act sooner
Through our expertise and scale, we make lab
testing easier to access and more affordable for
patients and providers
16 INVESTOR DAY 2025 Quest Diagnostics
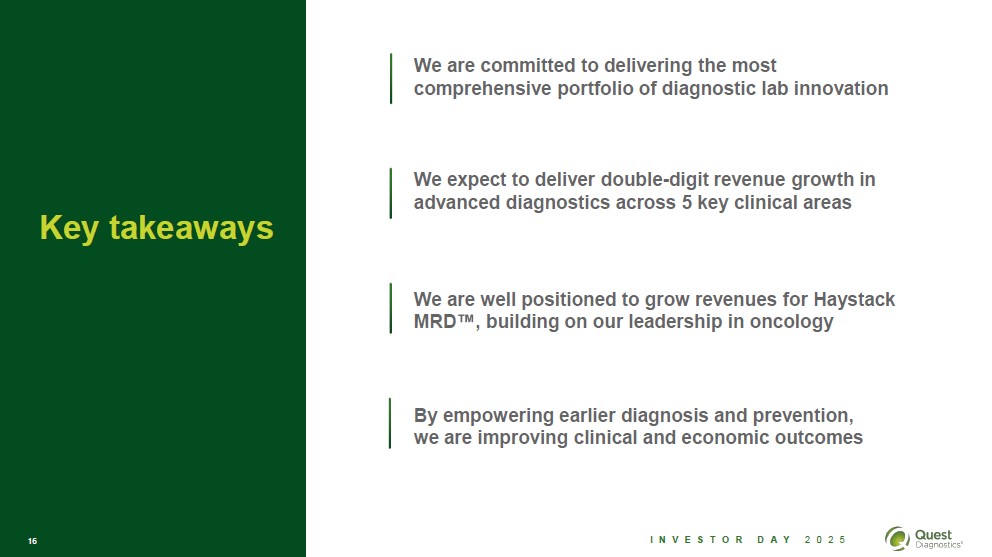
Key takeaways
We expect to deliver double-digit revenue growth in advanced diagnostics across 5key clinical areas
We are well positioned to grow revenues for Haystack MRD, building on our leadership in oncology
We are committed to delivering the most comprehensive portfolio of diagnostic lab innovation
By empowering earlier diagnosis and prevention, we are improving clinical and economic outcomes
Improving Quality, Experiences, and Productivity
Cathy Doherty Executive Vice President, Regional Businesses
Alex Louis Senior Vice President, Enterprise Operations
Investor Day 2025 Quest Diagnostics
2 INVESTOR DAY 2025 Quest Diagnostics
Safe harbor disclosure
The statements in this presentation which are not historical facts may be forward-looking statements. Readers are cautioned not to place undue reliance on forward-looking statements, which speak only as of the date that they are made and which reflect management's current estimates, projections, expectations or beliefs and which involve risks and uncertainties that could cause actual results and outcomes to be materially different. Risks and uncertainties that may affect the future results of the company include, but are not limited to, adverse results from pending or future government investigations, lawsuits or private actions, the competitive environment, the complexity of billing, reimbursement and revenue recognition for clinical laboratory testing, changes in government regulations, changing relationships with customers, payers, suppliers or strategic partners, acquisitions and other factors discussed in the company's most recently filed Annual Report on Form 10-K and in any of the company's subsequently filed Quarterly Reports on Form 10-Q and Current Reports on Form 8-K, including those discussed in the "Business," "Risk Factors," "Cautionary Factors that May Affect Future Results," and "Management's Discussion and Analysis of Financial Condition and Results of Operations" sections of those reports.
3 INVESTOR DAY 2025 Quest Diagnostics
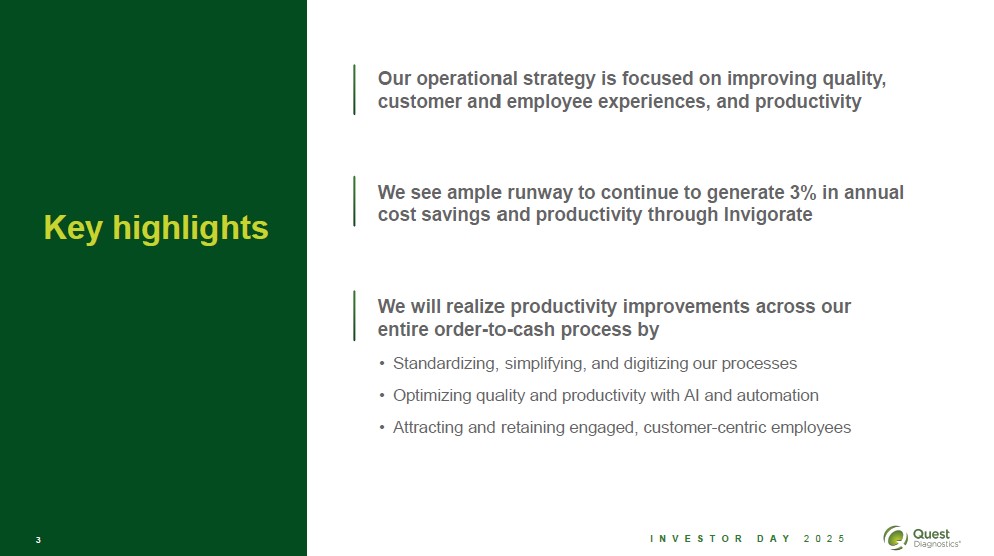
Key highlights
Our operational strategy is focused on improving quality, customer and employee experiences, and productivity
We see ample runway to continue to generate 3% in annual cost savings and productivity through Invigorate
We will realize productivity improvements across our entire order-to-cash process by
Standardizing, simplifying, and digitizing our processes
Optimizing quality and productivity with AI and automation
Attracting and retaining engaged, customer-centric employees
4 INVESTOR DAY 2025 Quest Diagnostics
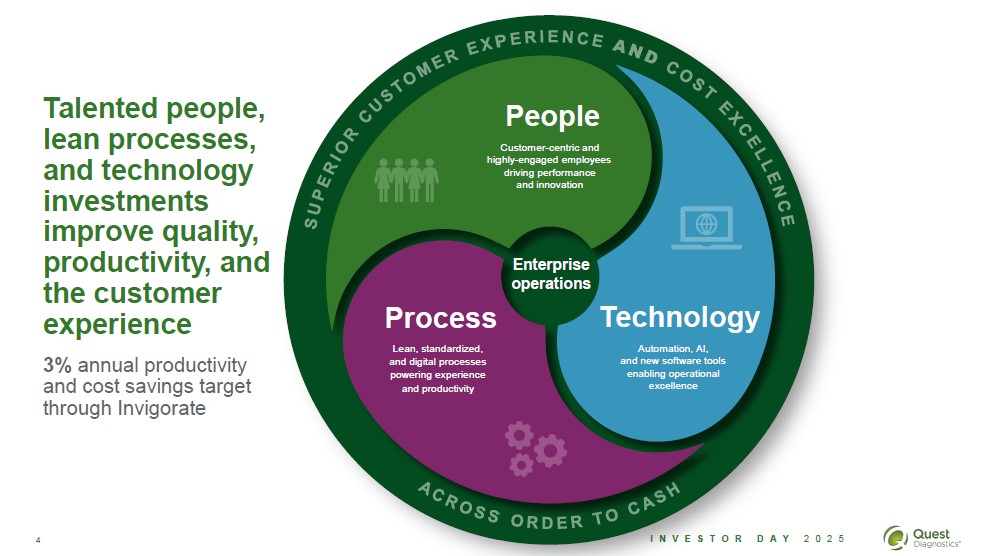
3% annual productivity and cost savings target through Invigorate
People
Customer-centric and highly-engaged employees driving performance and innovation
Technology
Automation, AI, and new software tools enabling operational excellence
Process
Lean, standardized, and digital processes powering experience and productivity
Enterprise operations
Talented people, lean processes, and technology investments improve quality, productivity, and the customer experience
SUPERIOR CUSTOMER EXPERIENCE AND COST EXCELLENCE
ACROSS ORDER TO CASH
5 INVESTOR DAY 2025 Quest Diagnostics
We are making improvements across our order-to-cash value stream
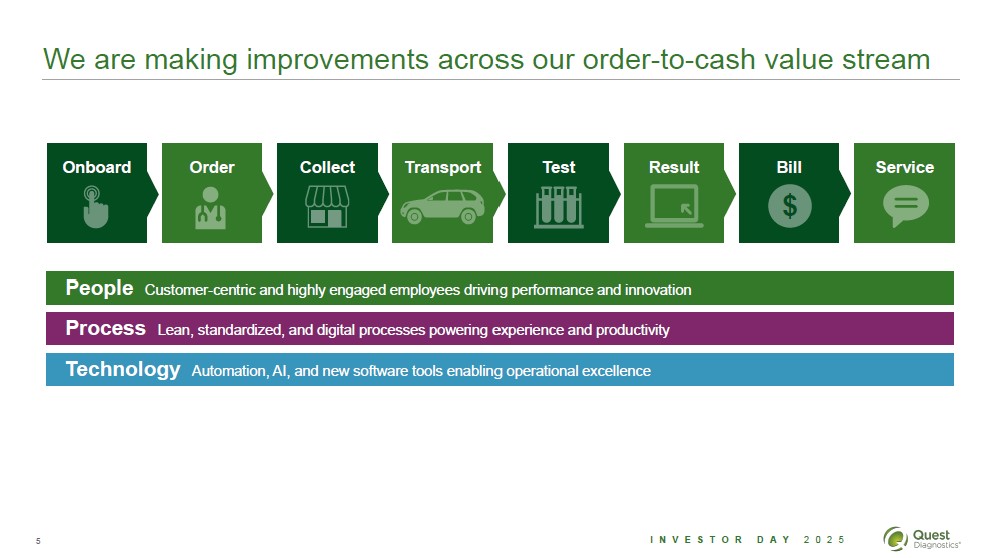
People Customer-centric and highly engaged employees driving performance and innovation
Process Lean, standardized, and digital processes powering experience and productivity
Technology Automation, AI, and new software tools enabling operational excellence
Onboard
Order
Collect
Test
Result
Bill
Service
$
Transport
6 INVESTOR DAY 2025 Quest Diagnostics
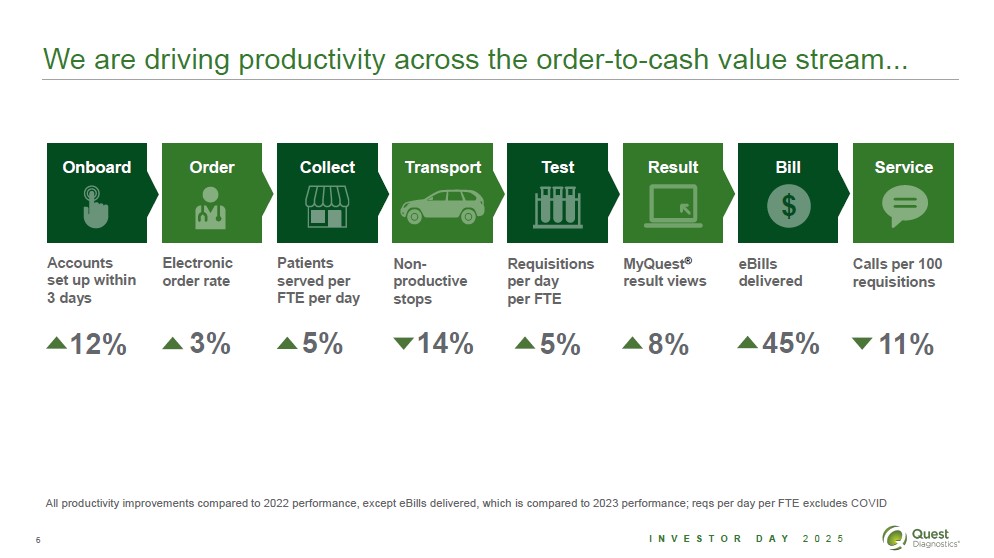
We are driving productivity across the order-to-cash value stream...
5%
14%
5%
11%
3%
8%
45%
12%
All productivity improvements compared to 2022 performance, except eBills delivered, which is compared to 2023 performance; reqs per day per FTE excludes COVID
Patients served per FTE per day
Non-productive stops
Requisitions per day per FTE
Calls per 100 requisitions
Accounts set up within 3 days
Electronic order rate
MyQuest
result views
eBills delivered
Onboard
Order
Collect
Test
Result
Bill
Service
$
Transport
7 INVESTOR DAY 2025 Quest Diagnostics
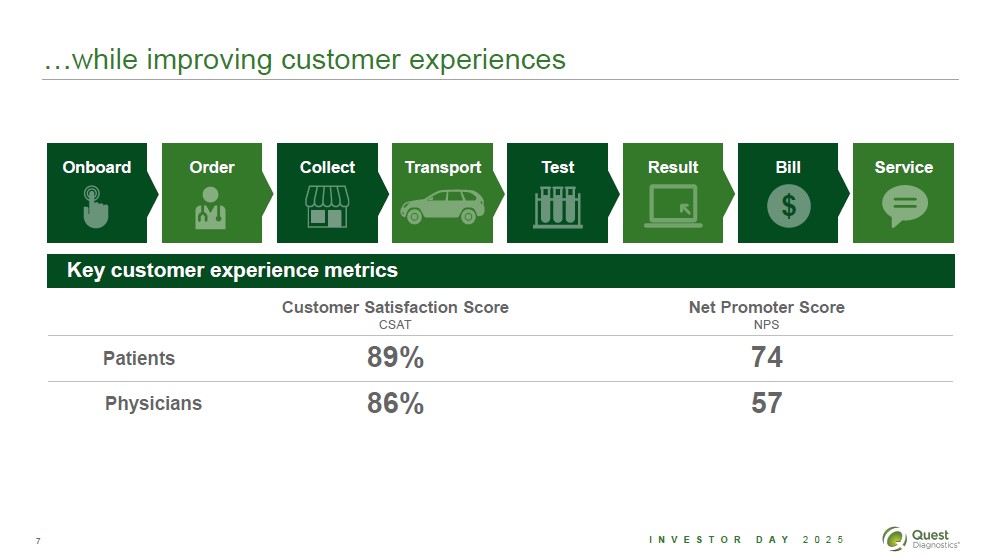
…while improving customer experiences
Customer Satisfaction Score
CSAT
Net Promoter Score
NPS
Patients
89%
74
Physicians
86%
57
Key customer experience metrics
Onboard
Order
Collect
Test
Result
Bill
Service
$
Transport
8 INVESTOR DAY 2025 Quest Diagnostics
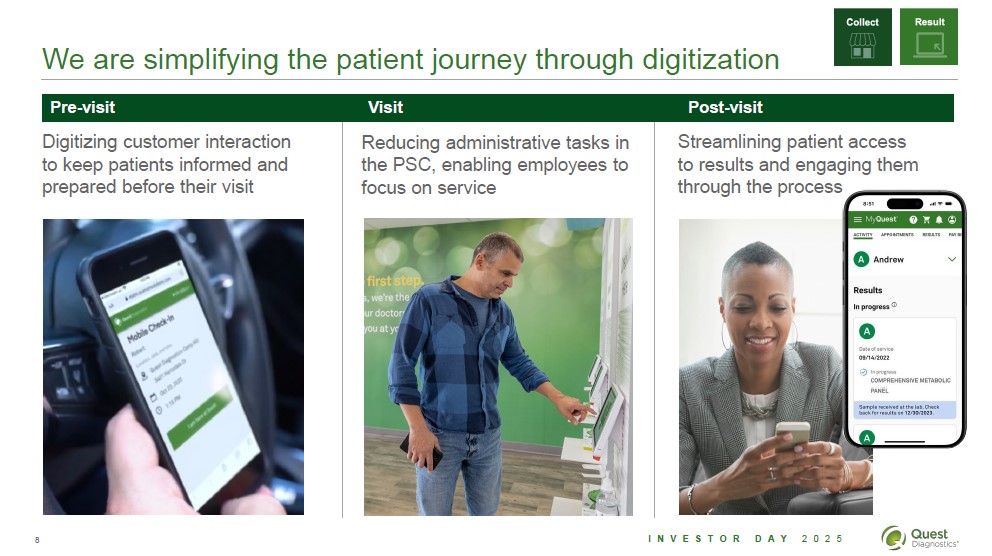
We are simplifying the patient journey through digitization
Digitizing customer interaction to keep patients informed and prepared before their visit
Reducing administrative tasks in the PSC, enabling employees to focus on service
Streamlining patient access to results and engaging them through the process
Pre-visit Visit Post-visit
Collect
Result
MyQuest
A Andrew
Results
In progress
A
A
9 INVESTOR DAY 2025 Quest Diagnostics
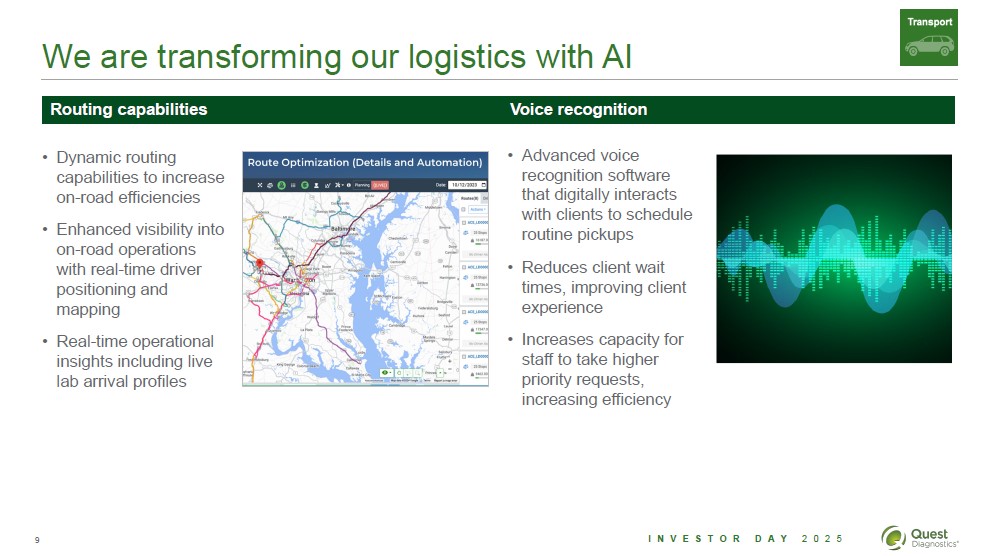
We are transforming our logistics with AI
Transport
Route Optimization (Details and Automation)
Dynamic routing capabilities to increase on-road efficiencies
Enhanced visibility into on-road operations with real-time driver positioning and mapping
Real-time operational insights including live lab arrival profiles
Advanced voice recognition software that digitally interacts with clients to schedule routine pickups
Reduces client wait times, improving client experience
Increases capacity for staff to take higher priority requests, increasing efficiency
Routing capabilities Voice recognition
10 INVESTOR DAY 2025 Quest Diagnostics
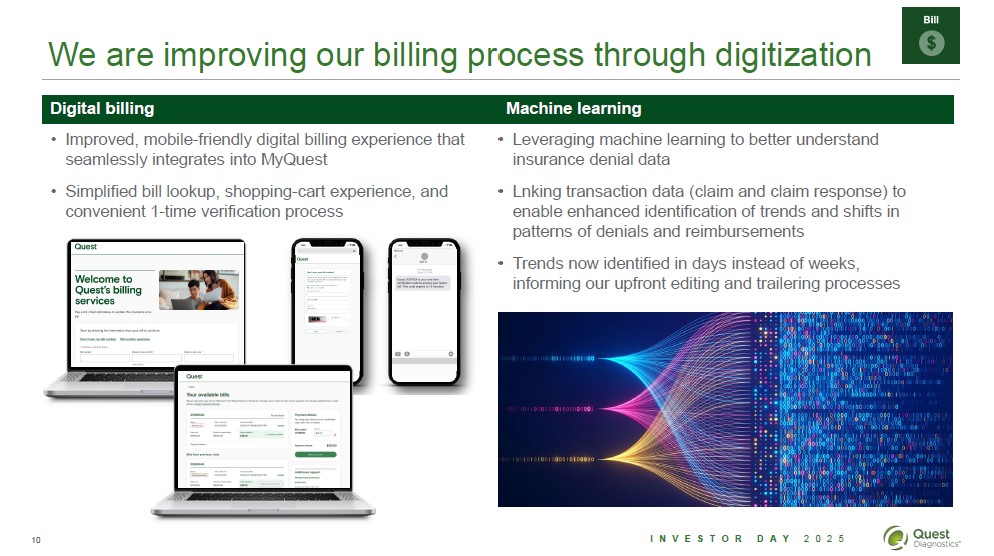
We are improving our billing process through digitization
Bill $
Quest
Welcome to Quest's billing services
Leveraging machine learning to better understand insurance denial data
Lnking transaction data (claim and claim response) to enable enhanced identification of trends and shifts in patterns of denials and reimbursements
Trends now identified in days instead of weeks, informing our upfront editing and trailering processes
Improved, mobile-friendly digital billing experience that seamlessly integrates into MyQuest
Simplified bill lookup, shopping-cart experience, and convenient 1-time verification process
Digital billing Machine learning
11 INVESTOR DAY 2025 Quest Diagnostics
Service =
100% = 12.2M
100% = 13.2M
2023
2024
Phone
Email
Chat
71%
18%
11%
75%
19%
6%
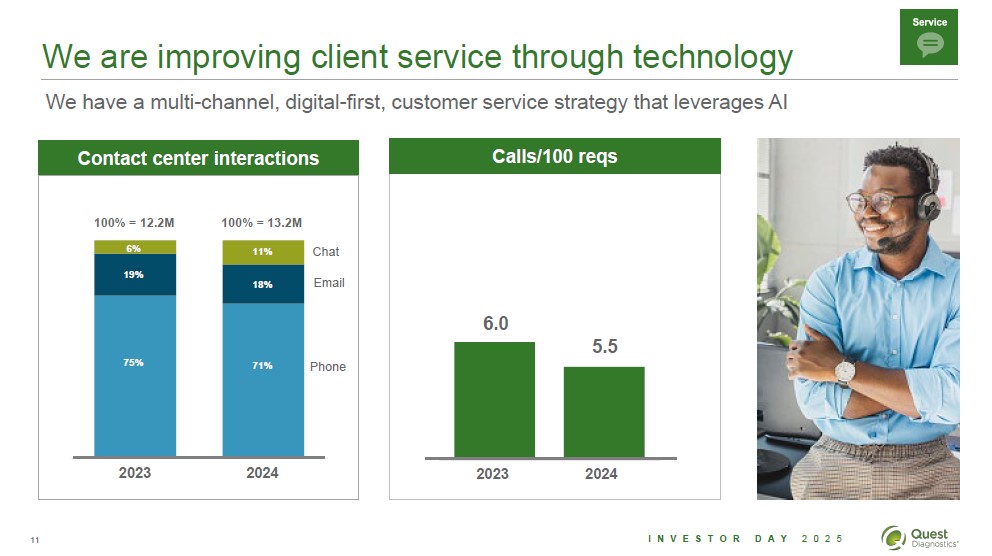
We are improving client service through technology
We have a multi-channel, digital-first, customer service strategy that leverages AI
5.5
2022
2024
Calls/100 reqs
Contact center interactions
5.5
6.0
12 INVESTOR DAY 2025 Quest Diagnostics
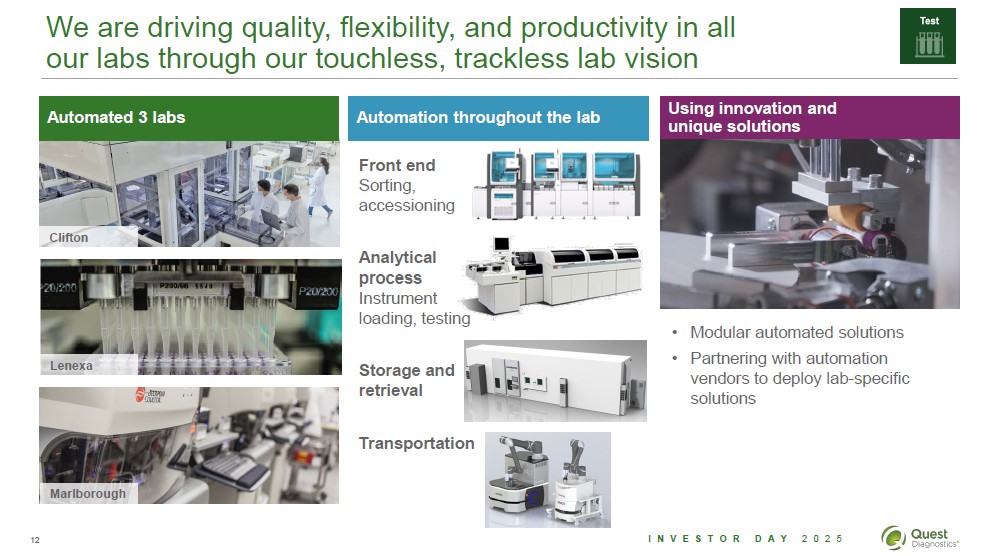
We are driving quality, flexibility, and productivity in all our labs through our touchless, trackless lab vision
Test
Automated 3 labs
Automation throughout the lab
Front end Sorting, accessioning
Analytical process Instrument loading, testing
Storage and retrieval
Transportation
Using innovation and unique solutions
Modular automated solutions
Partnering with automation vendors to deploy lab-specific solutions
Clifton
Lenexa
Marlborough
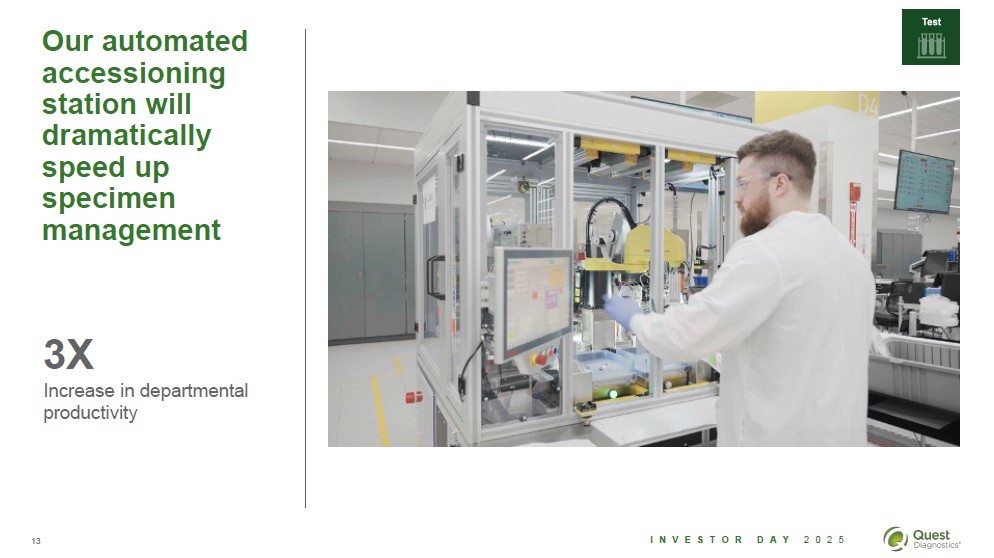
13 INVESTOR DAY 2025 Quest Diagnostics
Test
Our automated accessioning station will dramatically speed up specimen management
3X
Increase in departmental productivity
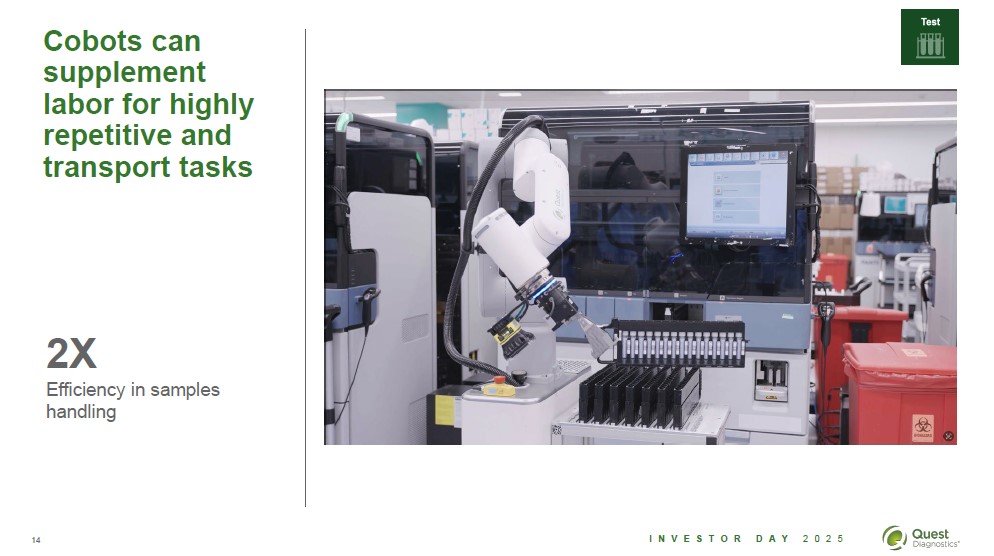
14 INVESTOR DAY 2025 Quest Diagnostics
Test
Cobots can supplement labor for highly repetitive and transport tasks
2X
Efficiency in samples handling
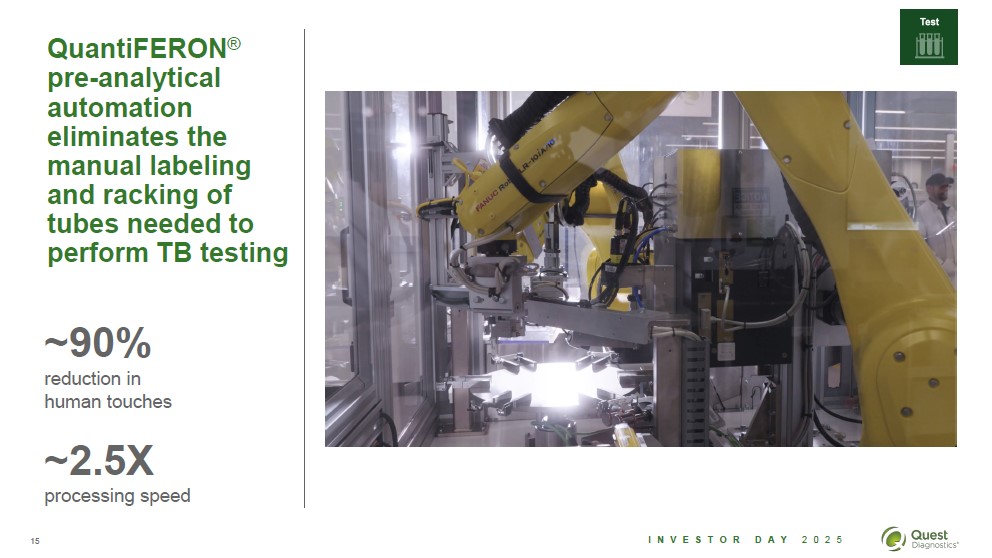
15 INVESTOR DAY 2025 Quest Diagnostics
Test
QuantiFERON
pre-analytical automation eliminates the manual labeling and racking of tubes needed to perform TB testing
~90%
reduction in human touches
~2.5X
processing speed
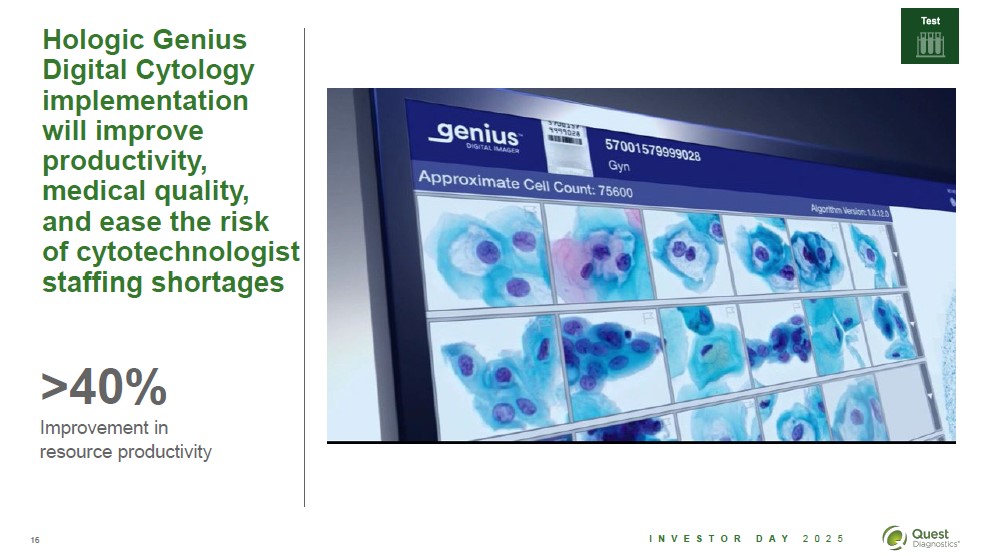
16 INVESTOR DAY 2025 Quest Diagnostics
Test
Hologic Genius Digital Cytology implementation will improve productivity, medical quality, and ease the risk of cytotechnologist staffing shortages
>40%
Improvement in resource productivity
Genius 57001579999028
Gyn
Approximate Cell Count: 75600 Algorithm Version 1.0.12.0
17 INVESTOR DAY 2025 Quest Diagnostics
Modernize systems | Improve customer experiences | Lower IT spend | Improve productivity
Project Nova
We are transforming our order-to-cash process through Project Nova
EMRs
Ortec
QBS
EMRs
Quanum
Salesforce
MyQuest
QSuite LIS
Esoteric/Genetic LIS
AP/Derm LIS
EMRs
IT initiative will modernize underlying applications to improve customer experiences and lower IT costs
IDAA
QDTRac
Onboard
Order
Collect
Test
Result
Bill
Service
$
Transport
Quanum
18 INVESTOR DAY 2025 Quest Diagnostics
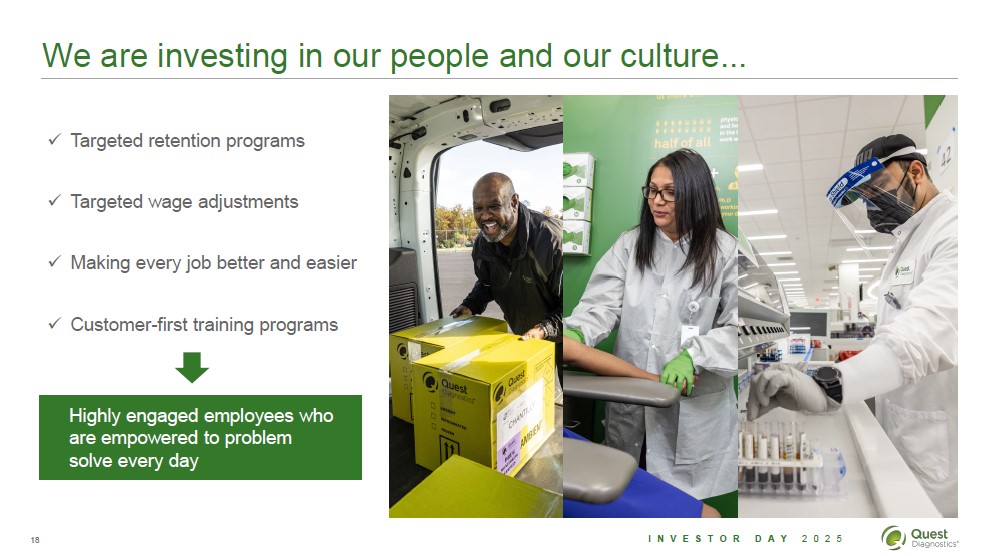
We are investing in our people and our culture...
Targeted retention programs
Targeted wage adjustments
Making every job better and easier
Customer-first training programs
Highly engaged employees who are empowered to problem solve every day
19 INVESTOR DAY 2025 Quest Diagnostics
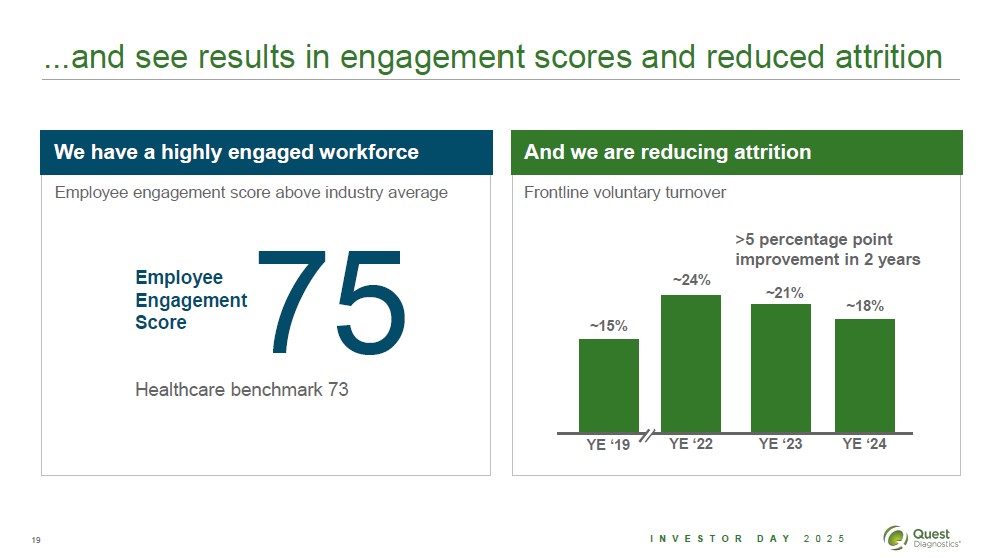
...and see results in engagement scores and reduced attrition
~15%
~24%
~21%
~18%
YE '19
YE '22
YE '23
YE '24
>5 percentage point improvement in 2 years
Frontline voluntary turnover
We have a highly engaged workforce
And we are reducing attrition
Employee engagement score above industry average
Employee
Engagement
Score
Healthcare benchmark 73
75
20 INVESTOR DAY 2025 Quest Diagnostics
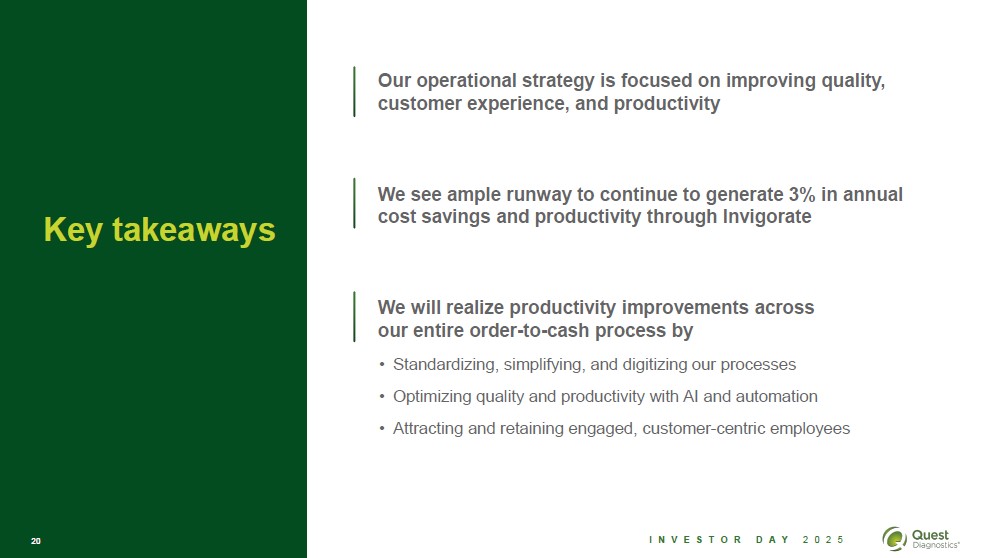
Key takeaways
Our operational strategy is focused on improving quality, customer experience, and productivity
We see ample runway to continue to generate 3% in annual cost savings and productivity through Invigorate
We will realize productivity improvements across our entire order-to-cash process by
Standardizing, simplifying, and digitizing our processes
Optimizing quality and productivity with AI and automation
Attracting and retaining engaged, customer-centric employees
Sam Samad Executive Vice President and Chief Financial Officer
Long-term Financial Outlook
Investor Day 2025 Quest Diagnostics
2 INVESTOR DAY 2025 Quest Diagnostics
Safe harbor disclosure
The statements in this press release which are not historical facts may be forward-looking statements. Readers are cautioned not to place undue reliance on forward-looking statements, which speak only as of the date that they are made and which reflect management's current estimates, projections, expectations or beliefs and which involve risks and uncertainties that could cause actual results and outcomes to be materially different. Risks and uncertainties that may affect the future results of the company include, but are not limited to, adverse results from pending or future government investigations, lawsuits or private actions, the competitive environment, the complexity of billing, reimbursement and revenue recognition for clinical laboratory testing, changes in government regulations, changing relationships with customers, payers, suppliers or strategic partners, acquisitions and other factors discussed in the company's most recently filed Annual Report on Form 10-K and in any of the company's subsequently filed Quarterly Reports on Form 10-Q and Current Reports on Form 8-K, including those discussed in the "Business," "Risk Factors," "Cautionary Factors that May Affect Future Results," and "Management's Discussion and Analysis of Financial Condition and Results of Operations" sections of those reports.
In the following presentations, references to adjusted EPS refer to adjusted diluted EPS. Any references to operating margin(s) refer to adjusted operating income as a percentage of net revenues. Any references to free cash flow refer to cash flow from operations less capital expenditures. Adjusted EPS, operating margin and free cash flow are non-GAAP financial
measures. Please see the explanation of these non-GAAP measures, including the
comparable GAAP measure, at the end this presentation and on Investor Relations
page on our website.
3 INVESTOR DAY 2025 Quest Diagnostics
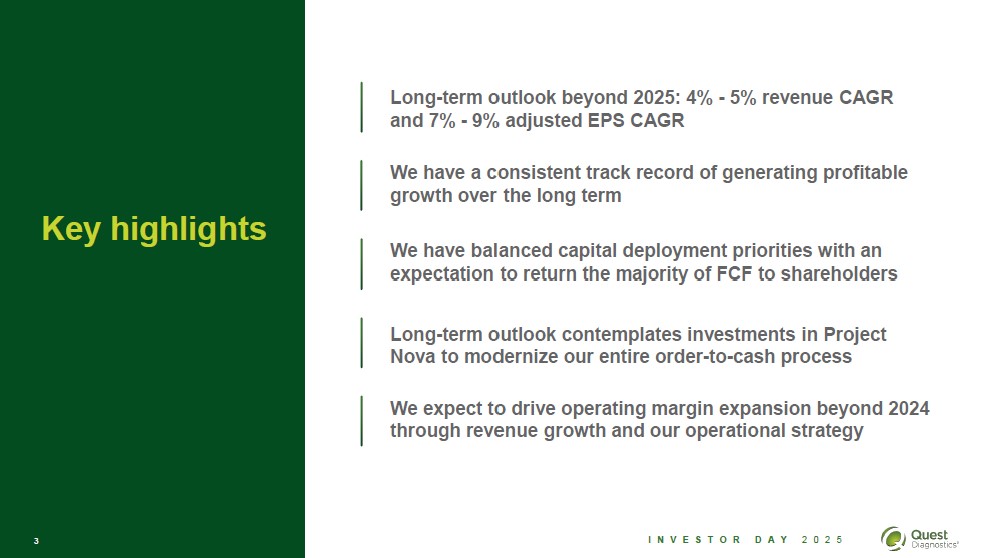
Key highlights
We have a consistent track record of generating profitable growth over the long term
We have balanced capital deployment priorities with an expectation to return the majority of FCF to shareholders
We expect to drive operating margin expansion beyond 2024 through revenue growth and our operational strategy
Long-term outlook beyond 2025: 4% - 5% revenue CAGR and 7% - 9% adjusted EPS CAGR
Long-term outlook contemplates investments in Project Nova to modernize our entire order-to-cash process
4 INVESTOR DAY 2025 Quest Diagnostics
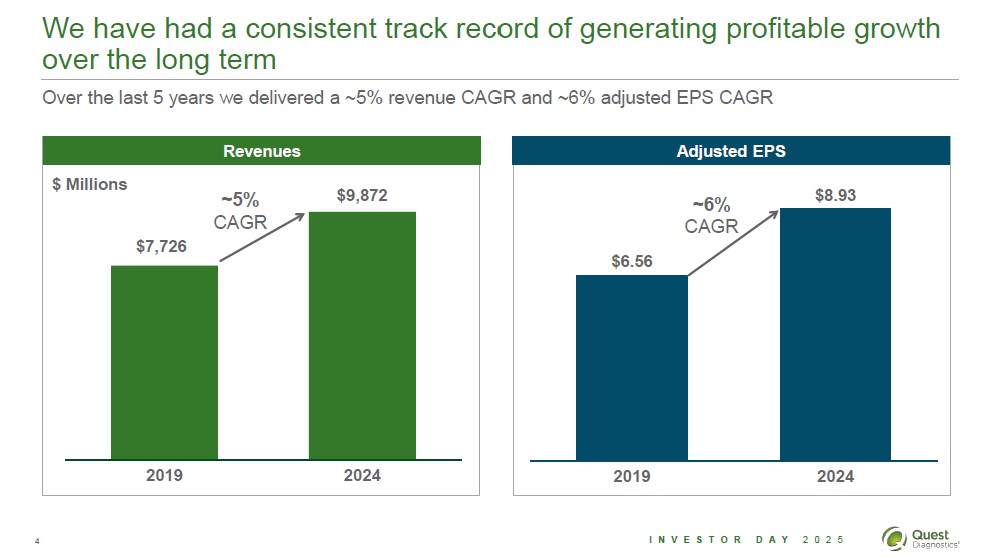
We have had a consistent track record of generating profitable growth over the long term
Over the last 5years we delivered a ~5% revenue CAGR and ~6% adjusted EPS CAGR
$7,726
$9,872
2019
2024
$6.56
$8.93
2019
2024
~6% CAGR
$ Millions
Revenues
Adjusted EPS
~5% CAGR
5 INVESTOR DAY 2025 Quest Diagnostics
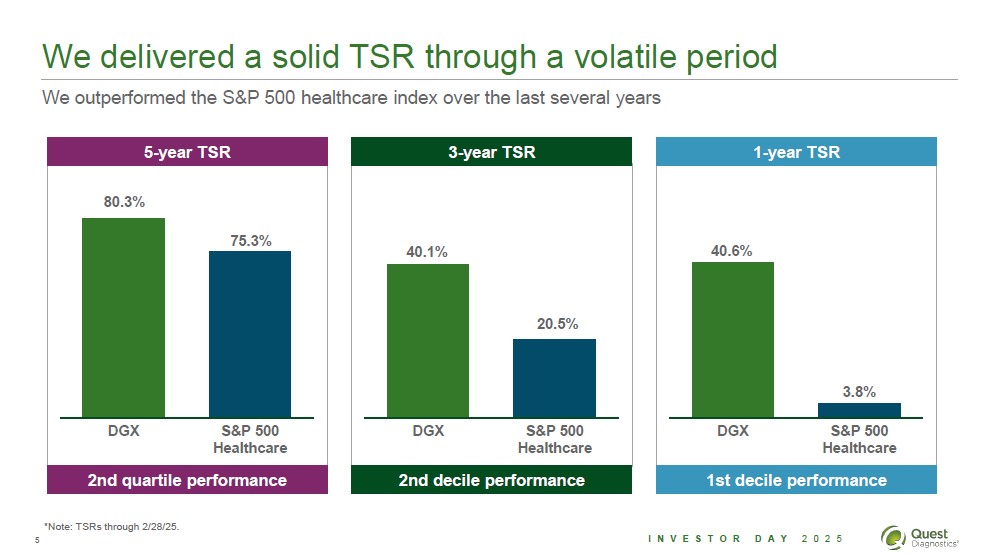
We delivered a solid TSR through a volatile period
We outperformed the SandP 500 healthcare index over the last several years
80.3%
75.3%
DGX
SandP 500 Healthcare
5-year TSR
40.1%
20.5%
DGX
SandP 500 Healthcare
3-year TSR
40.6%
3.8%
DGX
SandP 500 Healthcare
1-year TSR
2nd quartile performance
2nd decile performance
1st decile performance
*Note: TSRs through 2/28/25.
6 INVESTOR DAY 2025 Quest Diagnostics
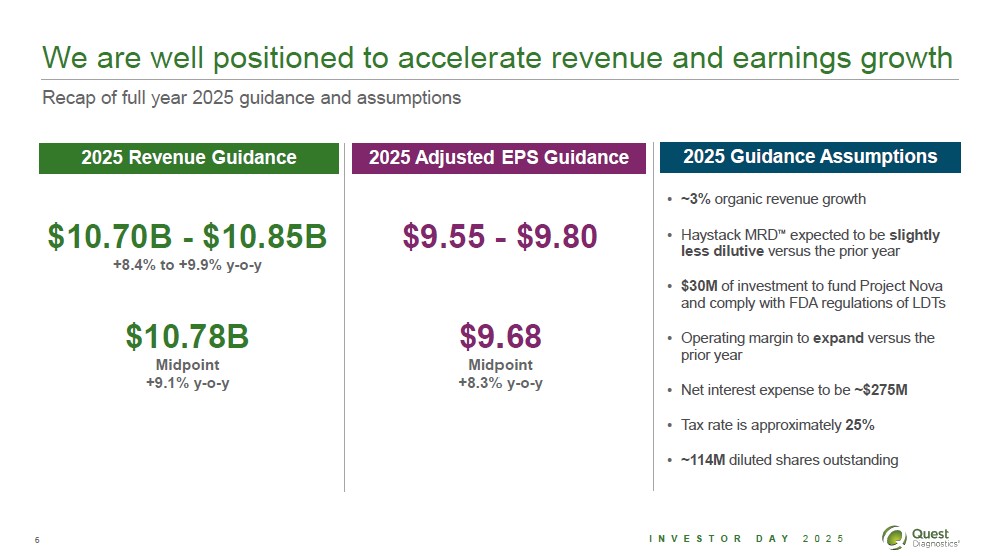
We are well positioned to accelerate revenue and earnings growth
Recap of full year 2025 guidance and assumptions
2025 Revenue Guidance
2025 Adjusted EPS Guidance
2025 Guidance Assumptions
$10.70B - $10.85B
+8.4% to +9.9% y-o-y
~3% organic revenue growth
Haystack MRD expected to be slightly less dilutive versus the prior year
$30M of investment to fund Project Nova and comply with FDA regulations of LDTs
Operating margin to expand versus the prior year
Net interest expense to be ~$275M
Tax rate is approximately 25%
~114M diluted shares outstanding
$10.78B
Midpoint
+9.1% y-o-y
$9.55 - $9.80
$9.68
Midpoint
+8.3% y-o-y
7 INVESTOR DAY 2025 Quest Diagnostics
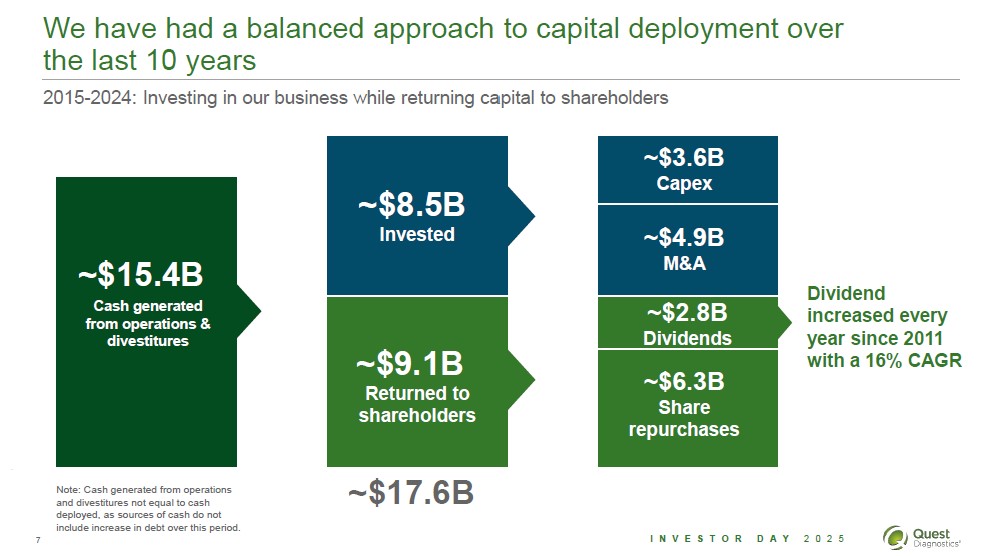
We have had a balanced approach to capital deployment over the last 10 years
2015-2024: Investing in our business while returning capital to shareholders
Note: Cash generated from operations and divestitures not equal to cash deployed, as sources of cash do not include increase in debt over this period.
Invested
~$15.4B
Returned to shareholders
~$3.6B Capex
~$4.9B MandA
~$2.8B Dividends
~$6.3B Share repurchases
Cash generated from operations and divestitures
~$9.1B
~$8.5B
~$17.6B
Dividend increased every year since 2011 with a 16% CAGR
8 INVESTOR DAY 2025 Quest Diagnostics
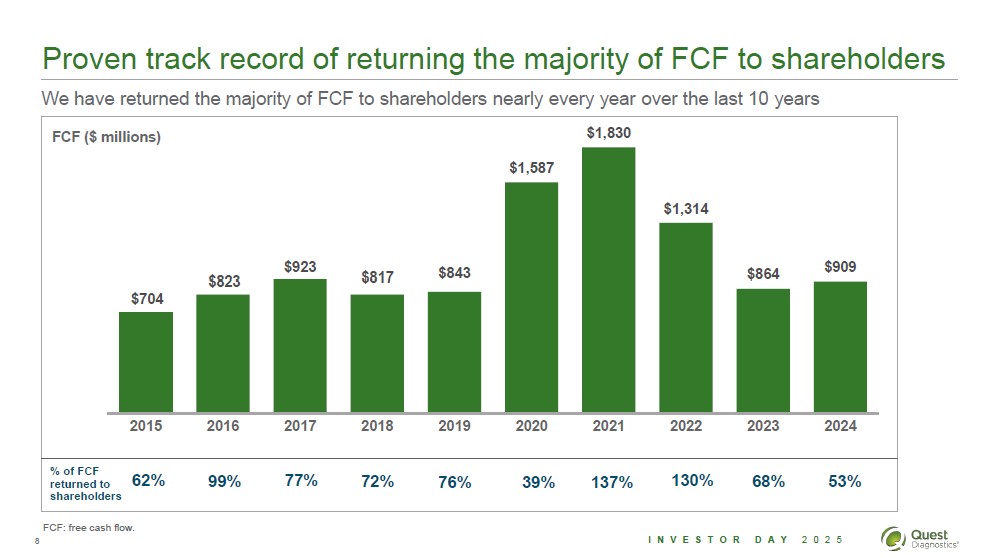
Proven track record of returning the majority of FCF to shareholders
$704
$823
$923
$817
$843
$1,587
$1,830
$1,314
$864
$909
2015
2016
2017
2018
2019
2020
2021
2022
2023
2024
62%
99%
77%
72%
FCF ($ millions)
76%
39%
137%
130%
68%
53%
We have returned the majority of FCF to shareholders nearly every year over the last 10 years
FCF: free cash flow.
% of FCF returned to shareholders
9 INVESTOR DAY 2025 Quest Diagnostics
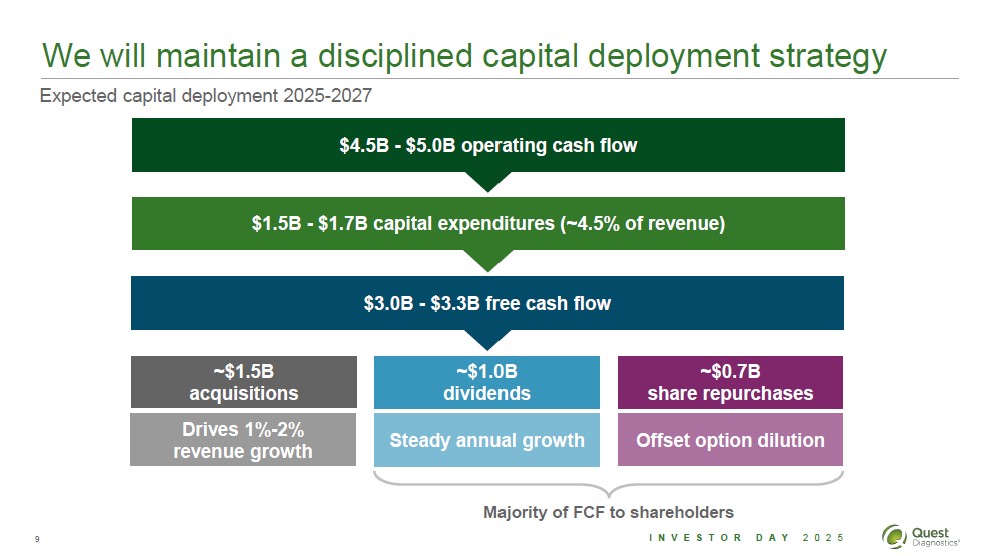
We will maintain a disciplined capital deployment strategy
$1.5B - $1.7B capital expenditures (~4.5% of revenue)
$4.5B - $5.0B operating cash flow
$3.0B - $3.3B free cash flow
Expected capital deployment 2025-2027
~$1.0B dividends
~$1.5B acquisitions
~$0.7B share repurchases
Steady annual growth
Drives 1%-2% revenue growth
Offset option dilution
Majority of FCF to shareholders
10 INVESTOR DAY 2025 Quest Diagnostics
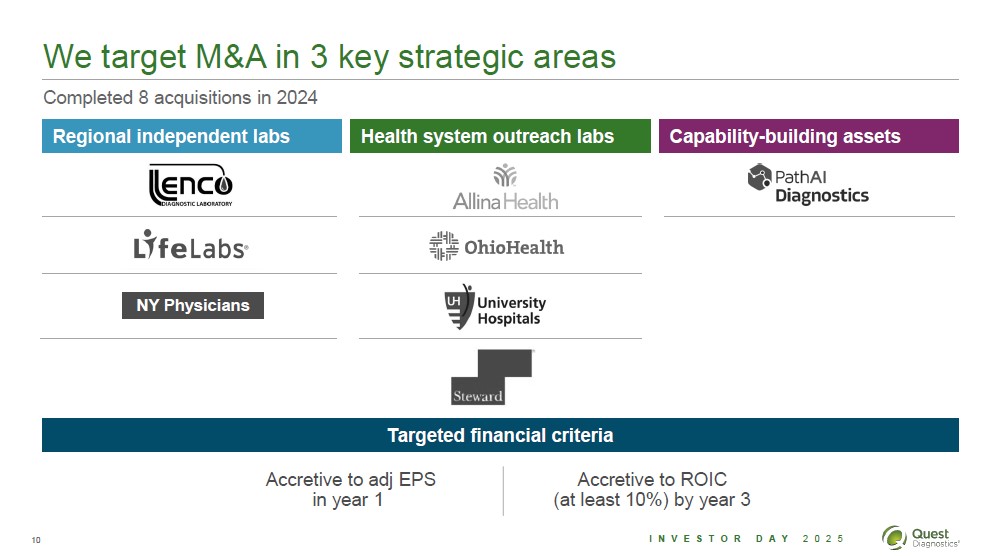
We target MandA in 3 key strategic areas
Regional independent labs
Capability-building assets
Health system outreach labs
Completed 8 acquisitions in 2024
Targeted financial criteria
Accretive to adj EPS in year 1
Accretive to ROIC
(at least 10%) by year 3
NY Physicians
ENCO
DIAGNOSTIC LABORATORY
LifeLabs
AllinaHealth
OhioHealth
University Hospitals
Steward
PathAI
Diagnostics
11 INVESTOR DAY 2025 Quest Diagnostics
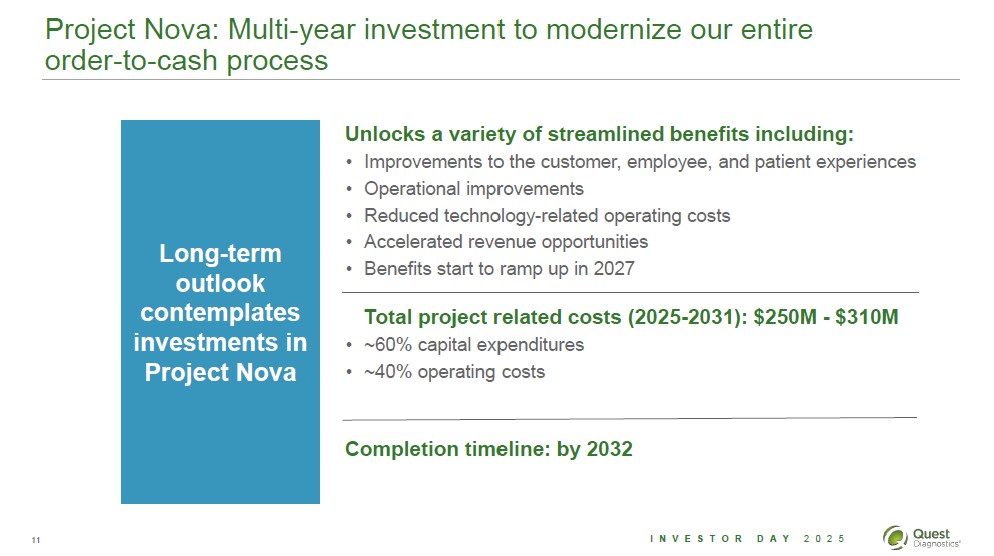
Project Nova: Multi-year investment to modernize our entire order-to-cash process
Unlocks a variety of streamlined benefits including:
Improvements to the customer, employee, and patient experiences
Operational improvements
Reduced technology-related operating costs
Accelerated revenue opportunities
Benefits start to ramp up in 2027
Total project related costs (2025-2031): $250M - $310M
~60% capital expenditures
~40% operating costs
Completion timeline: by 2032
Long-term outlook contemplates investments in Project Nova
12 INVESTOR DAY 2025 Quest Diagnostics
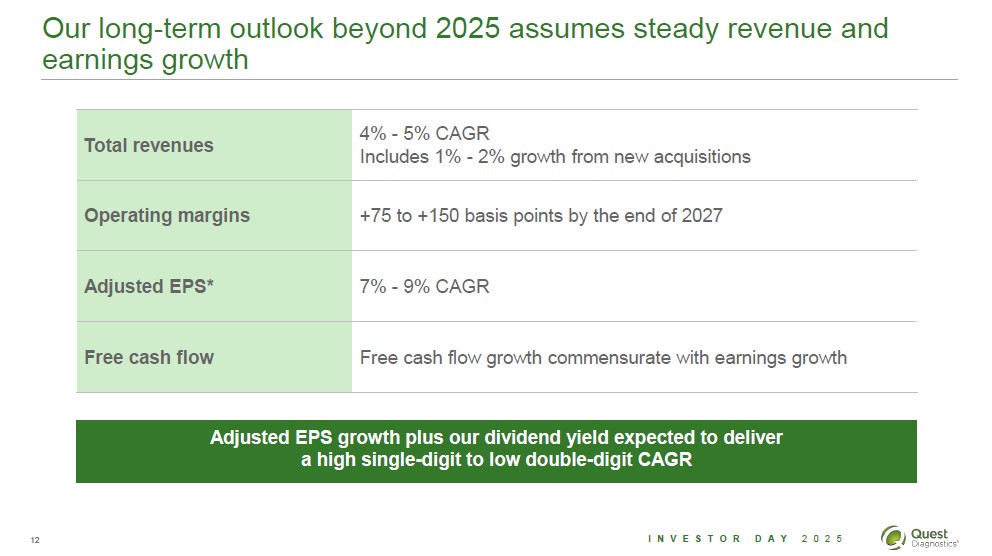
Our long-term outlook beyond 2025 assumes steady revenue and earnings growth
Total revenues
4% - 5% CAGR
Includes 1% - 2% growth from new acquisitions
Operating margins
+75 to +150 basis points by the end of 2027
Adjusted EPS*
7% - 9% CAGR
Free cash flow
Free cash flow growth commensurate with earnings growth
Adjusted EPS growth plus our dividend yield expected to deliver
a high single-digit to low double-digit CAGR
13 INVESTOR DAY 2025 Quest Diagnostics
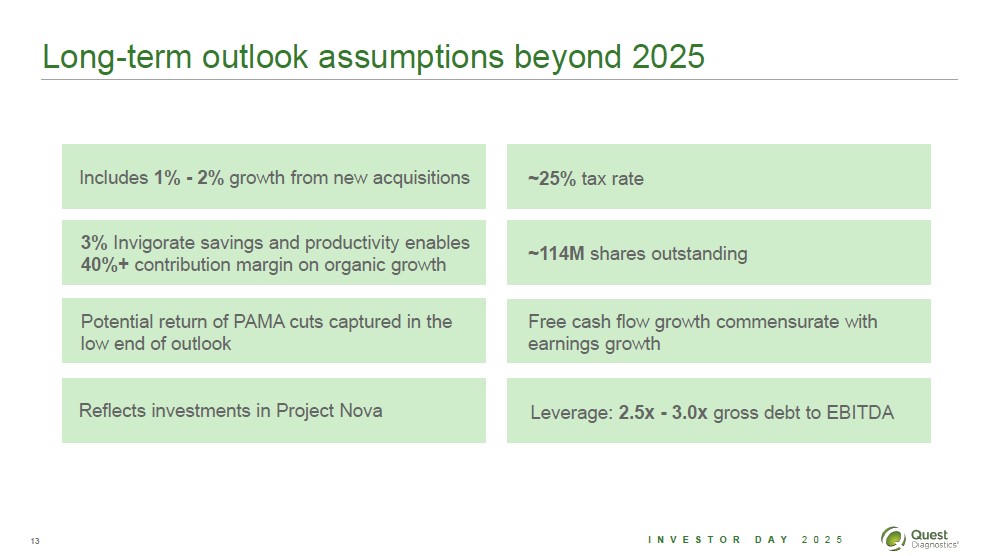
Long-term outlook assumptions beyond 2025
Includes 1% - 2% growth from new acquisitions
~25% tax rate
3% Invigorate savings and productivity enables 40%+ contribution margin on organic growth
Potential return of PAMA cuts captured in the low end of outlook
Reflects investments in Project Nova
~114M shares outstanding
Free cash flow growth commensurate with earnings growth
Leverage: 2.5x - 3.0x gross debt to EBITDA
14 INVESTOR DAY 2025 Quest Diagnostics
Key takeaways
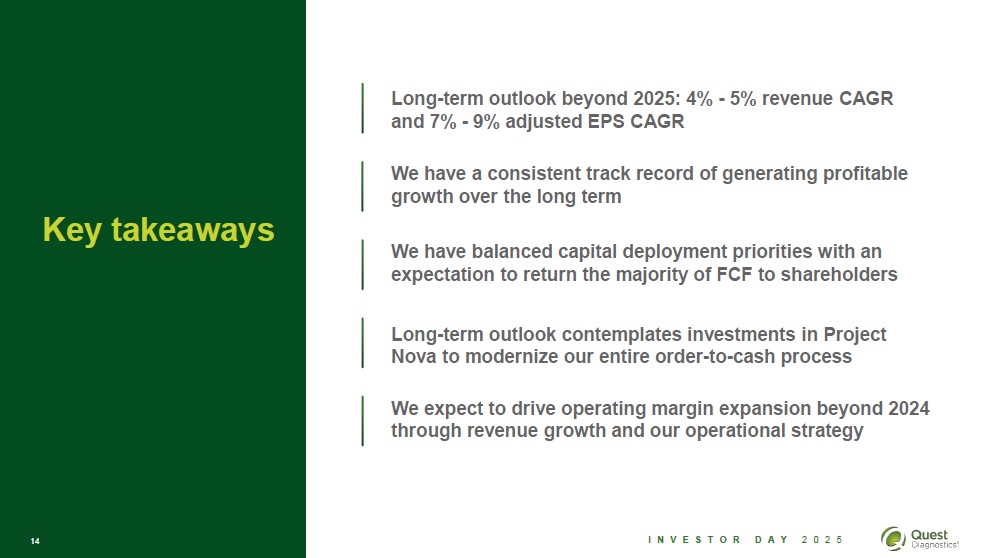
We have a consistent track record of generating profitable growth over the long term
We have balanced capital deployment priorities with an expectation to return the majority of FCF to shareholders
We expect to drive operating margin expansion beyond 2024 through revenue growth and our operational strategy
Long-term outlook beyond 2025: 4% - 5% revenue CAGR and 7% - 9% adjusted EPS CAGR
Long-term outlook contemplates investments in Project Nova to modernize our entire order-to-cash process
15 INVESTOR DAY 2025 Quest Diagnostics
Note on Non-GAAP Financial Measures
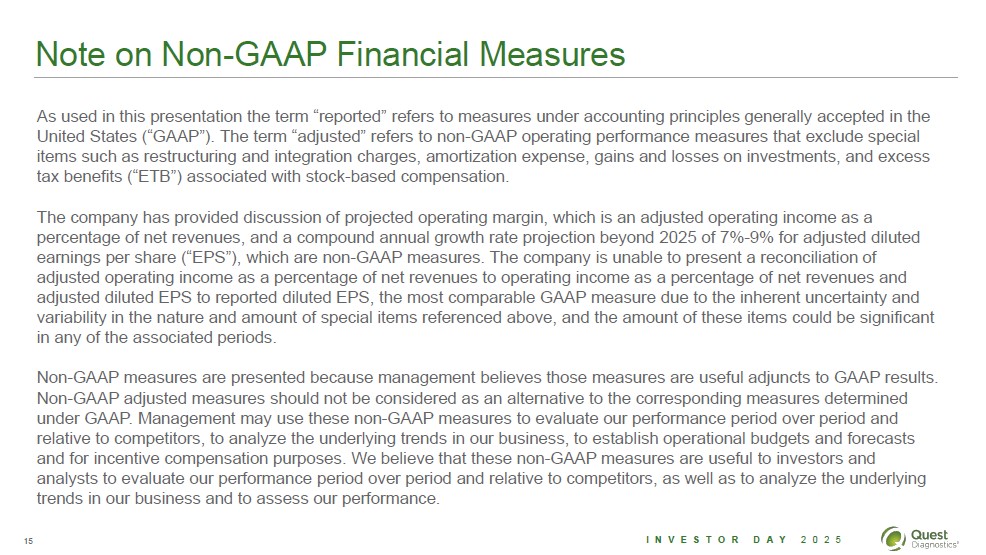
As used in this press release the term "reported" refers to measures under accounting principles generally accepted in the United States ("GAAP"). The term "adjusted" refers to non-GAAP operating performance measures that exclude special items such as restructuring and integration charges, amortization expense, gains and losses on investments, and excess tax benefits ("ETB") associated with stock-based compensation.
The company has provided discussion of projected operating margin, which is an
adjusted operating income as a percentage of net revenues, and a compound annual
growth rate projection beyond 2025 of 7%-9% for adjusted diluted earnings per
share ("EPS"), which are non-GAAP measures. The company is unable to present a
reconciliation of adjusted operating income as a percentage of net revenues to
operating income as a percentage of net revenues and adjusted diluted EPS to
reported diluted EPS, the most comparable GAAP measure due to the inherent
uncertainty and variability in the nature and amount of special items referenced
above, and the amount of these items could be significant in any of the
associated periods. The company has provided a compound annual growth rate projection beyond 2025 of 7%-9% for adjusted diluted earnings per share ("EPS"), which is a non-GAAP measure. The company is unable to present a reconciliation of adjusted diluted EPS to reported diluted EPS, the most comparable GAAP measure due to the inherent uncertainty and variability in the nature and amount of special items referenced above, and the amount of these items could be significant in any of the associated periods.
Non-GAAP adjusted measures are presented because management believes those measures are useful adjuncts to GAAP results. Non-GAAP adjusted measures should not be considered as an alternative to the corresponding measures determined under GAAP. Management may use these non-GAAP measures to evaluate our performance period over period and relative to competitors, to analyze the underlying trends in our business, to establish operational budgets and forecasts and for incentive compensation purposes. We believe that these non-GAAP measures are useful to investors and analysts to evaluate our performance period over period and relative to competitors, as well as to analyze the underlying trends in our business and to assess our performance.
16 INVESTOR DAY 2025 Quest Diagnostics
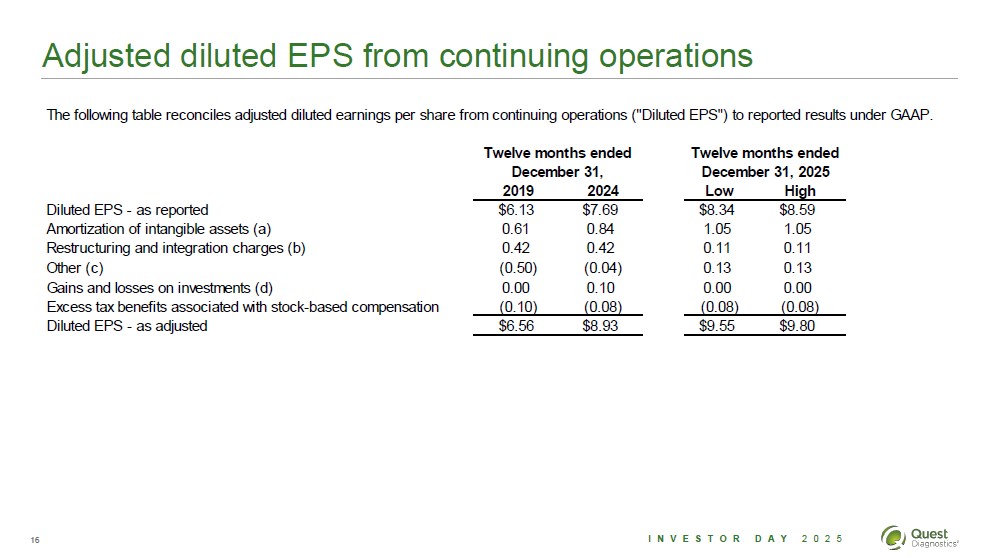
Adjusted diluted EPS from continuing operations
The following table reconciles adjusted diluted earnings per share from continuing operations ("Diluted EPS") to reported results under GAAP.
2019 2024 Low High
Diluted EPS - as reported $6.13 $7.69 $8.34 $8.59
Amortization of intangible assets (a) 0.61 0.84 1.05 1.05
Restructuring and integration charges (b) 0.42 0.42 0.11 0.11
Other (c) (0.50) (0.04) 0.13 0.13
Gains and losses on investments (d) 0.00 0.10 0.00 0.00
Excess tax benefits associated with stock-based compensation (0.10) (0.08) (0.08) (0.08)
Diluted EPS - as adjusted $6.56 $8.93 $9.55 $9.80
Twelve months ended December 31, 2025 Twelve months ended December 31,
17 INVESTOR DAY 2025 Quest Diagnostics
Adjusted diluted EPS from continuing operations
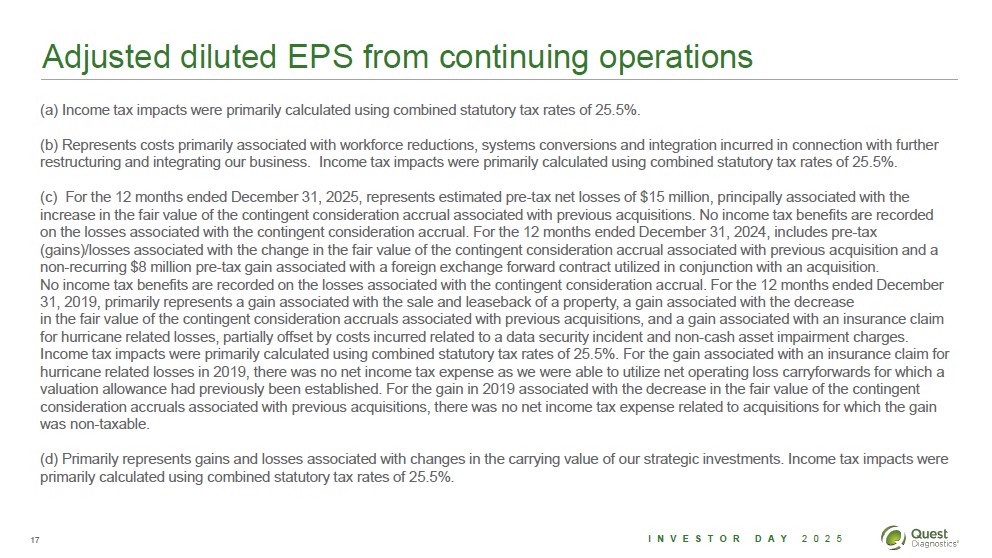
(a) Income tax impacts were primarily calculated using combined statutory tax rates of 25.5%.
(b) Represents costs primarily associated with workforce reductions, systems conversions and integration incurred in connection with further restructuring and integrating our business. Income tax impacts were primarily calculated using combined statutory tax rates of 25.5%.
(c) For the 12 months ended December 31, 2025, represents estimated pre-tax net losses of $15 million, principally associated with the increase in the fair value of the contingent consideration accrual associated with previous acquisitions. No income tax benefits are recorded on the losses associated with the contingent consideration accrual. For the 12 months ended December 31, 2024, includes pre-tax (gains)/losses associated with the change in the fair value of the contingent consideration accrual associated with previous acquisition and a non-recurring $8 million pre-tax gain associated with a foreign exchange forward contract utilized in conjunction with an acquisition. No income tax benefits are recorded on the losses associated with the contingent consideration accrual. For the 12 months ended December 31, 2019, primarily represents a gain associated with the sale and leaseback of a property, a gain associated with the decrease in the fair value of the contingent consideration accruals associated with previous acquisitions, and a gain associated with an insurance claim for hurricane related losses, partially offset by costs incurred related to a data security incident and non-cash asset impairment charges. Income tax impacts were primarily calculated using combined statutory tax rates of 25.5%. For the gain associated with an insurance claim for hurricane related losses in 2019, there was no net income tax expense as we were able to utilize net operating loss carryforwards for which a valuation allowance had previously been established. For the gain in 2019 associated with the decrease in the fair value of the contingent consideration accruals associated with previous acquisitions, there was no net income tax expense related to acquisitions for which the gain was non-taxable.
(d) Primarily represents gains and losses associated with changes in the carrying value of our strategic investments. Income tax impacts were primarily calculated using combined statutory tax rates of 25.5%.
Free cash flow
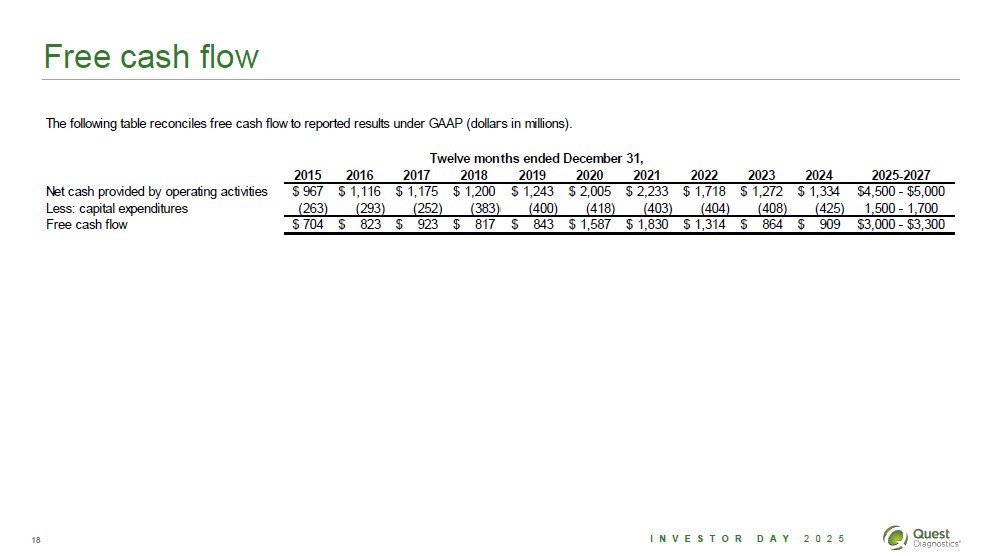
The following table reconciles free cash flow to reported results under GAAP (dollars in millions).
Net cash provided by operating activities
Less: capital expenditures
Free cash flow
Twelve months ended December 31,
2015 2016 2017 2018 2019 2020 2021 2022 2023 2024 2025-2027
$ 967 $ 1,116 $ 1,175 $ 1,200 $ 1,243 $ 2,233 $ 1,718 $ 1,272 $ 1,334 $4,500 - $5,000
(263) (293) (252) (383) (400) (418) (403) (404) (408) (425) 1,500 - 1,700
$ 704 $ 823 $ 923 $ 817 $ 843 $ 1,587 $ 1,830 $ 1,314 $ 864 $ 909 $3,000 - $3,300
18 INVESTOR DAY 2025 Quest Diagnostics