Delek US Holdings Reports First Quarter 2020 Results
| |
• | Reported first quarter net loss of $(314.4) million and Adjusted EBITDA of $(29.7) million |
| |
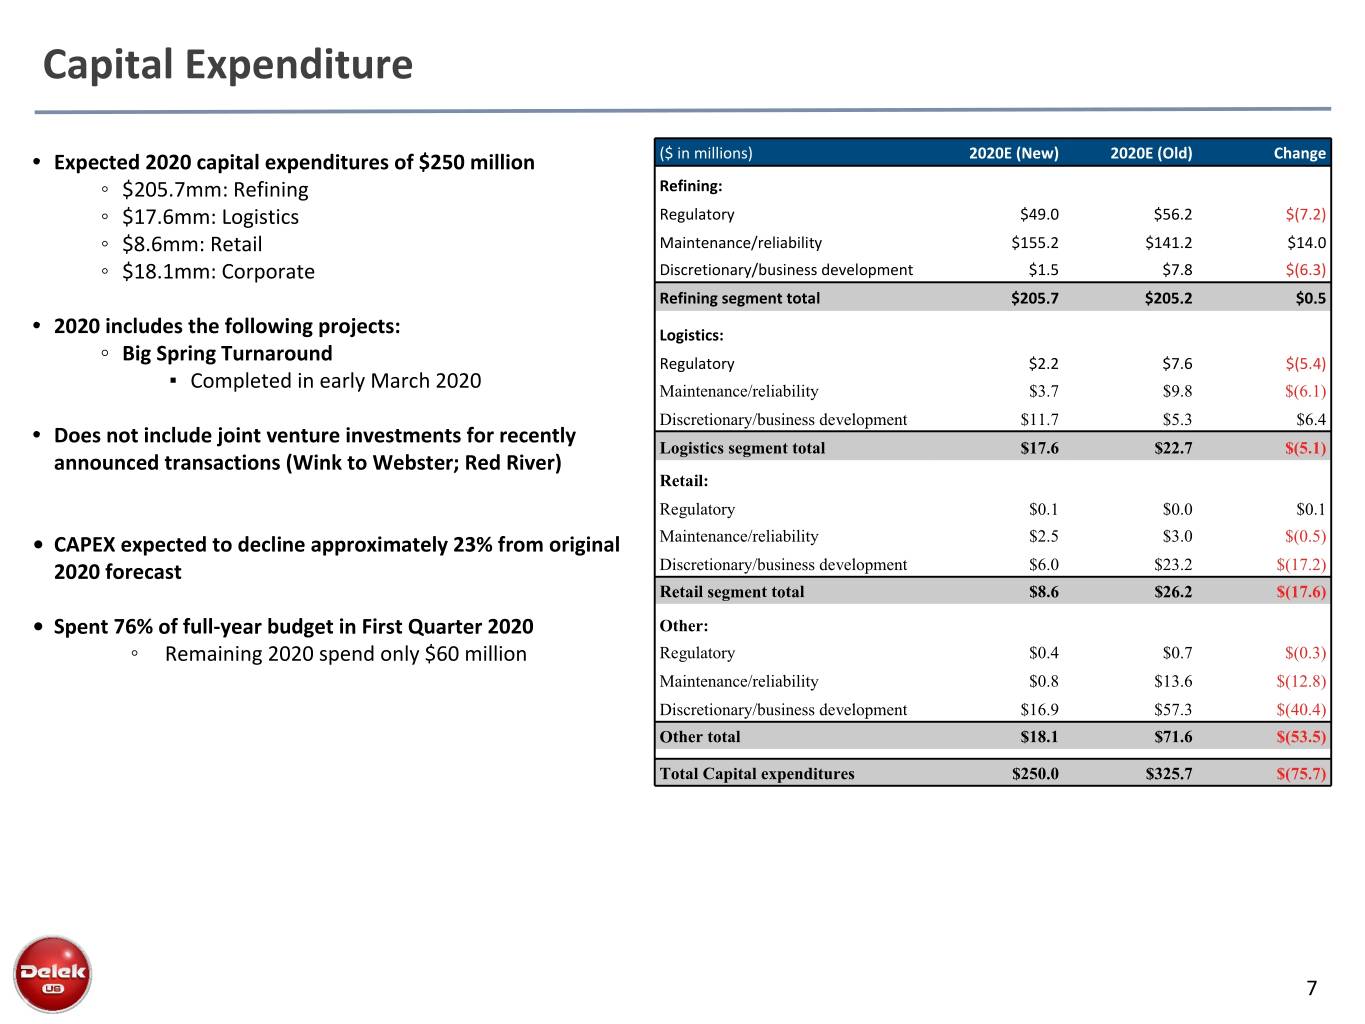
• | Reducing 2020 capital expenditures by approximately $75 million representing a 23% decrease |
| |
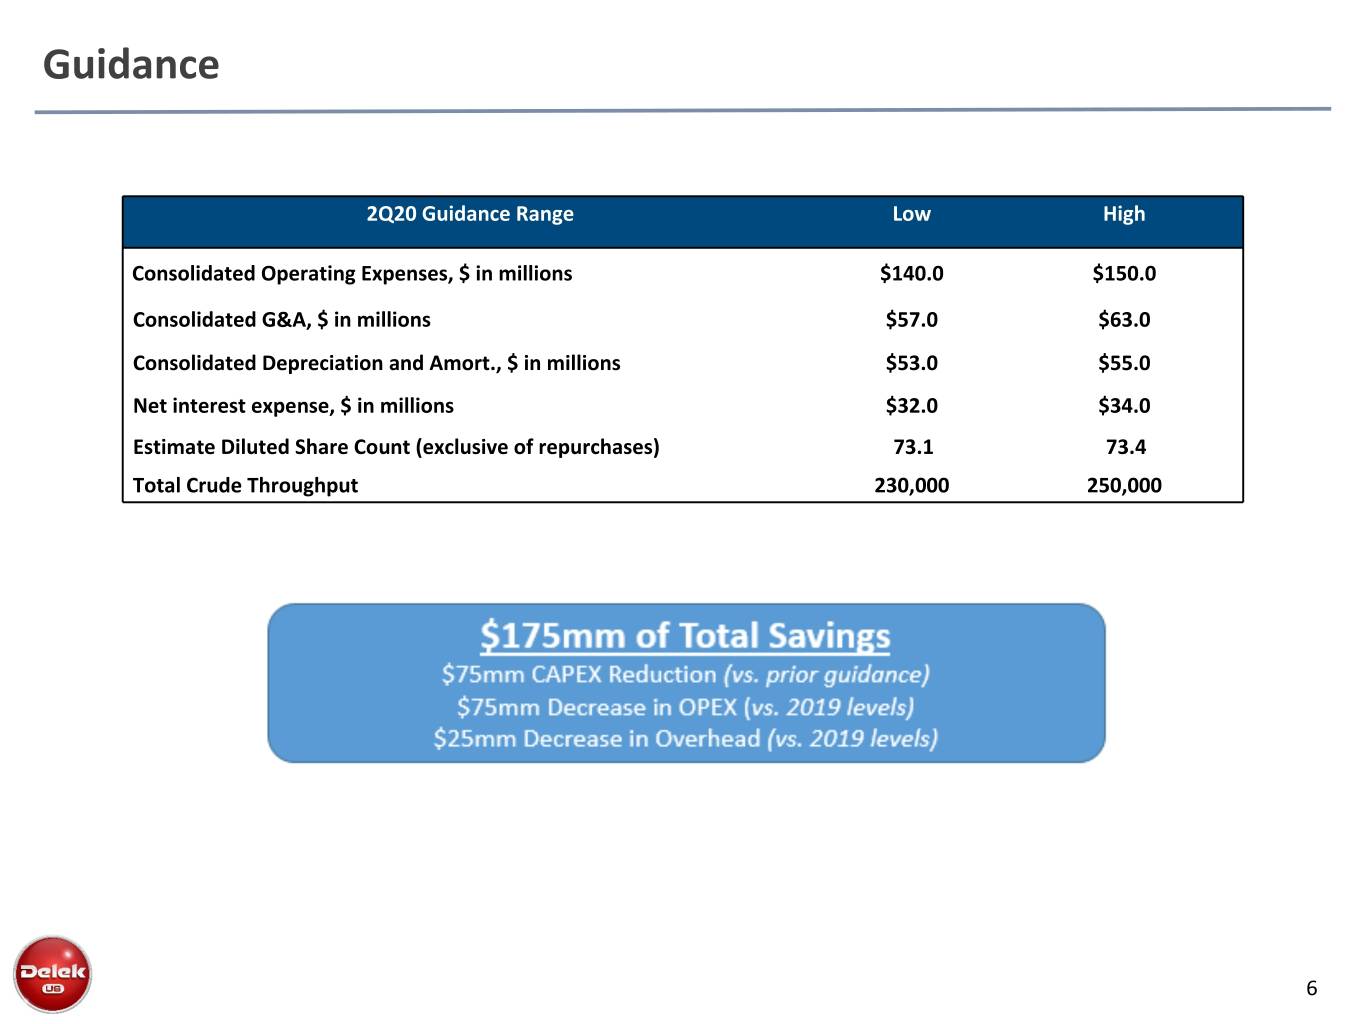
• | Improving cost structure with 10% reduction (~$100 million) in operating & overhead expenses 2020 vs. 2019 |
| |
• | Currently benefiting from steep crude contango, niche product markets and regional demand recovery |
| |
• | Expect refining throughput in 2Q20 to be approximately 80% utilization |
| |
• | Completed drop-down of Big Spring Gathering System to DKL increasing DK ownership of DKL to 71% |
| |
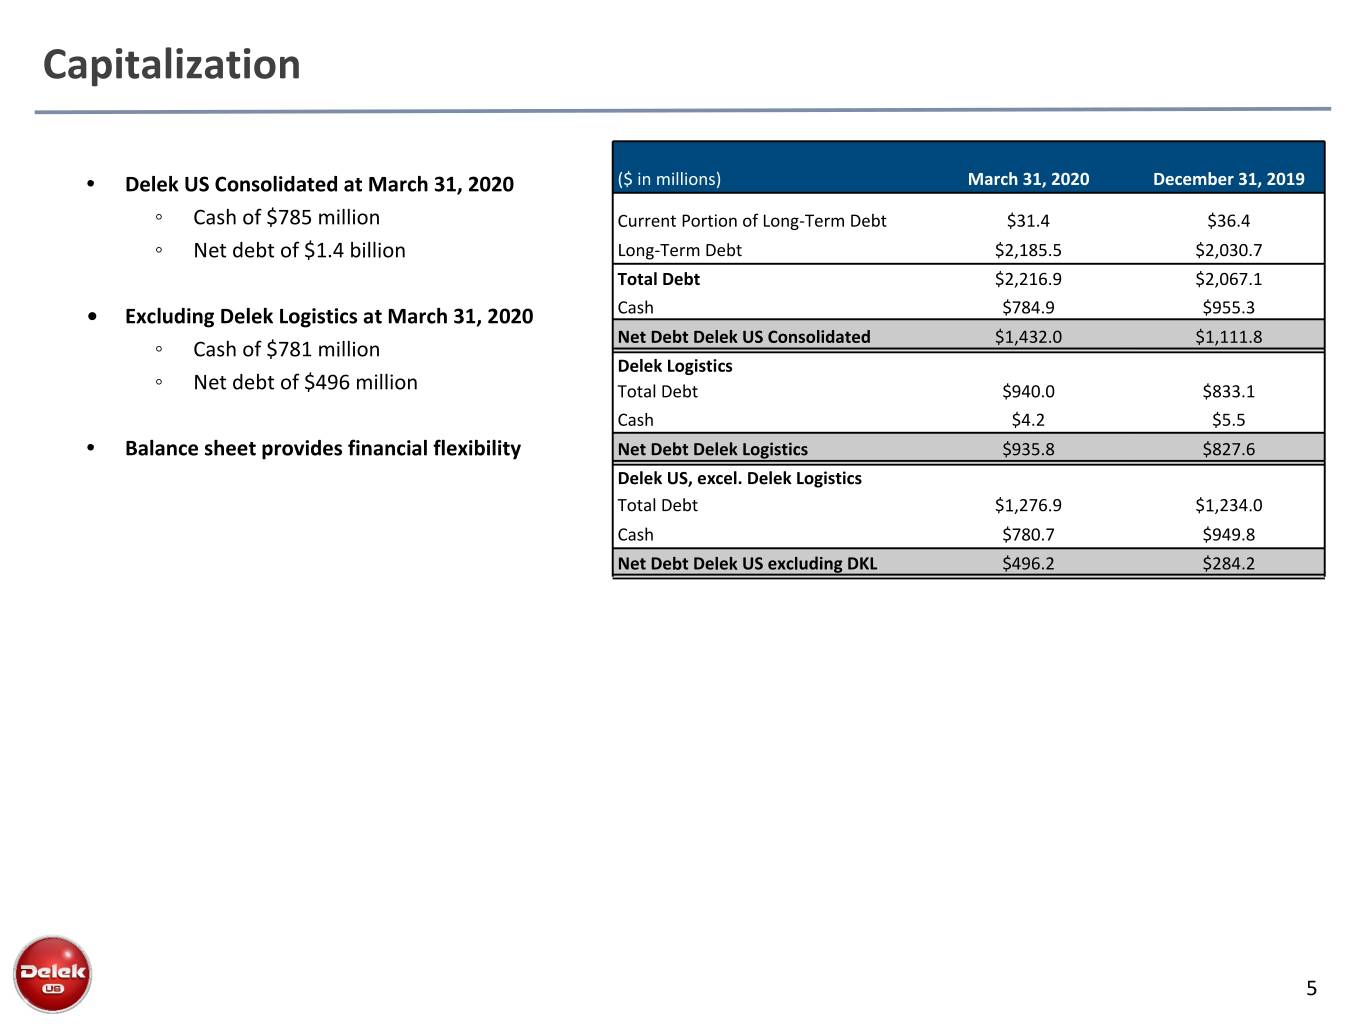
• | Maintain strong liquidity with $785 million of cash as of March 31, 2020 |
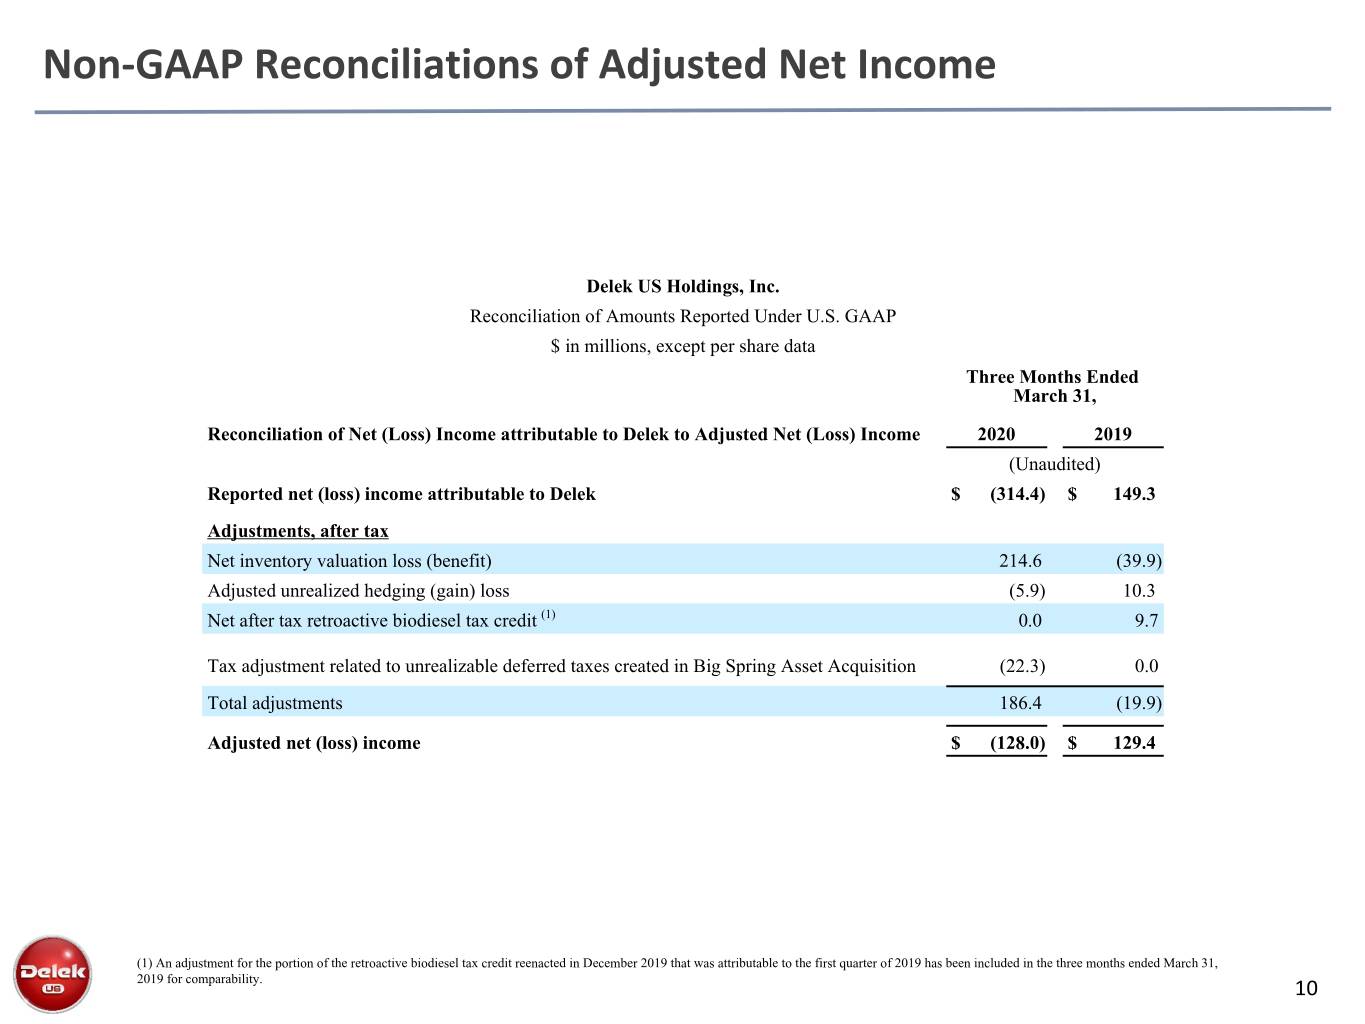
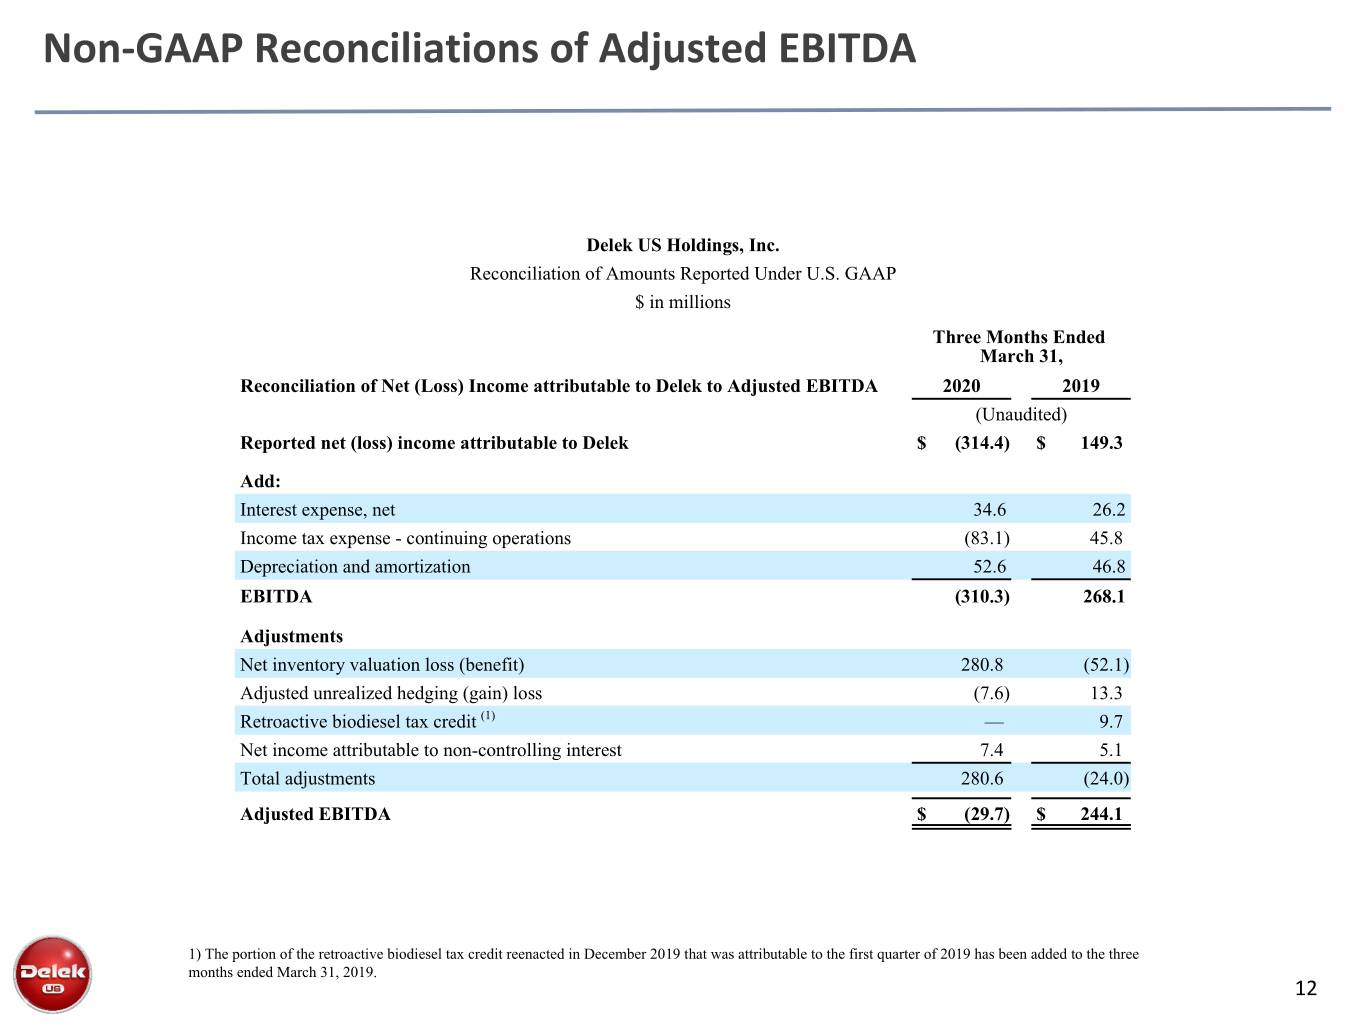
BRENTWOOD, Tenn.-- May 5, 2020 -- Delek US Holdings, Inc. (NYSE: DK) (“Delek US”) today announced financial results for its first quarter ended March 31, 2020. Delek US reported first quarter 2020 net loss of $(314.4) million, or $(4.28) per diluted share, versus a net income of $149.3 million, or $1.90 per diluted share, for the quarter ended March 31, 2019. On an adjusted basis, Delek US reported Adjusted net loss of $(128.0) million, or $(1.74) per share for the first quarter 2020. This compares to Adjusted net income of $129.4 million, or $1.64 per share, in the prior-year period. Adjusted earnings before interest, taxes, depreciation and amortization ("Adjusted EBITDA") was $(29.7) million compared to Adjusted EBITDA of $244.1 million in the prior-year period. Reconciliations of net income reported under U.S. GAAP to Adjusted net income and Adjusted EBITDA are included in the financial tables attached to this release.
Adjusted quarterly results include a negative after-tax impact of $(106.1) million or $(1.44) per share. This is comprised of an "other inventory" headwind in the amount of $(90.8) million pre-tax, or $(70.0) million after-tax, related to FIFO accounting. This inventory detriment was driven by the precipitous decline in commodity prices in the quarter, stemming from COVID-19 and excess global oil supply from OPEC+. Note, "other inventory" is separate from LCM inventory impacts that are excluded from adjusted results. Additionally, adjusted results include a $(36.1) million elevated tax headwind resulting from applying the annual estimated effective tax rate to quarterly results.
Uzi Yemin, Chairman, President and Chief Executive Officer of Delek US, stated, "COVID-19 is having a meaningful impact on near-term demand trends within our industry. That said, we have taken steps to maintain safe and reliable operations and continue supporting the communities that we serve. In an effort to adjust to the prevailing environment, we are reducing capital spending by approximately $75 million or 23% from previous 2020 guidance of $325 million. Separately, we expect to reduce our overall cost structure by roughly $100 million or 10% versus 2019 levels. This is driven through ongoing optimization of operating costs and implementation of a hiring freeze to minimize overhead.
Despite enormous macro volatility, we have seen bright spots in the second quarter with the crude curve moving into steep contango. Additionally, our niche product markets tend to be more resilient during a downturn and the regions where we conduct business appear to be on-pace for re-opening from COVID-19. The combination of these factors should allow us to run at refinery utilization rates above the industry average in the second quarter."
Mr. Yemin continued, "On March 31st, Delek US sold the Big Spring Gathering assets to Delek Logistics through a combination of cash and equity. This increased DK’s ownership of DKL to approximately 71%, including the GP interest. Finally, our balance sheet remains strong with $785 million of cash as of March 31st."
Regular Quarterly Dividend
Delek US announced today its Board of Directors declared a regular quarterly cash dividend of $0.31 per share. Shareholders of record on May 20, 2020 will receive this cash dividend payable on June 3, 2020.
Liquidity
As of March 31, 2020, Delek US had a cash balance of $784.9 million and total consolidated long-term debt of $2,216.9 million, resulting in net debt of $1,432.0 million. As of March 31, 2020, Delek Logistics Partners, LP (NYSE: DKL) ("Delek Logistics") had $940.0 million of total debt and $4.2 million of cash, which is included in the consolidated amounts on Delek US' balance sheet. Excluding Delek Logistics, Delek US had approximately $780.7 million in cash and $1,276.9 million of debt, or a $496.2 million net debt position.
Refining Segment
Refining contribution margin decreased to $(290.4) million in the first quarter 2020 from $301.9 million in the first quarter 2019. On a year-over-year basis, results were reduced primarily by inventory impacts due to the precipitous commodity price decline that occurred in March of 2020. The total inventory charge was $360.1 million in first quarter 2020 compared to a benefit of $129.9 million in first quarter 2019. Of this amount there was $277.8 million lower of cost or market ("LCM") valuation charge from product and crude oil prices in the first quarter 2020. This compares to a LCM valuation benefit of $52.2 million in the prior year period. Separate from LCM, there was a negative impact from "other inventory" in the amount of $79.2 million pre-tax, driven by FIFO accounting and the drop in commodity prices. Additional drivers were a lower crude oil differential and crack spread environment, coupled with reduced operating performance at the Big Spring refinery due to the major turnaround. Further, during the first quarter 2020, the realized Midland-Cushing crude oil premium was $0.79 per barrel compared to a realized discount of $4.26 per barrel in the prior year period.
Logistics Segment
The logistics segment contribution margin in the first quarter 2020 was $47.3 million compared to $40.1 million in the first quarter 2019. Results improved on a year-over-year basis primarily due to a $3.6 million increase to income from equity method investments, as well as increased contributions from the Paline Pipeline, the Lion Pipeline System and the Gathering Assets. This was partially offset by lower West Texas gross margin on a year-over-year basis.
Retail Segment
For the first quarter 2020, contribution margin was $12.3 million compared to $10.2 million in the prior year period for the retail segment. Merchandise sales were approximately $71.7 million with an average retail margin of 31.6% in the first quarter 2020, compared to merchandise sales of approximately $75.3 million with an average retail margin of 31.0% in the prior-year period. Approximately 48.0 million retail fuel gallons were sold at an average margin of $0.31 per gallon in the first quarter 2020 compared to 53.9 million retail fuel gallons sold at an average margin of $0.19 per gallon in the first quarter 2019. In the first quarter 2020, the average merchandise store count was 253 compared to 281 in the prior year period. On a same store sales basis in the first quarter 2020, merchandise sales increased 1.7% and fuel gallons sold decreased 8.2% compared to the prior-year period.
Corporate/Other
Contribution margin from Corporate/Other was a loss of $13.1 million in the first quarter 2020 compared to a loss of $18.4 million in the prior-year period. Note, hedging gains (losses) related to the refining segment have been reclassified from the corporate and other segment to the refining segment in the first quarter of 2020 and have been retrospectively reclassified in the first quarter of 2019 for comparison purposes.
First Quarter 2020 Results | Conference Call Information
Delek US will hold a conference call to discuss its first quarter 2020 results on Wednesday, May 6, 2020 at 8:30 a.m. Central Time. Investors will have the opportunity to listen to the conference call live by going to www.DelekUS.com and clicking on the Investor Relations tab. Participants are encouraged to register at least 15 minutes early to download and install any necessary software. Presentation materials accompanying the call will be available on the investor relations tab of the Delek US website approximately five minutes prior to the start of the call. For those who cannot listen to the live broadcast, the online replay will be available on the website for 90 days.
Investors may also wish to listen to Delek Logistics’ (NYSE: DKL) first quarter 2020 earnings conference call that will be held on Wednesday, May 6, 2020 at 7:30 a.m. Central Time and review Delek Logistics’ earnings press release. Market trends and information disclosed by Delek Logistics may be relevant to the logistics segment reported by Delek US. Both a replay of the conference call and press release for Delek Logistics are available online at www.deleklogistics.com.
About Delek US Holdings, Inc.
Delek US Holdings, Inc. is a diversified downstream energy company with assets in petroleum refining, logistics, renewable fuels and convenience store retailing. The refining assets consist of refineries operated in Tyler and Big Spring, Texas, El Dorado, Arkansas and Krotz Springs, Louisiana with a combined nameplate crude throughput capacity of 302,000 barrels per day.
The logistics operations primarily consist of Delek Logistics Partners, LP (NYSE: DKL). Delek US Holdings, Inc. and its affiliates own approximately 71% (including the 2% general partner interest) of Delek Logistics Partners, LP. Delek Logistics Partners, LP is a growth-oriented master limited partnership focused on owning and operating midstream energy infrastructure assets.
The convenience store retail operates approximately 253 convenience stores in central and west Texas and New Mexico.
Safe Harbor Provisions Regarding Forward-Looking Statements
This press release contains forward-looking statements that are based upon current expectations and involve a number of risks and uncertainties. Statements concerning current estimates, expectations and projections about future results, performance, prospects, opportunities, plans, actions and events and other statements, concerns, or matters that are not historical facts are “forward-looking statements,” as that term is defined under the federal securities laws. These statements contain words such as “possible,” “believe,” “should,” “could,” “would,” “predict,” “plan,” “estimate,” “intend,” “may,” “anticipate,” “will,” “if", “potential,” “expect” or similar expressions, as well as statements in the future tense. These forward-looking statements include, but are not limited to, statements regarding throughput at the Company’s refineries; crude oil prices, discounts and quality and our ability to benefit therefrom; share repurchases; returning cash to shareholders; payments of dividends; growth; investments into our business; the performance and execution of our midstream growth initiatives, including the Big Spring Gathering System, the Red River joint venture and the Wink to Webster long-haul crude oil pipeline, and the flexibility, benefits and the expected returns therefrom; RINs waivers and tax credits and the value and benefit therefrom; cash and liquidity; opportunities and anticipated performance and financial position.
Investors are cautioned that the following important factors, among others, may affect these forward-looking statements. These factors include, but are not limited to: uncertainty related to timing and amount of future share repurchases and dividend payments; risks and uncertainties with respect to the quantities and costs of crude oil we are able to obtain and the price of the refined petroleum products we ultimately sell; including uncertainties regarding future decisions by OPEC regarding production and pricing disputes between OPEC members and Russia; uncertainty relating to the impact of the COVID-19 outbreak on the demand for crude oil, refined products and transportation and storage services; risks related to Delek US’ exposure to Permian Basin crude oil, such as supply, pricing, gathering, production and transportation capacity; gains and losses from derivative instruments; management's ability to execute its strategy of growth, including risks associated with acquisitions and dispositions; acquired assets may suffer a diminishment in fair value as a result of which we may need to record a write-down or impairment in carrying value of the asset; the possibility of litigation challenging renewable fuel standard waivers;changes in the scope, costs, and/or timing of capital and maintenance projects; the ability to grow the Big Spring Gathering System; the ability of the Red River joint venture to complete the expansion project to increase the Red River pipeline capacity; the ability of the joint venture to construct the Wink to Webster long haul crude oil pipeline; operating hazards inherent in transporting, storing and processing crude oil and intermediate and finished petroleum products; our competitive position and the effects of competition; the projected growth of the industries in which we operate; general economic and business conditions affecting the geographic areas in which we operate; and other risks described in Delek US’ filings with the United States Securities and Exchange Commission (the “SEC”), including risks disclosed in our Annual Report on Form 10-K, Quarterly Reports on Form 10-Q and other filings and reports with the SEC.
Forward-looking statements should not be read as a guarantee of future performance or results and will not be accurate indications of the times at, or by, which such performance or results will be achieved. Forward-looking information is based on information available at the time and/or management's good faith belief with respect to future events, and is subject to risks and uncertainties that could cause actual performance or results to differ materially from those expressed in the statements. Delek US undertakes no obligation to update or revise any such forward-looking statements to reflect events or circumstances that occur, or which Delek US becomes aware of, after the date hereof, except as required by applicable law or regulation.
Non-GAAP Disclosures:
Our management uses certain “non-GAAP” operational measures to evaluate our operating segment performance and non-GAAP financial measures to evaluate past performance and prospects for the future to supplement our GAAP financial information presented in accordance with U.S. GAAP. These financial and operational non-GAAP measures are important factors in assessing our operating results and profitability and include:
| |
• | Adjusted net income (loss) - calculated as net income attributable to Delek US adjusted for certain identified infrequently occurring items, non-cash items and items that are not attributable to our on-going operations (collectively, "Adjusting Items") recorded during the period; |
| |
• | Adjusted unrealized hedging (gains) losses - calculated as GAAP unrealized (gains) losses on commodity derivatives that are economic hedges but not designated as hedging instruments adjusted to exclude unrealized (gains) losses where the instrument has matured but where it has not cash settled as of the balance sheet date. This adjustment more appropriately aligns matured commodity derivatives gains and losses with the recognition of the related cost of materials and other. There are no premiums paid or received at the inception of the derivative contracts, and upon settlement there is no cost recovery associated with these contracts; |
| |
• | Adjusted net income (loss) per share - calculated as Adjusted net income (loss) divided by weighted average shares outstanding, assuming dilution, as adjusted for any anti-dilutive instruments that may not be permitted for consideration in GAAP earnings per share calculations but that nonetheless favorably impact dilution; |
| |
• | Earnings before interest, taxes, depreciation and amortization ("EBITDA") - calculated as net income attributable to Delek adjusted to add back interest expense, income tax expense, depreciation and amortization; |
| |
• | Adjusted EBITDA - calculated as EBITDA adjusted for the identified adjusting items in Adjusted net income (loss) that do not relate to interest expense, income tax expense, depreciation or amortization, and adjusted to include income (loss) attributable to non-controlling interests; |
| |
• | Refining margin - calculated as the difference between total refining revenues and total cost of materials and other; |
| |
• | Adjusted refining margin -- calculated as refining margin adjusted for certain identified infrequently occurring items, non-cash items and items that are not attributable to our on-going refining operations recorded during the period; |
| |
• | Refining margin per sales barrel - calculated as refining margin divided by our average refining sales in barrels per day (excluding purchased barrels) multiplied by 1,000 and multiplied by the number of days in the period; and |
| |
• | Adjusted refining margin per sales barrel - calculated as adjusted refining margin divided by our average refining sales in barrels per day (excluding purchased barrels) multiplied by 1,000 and multiplied by the number of days in the period; |
We believe these non-GAAP operational and financial measures are useful to investors, lenders, ratings agencies and analysts to assess our ongoing performance because, when reconciled to their most comparable GAAP financial measure, they provide improved comparability between periods through the exclusion of certain items that we believe are not indicative of our core operating performance and that may obscure our underlying results and trends.
Non-GAAP measures have important limitations as analytical tools, because they exclude some, but not all, items that affect net earnings and operating income. These measures should not be considered substitutes for their most directly comparable U.S. GAAP financial measures. Additionally, because Adjusted net income or loss, Adjusted net income or loss per share, EBITDA and adjusted EBITDA or any of our other identified non-GAAP measures may be defined differently by other companies in its industry, Delek US' definition may not be comparable to similarly titled measures of other companies. See the accompanying tables in this earnings release for a reconciliation of these non-GAAP measures to the most directly comparable GAAP measures.
|
| | | | | | | | |
Delek US Holdings, Inc. |
Condensed Consolidated Balance Sheets (Unaudited) |
(In millions, except share and per share data) |
| | March 31,
2020 | | December 31,
2019 |
ASSETS | | | | |
Current assets: | | | | |
Cash and cash equivalents | | $ | 784.9 |
| | $ | 955.3 |
|
Accounts receivable, net | | 436.0 |
| | 792.6 |
|
Inventories, net of inventory valuation reserves | | 473.1 |
| | 946.7 |
|
Other current assets | | 262.1 |
| | 268.7 |
|
Total current assets | | 1,956.1 |
| | 2,963.3 |
|
Property, plant and equipment: | | |
| | |
|
Property, plant and equipment | | 3,539.8 |
| | 3,362.8 |
|
Less: accumulated depreciation | | (975.4 | ) | | (934.5 | ) |
Property, plant and equipment, net | | 2,564.4 |
| | 2,428.3 |
|
Operating lease right-of-use assets | | 177.1 |
| | 183.6 |
|
Goodwill | | 855.7 |
| | 855.7 |
|
Other intangibles, net | | 111.5 |
| | 110.3 |
|
Equity method investments | | 365.2 |
| | 407.3 |
|
Other non-current assets | | 63.4 |
| | 67.8 |
|
Total assets | | $ | 6,093.4 |
| | $ | 7,016.3 |
|
| | | | |
LIABILITIES AND STOCKHOLDERS’ EQUITY | | |
| | |
|
Current liabilities: | | |
| | |
|
Accounts payable | | $ | 1,102.3 |
| | $ | 1,599.7 |
|
Current portion of long-term debt | | 31.4 |
| | 36.4 |
|
Obligation under Supply and Offtake Agreements | | 97.9 |
| | 332.5 |
|
Current portion of operating lease liabilities | | 40.6 |
| | 40.5 |
|
Accrued expenses and other current liabilities | | 354.7 |
| | 346.8 |
|
Total current liabilities | | 1,626.9 |
| | 2,355.9 |
|
Non-current liabilities: | | |
| | |
|
Long-term debt, net of current portion | | 2,185.5 |
| | 2,030.7 |
|
Obligation under Supply and Offtake Agreements | | 179.5 |
| | 144.8 |
|
Environmental liabilities, net of current portion | | 136.3 |
| | 137.9 |
|
Asset retirement obligations | | 67.1 |
| | 68.6 |
|
Deferred tax liabilities | | 242.2 |
| | 267.9 |
|
Operating lease liabilities, net of current portion | | 137.3 |
| | 144.3 |
|
Other non-current liabilities | | 28.7 |
| | 30.9 |
|
Total non-current liabilities | | 2,976.6 |
| | 2,825.1 |
|
Stockholders’ equity: | | |
| | |
|
Preferred stock, $0.01 par value, 11,000,000 shares and 10,000,000 shares authorized at March 31,2020 and December 31, 2020, respectively, no shares issued and outstanding | | — |
| | — |
|
Common stock, $0.01 par value, 110,000,000 shares authorized, 91,089,920 shares and 90,987,025 shares issued at March 31, 2020 and December 31, 2019, respectively | | 0.9 |
| | 0.9 |
|
Additional paid-in capital | | 1,157.4 |
| | 1,151.9 |
|
Accumulated other comprehensive income | | 1.2 |
| | 0.1 |
|
Treasury stock, 17,575,527 shares and 17,516,814 shares, at cost, as of March 31, 2020 and December 31, 2019, respectively | | (694.1 | ) | | (692.2 | ) |
Retained earnings | | 861.6 |
| | 1,205.6 |
|
Non-controlling interests in subsidiaries | | 162.9 |
| | 169.0 |
|
Total stockholders’ equity | | 1,489.9 |
| | 1,835.3 |
|
Total liabilities and stockholders’ equity | | $ | 6,093.4 |
| | $ | 7,016.3 |
|
|
| | | | | | | | |
Delek US Holdings, Inc. |
Condensed Consolidated Statements of Income (Unaudited) (1) |
(In millions, except share and per share data) |
| | Three Months Ended March 31, |
| | 2020 | | 2019 |
| | | | |
Net revenues | | $ | 1,821.2 |
| | $ | 2,199.9 |
|
Cost of sales: | | | | |
Cost of materials and other | | 1,910.6 |
| | 1,699.4 |
|
Operating expenses (excluding depreciation and amortization presented below) | | 129.2 |
| | 140.9 |
|
Depreciation and amortization | | 47.0 |
| | 39.3 |
|
Total cost of sales | | 2,086.8 |
| | 1,879.6 |
|
Operating expenses related to retail and wholesale business (excluding depreciation and amortization presented below) | | 25.3 |
| | 25.8 |
|
General and administrative expenses | | 65.7 |
| | 62.2 |
|
Depreciation and amortization | | 5.6 |
| | 7.5 |
|
Other operating (income) expense, net | | (0.7 | ) | | 2.4 |
|
Total operating costs and expenses | | 2,182.7 |
| | 1,977.5 |
|
Operating (loss) income | | (361.5 | ) | | 222.4 |
|
Interest expense | | 36.3 |
| | 28.7 |
|
Interest income | | (1.7 | ) | | (2.5 | ) |
Income from equity method investments | | (5.1 | ) | | (2.6 | ) |
Other income, net | | (0.9 | ) | | (1.4 | ) |
Total non-operating expenses, net | | 28.6 |
| | 22.2 |
|
(Loss) income before income tax (benefit) expense | | (390.1 | ) | | 200.2 |
|
Income tax (benefit) expense | | (83.1 | ) | | 45.8 |
|
Net (loss) income | | (307.0 | ) | | 154.4 |
|
Net income attributed to non-controlling interests | | 7.4 |
| | 5.1 |
|
Net (loss) income attributable to Delek | | $ | (314.4 | ) | | $ | 149.3 |
|
| | | | |
Basic (loss) income per share | | $ | (4.28 | ) | | $ | 1.92 |
|
Diluted (loss) income per share | | $ | (4.28 | ) | | $ | 1.90 |
|
Weighted average common shares outstanding: | | | | |
Basic | | 73,437,730 |
| | 77,793,278 |
|
Diluted | | 73,437,730 |
| | 78,446,690 |
|
Dividends declared per common share outstanding | | $ | 0.31 |
| | $ | 0.27 |
|
|
| | | | | | | |
Delek US Holdings, Inc. |
Condensed Cash Flow Data (Unaudited) |
(In millions) |
| Three Months Ended March 31, |
| 2020 | | 2019 |
Cash flows from operating activities: | | | |
Net cash (used in) provided by operating activities | $ | (154.1 | ) | | $ | 133.4 |
|
Cash flows from investing activities: | | | |
Net cash used in investing activities | (146.6 | ) | | (127.0 | ) |
Cash flows from financing activities: | | | |
Net cash provided by (used in) financing activities | 130.3 |
| | (96.0 | ) |
Net decrease in cash and cash equivalents | (170.4 | ) | | (89.6 | ) |
Cash and cash equivalents at the beginning of the period | 955.3 |
| | 1,079.3 |
|
Cash and cash equivalents of continuing operations at the end of the period | $ | 784.9 |
| | $ | 989.7 |
|
|
| | | | | | | | | | | | | | | | | | | | |
Delek US Holdings, Inc. | | | | | | | | | | |
Segment Data (Unaudited) | | | | | | | | | | |
(In millions) | | | | | | | | | | |
| | Three Months Ended March 31, 2020 |
| | Refining | | Logistics | | Retail | | Corporate,
Other and Eliminations | | Consolidated |
Net revenues (excluding inter-segment fees and revenues) | | $ | 1,569.3 |
| | $ | 56.8 |
| | $ | 178.6 |
| | $ | 16.5 |
| | $ | 1,821.2 |
|
Inter-segment fees and revenues | | 158.6 |
| | 106.6 |
| | — |
| | (265.2 | ) | | — |
|
Operating costs and expenses: | | | | | | | | | | — |
|
Cost of materials and other | | 1,906.6 |
| | 101.3 |
| | 144.1 |
| | (241.4 | ) | | 1,910.6 |
|
Operating expenses (excluding depreciation and amortization presented below) | | 111.7 |
| | 14.8 |
| | 22.2 |
| | 5.8 |
| | 154.5 |
|
Segment contribution margin | | $ | (290.4 | ) | | $ | 47.3 |
| | $ | 12.3 |
| | $ | (13.1 | ) | | $ | (243.9 | ) |
Depreciation and amortization | | 37.2 |
| | 6.3 |
| | 2.9 |
| | 6.2 |
| | 52.6 |
|
General and administrative expenses | | | | | | | | | | 65.7 |
|
Other operating income, net | | | | | | | | | | (0.7 | ) |
Operating loss | | | | | | | | | | $ | (361.5 | ) |
Capital spending (excluding business combinations) | | $ | 168.1 |
| | $ | 3.0 |
| | $ | 6.2 |
| | $ | 12.9 |
| | $ | 190.2 |
|
|
| | | | | | | | | | | | | | | | | | | | |
| | Three Months Ended March 31, 2019 |
| | Refining (1) | | Logistics | | Retail | | Corporate,
Other and Eliminations (1) | | Consolidated |
Net revenues (excluding intercompany fees and sales) | | $ | 1,907.4 |
| | $ | 89.6 |
| | $ | 197.2 |
| | $ | 5.7 |
| | $ | 2,199.9 |
|
Intercompany fees and sales | | 184.6 |
| | 62.9 |
| | — |
| | (247.5 | ) | | — |
|
Operating costs and expenses: | | | | | | | | | | |
Cost of materials and other | | 1,669.1 |
| | 96.3 |
| | 163.4 |
| | (229.4 | ) | | 1,699.4 |
|
Operating expenses (excluding depreciation and amortization presented below) | | 121.0 |
| | 16.1 |
| | 23.6 |
| | 6.0 |
| | 166.7 |
|
Segment contribution margin | | $ | 301.9 |
| | $ | 40.1 |
| | $ | 10.2 |
| | $ | (18.4 | ) | | $ | 333.8 |
|
Depreciation and amortization | | 31.1 |
| | 6.5 |
| | 4.3 |
| | 4.9 |
| | 46.8 |
|
General and administrative expenses | | | | | | | | | | 62.2 |
|
Other operating expense, net | | | | | | | | | | 2.4 |
|
Operating income | | | | | | | | | | $ | 222.4 |
|
Capital spending (excluding business combinations) | | $ | 81.7 |
| | $ | 0.9 |
| | $ | 5.1 |
| | $ | 40.7 |
| | $ | 128.4 |
|
| |
(1) | The refining segment results of operations for the three months ended March 31, 2019, includes a component of cost of materials and other related to hedging activity of $7.6 million gain which was previously included and reported in corporate, other and eliminations. |
|
| | | | | | | | |
Refining Segment | | Three Months Ended March 31, |
| | 2020 | | 2019 |
Tyler, TX Refinery | | (Unaudited) |
Days in period | | 91 |
| | 90 |
|
Total sales volume - refined product (average barrels per day)(1) | | 74,981 |
| | 70,028 |
|
Products manufactured (average barrels per day): | | | | |
Gasoline | | 40,041 |
| | 39,341 |
|
Diesel/Jet | | 27,403 |
| | 27,383 |
|
Petrochemicals, LPG, NGLs | | 1,992 |
| | 2,056 |
|
Other | | 1,242 |
| | 1,166 |
|
Total production | | 70,678 |
| | 69,946 |
|
Throughput (average barrels per day): | | | | |
Crude oil | | 65,966 |
| | 64,479 |
|
Other feedstocks | | 5,741 |
| | 6,471 |
|
Total throughput | | 71,707 |
| | 70,950 |
|
Per barrel of refined product sales: | | | | |
Tyler refining margin | | $ | (21.51 | ) | | $ | 22.26 |
|
Tyler adjusted refining margin | | $ | 0.24 |
| | $ | 16.22 |
|
Operating expenses | | $ | 3.73 |
| | $ | 4.70 |
|
Crude Slate: (% based on amount received in period) | | | | |
WTI crude oil | | 92.6 | % | | 89.6 | % |
East Texas crude oil | | 7.4 | % | | 9.1 | % |
Other | | — | % | | 1.3 | % |
| | | | |
El Dorado, AR Refinery | | | | |
Days in period | | 91 |
| | 90 |
|
Total sales volume - refined product (average barrels per day)(1) | | 77,551 |
| | 52,440 |
|
Products manufactured (average barrels per day): | | | | |
Gasoline | | 36,407 |
| | 20,490 |
|
Diesel | | 27,637 |
| | 15,451 |
|
Petrochemicals, LPG, NGLs | | 2,061 |
| | 806 |
|
Asphalt | | 6,641 |
| | 4,825 |
|
Other | | 972 |
| | 639 |
|
Total production | | 73,718 |
| | 42,211 |
|
Throughput (average barrels per day): | | |
| | |
|
Crude oil | | 71,621 |
| | 41,112 |
|
Other feedstocks | | 2,643 |
| | 2,192 |
|
Total throughput | | 74,264 |
| | 43,304 |
|
Per barrel of refined product sales: | | |
| | |
|
El Dorado refining margin | | $ | (8.45 | ) | | $ | 13.45 |
|
El Dorado adjusted refining margin | | $ | (1.23 | ) | | 12.67 |
|
Operating expenses | | $ | 4.42 |
| | $ | 6.69 |
|
Crude Slate: (% based on amount received in period) | | | | |
WTI crude oil | | 34.4 | % | | 41.3 | % |
Local Arkansas crude oil | | 19.2 | % | | 27.7 | % |
Other | | 46.4 | % | | 31.0 | % |
|
| | | | | | | | |
Refining Segment | | Three Months Ended March 31, |
| | 2020 | | 2019 |
Big Spring, TX Refinery | | (Unaudited) |
Days in period - based on date acquired | | 91 |
| | 90 |
|
Total sales volume - refined product (average barrels per day) (1) | | 38,086 |
| | 81,849 |
|
Products manufactured (average barrels per day): | | | | |
Gasoline | | 14,607 |
| | 38,900 |
|
Diesel/Jet | | 9,796 |
| | 28,359 |
|
Petrochemicals, LPG, NGLs | | 1,381 |
| | 3,848 |
|
Asphalt | | 850 |
| | 1,512 |
|
Other | | 480 |
| | 1,237 |
|
Total production | | 27,114 |
| | 73,856 |
|
Throughput (average barrels per day): | | | | |
Crude oil | | 29,905 |
| | 72,329 |
|
Other feedstocks | | (1,327 | ) | | 1,890 |
|
Total throughput | | 28,578 |
| | 74,219 |
|
Per barrel of refined product sales: | | | | |
Big Spring refining margin | | $ | (12.60 | ) | | $ | 18.16 |
|
Big Spring adjusted refining margin | | $ | (4.92 | ) | | $ | 17.71 |
|
Operating expenses | | $ | 7.37 |
| | $ | 3.81 |
|
Crude Slate: (% based on amount received in period) | | | | |
WTI crude oil | | 56.3 | % | | 79.5 | % |
WTS crude oil | | 43.7 | % | | 20.5 | % |
| | | | |
Krotz Springs, LA Refinery | | | | |
Days in period - based on date acquired | | 91 |
| | 90 |
|
Total sales volume - refined product (average barrels per day) (1) | | 81,016 |
| | 78,231 |
|
Products manufactured (average barrels per day): | | | | |
Gasoline | | 29,933 |
| | 38,062 |
|
Diesel/Jet | | 30,932 |
| | 30,391 |
|
Heavy oils | | 731 |
| | 1,090 |
|
Petrochemicals, LPG, NGLs | | 3,006 |
| | 7,269 |
|
Other | | — |
| | 105 |
|
Total production | | 64,602 |
| | 76,917 |
|
Throughput (average barrels per day): | | |
| | |
Crude oil | | 72,481 |
| | 72,330 |
|
Other feedstocks | | (8,383 | ) | | 3,166 |
|
Total throughput | | 64,098 |
| | 75,496 |
|
Per barrel of refined product sales: | | |
| | |
Krotz Springs refining margin | | $ | (1.49 | ) | | $ | 11.95 |
|
Krotz Springs adjusted refining margin | | $ | 4.48 |
| | $ | 10.97 |
|
Operating expenses | | $ | 3.43 |
| | $ | 3.89 |
|
Crude Slate: (% based on amount received in period) | | | | |
WTI Crude | | 66.1 | % | | 65.0 | % |
Gulf Coast Sweet Crude | | 33.9 | % | | 35.0 | % |
| |
(1) | Includes inter-refinery sales and sales to other segments which are eliminated in consolidation. See tables below. |
Included in the refinery statistics above are the following inter-refinery and sales to other segments:
|
| | | | | | |
Inter-refinery Sales | | | | |
| | Three Months Ended March 31, |
(in barrels per day) | | 2020 | | 2019 |
| | (Unaudited) |
| | | | |
Tyler refined product sales to other Delek refineries | | 763 |
| | 197 |
|
El Dorado refined product sales to other Delek refineries | | 1,466 |
| | 847 |
|
Big Spring refined product sales to other Delek refineries | | 1,025 |
| | 1,296 |
|
Krotz Springs refined product sales to other Delek refineries | | 293 |
| | 797 |
|
|
| | | | | | |
Refinery Sales to Other Segments | | | | |
| | Three Months Ended March 31, |
(in barrels per day) | | 2020 | | 2019 |
| | (Unaudited) |
| | | | |
Tyler refined product sales to other Delek segments | | 3,207 |
| | 540 |
|
El Dorado refined product sales to other Delek segments | | 328 |
| | 253 |
|
Big Spring refined product sales to other Delek segments | | 25,112 |
| | 26,862 |
|
Krotz Springs refined product sales to other Delek segments | | — |
| | — |
|
|
| | | | | | | | |
Pricing statistics | | |
(average for the period presented) | | | | |
| | Three Months Ended March 31, |
| | 2020 | | 2019 |
| | (Unaudited) |
| | | | |
WTI — Cushing crude oil (per barrel) | | $ | 45.57 |
| | $ | 54.87 |
|
WTI — Midland crude oil (per barrel) (1) | | $ | 45.51 |
| | $ | 53.70 |
|
WTS -- Midland crude oil (per barrel) (1) | | $ | 44.99 |
| | $ | 53.93 |
|
LLS crude oil (per barrel) (1) | | $ | 47.63 |
| | $ | 62.36 |
|
Brent crude oil (per barrel) | | $ | 50.82 |
| | $ | 63.83 |
|
| | | | |
US Gulf Coast 5-3-2 crack spread (per barrel) (1) | | $ | 8.76 |
| | $ | 13.02 |
|
US Gulf Coast 3-2-1 crack spread (per barrel) (1) | | $ | 11.41 |
| | $ | 15.18 |
|
US Gulf Coast 2-1-1 crack spread (per barrel) (1) | | $ | 8.12 |
| | $ | 7.33 |
|
| | | | |
US Gulf Coast Unleaded Gasoline (per gallon) | | $ | 1.25 |
| | $ | 1.52 |
|
Gulf Coast Ultra low sulfur diesel (per gallon) | | $ | 1.47 |
| | $ | 1.88 |
|
US Gulf Coast high sulfur diesel (per gallon) | | $ | 1.36 |
| | $ | 1.75 |
|
Natural gas (per MMBTU) | | $ | 1.87 |
| | $ | 2.87 |
|
| |
(1) | For our Tyler and El Dorado refineries, we compare our per barrel refining product margin to the Gulf Coast 5-3-2 crack spread consisting of WTI Cushing crude, U.S. Gulf Coast CBOB and U.S, Gulf Coast Pipeline No. 2 heating oil (high sulfur diesel). For our Big Spring refinery, we compare our per barrel refined product margin to the Gulf Coast 3-2-1 crack spread consisting of WTI Cushing crude, Gulf Coast 87 Conventional gasoline and Gulf Coast ultra-low sulfur diesel, and for our Krotz Springs refinery, we compare our per barrel refined product margin to the Gulf Coast 2-1-1 crack spread consisting of LLS crude oil, Gulf Coast 87 Conventional gasoline and U.S, Gulf Coast Pipeline No. 2 heating oil (high sulfur diesel). The Tyler refinery's crude oil input is primarily WTI Midland and east Texas, while the El Dorado refinery's crude input is primarily a combination of WTI Midland, local Arkansas and other domestic inland crude oil. The Big Spring refinery’s crude oil input is primarily comprised of WTS and WTI Midland. The Krotz Springs refinery’s crude oil input is primarily comprised of LLS and WTI Midland. |
|
| | | | | | | | |
Delek US Holdings, Inc. |
Reconciliation of Refining Margin per barrel to Adjusted Refining Margin per barrel (1) |
$ in millions, except per share data |
| | Three Months Ended March 31, |
| | 2020 | | 2019 |
| | (Unaudited) |
Tyler (2) | | | | |
Reported refining margin, $ per barrel | | $ | (21.51 | ) | | $ | 22.26 |
|
Adjustments: | | | | |
LCM net inventory valuation loss (benefit) | | 21.75 |
| | (6.04 | ) |
| | | |
|
Adjusted refining margin $/bbl | | $ | 0.24 |
| | $ | 16.22 |
|
| | | | |
El Dorado (3) | | | | |
Reported refining margin, $ per barrel | | $ | (8.45 | ) | | $ | 13.45 |
|
Adjustments: | | | | |
LCM net inventory valuation loss (benefit) | | 7.22 |
| | (0.78 | ) |
| | | | |
Adjusted refining margin $/bbl | | $ | (1.23 | ) | | $ | 12.67 |
|
| | | | |
Big Spring (4) | | | | |
Reported refining margin, $ per barrel | | $ | (12.60 | ) | | $ | 18.16 |
|
Adjustments: | | | | |
LCM net inventory valuation loss (benefit) | | 7.68 |
| | (0.45 | ) |
| | | | |
Adjusted refining margin $/bbl | | $ | (4.92 | ) | | $ | 17.71 |
|
| | | | |
Krotz Springs (5) | | | | |
Reported refining margin, $ per barrel | | $ | (1.49 | ) | | $ | 11.95 |
|
Adjustments: | | | | |
LCM net inventory valuation loss (benefit) | | 5.97 |
| | (0.98 | ) |
| | | | |
Adjusted refining margin $/bbl | | $ | 4.48 |
| | $ | 10.97 |
|
| | | | |
| |
(1) | Adjusted refining margin per barrel is presented to provide a measure to evaluate performance excluding inventory valuation adjustments and other items at the individual refinery level. Delek US believes that the presentation of adjusted measures provides useful information to investors in assessing its results of operations at each refinery. Because adjusted refining margin per barrel may be defined differently by other companies in its industry, Delek US' definition may not be comparable to similarly titled measures of other companies. |
| |
(2) | Tyler adjusted refining margins exclude the following items. |
Net inventory valuation loss/benefit - There was approximately $148.4 million of valuation loss and $38.1 million of valuation benefit in the first quarter 2020 and 2019, respectively. These amounts resulted from lower of cost or market adjustments on LIFO inventory in the respective periods.
| |
(3) | El Dorado adjusted refining margins exclude the following items. |
Net inventory valuation loss/benefit - There was approximately $51.0 million of valuation loss and $3.7 million of valuation benefit in the first quarter 2020 and 2019, respectively. These amounts resulted from lower of cost or net realizable value adjustments on FIFO inventory in the respective periods.
| |
(4) | Big Spring adjusted refining margins exclude the following items. |
Net inventory valuation loss/benefit - There was approximately $26.6 million of valuation loss and $3.3 million of valuation benefit in the first quarter 2020 and 2019, respectively. These amounts resulted from lower of cost or net realizable value adjustments on FIFO inventory in the respective periods.
| |
(5) | Krotz Springs adjusted refining margins exclude the following items. |
Net inventory valuation loss/benefit - There was approximately $44.0 million of valuation loss and $6.9 million of valuation benefit in the first quarter 2020 and 2019, respectively.These amounts resulted from lower of cost or net realizable value adjustments on FIFO inventory in the respective periods.
|
| | | | | | | | |
Logistics Segment | | Three Months Ended March 31, |
| | 2020 | | 2019 |
| | (Unaudited) |
Pipelines & Transportation: (average bpd) | | | | |
Lion Pipeline System: | | | | |
Crude pipelines (non-gathered) | | 55,471 |
| | 28,683 |
|
Refined products pipelines | | 54,106 |
| | 23,092 |
|
SALA Gathering System | | 34,906 |
| | 16,998 |
|
East Texas Crude Logistics System | | 14,174 |
| | 18,113 |
|
| | | | |
Wholesale Marketing & Terminalling: | | | | |
East Texas - Tyler Refinery sales volumes (average bpd) (1) | | 72,650 |
| | 68,577 |
|
West Texas marketing throughputs (average bpd) | | 16,081 |
| | 13,314 |
|
West Texas gross margin per barrel | | $ | 2.70 |
| | $ | 3.56 |
|
Big Spring Marketing - Refinery sales volume (average bpd) (for period owned) | | 66,386 |
| | 87,741 |
|
Terminalling throughputs (average bpd) | | 135,329 |
| | 152,469 |
|
(1) Excludes jet fuel and petroleum coke.
|
| | | | | | | | |
Retail Segment | | Three Months Ended March 31, |
| | 2020 | | 2019 |
| | (Unaudited) |
Number of stores (end of period) | | 253 |
| | 281 |
|
Average number of stores | | 253 |
| | 281 |
|
Retail fuel sales (thousands of gallons) | | 47,959 |
| | 53,890 |
|
Average retail gallons per average number of stores (in thousands) | | 194 |
| | 199 |
|
Retail fuel margin ($ per gallon) (1) | | $ | 0.31 |
| | $ | 0.19 |
|
Merchandise sales (in millions) | | $ | 71.7 |
| | $ | 75.3 |
|
Merchandise sales per average number of stores (in millions) | | $ | 0.3 |
| | $ | 0.3 |
|
Merchandise margin % | | 31.6 | % | | 31.0 | % |
|
| | | | | | |
Same-Store Comparison | | Three Months Ended March 31, |
| | 2020 | | 2019 |
| | (Unaudited) |
Change in same-store fuel gallons sold (2) | | (8.2 | )% | | 4.1 | % |
Change in same-store merchandise sales (2) | | 1.7 | % | | 0.8 | % |
| |
(1) | Retail fuel margin represents gross margin on fuel sales in the retail segment, and is calculated as retail fuel sales revenue less retail fuel cost of sales. The retail fuel margin per gallon calculation is derived by dividing retail fuel margin by the total retail fuel gallons sold for the period. |
| |
(2) | Same-store comparisons include period-over-period increases or decreases in specified metrics for stores that were in service at both the beginning of the earliest period and the end of the most recent period used in the comparison. |
|
| | | | | | | | |
Delek US Holdings, Inc. | | | | |
Reconciliation of Amounts Reported Under U.S. GAAP | | | | |
$ in millions | | | | |
| | |
| | Three Months Ended March 31, |
Reconciliation of Net (Loss) Income attributable to Delek to Adjusted Net (Loss) Income | | 2020 | | 2019 |
| | (Unaudited) |
Reported net (loss) income attributable to Delek | | $ | (314.4 | ) | | $ | 149.3 |
|
| | | | |
Adjustments | | | | |
Net inventory valuation loss (benefit) | | 280.8 |
| | (52.1 | ) |
Tax effect of inventory valuation | | (66.2 | ) | | 12.2 |
|
Net after tax inventory valuation loss (benefit) | | 214.6 |
| | (39.9 | ) |
| | | | |
Adjusted unrealized (gain) hedging loss | | (7.6 | ) | | 13.3 |
|
Tax effect of adjusted unrealized hedging (gain) loss | | 1.7 |
| | (3.0 | ) |
Net after tax adjusted unrealized hedging (gain) loss | | (5.9 | ) | | 10.3 |
|
| | | | |
Retroactive biodiesel tax credit (1) | | — |
| | 9.7 |
|
Tax effect of retroactive biodiesel tax credit | | — |
| | — |
|
Net after tax retroactive biodiesel tax credit | | — |
| | 9.7 |
|
| | | | |
Tax adjustment to reduce deferred tax asset valuation allowance resulting from Big Springs Gathering Assets Acquisition | | (22.3 | ) | | — |
|
Total after tax adjustments | | 186.4 |
| | (19.9 | ) |
| | | | |
Adjusted net (loss) income | | $ | (128.0 | ) | | $ | 129.4 |
|
| | | | |
(1) An adjustment for the portion of the retroactive biodiesel tax credit reenacted in December 2019 that was attributable to the first quarter of 2019 has been included in the three months ended March 31, 2019 for comparability.
|
| | | | | | | | |
Delek US Holdings, Inc. | | | | |
Reconciliation of Amounts Reported Under U.S. GAAP | | | | |
per share data | | | | |
| | Three Months Ended March 31, |
Reconciliation of U.S. GAAP (Loss) Income per share to Adjusted Net (Loss) Income per share | | 2020 | | 2019 |
| | (Unaudited) |
| | | | |
Reported diluted (loss) income per share | | $ | (4.28 | ) | | $ | 1.90 |
|
| | | | |
Adjustments, after tax (per share) (1) | | | | |
Net inventory valuation loss (benefit) | | 2.92 |
| | (0.51 | ) |
Adjusted unrealized (gain) hedging loss | | (0.08 | ) | | 0.13 |
|
Retroactive biodiesel tax credit | | — |
| | 0.12 |
|
Tax adjustment to reduce deferred tax asset valuation allowance resulting from Big Springs Gathering Assets Acquisition | | (0.30 | ) | | — |
|
| | | | |
Total adjustments | | 2.54 |
| | (0.26 | ) |
Adjusted net (loss) income per share | | $ | (1.74 | ) | | $ | 1.64 |
|
(1) The tax calculation is based on the appropriate marginal income tax rate related to each adjustment and for each respective time period, which is applied to the adjusted items in the calculation of adjusted net income in all periods.
|
| | | | | | | | |
Delek US Holdings, Inc. | | | | |
Reconciliation of Amounts Reported Under U.S. GAAP | | | | |
$ in millions | | | | |
| | |
| | Three Months Ended March 31, |
Reconciliation of Net Income attributable to Delek to Adjusted EBITDA | | 2020 | | 2019 |
| | (Unaudited) |
Reported net (loss) income attributable to Delek | | $ | (314.4 | ) | | $ | 149.3 |
|
| | | | |
Add: | | | | |
Interest expense, net | | 34.6 |
| | 26.2 |
|
Income tax expense - continuing operations | | (83.1 | ) | | 45.8 |
|
Depreciation and amortization | | 52.6 |
| | 46.8 |
|
EBITDA | | (310.3 | ) | | 268.1 |
|
| | | | |
Adjustments | | | | |
Net inventory valuation loss (benefit) | | 280.8 |
| | (52.1 | ) |
Adjusted unrealized hedging (gain) loss | | (7.6 | ) | | 13.3 |
|
Retroactive biodiesel tax credit (1) | | — |
| | 9.7 |
|
Net income attributable to non-controlling interest | | 7.4 |
| | 5.1 |
|
Total adjustments | | 280.6 |
| | (24.0 | ) |
| | | | |
Adjusted EBITDA | | $ | (29.7 | ) | | $ | 244.1 |
|
| | | | |
(1) The portion of the retroactive biodiesel tax credit reenacted in December 2019 that was attributable to the first quarter of 2019 has been added to the three months ended March 31, 2019.
|
| | | | | | | | |
| | Three Months Ended March 31, |
Reconciliation of Refining Segment Gross Margin to Refining Margin | | 2020 | | 2019 |
| (Unaudited) |
Net revenues | | $ | 1,727.9 |
| | $ | 2,092.0 |
|
Cost of sales | | 2,055.5 |
| | 1,821.2 |
|
Gross margin | | (327.6 | ) | | 270.8 |
|
Add back (items included in cost of sales): | | | | |
Operating expenses (excluding depreciation and amortization) | | 111.7 |
| | 121.0 |
|
Depreciation and amortization | | 37.2 |
| | 31.1 |
|
Refining margin | | $ | (178.7 | ) | | $ | 422.9 |
|
|
| | | | | | | | |
| | Three Months Ended March 31, |
Reconciliation of Unrealized (Gains) Losses on Economic Hedge Commodity Derivatives Not Designated as Hedges to Adjusted Unrealized Hedging (Gains) Losses | | 2020 | | 2019 |
| | (Unaudited) |
Unrealized (gain) loss on economic hedge commodity derivatives not designated as hedges | | $ | (52.0 | ) | | $ | 27.1 |
|
Less: Net effect of settlement timing differences | | | | |
Portion of current period unrealized (gain) loss where the instrument has matured but has not cash settled as of period end | | (37.6 | ) | | 5.6 |
|
Less: Prior period unrealized loss (gain) where the instrument had matured but had not cash settled as of prior period end | | 6.8 |
| | (8.1 | ) |
Total net effect of settlement timing differences | | (44.4 | ) | | 13.7 |
|
Adjusted unrealized hedging (gains) losses | | $ | (7.6 | ) | | $ | 13.4 |
|
Investor/Media Relations Contacts:
Blake Fernandez, Senior Vice President of Investor Relations and Market Intelligence, 615-224-1312
Media/Public Affairs Contact:
Michael P. Ralsky, Vice President - Government Affairs, Public Affairs & Communications, 615-435-1407