
++++++\
Overview | PAGE |
| |
3 | |
| |
5 | |
| |
Consolidated Statements of Operations | |
| |
7 | |
| |
10 | |
| |
12 | |
| |
13 | |
| |
14 | |
| |
Balance Sheet Information | |
| |
15 | |
| |
16 | |
| |
17 | |
| |
18 | |
| |
Internal Growth | |
| |
19 | |
| |
20 | |
| |
21 | |
| |
22 | |
| |
23 | |
| |
24 | |
| |
External Growth | |
| |
25 | |
| |
26 | |
| |
Historical Capital Expenditures and Investments in Real Estate | 27 |
| |
28 | |
| |
29 | |
| |
Additional Information | |
| |
Reconciliation of Earnings Before Interest, Taxes, Depreciation & Amortization and Financial Ratios | 30 |
| |
31 | |
| |
33 |

Digital Realty Trust, Inc. (“Digital Realty” or the “company”) owns, acquires, develops, and operates data centers through its operating partnership subsidiary, Digital Realty Trust, L.P. (the “operating partnership”). The company is focused on providing data center, colocation, and interconnection solutions for domestic and international customers across a variety of industry verticals ranging from cloud and information technology services, communications and social networking to financial services, manufacturing, energy, healthcare, and consumer products. As of December 31, 2024, the company’s 308 data centers, including 78 data centers held as investments in unconsolidated joint ventures, contain applications and operations critical to the day-to-day operations of technology industry and corporate enterprise data center customers. Digital Realty’s portfolio is comprised of approximately 41.3 million square feet, excluding approximately 8.9 million square feet of space under active development and 4.7 million square feet of space held for future development, located throughout North America, Europe, South America, Asia, Australia, and Africa. For additional information, please visit the company’s website at digitalrealty.com.
Corporate Headquarters 2323 Bryan Street, Suite 1800 Dallas, TX 75201 | Senior Management President & Chief Executive Officer: Andrew P. Power |
Investor Relations
To request more information or to be added to our e-mail distribution list, please visit the Investor Relations section of our website at https://investor.digitalrealty.com.
| Bank of America | | BMO Capital | BNP Paribas | | |||||||
Argus Research | | Merrill Lynch | | Barclays | | Markets | | Exane | | Citigroup | | Deutsche Bank |
Marie Ferguson | | David Barden | | Brendan Lynch | | Ari Klein | | Nate Crossett | | Michael Rollins | | Matthew Niknam |
(212) 425-7500 | | (646) 855-1320 | | (212) 526-9428 | | (212) 885-4103 | | (646) 725-3716 | | (212) 816-1116 | | (212) 250-4711 |
| | | | | | | | | | | | |
Evercore ISI | | Goldman Sachs | | Green Street Advisors | | HSBC | | Jefferies | | JMP Securities | | J.P. Morgan |
Irvin Liu | | Jim Schneider | | David Guarino | | Phani Kanumuri | | Jonathan Petersen | | Greg Miller | | Richard Choe |
(415) 800-0183 | | (212) 357-2929 | | (949) 640-8780 | | +52 (551) 782-7350 | | (212) 284-1705 | | (212) 906-3500 | | (212) 662-6708 |
| | | | | | | | | | | | |
KeyBanc | | Mizuho Group | | MoffettNathanson | | Morgan Stanley | | Morningstar | | Raymond James | | RBC Capital Markets |
Brandon Nispel | | Vikram Malhotra | | Nick Del Deo | | Simon Flannery | | Samuel Siampaus | | Frank Louthan | | Jonathan Atkin |
(503) 821-3871 | | (212) 282-3827 | | (212) 519-0025 | | (212) 761-6432 | | (312) 244-7966 | | (404) 442-5867 | | (415) 633-8589 |
| | | | | | | | | | | | |
Scotiabank | | Stifel | | TD Cowen | | Truist Securities | | UBS | | Wells Fargo | | Wolfe Research |
Maher Yaghi | | Erik Rasmussen | | Michael Elias | | Anthony Hau | | John Hodulik | | Eric Luebchow | | Andrew Rosivach |
(437) 995-5548 | | (212) 271-3461 | | (646) 562-1358 | | (212) 303-4176 | | (212) 713-4226 | | (312) 630-2386 | | (646) 582-9250 |
| | | | | | | | | | | | |
This Earnings Press Release and Supplemental Information package supplements the information provided in our quarterly and annual reports filed with the U.S. Securities and Exchange Commission. Additional information about Digital Realty and our business is also available on our website at digitalrealty.com.
Upcoming Conference Schedule
| | |
March 2-5, 2025 | Citi Global Property CEO Conference | Hollywood, FL |
March 3-5, 2025 | Raymond James Institutional Investors Conference | Orlando, FL |
March 10-12, 2025 | Deutsche Bank Media, Internet & Telecom Conference | Palm Beach, FL |
Webcasts for these events are available through the Digital Realty Investor Relations website when possible. Please check our website for additional information.
3
Stock Listing Information
The stock of Digital Realty Trust, Inc. is traded primarily on the New York Stock Exchange under the following symbols:
Common Stock: | | DLR |
Series J Preferred Stock: | | DLRPRJ |
Series K Preferred Stock: | | DLRPRK |
Series L Preferred Stock: | | DLRPRL |
Symbols may vary by stock quote provider.
Credit Ratings
Standard & Poor’s | | | |
Corporate Credit Rating: | | BBB | (Stable Outlook) |
Preferred Stock: | | BB+ | |
| | | |
Moody’s | | | |
Issuer Rating: | | Baa2 | (Stable Outlook) |
Preferred Stock: | | Baa3 | |
| | | |
Fitch | | | |
Issuer Default Rating: | | BBB | (Stable Outlook) |
Preferred Stock: | | BB+ | |
These credit ratings may not reflect the potential impact of risks relating to the structure or trading of the company’s securities and are provided solely for informational purposes. Credit ratings are not recommendations to buy, hold or sell any security, and may be revised or withdrawn at any time by the issuing rating agency at its sole discretion. The company does not undertake any obligation to maintain the ratings or to advise of any change in ratings. Each agency’s rating should be evaluated independently of any other agency’s rating. An explanation of the significance of the ratings may be obtained from each of the rating agencies.
Common Stock Price Performance
The following summarizes recent activity of Digital Realty’s common stock (DLR):
| | Three Months Ended |
| |||||||||||||
| | 31-Dec-24 | | 30-Sep-24 | | 30-Jun-24 | | 31-Mar-24 | | 31-Dec-23 | | |||||
High price | |
| $198.00 | |
| $165.17 | |
| $153.25 | |
| $154.18 | |
| $139.35 |
|
Low price |
| | $155.16 |
| | $141.00 |
| | $135.54 |
| | $130.00 |
| | $113.94 | |
Closing price, end of quarter | | | $177.33 | | | $161.83 | | | $152.05 | | | $144.04 | | | $134.58 | |
Average daily trading volume (1) | | | 1,911 | | | 1,615 | | | 1,863 | | | 2,108 | | | 1,932 | |
Indicated dividend per common share (2) | | | $4.88 | | | $4.88 | | | $4.88 | | | $4.88 | | | $4.88 | |
Closing annual dividend yield, end of quarter | | | 2.8% | | | 3.0% | | | 3.2% | | | 3.4% | | | 3.6% | |
Shares and units outstanding, end of quarter (1) (3) | | | 342,772 | | | 337,744 | | | 332,346 | | | 319,009 | | | 318,057 | |
Closing market value of shares and units outstanding (4) | | | $60,783,759 | | | $54,657,112 | | | $50,533,209 | | | $45,950,001 | | | $42,804,053 | |
| (1) | Shares or shares and units in thousands. |
| (2) | On an annualized basis. |
| (3) | As of December 31, 2024, the total number of shares and units includes 336,637 shares of common stock, 4,049 common units held by third parties and 2,086 common units and vested and unvested long-term incentive units held by directors, officers and others and excludes all shares of common stock potentially issuable upon conversion of our series J, series K and series L cumulative redeemable preferred stock upon certain change of control transactions. |
| (4) | Dollars in thousands as of the end of the quarter. |
This Earnings Press Release and Supplemental Information package supplements the information provided in our quarterly and annual reports filed with the U.S. Securities and Exchange Commission. Additional information about us and our data centers is also available on our website at digitalrealty.com.
4
| Financial Supplement | |
|---|---|---|
Unaudited, Dollars (except per share data) and Square Feet in Thousands | Fourth Quarter 2024 |
Shares and Units at End of Quarter |
| 31-Dec-24 |
| 30-Sep-24 |
| 30-Jun-24 |
| 31-Mar-24 |
| 31-Dec-23 | |||||
Common shares outstanding |
| | 336,637 |
| | 331,347 |
| | 325,885 |
| | 312,421 |
| | 311,608 |
Common partnership units outstanding |
| | 6,135 |
| | 6,397 |
| | 6,461 |
| | 6,588 |
| | 6,449 |
Total Shares and Units |
| | 342,772 |
| | 337,744 |
| | 332,346 |
| | 319,009 |
| | 318,057 |
| | | | | | | | | | | | | | | |
Enterprise Value |
| |
|
| |
|
| |
|
| |
|
| |
|
Market value of common equity (1) | | | $60,783,759 | | | $54,657,112 | | | $50,533,209 | | | $45,950,001 | | | $42,804,053 |
Liquidation value of preferred equity | |
| 755,000 | |
| 755,000 | |
| 755,000 | |
| 755,000 | |
| 755,000 |
Total debt at balance sheet carrying value | |
| 16,714,377 | |
| 16,986,546 | |
| 16,339,746 | |
| 17,020,340 | |
| 17,425,908 |
Total Enterprise Value | | | $78,253,136 | | | $72,398,658 | | | $67,627,955 | | | $63,725,341 | | | $60,984,961 |
Total debt / total enterprise value | |
| 21.4% | |
| 23.5% | |
| 24.2% | |
| 26.7% | |
| 28.6% |
Debt-plus-preferred-to-total-enterprise-value | | | 22.3% | | | 24.5% | | | 25.3% | | | 27.9% | | | 29.8% |
| | | | | | | | | | | | | | | |
Selected Balance Sheet Data | |
|
| |
|
| |
|
| |
|
| |
|
|
Investments in real estate (before depreciation) | | | $35,401,912 | | | $36,463,664 | | | $34,573,283 | | | $34,099,698 | | | $34,355,662 |
Total Assets | |
| 45,283,616 | |
| 45,295,392 | |
| 43,606,883 | |
| 42,633,089 | |
| 44,113,257 |
Total Liabilities | |
| 22,107,836 | |
| 22,118,781 | |
| 21,199,178 | |
| 21,792,866 | |
| 23,116,936 |
| | | | | | | | | | | | | | | |
Selected Operating Data | |
|
| |
|
| |
|
| |
|
| |
|
|
Total operating revenues | | | $1,435,862 | | | $1,431,214 | | | $1,356,749 | | | $1,331,143 | | | $1,369,633 |
Total operating expenses | |
| 1,291,540 | |
| 1,262,928 | |
| 1,346,860 | |
| 1,181,776 | |
| 1,235,598 |
Net income | |
| 185,688 | |
| 40,134 | |
| 74,668 | |
| 287,837 | |
| 19,884 |
Net income / (loss) available to common stockholders | |
| 179,388 | |
| 41,012 | |
| 70,039 | |
| 271,327 | |
| 18,122 |
| | | | | | | | | | | | | | | |
Financial Ratios | |
|
| |
|
| |
|
| |
|
| |
|
|
EBITDA (2) | | | $746,578 | | | $639,875 | | | $625,130 | | | $835,446 | | | $572,958 |
Adjusted EBITDA (3) | |
| 751,276 | |
| 758,296 | |
| 726,874 | |
| 710,556 | |
| 699,509 |
Net Debt-to-Adjusted EBITDA (4) | |
| 4.8x | |
| 5.4x | |
| 5.3x | |
| 6.1x | |
| 6.2x |
Interest expense | |
| 104,742 | |
| 123,803 | |
| 114,756 | |
| 109,535 | |
| 113,638 |
Fixed charges (5) | |
| 149,364 | |
| 162,296 | |
| 152,529 | |
| 148,239 | |
| 156,851 |
Interest coverage ratio (6) | |
| 4.5x | |
| 4.3x | |
| 4.3x | |
| 4.3x | |
| 4.0x |
Fixed charge coverage ratio (7) | |
| 4.2x | |
| 4.1x | |
| 4.1x | |
| 4.0x | |
| 3.8x |
| | | | | | | | | | | | | | | |
Profitability Measures | |
|
| |
|
| |
|
| |
|
| |
|
|
Net income / (loss) per common share - basic | | | $0.54 | | | $0.13 | | | $0.22 | | | $0.87 | | | $0.06 |
Net income / (loss) per common share - diluted | | | $0.51 | | | $0.09 | | | $0.20 | | | $0.82 | | | $0.03 |
Funds from operations (FFO) / diluted share and unit (8) | | | $1.61 | | | $1.55 | | | $1.57 | | | $1.41 | | | $1.53 |
Core funds from operations (Core FFO) / diluted share and unit (8) | | | $1.73 | | | $1.67 | | | $1.65 | | | $1.67 | | | $1.63 |
Adjusted funds from operations (AFFO) / diluted share and unit (9) | | | $1.36 | | | $1.52 | | | $1.56 | | | $1.68 | | | $1.30 |
Dividends per share and common unit | | | $1.22 | | | $1.22 | | | $1.22 | | | $1.22 | | | $1.22 |
Diluted FFO payout ratio (8) (10) | |
| 75.6% | |
| 78.8% | |
| 77.9% | |
| 86.5% | |
| 79.8% |
Diluted Core FFO payout ratio (8) (11) | |
| 70.7% | |
| 73.2% | |
| 73.9% | |
| 73.2% | |
| 75.0% |
Diluted AFFO payout ratio (9) (12) | |
| 89.5% | |
| 80.4% | |
| 78.1% | |
| 72.8% | |
| 93.6% |
| | | | | | | | | | | | | | | |
Portfolio Statistics | |
|
| |
|
| |
|
| |
|
| |
|
|
Buildings (13) | | | 328 | | | 331 | | | 323 | | | 323 | | | 323 |
Data Centers (13) | |
| 308 | |
| 312 | |
| 310 | |
| 309 | |
| 309 |
Cross-connects (13) (14) | |
| 227,000 | |
| 225,000 | |
| 223,000 | |
| 221,500 | |
| 220,000 |
Net rentable square feet, excluding development space (13) | |
| 41,326 | |
| 41,092 | |
| 41,220 | |
| 39,839 | |
| 39,688 |
Occupancy at end of quarter (15) | |
| 84.1% | |
| 83.9% | |
| 82.9% | |
| 82.1% | |
| 81.7% |
Occupied square footage (13) | |
| 34,741 | |
| 34,479 | |
| 34,160 | |
| 32,727 | |
| 32,407 |
Space under active development (16) | |
| 8,904 | |
| 9,126 | |
| 8,507 | |
| 8,238 | |
| 8,470 |
Space held for development (17) | |
| 4,686 | |
| 4,862 | |
| 5,130 | |
| 4,141 | |
| 4,130 |
Weighted average remaining lease term (years) (18) | |
| 4.8 | |
| 4.8 | |
| 4.7 | |
| 4.5 | |
| 4.6 |
Same-capital occupancy at end of quarter (15) (19) | |
| 82.9% | |
| 83.3% | |
| 83.5% | |
| 82.5% | |
| 82.8% |
5
| Financial Supplement | |
|---|---|---|
Unaudited, Dollars (except per share data) and Square Feet in Thousands | Fourth Quarter 2024 |
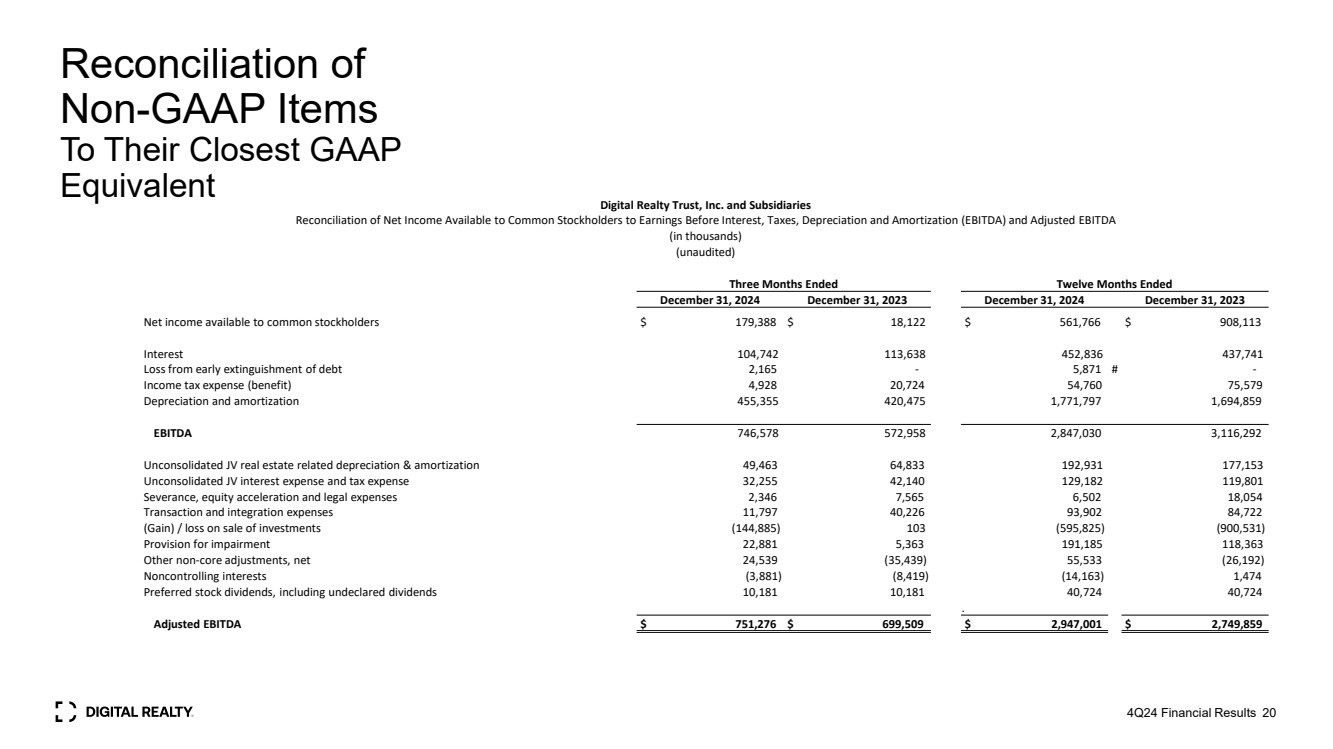
| (2) | EBITDA is calculated as earnings before interest expense, loss on debt extinguishment and modifications, tax expense, and depreciation and amortization. For a discussion of EBITDA, see page 31. For a reconciliation of net income available to common stockholders to EBITDA, see page 30. |
| (3) | Adjusted EBITDA is EBITDA excluding (i) unconsolidated joint venture real estate related depreciation & amortization, (ii) unconsolidated joint venture interest and tax expense, (iii) severance, equity acceleration and legal expenses, (iv) transaction and integration expenses, (v) gain (loss) on sale / deconsolidation, (vi) provision for impairment, (vii) other non-core adjustments, net, (viii) non-controlling interests, (ix) preferred stock dividends, and (x) issuance costs associated with redeemed preferred stock. For a discussion of Adjusted EBITDA, see page 31. For a reconciliation of net income available to common stockholders to Adjusted EBITDA, see page 30. |
| (4) | Net Debt to Adjusted EBITDA is calculated as total debt at balance sheet carrying value (see page 5), plus capital lease obligations, plus our share of unconsolidated joint venture debt at carrying value, less cash and cash equivalents (including our share of unconsolidated joint venture cash), divided by the product of Adjusted EBITDA (including our share of unconsolidated joint venture EBITDA), multiplied by four. |
| (5) | Fixed charges consist of GAAP interest expense, capitalized interest, scheduled debt principal payments and preferred stock dividends. |
| (6) | Interest coverage ratio is Adjusted EBITDA divided by GAAP interest expense plus capitalized interest (including our share of unconsolidated joint venture interest expense). |
| (7) | Fixed charge coverage ratio is Adjusted EBITDA divided by fixed charges (including our share of unconsolidated joint venture fixed charges). |
| (8) | For definitions and discussion of FFO and Core FFO, see page 31. For reconciliations of net income available to common stockholders to FFO and Core FFO, see page 13. |
| (9) | For a definition and discussion of AFFO, see page 31. For a reconciliation of Core FFO to AFFO, see page 14. |
| (10) | Diluted FFO payout ratio is dividends declared per common share and unit divided by diluted FFO per share and unit. |
| (11) | Diluted Core FFO payout ratio is dividends declared per common share and unit divided by diluted Core FFO per share and unit. |
| (12) | Diluted AFFO payout ratio is dividends declared per common share and unit divided by diluted AFFO per share and unit. |
| (13) | Includes buildings held as investments in unconsolidated entities. Excludes buildings held-for-sale. |
| (14) | Represents approximate amounts. |
| (15) | Occupancy and same-capital occupancy exclude space under active development and space held for development. Occupancy represents our consolidated portfolio in addition to our managed portfolio of unconsolidated joint ventures and non-managed unconsolidated joint ventures. For some of our buildings, we calculate occupancy based on factors in addition to contractually leased square feet, including available power, required support space and common area. Excludes buildings held for sale. |
| (16) | Space under active development includes current Base Building and Data Centers projects in progress. Excludes buildings held-for-sale. |
| (17) | Space held for development includes space held for future Data Center development and excludes space under active development. Excludes buildings held for sale. |
| (18) | Weighted average remaining lease term excludes renewal options and is weighted by net rentable square feet. |
| (19) | Represents buildings owned as of December 31, 2022, with less than 5% of total rentable square feet under development. Excludes buildings that were undergoing, or were expected to undergo, development activities in 2023-2024, buildings classified as held-for-sale, and buildings sold or contributed to joint ventures for all periods presented. Prior period results have been adjusted to reflect current same-capital pool. |
6
Digital Realty Reports Fourth Quarter 2024 Results
Dallas, TX — February 13, 2025 — Digital Realty (NYSE: DLR), the largest global provider of cloud- and carrier-neutral data center, colocation, and interconnection solutions, announced today financial results for the fourth quarter of 2024. All per share results are presented on a fully diluted basis.
Highlights
| ◾ | Reported net income available to common stockholders of $0.51 per share in 4Q24, compared to $0.03 in 4Q23 |
| ◾ | Reported FFO per share of $1.61 in 4Q24, compared to $1.53 in 4Q23 |
| ◾ | Reported Core FFO per share of $1.73 in 4Q24, compared to $1.63 in 4Q23 |
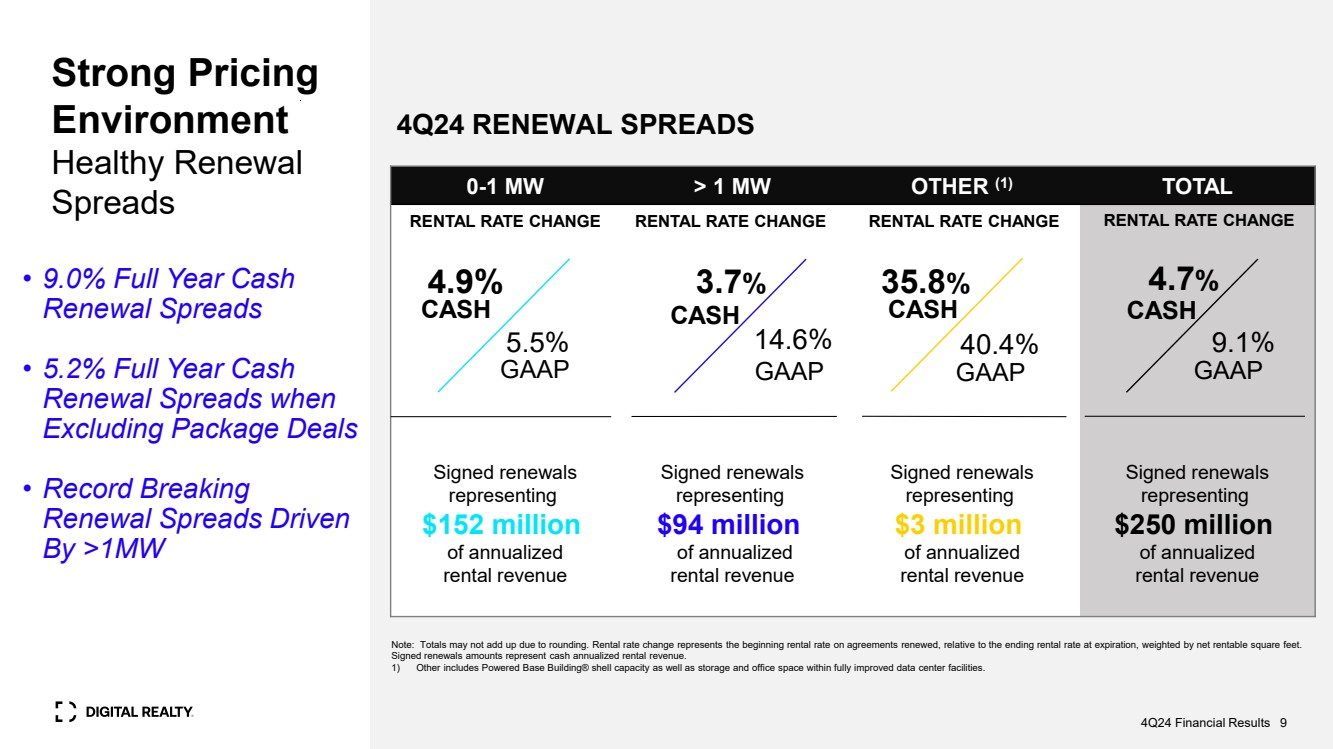
| ◾ | Reported rental rate increases on renewal leases of 4.7% on a cash basis in 4Q24 |
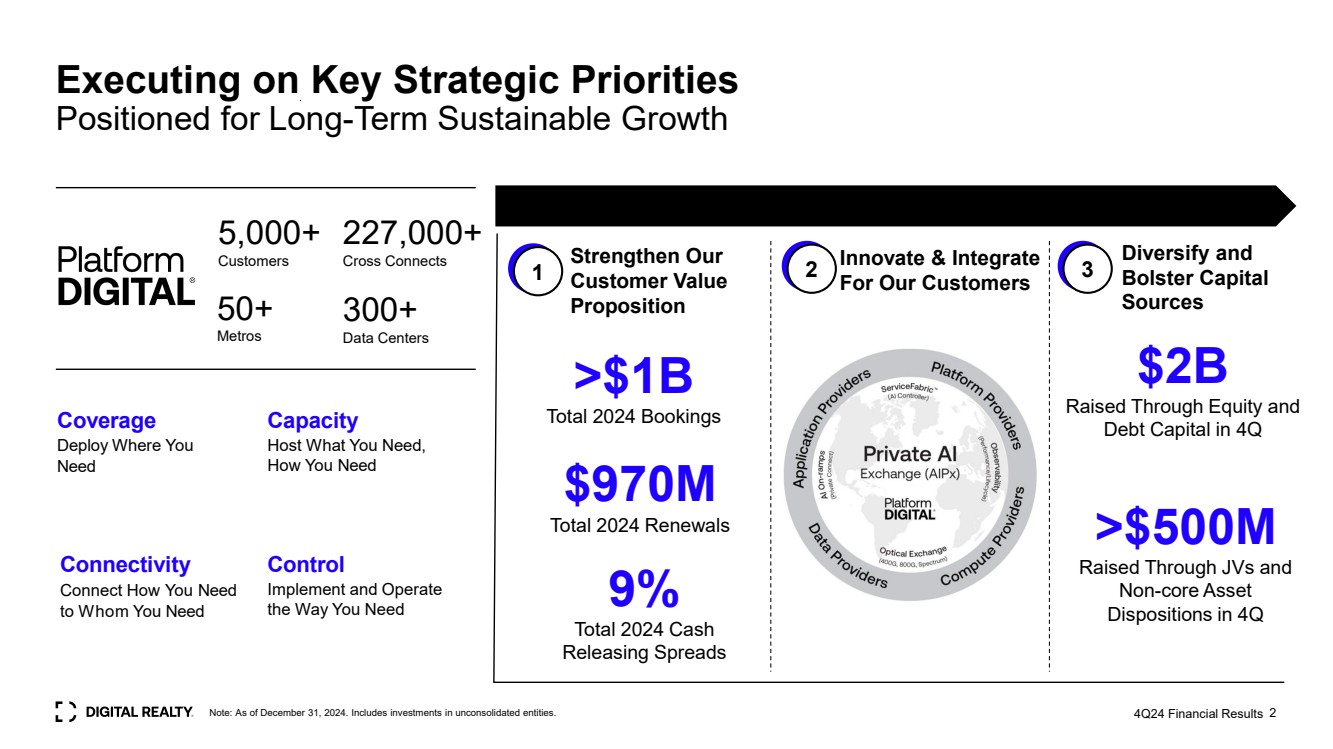
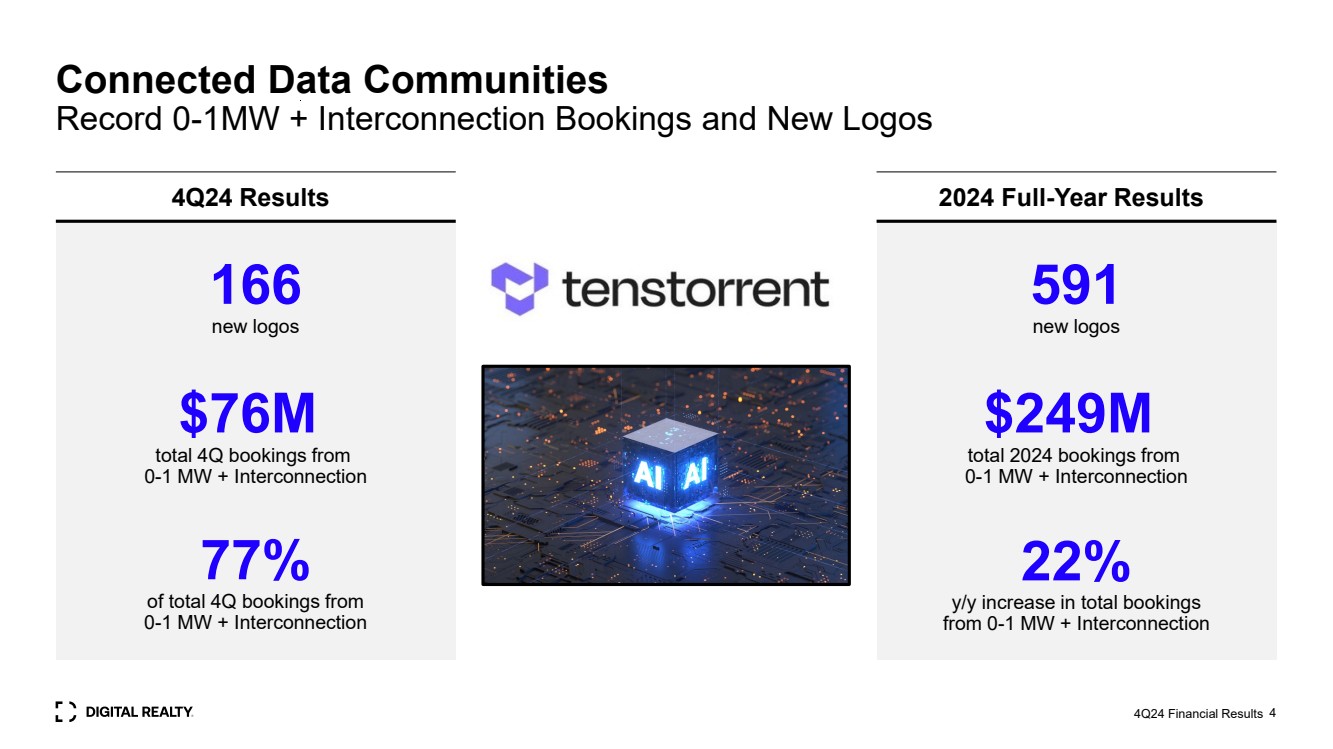
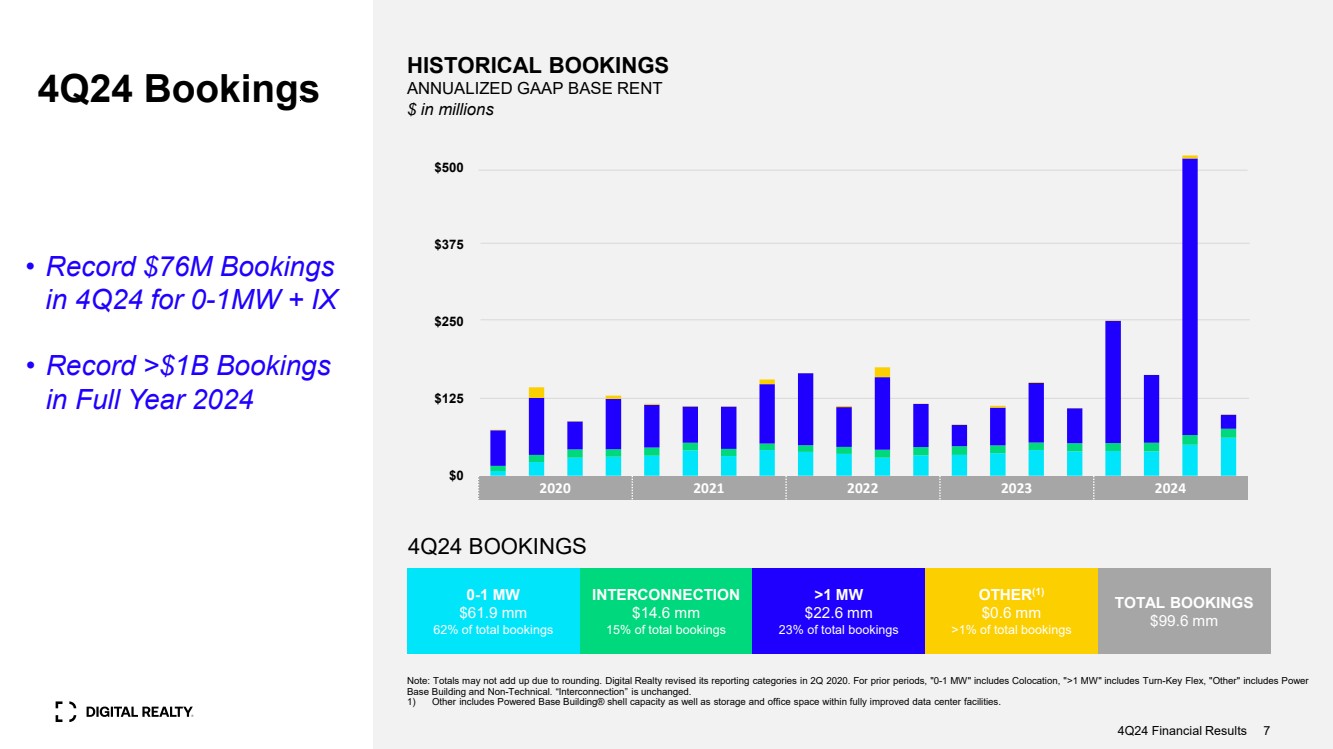
| ◾ | Signed total bookings during 4Q24 that are expected to generate $100 million of annualized GAAP rental revenue, including a record $76 million contribution from the 0–1 megawatt plus interconnection category |
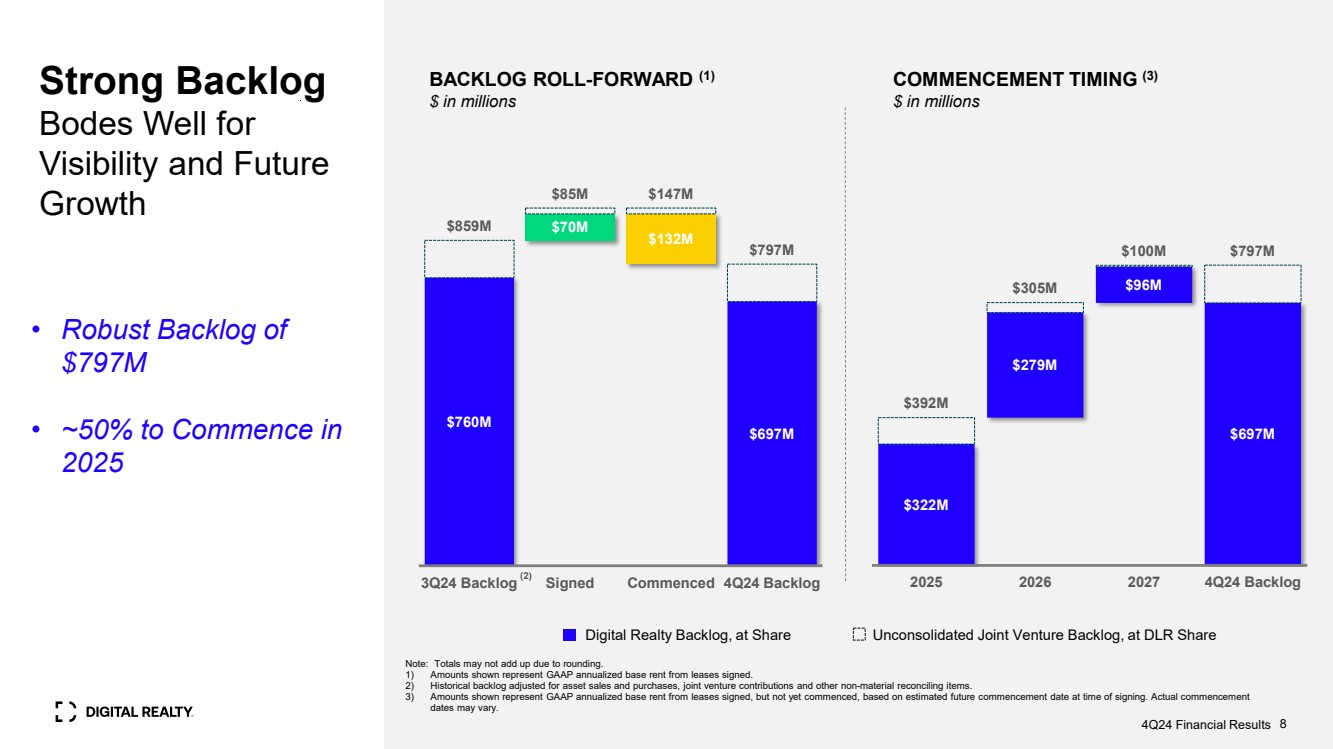
| ◾ | Reported backlog of $797 million of annualized GAAP base rent at the end of 4Q24 |
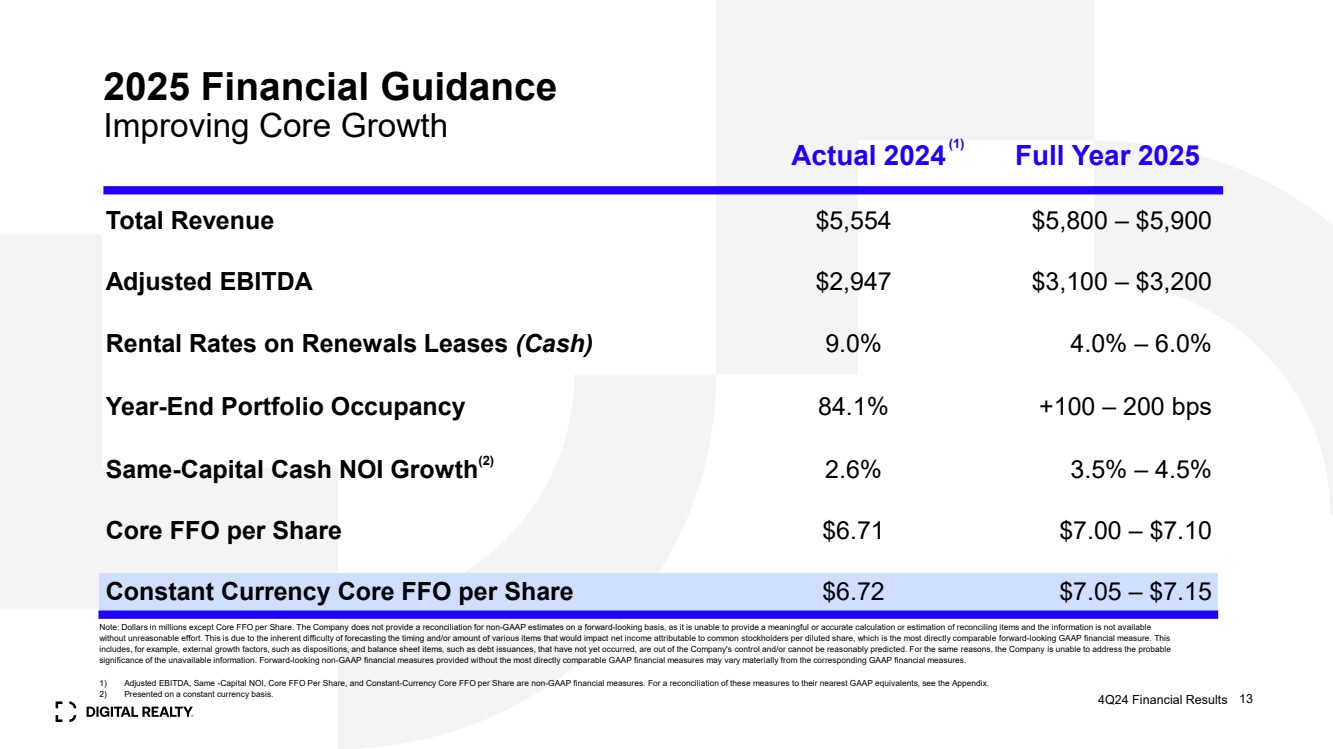
| ◾ | Introduced 2025 Constant-Currency Core FFO per share outlook of $7.05 - $7.15 |
Financial Results
Digital Realty reported revenues of $1.4 billion in the fourth quarter of 2024, a slight increase from the previous quarter and a 5% increase from the same quarter last year.
The company delivered net income of $186 million in the fourth quarter of 2024, and net income available to common stockholders of $179 million, or $0.51 per share, compared to $0.09 per share in the previous quarter and $0.03 per share in the same quarter last year.
Digital Realty generated Adjusted EBITDA of $751 million in the fourth quarter of 2024, a 1% decrease from the previous quarter and a 7% increase over the same quarter last year.
The company reported Funds From Operations (FFO) of $545 million in the fourth quarter of 2024, or $1.61 per share, compared to $1.55 per share in the previous quarter and $1.53 per share in the same quarter last year.
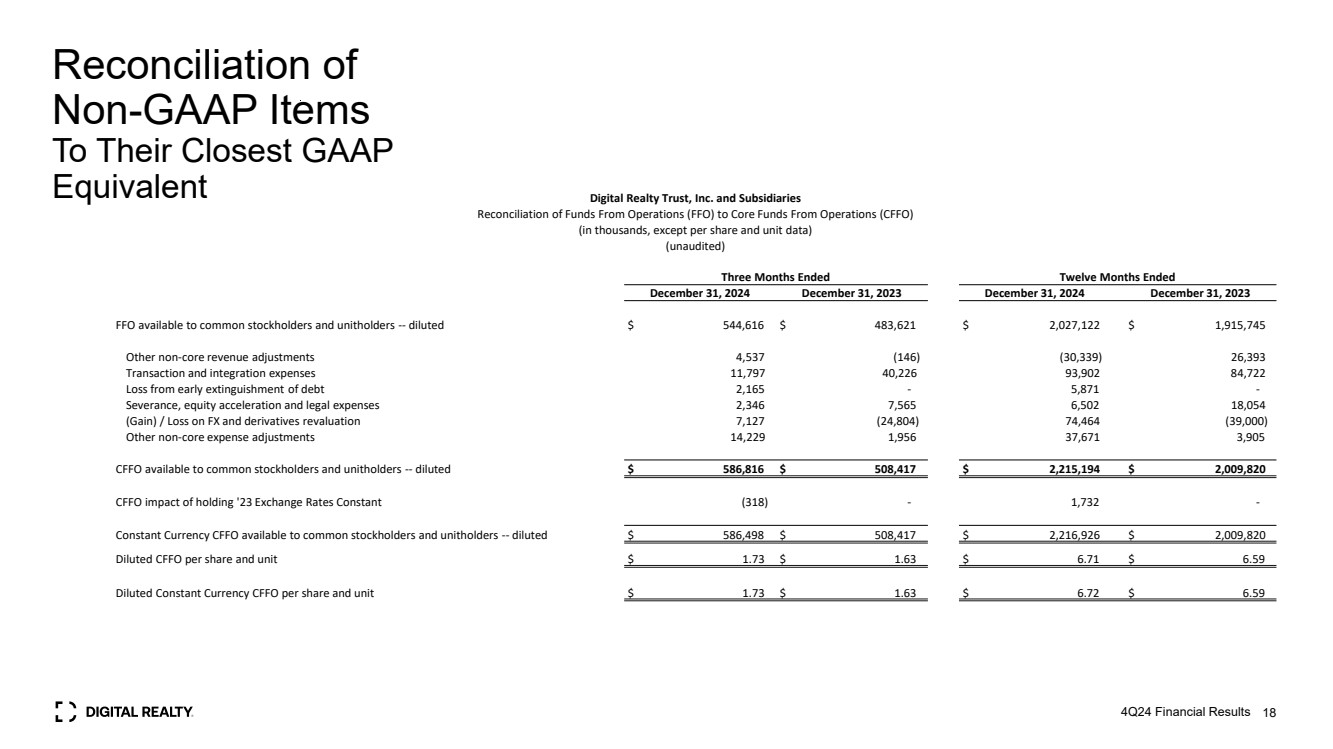
Excluding certain items that do not represent core expenses or revenue streams, Digital Realty delivered Core FFO per share of $1.73 in the fourth quarter of 2024, compared to $1.67 per share in the previous quarter and $1.63 per share in the same quarter last year. Digital Realty delivered Constant-Currency Core FFO per share of $1.73 for the fourth quarter of 2024 and $6.72 per share for the twelve-month period ended December 31, 2024.
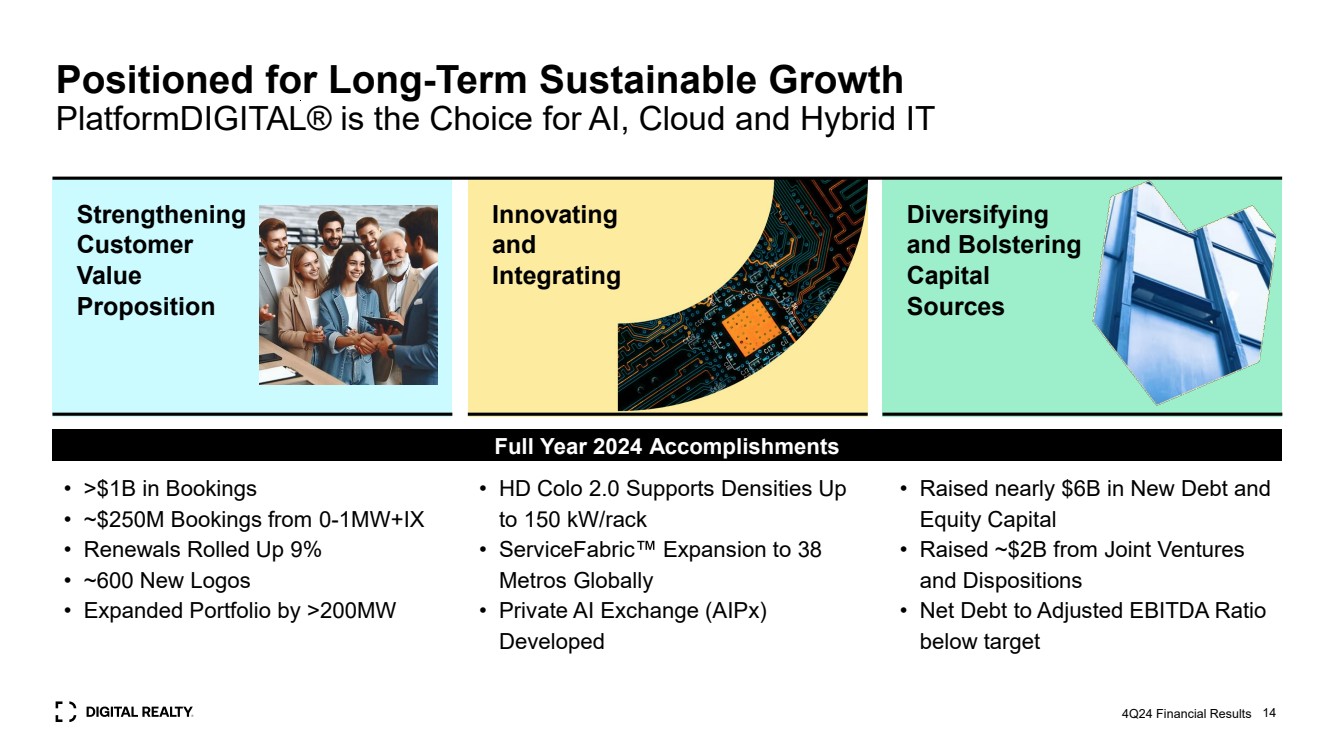
“2024 was a remarkable year for Digital Realty, with record leasing driving impressive growth in our revenue backlog, and providing compelling visibility into our accelerating earnings growth,” said Digital Realty President & Chief Executive Officer Andy Power. “In the fourth quarter, we achieved multiple milestones across our growing 0-1 megawatt plus interconnection segment, eclipsing last quarter’s bookings record and adding a record 166 new customers to the platform, demonstrating the continued success of our global, full spectrum data center strategy.”
Leasing Activity
In the fourth quarter, Digital Realty signed total bookings that are expected to generate $100 million of annualized GAAP rental revenue, including a $62 million contribution from the 0–1 megawatt category and a $15 million contribution from interconnection.
The weighted-average lag between new leases signed during the fourth quarter of 2024 and the contractual commencement date was six months. The backlog of signed-but-not-commenced leases at quarter-end was $797 million of annualized GAAP base rent at Digital Realty’s share.
In addition to new leases signed, Digital Realty also signed renewal leases representing $250 million of annualized cash rental revenue during the quarter. Rental rates on renewal leases signed during the fourth quarter of 2024 increased 4.7% on a cash basis and 9.1% on a GAAP basis.
7
New leases signed during the fourth quarter of 2024 are summarized by region and product as follows:
|
| Annualized GAAP |
| |
| | |
|
|
| | | |
| | Base Rent | | Square Feet | | GAAP Base Rent | | | | GAAP Base Rent | |||
Americas | | (in thousands) | | (in thousands) | | per Square Foot | | Megawatts | | per Kilowatt | |||
0-1 MW | | | $29,612 |
| 90 | | | $329 |
| 8.9 | | | $277 |
> 1 MW | | | 3,978 |
| 20 | | | 197 |
| 2.2 | | | 154 |
Other (1) | | | 409 |
| 7 | | | 58 |
| — | | | — |
Total | | | $33,999 |
| 117 | | | $290 |
| 11.1 | | | $253 |
| | | | | | | | | | | | | |
EMEA (2) | | |
|
|
| | |
|
|
| | |
|
0-1 MW | | | $25,997 |
| 100 | | | $259 |
| 9.4 | | | $232 |
> 1 MW | | | 9,121 |
| 63 | | | 146 |
| 5.6 | | | 136 |
Other (1) | | | 91 |
| 1 | | | 97 |
| — | | | — |
Total | | | $35,209 |
| 164 | | | $215 |
| 15.0 | | | $196 |
| | | | | | | | | | | | | |
Asia Pacific (2) | | |
|
|
| | |
|
|
| | |
|
0-1 MW | | | $6,139 |
| 19 | | | $322 |
| 1.5 | | | $352 |
> 1 MW | | | 9,474 |
| 48 | | | 196 |
| 5.8 | | | 136 |
Other (1) | | | 100 |
| 1 | | | 70 |
| — | | | — |
Total | | | $15,713 |
| 69 | | | $229 |
| 7.3 | | | $179 |
| | | | | | | | | | | | | |
All Regions (2) | | |
|
|
| | |
|
|
| | |
|
0-1 MW | | | $61,748 |
| 209 | | | $295 |
| 19.7 | | | $261 |
> 1 MW | | | 22,573 |
| 131 | | | 172 |
| 13.6 | | | 139 |
Other (1) | | | 599 |
| 9 | | | 64 |
| — | | | — |
Total | | | $84,920 |
| 350 | | | $243 |
| 33.3 | | | $211 |
| | | | | | | | | | | | | |
Interconnection | | | $14,587 |
| N/A | | | N/A |
| N/A | | | N/A |
| | | | | | | | | | | | | |
Grand Total | | | $99,507 |
| 350 | | | $243 |
| 33.3 | | | $211 |
Note: Totals may not foot due to rounding differences.
| (1) | Other includes Powered Base Building® shell capacity as well as storage and office space within fully improved data center facilities. |
| (2) | Based on quarterly average exchange rates during the three months ended December 31, 2024. |
As previously disclosed, during the quarter, Digital Realty closed on the acquisition of a 6.7-acre parcel in Richardson, Texas, adjacent to its existing campus, for approximately $15 million, which can support the development of up to 100 megawatts of incremental IT capacity.
During the quarter, Digital Realty also closed on the following acquisitions:
| ◾ | 156 acres of land in Charlotte, North Carolina for $160 million, which can support up to 400 megawatts of IT capacity |
| ◾ | Three acres of land in Madrid, Spain for approximately €25 million or $26 million, which can support up to 24 megawatts of IT capacity |
During the quarter, Digital Realty closed on the following dispositions:
| ◾ | A facility in San Jose, California for approximately $10 million |
| ◾ | A facility in Trumbull, Connecticut for approximately $10 million |
| ◾ | A facility in Redhill, United Kingdom for approximately £64 million or $80 million |
Also, during the quarter, Digital Realty closed on the sale to Digital Core REIT (SGX: DCRU) of an additional 15.1% interest in a data center located in Frankfurt, Germany for approximately €71 million or $74 million. The transaction valued the Frankfurt facility at €470 million or $508 million (at 100% share). Including two prior investments, Digital Core REIT now owns a 65% interest in this Frankfurt data center.
Further during the quarter, Digital Realty and Blackstone Inc. closed on the second phase of their $7 billion hyperscale data center development joint venture. The second phase includes portions of data center campuses in Frankfurt and Northern Virginia, which will support the growth of existing hyperscale data center capacity in the regions.
8
Balance Sheet
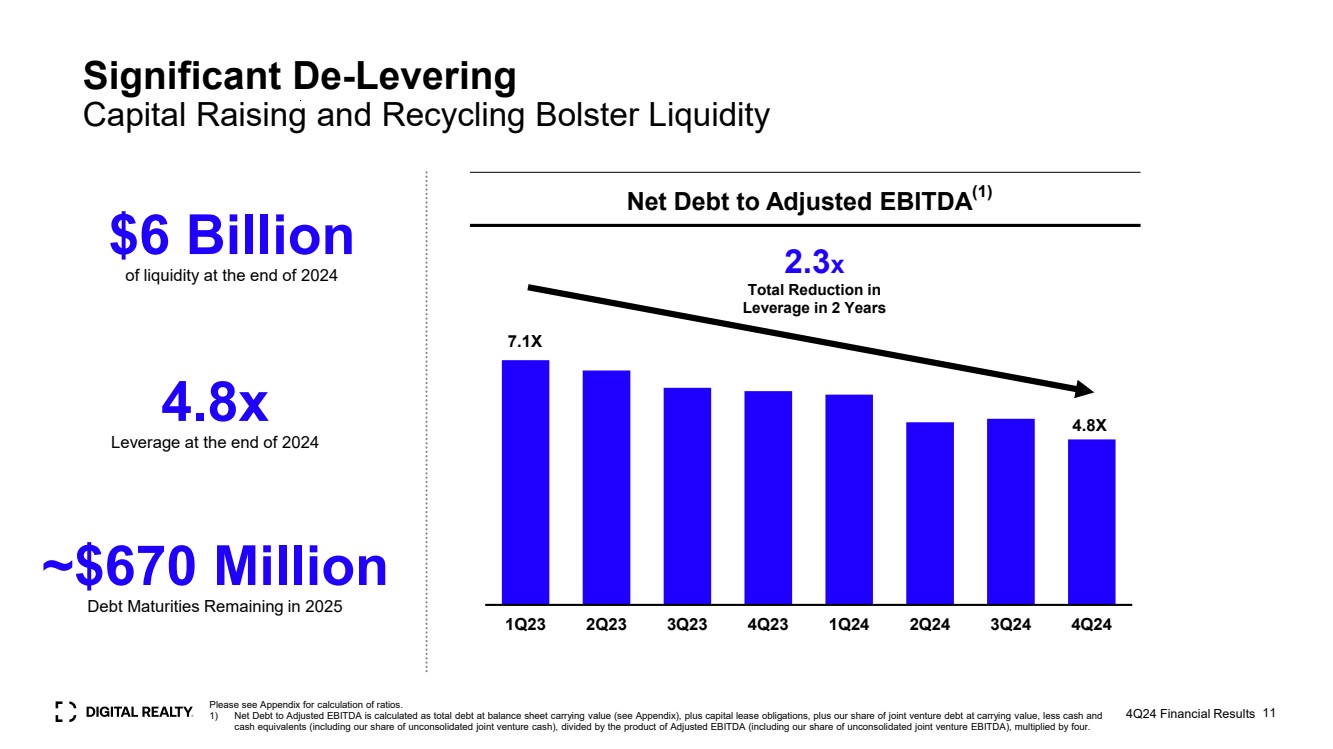
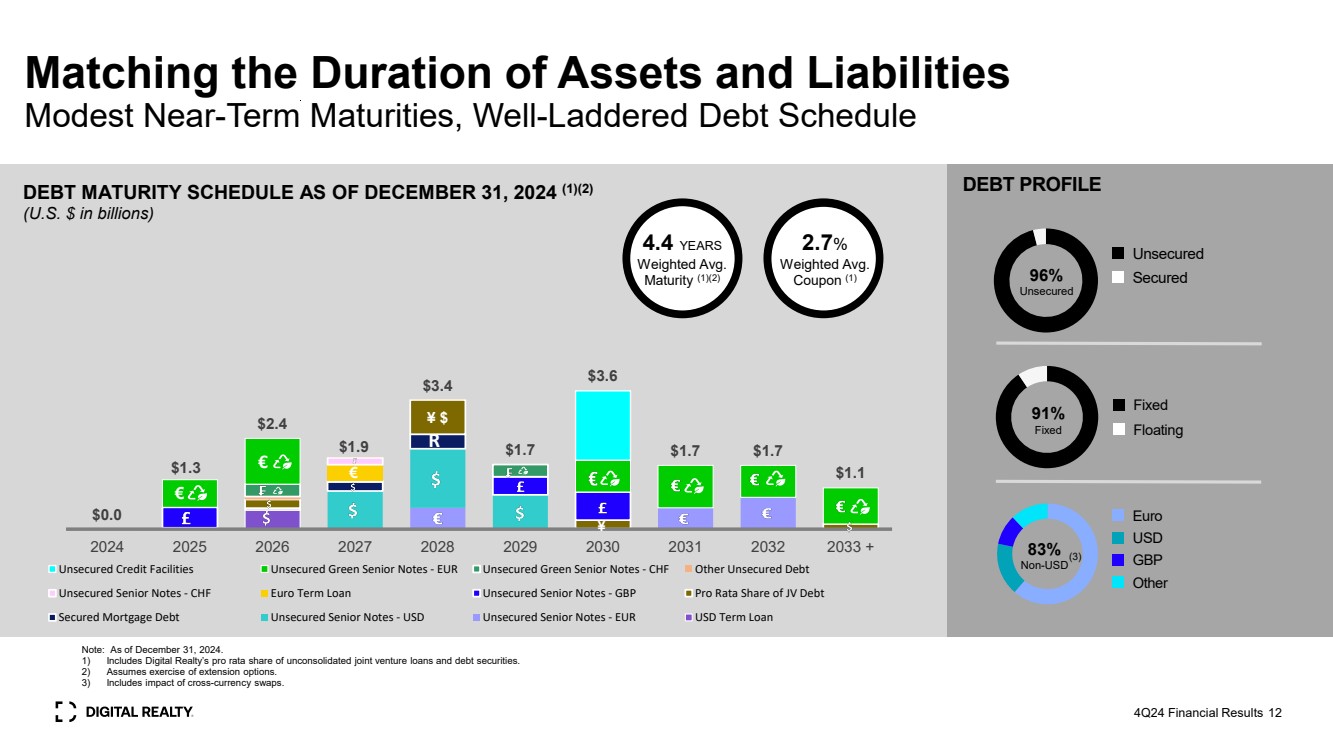
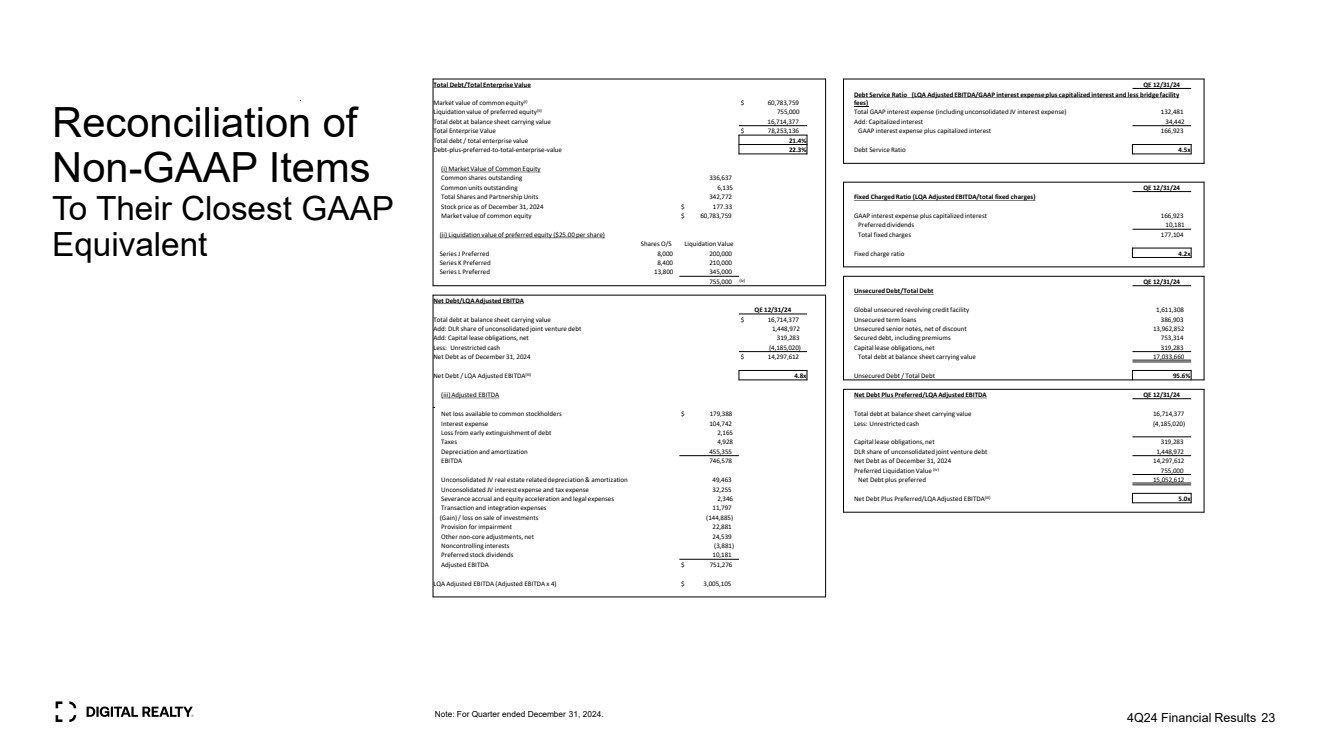
Digital Realty had approximately $16.7 billion of total debt outstanding as of December 31, 2024, comprised of $16.0 billion of unsecured debt and approximately $0.7 billion of secured debt and other. At the end of the fourth quarter of 2024, net debt-to-Adjusted EBITDA was 4.8x, debt-plus-preferred-to-total enterprise value was 22.3% and fixed charge coverage was 4.2x.
Digital Realty completed the following financing transactions during the fourth quarter:
| ◾ | In November, the company issued $1.15 billion of 1.875% exchangeable notes due 2029, for net proceeds of approximately $1.13 billion; |
| ◾ | In November, the company repaid a $500 million term loan; and |
| ◾ | The company also sold 5.0 million shares of common stock under its At-The-Market (ATM) equity issuance program at a weighted average price of $185.63 per share, for net proceeds of approximately $923 million. |
Subsequent to quarter end, the company issued €850 million of 3.875% notes due 2035, for net proceeds of approximately €841 million ($867 million). In January, the company also repaid £400 million ($501 million) of 4.25% senior notes.
9
Digital Realty introduced its 2025 Constant-Currency Core FFO per share outlook of $7.05 - $7.15. The assumptions underlying the outlook are summarized in the following table.
|
| As of |
|
Top-Line and Cost Structure | | February 13, 2025 | |
Total revenue | | $5.800 - $5.900 billion | |
Net non-cash rent adjustments (1) | | ($45 - $50 million) | |
Adjusted EBITDA | | $3.100 - $3.200 billion | |
G&A | | $500 - $510 million | |
| | | |
Internal Growth | | | |
Rental rates on renewal leases | | | |
Cash basis | | 4.0% - 6.0% | |
GAAP basis | | 6.0% - 8.0% | |
Year-end portfolio occupancy | | +100 - 200 bps | |
"Same-Capital" cash NOI growth (2) | | 3.5% - 4.5% | |
| | | |
Foreign Exchange Rates | | | |
U.S. Dollar / Pound Sterling | | $1.20 - $1.25 | |
U.S. Dollar / Euro | | $1.00 - $1.05 | |
| | | |
External Growth | | | |
Dispositions / Joint Venture Capital | | | |
Dollar volume | | $500 - $1,000 million | |
Cap rate | | 0.0% - 10.0% | |
Development | | | |
CapEx (Net of Partner Contributions) (3) | | $3,000 - $3,500 million | |
Average stabilized yields | | 10.0%+ | |
Enhancements and other non-recurring CapEx (4) | | $30 - $35 million | |
Recurring CapEx + capitalized leasing costs (5) | | $320 - $335 million | |
| | | |
Balance Sheet | | | |
Long-term debt issuance | | | |
Dollar amount | | $900 - $1,500 million | |
Pricing | | 5.0% - 5.5% | |
| | | |
Net income per diluted share | | $2.10 - $2.20 | |
Real estate depreciation and (gain) / loss on sale | | $4.50 - $4.50 | |
Funds From Operations / share (NAREIT-Defined) | | $6.60 - $6.70 | |
Non-core expenses and revenue streams | | $0.40 - $0.40 | |
Core Funds From Operations / share | | $7.00 - $7.10 | |
Foreign currency translation adjustments | | $0.05 - $0.05 | |
Constant-Currency Core Funds From Operations / share | | $7.05 - $7.15 | |
| (1) | Net non-cash rent adjustments represent the sum of straight-line rental revenue and straight-line rental expense, as well as the amortization of above- and below-market leases (i.e., ASC 805 adjustments). |
| (2) | The “Same-Capital” pool includes properties owned as of December 31, 2023 with less than 5% of total rentable square feet under development. It excludes properties that were undergoing, or were expected to undergo, development activities in 2024-2025, properties classified as held for sale, and properties sold or contributed to joint ventures for all periods presented. The 2025 “Same-Capital” cash NOI growth outlook is presented on a constant currency basis. |
| (3) | Excludes land acquisitions and includes Digital Realty’s share of JV contributions. Figure is net of JV partner contributions. |
| (4) | Other non-recurring CapEx represents costs incurred to enhance the capacity or marketability of operating properties, such as network fiber initiatives and software development costs. |
| (5) | Recurring CapEx represents non-incremental improvements required to maintain current revenues, including second-generation tenant improvements and leasing commissions. |
Note: The company does not provide a reconciliation for non-GAAP estimates on a forward-looking basis, where it is unable to provide a meaningful or accurate calculation or estimation of reconciling items, and the information is not available without unreasonable effort. Please see Non-GAAP Financial Measures in this document for further discussion.
10
Non-GAAP Financial Measures
This document contains non-GAAP financial measures, including FFO, Core FFO, Constant Currency Core FFO, Adjusted FFO, Net Operating Income (NOI), “Same-Capital” Cash NOI and Adjusted EBITDA. A reconciliation from U.S. GAAP net income available to common stockholders to FFO, a reconciliation from FFO to Core FFO, a reconciliation from Core FFO to Adjusted FFO, reconciliation from NOI to Cash NOI, and definitions of FFO, Core FFO, Constant Currency Core FFO, Adjusted FFO, NOI and “Same-Capital” Cash NOI are included as an attachment to this document. A reconciliation from U.S. GAAP net income available to common stockholders to Adjusted EBITDA, a definition of Adjusted EBITDA and definitions of net debt-to-Adjusted EBITDA, debt-plus-preferred-to-total enterprise value, cash NOI, and fixed charge coverage ratio are included as an attachment to this document.
The company does not provide a reconciliation for non-GAAP estimates on a forward-looking basis, where it is unable to provide a meaningful or accurate calculation or estimation of reconciling items and the information is not available without unreasonable effort. This is due to the inherent difficulty of forecasting the timing and/or amount of various items that would impact net income attributable to common stockholders per diluted share, which is the most directly comparable forward-looking GAAP financial measure. This includes, for example, external growth factors, such as dispositions, and balance sheet items such as debt issuances, that have not yet occurred, are out of the company's control and/or cannot be reasonably predicted. For the same reasons, the company is unable to address the probable significance of the unavailable information. Forward-looking non-GAAP financial measures provided without the most directly comparable GAAP financial measures may vary materially from the corresponding GAAP financial measures.
Investor Conference Call
Prior to Digital Realty’s investor conference call at 5:00 p.m. ET / 4:00 p.m. CT on February 13, 2025, a presentation will be posted to the Investors section of the company’s website at https://investor.digitalrealty.com. The presentation is designed to accompany the discussion of the company’s fourth quarter 2024 financial results and operating performance. The conference call will feature President & Chief Executive Officer Andy Power and Chief Financial Officer Matt Mercier.
To participate in the live call, investors are invited to dial +1 (888) 317-6003 (for domestic callers) or +1 (412) 317-6061 (for international callers) and reference the conference ID# 5600611 at least five minutes prior to start time. A live webcast of the call will be available via the Investors section of Digital Realty’s website at https://investor.digitalrealty.com.
Telephone and webcast replays will be available after the call until March 13, 2025. The telephone replay can be accessed by dialing +1 (877) 344-7529 (for domestic callers) or +1 (412) 317-0088 (for international callers) and providing the conference ID# 3368293. The webcast replay can be accessed on Digital Realty’s website.
About Digital Realty
Digital Realty brings companies and data together by delivering the full spectrum of data center, colocation, and interconnection solutions. PlatformDIGITAL®, the company’s global data center platform, provides customers with a secure data meeting place and a proven Pervasive Datacenter Architecture (PDx®) solution methodology for powering innovation and efficiently managing Data Gravity challenges. Digital Realty gives its customers access to the connected data communities that matter to them with a global data center footprint of 300+ facilities in 50+ metros across 25+ countries on six continents. To learn more about Digital Realty, please visit digitalrealty.com or follow us on LinkedIn and X.
Contact Information
Matt Mercier
Chief Financial Officer
Digital Realty
(415) 874-2803
Jordan Sadler / Jim Huseby
Investor Relations
Digital Realty
(415) 275-5344
11
| Financial Supplement | |
|---|---|---|
Unaudited and in Thousands, Except Per Share Data | Fourth Quarter 2024 |
| | | Three Months Ended | | | Twelve Months Ended | ||||||||||||||||
|
| | 31-Dec-24 |
| | 30-Sep-24 |
| | 30-Jun-24 |
| | 31-Mar-24 |
| | 31-Dec-23 | | | | 31-Dec-24 |
| | 31-Dec-23 |
Rental revenues | | | $958,892 | | | $956,351 | | | $912,994 | | | $894,409 | | | $885,694 | | | | $3,722,646 | | | $3,512,926 |
Tenant reimbursements - Utilities | | | 302,664 | | | 305,097 | | | 274,505 | | | 276,357 | | | 316,634 | | | | 1,158,623 | | | 1,299,676 |
Tenant reimbursements - Other | | | 38,591 | | | 39,624 | | | 41,964 | | | 38,434 | | | 46,418 | | | | 158,612 | | | 197,636 |
Interconnection & other | | | 112,360 | | | 112,655 | | | 109,505 | | | 108,071 | | | 106,413 | | | | 442,591 | | | 419,934 |
Fee income | | | 23,316 | | | 12,907 | | | 15,656 | | | 13,010 | | | 14,330 | | | | 64,888 | | | 44,926 |
Other | | | 40 | | | 4,581 | | | 2,125 | | | 862 | | | 144 | | | | 7,608 | | | 1,963 |
Total Operating Revenues | | | $1,435,862 | | | $1,431,214 | | | $1,356,749 | | | $1,331,143 | | | $1,369,633 | | | | $5,554,968 | | | $5,477,061 |
| | | | | | | | | | | | | | | | | | | | | | |
Utilities | | | $337,534 | | | $356,063 | | | $315,248 | | | $324,571 | | | $366,083 | | | | $1,333,416 | | | $1,471,836 |
Rental property operating | | | 273,104 | | | 249,796 | | | 237,653 | | | 224,369 | | | 237,118 | | | | 984,921 | | | 909,830 |
Property taxes | | | 46,044 | | | 45,633 | | | 49,620 | | | 41,156 | | | 40,161 | | | | 182,453 | | | 199,581 |
Insurance | | | 6,007 | | | 4,869 | | | 4,755 | | | 2,694 | | | 3,794 | | | | 18,325 | | | 16,823 |
Depreciation & amortization | | | 455,355 | | | 459,997 | | | 425,343 | | | 431,102 | | | 420,475 | | | | 1,771,797 | | | 1,694,859 |
General & administration | | | 124,470 | | | 115,120 | | | 119,511 | | | 114,419 | | | 109,235 | | | | 473,521 | | | 431,004 |
Severance, equity acceleration and legal expenses | | | 2,346 | | | 2,481 | | | 884 | | | 791 | | | 7,565 | | | | 6,502 | | | 18,054 |
Transaction and integration expenses | | | 11,797 | | | 24,194 | | | 26,072 | | | 31,839 | | | 40,226 | | | | 93,902 | | | 84,722 |
Provision for impairment | | | 22,881 | | | — | | | 168,303 | | | — | | | 5,363 | | | | 191,184 | | | 118,363 |
Other expenses | | | 12,002 | | | 4,774 | | | (529) | | | 10,836 | | | 5,580 | | | | 27,083 | | | 7,529 |
Total Operating Expenses | | | $1,291,540 | | | $1,262,928 | | | $1,346,860 | | | $1,181,776 | | | $1,235,598 | | | | $5,083,104 | | | $4,952,600 |
| | | | | | | | | | | | | | | | | | | | | | |
Operating Income | | | $144,322 | | | $168,286 | | | $9,889 | | | $149,367 | | | $134,035 | | | | $471,864 | | | $524,461 |
| | | | | | | | | | | | | | | | | | | | | | |
Equity in earnings / (loss) of unconsolidated joint ventures | | | (36,201) | | | (26,486) | | | (41,443) | | | (16,008) | | | (29,955) | | | | (120,138) | | | (29,791) |
Gain / (loss) on sale of investments | | | 144,885 | | | (556) | | | 173,709 | | | 277,787 | | | (103) | | | | 595,825 | | | 900,531 |
Interest and other income / (expense), net | | | 44,517 | | | 37,756 | | | 62,261 | | | 9,709 | | | 50,269 | | | | 154,243 | | | 68,431 |
Interest (expense) | | | (104,742) | | | (123,803) | | | (114,756) | | | (109,535) | | | (113,638) | | | | (452,836) | | | (437,741) |
Income tax benefit / (expense) | | | (4,928) | | | (12,427) | | | (14,992) | | | (22,413) | | | (20,724) | | | | (54,760) | | | (75,579) |
Loss on debt extinguishment and modifications | | | (2,165) | | | (2,636) | | | — | | | (1,070) | | | — | | | | (5,871) | | | — |
Net Income | | | $185,688 | | | $40,134 | | | $74,668 | | | $287,837 | | | $19,884 | | | | $588,327 | | | $950,311 |
| | | | | | | | | | | | | | | | | | | | | | |
Net (income) / loss attributable to noncontrolling interests | | | 3,881 | | | 11,059 | | | 5,552 | | | (6,329) | | | 8,419 | | | | 14,163 | | | (1,474) |
Net Income Attributable to Digital Realty Trust, Inc. | | | $189,569 | | | $51,193 | | | $80,220 | | | $281,508 | | | $28,304 | | | | $602,490 | | | $948,838 |
| | | | | | | | | | | | | | | | | | | | | | |
Preferred stock dividends | | | (10,181) | | | (10,181) | | | (10,181) | | | (10,181) | | | (10,181) | | | | (40,725) | | | (40,725) |
Net Income / (Loss) Available to Common Stockholders | | | $179,388 | | | $41,012 | | | $70,039 | | | $271,327 | | | $18,122 | | | | $561,766 | | | $908,113 |
| | | | | | | | | | | | | | | | | | | | | | |
Weighted-average shares outstanding - basic | | | 333,376 | | | 327,977 | | | 319,537 | | | 312,292 | | | 305,781 | | | | 323,336 | | | 298,603 |
Weighted-average shares outstanding - diluted | | | 340,690 | | | 336,249 | | | 327,946 | | | 320,798 | | | 314,995 | | | | 331,547 | | | 309,065 |
Weighted-average fully diluted shares and units | | | 346,756 | | | 342,374 | | | 334,186 | | | 326,975 | | | 321,173 | | | | 337,697 | | | 315,113 |
| | | | | | | | | | | | | | | | | | | | | | |
Net income / (loss) per share - basic | | | $0.54 | | | $0.13 | | | $0.22 | | | $0.87 | | | $0.06 | | | | $1.74 | | | $3.04 |
Net income / (loss) per share - diluted | | | $0.51 | | | $0.09 | | | $0.20 | | | $0.82 | | | $0.03 | | | | $1.61 | | | $2.88 |
12
| Financial Supplement | |
|---|---|---|
Unaudited and in Thousands, Except Per Share Data | Fourth Quarter 2024 |
| | Three Months Ended | | | Twelve Months Ended | |||||||||||||||||
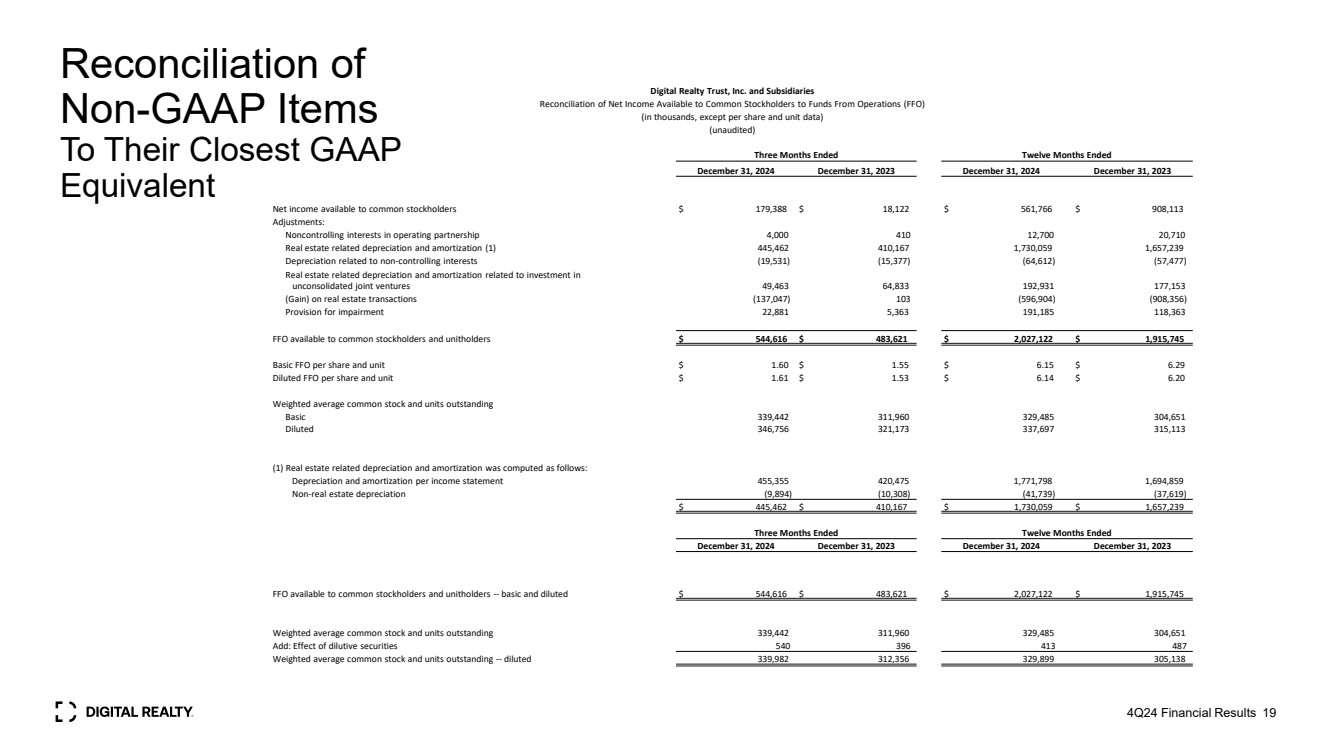
Reconciliation of Net Income to Funds From Operations (FFO) | | | 31-Dec-24 | | | 30-Sep-24 | | | 30-Jun-24 | | | 31-Mar-24 | | | 31-Dec-23 | | | | 31-Dec-24 | | | 31-Dec-23 |
| | | | | | | | | | | | | | | | | | | | | | |
Net Income / (Loss) Available to Common Stockholders | | | $179,388 | | | $41,012 | | | $70,039 | | | $271,327 | | | $18,122 | | | | $561,766 | | | $908,113 |
Adjustments: | | | | | | | | | | | | | | | | | | | | | | |
Non-controlling interest in operating partnership | | | 4,000 | | | 1,000 | | | 1,500 | | | 6,200 | | | 410 | | | | 12,700 | | | 20,710 |
Real estate related depreciation & amortization (1) | | | 445,462 | | | 449,086 | | | 414,920 | | | 420,591 | | | 410,167 | | | | 1,730,059 | | | 1,657,239 |
Reconciling items related to non-controlling interests | | | (19,531) | | | (19,746) | | | (17,317) | | | (8,017) | | | (15,377) | | | | (64,612) | | | (57,477) |
Unconsolidated JV real estate related depreciation & amortization | | | 49,463 | | | 48,474 | | | 47,117 | | | 47,877 | | | 64,833 | | | | 192,931 | | | 177,153 |
(Gain) / loss on real estate transactions | | | (137,047) | | | 556 | | | (173,709) | | | (286,704) | | | 103 | | | | (596,904) | | | (908,356) |
Provision for impairment | | | 22,881 | | | — | | | 168,303 | | | — | | | 5,363 | | | | 191,185 | | | 118,363 |
Funds From Operations | | | $544,616 | | | $520,382 | | | $510,852 | | | $451,273 | | | $483,621 | | | | $2,027,122 | | | $1,915,745 |
| | | | | | | | | | | | | | | | | | | | | | |
Weighted-average shares and units outstanding - basic | | | 339,442 | | | 334,103 | | | 325,777 | | | 318,469 | | | 311,960 | | | | 329,485 | | | 304,651 |
Weighted-average shares and units outstanding - diluted (2) (3) | | | 346,756 | | | 342,374 | | | 334,186 | | | 326,975 | | | 321,173 | | | | 337,697 | | | 315,113 |
| | | | | | | | | | | | | | | | | | | | | | |
Funds From Operations per share - basic | | | $1.60 | | | $1.56 | | | $1.57 | | | $1.42 | | | $1.55 | | | | $6.15 | | | $6.29 |
| | | | | | | | | | | | | | | | | | | | | | |
Funds From Operations per share - diluted (2) (3) | | | $1.61 | | | $1.55 | | | $1.57 | | | $1.41 | | | $1.53 | | | | $6.14 | | | $6.20 |
| | Three Months Ended | | | Twelve Months Ended | |||||||||||||||||
Reconciliation of FFO to Core FFO | | | 31-Dec-24 | | | 30-Sep-24 | | | 30-Jun-24 | | | 31-Mar-24 | | | 31-Dec-23 | | | | 31-Dec-24 | | | 31-Dec-23 |
| | | | | | | | | | | | | | | | | | | | | | |
Funds From Operations | | | $544,616 | | | $520,382 | | | $510,852 | | | $451,273 | | | $483,621 | | | | $2,027,122 | | | $1,915,745 |
Other non-core revenue adjustments (4) | | | 4,537 | | | (4,583) | | | (33,818) | | | 3,525 | | | (146) | | | | (30,339) | | | 26,393 |
Transaction and integration expenses | | | 11,797 | | | 24,194 | | | 26,072 | | | 31,839 | | | 40,226 | | | | 93,902 | | | 84,722 |
Loss on debt extinguishment and modifications | | | 2,165 | | | 2,636 | | | — | | | 1,070 | | | — | | | | 5,871 | | | — |
Severance, equity acceleration and legal expenses (5) | | | 2,346 | | | 2,481 | | | 884 | | | 791 | | | 7,565 | | | | 6,502 | | | 18,054 |
(Gain) / Loss on FX and derivatives revaluation | | | 7,127 | | | 1,513 | | | 32,222 | | | 33,602 | | | (24,804) | | | | 74,464 | | | (39,000) |
Other non-core expense adjustments (6) | | | 14,229 | | | 11,120 | | | 2,271 | | | 10,052 | | | 1,956 | | | | 37,671 | | | 3,905 |
Core Funds From Operations | | | $586,816 | | | $557,744 | | | $538,482 | | | $532,153 | | | $508,417 | | | | $2,215,194 | | | $2,009,820 |
| | | | | | | | | | | | | | | | | | | | | | |
Weighted-average shares and units outstanding - diluted (2) (3) | | | 339,982 | | | 334,476 | | | 326,181 | | | 319,138 | | | 312,356 | | | | 329,899 | | | 305,138 |
| | | | | | | | | | | | | | | | | | | | | | |
Core Funds From Operations per share - diluted (2) | | | $1.73 | | | $1.67 | | | $1.65 | | | $1.67 | | | $1.63 | | | | $6.71 | | | $6.59 |
(1) Real Estate Related Depreciation & Amortization | | Three Months Ended | | | Twelve Months Ended | |||||||||||||||||
| | | 31-Dec-24 | | | 30-Sep-24 | | | 30-Jun-24 | | | 31-Mar-24 | | | 31-Dec-23 | | | | 31-Dec-24 | | | 31-Dec-23 |
| | | | | | | | | | | | | | | | | | | | | | |
Depreciation & amortization per income statement | | | $455,355 | | | $459,997 | | | $425,343 | | | $431,102 | | | $420,475 | | | | $1,771,798 | | | $1,694,859 |
Non-real estate depreciation | | | (9,894) | | | (10,911) | | | (10,424) | | | (10,511) | | | (10,308) | | | | (41,739) | | | (37,619) |
Real Estate Related Depreciation & Amortization | | | $445,462 | | | $449,086 | | | $414,920 | | | $420,591 | | | $410,167 | | | | $1,730,059 | | | $1,657,239 |
| (2) | Certain of Teraco's minority indirect shareholders have the right to put their shares in an upstream parent company of Teraco to Digital Realty in exchange for cash or the equivalent value of shares of Digital Realty common stock, or a combination thereof. US GAAP requires Digital Realty to assume the put right is settled in shares for purposes of calculating diluted EPS. This same approach was utilized to calculate FFO/share. The potential future dilutive impact associated with this put right will be excluded from Core FFO and AFFO until settlement occurs – causing diluted share count to be higher for FFO than for Core FFO and AFFO. When calculating diluted FFO, Teraco related minority interest is added back to the FFO numerator as the denominator assumes all shares have been put back to Digital Realty. |
| | Three Months Ended | | | Twelve Months Ended | |||||||||||||||||
| | | 31-Dec-24 | | | 30-Sep-24 | | | 30-Jun-24 | | | 31-Mar-24 | | | 31-Dec-23 | | | | 31-Dec-24 | | | 31-Dec-23 |
Teraco noncontrolling share of FFO | | | $14,905 | | | $9,828 | | | $12,453 | | | $9,768 | | | $7,135 | | | | $46,954 | | | $39,386 |
Teraco related minority interest | | | $14,905 | | | $9,828 | | | $12,453 | | | $9,768 | | | $7,135 | | | | $46,954 | | | $39,386 |
| (4) | Includes deferred rent adjustments related to a customer bankruptcy, joint venture development fees included in gains, lease termination fees and gain on sale of equity investment included in other income. |
| (5) | Relates to severance and other charges related to the departure of company executives and integration-related severance. |
| (6) | Includes write-offs associated with bankrupt or terminated customers, non-recurring legal and insurance expenses and adjustments to reflect our proportionate share of transaction costs associated with noncontrolling interests. |
13
| Financial Supplement | |
|---|---|---|
Unaudited and in Thousands, Except Per Share Data | Fourth Quarter 2024 |
| | Three Months Ended | | | Twelve Months Ended | |||||||||||||||||
Reconciliation of Core FFO to AFFO | | | 31-Dec-24 | | | 30-Sep-24 | | | 30-Jun-24 | | | 31-Mar-24 | | | 31-Dec-23 | | | | 31-Dec-24 | | | 31-Dec-23 |
| | | | | | | | | | | | | | | | | | | | | | |
Core FFO available to common stockholders and unitholders | | | $586,816 | | | $557,744 | | | $538,482 | | | $532,153 | | | $508,417 | | | | $2,215,194 | | | $2,009,820 |
Adjustments: | | | | | | | | | | | | | | | | | | | | | | |
Non-real estate depreciation | | | 9,894 | | | 10,911 | | | 10,424 | | | 10,511 | | | 10,308 | | | | 41,739 | | | 37,619 |
Amortization of deferred financing costs | | | 5,697 | | | 4,853 | | | 5,072 | | | 5,576 | | | 5,744 | | | | 21,198 | | | 21,575 |
Amortization of debt discount/premium | | | 1,324 | | | 1,329 | | | 1,321 | | | 1,832 | | | 973 | | | | 5,805 | | | 4,973 |
Non-cash stock-based compensation expense | | | 13,386 | | | 15,026 | | | 14,464 | | | 12,592 | | | 9,226 | | | | 55,468 | | | 50,238 |
Straight-line rental revenue | | | (18,242) | | | (17,581) | | | 334 | | | 9,976 | | | (21,992) | | | | (25,513) | | | (68,417) |
Straight-line rental expense | | | (136) | | | 1,690 | | | 782 | | | 1,111 | | | (4,999) | | | | 3,447 | | | (3,567) |
Above- and below-market rent amortization | | | (269) | | | (742) | | | (1,691) | | | (854) | | | (856) | | | | (3,555) | | | (4,404) |
Deferred tax (benefit) / expense | | | (15,048) | | | (9,366) | | | (9,982) | | | (3,437) | | | 33,448 | | | | (37,834) | | | 16,452 |
Leasing compensation & internal lease commissions | | | 10,505 | | | 10,918 | | | 10,519 | | | 13,291 | | | 9,848 | | | | 45,233 | | | 45,040 |
Recurring capital expenditures (1) | | | (130,245) | | | (67,308) | | | (60,483) | | | (47,676) | | | (142,808) | | | | (305,712) | | | (327,022) |
| | | | | | | | | | | | | | | | | | | | | | |
AFFO available to common stockholders and unitholders (2) | | | $463,682 | | | $507,474 | | | $509,241 | | | $535,073 | | | $407,306 | | | | $2,015,471 | | | $1,782,308 |
| | | | | | | | | | | | | | | | | | | | | | |
Weighted-average shares and units outstanding - basic | | | 339,442 | | | 334,103 | | | 325,777 | | | 318,469 | | | 311,960 | | | | 329,485 | | | 304,651 |
Weighted-average shares and units outstanding - diluted (3) | | | 339,982 | | | 334,476 | | | 326,181 | | | 319,138 | | | 312,356 | | | | 329,899 | | | 305,138 |
| | | | | | | | | | | | | | | | | | | | | | |
AFFO per share - diluted (3) | | | $1.36 | | | $1.52 | | | $1.56 | | | $1.68 | | | $1.30 | | | | $6.11 | | | $5.84 |
| | | | | | | | | | | | | | | | | | | | | | |
Dividends per share and common unit | | | $1.22 | | | $1.22 | | | $1.22 | | | $1.22 | | | $1.22 | | | | $4.88 | | | $4.88 |
| | | | | | | | | | | | | | | | | | | | | | |
Diluted AFFO Payout Ratio | | | 89.5% | | | 80.4% | | | 78.1% | | | 72.8% | | | 93.6% | | | | 79.9% | | | 83.5% |
| | Three Months Ended | | | Twelve Months Ended | |||||||||||||||||
Share Count Detail | | | 31-Dec-24 | | | 30-Sep-24 | | | 30-Jun-24 | | | 31-Mar-24 | | | 31-Dec-23 | | | | 31-Dec-24 | | | 31-Dec-23 |
| | | | | | | | | | | | | | | | | | | | | | |
Weighted Average Common Stock and Units Outstanding | | | 339,442 | | | 334,103 | | | 325,777 | | | 318,469 | | | 311,960 | | | | 329,485 | | | 304,651 |
Add: Effect of dilutive securities | | | 540 | | | 373 | | | 404 | | | 669 | | | 396 | | | | 413 | | | 487 |
Weighted Avg. Common Stock and Units Outstanding - diluted | | | 339,982 | | | 334,476 | | | 326,181 | | | 319,138 | | | 312,356 | | | | 329,899 | | | 305,138 |
| (1) | Recurring capital expenditures represent non-incremental building improvements required to maintain current revenues, including second-generation tenant improvements and external leasing commissions. Recurring capital expenditures do not include acquisition costs contemplated when underwriting the purchase of a building, costs which are incurred to bring a building up to Digital Realty’s operating standards, or internal leasing commissions. |
| (2) | For a definition and discussion of AFFO, see the Definitions section. For a reconciliation of net income available to common stockholders to FFO and Core FFO, see above. |
| (3) | For all periods presented, we have excluded the effect of dilutive series J, series K and series L preferred stock, as applicable, that may be converted into common stock upon the occurrence of specified change in control transactions as described in the articles supplementary governing the series J, series K and series L preferred stock, as applicable, which we consider highly improbable. See above for calculations of FFO and for calculations of weighted average common stock and units outstanding. |
14
| Financial Supplement | |
|---|---|---|
Unaudited and in Thousands, Except Per Share Data | Fourth Quarter 2024 |
| | 31-Dec-24 | | 30-Sep-24 | | 30-Jun-24 | | 31-Mar-24 | | 31-Dec-23 | |||||
Assets | | | | | | | | | | | | | | | |
Investments in real estate: | | | | | | | | | | | | | | | |
Real estate | | $27,558,993 | | | $28,808,770 | | | $27,470,635 | | | $27,122,796 | | | $27,306,369 | |
Construction in progress | | 5,164,334 | | | 5,175,054 | | | 4,676,012 | | | 4,496,840 | | | 4,635,215 | |
Land held for future development | | 38,785 | | | 23,392 | | | 93,938 | | | 114,240 | | | 118,190 | |
Investments in Real Estate | | $32,762,112 | | | $34,007,216 | | | $32,240,584 | | | $31,733,877 | | | $32,059,773 | |
Accumulated depreciation and amortization | | (8,641,331) | | | (8,777,002) | | | (8,303,070) | | | (7,976,093) | | | (7,823,685) | |
Net Investments in Properties | | $24,120,781 | | | $25,230,214 | | | $23,937,514 | | | $23,757,784 | | | $24,236,089 | |
Investment in unconsolidated joint ventures | | 2,639,800 | | | 2,456,448 | | | 2,332,698 | | | 2,365,821 | | | 2,295,889 | |
Net Investments in Real Estate | | $26,760,582 | | | $27,686,662 | | | $26,270,212 | | | $26,123,605 | | | $26,531,977 | |
| | | | | | | | | | | | | | | |
Operating lease right-of-use assets, net | | $1,178,853 | | | $1,228,507 | | | $1,211,003 | | | $1,233,410 | | | $1,414,256 | |
Cash and cash equivalents | | 3,870,891 | | | 2,175,605 | | | 2,282,062 | | | 1,193,784 | | | 1,625,495 | |
Accounts and other receivables, net (1) | | 1,257,464 | | | 1,274,460 | | | 1,222,403 | | | 1,217,276 | | | 1,278,110 | |
Deferred rent, net | | 642,456 | | | 641,778 | | | 613,749 | | | 611,670 | | | 624,427 | |
Goodwill | | 8,929,431 | | | 9,395,233 | | | 9,128,811 | | | 9,105,026 | | | 9,239,871 | |
Customer relationship value, deferred leasing costs & other intangibles, net | | 2,178,054 | | | 2,367,467 | | | 2,315,143 | | | 2,359,380 | | | 2,500,237 | |
Assets held for sale | | | — | | | — | | | — | | | 287,064 | | | 478,503 |
Other assets | | 465,885 | | | 525,679 | | | 563,500 | | | 501,875 | | | 420,382 | |
Total Assets | | $45,283,616 | | | $45,295,392 | | | $43,606,883 | | | $42,633,089 | | | $44,113,257 | |
| | | | | | | | | | | | | | | |
Liabilities and Equity | | | | | | | | | | | | | | | |
Global unsecured revolving credit facilities, net | | $1,611,308 | | | $1,786,921 | | | $1,848,167 | | | $1,901,126 | | | $1,812,287 | |
Unsecured term loans, net | | 386,903 | | | 913,733 | | | 1,297,893 | | | 1,303,263 | | | 1,560,305 | |
Unsecured senior notes, net of discount | | 13,962,852 | | | 13,528,061 | | | 12,507,551 | | | 13,190,202 | | | 13,422,342 | |
Secured and other debt, net of discount | | 753,314 | | | 757,831 | | | 686,135 | | | 625,750 | | | 630,973 | |
Operating lease liabilities | | 1,294,219 | | | 1,343,903 | | | 1,336,839 | | | 1,357,751 | | | 1,542,094 | |
Accounts payable and other accrued liabilities | | 2,056,215 | | | 2,140,764 | | | 1,973,798 | | | 1,870,344 | | | 2,168,983 | |
Deferred tax liabilities, net | | 1,084,562 | | | 1,223,771 | | | 1,132,090 | | | 1,121,224 | | | 1,151,096 | |
Accrued dividends and distributions | | 418,661 | | | — | | | — | | | — | | | 387,988 | |
Security deposits and prepaid rents | | 539,802 | | | 423,797 | | | 416,705 | | | 413,225 | | | 401,867 | |
Obligations associated with assets held for sale | | | — | | | — | | | — | | | 9,981 | | | 39,001 |
Total Liabilities | | $22,107,836 | | | $22,118,781 | | | $21,199,178 | | | $21,792,866 | | | $23,116,936 | |
| | | | | | | | | | | | | | | |
Redeemable non-controlling interests | | 1,433,185 | | | 1,465,636 | | | 1,399,889 | | | 1,350,736 | | | 1,394,814 | |
| | | | | | | | | | | | | | | |
Equity | | | | | | | | | | | | | | | |
Preferred Stock: $0.01 par value per share, 110,000 shares authorized: | | | | | | | | | | | | | | | |
Series J Cumulative Redeemable Preferred Stock (2) | | $193,540 | | | $193,540 | | | $193,540 | | | $193,540 | | | $193,540 | |
Series K Cumulative Redeemable Preferred Stock (3) | | 203,264 | | | 203,264 | | | 203,264 | | | 203,264 | | | 203,264 | |
Series L Cumulative Redeemable Preferred Stock (4) | | 334,886 | | | 334,886 | | | 334,886 | | | 334,886 | | | 334,886 | |
Common Stock: $0.01 par value per share, 502,000 shares authorized (5) | | 3,337 | | | 3,285 | | | 3,231 | | | 3,097 | | | 3,088 | |
Additional paid-in capital | | 28,079,738 | | | 27,229,143 | | | 26,388,393 | | | 24,508,683 | | | 24,396,797 | |
Dividends in excess of earnings | | (6,292,085) | | | (6,060,642) | | | (5,701,096) | | | (5,373,529) | | | (5,262,648) | |
Accumulated other comprehensive (loss), net | | (1,182,283) | | | (657,364) | | | (884,715) | | | (850,091) | | | (751,393) | |
Total Stockholders' Equity | | $21,340,397 | | | $21,246,112 | | | $20,537,503 | | | $19,019,850 | | | $19,117,535 | |
| | | | | | | | | | | | | | | |
Noncontrolling Interests | | | | | | | | | | | | | | | |
Noncontrolling interest in operating partnership | | $396,099 | | | $427,930 | | | $434,253 | | | $438,422 | | | $438,081 | |
Noncontrolling interest in consolidated joint ventures | | 6,099 | | | 36,933 | | | 36,060 | | | 31,215 | | | 45,892 | |
| | | | | | | | | | | | | | | |
Total Noncontrolling Interests | | $402,198 | | | $464,863 | | | $470,313 | | | $469,637 | | | $483,972 | |
| | | | | | | | | | | | | | | |
Total Equity | | $21,742,595 | | | $21,710,975 | | | $21,007,816 | | | $19,489,487 | | | $19,601,507 | |
| | | | | | | | | | | | | | | |
Total Liabilities and Equity | | $45,283,616 | | | $45,295,392 | | | $43,606,883 | | | $42,633,089 | | | $44,113,257 | |
| (1) | Net of allowance for doubtful accounts of $59,224 and $41,204 as of December 31, 2024 and December 31, 2023, respectively. |
| (2) | Series J Cumulative Redeemable Preferred Stock, 5.250%, $200,000 liquidation preference ($25.00 per share), 8,000 shares issued and outstanding as of December 31, 2024 and December 31, 2023. |
| (3) | Series K Cumulative Redeemable Preferred Stock, 5.850%, $210,000 liquidation preference ($25.00 per share), 8,400 shares issued and outstanding as of December 31, 2024 and December 31, 2023. |
| (4) | Series L Cumulative Redeemable Preferred Stock, 5.200%, $345,000 liquidation preference ($25.00 per share), 13,800 shares issued and outstanding as of December 31, 2024 and December 31, 2023. |
| (5) | Common Stock: 336,637 and 311,608 shares issued and outstanding as of December 31, 2024 and December 31, 2023, respectively. |
15
| Financial Supplement | |
|---|---|---|
Unaudited and in Thousands | Fourth Quarter 2024 |
44
Consolidated Properties Cash Net Operating Income (NOI)(2), Annualized (3) | | | |
Network-Dense | | | $1,098,181 |
Campus | | | 1,716,860 |
Other (4) | | | 93,047 |
Total Cash NOI, Annualized | | | $2,908,088 |
less: Partners' share of consolidated JVs | | | (82,398) |
Acquisitions / dispositions / expirations | | | (96,689) |
FY 2025 backlog cash NOI and 4Q24 carry-over (stabilized) (5) | | | 191,470 |
Total Consolidated Cash NOI, Annualized | | | $2,920,471 |
| | | |
Digital Realty's Pro Rata Share of Unconsolidated Joint Venture Cash NOI (3) (6) | | | $264,484 |
| | | |
Other Income | | | |
Development and Management Fees (net), Annualized | | | $93,265 |
| | | |
Other Assets | | | |
Pre-stabilized inventory, at cost (7) | | | $178,717 |
Land held for development | | | 38,785 |
Development CIP (8) | | | 5,164,334 |
less: Investment associated with FY25 Backlog NOI (9) | | | (1,038,358) |
Cash and cash equivalents | | | 3,870,891 |
Accounts and other receivables, net | | | 1,257,464 |
Other assets | | | 465,885 |
less: Partners' share of consolidated JV assets | | | (144,588) |
Total Other Assets | | | $9,793,130 |
| | | |
Liabilities | | | |
Global unsecured revolving credit facilities | | | $1,637,922 |
Unsecured term loans | | | 388,275 |
Unsecured senior notes | | | 14,059,415 |
Secured and other debt | | | 761,262 |
Accounts payable and other accrued liabilities | | | 2,056,215 |
Deferred tax liabilities, net | | | 1,084,562 |
Accrued dividends and distributions | | | 418,661 |
Security deposits and prepaid rents | | | 539,802 |
Backlog NOI cost to complete (9) | | | 412,496 |
Preferred stock | | | 755,000 |
Digital Realty's share of unconsolidated JV debt | | | 1,448,972 |
less: Partners' share of consolidated JV liabilities | | | (446,294) |
Total Liabilities | | | $23,116,287 |
| | | |
| (1) | Backlog and associated financial line items include activity related to unconsolidated joint venture properties. |
| (2) | For definitions and discussion of NOI and cash NOI and a reconciliation of operating income to NOI and cash NOI, see page 32. |
| (3) | Annualized cash NOI is calculated by multiplying results for the most recent quarter by four. Annualized results may not be indicative of any four-quarter period and do not take into account scheduled lease expirations, among other things. Annualized data is presented for illustrative purposes only. Reflects annualized 4Q24 Cash NOI of $2.9 billion. NOI is allocated based on management’s estimates derived using contractual ABR and stabilized margins. |
| (4) | Other includes Powered Base Building shell capacity as well as storage and office space within fully improved data center facilities. |
| (5) | Estimated cash NOI related to signed leases that are expected to commence through December 31, 2025. Includes Digital Realty’s share of signed leases at unconsolidated joint venture properties. |
| (6) | For a reconciliation of Digital Realty’s pro rata share of unconsolidated joint venture operating income to cash NOI, see page 29. |
| (7) | Excludes Digital Realty’s share of cost at unconsolidated joint venture properties. |
| (8) | See page 26 for further details on the breakdown of the construction in progress balance. |
| (9) | Includes Digital Realty’s share of construction in progress and expected cost to complete at unconsolidated joint venture properties. |
16
| | As of December 31, 2024 | ||||||||||||||||
| | | | Interest Rate | | | | | | | | | | | | | | |
| | Interest | | Including | | | | | | | | | | | | | | |
| | Rate | | Swaps | | 2025 | | 2026 | | 2027 | | 2028 | | 2029 | | Thereafter | | Total |
Global Unsecured Revolving Credit Facilities (1) | | | | | | | | | | | | | | | | | | |
Global unsecured revolving credit facility | | 4.167% | | 4.118% | | — | | — | | — | | — | | — | | $1,481,187 | | $1,481,187 |
Yen revolving credit facility | | 0.900% | | 0.900% | | — | | — | | — | | — | | — | | 156,735 | | 156,735 |
Deferred financing costs, net | | — | | — | | — | | — | | — | | — | | — | | — | | (26,614) |
Total Global Unsecured Revolving Credit Facilities | | 3.855% | | 3.810% | | — | | — | | — | | — | | — | | $1,637,922 | | $1,611,308 |
| | | | | | | | | | | | | | | | | | |
Unsecured Term Loans | | | | |
| | | | | | | | | | | | | |
Euro term loan facility | | 3.813% | | 3.230% | | — | | — | | $388,275 | | — | | — | | — | | $388,275 |
Deferred financing costs, net | | — | | — | | — | | — | | — | | — | | — | | — | | (1,372) |
Total Unsecured Term Loans | | 3.813% | | 3.230% | | — | | — | | $388,275 | | — | | — | | — | | $386,903 |
| | | | | | | | | | | | | | | | | | |
Senior Notes | | | | | | | | | | | | | | | | | | |
£400 million 4.250% Notes due 2025 (2) | | 4.250% | | 4.250% | | $500,640 | | — | | — | | — | | — | | — | | $500,640 |
€650 million 0.625% Notes due 2025 | | 0.625% | | 0.625% | | 673,010 | | — | | — | | — | | — | | — | | 673,010 |
€1.08 billion 2.500% Notes due 2026 | | 2.500% | | 2.500% | | — | | $1,113,055 | | — | | — | | — | | — | | 1,113,055 |
₣275 million 0.200% Notes due 2026 | | 0.200% | | 0.200% | | — | | 302,987 | | — | | — | | — | | — | | 302,987 |
₣150 million 1.700% Notes due 2027 | | 1.700% | | 1.700% | | — | | — | | $165,265 | | — | | — | | — | | 165,265 |
$1.00 billion 3.700% Notes due 2027 (3) | | 3.700% | | 2.485% | | — | | — | | 1,000,000 | | — | | — | | — | | 1,000,000 |
€500 million 1.125% Notes due 2028 | | 1.125% | | 1.125% | | — | | — | | — | | $517,700 | | — | | — | | 517,700 |
$900 million 5.550% Notes due 2028 (3) | | 5.550% | | 3.996% | | — | | — | | — | | 900,000 | | — | | — | | 900,000 |
$650 million 4.450% Notes due 2028 | | 4.450% | | 4.450% | | — | | — | | — | | 650,000 | | — | | — | | 650,000 |
₣270 million 0.550% Notes due 2029 | | 0.550% | | 0.550% | | — | | — | | — | | — | | $297,478 | | — | | 297,478 |
$900 million 3.600% Notes due 2029 | | 3.600% | | 3.600% | | — | | — | | — | | — | | 900,000 | | — | | 900,000 |
£350 million 3.300% Notes due 2029 | | 3.300% | | 3.300% | | — | | — | | — | | — | | 438,060 | | — | | 438,060 |
$1.15 billion 1.875% Notes due 2029 (3) | | 1.875% | | 1.263% | | — | | — | | — | | — | | 1,150,000 | | — | | 1,150,000 |
€750 million 1.500% Notes due 2030 | | 1.500% | | 1.500% | | — | | — | | — | | — | | — | | $776,550 | | 776,550 |
£550 million 3.750% Notes due 2030 | | 3.750% | | 3.750% | | — | | — | | — | | — | | — | | 688,380 | | 688,380 |
€500 million 1.250% Notes due 2031 | | 1.250% | | 1.250% | | — | | — | | — | | — | | — | | 517,700 | | 517,700 |
€1.00 billion 0.625% Notes due 2031 | | 0.625% | | 0.625% | | — | | — | | — | | — | | — | | 1,035,400 | | 1,035,400 |
€750 million 1.000% Notes due 2032 | | 1.000% | | 1.000% | | — | | — | | — | | — | | — | | 776,550 | | 776,550 |
€750 million 1.375% Notes due 2032 | | 1.375% | | 1.375% | | — | | — | | — | | — | | — | | 776,550 | | 776,550 |
€850 million 3.875% Notes due 2033 | | 3.875% | | 3.875% | | — | | — | | — | | — | | — | | 880,090 | | 880,090 |
Unamortized discounts | | — | | — | | — | | — | | — | | — | | — | | — | | (27,479) |
Deferred financing costs | | — | | — | | — | | — | | — | | — | | — | | — | | (69,084) |
Total Senior Notes | | 2.500% | | 2.264% | | $1,173,650 | | $1,416,042 | | $1,165,265 | | $2,067,700 | | $2,785,538 | | $5,451,220 | | $13,962,852 |
| | | | | | | | | | | | | | | | | | |
Secured Debt | | | | | | | | | | | | | | | | | | |
ICN10 Facilities | | 5.680% | | 3.500% | | — | | — | | — | | — | | — | | $11,429 | | $11,429 |
Westin | | 3.290% | | 3.290% | | — | | — | | $135,000 | | — | | — | | — | | 135,000 |
Teraco Loans | | 10.027% | | 9.679% | | $782 | | $47,713 | | 94,634 | | $353,970 | | $9,022 | | 31,579 | | 537,700 |
Deferred financing costs | | — | | — | | — | | — | | — | | — | | — | | — | | (4,290) |
Total Secured Debt | | 8.625% | | 8.315% | | $782 | | $47,713 | | $229,634 | | $353,970 | | $9,022 | | $43,008 | | $679,839 |
| | | | | | | | | | | | | | | | | | |
Other Debt | | | | | | | | | | | | | | | | | | |
Icolo loans | | 12.704% | | 12.704% | | — | | $5,760 | | $4,389 | | $1,029 | | $4,924 | | — | | $16,102 |
Total Other Debt | | 12.704% | | 12.704% | | — | | $5,760 | | $4,389 | | $1,029 | | $4,924 | | — | | $16,102 |
| | | | | | | | | | | | | | | | | | |
Mandatorily Redeemable Preferred Shares (Teraco) | | | | | | | | | | | | | | | | | | |
Mandatorily Redeemable Preferred Shares (Teraco) | | 9.675% | | 9.675% | | — | | $61,032 | | — | | — | | — | | — | | $61,032 |
Unamortized discounts | | — | | — | | — | | — | | — | | — | | — | | — | | (3,658) |
Total Redeemable Preferred Shares | | 9.675% | | 9.675% | | — | | $61,032 | | — | | — | | — | | — | | $57,374 |
| | | | | | | | | | | | | | | | | | |
Total unhedged variable rate debt | | — | | — | | $149 | | $61,697 | | $1,179 | | $9,697 | | $4,176 | | $1,506,917 | | $1,583,814 |
Total fixed rate / hedged variable rate debt | | — | | — | | 1,174,283 | | 1,468,849 | | 1,786,384 | | 2,413,002 | | 2,795,308 | | 5,625,233 | | 15,263,060 |
Total Debt | | 2.946% | | 2.719% | | $1,174,432 | | $1,530,546 | | $1,787,563 | | $2,422,699 | | $2,799,484 | | $7,132,150 | | $16,846,874 |
| | | | | | | | | | | | | | | | | | |
Weighted Average Interest Rate | | | | | | 2.176% | | 2.593% | | 3.041% | | 4.338% | | 2.305% | | 2.367% | | 2.719% |
| | | | | | | | | | | | | | | | | | |
Summary | | | | | | | | | | | | | | | | | | |
| | | | | | | | | | | | | | | | | | |
Weighted Average Term to Initial Maturity | | | | | | | | | | | | | | | | | | 4.2 Years |
| | | | | | | | | | | | | | | | | | |
Weighted Average Maturity (assuming exercise of extension options) | | | | | | | | | | | | | | | | | | 4.4 Years |
Global Unsecured Revolving Credit Facilities Detail As of December 31, 2024 | | | | | | | | | | | | |
| | | | | | | | | | | | |
| | | Maximum Available | | Existing Capacity (4) | | Currently Drawn | |||||
| | | | | | | | | | | | |
Global Unsecured Revolving Credit Facilities | $4,408,339 | | $2,655,883 | | $1,637,922 | |||||||
| (1) | Assumes all extensions will be exercised. |
| (2) | Repaid in full on January 17, 2025. |
| (3) | Subject to cross-currency swaps. |
| (4) | Net of letters of credit issued of $114.5 million. |
17
| | As of December 31, 2024 | ||||||||
| | | | | | | | | | |
|
| |
| |
| |
| Global Unsecured | ||
| | Unsecured Senior Notes | | Credit Facilities | ||||||
Debt Covenant Ratios (1) |
| Required | | Actual (2) | | Actual (3) | | Required | | Actual |
Total outstanding debt / total assets (4) |
| Less than 60% | | 42% | | 35% | | Less than 60% (5) |
| 31% |
Secured debt / total assets (6) |
| Less than 40% | | 5% | | 1% | | Less than 40% (7) | | 3% |
Total unencumbered assets / unsecured debt |
| Greater than 150% | | 258% | | 282% | | N/A |
| N/A |
Consolidated EBITDA / interest expense (8) |
| Greater than 1.50x |
| 4.3x |
| 4.3x |
| N/A |
| N/A |
Fixed charge coverage |
| |
| N/A |
| N/A |
| Greater than 1.50x |
| 4.3x |
Unsecured debt / total unencumbered asset value (9) |
| |
| N/A | | N/A | | Less than 60% | | 32% |
Unencumbered assets debt service coverage ratio (9) |
| |
| N/A |
| N/A |
| Greater than 1.50x |
| 4.8x |
| (1) | For definitions of the terms used in the table above and related footnotes, please refer to the indentures which govern the notes, the Third Amended and Restated Global Senior Credit Agreement dated as of September 24, 2024 and the Second Amended and Restated Yen facility Credit Agreement dated as of September 24, 2024, each as amended and which are filed as exhibits to our reports filed with the U.S. Securities and Exchange Commission. |
| (3) | Ratios for the 0.20% notes due 2026, 1.70% notes due 2027, 5.550% notes due 2028, 0.55% notes due 2029, 1.875% notes due 2029, 1.250% notes due 2031, 0.625% notes due 2031, 1.00% notes due 2032, 1.375% notes due 2032 and 3.875% notes due 2033. |
| (4) | This ratio is referred to as the Leverage Ratio, defined as Consolidated Debt / Total Asset Value, under the global unsecured revolving credit facility and the Yen facility. For the calculation of Total Assets, please refer to the indentures which govern the notes, the Third Amended and Restated Global Senior Credit Agreement dated as of September 24, 2024 and the Second Amended and Restated Yen facility Credit Agreement dated as of September 24, 2024, each as amended and which are filed as exhibits to our reports filed with the U.S. Securities and Exchange Commission. |
| (5) | The company has the right to maintain a Leverage Ratio of greater than 60.0% but less than or equal to 65.0% for up to four consecutive fiscal quarters during the term of the facility following any acquisition of one or more Assets. |
| (6) | This ratio is referred to as the Secured Debt Leverage Ratio, defined as Secured Debt / Total Asset Value, under the global unsecured revolving credit facility and the Yen facility. |
| (7) | The company has the right to maintain a Secured Debt Leverage Ratio of greater than 40.0% but less than or equal to 45.0% for up to four consecutive fiscal quarters during the term of the facility following any acquisition of one or more Assets. |
| (8) | Calculated as current quarter annualized consolidated EBITDA to current quarter annualized Interest Expense (including capitalized interest and debt discounts). This ratio no longer applies from and after the date that the company achieves a Debt Rating of at least BBB+ / Baa1 and a Total Asset Value of at least $35,000,000,000. |
| (9) | Assets must satisfy certain conditions to qualify for inclusion as an Unencumbered Asset under the global unsecured revolving credit facility and the Yen facility. |
18
| Financial Supplement | |
|---|---|---|
Unaudited and in Thousands | Fourth Quarter 2024 |
Stabilized (“Same-Capital”) Portfolio (1)
| | Three Months Ended | | | Twelve Months Ended | | ||||||||||||||||||||
| | 31-Dec-24 | | 31-Dec-23 | | % Change | | 30-Sep-24 | | % Change | | | 31-Dec-24 | | 31-Dec-23 | | % Change | | ||||||||
Rental revenues | | | $703,083 | | | $687,397 | | | 2.3% | | | $698,831 | | | 0.6% | | | | $2,785,140 | | | $2,704,364 | | | 3.0% | |
Tenant reimbursements - Utilities | | | 226,913 | | | 258,932 | | | (12.4%) | | | 231,434 | | | (2.0%) | | | | 892,197 | | | 1,053,169 | | | (15.3%) | |
Tenant reimbursements - Other | | | 27,884 | | | 34,815 | | | (19.9%) | | | 30,343 | | | (8.1%) | | | | 120,119 | | | 120,184 | | | (0.1%) | |
Interconnection & other | | | 94,051 | | | 90,608 | | | 3.8% | | | 94,590 | | | (0.6%) | | | | 372,994 | | | 355,495 | | | 4.9% | |
Total Revenue | | | $1,051,932 | | | $1,071,752 | | | (1.8%) | | | $1,055,198 | | | (0.3%) | | | | $4,170,449 | | | $4,233,212 | | | (1.5%) | |
| | | | | | | | | | | | | | | | | | | | | | | | | | |
Utilities | | | $250,191 | | | $301,068 | | | (16.9%) | | | $271,626 | | | (7.9%) | | | | $1,020,379 | | | $1,203,719 | | | (15.2%) | |
Rental property operating | | | 201,620 | | | 175,100 | | | 15.1% | | | 172,991 | | | 16.5% | | | | 712,962 | | | 662,061 | | | 7.7% | |
Property taxes | | | 34,082 | | | 28,385 | | | 20.1% | | | 36,312 | | | (6.1%) | | | | 142,625 | | | 122,922 | | | 16.0% | |
Insurance | | | 4,436 | | | 3,460 | | | 28.2% | | | 4,097 | | | 8.3% | | | | 16,714 | | | 15,219 | | | 9.8% | |
Total Expenses | | | $490,330 | | | $508,013 | | | (3.5%) | | | $485,025 | | | 1.1% | | | | $1,892,680 | | | $2,003,921 | | | (5.6%) | |
| | | | | | | | | | | | | | | | | | | | | | | | | | |
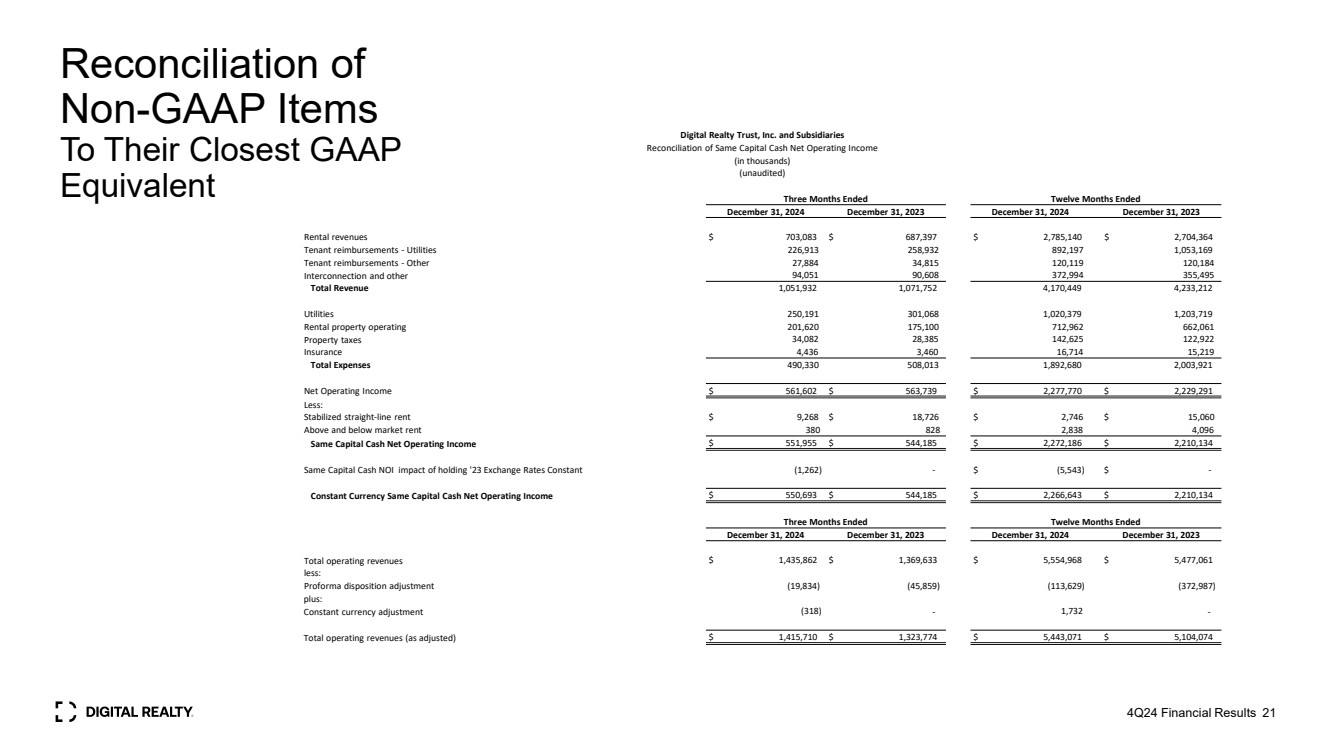
Net Operating Income (2) | | | $561,602 | | | $563,739 | | | (0.4%) | | | $570,172 | | | (1.5%) | | | | $2,277,770 | | | $2,229,291 | | | 2.2% | |
Less: | | | | | | | | | | | | | | | | | | | | | | | | | | |
Stabilized straight-line rent | | | $9,268 | | | $18,726 | | | (50.5%) | | | $8,024 | | | 15.5% | | | | $2,746 | | | $15,060 | | | (81.8%) | |
Above- and below-market rent | | | 380 | | | 828 | | | (54.1%) | | | 840 | | | (54.8%) | | | | 2,838 | | | 4,096 | | | (30.7%) | |
Cash Net Operating Income (3) | | | $551,955 | | | $544,185 | | | 1.4% | | | $561,309 | | | (1.7%) | | | | $2,272,186 | | | $2,210,134 | | | 2.8% | |
| | | | | | | | | | | | | | | | | | | | | | | | | | |
Stabilized Portfolio occupancy at period end (4) | | | 82.9% | | | 82.8% | | | 0.0% | | | 83.3% | | | (0.4%) | | | | 82.9% | | | 82.8% | | | 0.0% | |
| (1) | Represents buildings owned as of December 31, 2022 with less than 5% of total rentable square feet under development. Excludes buildings that were undergoing, or were expected to undergo, development activities in 2023-2024, buildings classified as held for sale, and buildings sold or contributed to joint ventures for all periods presented. Prior period numbers adjusted to reflect current same-capital pool. |
| (2) | For a definition and discussion of net operating income and a reconciliation of operating income to NOI, see page 32. |
| (3) | For a definition and discussion of cash net operating income and a reconciliation of operating income to cash NOI, see page 32. |
| (4) | Occupancy excludes space under active development and space held for development. For some of our buildings, we calculate occupancy based on factors in addition to contractually leased square feet, including available power, required support space and common areas. |
19
Summary of Leasing Activity | Financial Supplement | |
|---|---|---|
Leases Signed in the Quarter End December 31, 2024 | Fourth Quarter 2024 |
| | 0-1 MW | | > 1 MW | | Other (3) | | Total | ||||||||||||||||
Leasing Activity - New (1) (2) |
| 4Q24 |
| LTM |
| 4Q24 |
| LTM |
| 4Q24 |
| LTM |
| 4Q24 |
| LTM | ||||||||
| | | | | | | | | | | | | | | | | | | | | | | | |
Annualized GAAP Rent (in thousands) |
| | $61,748 |
| | $191,748 |
| | $22,573 | | | $780,787 | | | $599 | | | $6,741 | | | $84,920 | | | $979,276 |
| | | | | | | | | | | | | | | | | | | | | | | | |
Kilowatt leased | | | 19,701 | | | 60,942 | | | 13,557 | | | 343,472 | | | — | | | — | | | 33,258 | | | 404,414 |
NRSF (in thousands) | | | 209 | | | 650 | | | 131 | | | 2,582 | | | 9 | | | 106 | | | 350 | | | 3,338 |
| | | | | | | | | | | | | | | | | | | | | | | | |
Weighted Average Lease Term (years) | | | 4.5 | | | 3.9 | | | 8.1 | | | 11.7 | | | 4.3 | | | 12.2 | | | 5.8 | | | 10.2 |
| | | | | | | | | | | | | | | | | | | | | | | | |
Initial stabilized cash rent per Kilowatt | | | $259 | | | $260 | | | $130 | | | $152 | | | — | | | — | | | $206 | | | $168 |
GAAP rent per Kilowatt | | | $261 | | | $262 | | | $139 | | | $189 | | | — | | | — | | | $211 | | | $200 |
Leasing cost per Kilowatt | | | $20 | | | $23 | | | — | | | — | | | — | | | — | | | $12 | | | $4 |
| | | | | | | | | | | | | | | | | | | | | | | | |
Net Effective Economics by Kilowatt (4) | | | | | | | | | | | | | | | | | | | | | | | | |
| | | | | | | | | | | | | | | | | | | | | | | | |
Base rent by Kilowatt | | | $263 | | | $265 | | | $141 | | | $190 | | | — | | | — | | | $213 | | | $201 |
Rental concessions by Kilowatt | | | $2 | | | $3 | | | $2 | | | — | | | — | | | — | | | $2 | | | $1 |
Estimated operating expense by Kilowatt | | | $75 | | | $77 | | | $37 | | | $48 | | | — | | | — | | | $60 | | | $52 |
| | | | | | | | | | | | | | | | | | | | | | | | |
Net rent per Kilowatt | | | $186 | | | $185 | | | $101 | | | $142 | | | — | | | — | | | $151 | | | $148 |
| | | | | | | | | | | | | | | | | | | | | | | | |
Tenant improvements by Kilowatt | | | — | | | — | | | — | | | — | | | — | | | — | | | — | | | — |
Leasing commissions by Kilowatt | | | $7 | | | $9 | | | — | | | — | | | — | | | — | | | $4 | | | $1 |
| | | | | | | | | | | | | | | | | | | | | | | | |
Net effective rent per Kilowatt | | | $178 | | | $176 | | | $101 | | | $142 | | | — | | | — | | | $147 | | | $147 |
| | | | | | | | | | | | | | | | | | | | | | | | |
Initial stabilized cash rent per NRSF | | | $292 | | | $292 | | | $161 | | | $242 | | | $62 | | | $51 | | | $237 | | | $246 |
GAAP rent per NRSF | | | $295 | | | $295 | | | $172 | | | $302 | | | $64 | | | $64 | | | $243 | | | $293 |
Leasing cost per NRSF | | | $23 | | | $26 | | | — | | | — | | | $7 | | | $2 | | | $14 | | | $5 |
| | | | | | | | | | | | | | | | | | | | | | | | |
Net Effective Economics by NRSF (4) | | | | | | | | | | | | | | | | | | | | | | | | |
| | | | | | | | | | | | | | | | | | | | | | | | |
Base rent by NRSF | | | $297 | | | $298 | | | $175 | | | $303 | | | $64 | | | $64 | | | $245 | | | $294 |
Rental concessions by NRSF | | | $2 | | | $4 | | | $3 | | | $1 | | | — | | | — | | | $2 | | | $1 |
Estimated operating expense by NRSF | | | $85 | | | $81 | | | $47 | | | $80 | | | $8 | | | $8 | | | $69 | | | $78 |
| | | | | | | | | | | | | | | | | | | | | | | | |
Net rent per NRSF | | | $210 | | | $214 | | | $126 | | | $223 | | | $56 | | | $55 | | | $174 | | | $216 |
| | | | | | | | | | | | | | | | | | | | | | | | |
Tenant improvements by NRSF | | | — | | | — | | | — | | | — | | | — | | | — | | | — | | | — |
Leasing commissions by NRSF | | | $8 | | | $10 | | | — | | | — | | | $2 | | | $1 | | | $5 | | | $2 |
| | | | | | | | | | | | | | | | | | | | | | | | |
Net effective rent per NRSF | | | $201 | | | $204 | | | $126 | | | $223 | | | $53 | | | $55 | | | $169 | | | $214 |
| (1) | Excludes short-term, roof, storage, and garage leases. |
| (2) | Includes leases for new and re-leased space. |
| (3) | Other includes Powered Base Building shell capacity as well as storage and office space within fully improved data center facilities. |
| (4) | All dollar amounts are per square foot averaged over lease term. Per Kilowatt amounts are presented in monthly values. Per NRSF amounts are presented in yearly values. |
Note: LTM is last twelve months, including current quarter. Weighted average lease term excludes renewal options and is weighted by net rentable square feet.
20
Summary of Leasing Activity | Financial Supplement | |
|---|---|---|
Leases Renewed in the Quarter Ended December 31, 2024 | Fourth Quarter 2024 |
| | 0-1 MW | | > 1 MW | | Other (4) | | Total | ||||||||||||||||
Leasing Activity - Renewals (1) (2) (3) |
| 4Q24 |
| LTM |
| 4Q24 |
| LTM |
| 4Q24 |
| LTM |
| 4Q24 |
| LTM | ||||||||
| | | | | | | | | | | | | | | | | | | | | | | | |
Leases renewed (Kilowatt) | | | 34,382 | | | 142,148 | | | 59,304 | | | 216,280 | | | — | | | — | | | 93,686 | | | 358,428 |
Leases renewed (NRSF in thousands) | | | 537 | | | 2,082 | |
| 701 | | | 2,513 | | | 36 | | | 404 | | | 1,274 | | | 5,000 |
Leasing cost per Kilowatt | | | $1 | | | $1 | |
| $2 | |
| $1 | | | — | | | — | | | $2 | | | $1 |
Leasing cost per NRSF | | | $1 | | | $1 | |
| $2 | |
| $1 | | | $3 | | | $2 | | | $2 | | | $1 |
| | | | | | | | | | | | | | | | | | | | | | | | |
Weighted Term (years) | | | 1.2 | | | 1.5 | | | 4.0 | | | 5.5 | | | 2.3 | | | 5.4 | | | 2.8 | | | 3.8 |
| | | | | | | | | | | | | | | | | | | | | | | | |
Cash Rent | | | | | | | | | | | | | | | | | | | | | | | | |
| | | | | | | | | | | | | | | | | | | | | | | | |
Expiring cash rent per Kilowatt |
| | $351 | | | $308 | | | $128 | | | $133 | | | — | | | — | | | $210 | | | $202 |
Renewed cash rent per Kilowatt |
| | $369 | | | $321 | | | $133 | | | $152 | | | — | | | — | | | $219 | | | $219 |
| | | | | | | | | | | | | | | | | | | | | | | | |
% Change Cash Rent Per Kilowatt |
| | 4.9% | | | 4.2% | | | 3.7% | | | 14.4% | | | — | | | — | | | 4.4% | | | 8.3% |
| | | | | | | | | | | | | | | | | | | | | | | | |
Expiring cash rent per NRSF | | | $270 | | | $253 | | | $130 | | | $137 | | | $64 | | | $51 | | | $187 | | | $178 |
Renewed cash rent per NRSF | | | $283 | | | $263 | | | $135 | | | $157 | | | $86 | | | $71 | | | $196 | | | $194 |
| | | | | | | | | | | | | | | | | | | | | | | | |
% Change Cash Rent Per NRSF | | | 4.9% | | | 4.2% | | | 3.7% | | | 14.4% | |
| 35.8% | |
| 38.5% | |
| 4.7% | |
| 9.0% |
| | | | | | | | | | | | | | | | | | | | | | | | |
GAAP Rent | | | | | | | | | | | | | | | | | | | | | | | | |
| | | | | | | | | | | | | | | | | | | | | | | | |
Expiring GAAP rent per Kilowatt |
| | $350 |
| | $307 | | | $118 | | | $125 | |
| — | |
| — | |
| $203 | | | $197 |
Renewed GAAP rent per Kilowatt |
| | $369 |
| | $322 | | | $135 | | | $159 | |
| — | |
| — | |
| $221 | | | $224 |
| | | | | | | | | | | | | | | | | | | | | | | | |
% Change GAAP Rent Per Kilowatt |
| | 5.5% |
| | 5.0% | | | 14.6% | | | 27.4% | | | — | | | — | | | 8.8% | | | 13.6% |
| | | | | | | | | | | | | | | | | | | | | | | | |
Expiring GAAP rent per NRSF | | | $269 | | | $251 | | | $120 | | | $129 | | | $57 | | | $46 | | | $181 | | | $173 |
Renewed GAAP rent per NRSF | | | $284 | | | $264 | | | $137 | | | $164 | | | $80 | | | $68 | | | $197 | | | $198 |
| | | | | | | | | | | | | | | | | | | | | | | | |
% Change GAAP Rent Per NRSF | | | 5.5% |
| | 5.0% | | | 14.6% | | | 27.4% | | | 40.4% | | | 47.0% | | | 9.1% | | | 14.3% |
| | | | | | | | | | | | | | | | | | | | | | | | |
Retention ratio (5) | | | 80.4% | | | 82.9% | | | 82.8% | | | 81.0% | | | 15.7% | | | 54.5% | | | 73.0% | | | 78.6% |
| | | | | | | | | | | | | | | | | | | | | | | | |
Churn (6) | | | 2.5% | | | 7.8% | | | 1.4% | | | 4.9% | | | 3.6% | | | 5.6% | | | 2.0% | | | 6.2% |
| (1) | Excludes short-term, roof, storage, and garage leases. |
| (2) | Rental rates represent annual estimated cash rent per kilowatt and net rentable square feet, adjusted for straight-line rents in accordance with GAAP. |
| (3) | Per Kilowatt amounts are presented in monthly values. Per NRSF amounts are presented in yearly values. |
| (4) | Other includes Powered Base Building shell capacity as well as storage and office space within fully improved data center facilities. |
| (5) | Based on square feet. |
| (6) | Churn is defined as recurring revenue lost during the period due to leases terminated or not renewed, divided by recurring revenue at the beginning of the period. |
Note: LTM is last twelve months, including current quarter. Weighted average lease term excludes renewal options and is weighted by net rentable square feet.
21
| Financial Supplement | |
|---|---|---|
Dollars and Square Feet in Thousands (except per square foot and per kW data) | Fourth Quarter 2024 |
|
| |
| | |
| % of |
| Annualized Rent Per |
| Annualized Rent Per |
| |
| | |
| |
| Rent Per kW |
| |||||
| | Square Footage of | | Annualized | | Annualized | | Occupied | | Occupied Square | | Annualized Rent | | kW of Expiring | | Rent per kW | | Per Month at |
| |||||||
Year | | Expiring Leases (1) | | Rent (2) | | Rent | | Square Foot | | Foot at Expiration | | at Expiration | | Leases | | Per Month | | Expiration |
| |||||||
0-1 MW |
|
|
|
|
|
|
|
|
|
|
|
|
|
|
|
|
|
|
|
|
|
|
|
|
|
|
Available |
| 2,890 |
| | — |
| — |
| | — |
| | — |
| | — |
| | — |
| | — |
| | — | |
Month to Month (3) |
| 232 |
| | $53,167 |
| 1.4% |
| | $229 |
| | $228 |
| | $52,957 |
| | 11,570 |
| | $383 |
| | $381 | |
2025 |
| 2,422 |
| | 733,388 |
| 19.8% |
| | 303 |
| | 303 |
| | 734,031 |
| | 172,564 |
| | 354 |
| | 354 | |
2026 |
| 678 |
| | 175,076 |
| 4.7% |
| | 258 |
| | 263 |
| | 178,682 |
| | 52,913 |
| | 276 |
| | 281 | |
2027 |
| 703 |
| | 158,584 |
| 4.3% |
| | 225 |
| | 237 |
| | 166,661 |
| | 54,840 |
| | 241 |
| | 253 | |
2028 |
| 328 |
| | 64,153 |
| 1.7% |
| | 196 |
| | 211 |
| | 69,244 |
| | 23,552 |
| | 227 |
| | 245 | |
2029 |
| 309 |
| | 59,728 |
| 1.6% |
| | 194 |
| | 214 |
| | 66,175 |
| | 23,578 |
| | 211 |
| | 234 | |
2030 |
| 125 |
| | 29,986 |
| 0.8% |
| | 239 |
| | 262 |
| | 32,807 |
| | 8,730 |
| | 286 |
| | 313 | |
2031 |
| 110 |
| | 20,766 |
| 0.6% |
| | 189 |
| | 217 |
| | 23,790 |
| | 7,246 |
| | 239 |
| | 274 | |
2032 |
| 48 |
| | 7,653 |
| 0.2% |
| | 159 |
| | 184 |
| | 8,874 |
| | 2,765 |
| | 231 |
| | 267 | |
2033 |
| 30 |
| | 8,520 |
| 0.2% |
| | 281 |
| | 337 |
| | 10,194 |
| | 2,635 |
| | 269 |
| | 322 | |
2034 |
| 29 |
| | 3,644 |
| 0.1% |
| | 125 |
| | 125 |
| | 3,651 |
| | 1,811 |
| | 168 |
| | 168 | |
Thereafter |
| 13 |
| | 1,429 |
| 0.0% |
| | 111 |
| | 114 |
| | 1,468 |
| | 425 |
| | 280 |
| | 287 | |
| | | | | | | | | | | | | | | | | | | | | | | | | | |
Total / Wtd. Avg. |
| 7,918 | | | $1,316,096 |
| 35.5% | | | $262 | | | $268 | | | $1,348,534 | | | 362,629 | | | $302 | | | $310 | |
| | | | | | | | | | | | | | | | | | | | | | | | | | |
> 1 MW |
| Expiring Leases (1) | | Annualized |
| Annualized | Annualized Rent Per | | Annualized Rent Per | | Annualized Rent Per | | kW of Expiring | | Annualized | | Rent Per kW |
| ||||||||
Available |
| 1,636 |
| | — |
| — |
| | — |
| | — |
| | — |
| | — |
| | — |
| | — | |
Month to Month (3) |
| 52 |
| | $7,730 |
| 0.2% |
| | $149 |
| | $150 |
| | $7,762 |
| | 3,942 |
| | $163 |
| | $164 | |
2025 |
| 1,183 |
| | 190,930 |
| 5.1% |
| | 161 |
| | 163 |
| | 192,834 |
| | 108,455 |
| | 147 |
| | 148 | |
2026 |
| 1,836 |
| | 265,780 |
| 7.2% |
| | 145 |
| | 149 |
| | 274,030 |
| | 164,408 |
| | 135 |
| | 139 | |
2027 |
| 1,555 |
| | 231,835 |
| 6.3% |
| | 149 |
| | 158 |
| | 245,316 |
| | 149,234 |
| | 129 |
| | 137 | |
2028 |
| 1,511 |
| | 187,200 |
| 5.0% |
| | 124 |
| | 133 |
| | 200,885 |
| | 137,029 |
| | 114 |
| | 122 | |
2029 |
| 1,884 |
| | 274,484 |
| 7.4% |
| | 146 |
| | 160 |
| | 301,997 |
| | 211,706 |
| | 108 |
| | 119 | |
2030 |
| 1,283 |
| | 192,284 |
| 5.2% |
| | 150 |
| | 165 |
| | 211,557 |
| | 141,513 |
| | 113 |
| | 125 | |
2031 |
| 988 |
| | 148,575 |
| 4.0% |
| | 150 |
| | 176 |
| | 173,996 |
| | 103,823 |
| | 119 |
| | 140 | |
2032 |
| 854 |
| | 118,541 |
| 3.2% |
| | 139 |
| | 158 |
| | 134,580 |
| | 92,948 |
| | 106 |
| | 121 | |
2033 |
| 570 |
| | 90,317 |
| 2.4% |
| | 159 |
| | 187 |
| | 106,313 |
| | 60,600 |
| | 124 |
| | 146 | |
2034 |
| 1,283 |
| | 151,561 |
| 4.1% |
| | 118 |
| | 139 |
| | 178,319 |
| | 122,392 |
| | 103 |
| | 121 | |
Thereafter |
| 1,820 |
| | 289,885 |
| 7.8% |
| | 159 |
| | 204 |
| | 371,404 |
| | 179,451 |
| | 135 |
| | 172 | |
| | | | | | | | | | | | | | | | | | | | | | | | | | |
Total / Wtd. Avg. |
| 16,455 | | | $2,149,122 |
| 57.9% | | | $145 | | | $162 | | | $2,398,993 | | | 1,475,502 | | | $121 | | | $135 | |
| | | | | | | | | | | | | | | | | | | | | | | | | | |
Other (4) |
| Expiring Leases (1) | | Annualized |
| Annualized | Annualized Rent Per | | Annualized Rent Per | | Annualized Rent Per | | kW of Expiring | | Annualized | | Rent Per kW | | ||||||||
Available |
| 1,278 |
| | — |
| — |
| | — |
| | — |
| | — |
| | — |
| | — |
| | — | |
Month to Month (3) |
| 96 |
| | $9,188 |
| 0.2% |
| | $96 |
| | $96 |
| | $9,197 |
| | — |
| | — |
| | — | |
2025 |
| 725 |
| | 23,630 |
| 0.6% |
| | 33 |
| | 33 |
| | 23,696 |
| | — |
| | — |
| | — | |
2026 |
| 845 |
| | 29,087 |
| 0.8% |
| | 34 |
| | 36 |
| | 30,345 |
| | — |
| | — |
| | — | |
2027 |
| 342 |
| | 11,044 |
| 0.3% |
| | 32 |
| | 34 |
| | 11,633 |
| | — |
| | — |
| | — | |
2028 |
| 479 |
| | 14,021 |
| 0.4% |
| | 29 |
| | 31 |
| | 15,047 |
| | — |
| | — |
| | — | |
2029 |
| 757 |
| | 37,110 |
| 1.0% |
| | 49 |
| | 55 |
| | 41,479 |
| | — |
| | — |
| | — | |
2030 |
| 832 |
| | 35,619 |
| 1.0% |
| | 43 |
| | 57 |
| | 47,438 |
| | — |
| | — |
| | — | |
2031 |
| 72 |
| | 2,320 |
| 0.1% |
| | 32 |
| | 38 |
| | 2,713 |
| | — |
| | — |
| | — | |
2032 |
| 111 |
| | 6,267 |
| 0.2% |
| | 57 |
| | 64 |
| | 7,028 |
| | — |
| | — |
| | — | |
2033 |
| 110 |
| | 4,164 |
| 0.1% |
| | 38 |
| | 44 |
| | 4,860 |
| | — |
| | — |
| | — | |
2034 |
| 590 |
| | 21,695 |
| 0.6% |
| | 37 |
| | 45 |
| | 26,686 |
| | — |
| | — |
| | — | |
Thereafter |
| 2,514 |
| | 49,397 |
| 1.3% |
| | 20 |
| | 25 |
| | 63,804 |
| | — |
| | — |
| | — | |
| | | | | | | | | | | | | | | | | | | | | | | | | | |
Total / Wtd. Avg. |
| 8,749 | | | $243,541 |
| 6.6% | | | $33 | | | $38 | | | $283,925 | | | — | | | — | | | — | |
| | | | | | | | | | | | | | | | | | | | | | | | | | |
Total |
| Expiring Leases (1) | | Annualized |
| Annualized | Annualized Rent Per | | Annualized Rent Per | | Annualized Rent Per | | kW of Expiring | | Annualized | | Rent Per kW |
| ||||||||
Available |
| 5,680 |
| | — |
| — |
| | — |
| | — |
| | — |
| | — |
| | — |
| | — | |
Month to Month (3) |
| 380 |
| | $70,085 |
| 1.9% |
| | $184 |
| | $184 |
| | $69,917 |
| | — |
| | — |
| | — | |
2025 |
| 4,330 |
| | 947,948 |
| 25.6% |
| | 219 |
| | 220 |
| | 950,561 |
| | — |
| | — |
| | — | |
2026 |
| 3,359 |
| | 469,943 |
| 12.7% |
| | 140 |
| | 144 |
| | 483,057 |
| | — |
| | — |
| | — | |
2027 |
| 2,600 |
| | 401,463 |
| 10.8% |
| | 154 |
| | 163 |
| | 423,610 |
| | — |
| | — |
| | — | |
2028 |
| 2,318 |
| | 265,374 |
| 7.2% |
| | 114 |
| | 123 |
| | 285,176 |
| | — |
| | — |
| | — | |
2029 |
| 2,950 |
| | 371,322 |
| 10.0% |
| | 126 |
| | 139 |
| | 409,651 |
| | — |
| | — |
| | — | |
2030 |
| 2,240 |
| | 257,889 |
| 7.0% |
| | 115 |
| | 130 |
| | 291,802 |
| | — |
| | — |
| | — | |
2031 |
| 1,169 |
| | 171,662 |
| 4.6% |
| | 147 |
| | 171 |
| | 200,498 |
| | — |
| | — |
| | — | |
2032 |
| 1,013 |
| | 132,461 |
| 3.6% |
| | 131 |
| | 149 |
| | 150,482 |
| | — |
| | — |
| | — | |
2033 |
| 710 |
| | 103,000 |
| 2.8% |
| | 145 |
| | 171 |
| | 121,367 |
| | — |
| | — |
| | — | |
2034 |
| 1,902 |
| | 176,901 |
| 4.8% |
| | 93 |
| | 110 |
| | 208,656 |
| | — |
| | — |
| | — | |
Thereafter |
| 4,347 |
| | 340,711 |
| 9.2% |
| | 78 |
| | 100 |
| | 436,675 |
| | — |
| | — |
| | — | |
| | | | | | | | | | | | | | | | | | | | | | | | | | |
Total / Wtd. Avg. |
| 32,999 | | | $3,708,758 |
| 100.0% | | | $136 | | | $148 | | | $4,031,452 | | | — | | | — | | | — | |
| (1) | For some buildings, we calculate square footage based on factors in addition to contractually leased square feet, including available power, required support space and common areas. We estimate the total net rentable square feet available for lease based on a number of factors in addition to contractually leased square feet, including available power, required support space and common areas. |
| (2) | Annualized rent represents the monthly contractual base rent (defined as cash base rent before abatements) under existing leases as of December 31, 2024, multiplied by 12. |
| (3) | Includes leases, licenses, and similar agreements that upon expiration have been automatically renewed on a month-to-month basis. |
| (4) | Other includes unimproved building shell capacity as well as storage and office space within fully improved data center facilities. |
Note: Represents consolidated portfolio in addition to our managed portfolio of unconsolidated joint ventures based on our ownership percentage.
22
| | | | |
| | |
| |
| Weighted |
| | | | | | | | | | | Average |
| | | | | | Annualized | | % of Annualized | | Remaining | |
| | | | Number of | | Recurring | | Recurring | | Lease Term in | |
| | Customer | | Locations | | Revenue (1) | | Revenue | | Years | |
1 | | Fortune 50 Software Company | | 73 | | | $475,081 | | 11.5% | | 8.9 |
2 | | Oracle Corporation | | 39 | | | 266,603 | | 6.4% | | 9.7 |
3 | | Social Content Platform | | 30 | | | 229,771 | | 5.5% | | 3.7 |
4 | | Global Cloud Provider | | 63 | | | 189,147 | | 4.6% | | 4.8 |
5 | | IBM | | 36 | | | 119,145 | | 2.9% | | 2.8 |
6 | | Equinix | | 17 | | | 98,128 | | 2.4% | | 5.0 |
7 | | LinkedIn Corporation | | 7 | | | 84,509 | | 2.0% | | 3.2 |
8 | | Fortune 25 Investment Grade-Rated Company | | 29 | | | 64,371 | | 1.6% | | 1.9 |
9 | | Meta Platforms, Inc. | | 49 | | | 64,157 | | 1.5% | | 3.6 |
10 | | Social Media Platform | | 5 | | | 63,168 | | 1.5% | | 6.4 |
11 | | Specialized Cloud Provider | | 2 | | | 58,322 | | 1.4% | | 4.7 |
12 | | Lumen Technologies, Inc. | | 130 | | | 55,529 | | 1.3% | | 8.2 |
13 | | Fortune 25 Tech Company | | 54 | | | 54,008 | | 1.3% | | 3.3 |
14 | | AT&T | | 77 | | | 49,890 | | 1.2% | | 2.5 |
15 | | Comcast Corporation | | 44 | | | 43,900 | | 1.1% | | 3.5 |
16 | | Fortune 500 SaaS Provider | | 10 | | | 42,462 | | 1.0% | | 2.8 |
17 | | JPMorgan Chase & Co. | | 19 | | | 40,101 | | 1.0% | | 3.4 |
18 | | Rackspace | | 23 | | | 37,599 | | 0.9% | | 8.9 |
19 | | Morgan Stanley | | 13 | | | 37,276 | | 0.9% | | 4.4 |
20 | | Verizon | | 88 | | | 33,554 | | 0.8% | | 12.1 |
| | Total / Weighted Average | | | | | $2,106,721 | | 50.8% | | 6.1 |
| (1) | Annualized recurring revenue represents the monthly contractual base rent (defined as cash base rent before abatements) and interconnection revenue under existing leases as of December 31, 2024, multiplied by 12. |
Note: Represents consolidated portfolio in addition to our managed portfolio of unconsolidated joint ventures based on ownership percentage. Our direct customers may be the entities named in the table above or their subsidiaries or affiliates.
23
| | Net Rentable | | Space Under Active | | Space Held for | | Annualized | | Occupancy (5) | | White Space | | Data Center | |||
Metropolitan Area |
| Square Feet (1) |
| Development (2) |
| Development (3) |
| Rent (4) |
| 31-Dec-24 |
| 30-Sep-24 |
| IT Load (6) |
| Count | |
North America |
|
|
|
|
|
|
| |
|
|
|
|
|
|
|
|
|
| | | | | | | | | | | | | | | | | |
Northern Virginia |
| 5,372 |
| 1,571 |
| 254 | | | $643,833 |
| 92.8% | | 93.1% | | 478.5 | | 18 |
Chicago |
| 2,262 |
| 553 |
| 48 | | | 232,208 |
| 92.6% | | 92.3% | | 81.0 | | 7 |
Dallas |
| 3,126 |
| 408 |
| 110 | | | 211,320 |
| 84.0% | | 83.0% | | 111.2 | | 19 |
New York |
| 1,553 |
| 87 |
| 100 | | | 201,566 |
| 73.7% | | 67.0% | | 59.9 | | 11 |
Silicon Valley |
| 1,524 |
| — |
| — | | | 162,151 |
| 87.9% | | 91.2% | | 94.6 | | 13 |
Portland |
| 1,147 |
| — |
| — | | | 152,973 |
| 98.9% | | 98.9% | | 123.6 | | 3 |
Phoenix |
| 796 |
| — |
| — | | | 78,576 |
| 76.7% | | 75.9% | | 42.5 | | 2 |
Toronto |
| 593 |
| 130 |
| 135 | | | 63,437 |
| 96.1% | | 95.5% | | 55.8 | | 2 |
Atlanta |
| 542 |
| 15 |
| 314 | | | 61,235 |
| 96.7% | | 97.6% | | 9.1 | | 4 |
San Francisco |
| 844 |
| — |
| — | | | 60,731 |
| 61.6% | | 62.4% | | 31.5 | | 4 |
Seattle |
| 397 |
| — |
| — | | | 48,233 |
| 73.8% | | 75.1% | | 5.9 | | 1 |
Los Angeles |
| 611 |
| 11 |
| — | | | 43,954 |
| 79.4% | | 80.6% | | 16.2 | | 2 |
Houston |
| 393 |
| — |
| 14 | | | 19,221 |
| 69.7% | | 69.6% | | 12.0 | | 6 |
Boston |
| 437 |
| — |
| 51 | | | 15,527 |
| 38.1% | | 41.9% | | 19.0 | | 3 |
Miami |
| 226 |
| — |
| — | | | 9,941 |
| 86.0% | | 85.3% | | 1.3 | | 2 |
Austin |
| 86 |
| — |
| — | | | 7,472 |
| 59.7% | | 59.6% | | 4.3 | | 1 |
Charlotte |
| 95 |
| — |
| — | | | 5,889 |
| 92.4% | | 92.0% | | 1.5 | | 3 |
North America Total/Weighted Average |
| 20,004 |
| 2,775 |
| 1,025 | | | $2,018,267 |
| 85.5% | | 85.5% | | 1,147.9 | | 101 |
| | | | | | | | | | | | | | | | | |
EMEA | |
|
|
|
|
| |
|
|
|
|
|
|
|
|
|
|
| | | | | | | | | | | | | | | | | |
London |
| 1,412 |
| 13 |
| 76 | | | $227,318 |
| 61.0% | | 60.7% | | 98.9 | | 13 |
Frankfurt |
| 1,722 |
| 1,488 |
| — | | | 217,040 |
| 87.2% | | 86.5% | | 110.8 | | 24 |
Amsterdam | | 1,332 |
| 222 |
| 92 | | | 183,014 |
| 86.2% | | 85.0% | | 116.3 | | 13 |
Johannesburg |
| 1,263 |
| 945 |
| — | | | 143,214 |
| 81.7% | | 80.7% | | 67.4 | | 5 |
Paris |
| 977 |
| 285 |
| — | | | 124,168 |
| 82.8% | | 83.1% | | 91.9 | | 12 |
Marseille |
| 558 |
| 237 |
| 378 | | | 72,264 |
| 75.4% | | 80.2% | | 45.2 | | 4 |
Zurich |
| 496 |
| 92 |
| — | | | 68,909 |
| 85.2% | | 83.1% | | 34.3 | | 3 |
Dublin |
| 553 |
| — |
| — | | | 56,505 |
| 71.3% | | 71.8% | | 39.3 | | 9 |
Vienna |
| 356 |
| 133 |
| — | | | 50,148 |
| 82.6% | | 82.7% | | 25.6 | | 3 |
Cape Town |
| 326 |
| 402 |
| — | | | 44,169 |
| 87.3% | | 75.9% | | 21.1 | | 2 |
Madrid |
| 308 |
| 100 |
| — | | | 43,514 |
| 76.4% | | 75.9% | | 16.8 | | 4 |
Brussels |
| 338 |
| — |
| — | | | 38,542 |
| 69.7% | | 69.7% | | 21.5 | | 3 |
Stockholm |
| 245 |
| — |
| — | | | 23,781 |
| 57.7% | | 72.7% | | 16.8 | | 6 |
Copenhagen |
| 226 |
| — |
| 99 | | | 23,506 |
| 69.2% | | 69.8% | | 12.9 | | 3 |
Dusseldorf |
| 142 |
| — |
| 71 | | | 18,601 |
| 59.8% | | 54.7% | | 7.7 | | 3 |
Athens |
| 148 |
| 61 |
| — | | | 18,253 |
| 81.9% | | 80.8% | | 9.0 | | 4 |
Durban |
| 59 |
| — |
| — | | | 6,914 |
| 69.7% | | 90.1% | | 2.1 | | 1 |
Mombasa |
| 37 |
| — |
| 21 | | | 4,346 |
| 39.6% | | 39.0% | | 1.9 | | 2 |
Zagreb |
| 24 |
| 10 |
| — | | | 2,723 |
| 94.6% | | 94.6% | | 0.9 | | 1 |
Nairobi |
| 16 |
| 75 |
| — | | | 2,993 |
| 64.6% | | 64.3% | | 0.9 | | 1 |
Maputo |
| 3 |
| — |
| — | | | 487 |
| 41.6% | | 41.6% | | 0.2 | | 1 |
Rome |
| 0 |
| 37 |
| — | | | 177 |
| 100.0% | | — | | 0.1 | | 1 |
Barcelona |
| — |
| 144 |
| — | | | — |
| — | | — | | — | | — |
Crete |
| — |
| 11 |
| — | | | — |
| — | | — | | — | | — |
EMEA Total/Weighted Average |
| 10,540 |
| 4,254 |
| 738 | | | $1,370,587 |
| 78.1% | | 77.6% | | 741.6 | | 118 |
| | | | | | | | | | | | | | | | | |
Asia Pacific |
|
|
|
|
|
| |
|
|
|
|
|
|
|
|
|
|
| | | | | | | | | | | | | | | | | |
Singapore |
| 793 |
| — |
| 97 | | | $210,062 |
| 91.1% | | 91.8% | | 72.1 | | 3 |
Sydney |
| 361 |
| — |
| 88 | | | 26,004 |
| 83.3% | | 85.9% | | 22.8 | | 4 |
Melbourne |
| 147 |
| — |
| — | | | 17,598 |
| 90.6% | | 92.4% | | 9.6 | | 2 |
Hong Kong |
| 114 |
| 66 |
| 104 | | | 10,857 |
| 73.3% | | 73.2% | | 7.5 | | 1 |
Seoul |
| 162 |
| — |
| — | | | 4,586 |
| 25.2% | | 14.9% | | 12.0 | | 1 |
Asia Pacific Total/Weighted Average |
| 1,577 |
| 66 |
| 289 | | | $269,106 |
| 81.2% | | 81.8% | | 123.9 | | 11 |
| | | | | | | | | | | | | | | | | |
| | | | | | | | | | | | | | | | | |
Consolidated Portfolio Total/Weighted Average |
| 32,120 |
| 7,095 |
| 2,052 | | | $3,657,960 |
| 82.9% | | 82.7% | | 2,013.3 | | 230 |
| | | | | | | | | | | | | | | | | |
| | | | | | | | | | | | | | | | | |
Unconsolidated Joint Ventures |
|
|
|
|
|
| |
|
|
| |
| | |
| |
|
| | | | | | | | | | | | | | | | | |
Northern Virginia |
| 2,793 |
| 792 |
| — | | | $244,873 |
| 97.0% | | 96.8% | | 209.7 | | 12 |
Chicago |
| 1,118 |
| — |
| — | | | 118,762 |
| 96.3% | | 96.3% | | 94.2 | | 3 |
Frankfurt |
| 551 |
| — |
| — | | | 49,376 |
| 81.0% | | 77.9% | | 46.1 | | 5 |
Dallas |
| 364 |
| — |
| — | | | 27,081 |
| 100.0% | | 100.0% | | 16.0 | | 2 |
Silicon Valley |
| 142 |
| — |
| 400 | | | 18,592 |
| 100.0% | | 100.0% | | 10.9 | | 2 |
Hong Kong |
| 186 |
| — |
| — | | | 11,192 |
| 44.3% | | 44.3% | | 11.0 | | 1 |
Toronto |
| 104 |
| — |
| — | | | 9,821 |
| 54.5% | | 54.6% | | 6.8 | | 1 |
Los Angeles |
| 197 |
| — |
| — | | | 9,617 |
| 80.0% | | 100.0% | | 4.3 | | 2 |
Paris |
| 91 |
| 179 |
| — | | | 7,050 |
| 60.1% | | 59.9% | | 10.0 | | 1 |
Lagos |
| 5 |
| 26 |
| — | | | 1,215 |
| 93.3% | | 92.2% | | 0.2 | | 2 |
Accra |
| — |
| 24 |
| — | | | — |
| — | | — | | — | | — |
Managed Unconsolidated Portfolio Total/Weighted Average |
| 5,552 |
| 1,022 |
| 400 | | | $497,581 |
| 91.8% | | 91.8% | | 409.0 | | 31 |
| | | | | | | | | | | | | | | | | |
Managed Portfolio Total/Weighted Average |
| 37,672 |
| 8,117 |
| 2,452 | | | $4,155,541 |
| 84.2% | | 84.0% | | 2,422.3 | | 261 |
| | | | | | | | | | | | | | | | | |
Digital Realty Share Total/Weighted Average (7) |
| 32,999 |
| 6,495 |
| 2,446 | | | $3,708,758 |
| 82.8% | | 81.6% | | 2,079.9 | | — |
| | | | | | | | | | | | | | | | | |
Non-Managed Unconsolidated Joint Ventures |
|
|
|
|
|
| |
|
|
| |
| |
|
|
|
|
| | | | | | | | | | | | | | | | | |
Sao Paulo |
| 1,416 |
| 75 |
| 1,198 | | | $177,167 |
| 92.0% | | 91.9% | | 119.6 | | 25 |
Tokyo |
| 1,118 |
| 479 |
| — | | | 88,868 |
| 76.2% | | 74.9% | | 64.9 | | 5 |
Osaka |
| 583 |
| 116 |
| 80 | | | 73,048 |
| 82.0% | | 83.3% | | 58.9 | | 4 |
Santiago |
| 119 |
| 118 |
| 71 | | | 14,696 |
| 90.1% | | 90.1% | | 10.2 | | 3 |
Rio De Janeiro |
| 112 |
| — |
| — | | | 11,647 |
| 100.0% | | 100.0% | | 8.0 | | 2 |
Queretaro |
| 105 |
| — |
| 583 | | | 9,693 |
| 100.0% | | 100.0% | | 8.0 | | 3 |
Seattle |
| 51 |
| — |
| — | | | 7,770 |
| 100.0% | | 100.0% | | 9.0 | | 1 |
Fortaleza |
| 94 |
| — |
| — | | | 1,769 |
| 22.0% | | 22.0% | | 6.2 | | 1 |
Chennai |
| 55 |
| — |
| 104 | | | 310 |
| 2.5% | | — | | 7.2 | | 1 |
Bogota |
| — |
| — |
| 197 | | | — |
| — | | — | | — | | 2 |
Non-Managed Portfolio Total/Weighted Average |
| 3,654 |
| 787 |
| 2,234 | | | $384,966 |
| 83.0% | | 82.6% | | 292.0 | | 47 |
| | | | | | | | | | | | | | | | | |
Portfolio Total/Weighted Average |
| 41,326 |
| 8,904 |
| 4,686 | | | $4,540,507 |
| 84.1% | | 83.9% | | 2,714.3 | | 308 |
| (1) | We estimate the total net rentable square feet available for lease based on a number of factors in addition to contractually leased square feet, including available power, required support space and common areas. |
| (2) | Space under active development includes current Base Building and Data Center projects in progress. |
| (3) | Space held for development includes space held for future Data Center development and excludes space under active development. |
| (4) | Annualized base rent represents the monthly contractual base rent (defined as cash base rent before abatements) under existing leases as of December 31, 2024, multiplied by 12. |
| (5) | Occupancy excludes space under active development and space held for development. For some of our buildings, we calculate occupancy based on factors in addition to contractually leased square feet, including available power, required support space and common areas. |
| (6) | White Space IT Load represents UPS-backed utility power dedicated to Digital Realty’s operated data center space. |
| (7) | Represents consolidated portfolio plus our managed portfolio of unconsolidated joint ventures based on our ownership percentage. |
24
| | Future Development Capacity | | Data Center Construction | |||||||||||||||||||||||||||||||||
| | | | | | | | | | | | | | | | | | | | | | | | | | | | | | | | | | | | | |
| | IT Capacity (100% Share) (2) | | Total Investment (3) | | Project Summary (4) | | 100% Share (4) | | DLR Share (5) | |||||||||||||||||||||||||||
| | | | | | | | | | | | | | | | | | | | | | | | | | | | | | | | | | | |
| |
| | | | | | | | | | Under | | | | Average | | Current | | Future | | Total | | Current | | Future | | Total | | | | ||||||||
| | | | | | 100% Share | | DLR Share | | Construction | | | | Expected | | Investment | | Investment | | Investment | | Investment | | Investment | | Investment | | | Yields | ||||||||
Region | | Land (MW) | | Shell (MW) | | | (4) | (5) | | (MW) | | % Leased | | Completion | | | (6) | | | (7) | | | (8) | | (6) | | (7) | | | (8) | | | (9) | ||||
Northern Virginia | | 1,000 |
| 120 | | | $1,774,041 | | | $1,502,761 |
| 192 |
| 100% |
| 4Q25 | | | $655,787 | | | $1,262,588 | | | $1,918,375 | | | $452,072 | | | $683,674 | | | $1,135,745 | | | |
Chicago | | 40 |
| — | | | 38,990 | | | 38,990 |
| 54 |
| 89% |
| 4Q26 | | | 100,126 | | | 548,796 | | | 648,923 | | | 100,126 | | | 548,796 | | | 648,923 | | | |
Dallas | | 230 |
| 30 | | | 184,027 | | | 184,027 |
| 48 |
| 100% |
| 4Q26 | | | 22,702 | | | 493,714 | | | 516,416 | | | 22,702 | | | 493,714 | | | 516,416 | | | |
Other | | 710 |
| 150 | | | 847,546 | | | 751,069 |
| 24 |
| 90% |
| 3Q25 | | | 259,435 | | | 36,461 | | | 295,896 | | | 195,655 | | | 29,240 | | | 224,895 | | | |
Americas |
| 1,980 |
| 300 | | | $2,844,605 | | | $2,476,848 |
| 318 |
| 97% |
| | | | $1,038,050 | | | $2,341,560 | | | $3,379,610 | | | $770,555 | | | $1,755,424 | | | $2,525,979 | | | 13.7% |
| | | | | | | | | | | | | | | | | | | | | | | | | | | | | | | | | | | | | |
Frankfurt |
| 120 |
| 60 | | | $771,095 | | | $663,656 |
| 46 |
| 47% |
| 4Q25 | | | $688,564 | | | $146,074 | | | $834,638 | | | $688,564 | | | $146,074 | | | $834,638 | | | |
Paris |
| 220 |
| — | | | 98,030 | | | 56,565 |
| 52 |
| 57% |
| 3Q25 | | | 605,048 | | | 144,011 | | | 749,059 | | | 477,315 | | | 81,290 | | | 558,605 | | | |
Amsterdam |
| 40 |
| 10 | | | 66,906 | | | 66,906 |
| 27 |
| — |
| 4Q25 | | | 206,390 | | | 198,800 | | | 405,189 | | | 206,390 | | | 198,800 | | | 405,189 | | | |
Other |
| 460 |
| 110 | | | 680,518 | | | 657,677 |
| 146 |
| 35% |
| 2Q26 | | | 636,775 | | | 824,875 | | | 1,461,650 | | | 509,608 | | | 719,430 | | | 1,229,038 | | | |
EMEA |
| 840 |
| 180 | | | $1,616,550 | | | $1,444,804 |
| 272 |
| 38% |
| | | | $2,136,776 | | | $1,313,760 | | | $3,450,536 | | | $1,881,876 | | | $1,145,594 | | | $3,027,470 | | | 10.9% |
| | | | | | | | | | | | | | | | | | | | | | | | | | | | | | | | | | | | | |
Tokyo |
| 30 |
| 10 | | | $101,880 | | | $50,940 |
| 36 |
| 74% |
| 3Q25 | | | $174,200 | | | $187,809 | | | $362,009 | | | $87,100 | | | $93,904 | | | $181,005 | | | |
Hong Kong |
| — |
| — | | | 26,334 | | | 26,334 |
| 6 |
| 100% |
| 3Q25 | | | 45,386 | | | 34,454 | | | 79,840 | | | 45,386 | | | 34,454 | | | 79,840 | | | |
Osaka |
| 40 |
| 10 | | | 35,659 | | | 17,829 |
| 12 |
| 50% |
| 4Q25 | | | 46,117 | | | 67,536 | | | 113,653 | | | 23,059 | | | 33,768 | | | 56,827 | | | |
Other |
| 200 |
| 20 | | | 257,248 | | | 173,172 |
| — |
| — |
| — | | | — | | | — | | | — | | | — | | | — | | | — | | | |
APAC |
| 270 |
| 40 | | | $421,120 | | | $268,274 |
| 54 |
| 72% |
| | | | $265,704 | | | $289,799 | | | $555,503 | | | $155,545 | | | $162,126 | | | $317,671 | | | 10.0% |
| | | | | | | | | | | | | | | | | | | | | | | | | | | | | | | | | | | | | |
Total |
| 3,090 |
| 520 | | | $4,882,275 | | | $4,189,927 |
| 644 |
| 70% | | | | | $3,440,530 | | | $3,945,119 | | | $7,385,649 | | | $2,807,976 | | | $3,063,144 | | | $5,871,121 | | | 12.1% |
| (1) | Includes development projects in consolidated and unconsolidated joint ventures. |
| (2) | Represents the expected megawatt capacity to be developed based on our current plans and estimates; actual megawatt capacity developed may differ. Includes land and space held or actively under construction in preparation for future data center fit-out. |
| (3) | Represents cost incurred through December 31, 2024, plus remaining cost to complete on approved phases in preparation for future data center fit-out, including pro-rata share of acquisition, shell, and infrastructure costs. |
| (4) | Includes Digital Realty's and partners' shares in development joint venture projects. |
| (5) | Includes only Digital Realty's share in development joint venture projects. |
| (6) | Represents cost incurred through December 31, 2024. |
| (7) | Represents estimated cost to complete scope of work pursuant to approved development budget. |
| (8) | Represents total cost to develop a data center, including pro-rata share of acquisition, infrastructure, and shell space, plus the direct investment in the data center fit-out. |
| (9) | Represents pre-tax estimated stabilized cash yields, which are based on total expected investment amounts and anticipated net operating income from leases signed or other assumptions based on market conditions. |
25
|
| | 100% Share (2) |
| DLR Share (3) | |||||||||||||||
| | Current | | Future | | Total | | Current | | Future | | Total | | | ||||||
Construction Projects in Progress | | Investment (4) | | Investment (5) | | Investment | | Investment (4) (6) | | Investment (5) | | Investment | | | ||||||
Future Development Capacity (7) |
| | $2,910,984 | | | $1,971,291 | | | $4,882,275 | | | $2,496,078 | | | $1,693,848 | | | $4,189,927 |
| |
Data Center Construction | |
| 3,440,530 | | | 3,945,119 | | | 7,385,649 | | | 2,807,976 | | | 3,063,144 | | | 5,871,121 | |
|
Equipment Pool & Other Inventory (8) | |
| 192,429 | | | — | | | 192,429 | | | 192,429 | | | — | | | 192,429 | |
|
Campus, Tenant Improvements & Other (9) | |
| 271,042 | | | 157,976 | | | 429,018 | | | 271,042 | | | 157,976 | | | 429,018 | |
|
Total Land Held and Development CIP | |
| $6,814,986 | | | $6,074,385 | | | $12,889,372 | | | $5,767,526 | | | $4,914,968 | | | $10,682,495 | |
|
| | | | | | | | | | | | | | | | | | | | |
Enhancement & Other | |
| $11,112 | | | $6,768 | | | $17,879 | | | $11,112 | | | $6,768 | | | $17,879 | |
|
Recurring | |
| 29,657 | | | 36,451 | | | 66,108 | | | 29,657 | | | 36,451 | | | 66,108 | |
|
Total Land Held and Construction in Progress | |
| $6,855,755 | | | $6,117,604 | | | $12,973,359 | | | $5,808,295 | | | $4,958,187 | | | $10,766,483 | |
|
| (1) | Includes development projects in consolidated and unconsolidated joint ventures. |
| (2) | Includes Digital Realty's and partners' shares in development joint venture projects. |
| (3) | Includes only Digital Realty's share in development joint venture projects. |
| (4) | Represents cost incurred through December 31, 2024. |
| (5) | Represents estimated cost to complete scope of work pursuant to approved development budget. |
| (6) | Excludes $116.8 million representing our partners' shares in consolidated joint ventures included in Construction in Progress or Land Held for Future Development in our Consolidated Balance Sheet; includes $681.2 million representing Digital Realty's share in development projects classified as Investments in Unconsolidated Joint Ventures in our Consolidated Balance Sheet. |
| (7) | Includes land and space held or actively under construction in preparation for future data center fit-out. |
| (8) | Represents long-lead equipment and materials required for timely deployment and delivery of data center fit-out. |
| (9) | Represents improvements in progress as of December 31, 2024, which benefit space recently converted to our operating portfolio and is composed primarily of shared infrastructure projects and first-generation tenant improvements. Includes $2.8 million included in our Consolidated Balance Sheet related to fair value adjustments on Teraco portfolio projects that were partially constructed as of August 1, 2022. |
26
Historical Capital Expenditures and Investments in Real Estate |
| Financial Supplement |
|---|---|---|
Dollars and Square Feet in Thousands | Fourth Quarter 2024 |
| | Three Months Ended | | | Twelve Months Ended | |||||||||||||||||
|
| 31-Dec-24 | | | 30-Sep-24 | 30-Jun-24 |
| 31-Mar-24 |
| 31-Dec-23 |
|
| 31-Dec-24 |
| 31-Dec-23 | |||||||
| | | | | | | | | | | | | | | | | | | | | | |
Non-Recurring Capital Expenditures (1) |
|
|
|
|
|
|
|
|
|
|
|
|
|
|
| |
|
|
|
|
|
|
| | | | | | | | | | | | | | | | | | | | | | |
Development (2) | | | $528,356 | | | $650,912 | | | $531,903 | | | $549,522 | | | $845,315 | | | | $2,260,693 | | | $2,966,898 |
| | | | | | | | | | | | | | | | | | | | | | |
Enhancements and Other Non-Recurring | | | 13,384 | | | 7,070 | | | 7,051 | | | 7,738 | | | 10,113 | | | | 35,243 | | | 15,705 |
| | | | | | | | | | | | | | | | | | | | | | |
Total Non-Recurring Capital Expenditures | | | $541,740 | | | $657,982 | | | $538,953 | | | $557,260 | | | $855,428 | | | | $2,295,936 | | | $2,982,603 |
| | | | | | | | | | | | | | | | | | | | | | |
Recurring Capital Expenditures (3) | | | $130,245 | | | $67,308 | | | $60,483 | | | $47,676 | | | $142,808 | | | | $305,712 | | | $327,022 |
| | | | | | | | | | | | | | | | | | | | | | |
Total Direct Capital Expenditures | | | $671,985 | | | $725,290 | | | $599,436 | | | $604,936 | | | $998,236 | | | | $2,601,647 | | | $3,309,625 |
| | | | | | | | | | | | | | | | | | | | | | |
Indirect Capital Expenditures | | |
| | |
| | |
| | |
| | |
| | | |
| | |
|
| | | | | | | | | | | | | | | | | | | | | | |
Capitalized Interest | | | $34,442 | | | $28,312 | | | $27,592 | | | $28,522 | | | $33,032 | | | | $118,868 | | | $116,816 |
| | | | | | | | | | | | | | | | | | | | | | |
Capitalized Overhead | | | 28,983 | | | 27,929 | | | 28,457 | | | 25,857 | | | 27,867 | | | | 111,226 | | | 99,156 |
| | | | | | | | | | | | | | | | | | | | | | |
Total Indirect Capital Expenditures | | | $63,425 | | | $56,241 | | | $56,049 | | | $54,379 | | | $60,899 | | | | $230,094 | | | $215,972 |
| | | | | | | | | | | | | | | | | | | | | | |
Total Improvements to and Advances for Investment in Real Estate | | | $735,410 | | | $781,530 | | | $655,485 | | | $659,315 | | | $1,059,135 | | | | $2,831,740 | | | $3,525,597 |
| | | | | | | | | | | | | | | | | | | | | | |
| (1) | Non-recurring capital expenditures are primarily for development of space and land, excluding acquisition costs. |
| (2) | Amount reflects the total capital expenditures on consolidated development projects during the quarter. The total includes 100% of spending on projects contributed to joint ventures prior to their contribution. |
| (3) | Recurring capital expenditures represent non-incremental building improvements required to maintain current revenues, including second-generation tenant improvements and external leasing commissions. Recurring capital expenditures do not include acquisition costs contemplated when underwriting the purchase of a building, costs which are incurred to bring a building up to Digital Realty’s operating standards, or internal leasing commissions. |
27
| Financial Supplement | |
|---|---|---|
Dollars and Square Feet in Thousands | Fourth Quarter 2024 |
|
| |
| |
| |
| |
|
|
| Net |
| |
| |
| |
| | | | | | | | | | | | Rentable | | Square Feet | | Square Feet | | % of Total Net |
| | Acquisition | | Metropolitan | | Date | | Purchase | | Cap | | Square | | Under | | Held For | | Rentable Square |
Property | | Type | | Area | | Acquired | | Price (1) | | Rate (2) | | Feet (3) | | Development | | Development | | Feet Occupied (4) |
1201 North Bowser Road | | Land | | Dallas, TX | | 10/15/2024 | | $14,500 | | NA | | — | | — | | — | | — |
Calle Alcala (MAD5) | | Land | | Madrid, SPN | | 10/25/2024 | | 26,430 | | NA | | — | | — | | — | | — |
Moores Chapel Road | | Land | | Charlotte, NC | | 11/21/2024 | | 160,000 | | NA | | — | | — | | — | | — |
Total | | | | | | | | $200,930 |
| — |
| — |
| — |
| — |
| — |
Closed Dispositions:
|
| |
| |
| |
| |
| |
| Net |
| |
| |
| |
| | | | | | | | | | | | Rentable | | Square Feet | | Square Feet | | % of Total Net |
| | Disposition | | Metropolitan | | Date | | Sale | | Cap | | Square | | Under | | Held For | | Rentable Square |
Property | | Type | | Area | | Disposed | | Price (1) | | Rate (2) | | Feet (3) | | Development | | Development | | Feet Occupied (4) |
Wilhelm-Fay-Straße 24 (5) | | Building | | Frankfurt, GER | | 12/5/2024 | | $489,088 | | 5.7% | | — | | — | | — | | 98.5% |
60 & 80 Merritt Boulevard | | Building | | Trumbull, CT | | 12/9/2024 | | 10,000 | | NA | | — | | — | | — | | — |
1 - 3 St Annes Boulevard | | Building | | Redhill, UK | | 12/19/2024 | | 80,430 | | NA | | — | | — | | — | | — |
2334 Lundy Place | | Building | | San Jose, CA | | 12/19/2024 | | 9,543 | | NA | | — | | — | | — | | — |
Total | | | | | | | | $589,061 | | — | | — | | — | | — | | — |
Closed Joint Venture Contributions:
|
| |
| |
| |
| |
| Net |
| |
| |
| |
| | | | | | | | | | Rentable | | Square Feet | | Square Feet | | % of Total Net |
| | Metropolitan | | | | Contribution | | Cap | | Square | | Under | | Held For | | Rentable Square |
Property | | Area | | Date | | Price | | Rate (2) | | Feet (3) | | Development | | Development | | Feet Occupied (4) |
Blackstone JV - Phase II (6) | | NoVa, Frankfurt | | 12/3/2024 | | $509,472 | | NA | | — | | — | | — | | — |
Total |
| |
| |
| $509,472 |
| — | | — |
| — |
| — |
| — |
| (1) | Represents the purchase price or sale price, as applicable before contractual price adjustments, transaction expenses, taxes, and potential currency fluctuations. All prices converted to USD based on FX rate as of December 31, 2024. |
| (3) | We estimate the total net rentable square feet available for lease based on a number of factors in addition to contractually leased square feet, including available power, required support space and common area. |
| (4) | Occupancy excludes space under active development and space held for development. |
| (5) | Digital Realty sold an additional 15.1% interest in the Facility for €71 million or approximately $74 million. Sale price is shown at 100%. |
| (6) | Blackstone acquired an 80% interest, while Digital Realty maintains a 20% interest and will manage the development and day-to-day operations of the JV. Contribution price is shown at 100%. |
28
Summary Balance Sheet - | | As of December 31, 2024 | |||||||||||||
at the JV's 100% Share | | | Americas (1) | | | APAC (2) | | | EMEA (3) | | | Global (4) | | | Total |
| | | | | | | | | | | | | | | |
Gross cost of operating real estate |
|
| $6,443,437 |
|
| $1,881,988 |
|
| $701,844 |
|
| $1,701,716 |
|
| $10,728,985 |
Accumulated depreciation & amortization | | | (970,107) | | | (267,660) | | | (4,540) | | | (104,877) | | | (1,347,184) |
Net Book Value of Operating Real Estate | | | $5,473,330 | | | $1,614,327 | | | $697,304 | | | $1,596,839 | | | $9,381,800 |
Cash | | | 343,954 | | | 303,723 | | | 63,301 | | | 44,115 | | | 755,093 |
Other assets | | | 1,656,516 | | | 209,116 | | | 248,451 | | | 366,128 | | | 2,480,210 |
Total Assets | | | $7,473,799 | | | $2,127,166 | | | $1,009,055 | | | $2,007,082 | | | $12,617,102 |
| | | | | | | | | | | | | | | |
Debt | | | 2,794,156 | | | 635,833 | | | — | | | 550,463 | | | 3,980,451 |
Other liabilities | | | 738,092 | | | 188,088 | | | 992,580 | | | 44,258 | | | 1,963,018 |
Equity / (deficit) | | | 3,941,551 | | | 1,303,245 | | | 16,475 | | | 1,011,361 | | | 6,272,632 |
Total Liabilities and Equity | | | $7,473,799 | | | $2,127,166 | | | $1,009,055 | | | $1,606,082 | | | $12,216,102 |
| | | | | | | | | | | | | | | |
Digital Realty's ownership percentage | | | Various | | | Various | | | Various | | | 38% | | | |
| | | | | | | | | | | | | | | |
Digital Realty's Pro Rata Share of Unconsolidated JV Debt | | | $927,132 | | | $309,994 | | | — | | | $211,846 | | | $1,448,972 |
Summary Statement of Operations - | | Three Months Ended December 31, 2024 | |||||||||||||
at the JV's 100% Share | | | Americas (1) | | | APAC (2) | | | EMEA (3) | | | Global (4) | | | Total |
| | | | | | | | | | | | | | | |
Total revenues |
|
| $215,331 |
|
| $71,559 |
|
| $4,164 |
|
| $33,120 |
|
| $324,174 |
Operating expenses | | | (89,750) | | | (32,908) | | | (2,608) | | | (13,711) | | | (138,977) |
Net Operating Income (NOI) | | | $125,581 | | | $38,651 | | | $1,556 | | | $19,409 | | | $185,197 |
| | | | | | | | | | | | | | | |
Straight-line rent | | | (2,595) | | | 211 | | | (114) | | | (329) | | | (2,827) |
Above and below market rent | | | 1,028 | | | — | | | (441) | | | (1,575) | | | (988) |
Cash Net Operating Income (NOI) | | | $124,014 | | | $38,862 | | | $1,002 | | | $17,504 | | | $181,382 |
| | | | | | | | | | | | | | | |
Interest expense | | | ($58,436) | | | ($1,457) | | | ($3,214) | | | ($8,628) | | | ($71,734) |
Depreciation & amortization | | | (110,014) | | | (15,323) | | | (2,467) | | | (17,655) | | | (145,458) |
Other income / (expense) | | | 36,836 | | | (3,911) | | | 520 | | | (28,692) | | | 4,753 |
FX remeasurement on USD debt | | | (83,632) | | | — | | | 3,851 | | | 25,769 | | | (54,012) |
Total Non-Operating Expenses | | | ($215,246) | | | ($20,691) | | | ($1,310) | | | ($29,205) | | | ($266,452) |
| | | | | | | | | | | | | | | |
Net Income / (Loss) | | | ($89,665) | | | $17,960 | | | $245 | | | ($9,797) | | | ($81,256) |
| | | | | | | | | | | | | | | |
| | | | | | | | | | | | | | | |
Digital Realty's Pro Rata Share of Unconsolidated JV NOI | | | $39,541 | | | $19,324 | | | $441 | | | $8,215 | | | $67,521 |
| | | | | | | | | | | | | | | |
Digital Realty's Pro Rata Share of Unconsolidated JV Cash NOI | | | $39,053 | | | $19,429 | | | $330 | | | $7,309 | | | $66,121 |
| | | | | | | | | | | | | | | |
Digital Realty's Earnings (loss) income from unconsolidated joint ventures | | | ($45,281) | | | $8,980 | | | $3,301 | | | ($3,201) | | | ($36,201) |
| | | | | | | | | | | | | | | |
Digital Realty's Pro Rata Share of Core FFO (5) | | | $8,690 | | | $16,626 | | | $1,611 | | | $6,919 | | | $33,846 |
| | | | | | | | | | | | | | | |
Digital Realty's Fee Income from Joint Ventures | | | $14,547 | | | $891 | | | $621 | | | $3,456 | | | $19,515 |
| (1) | Includes Ascenty, Blackstone NoVa, Clise, GI Partners, Mapletree, Menlo, Mitsubishi, Realty Income, TPG Real Estate, and Walsh. |
| (2) | Includes Digital Connexion, Lumen, and MC Digital Realty. |
| (3) | Includes Blackstone Frankfurt, Blackstone Paris, Medallion, and Mivne. |
| (4) | Includes Digital Core REIT. |
| (5) | For a definition of Core FFO, see page 31. |
Note: Digital Realty’s ownership percentages in the Joint Ventures vary.
29
Reconciliation of Earnings Before Interest, Taxes, Depreciation & Amortization and Financial Ratios |
| Financial Supplement |
|---|---|---|
Unaudited and Dollars in Thousands | Fourth Quarter 2024 |
| | Three Months Ended | |||||||||||||
Reconciliation of Earnings Before Interest, Taxes, Depreciation & Amortization (EBITDA) (1) | | | 31-Dec-24 | | | 30-Sep-24 | | | 30-Jun-24 | | | 31-Mar-24 | | | 31-Dec-23 |
| | | | | | | | | | | | | | | |
Net Income / (Loss) Available to Common Stockholders | | | $179,388 | | | $41,012 | | | $70,039 | | | $271,327 | | | $18,122 |
Interest |
|
| 104,742 |
|
| 123,803 |
|
| 114,756 |
|
| 109,535 |
|
| 113,638 |
Loss on debt extinguishment and modifications | | | 2,165 | | | 2,636 | | | — | | | 1,070 | | | — |
Income tax expense (benefit) | | | 4,928 | | | 12,427 | | | 14,992 | | | 22,413 | | | 20,724 |
Depreciation & amortization | | | 455,355 | | | 459,997 | | | 425,343 | | | 431,102 | | | 420,475 |
EBITDA | | | $746,578 | | | $639,875 | | | $625,130 | | | $835,446 | | | $572,958 |
Unconsolidated JV real estate related depreciation & amortization | | | 49,463 | | | 48,474 | | | 47,117 | | | 47,877 | | | 64,833 |
Unconsolidated JV interest expense and tax expense | | | 32,255 | | | 34,951 | | | 27,704 | | | 34,271 | | | 42,140 |
Severance, equity acceleration and legal expenses | | | 2,346 | | | 2,481 | | | 884 | | | 791 | | | 7,565 |
Transaction and integration expenses | | | 11,797 | | | 24,194 | | | 26,072 | | | 31,839 | | | 40,226 |
(Gain) / loss on sale of investments | | | (144,885) | | | 556 | | | (173,709) | | | (277,787) | | | 103 |
Provision for impairment | | | 22,881 | | | — | | | 168,303 | | | — | | | 5,363 |
Other non-core adjustments, net (2) | | | 24,539 | | | 8,642 | | | 743 | | | 21,608 | | | (35,439) |
Non-controlling interests | | | (3,881) | | | (11,059) | | | (5,552) | | | 6,329 | | | (8,419) |
Preferred stock dividends | | | 10,181 | | | 10,181 | | | 10,181 | | | 10,181 | | | 10,181 |
Adjusted EBITDA | | | $751,276 | | | $758,296 | | | $726,874 | | | $710,556 | | | $699,509 |
| (1) | For definitions and discussion of EBITDA and Adjusted EBITDA, see the Definitions section. |
| (2) | Includes foreign exchange net unrealized gains/losses attributable to remeasurement, deferred rent adjustments related to a customer bankruptcy, write offs associated with bankrupt or terminated customers, non-recurring legal and insurance expenses, gain on sale of land option and lease termination fees. |
| | Three Months Ended | |||||||||||||
Financial Ratios | | | 31-Dec-24 | | | 30-Sep-24 | | | 30-Jun-24 | | | 31-Mar-24 | | | 31-Dec-23 |
| | | | | | | | | | | | | | | |
Total GAAP interest expense |
|
| $104,742 |
|
| $123,803 |
|
| $114,756 |
|
| $109,535 |
|
| $113,638 |
Capitalized interest | | | 34,442 | | | 28,312 | | | 27,592 | | | 28,522 | | | 33,032 |
Change in accrued interest and other non-cash amounts | | | (58,137) | | | 43,720 | | | (55,605) | | | 55,421 | | | (66,013) |
Cash Interest Expense (3) | | | $81,046 | | | $195,835 | | | $86,743 | | | $193,479 | | | $80,657 |
| | | | | | | | | | | | | | | |
Preferred stock dividends | | | 10,181 | | | 10,181 | | | 10,181 | | | 10,181 | | | 10,181 |
Total Fixed Charges (4) | | | $149,364 | | | $162,296 | | | $152,529 | | | $148,239 | | | $156,851 |
| | | | | | | | | | | | | | | |
| | | | | | | | | | | | | | | |
Coverage | | | | | | | | | | | | | | | |
Interest coverage ratio (5) | | | 4.5x | | | 4.3x | | | 4.3x | | | 4.3x | | | 4.2x |
Cash interest coverage ratio (6) | | | 6.9x | | | 3.4x | | | 6.4x | | | 6.3x | | | 3.2x |
Fixed charge coverage ratio (7) | | | 4.2x | | | 4.1x | | | 4.1x | | | 4.0x | | | 4.0x |
Cash fixed charge coverage ratio (8) | | | 6.3x | | | 3.3x | | | 5.9x | | | 3.1x | | | 5.9x |
| | | | | | | | | | | | | | | |
Leverage | | | | | | | | | | | | | | | |
Debt to total enterprise value (9)(10) | | | 21.4% | | | 23.5% | | | 24.2% | | | 24.2% | | | 26.7% |
Debt-plus-preferred-stock-to-total-enterprise-value (10)(11) | | | 22.3% | | | 24.5% | | | 25.3% | | | 25.3% | | | 27.9% |
Pre-tax income to interest expense (12) | | | 2.8x | | | 1.3x | | | 1.7x | | | 3.5x | | | 1.2x |
Net Debt-to-Adjusted EBITDA (13) | | | 4.8x | | | 5.4x | | | 5.3x | | | 5.7x | | | 6.0x |
| (3) | Cash interest expense is interest expense less amortization of debt discount and deferred financing fees and includes interest that we capitalized. We consider cash interest expense to be a useful measure of interest as it excludes non-cash-based interest expense. |
| (4) | Fixed charges consist of GAAP interest expense, capitalized interest, and preferred stock dividends. |
| (5) | Adjusted EBITDA divided by GAAP interest expense plus capitalized interest (including our pro rata share of unconsolidated joint venture interest expense). |
| (6) | Adjusted EBITDA divided by cash interest expense (including our pro rata share of unconsolidated joint venture interest expense). |
| (7) | Adjusted EBITDA divided by fixed charges (including our pro rata share of unconsolidated joint venture fixed charges). |
| (8) | Adjusted EBITDA divided by the sum of cash interest expense and preferred stock dividends (including our pro rata share of unconsolidated joint venture cash fixed charges). |
| (9) | Total debt divided by market value of common equity plus debt plus preferred stock. |
| (10) | Total enterprise value defined as market value of common equity plus debt plus preferred stock. |
| (11) | Same as (9), except numerator includes preferred stock. |
| (12) | Calculated as net income plus interest expense divided by GAAP interest expense. |
| (13) | Calculated as total debt at balance sheet carrying value, plus capital lease obligations, plus Digital Realty’s pro rata share of unconsolidated joint venture debt, less cash and cash equivalents (including Digital Realty’s pro rata share of unconsolidated joint venture cash) divided by the product of Adjusted EBITDA (including Digital Realty’s pro rata share of unconsolidated joint venture EBITDA), multiplied by four. |
30
Funds From Operations (FFO):
We calculate funds from operations, or FFO, in accordance with the standards established by the National Association of Real Estate Investment Trusts (Nareit) in the Nareit Funds From Operations White Paper - 2018 Restatement. FFO is a non-GAAP financial measure and represents net income (loss) (computed in accordance with GAAP), excluding gain (loss) from the disposition of real estate assets, provision for impairment, real estate related depreciation and amortization (excluding amortization of deferred financing costs), our share of unconsolidated JV real estate related depreciation & amortization, net income attributable to non-controlling interests in operating partnership and reconciling items related to non-controlling interests. Management uses FFO as a supplemental performance measure because, in excluding real estate related depreciation and amortization and gains and losses from property dispositions and after adjustments for unconsolidated partnerships and joint ventures, it provides a performance measure that, when compared year over year, captures trends in occupancy rates, rental rates and operating costs. We also believe that, as a widely recognized measure of the performance of REITs, FFO will be used by investors as a basis to compare our operating performance with that of other REITs. However, because FFO excludes depreciation and amortization and captures neither the changes in the value of our data centers that result from use or market conditions, nor the level of capital expenditures and capitalized leasing commissions necessary to maintain the operating performance of our data centers, all of which have real economic effect and could materially impact our financial condition and results from operations, the utility of FFO as a measure of our performance is limited. Other REITs may not calculate FFO in accordance with the Nareit definition and, accordingly, our FFO may not be comparable to other REITs’ FFO. FFO should be considered only as a supplement to net income computed in accordance with GAAP as a measure of our performance.
Core Funds from Operations (Core FFO):
We present core funds from operations, or Core FFO, as a supplemental operating measure because, in excluding certain items that do not reflect core revenue or expense streams, it provides a performance measure that, when compared year over year, captures trends in our core business operating performance. We calculate Core FFO by adding to or subtracting from FFO (i) other non-core revenue adjustments, (ii) transaction and integration expenses, (iii) loss on debt extinguishment and modifications, (iv) gain on / issuance costs associated with redeemed preferred stock, (v) severance, equity acceleration and legal expenses, (vi) gain/loss on FX and derivatives revaluation, and (vii) other non-core expense adjustments. Because certain of these adjustments have a real economic impact on our financial condition and results from operations, the utility of Core FFO as a measure of our performance is limited. Other REITs may calculate Core FFO differently than we do and accordingly, our Core FFO may not be comparable to other REITs’ Core FFO. Core FFO should be considered only as a supplement to net income computed in accordance with GAAP as a measure of our performance.
Adjusted Funds from Operations (AFFO):
We present adjusted funds from operations, or AFFO, as a supplemental operating measure because, when compared year over year, it assesses our ability to fund dividend and distribution requirements from our operating activities. We also believe that, as a widely recognized measure of the operations of REITs, AFFO will be used by investors as a basis to assess our ability to fund dividend payments in comparison to other REITs, including on a per share and unit basis. We calculate AFFO by adding to or subtracting from Core FFO (i) non-real estate depreciation, (ii) amortization of deferred financing costs, (iii) amortization of debt discount/premium, (iv) non-cash stock-based compensation expense, (v) straight-line rental revenue, (vi) straight-line rental expense, (vii) above- and below-market rent amortization, (viii) deferred tax expense / (benefit), (ix) leasing compensation and internal lease commissions, and (x) recurring capital expenditures. Other REITs may calculate AFFO differently than we do and, accordingly, our AFFO may not be comparable to other REITs’ AFFO. AFFO should be considered only as a supplement to net income computed in accordance with GAAP as a measure of our performance.
We believe that earnings before interest, loss on debt extinguishment and modifications, income taxes, and depreciation and amortization, or EBITDA, and Adjusted EBITDA (as defined below), are useful supplemental performance measures because they allow investors to view our performance without the impact of non-cash depreciation and amortization or the cost of debt and, with respect to Adjusted EBITDA, (i) unconsolidated joint venture real estate related depreciation & amortization, (ii) unconsolidated joint venture interest expense and tax, (iii) severance, equity acceleration and legal expenses, (iv) transaction and integration expenses, (v) gain (loss) on sale / deconsolidation, (vi) provision for impairment, (vii) other non-core adjustments, net, (viii) non-controlling interests, (ix) preferred stock dividends, and (x) issuance costs associated with redeemed preferred stock. Adjusted EBITDA is EBITDA excluding (i) unconsolidated joint venture real estate related depreciation & amortization, (ii) unconsolidated joint venture interest expense and tax, (iii) severance, equity acceleration and legal expenses, (iv) transaction and integration expenses, (v) gain (loss) on sale / deconsolidation, (vi) provision for impairment, (vii) other non-core adjustments, net, (viii) non-controlling interests, (ix) preferred stock dividends, and (x) gain on / issuance costs associated with redeemed preferred stock. In addition, we believe EBITDA and Adjusted EBITDA are frequently used by securities analysts, investors, and other interested parties in the evaluation of REITs. Because EBITDA and Adjusted EBITDA are calculated before recurring cash charges including interest expense and income taxes, exclude capitalized costs, such as leasing commissions, and are not adjusted for capital expenditures or other recurring cash requirements of our business, their utility as a measure of our performance is limited. Other REITs may calculate EBITDA and Adjusted EBITDA differently than we do and, accordingly, our EBITDA and Adjusted EBITDA may not be comparable to other REITs’ EBITDA and Adjusted EBITDA. Accordingly, EBITDA and Adjusted EBITDA should be considered only as supplements to net income computed in accordance with GAAP as a measure of our financial performance.
31
Net Operating Income (NOI) and Cash NOI:
Net operating income, or NOI, represents rental revenue, tenant reimbursement revenue and interconnection revenue less utilities expense, rental property operating expenses, property taxes and insurance expenses (as reflected in the statement of operations). NOI is commonly used by stockholders, company management and industry analysts as a measurement of operating performance of the company’s rental portfolio. Cash NOI is NOI less straight-line rents and above- and below-market rent amortization. Cash NOI is commonly used by stockholders, company management and industry analysts as a measure of property operating performance on a cash basis. Same-Capital Cash NOI represents buildings owned as of December 31, 2022 of the prior year with less than 5% of total rentable square feet under development and excludes buildings that were undergoing, or were expected to undergo, development activities in 2023-2024, buildings classified as held for sale, and buildings sold or contributed to joint ventures for all periods presented (prior period numbers adjusted to reflect current same-capital pool). However, because NOI and cash NOI exclude depreciation and amortization and capture neither the changes in the value of our data centers that result from use or market conditions, nor the level of capital expenditures and capitalized leasing commissions necessary to maintain the operating performance of our data centers, all of which have real economic effect and could materially impact our results from operations, the utility of NOI and cash NOI as measures of our performance is limited. Other REITs may calculate NOI and cash NOI differently than we do and, accordingly, our NOI and cash NOI may not be comparable to other REITs’ NOI and cash NOI. NOI and cash NOI should be considered only as supplements to net income computed in accordance with GAAP as measures of our performance.
Additional Definitions
Net debt-to-Adjusted EBITDA ratio is calculated as total debt at balance sheet carrying value, plus capital lease obligations, plus Digital Realty’s pro rata share of unconsolidated joint venture debt, less cash and cash equivalents (including Digital Realty’s pro rata share of unconsolidated joint venture cash) divided by the product of Adjusted EBITDA (including Digital Realty’s pro rata share of unconsolidated joint venture EBITDA), multiplied by four.
Debt-plus-preferred-to-total enterprise value is total debt plus preferred stock divided by total debt plus the liquidation value of preferred stock and the market value of outstanding Digital Realty Trust, Inc. common stock and Digital Realty Trust, L.P. units, assuming the redemption of Digital Realty Trust, L.P. units for shares of Digital Realty Trust, Inc. common stock.
Fixed charge coverage ratio is Adjusted EBITDA divided by the sum of GAAP interest expense, capitalized interest and preferred stock dividends. For the quarter ended December 31, 2024, GAAP interest expense was $105 million, capitalized interest was $34 million and preferred stock dividends was $10 million.
Reconciliation of Net Operating Income (NOI) | | Three Months Ended | | | Twelve Months Ended | |||||||||||
(in thousands) |
| 31-Dec-24 |
| 30-Sep-24 |
| 31-Dec-23 |
|
| 31-Dec-24 |
| 31-Dec-23 | |||||
| |
| | |
| | |
| | | |
| | |
| |
Operating income | | | $144,322 | | | $168,286 | | | $134,035 | | | | $471,864 | | | $524,461 |
| | | | | | | | | | | | | | | | |
Fee income | | | (23,316) | | | (12,907) | | | (14,330) | | | | (64,888) | | | (44,926) |
Other income | | | (40) | | | (4,581) | | | (144) | | | | (7,608) | | | (1,963) |
Depreciation and amortization | | | 455,355 | | | 459,997 | | | 420,475 | | | | 1,771,797 | | | 1,694,859 |
General and administrative | | | 124,470 | | | 115,120 | | | 109,235 | | | | 473,521 | | | 431,004 |
Severance, equity acceleration and legal expenses | | | 2,346 | | | 2,481 | | | 7,565 | | | | 6,502 | | | 18,054 |
Transaction expenses | | | 11,797 | | | 24,194 | | | 40,226 | | | | 93,902 | | | 84,722 |
Provision for impairment | | | 22,881 | | | — | | | 5,363 | | | | 191,184 | | | 118,363 |
Other expenses | | | 12,002 | | | 4,774 | | | 5,580 | | | | 27,083 | | | 7,529 |
| | | | | | | | | | | | | | | | |
Net Operating Income | | | $749,818 | | | $757,365 | | | $708,003 | | | | $2,963,357 | | | $2,832,102 |
| | | | | | | | | | | | | | | | |
| | | | | | | | | | | | | | | | |
Cash Net Operating Income (Cash NOI) | | |
| | |
| | |
| | | |
| | |
|
| | | | | | | | | | | | | | | | |
Net Operating Income | | | $749,818 | | | $757,365 | | | $708,003 | | | | $2,963,357 | | | $2,832,102 |
| | | | | | | | | | | | | | | | |
Straight-line rental revenue | | | (22,577) | | | (18,423) | | | (22,085) | | | | (46,395) | | | (40,480) |
Straight-line rental expense | | | 51 | | | 1,683 | | | (4,745) | | | | 4,061 | | | (2,901) |
Above- and below-market rent amortization | | | (269) | | | (742) | | | (856) | | | | (3,555) | | | (4,404) |
| | | | | | | | | | | | | | | | |
Cash Net Operating Income | | | $727,022 | | | $739,883 | | | $680,317 | | | | $2,917,467 | | | $2,784,317 |
| | | | | | | | | | | | | | | | |
| | | | | | | | | | | | | | | | |
| | | | | | | | | | | | | | | | |
Constant Currency CFFO Reconciliation | | Three Months Ended | | | Twelve Months Ended | |||||||||||
(in thousands, except per share data) |
| 31-Dec-24 |
| |
| 31-Dec-23 |
|
| 31-Dec-24 |
| 31-Dec-23 | |||||
| |
| | |
| | |
| | | |
| | |
| |
Core FFO (1) | | | $586,816 | | | | | | $508,417 | | | | $2,215,194 | | | $2,009,820 |
Core FFO impact of holding '23 Exchange Rates Constant (2) | | | (318) | | | | | | — | | | | 1,732 | | | — |
| | | | | | | | | | | | | | | | |
Constant Currency Core FFO | | | $586,498 | | | | | | $508,417 | | | | $2,216,926 | | | $2,009,820 |
Weighted-average shares and units outstanding - diluted | | | 339,982 | | | | | | 312,356 | | | | 329,899 | | | 305,138 |
Constant Currency CFFO Per Share | | | $1.73 | | | | | | $1.63 | | | | $6.72 | | | $6.59 |
| 1) | As reconciled to net income above. |
| 2) | Adjustment calculated by holding currency translation rates for 2024 constant with average currency translation rates that were applicable to the same periods in 2023. |
32
This document contains forward-looking statements within the meaning of the federal securities laws, which are based on current expectations, forecasts and assumptions that involve risks and uncertainties that could cause actual outcomes and results to differ materially. Such forward-looking statements include statements relating to: our economic outlook, our expected investment and expansion activity, anticipated continued demand for our products and service, our liquidity, our joint ventures, supply and demand for data center and colocation space, our acquisition and disposition activity, pricing and net effective leasing economics, market dynamics and data center fundamentals, our strategic priorities, our product offerings, available inventory, rent from leases that have been signed but have not yet commenced and other contracted rent to be received in future periods, rental rates on future leases, lag between signing and commencement, cap rates and yields, investment activity, the company’s FFO, Core FFO, constant currency Core FFO, adjusted FFO, and net income, 2025 outlook and underlying assumptions, information related to trends, our strategy and plans, leasing expectations, weighted average lease terms, the exercise of lease extensions, lease expirations, debt maturities, annualized rent at expiration of leases, the effect new leases and increases in rental rates will have on our rental revenue, our credit ratings, construction and development activity and plans, projected construction costs, estimated yields on investment, expected occupancy, expected square footage and IT load capacity upon completion of development projects, backlog NOI, NAV components, and other forward-looking financial data. Such statements are based on management’s beliefs and assumptions made based on information currently available to management. Such statements are subject to risks, uncertainties and assumptions and are not guarantees of future performance and may be affected by known and unknown risks, trends, uncertainties, and factors that are beyond our control. Should one or more of these risks or uncertainties materialize, or should underlying assumptions prove incorrect, actual results may vary materially from those anticipated, estimated, or projected. Some of the risks and uncertainties that may cause our actual results, performance, or achievements to differ materially from those expressed or implied by forward-looking statements include, among others, the following:
| ● | reduced demand for data centers or decreases in information technology spending; |
| ● | decreased rental rates, increased operating costs or increased vacancy rates; |
| ● | increased competition or available supply of data center space; |
| ● | the suitability of our data centers and data center infrastructure, delays or disruptions in connectivity or availability of power, or failures or breaches of our physical and information security infrastructure or services; |
| ● | breaches of our obligations or restrictions under our contracts with our customers; |
| ● | our inability to successfully develop and lease new properties and development space, and delays or unexpected costs in development of properties; |
| ● | the impact of current global and local economic, credit and market conditions; |
| ● | global supply chain or procurement disruptions, or increased supply chain costs; |
| ● | the impact from periods of heightened inflation on our costs, such as operating and general and administrative expenses, interest expense and real estate acquisition and construction costs; |
| ● | the impact on our customers’ and our suppliers’ operations during an epidemic, pandemic, or other global events; |
| ● | our dependence upon significant customers, bankruptcy or insolvency of a major customer or a significant number of smaller customers, or defaults on or non-renewal of leases by customers; |
| ● | changes in political conditions, geopolitical turmoil, political instability, civil disturbances, restrictive governmental actions or nationalization in the countries in which we operate; |
| ● | our inability to retain data center space that we lease or sublease from third parties; |
| ● | information security and data privacy breaches; |
| ● | difficulties managing an international business and acquiring or operating properties in foreign jurisdictions and unfamiliar metropolitan areas; |
| ● | our failure to realize the intended benefits from, or disruptions to our plans and operations or unknown or contingent liabilities related to, our recent and future acquisitions; |
| ● | our failure to successfully integrate and operate acquired or developed properties or businesses; |
| ● | difficulties in identifying properties to acquire and completing acquisitions; |
| ● | risks related to joint venture investments, including as a result of our lack of control of such investments; |
| ● | risks associated with using debt to fund our business activities, including re-financing and interest rate risks, our failure to repay debt when due, adverse changes in our credit ratings or our breach of covenants or other terms contained in our loan facilities and agreements; |
| ● | our failure to obtain necessary debt and equity financing, and our dependence on external sources of capital; |
| ● | financial market fluctuations and changes in foreign currency exchange rates; |
| ● | adverse economic or real estate developments in our industry or the industry sectors that we sell to, including risks relating to decreasing real estate valuations and impairment charges and goodwill and other intangible asset impairment charges; |
| ● | our inability to manage our growth effectively; |
| ● | losses in excess of our insurance coverage; |
| ● | our inability to attract and retain talent; |
| ● | environmental liabilities, risks related to natural disasters and our inability to achieve our sustainability goals; |
| ● | the expected operating performance of anticipated near-term acquisitions and descriptions relating to these expectations; |
| ● | our inability to comply with rules and regulations applicable to our company; |
| ● | Digital Realty Trust, Inc.’s failure to maintain its status as a REIT for federal income tax purposes; |
| ● | Digital Realty Trust, L.P.’s failure to qualify as a partnership for federal income tax purposes; |
| ● | restrictions on our ability to engage in certain business activities; |
| ● | changes in local, state, federal and international laws, and regulations, including related to taxation, real estate, and zoning laws, and increases in real property tax rates; and |
| ● | the impact of any financial, accounting, legal or regulatory issues or litigation that may affect us. |
The risks included here are not exhaustive, and additional factors could adversely affect our business and financial performance. Several additional material risks are discussed in our annual report on Form 10-K for the year ended December 31, 2023, and other filings with the U.S. Securities and Exchange Commission. Those risks continue to be relevant to our performance and financial condition. Moreover, we operate in a competitive and rapidly changing environment. New risk factors emerge from time to time and it is not possible for management to predict all such risk factors, nor can it assess the impact of all such risk factors on the business or the extent to which any factor, or combination of factors, may cause actual results to differ materially from those contained in any forward-looking statements. We expressly disclaim any responsibility to update forward-looking statements, whether as a result of new information, future events or otherwise. Digital Realty, Digital Realty Trust, the Digital Realty logo, Interxion, Turn-Key Flex, Powered Base Building, ServiceFabric, AnyScale Colo, Pervasive Data Center Architecture, PlatformDIGITAL, PDx, Data Gravity Index and Data Gravity Index DGx are registered trademarks and service marks of Digital Realty Trust, Inc. in the United States and/or other countries. All other names, trademarks and service marks are the property of their respective owners.
33