DOLLAR TREE, INC. REPORTS RESULTS FOR THE SECOND QUARTER FISCAL 2021
~ Diluted EPS Increased 11.8% year-over-year to $1.23; and 61.8% Compared to Q2 2019 ~
~ Enterprise Operating Margin Improved 30 Basis Points to 6.3% ~
~ Company Repurchased 7.0 Million Shares for $700 Million ~
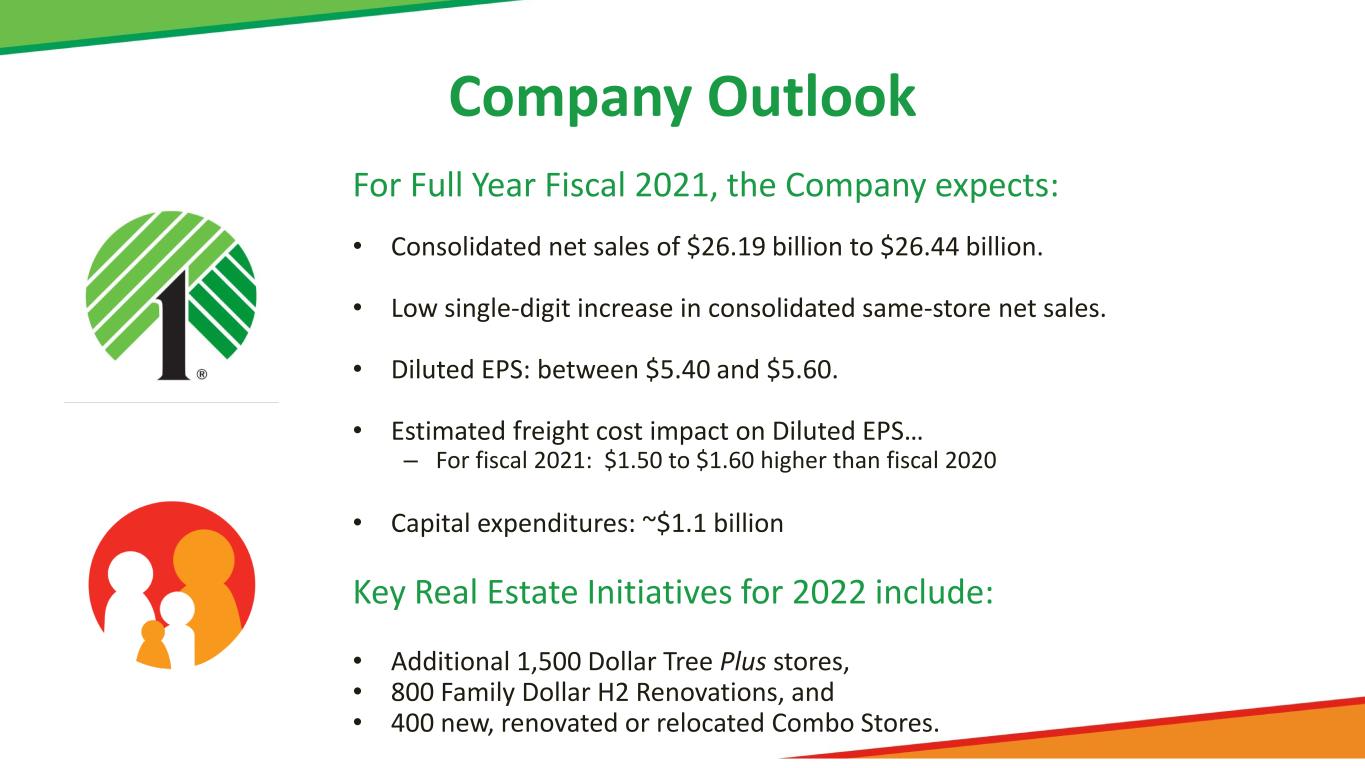
~ Key Real Estate Initiatives for Fiscal 2022 Include: 1,500 Dollar Tree Plus Stores;
800 Family Dollar H2 Renovations; and 400 New or Renovated Combo Stores ~
CHESAPEAKE, Va.--August 26, 2021--Dollar Tree, Inc. (NASDAQ: DLTR), today reported financial results for its second quarter ended July 31, 2021.
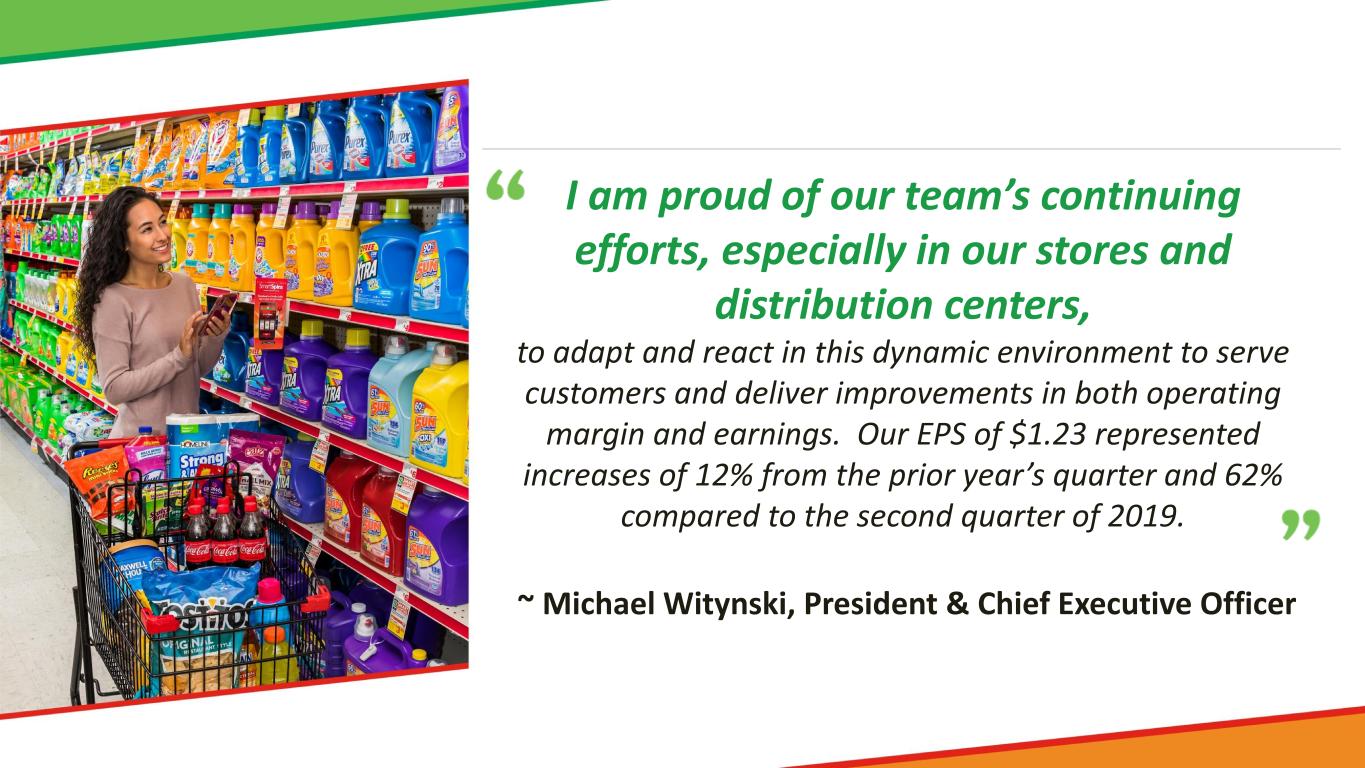
“I am proud of our team’s continuing efforts, especially in our stores and distribution centers, to adapt and react in this dynamic environment to serve customers and deliver improvements in both operating margin and earnings,” stated Michael Witynski, President and Chief Executive Officer. “Our EPS of $1.23 represented increases of 12% from the prior year’s quarter and 62% compared to the second quarter of 2019. We continued to see strong performance on the discretionary side of the business, and our key initiatives, including H2, Dollar Tree Plus and the new Combo Stores, are delivering compelling results. All three concepts have performed very well and we are significantly accelerating these initiatives in 2022 and beyond.”
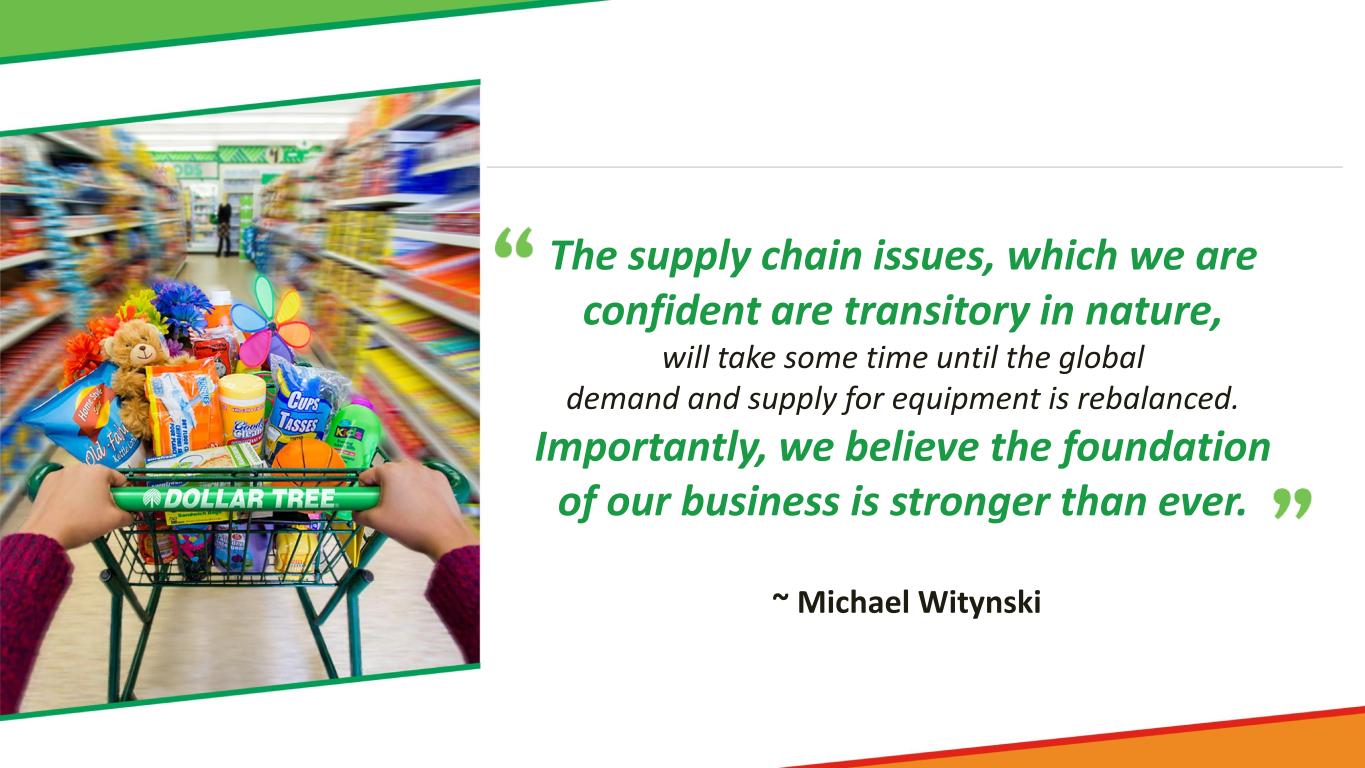
Witynski added, “Regarding the continuing and well-publicized challenges in the global supply chain, as well as higher freight costs and other inflationary pressures, our teams are working hard to navigate these issues while staying focused, as always, on delivering the value and convenience our shoppers expect.”
Second Quarter Results
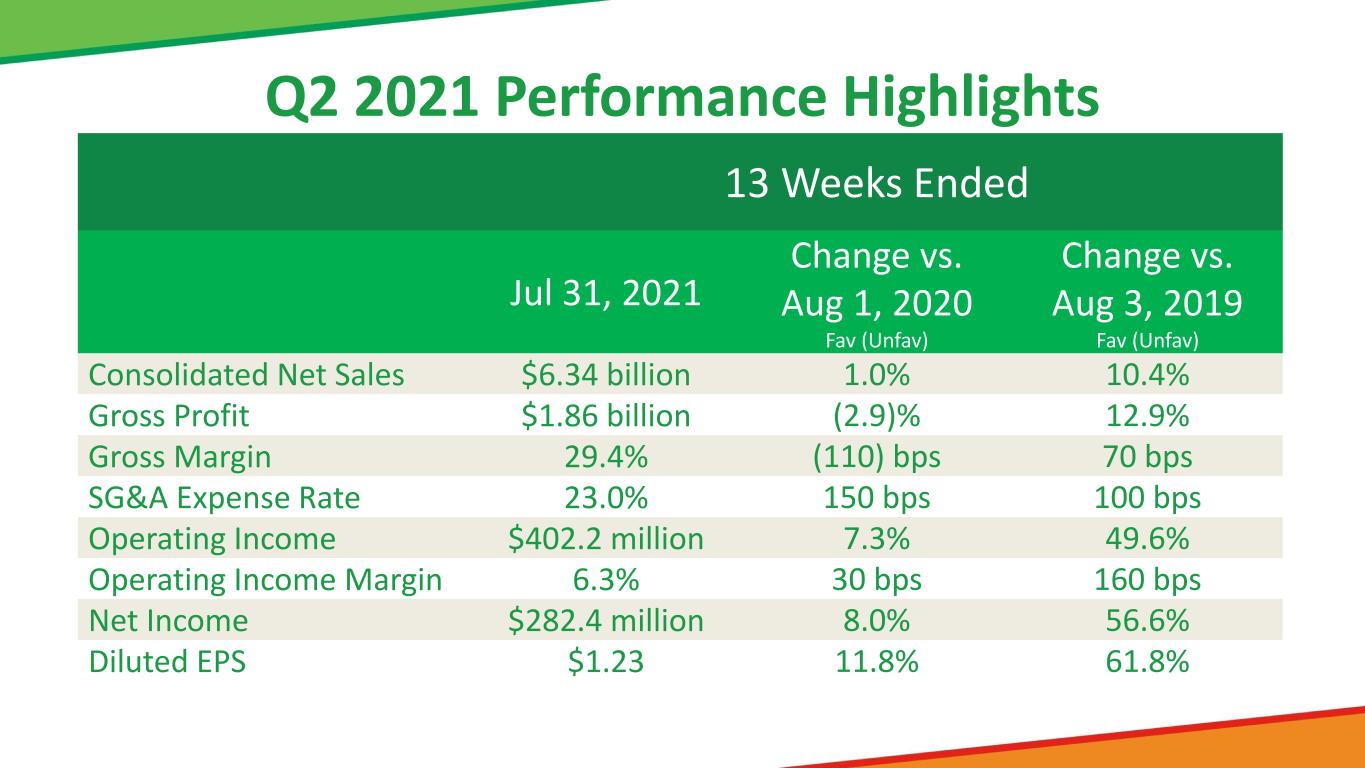
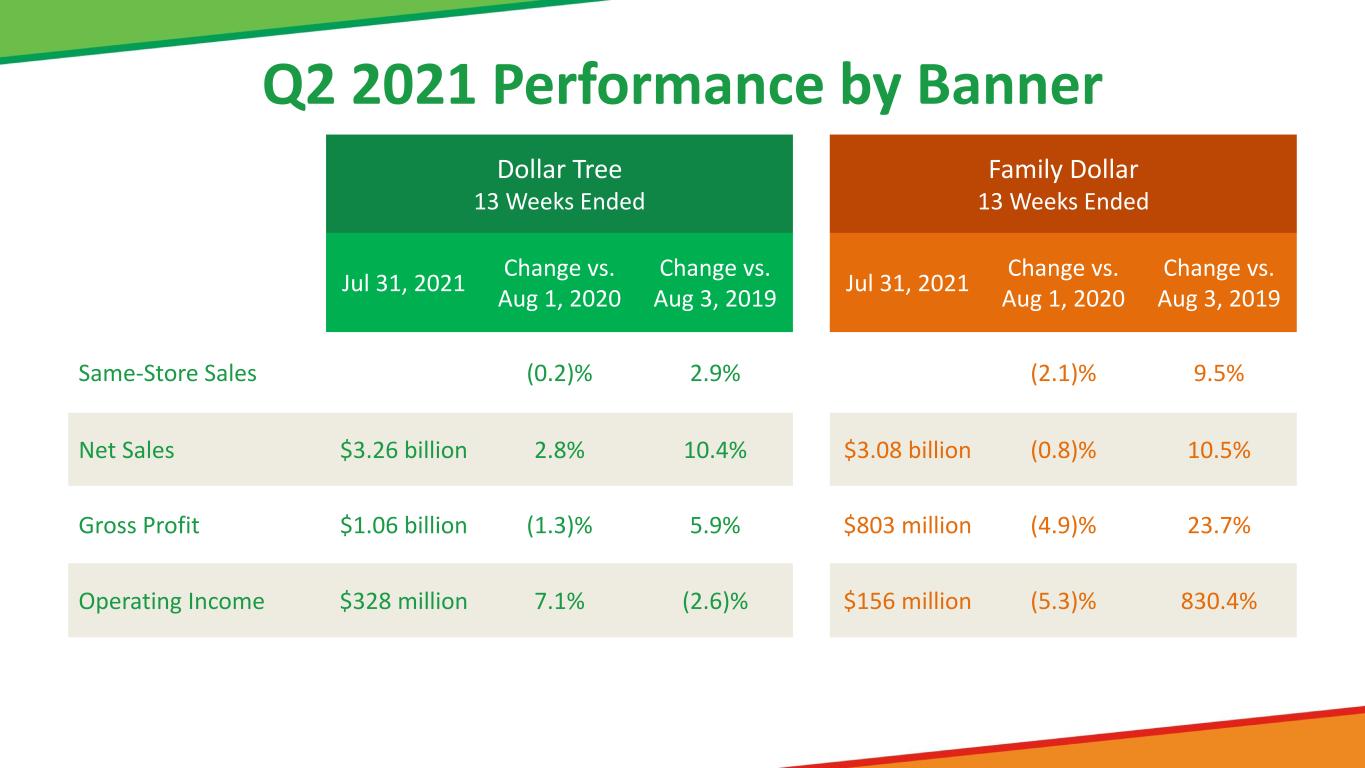
Consolidated net sales increased 1.0% to $6.34 billion from $6.28 billion in the prior year’s second quarter. Enterprise same-store sales decreased 1.2% on a constant currency basis (or 1.1% when adjusted to include the impact of Canadian currency fluctuations), and increased 6.0% on a two-year stacked basis. Dollar Tree same-store sales decreased 0.2% on a constant currency basis (or were flat when adjusted to include the impact of Canadian currency fluctuations). Same-store sales for Family Dollar decreased 2.1%, cycling the strong 11.6% increase in the prior year’s quarter.
Gross profit was $1.86 billion for the quarter. Gross margin was 29.4% of net sales, compared to 30.5% in the prior year’s quarter. The decrease in gross margin was driven primarily by higher freight costs, partially offset by the continuing improvement in shrink results.
Selling, general and administrative expenses improved 150 basis points to 23.0% of total revenue compared to 24.5% in the prior year's second quarter. The Company was cycling COVID-19-related costs of $123.5 million in the prior year’s quarter.
Operating income for the quarter improved 7.3% to $402.2 million compared with $374.9 million in the same period last year and operating income margin was 6.3% in the current quarter compared to 6.0% in last year’s quarter.
Net income was $282.4 million in the second quarter and diluted earnings per share for the quarter increased 11.8% to $1.23, compared to $1.10 per share in the prior year’s quarter.
The Company repurchased 7,006,326 shares during the quarter for $700 million. As of July 31, the Company had $1.45 billion remaining on its share repurchase authorization.
The Company opened 131 new stores, expanded or relocated 30 stores, and closed 37 stores. Additionally, the Company completed 470 renovations to the Family Dollar H2 or Combo Store formats. Retail selling square footage at quarter end
was approximately 126.8 million square feet.
First Six Months Results
Consolidated net sales increased 2.0% to $12.82 billion from $12.56 billion in the same period last year. Enterprise same-store sales decreased 0.2% on a constant currency basis (or 0.1% when adjusted to include the impact of Canadian currency fluctuations). Dollar Tree same-store sales increased 2.2% on a constant currency basis (or 2.4% when adjusted to include the impact of Canadian currency fluctuations). Same-store sales for Family Dollar decreased 2.5%, cycling a strong 13.6% increase in the same period a year ago.
Gross profit for the first six months increased 3.1% to $3.83 billion. Gross margin improved to 29.8% of net sales, compared to 29.5% in the prior year period.
Selling, general and administrative expenses improved to 22.7% of total revenue compared to 23.6% in the first six months of 2020.
Operating income for the period improved 24.5% to $922.1 million. Operating income margin increased 130 basis points to 7.2% in the current year period from 5.9% in the prior year.
Net income compared to the prior year period improved 29.0% to $656.9 million and diluted earnings per share increased 32.2% to $2.83 compared to $2.14 in the prior year period.
The Company repurchased 9,156,898 shares in the first six months of fiscal 2021 for $950 million.
Update on Key Real Estate Initiatives – H2, Dollar Tree Plus and Combo Stores
The Company continues to take a deliberate approach to managing its footprint to ensure it is well-positioned to serve customers across urban, suburban and rural markets. The Family Dollar H2 stores continue to perform very well. The Company renovated 435 stores in the second quarter, bringing the total number of H2 stores to 3,300. Following a variety of tests of different store formats, the Company also plans to accelerate the Dollar Tree Plus initiative and the rollout of its Combo Store format to better serve customer needs and drive long-term sustainable value creation.
Dollar Tree Plus
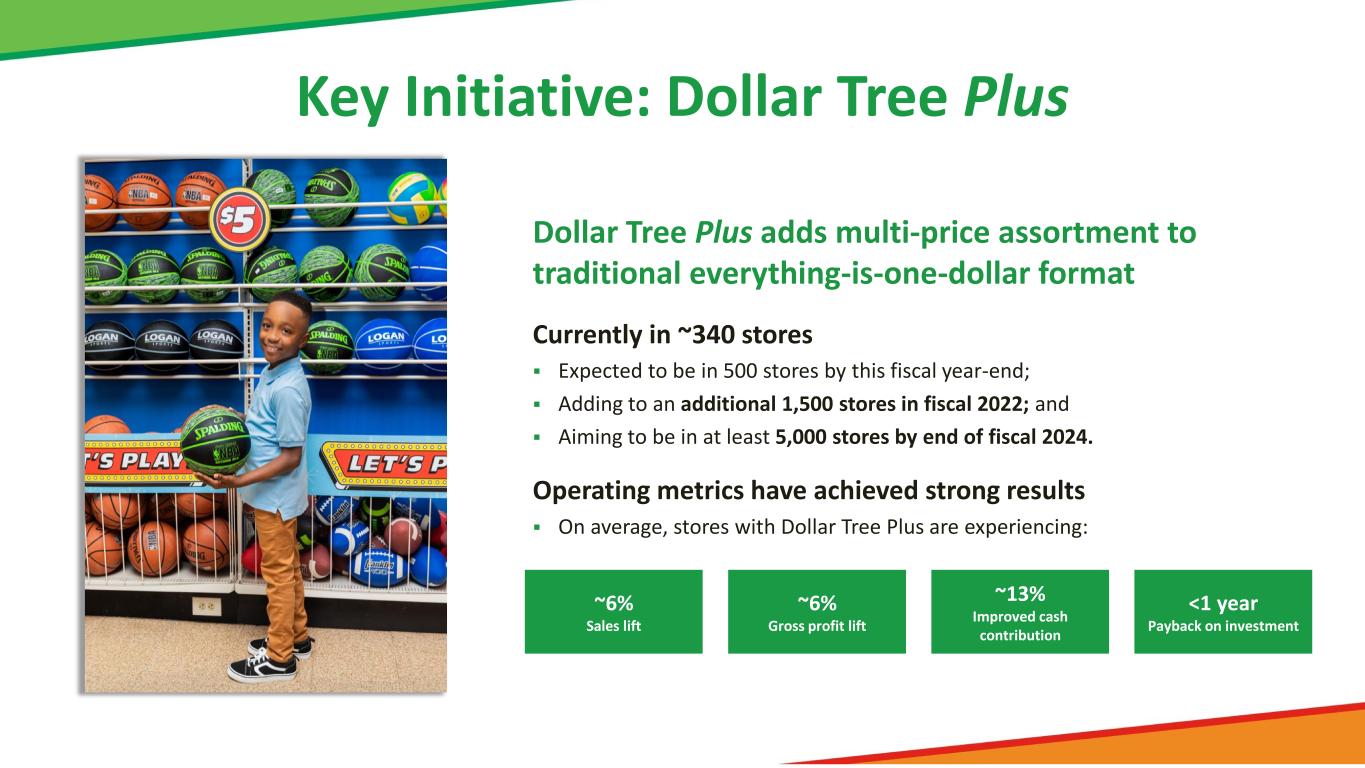
The Company has been carefully improving and calibrating its Dollar Tree Plus initiative, which adds a multi-price assortment to the traditional everything-is-one-dollar format that has been so popular with customers. The Company’s latest iteration has proven to be a big hit with customers, who are now embracing the Dollar Tree Plus concept as it provides Dollar Tree shoppers with extraordinary value in the discretionary categories they most desire, which is enhancing store productivity. The Company currently has the multi-price assortment in approximately 340 stores and expects to hit its fiscal 2021 target of 500 stores by year-end.
“Our merchandising team has worked tirelessly to refine and improve the Dollar Tree Plus program. Despite stronger than anticipated sell-through and global supply chain challenges, I am pleased we are on schedule to have the multi-price assortment in 500 stores by year-end,” said Witynski. “Due to its continued success, we are planning to add Dollar Tree Plus to an additional 1,500 stores in fiscal 2022, and aim to have at least 5,000 Dollar Tree Plus stores by the end of 2024. Many of our new stores will be opened as Dollar Tree Plus stores.”
As the Company has continued to refine Dollar Tree Plus, the operating metrics have reached strong levels and have provided the Company valuable insights that are enabling the expansion of the concept. On average, stores with Dollar Tree Plus are experiencing an overall sales lift of approximately 6%, with a similar lift to gross profit, improved cash contribution of approximately 13%, and a payback on the investment of less than one year.
Combo Stores
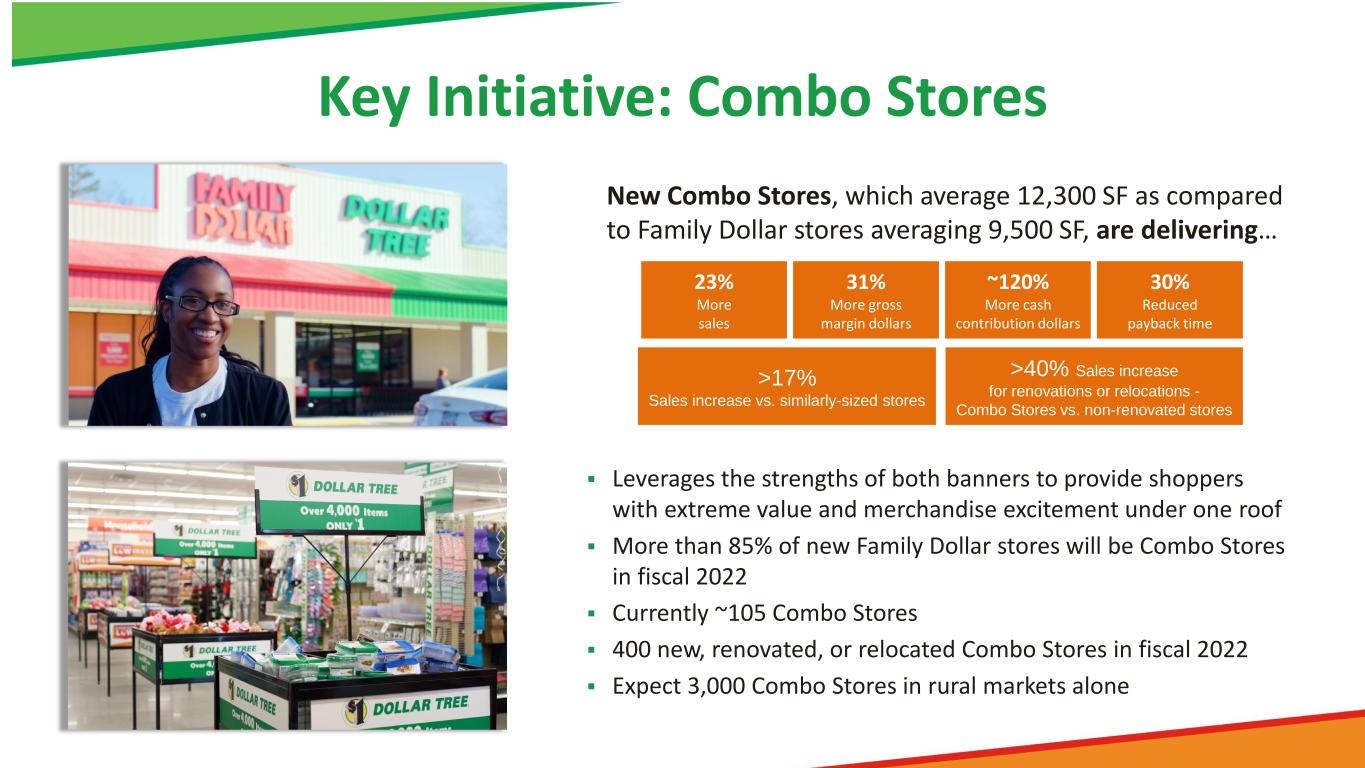
In March 2021, the Company announced its newest store format, the Combo Store, which leverages the strengths of both banners - under one roof - to provide shoppers with extreme value and merchandise excitement. The Combo Store represents another way to introduce the multi-price assortment to Dollar Tree shoppers, and the one-dollar assortment to Family Dollar shoppers, a major benefit from the Dollar Tree and Family Dollar combination. The Company currently has 105 Combo Stores operating.
“Our shoppers love the Combo Stores. We are seeing materially increased sales and margin dollars, better returns and improved paybacks with this format. The performance of Combo Stores continues to exceed our expectations. We believe there is an opportunity for up to 3,000 Combo Stores in rural markets alone,” continued Witynski. “Demonstrating our great confidence in Combo Stores as a key strategic format, more than 85% of our new Family Dollar stores will be Combo Stores in fiscal 2022. We anticipate 400 new, renovated, or relocated Combo Stores next year. Additionally, we are in the process of validating this concept in other demographic markets.”
When comparing new Combo Stores, averaging 12,300 gross square feet, to Family Dollar stores which average 9,500 gross square feet, the Combo Stores, on average, are delivering: 23% more sales; 31% more gross margin dollars; approximately 120% more cash contribution dollars, and reducing payback time by approximately 30%. New Combo Stores compared to similarly-sized Family Dollar stores are showing a sales increase of over 17%, and renovated or relocated Combo Stores are showing a sales increase of over 40% when compared to Family Dollar stores that have not been renovated or relocated.
A video, photos, store features and customer testimonials of the Combo Stores is available online at: www.FamilyDollar.com/ComboStores.
Company Outlook and Liquidity
The Company estimates consolidated net sales for the third quarter of 2021 will range from $6.40 billion to $6.52 billion, based on a low single-digit increase in same-store sales for the combined enterprise. Diluted earnings per share are estimated to be in the range of $0.88 to $0.98.
Consolidated net sales for full-year fiscal 2021 are expected to range from $26.19 billion to $26.44 billion, based on a low single-digit increase in same-store sales and 3.4% square footage growth. The Company now estimates diluted earnings per share will range from $5.40 to $5.60.
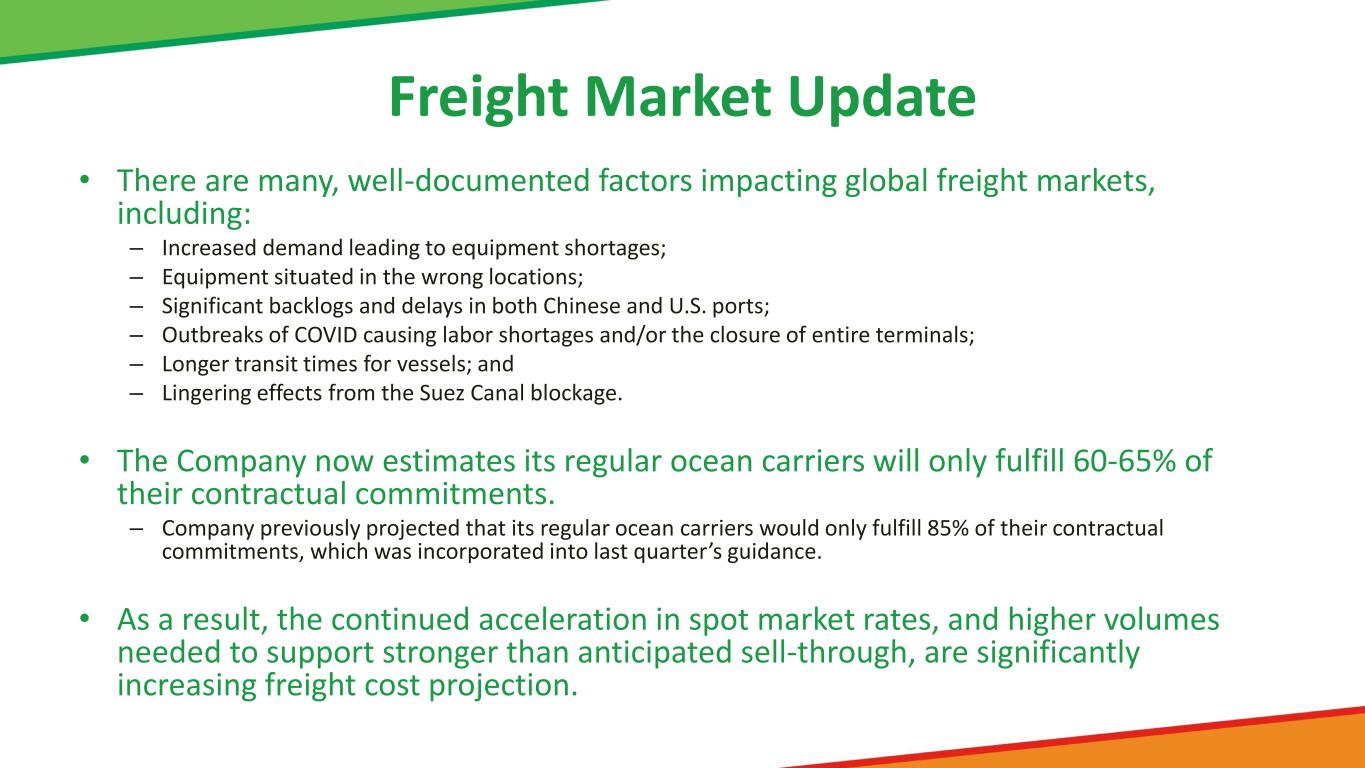
Freight costs for fiscal 2021 are now expected to be $1.50 to $1.60 per diluted share higher than fiscal year 2020. The updated outlook includes $0.60 to $0.65 per diluted share, or $185 million to $200 million, of additional freight costs since the Company’s prior guidance on May 27, 2021.
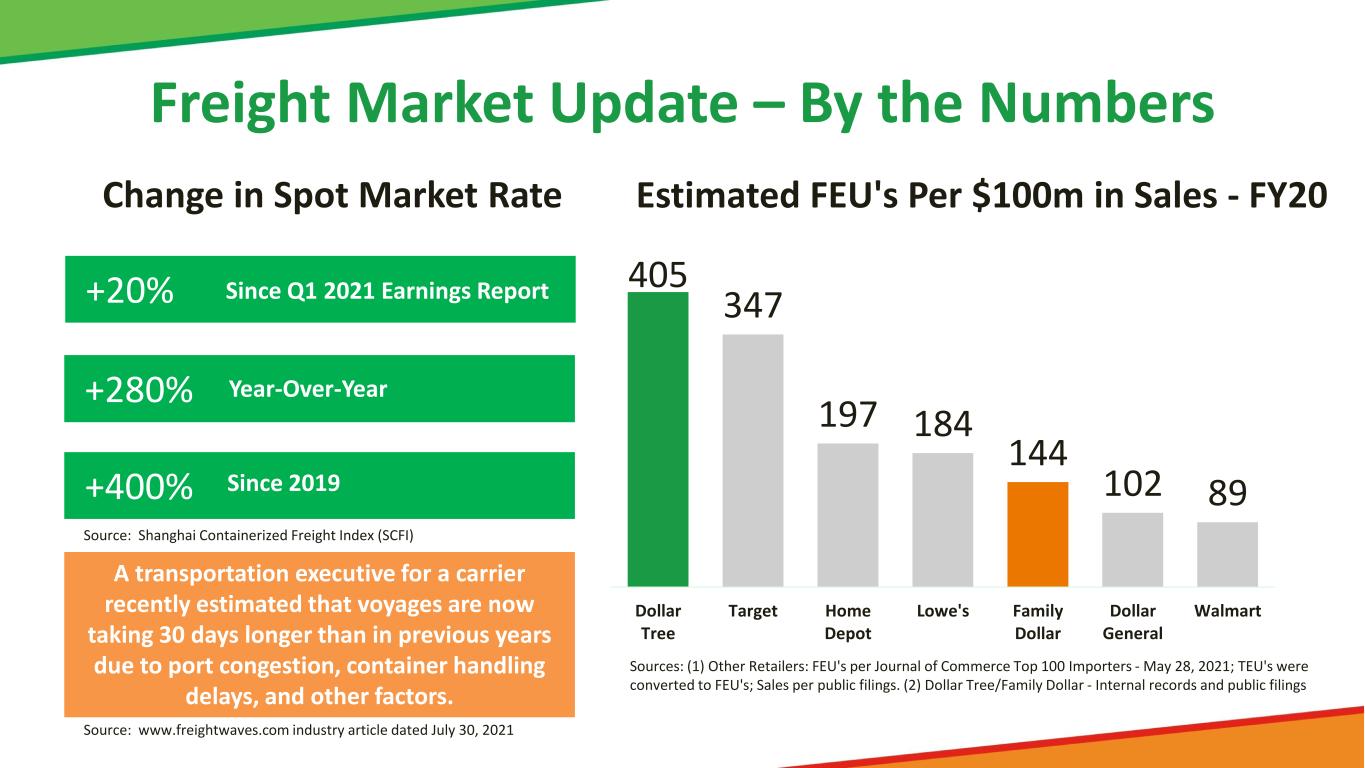
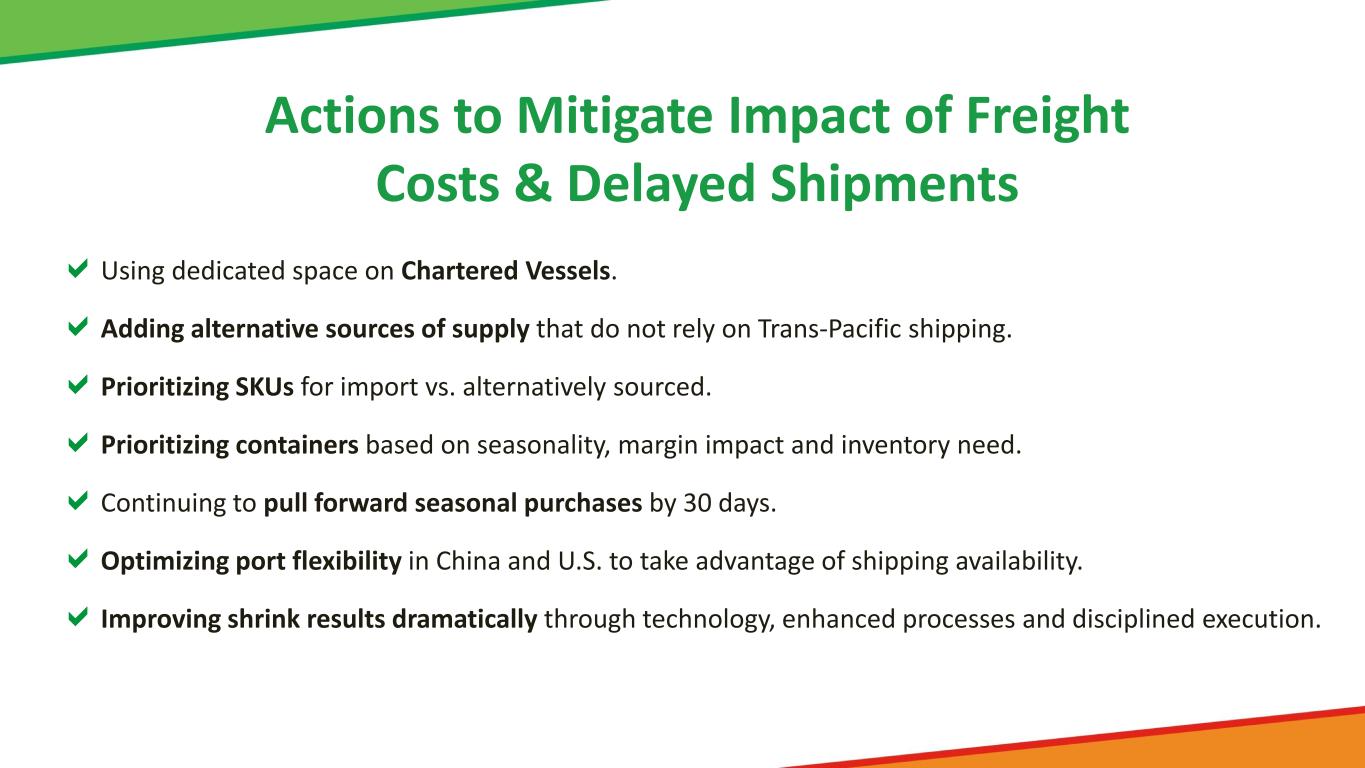
After the first quarter of 2021, the Company’s updated freight outlook assumed that its regular ocean carriers would fulfill only 85% of their contractual commitments and also assumed higher spot market rates. However, the Company now projects that its regular carriers will fulfill only 60-65% of their commitments. Additionally, the spot market rates for ocean freight from China have continued to trend upward from all-time highs, and have increased more than 20% since the Company last reported earnings in May. The Company expects continued volatility with respect to the ocean carriers ability to fulfill contractual commitments. The Dollar Tree banner is highly sensitive to freight costs, and while the Company does not expect these conditions to be permanent, the Company continues to undertake steps to mitigate the impact from freight and otherwise improve gross merchandise margin.
Outstanding debt, as of July 31, was $3.25 billion. The Company ended the quarter with approximately $721 million in cash and cash equivalents on its balance sheet and now expects capital expenditures for fiscal 2021 will total approximately $1.1 billion. A majority of the excess cash flow generated may be dedicated to share repurchases under the Company’s current $1.45 billion remaining on its authorization.
“We are confident in the accelerated expansion of our key initiatives, which will further leverage our brands to deliver long-term value to our shareholders,” Witynski concluded. “Despite the current global supply chain disruptions and the inflationary pressures, we are more excited than ever about the opportunities ahead of us. I want to thank our entire team for their efforts, commitment, dedication and focus to continue delivering value and convenience to millions of households across North America.”
Conference Call Information
On Thursday, August 26, 2021, the Company will host a conference call to discuss its earnings results at 9:00 a.m. Eastern Time. The telephone number for the call is 866-548-4713. A recorded version of the call will be available until midnight Wednesday, September 1, 2021, and may be accessed by dialing 888-203-1112. The access code is 9288176. A webcast of the call is accessible through Dollar Tree's website and will remain online through Wednesday, September 1, 2021.
Supplemental financial information for the second quarter is available on the Investor Relations portion of the Company’s
website, at www.DollarTreeInfo.com/Presentations.
Dollar Tree, a Fortune 200 Company, operated 15,865 stores across 48 states and five Canadian provinces as of July 31, 2021. Stores operate under the brands of Dollar Tree, Family Dollar, and Dollar Tree Canada. To learn more about the Company, visit www.DollarTree.com and www.FamilyDollar.com.
A WARNING ABOUT FORWARD-LOOKING STATEMENTS: Our press release contains "forward-looking statements" as that term is used in the Private Securities Litigation Reform Act of 1995. Forward-looking statements can be identified by the fact that they address future events, developments or results and do not relate strictly to historical facts. Any statements contained in this press release that are not statements of historical fact may be deemed to be forward-looking statements. Forward-looking statements include, without limitation, statements preceded by, followed by or including words such as: “aim”, “believe”, “anticipate”, “expect”, “intend”, “plan”, “view”, “target” or “estimate”, “may”, “will”, “should”, “predict”, “possible”, “potential”, “continue”, “strategy”, and similar expressions. For example, our forward-looking statements include statements regarding our plans and expectations concerning various initiatives, including the expansion of Dollar Tree Plus, Family Dollar H2 stores and Combo Stores (which are dependent on supply chain performance and continued store performance); the growth potential of our Combo Store initiative in rural and other demographic markets; our expectations of continued volatility and uncertainty related to the COVID-19 pandemic, and other macroeconomic factors; our estimates and assumptions for consolidated net sales, comparable store net sales and diluted earnings per share for the third quarter and full year fiscal 2021; our expectations of higher freight costs for the third and fourth quarters and full year fiscal 2021, including the impact of higher freight costs on our profitability and margins and our efforts to mitigate the effects of such costs; our expectations regarding the ability of our ocean carriers to fulfill their contractual capacity commitments to us; our expectations regarding our increased use of ocean carriers charging higher spot market rates and the potential for continued increases in spot market rates; our expectations concerning the duration and impact of shipping disruptions on results of operations; our expectations regarding capital expenditures and share repurchases for fiscal 2021; our plans relating to new store openings and store renovations and relocations; and our other plans, objectives, expectations (financial and otherwise) and intentions. These statements are subject to risks and uncertainties. For a discussion of the risks, uncertainties and assumptions that could affect our future events, developments or results, you should carefully review the "Risk Factors," "Business" and "Management's Discussion and Analysis of Financial Condition and Results of Operations" sections in our Annual Report on Form 10-K filed March 16, 2021, our Form 10-Q for the most recently ended fiscal quarter and other filings we make from time to time with the Securities and Exchange Commission. We are not obligated to release publicly any revisions to any forward-looking statements contained in this press release to reflect events or circumstances occurring after the date of this report and you should not expect us to do so.
| | | | | |
| CONTACT: | Dollar Tree, Inc. |
| Randy Guiler, 757-321-5284 |
| Vice President, Investor Relations |
| www.DollarTree.com |
| DLTR-E |
| | | | | | | | | | | | | | | | | | | | | | | | | | |
| DOLLAR TREE, INC. |
| Condensed Consolidated Income Statements |
| (In millions, except per share data) |
| (Unaudited) |
| | | | |
| | 13 Weeks Ended | | 26 Weeks Ended |
| | July 31, 2021 | | August 1, 2020 | | July 31, 2021 | | August 1, 2020 |
| | | | | | | | |
| Net sales | | $ | 6,340.2 | | | $ | 6,277.6 | | | $ | 12,817.0 | | | $ | 12,564.4 | |
| | | | | | | | |
| Other revenue | | 3.0 | | | — | | | 5.9 | | | — | |
| | | | | | | | |
| Total revenue | | 6,343.2 | | | 6,277.6 | | | 12,822.9 | | | 12,564.4 | |
| | | | | | | | |
| Cost of sales | | 4,479.2 | | | 4,361.4 | | | 8,991.9 | | | 8,853.3 | |
| | | | | | | | |
| Selling, general and administrative expenses | | 1,461.8 | | | 1,541.3 | | | 2,908.9 | | | 2,970.3 | |
| | 23.0 | % | | 24.5 | % | | 22.7 | % | | 23.6 | % |
| | | | | | | | |
| Operating income | | 402.2 | | | 374.9 | | | 922.1 | | | 740.8 | |
| | 6.3 | % | | 6.0 | % | | 7.2 | % | | 5.9 | % |
| | | | | | | | |
| Interest expense, net | | 33.0 | | | 34.8 | | | 66.0 | | | 75.0 | |
| Other expense, net | | — | | | 0.2 | | | — | | | 0.7 | |
| | | | | | | | |
| Income before income taxes | | 369.2 | | | 339.9 | | | 856.1 | | | 665.1 | |
| | 5.8 | % | | 5.4 | % | | 6.7 | % | | 5.3 | % |
| | | | | | | | |
| Provision for income taxes | | 86.8 | | | 78.4 | | | 199.2 | | | 156.0 | |
| Income tax rate | | 23.5 | % | | 23.1 | % | | 23.3 | % | | 23.5 | % |
| | | | | | | | |
| Net income | | $ | 282.4 | | | $ | 261.5 | | | $ | 656.9 | | | $ | 509.1 | |
| | 4.5 | % | | 4.2 | % | | 5.1 | % | | 4.1 | % |
| | | | | | | | |
| Net earnings per share: | | | | | | | | |
| Basic | | $ | 1.24 | | | $ | 1.10 | | | $ | 2.84 | | | $ | 2.15 | |
| Weighted average number of shares | | 228.6 | | | 237.3 | | | 230.9 | | | 237.1 | |
| | | | | | | | |
| Diluted | | $ | 1.23 | | | $ | 1.10 | | | $ | 2.83 | | | $ | 2.14 | |
| Weighted average number of shares | | 229.5 | | | 238.1 | | | 232.0 | | | 237.8 | |
| | | | | | | | | | | | | | | | | | | | | | | | | | | | | | | | | | | | | | | | | | | | | | | | | | |
| DOLLAR TREE, INC. |
| Segment Information |
| (In millions, except store count) |
| (Unaudited) |
| | | | | | | | | | | | | | | | |
| | 13 Weeks Ended | | 26 Weeks Ended |
| | July 31, 2021 | | August 1, 2020 | | July 31, 2021 | | August 1, 2020 |
| | | | | | | | |
| Net sales: | | | | | | | | | | | | | | | | |
| Dollar Tree | | $ | 3,264.3 | | | | | $ | 3,176.9 | | | | | $ | 6,585.6 | | | | | $ | 6,254.4 | | | |
| Family Dollar | | 3,075.9 | | | | | 3,100.7 | | | | | 6,231.4 | | | | | 6,310.0 | | | |
| Total net sales | | $ | 6,340.2 | | | | | $ | 6,277.6 | | | | | $ | 12,817.0 | | | | | $ | 12,564.4 | | | |
| | | | | | | | | | | | | | | | |
| Gross profit: | | | | | | | | | | | | | | | | |
| Dollar Tree | | $ | 1,057.7 | | | 32.4 | % | | $ | 1,071.9 | | | 33.7 | % | | $ | 2,176.0 | | | 33.0 | % | | $ | 2,052.6 | | | 32.8 | % |
| Family Dollar | | 803.3 | | | 26.1 | % | | 844.3 | | | 27.2 | % | | 1,649.1 | | | 26.5 | % | | 1,658.5 | | | 26.3 | % |
| Total gross profit | | $ | 1,861.0 | | | 29.4 | % | | $ | 1,916.2 | | | 30.5 | % | | $ | 3,825.1 | | | 29.8 | % | | $ | 3,711.1 | | | 29.5 | % |
| | | | | | | | | | | | | | | | |
| Operating income (loss): | | | | | | | | | | | | | | | | |
| Dollar Tree | | $ | 328.4 | | | 10.1 | % | | $ | 306.6 | | | 9.7 | % | | $ | 728.7 | | | 11.1 | % | | $ | 588.6 | | | 9.4 | % |
| Family Dollar | | 156.3 | | | 5.1 | % | | 165.1 | | | 5.3 | % | | 367.7 | | | 5.9 | % | | 340.6 | | | 5.4 | % |
| Corporate, support and Other | | (82.5) | | | (1.3 | %) | | (96.8) | | | (1.5 | %) | | (174.3) | | | (1.4 | %) | | (188.4) | | | (1.5 | %) |
| Total operating income | | $ | 402.2 | | | 6.3 | % | | $ | 374.9 | | | 6.0 | % | | $ | 922.1 | | | 7.2 | % | | $ | 740.8 | | | 5.9 | % |
| | | | | | | | | | | | | | | | | | | | | | | | | | | | | | | | | | | | | | | | | | | | | | | | | | | | | | | | | | | | | | | | | | | | | | | | | | |
| | | | | | | | | | | | | | | | | | | | | | | | |
| | | | | | | | | | | | | | | | | | | | | | | | |
| | 13 Weeks Ended | | 26 Weeks Ended |
| | July 31, 2021 | | August 1, 2020 | | July 31, 2021 | | August 1, 2020 |
| | Dollar
Tree | | Family
Dollar | | Total | | Dollar
Tree | | Family
Dollar | | Total | | Dollar
Tree | | Family
Dollar | | Total | | Dollar Tree | | Family Dollar | | Total |
| Store Count: | | | | | | | | | | | | | | | | | | | | | | | | |
| Beginning | | 7,867 | | 7,905 | | 15,772 | | 7,562 | | 7,808 | | 15,370 | | 7,805 | | 7,880 | | 15,685 | | 7,505 | | 7,783 | | 15,288 |
| New stores | | 87 | | 44 | | 131 | | 100 | | 31 | | 131 | | 152 | | 85 | | 237 | | 167 | | 63 | | 230 |
| Re-bannered stores (a) | | — | | (1) | | (1) | | — | | 4 | | 4 | | — | | (1) | | (1) | | (3) | | 4 | | 1 |
| Closings | | (20) | | (17) | | (37) | | (10) | | (16) | | (26) | | (23) | | (33) | | (56) | | (17) | | (23) | | (40) |
| Ending | | 7,934 | | 7,931 | | 15,865 | | 7,652 | | 7,827 | | 15,479 | | 7,934 | | 7,931 | | 15,865 | | 7,652 | | 7,827 | | 15,479 |
Selling Square Footage
(in millions) | | 68.5 | | 58.3 | | 126.8 | | 66.0 | | 57.1 | | 123.1 | | 68.5 | | 58.3 | | 126.8 | | 66.0 | | 57.1 | | 123.1 |
Growth Rate
(Square Footage) | | 3.8 | % | | 2.1 | % | | 3.0 | % | | 4.9 | % | | 0.5 | % | | 2.8 | % | | 3.8 | % | | 2.1 | % | | 3.0 | % | | 4.9 | % | | 0.5 | % | | 2.8 | % |
| | | | | | | | | | | | | | | | | | | | | | | | |
| (a) Stores are included as re-banners when they close or open, respectively. |
| | | | | | | | | | | | | | | | | | | | |
| DOLLAR TREE, INC. |
| Condensed Consolidated Balance Sheets |
| (In millions) |
| (Unaudited) |
| | | | | | |
| | July 31, 2021 | | January 30, 2021 | | August 1, 2020 |
| | | | | | |
| Cash and cash equivalents | | $ | 720.8 | | | $ | 1,416.7 | | | $ | 1,750.3 | |
| Merchandise inventories | | 3,667.7 | | | 3,427.0 | | | 3,275.7 | |
| Other current assets | | 259.6 | | | 207.1 | | | 206.5 | |
| Total current assets | | 4,648.1 | | | 5,050.8 | | | 5,232.5 | |
| | | | | | |
| Property, plant and equipment, net | | 4,250.2 | | | 4,116.3 | | | 4,032.6 | |
| Restricted cash | | 46.9 | | | 46.9 | | | 46.9 | |
| Operating lease right-of-use assets | | 6,341.2 | | | 6,324.1 | | | 6,204.1 | |
| Goodwill | | 1,985.1 | | | 1,984.4 | | | 1,983.0 | |
| Trade name intangible asset | | 3,100.0 | | | 3,100.0 | | | 3,100.0 | |
| Deferred tax asset | | 23.9 | | | 23.2 | | | 24.0 | |
| Other assets | | 49.8 | | | 50.3 | | | 47.9 | |
| | | | | | |
| Total assets | | $ | 20,445.2 | | | $ | 20,696.0 | | | $ | 20,671.0 | |
| | | | | | |
| Current portion of long-term debt | | $ | — | | | $ | — | | | $ | 800.0 | |
| Current portion of operating lease liabilities | | 1,368.6 | | | 1,348.2 | | | 1,284.6 | |
| Accounts payable | | 1,559.6 | | | 1,480.5 | | | 1,481.0 | |
| Income taxes payable | | 11.7 | | | 86.3 | | | 1.9 | |
| Other current liabilities | | 782.8 | | | 815.3 | | | 711.3 | |
| Total current liabilities | | 3,722.7 | | | 3,730.3 | | | 4,278.8 | |
| | | | | | |
| Long-term debt, net, excluding current portion | | 3,229.5 | | | 3,226.2 | | | 3,224.3 | |
| Operating lease liabilities, long-term | | 5,078.7 | | | 5,065.5 | | | 4,981.6 | |
| Deferred income taxes, net | | 1,030.9 | | | 1,013.5 | | | 1,008.1 | |
| Income taxes payable, long-term | | 24.0 | | | 22.6 | | | 29.4 | |
| Other liabilities | | 347.7 | | | 352.6 | | | 335.2 | |
| | | | | | |
| Total liabilities | | 13,433.5 | | | 13,410.7 | | | 13,857.4 | |
| | | | | | |
| Shareholders' equity | | 7,011.7 | | | 7,285.3 | | | 6,813.6 | |
| | | | | | |
| Total liabilities and shareholders' equity | | $ | 20,445.2 | | | $ | 20,696.0 | | | $ | 20,671.0 | |
| | | | | | |
| The January 30, 2021 information was derived from the audited consolidated financial statements as of that date. |
| | | | | | | | | | | | | | |
| DOLLAR TREE, INC. |
| Condensed Consolidated Statements of Cash Flows |
| (In millions) |
| (Unaudited) |
| | | | |
| | 26 Weeks Ended |
| | July 31, 2021 | | August 1, 2020 |
| | | | |
| Cash flows from operating activities: | | | | |
| Net income | | $ | 656.9 | | | $ | 509.1 | |
Adjustments to reconcile net income to net cash provided by operating
activities: | | | | |
| Depreciation and amortization | | 348.8 | | | 333.6 | |
| Provision for deferred income taxes | | 17.3 | | | 23.6 | |
| Stock-based compensation expense | | 49.6 | | | 55.7 | |
| Amortization of debt discount and debt-issuance costs | | 3.3 | | | 2.1 | |
| Other non-cash adjustments to net income | | 6.0 | | | 3.7 | |
| Changes in operating assets and liabilities | | (345.8) | | | 509.2 | |
| Total adjustments | | 79.2 | | | 927.9 | |
| Net cash provided by operating activities | | 736.1 | | | 1,437.0 | |
| | | | |
| Cash flows from investing activities: | | | | |
| Capital expenditures | | (454.0) | | | (468.3) | |
| Proceeds from governmental grant | | 2.3 | | | — | |
| Proceeds from (payments for) fixed asset disposition | | 0.2 | | | (2.8) | |
| Net cash used in investing activities | | (451.5) | | | (471.1) | |
| | | | |
| Cash flows from financing activities: | | | | |
| | | | |
| Principal payments for long-term debt | | — | | | (250.0) | |
| | | | |
| Proceeds from revolving credit facility | | — | | | 750.0 | |
| Repayments of revolving credit facility | | — | | | (250.0) | |
| Proceeds from stock issued pursuant to stock-based compensation plans | | 6.6 | | | 11.8 | |
| Cash paid for taxes on exercises/vesting of stock-based compensation | | (39.9) | | | (16.4) | |
| Payments for repurchase of stock | | (947.5) | | | — | |
| Net cash provided by (used in) financing activities | | (980.8) | | | 245.4 | |
| Effect of exchange rate changes on cash, cash equivalents and restricted cash | | 0.3 | | | (0.1) | |
| Net increase (decrease) in cash, cash equivalents and restricted cash | | (695.9) | | | 1,211.2 | |
| Cash, cash equivalents and restricted cash at beginning of period | | 1,463.6 | | | 586.0 | |
| Cash, cash equivalents and restricted cash at end of period | | $ | 767.7 | | | $ | 1,797.2 | |