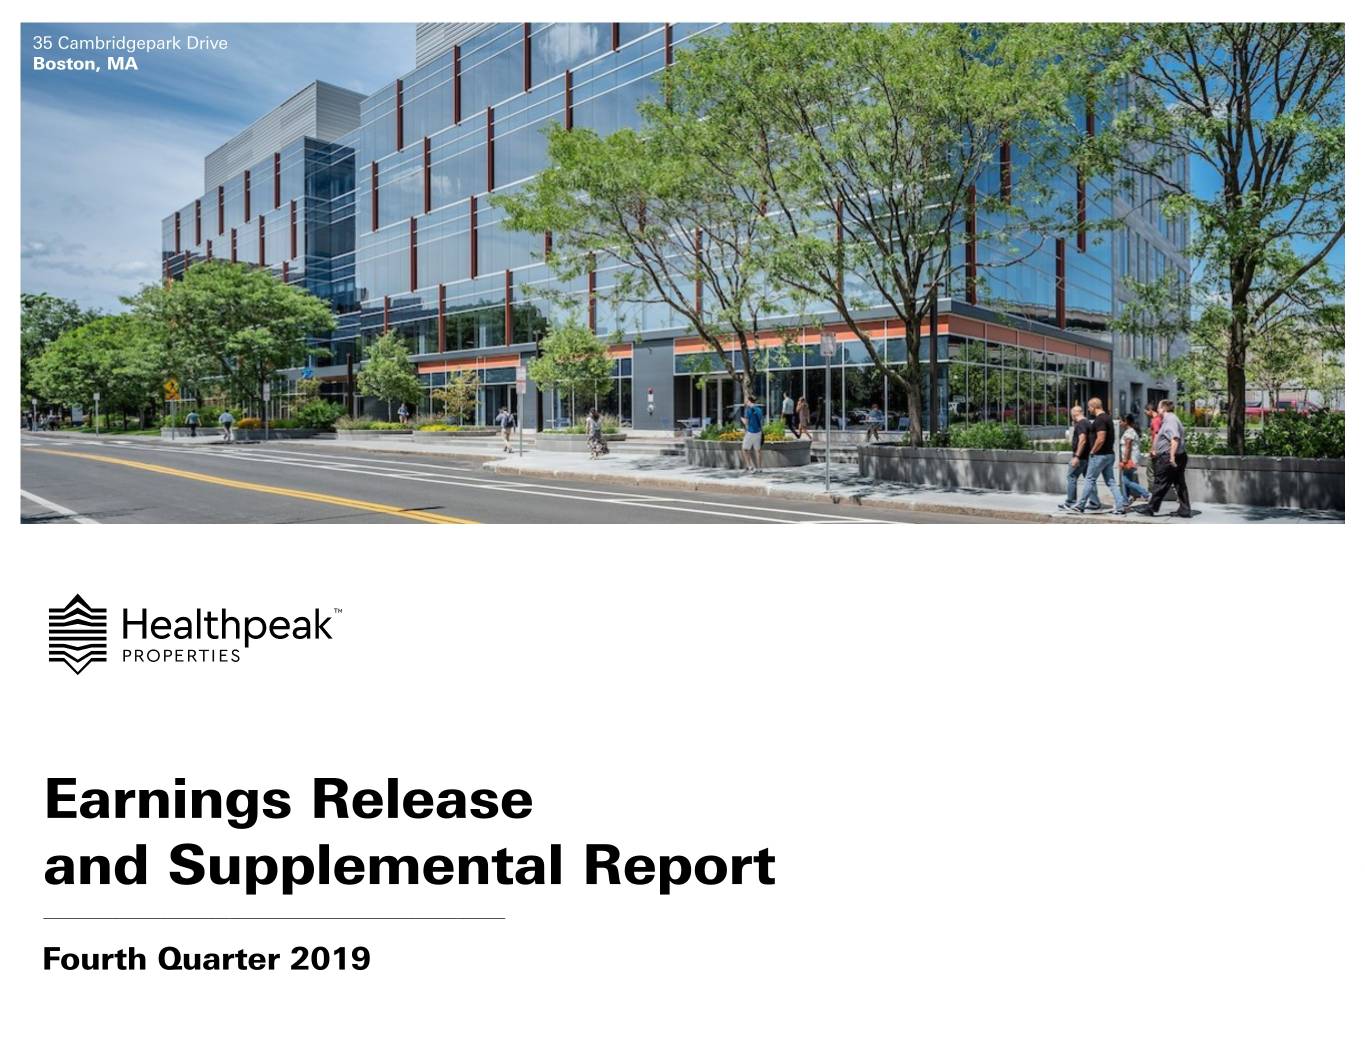
35 Cambridgepark Drive Boston, MA Earnings Release and Supplemental Report ___________________________________________________________________ Fourth Quarter 2019
TABLE OF Contents Earnings Release 3 Consolidated Financial Statements 10 Overview 14 Portfolio Summary 15 Property Count Reconciliations 18 Capitalization and Indebtedness 19 Investment Summary 22 Developments and Redevelopments 24 Capital Expenditures 26 Portfolio Diversification 27 Expirations and Maturities 29 Triple-net Master Lease Profile 30 Portfolio Senior Housing Triple-net 31 Senior Housing Operating Portfolio 33 Life Science 38 Medical Office 41 Other 44 Guidance 48 Financial Reporting Updates 49 Glossary and Debt Ratios 50 Company Information 56 Forward-Looking Statements & Risk Factors 58 Discussion and Reconciliation of Non-GAAP Financial Measures Hayden Research Campus Lexington, MA 2
Healthpeak PropertiesTM Reports Fourth Quarter and Year Ended 2019 Results IRVINE, CA, February 11, 2020 -- Healthpeak Properties, Inc. (NYSE: PEAK) today announced results for the fourth quarter and full year ended December 31, 2019. FOURTH QUARTER 2019 FINANCIAL PERFORMANCE AND RECENT HIGHLIGHTS – Net income of $0.09 per share, NAREIT FFO of $0.39 per share, FFO as Adjusted of $0.44 per share and blended Total Portfolio SPP Cash NOI growth of 3.6% – Executed a definitive agreement to acquire The Post, a 426,000 square foot life science property located within the Route 128 submarket of Boston, Massachusetts, for $320 million – Signed leases totaling 122,000 square feet at Healthpeak’s 75 Hayden development project in Boston, Massachusetts – Executed an agreement with Capital Senior Living ("CSU") to convert the six properties in the master lease maturing 2026 into a RIDEA structure and immediately market those properties for sale – Previously announced Life Science transactions: • In December 2019, closed on the $333 million acquisition of 35 CambridgePark Drive in the West Cambridge Boston submarket • Commenced construction on a $164 million life science development project, The Boardwalk, located in the Torrey Pines life science cluster in San Diego • Executed a long-term lease with Janssen BioPharma, Inc., part of the Johnson & Johnson Family of Companies, for approximately 60% of Phase II of The Shore at Sierra Point • Executed a lease amendment and extension with Amgen at Healthpeak's Britannia Oyster Point campus in South San Francisco – Previously announced Senior Housing transactions: • Entered into an agreement with Oakmont Senior Living (“Oakmont”) that provides Healthpeak the option to acquire up to 24 of Oakmont's senior housing development properties as completed and stabilized over the next four years • In January 2020, closed on the transactions with Brookdale Senior Living (“Brookdale”) related to the acquisition of Brookdale's 51% interest in 13 CCRCs for $641 million (which includes payment of a $100 million management termination fee) and the sale of the 18-property triple-net portfolio for $405 million • In December 2019, closed on a $790 million sovereign wealth fund senior housing joint venture ("SWF SH JV") in which Healthpeak sold a 46.5% interest in a 19-property senior housing operating portfolio managed by Brookdale to a sovereign wealth fund • In December 2019, closed on the sale of the remaining 49% interest in Healthpeak's U.K. holdings, which resulted in $91 million of net proceeds – Previously announced Medical Office transactions: • Added an on-campus medical office development in Nashville with a total estimated spend of $49 million to Healthpeak’s development program with HCA Healthcare (“HCA”) – Issued $750 million of 3.00% senior unsecured notes due 2030 and prepaid Healthpeak's $350 million 4.00% senior unsecured notes due 2022 – Completed public offering of 15.6 million shares of common stock for gross proceeds of $547 million and sold 7.5 million shares of common stock under the ATM equity program, raising gross proceeds of $250 million – Appointed Sara Grootwassink Lewis as an independent director to Healthpeak’s Board of Directors – Welcomed Justin Hill to our team to lead Medical Office business development – Named to the CDP Leadership Band with a score of A-, as well as the Dow Jones Sustainability Index for the seventh consecutive year; received NAREIT's Dividends Through Diversity Award; received the Green Star designation from GRESB for the eighth year, and named to Bloomberg Gender-Equality Index, Investors’ Business Daily’s Top 50 ESG Companies list and Newsweek’s list of America’s Most Responsible Companies – Completed a comprehensive review of, and certain revisions to, Healthpeak's Senior Housing Operating Portfolio Same-Store policies. SHOP same-store policy details, rationale and pro forma impact can be found on the "Investor Presentations" section of our website at https://ir.healthpeak.com/investor-presentations 3 ReturnReturn to to TOC TOC
FULL YEAR 2019 HIGHLIGHTS – Net income of $0.09 per share, NAREIT FFO of $1.59 per share, FFO as Adjusted of $1.76 per share and blended Total Portfolio SPP Cash NOI growth of 3.7% – Changed name to Healthpeak Properties, Inc., ticker symbol to “PEAK” and website URL to www.healthpeak.com – Announced $2.7 billion of investments including: • $1.4 billion of senior housing acquisitions • $1.1 billion of life science acquisitions and estimated incremental development spending at The Boardwalk • $166 million of estimated incremental medical office development spending through Healthpeak’s program with HCA – Announced $1.4 billion of senior housing dispositions, including the $274 million sale of Healthpeak's direct financing lease interests in 13 non-core senior housing properties to Prime Care, LLC and its affiliates – Improved operator diversification and the quality of Healthpeak’s senior housing portfolio • Converted 39 triple-net leased assets to RIDEA (35 Sunrise, 4 Oakmont) • Renewed master lease with Aegis Senior Living and amended the lease with Harbor Retirement Associates • Reduced Brookdale concentration to 6% – Continued to deliver development projects on-time and on-budget, with significant pre-leasing prior to delivery • Delivered Phase III of The Cove in South San Francisco, representing 324,000 square feet of Class A life science space that is 100% leased • Delivered a 90,000 square foot on-campus medical office building at Grand Strand Medical Center, which was 71% leased upon delivery – Sold $1.4 billion of equity through a public follow-on offering and our ATM equity program – Directly issued or settled previous forward sales agreements for 26.7 million shares, resulting in net proceeds of $782 million – Issued $2.1 billion of long-term senior unsecured notes, with proceeds used to refinance near-term debt, including $1.7 billion of senior unsecured notes – Upsized revolving credit facility to $2.5 billion and originated a $250 million unsecured term loan facility – Established a $1 billion unsecured commercial paper program with $93 million outstanding at year end – Upgraded by Moody’s to Baa1 (stable) in January and by Fitch to BBB+ (stable) in October – Added one new director in 2019 and decreased average director tenure to 5 years 4 ReturnReturn to to TOC TOC
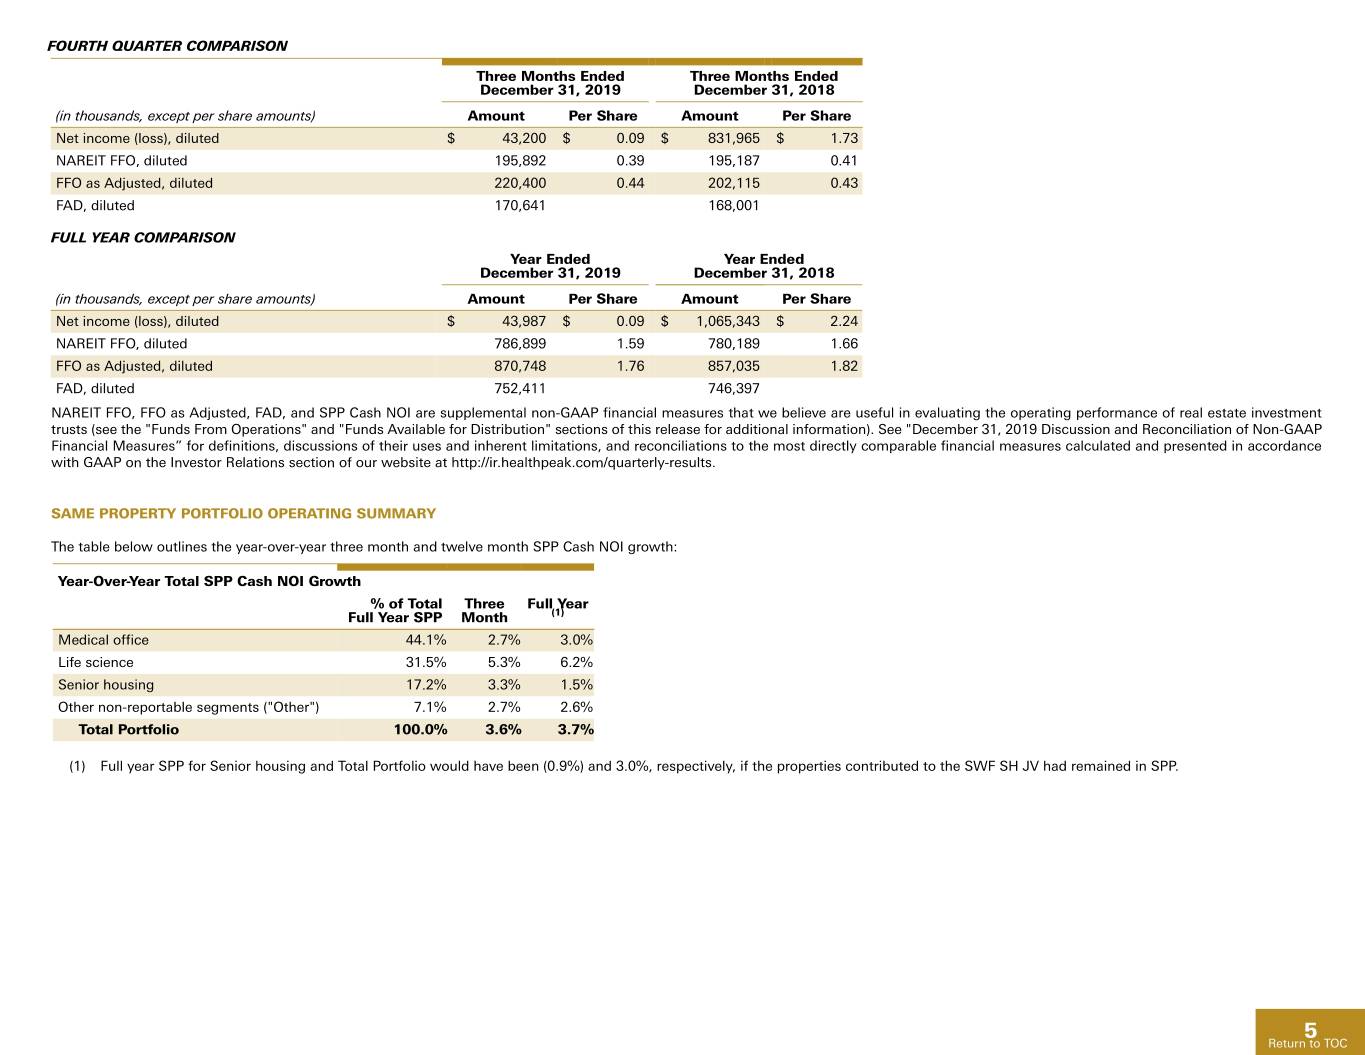
FOURTH QUARTER COMPARISON Three Months Ended Three Months Ended December 31, 2019 December 31, 2018 (in thousands, except per share amounts) Amount Per Share Amount Per Share Net income (loss), diluted $ 43,200 $ 0.09 $ 831,965 $ 1.73 NAREIT FFO, diluted 195,892 0.39 195,187 0.41 FFO as Adjusted, diluted 220,400 0.44 202,115 0.43 FAD, diluted 170,641 168,001 FULL YEAR COMPARISON Year Ended Year Ended December 31, 2019 December 31, 2018 (in thousands, except per share amounts) Amount Per Share Amount Per Share Net income (loss), diluted $ 43,987 $ 0.09 $ 1,065,343 $ 2.24 NAREIT FFO, diluted 786,899 1.59 780,189 1.66 FFO as Adjusted, diluted 870,748 1.76 857,035 1.82 FAD, diluted 752,411 746,397 NAREIT FFO, FFO as Adjusted, FAD, and SPP Cash NOI are supplemental non-GAAP financial measures that we believe are useful in evaluating the operating performance of real estate investment trusts (see the "Funds From Operations" and "Funds Available for Distribution" sections of this release for additional information). See "December 31, 2019 Discussion and Reconciliation of Non-GAAP Financial Measures” for definitions, discussions of their uses and inherent limitations, and reconciliations to the most directly comparable financial measures calculated and presented in accordance with GAAP on the Investor Relations section of our website at http://ir.healthpeak.com/quarterly-results. SAME PROPERTY PORTFOLIO OPERATING SUMMARY The table below outlines the year-over-year three month and twelve month SPP Cash NOI growth: Year-Over-Year Total SPP Cash NOI Growth % of Total Three Full Year Full Year SPP Month (1) Medical office 44.1% 2.7% 3.0% Life science 31.5% 5.3% 6.2% Senior housing 17.2% 3.3% 1.5% Other non-reportable segments ("Other") 7.1% 2.7% 2.6% Total Portfolio 100.0% 3.6% 3.7% (1) Full year SPP for Senior housing and Total Portfolio would have been (0.9%) and 3.0%, respectively, if the properties contributed to the SWF SH JV had remained in SPP. 5 ReturnReturn to to TOC TOC
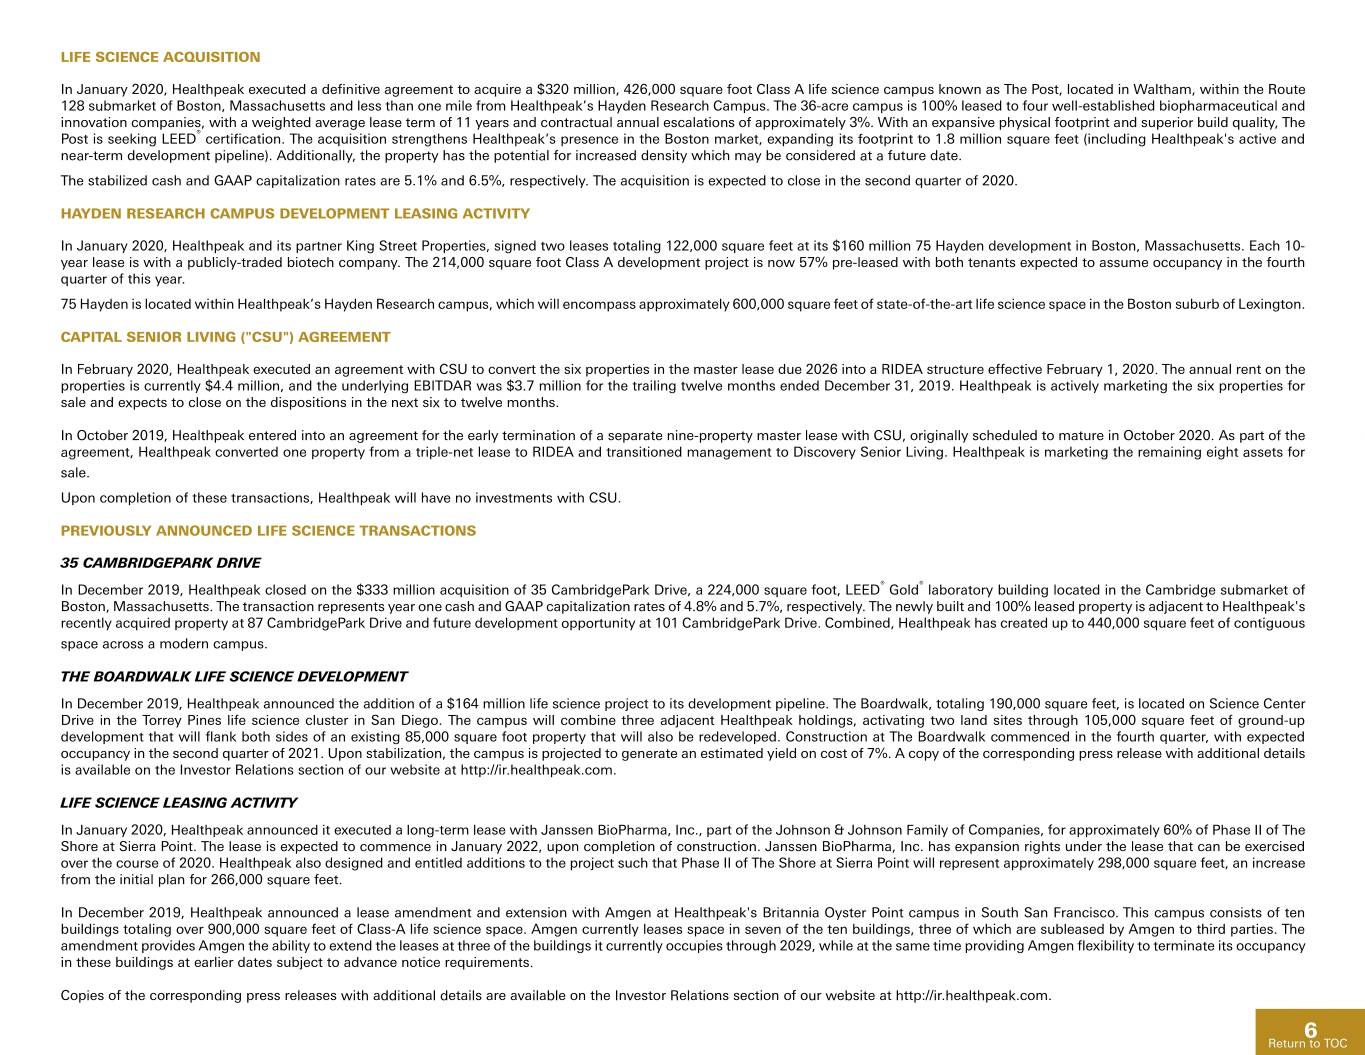
LIFE SCIENCE ACQUISITION In January 2020, Healthpeak executed a definitive agreement to acquire a $320 million, 426,000 square foot Class A life science campus known as The Post, located in Waltham, within the Route 128 submarket of Boston, Massachusetts and less than one mile from Healthpeak’s Hayden Research Campus. The 36-acre campus is 100% leased to four well-established biopharmaceutical and innovation companies, with a weighted average lease term of 11 years and contractual annual escalations of approximately 3%. With an expansive physical footprint and superior build quality, The Post is seeking LEED® certification. The acquisition strengthens Healthpeak’s presence in the Boston market, expanding its footprint to 1.8 million square feet (including Healthpeak's active and near-term development pipeline). Additionally, the property has the potential for increased density which may be considered at a future date. The stabilized cash and GAAP capitalization rates are 5.1% and 6.5%, respectively. The acquisition is expected to close in the second quarter of 2020. HAYDEN RESEARCH CAMPUS DEVELOPMENT LEASING ACTIVITY In January 2020, Healthpeak and its partner King Street Properties, signed two leases totaling 122,000 square feet at its $160 million 75 Hayden development in Boston, Massachusetts. Each 10- year lease is with a publicly-traded biotech company. The 214,000 square foot Class A development project is now 57% pre-leased with both tenants expected to assume occupancy in the fourth quarter of this year. 75 Hayden is located within Healthpeak’s Hayden Research campus, which will encompass approximately 600,000 square feet of state-of-the-art life science space in the Boston suburb of Lexington. CAPITAL SENIOR LIVING ("CSU") AGREEMENT In February 2020, Healthpeak executed an agreement with CSU to convert the six properties in the master lease due 2026 into a RIDEA structure effective February 1, 2020. The annual rent on the properties is currently $4.4 million, and the underlying EBITDAR was $3.7 million for the trailing twelve months ended December 31, 2019. Healthpeak is actively marketing the six properties for sale and expects to close on the dispositions in the next six to twelve months. In October 2019, Healthpeak entered into an agreement for the early termination of a separate nine-property master lease with CSU, originally scheduled to mature in October 2020. As part of the agreement, Healthpeak converted one property from a triple-net lease to RIDEA and transitioned management to Discovery Senior Living. Healthpeak is marketing the remaining eight assets for sale. Upon completion of these transactions, Healthpeak will have no investments with CSU. PREVIOUSLY ANNOUNCED LIFE SCIENCE TRANSACTIONS 35 CAMBRIDGEPARK DRIVE In December 2019, Healthpeak closed on the $333 million acquisition of 35 CambridgePark Drive, a 224,000 square foot, LEED® Gold® laboratory building located in the Cambridge submarket of Boston, Massachusetts. The transaction represents year one cash and GAAP capitalization rates of 4.8% and 5.7%, respectively. The newly built and 100% leased property is adjacent to Healthpeak's recently acquired property at 87 CambridgePark Drive and future development opportunity at 101 CambridgePark Drive. Combined, Healthpeak has created up to 440,000 square feet of contiguous space across a modern campus. THE BOARDWALK LIFE SCIENCE DEVELOPMENT In December 2019, Healthpeak announced the addition of a $164 million life science project to its development pipeline. The Boardwalk, totaling 190,000 square feet, is located on Science Center Drive in the Torrey Pines life science cluster in San Diego. The campus will combine three adjacent Healthpeak holdings, activating two land sites through 105,000 square feet of ground-up development that will flank both sides of an existing 85,000 square foot property that will also be redeveloped. Construction at The Boardwalk commenced in the fourth quarter, with expected occupancy in the second quarter of 2021. Upon stabilization, the campus is projected to generate an estimated yield on cost of 7%. A copy of the corresponding press release with additional details is available on the Investor Relations section of our website at http://ir.healthpeak.com. LIFE SCIENCE LEASING ACTIVITY In January 2020, Healthpeak announced it executed a long-term lease with Janssen BioPharma, Inc., part of the Johnson & Johnson Family of Companies, for approximately 60% of Phase II of The Shore at Sierra Point. The lease is expected to commence in January 2022, upon completion of construction. Janssen BioPharma, Inc. has expansion rights under the lease that can be exercised over the course of 2020. Healthpeak also designed and entitled additions to the project such that Phase II of The Shore at Sierra Point will represent approximately 298,000 square feet, an increase from the initial plan for 266,000 square feet. In December 2019, Healthpeak announced a lease amendment and extension with Amgen at Healthpeak's Britannia Oyster Point campus in South San Francisco. This campus consists of ten buildings totaling over 900,000 square feet of Class-A life science space. Amgen currently leases space in seven of the ten buildings, three of which are subleased by Amgen to third parties. The amendment provides Amgen the ability to extend the leases at three of the buildings it currently occupies through 2029, while at the same time providing Amgen flexibility to terminate its occupancy in these buildings at earlier dates subject to advance notice requirements. Copies of the corresponding press releases with additional details are available on the Investor Relations section of our website at http://ir.healthpeak.com. 6 ReturnReturn to to TOC TOC
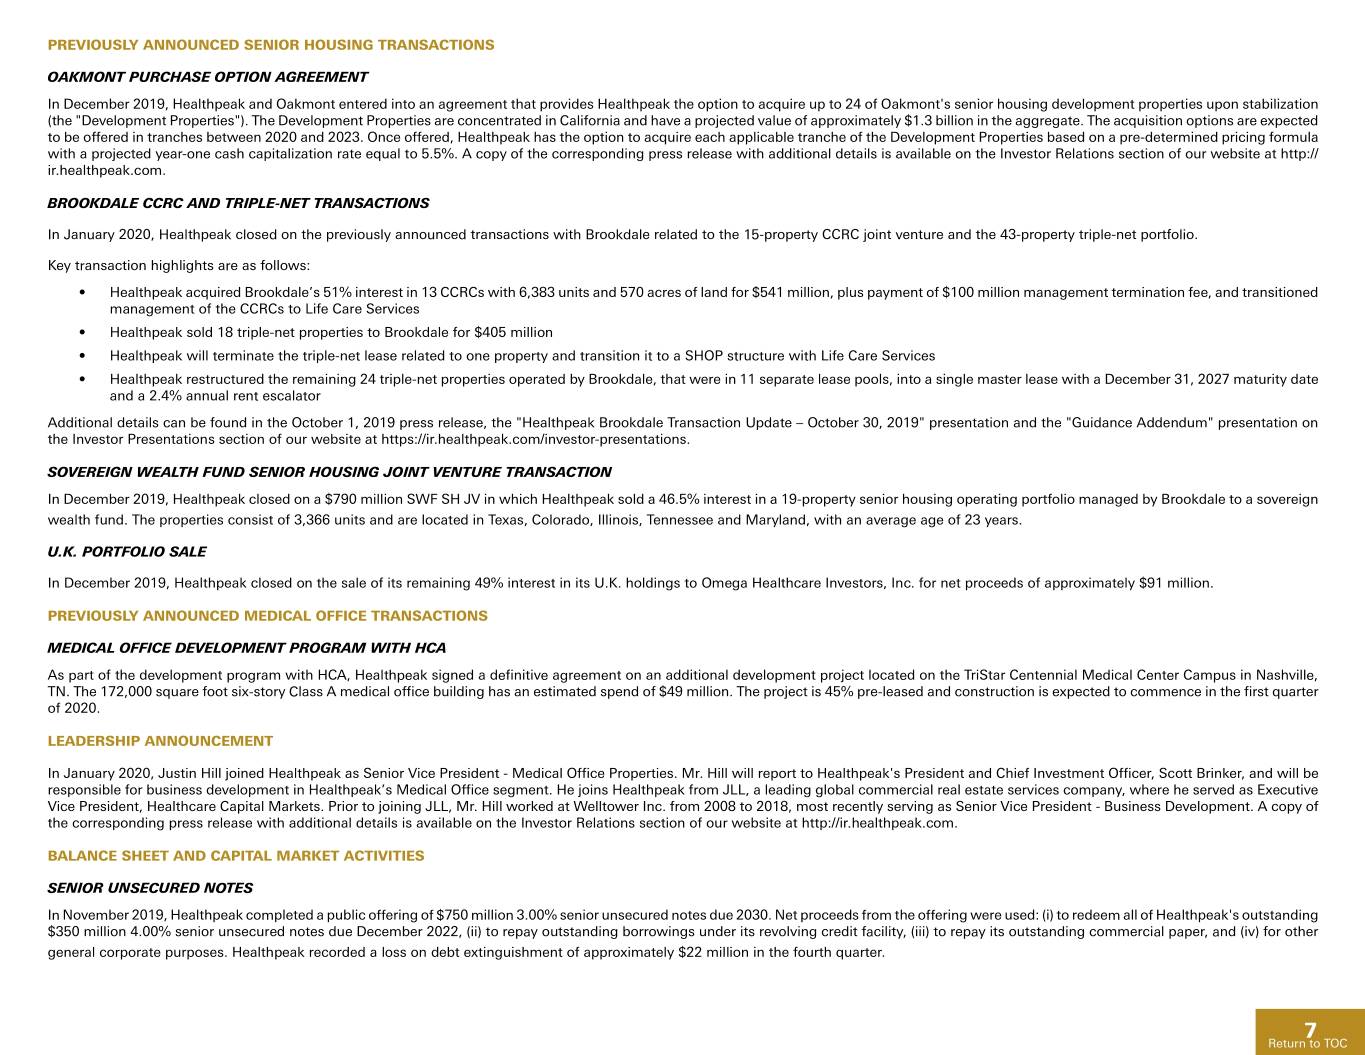
PREVIOUSLY ANNOUNCED SENIOR HOUSING TRANSACTIONS OAKMONT PURCHASE OPTION AGREEMENT In December 2019, Healthpeak and Oakmont entered into an agreement that provides Healthpeak the option to acquire up to 24 of Oakmont's senior housing development properties upon stabilization (the "Development Properties"). The Development Properties are concentrated in California and have a projected value of approximately $1.3 billion in the aggregate. The acquisition options are expected to be offered in tranches between 2020 and 2023. Once offered, Healthpeak has the option to acquire each applicable tranche of the Development Properties based on a pre-determined pricing formula with a projected year-one cash capitalization rate equal to 5.5%. A copy of the corresponding press release with additional details is available on the Investor Relations section of our website at http:// ir.healthpeak.com. BROOKDALE CCRC AND TRIPLE-NET TRANSACTIONS In January 2020, Healthpeak closed on the previously announced transactions with Brookdale related to the 15-property CCRC joint venture and the 43-property triple-net portfolio. Key transaction highlights are as follows: • Healthpeak acquired Brookdale’s 51% interest in 13 CCRCs with 6,383 units and 570 acres of land for $541 million, plus payment of $100 million management termination fee, and transitioned management of the CCRCs to Life Care Services • Healthpeak sold 18 triple-net properties to Brookdale for $405 million • Healthpeak will terminate the triple-net lease related to one property and transition it to a SHOP structure with Life Care Services • Healthpeak restructured the remaining 24 triple-net properties operated by Brookdale, that were in 11 separate lease pools, into a single master lease with a December 31, 2027 maturity date and a 2.4% annual rent escalator Additional details can be found in the October 1, 2019 press release, the "Healthpeak Brookdale Transaction Update – October 30, 2019" presentation and the "Guidance Addendum" presentation on the Investor Presentations section of our website at https://ir.healthpeak.com/investor-presentations. SOVEREIGN WEALTH FUND SENIOR HOUSING JOINT VENTURE TRANSACTION In December 2019, Healthpeak closed on a $790 million SWF SH JV in which Healthpeak sold a 46.5% interest in a 19-property senior housing operating portfolio managed by Brookdale to a sovereign wealth fund. The properties consist of 3,366 units and are located in Texas, Colorado, Illinois, Tennessee and Maryland, with an average age of 23 years. U.K. PORTFOLIO SALE In December 2019, Healthpeak closed on the sale of its remaining 49% interest in its U.K. holdings to Omega Healthcare Investors, Inc. for net proceeds of approximately $91 million. PREVIOUSLY ANNOUNCED MEDICAL OFFICE TRANSACTIONS MEDICAL OFFICE DEVELOPMENT PROGRAM WITH HCA As part of the development program with HCA, Healthpeak signed a definitive agreement on an additional development project located on the TriStar Centennial Medical Center Campus in Nashville, TN. The 172,000 square foot six-story Class A medical office building has an estimated spend of $49 million. The project is 45% pre-leased and construction is expected to commence in the first quarter of 2020. LEADERSHIP ANNOUNCEMENT In January 2020, Justin Hill joined Healthpeak as Senior Vice President - Medical Office Properties. Mr. Hill will report to Healthpeak's President and Chief Investment Officer, Scott Brinker, and will be responsible for business development in Healthpeak’s Medical Office segment. He joins Healthpeak from JLL, a leading global commercial real estate services company, where he served as Executive Vice President, Healthcare Capital Markets. Prior to joining JLL, Mr. Hill worked at Welltower Inc. from 2008 to 2018, most recently serving as Senior Vice President - Business Development. A copy of the corresponding press release with additional details is available on the Investor Relations section of our website at http://ir.healthpeak.com. BALANCE SHEET AND CAPITAL MARKET ACTIVITIES SENIOR UNSECURED NOTES In November 2019, Healthpeak completed a public offering of $750 million 3.00% senior unsecured notes due 2030. Net proceeds from the offering were used: (i) to redeem all of Healthpeak's outstanding $350 million 4.00% senior unsecured notes due December 2022, (ii) to repay outstanding borrowings under its revolving credit facility, (iii) to repay its outstanding commercial paper, and (iv) for other general corporate purposes. Healthpeak recorded a loss on debt extinguishment of approximately $22 million in the fourth quarter. 7 ReturnReturn to to TOC TOC
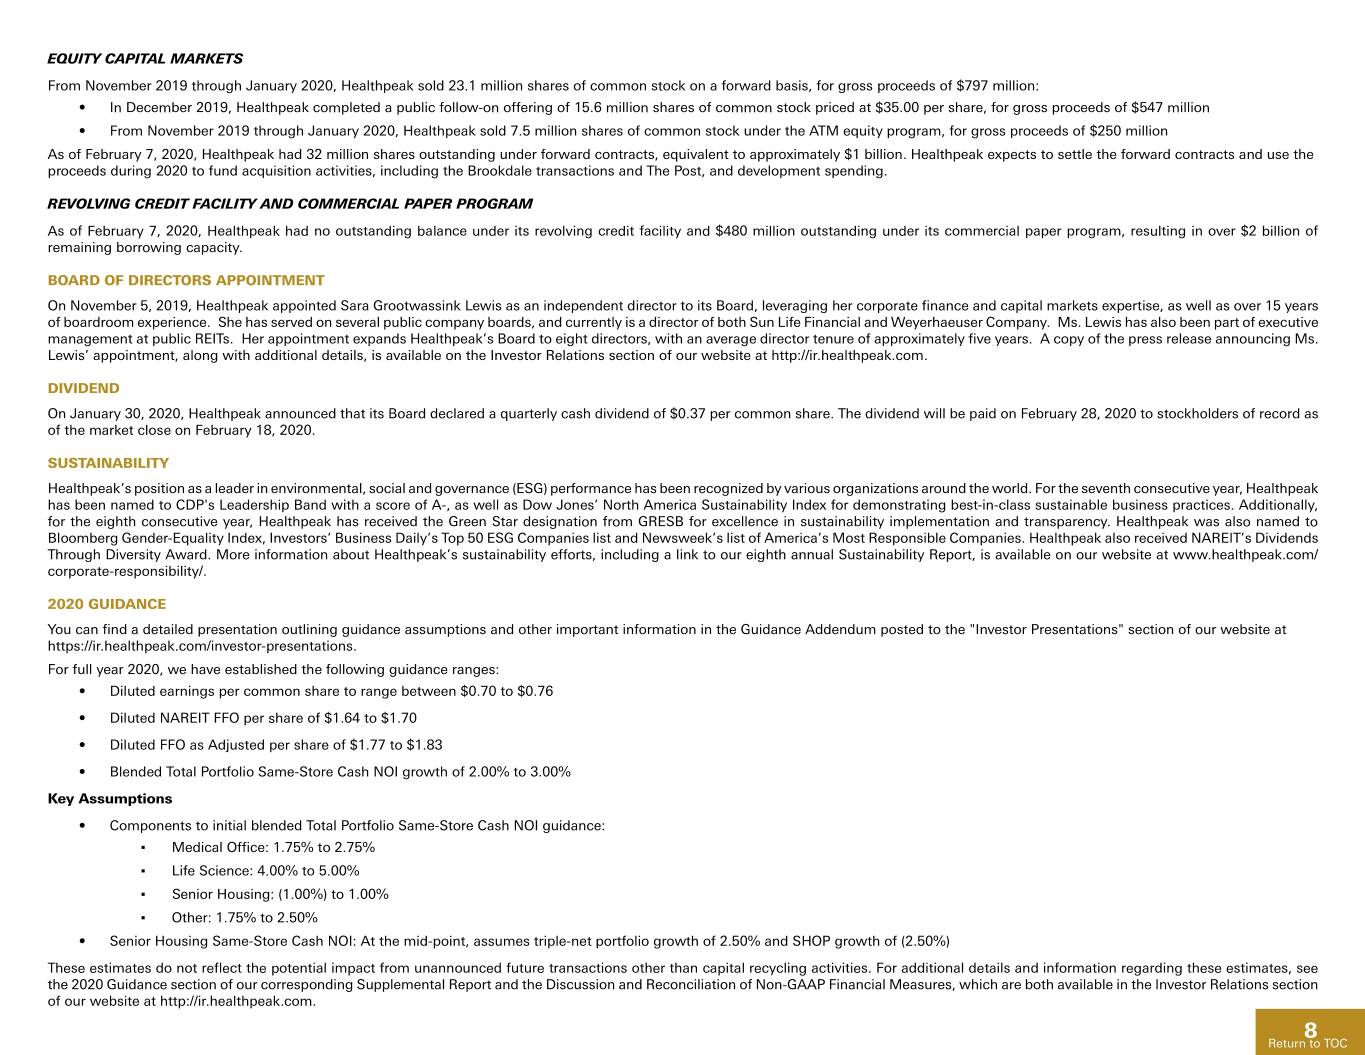
EQUITY CAPITAL MARKETS From November 2019 through January 2020, Healthpeak sold 23.1 million shares of common stock on a forward basis, for gross proceeds of $797 million: • In December 2019, Healthpeak completed a public follow-on offering of 15.6 million shares of common stock priced at $35.00 per share, for gross proceeds of $547 million • From November 2019 through January 2020, Healthpeak sold 7.5 million shares of common stock under the ATM equity program, for gross proceeds of $250 million As of February 7, 2020, Healthpeak had 32 million shares outstanding under forward contracts, equivalent to approximately $1 billion. Healthpeak expects to settle the forward contracts and use the proceeds during 2020 to fund acquisition activities, including the Brookdale transactions and The Post, and development spending. REVOLVING CREDIT FACILITY AND COMMERCIAL PAPER PROGRAM As of February 7, 2020, Healthpeak had no outstanding balance under its revolving credit facility and $480 million outstanding under its commercial paper program, resulting in over $2 billion of remaining borrowing capacity. BOARD OF DIRECTORS APPOINTMENT On November 5, 2019, Healthpeak appointed Sara Grootwassink Lewis as an independent director to its Board, leveraging her corporate finance and capital markets expertise, as well as over 15 years of boardroom experience. She has served on several public company boards, and currently is a director of both Sun Life Financial and Weyerhaeuser Company. Ms. Lewis has also been part of executive management at public REITs. Her appointment expands Healthpeak’s Board to eight directors, with an average director tenure of approximately five years. A copy of the press release announcing Ms. Lewis’ appointment, along with additional details, is available on the Investor Relations section of our website at http://ir.healthpeak.com. DIVIDEND On January 30, 2020, Healthpeak announced that its Board declared a quarterly cash dividend of $0.37 per common share. The dividend will be paid on February 28, 2020 to stockholders of record as of the market close on February 18, 2020. SUSTAINABILITY Healthpeak’s position as a leader in environmental, social and governance (ESG) performance has been recognized by various organizations around the world. For the seventh consecutive year, Healthpeak has been named to CDP's Leadership Band with a score of A-, as well as Dow Jones’ North America Sustainability Index for demonstrating best-in-class sustainable business practices. Additionally, for the eighth consecutive year, Healthpeak has received the Green Star designation from GRESB for excellence in sustainability implementation and transparency. Healthpeak was also named to Bloomberg Gender-Equality Index, Investors’ Business Daily’s Top 50 ESG Companies list and Newsweek’s list of America’s Most Responsible Companies. Healthpeak also received NAREIT’s Dividends Through Diversity Award. More information about Healthpeak’s sustainability efforts, including a link to our eighth annual Sustainability Report, is available on our website at www.healthpeak.com/ corporate-responsibility/. 2020 GUIDANCE You can find a detailed presentation outlining guidance assumptions and other important information in the Guidance Addendum posted to the "Investor Presentations" section of our website at https://ir.healthpeak.com/investor-presentations. For full year 2020, we have established the following guidance ranges: • Diluted earnings per common share to range between $0.70 to $0.76 • Diluted NAREIT FFO per share of $1.64 to $1.70 • Diluted FFO as Adjusted per share of $1.77 to $1.83 • Blended Total Portfolio Same-Store Cash NOI growth of 2.00% to 3.00% Key Assumptions • Components to initial blended Total Portfolio Same-Store Cash NOI guidance: ▪ Medical Office: 1.75% to 2.75% ▪ Life Science: 4.00% to 5.00% ▪ Senior Housing: (1.00%) to 1.00% ▪ Other: 1.75% to 2.50% • Senior Housing Same-Store Cash NOI: At the mid-point, assumes triple-net portfolio growth of 2.50% and SHOP growth of (2.50%) These estimates do not reflect the potential impact from unannounced future transactions other than capital recycling activities. For additional details and information regarding these estimates, see the 2020 Guidance section of our corresponding Supplemental Report and the Discussion and Reconciliation of Non-GAAP Financial Measures, which are both available in the Investor Relations section of our website at http://ir.healthpeak.com. 8 ReturnReturn to to TOC TOC
COMPANY INFORMATION Healthpeak has scheduled a conference call and webcast for Wednesday, February 12, 2020, at 9:00 a.m. Pacific Time (12:00 p.m. Eastern Time) to present its performance and operating results for the fourth quarter and full year ended December 31, 2019. The conference call is accessible by dialing (888) 317-6003 (U.S.) or (412) 317-6061 (International). The conference ID number is 5416031. You may also access the conference call via webcast in the Investor Relations section of our website at http://ir.healthpeak.com. An archive of the webcast will be available on Healthpeak's website through February 12, 2021, and a telephonic replay can be accessed through February 27, 2020, by dialing (877) 344-7529 (U.S.) or (412) 317-0088 (International) and entering conference ID number 10137451. Our Supplemental Report for the current period is also available, with this earnings release, in the Investor Relations section of our website. ABOUT HEALTHPEAK Healthpeak Properties, Inc. is a fully integrated real estate investment trust (REIT) and S&P 500 company. Healthpeak owns and develops high-quality real estate in the three private-pay healthcare asset classes of Life Science, Senior Housing and Medical Office, designed to provide stability through the inevitable industry cycles. At Healthpeak, we pair our deep understanding of the healthcare real estate market with a strong vision for long-term growth. For more information regarding Healthpeak, visit www.healthpeak.com. FORWARD-LOOKING STATEMENTS Statements in this release that are not historical facts are "forward-looking statements" within the meaning of Section 27A of the Securities Act of 1933, as amended, and Section 21E of the Securities Exchange Act of 1934, as amended. Forward-looking statements include, among other things, statements regarding our and our officers' intent, belief or expectation as identified by the use of words such as "may," "will," "project," "expect," "believe," "intend," "anticipate," "seek," "target," "forecast," "plan," "potential," "estimate," "could," "would," "should" and other comparable and derivative terms or the negatives thereof. Examples of forward-looking statements include, among other things: (i) statements regarding timing, outcomes and other details relating to current, pending or contemplated acquisitions, dispositions, transitions, developments, redevelopments, joint venture transactions, leasing activity, capital recycling plans, financing activities, or other transactions discussed in this release; (ii) the payment of a quarterly cash dividend; and (iii) all statements and assumptions under the heading "2020 Guidance," including without limitation with respect to expected net income, NAREIT FFO per share, FFO as Adjusted per share, Same-Store Cash NOI growth and other financial projections and assumptions, as well as comparable statements included in other sections of this release. Forward-looking statements reflect our current expectations and views about future events and are subject to risks and uncertainties that could significantly affect our future financial condition and results of operations. While forward-looking statements reflect our good faith belief and assumptions we believe to be reasonable based upon current information, we can give no assurance that our expectations or forecasts will be attained. Further, we cannot guarantee the accuracy of any such forward-looking statement contained in this release, and such forward-looking statements are subject to known and unknown risks and uncertainties that are difficult to predict. These risks and uncertainties include, but are not limited to: the financial condition of our existing and future tenants, operators and borrowers, including potential bankruptcies and downturns in their businesses, and their legal and regulatory proceedings, which results in uncertainties regarding our ability to continue to realize the full benefit of such tenants’ and operators’ leases and borrowers’ loans; the ability of our existing and future tenants, operators and borrowers to conduct their respective businesses in a manner sufficient to maintain or increase their revenues and manage their expenses in order to generate sufficient income to make rent and loan payments to us and our ability to recover investments made, if applicable, in their operations; our concentration in the healthcare property sector, particularly in senior housing, life sciences and medical office buildings, which makes our profitability more vulnerable to a downturn in a specific sector than if we were investing in multiple industries; operational risks associated with third party management contracts, including the additional regulation and liabilities of our RIDEA lease structures; the effect on us and our tenants and operators of legislation, executive orders and other legal requirements, including compliance with the Americans with Disabilities Act, fire, safety and health regulations, environmental laws, the Affordable Care Act, licensure, certification and inspection requirements, and laws addressing entitlement programs and related services, including Medicare and Medicaid, which may result in future reductions in reimbursements or fines for noncompliance; our ability to identify replacement tenants and operators and the potential renovation costs and regulatory approvals associated therewith; the risks associated with property development and redevelopment, including costs above original estimates, project delays and lower occupancy rates and rents than expected; the potential impact of uninsured or underinsured losses; the risks associated with our investments in joint ventures and unconsolidated entities, including our lack of sole decision making authority and our reliance on our partners’ financial condition and continued cooperation; competition for the acquisition and financing of suitable healthcare properties as well as competition for tenants and operators, including with respect to new leases and mortgages and the renewal or rollover of existing leases; our or our counterparties’ ability to fulfill obligations, such as financing conditions and/or regulatory approval requirements, required to successfully consummate acquisitions, dispositions, transitions, developments, redevelopments, joint venture transactions or other transactions; our ability to achieve the benefits of acquisitions or other investments within expected time frames or at all, or within expected cost projections; the potential impact on us and our tenants, operators and borrowers from current and future litigation matters, including the possibility of larger than expected litigation costs, adverse results and related developments; changes in federal, state or local laws and regulations, including those affecting the healthcare industry that affect our costs of compliance or increase the costs, or otherwise affect the operations, of our tenants and operators; our ability to foreclose on collateral securing our real estate-related loans; volatility or uncertainty in the capital markets, the availability and cost of capital as impacted by interest rates, changes in our credit ratings, the value of our common stock, and other conditions that may adversely impact our ability to fund our obligations or consummate transactions, or reduce the earnings from potential transactions; changes in global, national and local economic and other conditions; our ability to manage our indebtedness level and changes in the terms of such indebtedness; competition for skilled management and other key personnel; our reliance on information technology systems and the potential impact of system failures, disruptions or breaches; our ability to maintain our qualification as a real estate investment trust; and other risks and uncertainties described from time to time in our Securities and Exchange Commission filings. Except as required by law, we do not undertake, and hereby disclaim, any obligation to update any forward-looking statements, which speak only as of the date on which they are made. CONTACT Barbat Rodgers Senior Director – Investor Relations 949-407-0400 9 ReturnReturn to to TOC TOC
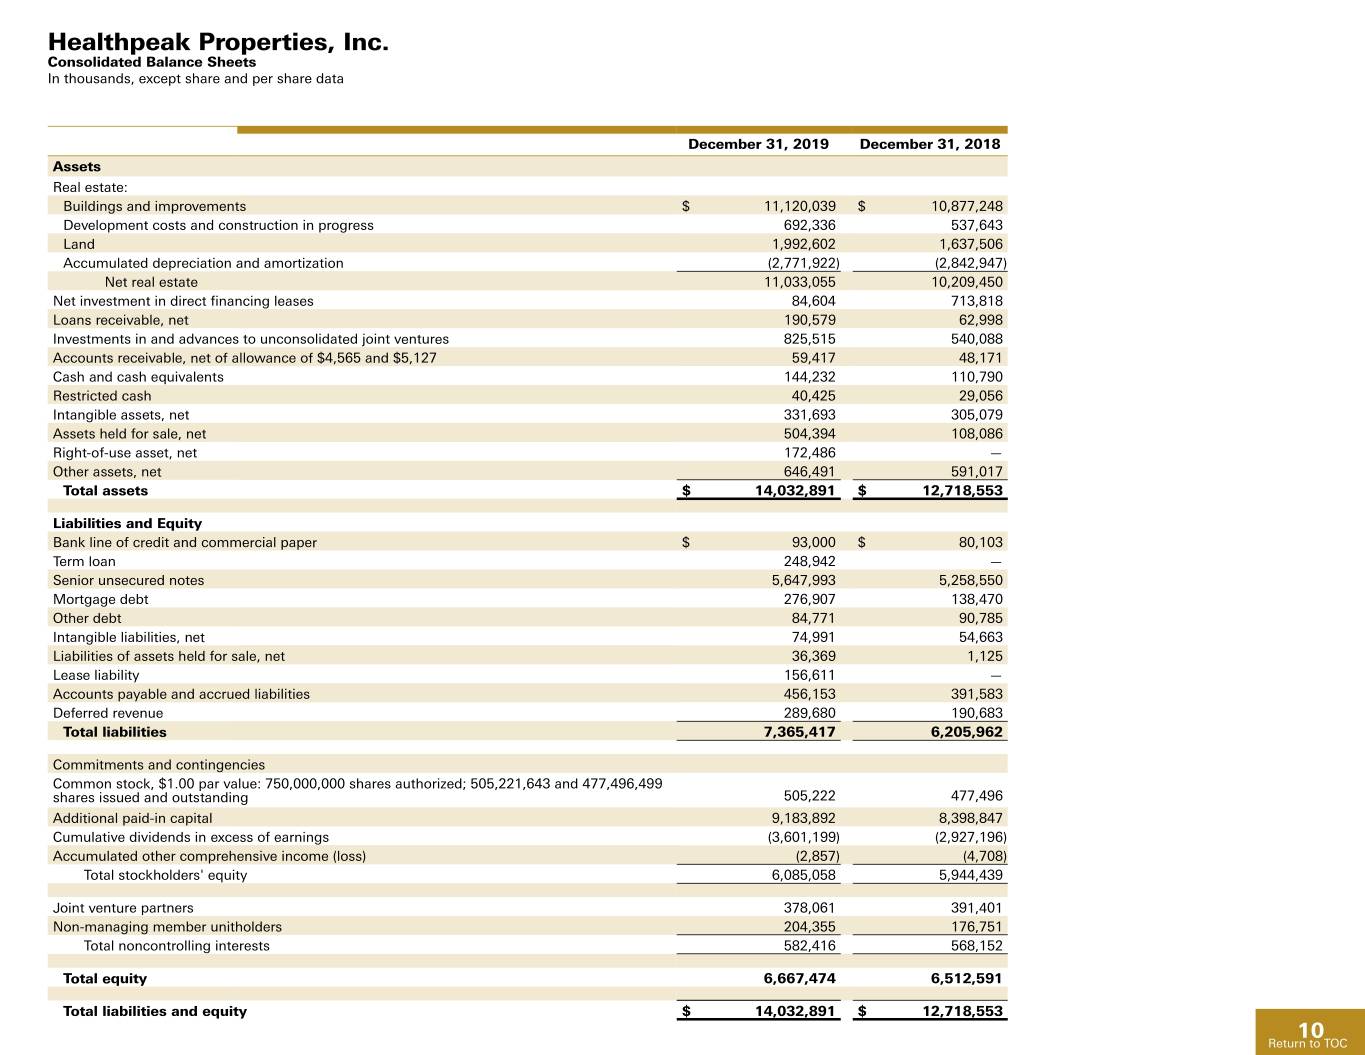
Healthpeak Properties, Inc. Consolidated Balance Sheets In thousands, except share and per share data December 31, 2019 December 31, 2018 Assets Real estate: Buildings and improvements $ 11,120,039 $ 10,877,248 Development costs and construction in progress 692,336 537,643 Land 1,992,602 1,637,506 Accumulated depreciation and amortization (2,771,922) (2,842,947) Net real estate 11,033,055 10,209,450 Net investment in direct financing leases 84,604 713,818 Loans receivable, net 190,579 62,998 Investments in and advances to unconsolidated joint ventures 825,515 540,088 Accounts receivable, net of allowance of $4,565 and $5,127 59,417 48,171 Cash and cash equivalents 144,232 110,790 Restricted cash 40,425 29,056 Intangible assets, net 331,693 305,079 Assets held for sale, net 504,394 108,086 Right-of-use asset, net 172,486 — Other assets, net 646,491 591,017 Total assets $ 14,032,891 $ 12,718,553 Liabilities and Equity Bank line of credit and commercial paper $ 93,000 $ 80,103 Term loan 248,942 — Senior unsecured notes 5,647,993 5,258,550 Mortgage debt 276,907 138,470 Other debt 84,771 90,785 Intangible liabilities, net 74,991 54,663 Liabilities of assets held for sale, net 36,369 1,125 Lease liability 156,611 — Accounts payable and accrued liabilities 456,153 391,583 Deferred revenue 289,680 190,683 Total liabilities 7,365,417 6,205,962 Commitments and contingencies Common stock, $1.00 par value: 750,000,000 shares authorized; 505,221,643 and 477,496,499 shares issued and outstanding 505,222 477,496 Additional paid-in capital 9,183,892 8,398,847 Cumulative dividends in excess of earnings (3,601,199) (2,927,196) Accumulated other comprehensive income (loss) (2,857) (4,708) Total stockholders' equity 6,085,058 5,944,439 Joint venture partners 378,061 391,401 Non-managing member unitholders 204,355 176,751 Total noncontrolling interests 582,416 568,152 Total equity 6,667,474 6,512,591 Total liabilities and equity $ 14,032,891 $ 12,718,553 10 ReturnReturn to to TOC TOC
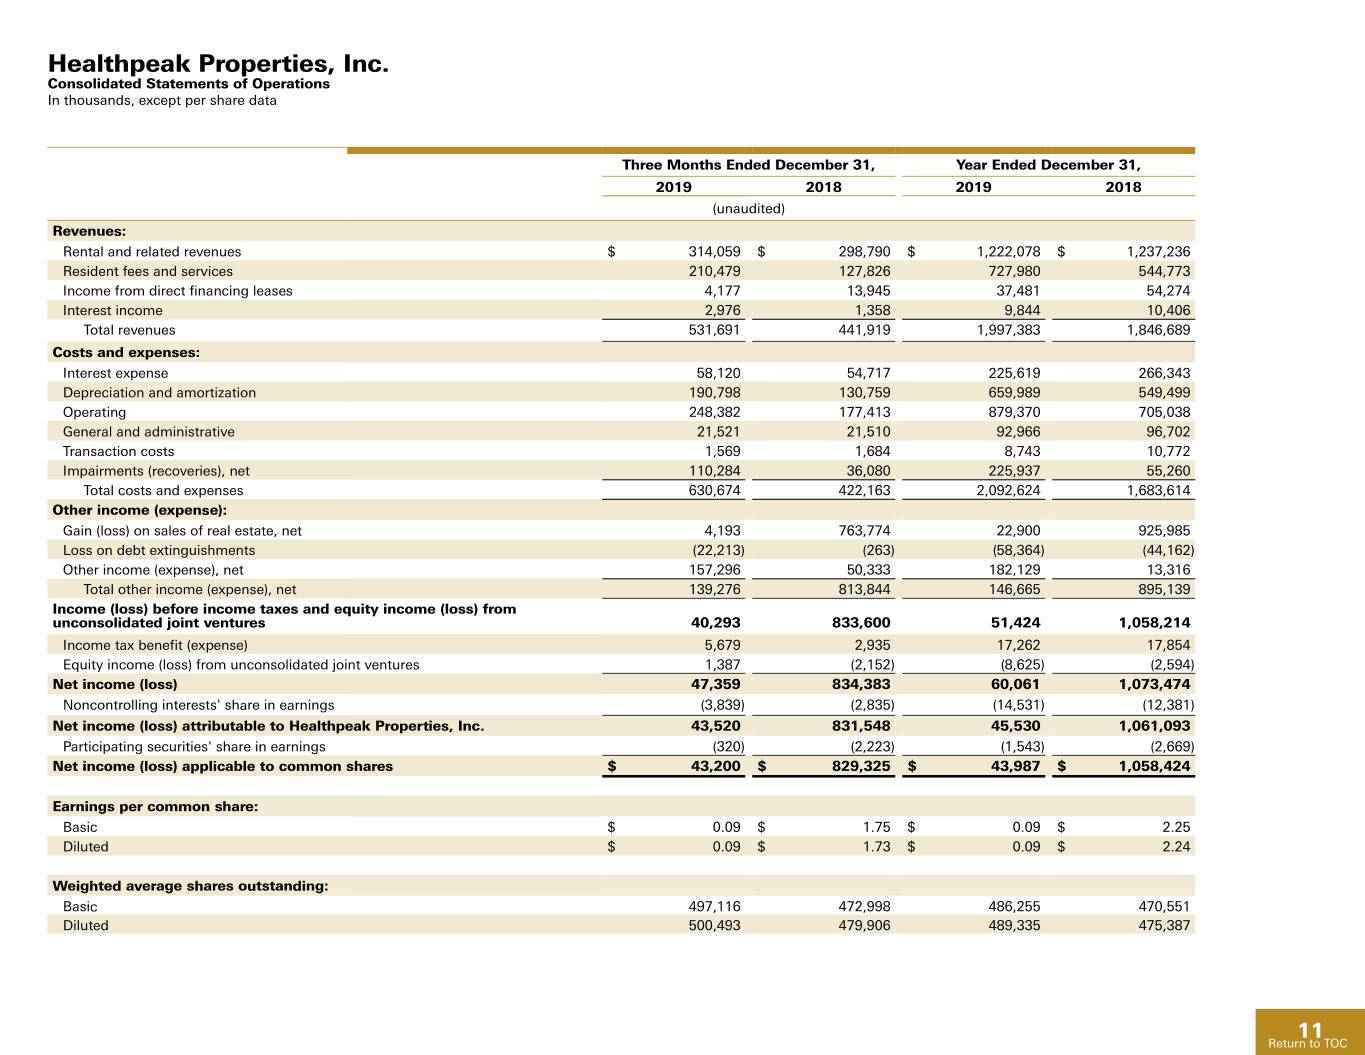
Healthpeak Properties, Inc. Consolidated Statements of Operations In thousands, except per share data Three Months Ended December 31, Year Ended December 31, 2019 2018 2019 2018 (unaudited) Revenues: Rental and related revenues $ 314,059 $ 298,790 $ 1,222,078 $ 1,237,236 Resident fees and services 210,479 127,826 727,980 544,773 Income from direct financing leases 4,177 13,945 37,481 54,274 Interest income 2,976 1,358 9,844 10,406 Total revenues 531,691 441,919 1,997,383 1,846,689 Costs and expenses: Interest expense 58,120 54,717 225,619 266,343 Depreciation and amortization 190,798 130,759 659,989 549,499 Operating 248,382 177,413 879,370 705,038 General and administrative 21,521 21,510 92,966 96,702 Transaction costs 1,569 1,684 8,743 10,772 Impairments (recoveries), net 110,284 36,080 225,937 55,260 Total costs and expenses 630,674 422,163 2,092,624 1,683,614 Other income (expense): Gain (loss) on sales of real estate, net 4,193 763,774 22,900 925,985 Loss on debt extinguishments (22,213) (263) (58,364) (44,162) Other income (expense), net 157,296 50,333 182,129 13,316 Total other income (expense), net 139,276 813,844 146,665 895,139 Income (loss) before income taxes and equity income (loss) from unconsolidated joint ventures 40,293 833,600 51,424 1,058,214 Income tax benefit (expense) 5,679 2,935 17,262 17,854 Equity income (loss) from unconsolidated joint ventures 1,387 (2,152) (8,625) (2,594) Net income (loss) 47,359 834,383 60,061 1,073,474 Noncontrolling interests' share in earnings (3,839) (2,835) (14,531) (12,381) Net income (loss) attributable to Healthpeak Properties, Inc. 43,520 831,548 45,530 1,061,093 Participating securities' share in earnings (320) (2,223) (1,543) (2,669) Net income (loss) applicable to common shares $ 43,200 $ 829,325 $ 43,987 $ 1,058,424 Earnings per common share: Basic $ 0.09 $ 1.75 $ 0.09 $ 2.25 Diluted $ 0.09 $ 1.73 $ 0.09 $ 2.24 Weighted average shares outstanding: Basic 497,116 472,998 486,255 470,551 Diluted 500,493 479,906 489,335 475,387 11 ReturnReturn to to TOC TOC
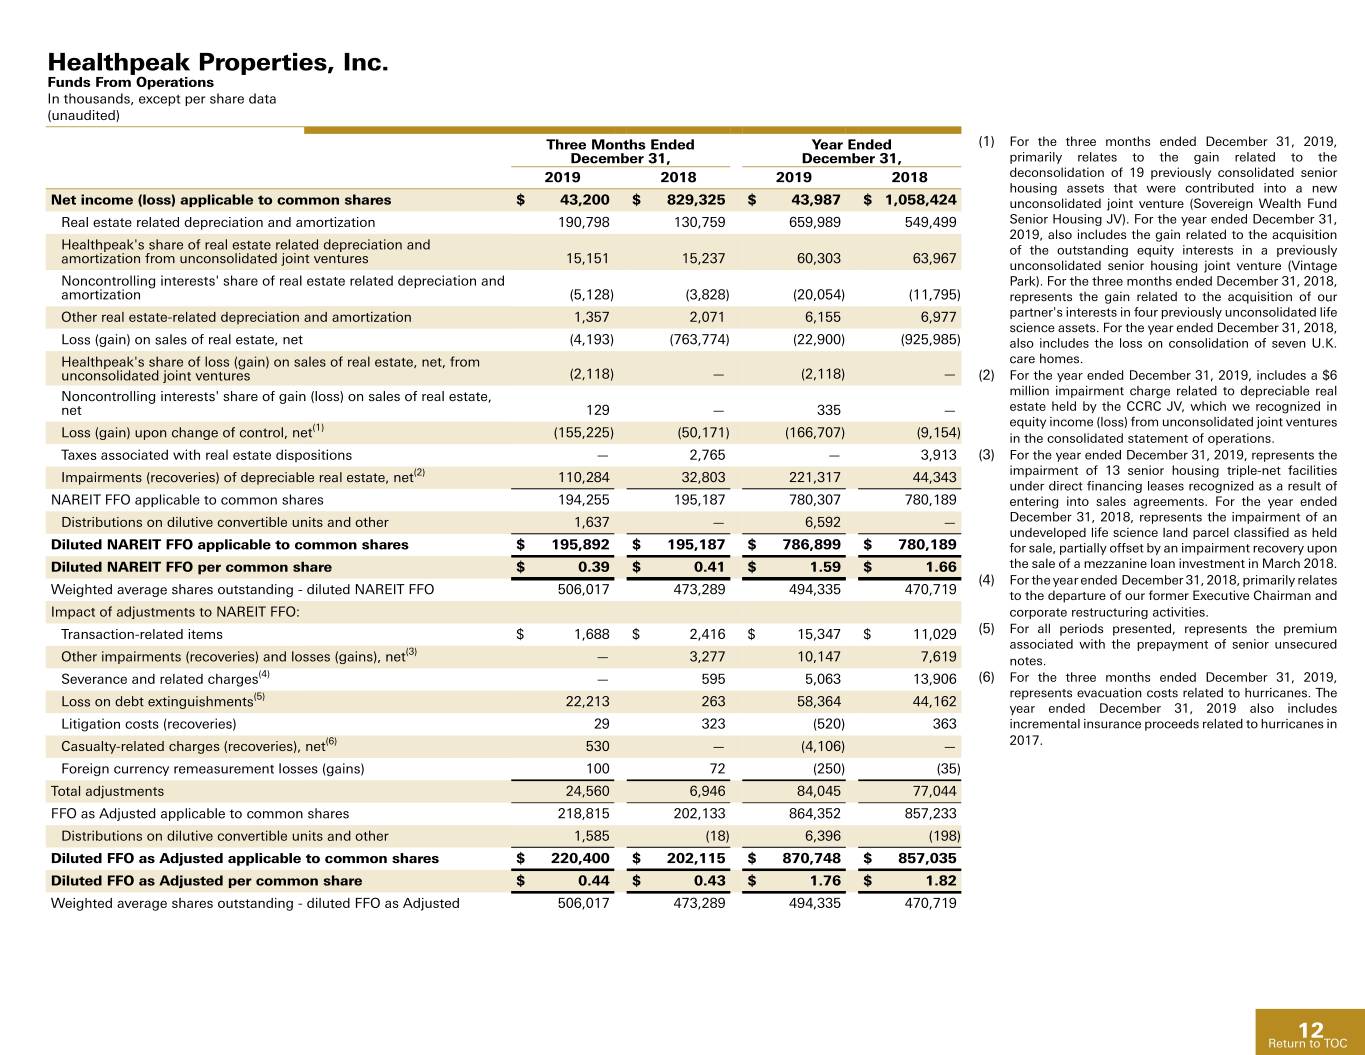
Healthpeak Properties, Inc. Funds From Operations In thousands, except per share data (unaudited) Three Months Ended Year Ended (1) For the three months ended December 31, 2019, December 31, December 31, primarily relates to the gain related to the 2019 2018 2019 2018 deconsolidation of 19 previously consolidated senior housing assets that were contributed into a new Net income (loss) applicable to common shares $ 43,200 $ 829,325 $ 43,987 $ 1,058,424 unconsolidated joint venture (Sovereign Wealth Fund Real estate related depreciation and amortization 190,798 130,759 659,989 549,499 Senior Housing JV). For the year ended December 31, 2019, also includes the gain related to the acquisition Healthpeak's share of real estate related depreciation and of the outstanding equity interests in a previously amortization from unconsolidated joint ventures 15,151 15,237 60,303 63,967 unconsolidated senior housing joint venture (Vintage Noncontrolling interests' share of real estate related depreciation and Park). For the three months ended December 31, 2018, amortization (5,128) (3,828) (20,054) (11,795) represents the gain related to the acquisition of our Other real estate-related depreciation and amortization 1,357 2,071 6,155 6,977 partner's interests in four previously unconsolidated life science assets. For the year ended December 31, 2018, Loss (gain) on sales of real estate, net (4,193) (763,774) (22,900) (925,985) also includes the loss on consolidation of seven U.K. Healthpeak's share of loss (gain) on sales of real estate, net, from care homes. unconsolidated joint ventures (2,118) — (2,118) — (2) For the year ended December 31, 2019, includes a $6 Noncontrolling interests' share of gain (loss) on sales of real estate, million impairment charge related to depreciable real net 129 — 335 — estate held by the CCRC JV, which we recognized in (1) equity income (loss) from unconsolidated joint ventures Loss (gain) upon change of control, net (155,225) (50,171) (166,707) (9,154) in the consolidated statement of operations. Taxes associated with real estate dispositions — 2,765 — 3,913 (3) For the year ended December 31, 2019, represents the (2) impairment of 13 senior housing triple-net facilities Impairments (recoveries) of depreciable real estate, net 110,284 32,803 221,317 44,343 under direct financing leases recognized as a result of NAREIT FFO applicable to common shares 194,255 195,187 780,307 780,189 entering into sales agreements. For the year ended Distributions on dilutive convertible units and other 1,637 — 6,592 — December 31, 2018, represents the impairment of an undeveloped life science land parcel classified as held Diluted NAREIT FFO applicable to common shares $ 195,892 $ 195,187 $ 786,899 $ 780,189 for sale, partially offset by an impairment recovery upon Diluted NAREIT FFO per common share $ 0.39 $ 0.41 $ 1.59 $ 1.66 the sale of a mezzanine loan investment in March 2018. (4) For the year ended December 31, 2018, primarily relates Weighted average shares outstanding - diluted NAREIT FFO 506,017 473,289 494,335 470,719 to the departure of our former Executive Chairman and Impact of adjustments to NAREIT FFO: corporate restructuring activities. Transaction-related items $ 1,688 $ 2,416 $ 15,347 $ 11,029 (5) For all periods presented, represents the premium associated with the prepayment of senior unsecured (3) Other impairments (recoveries) and losses (gains), net — 3,277 10,147 7,619 notes. Severance and related charges(4) — 595 5,063 13,906 (6) For the three months ended December 31, 2019, (5) represents evacuation costs related to hurricanes. The Loss on debt extinguishments 22,213 263 58,364 44,162 year ended December 31, 2019 also includes Litigation costs (recoveries) 29 323 (520) 363 incremental insurance proceeds related to hurricanes in Casualty-related charges (recoveries), net(6) 530 — (4,106) — 2017. Foreign currency remeasurement losses (gains) 100 72 (250) (35) Total adjustments 24,560 6,946 84,045 77,044 FFO as Adjusted applicable to common shares 218,815 202,133 864,352 857,233 Distributions on dilutive convertible units and other 1,585 (18) 6,396 (198) Diluted FFO as Adjusted applicable to common shares $ 220,400 $ 202,115 $ 870,748 $ 857,035 Diluted FFO as Adjusted per common share $ 0.44 $ 0.43 $ 1.76 $ 1.82 Weighted average shares outstanding - diluted FFO as Adjusted 506,017 473,289 494,335 470,719 12 ReturnReturn to to TOC TOC
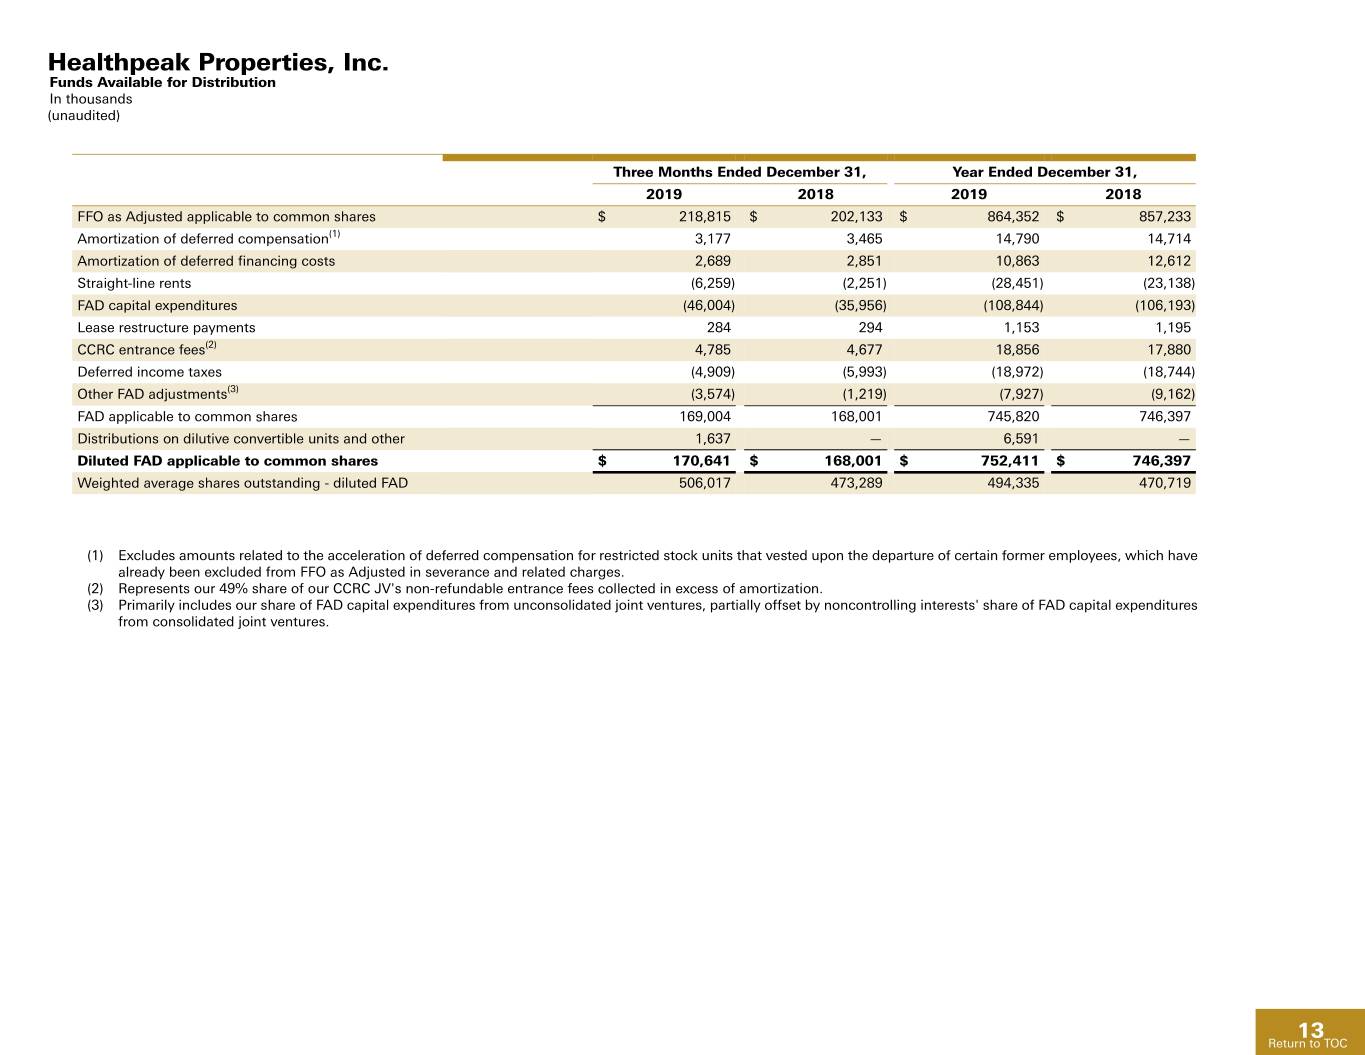
Healthpeak Properties, Inc. Funds Available for Distribution In thousands (unaudited) Three Months Ended December 31, Year Ended December 31, 2019 2018 2019 2018 FFO as Adjusted applicable to common shares $ 218,815 $ 202,133 $ 864,352 $ 857,233 Amortization of deferred compensation(1) 3,177 3,465 14,790 14,714 Amortization of deferred financing costs 2,689 2,851 10,863 12,612 Straight-line rents (6,259) (2,251) (28,451) (23,138) FAD capital expenditures (46,004) (35,956) (108,844) (106,193) Lease restructure payments 284 294 1,153 1,195 CCRC entrance fees(2) 4,785 4,677 18,856 17,880 Deferred income taxes (4,909) (5,993) (18,972) (18,744) Other FAD adjustments(3) (3,574) (1,219) (7,927) (9,162) FAD applicable to common shares 169,004 168,001 745,820 746,397 Distributions on dilutive convertible units and other 1,637 — 6,591 — Diluted FAD applicable to common shares $ 170,641 $ 168,001 $ 752,411 $ 746,397 Weighted average shares outstanding - diluted FAD 506,017 473,289 494,335 470,719 (1) Excludes amounts related to the acceleration of deferred compensation for restricted stock units that vested upon the departure of certain former employees, which have already been excluded from FFO as Adjusted in severance and related charges. (2) Represents our 49% share of our CCRC JV's non-refundable entrance fees collected in excess of amortization. (3) Primarily includes our share of FAD capital expenditures from unconsolidated joint ventures, partially offset by noncontrolling interests' share of FAD capital expenditures from consolidated joint ventures. 13 ReturnReturn to to TOC TOC
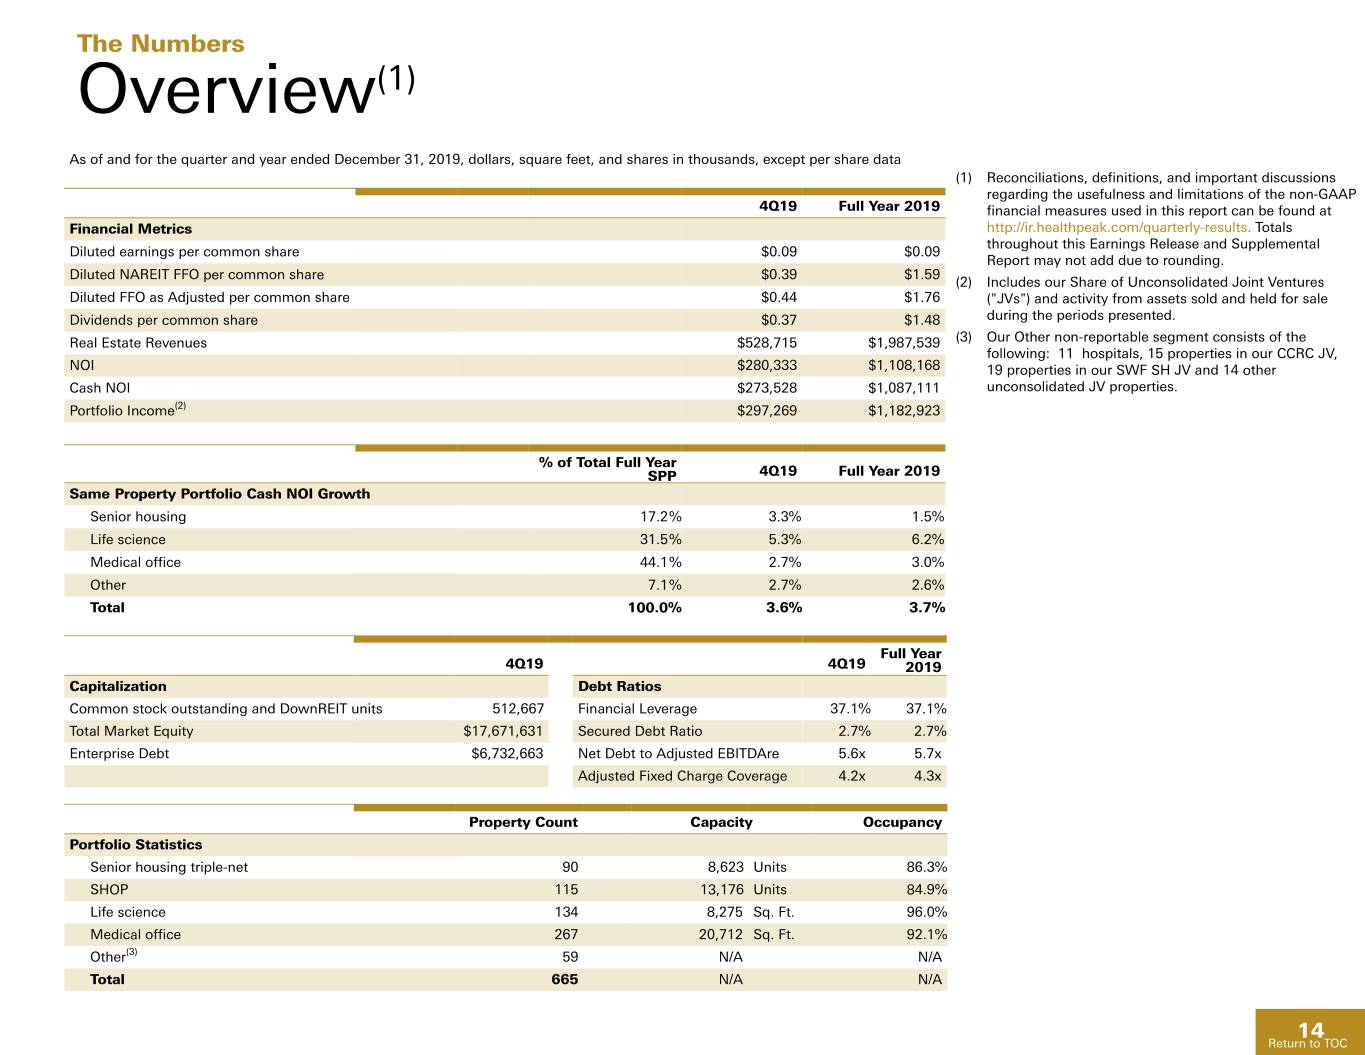
The Numbers Overview(1) As of and for the quarter and year ended December 31, 2019, dollars, square feet, and shares in thousands, except per share data (1) Reconciliations, definitions, and important discussions regarding the usefulness and limitations of the non-GAAP 4Q19 Full Year 2019 financial measures used in this report can be found at Financial Metrics http://ir.healthpeak.com/quarterly-results. Totals throughout this Earnings Release and Supplemental Diluted earnings per common share $0.09 $0.09 Report may not add due to rounding. Diluted NAREIT FFO per common share $0.39 $1.59 (2) Includes our Share of Unconsolidated Joint Ventures Diluted FFO as Adjusted per common share $0.44 $1.76 ("JVs") and activity from assets sold and held for sale Dividends per common share $0.37 $1.48 during the periods presented. Real Estate Revenues $528,715 $1,987,539 (3) Our Other non-reportable segment consists of the following: 11 hospitals, 15 properties in our CCRC JV, NOI $280,333 $1,108,168 19 properties in our SWF SH JV and 14 other Cash NOI $273,528 $1,087,111 unconsolidated JV properties. Portfolio Income(2) $297,269 $1,182,923 % of Total Full Year SPP 4Q19 Full Year 2019 Same Property Portfolio Cash NOI Growth Senior housing 17.2% 3.3% 1.5% Life science 31.5% 5.3% 6.2% Medical office 44.1% 2.7% 3.0% Other 7.1% 2.7% 2.6% Total 100.0% 3.6% 3.7% Full Year 4Q19 4Q19 2019 Capitalization Debt Ratios Common stock outstanding and DownREIT units 512,667 Financial Leverage 37.1% 37.1% Total Market Equity $17,671,631 Secured Debt Ratio 2.7% 2.7% Enterprise Debt $6,732,663 Net Debt to Adjusted EBITDAre 5.6x 5.7x Adjusted Fixed Charge Coverage 4.2x 4.3x Property Count Capacity Occupancy Portfolio Statistics Senior housing triple-net 90 8,623 Units 86.3% SHOP 115 13,176 Units 84.9% Life science 134 8,275 Sq. Ft. 96.0% Medical office 267 20,712 Sq. Ft. 92.1% Other(3) 59 N/A N/A Total 665 N/A N/A 14 ReturnReturn to to TOC TOC
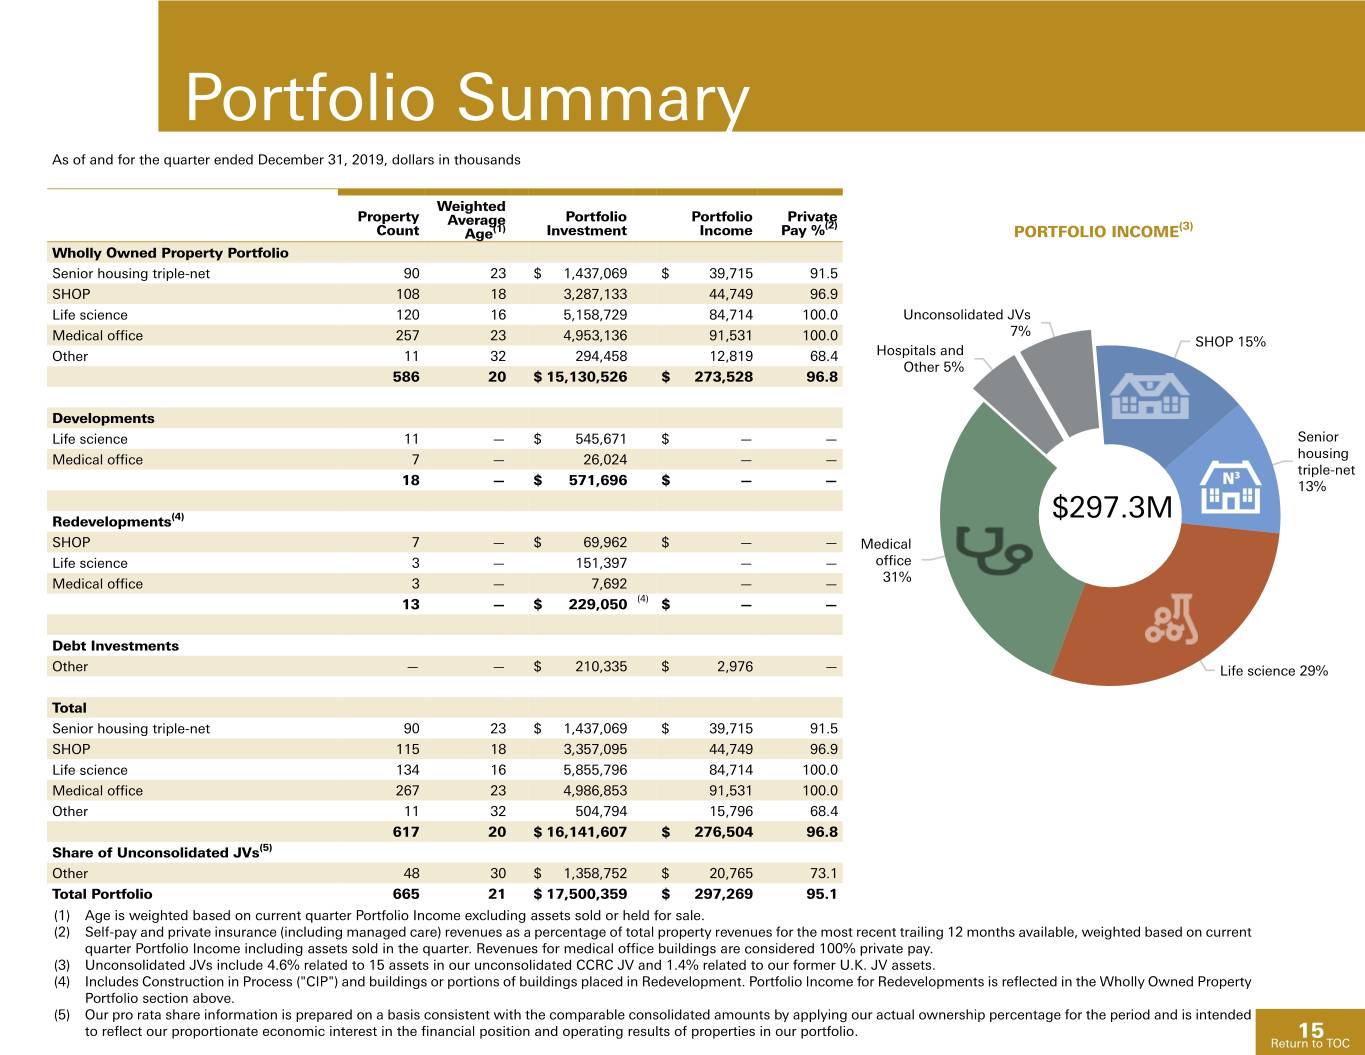
Portfolio Summary As of and for the quarter ended December 31, 2019, dollars in thousands Weighted Property Portfolio Portfolio Private Average (2) (3) Count Age(1) Investment Income Pay % PORTFOLIO INCOME Wholly Owned Property Portfolio Senior housing triple-net 90 23 $ 1,437,069 $ 39,715 91.5 SHOP 108 18 3,287,133 44,749 96.9 Life science 120 16 5,158,729 84,714 100.0 Unconsolidated JVs 7% Medical office 257 23 4,953,136 91,531 100.0 SHOP 15% Other 11 32 294,458 12,819 68.4 Hospitals and Other 5% 586 20 $ 15,130,526 $ 273,528 96.8 Developments Life science 11 — $ 545,671 $ — — Senior Medical office 7 — 26,024 — — housing triple-net 18 — $ 571,696 $ — — 13% Redevelopments(4) $297.3M SHOP 7 — $ 69,962 $ — — Medical Life science 3 — 151,397 — — office Medical office 3 — 7,692 — — 31% 13 — $ 229,050 (4) $ — — Debt Investments Other — — $ 210,335 $ 2,976 — Life science 29% Total Senior housing triple-net 90 23 $ 1,437,069 $ 39,715 91.5 SHOP 115 18 3,357,095 44,749 96.9 Life science 134 16 5,855,796 84,714 100.0 Medical office 267 23 4,986,853 91,531 100.0 Other 11 32 504,794 15,796 68.4 617 20 $ 16,141,607 $ 276,504 96.8 Share of Unconsolidated JVs(5) Other 48 30 $ 1,358,752 $ 20,765 73.1 Total Portfolio 665 21 $ 17,500,359 $ 297,269 95.1 (1) Age is weighted based on current quarter Portfolio Income excluding assets sold or held for sale. (2) Self-pay and private insurance (including managed care) revenues as a percentage of total property revenues for the most recent trailing 12 months available, weighted based on current quarter Portfolio Income including assets sold in the quarter. Revenues for medical office buildings are considered 100% private pay. (3) Unconsolidated JVs include 4.6% related to 15 assets in our unconsolidated CCRC JV and 1.4% related to our former U.K. JV assets. (4) Includes Construction in Process ("CIP") and buildings or portions of buildings placed in Redevelopment. Portfolio Income for Redevelopments is reflected in the Wholly Owned Property Portfolio section above. (5) Our pro rata share information is prepared on a basis consistent with the comparable consolidated amounts by applying our actual ownership percentage for the period and is intended to reflect our proportionate economic interest in the financial position and operating results of properties in our portfolio. 15 Return to TOC
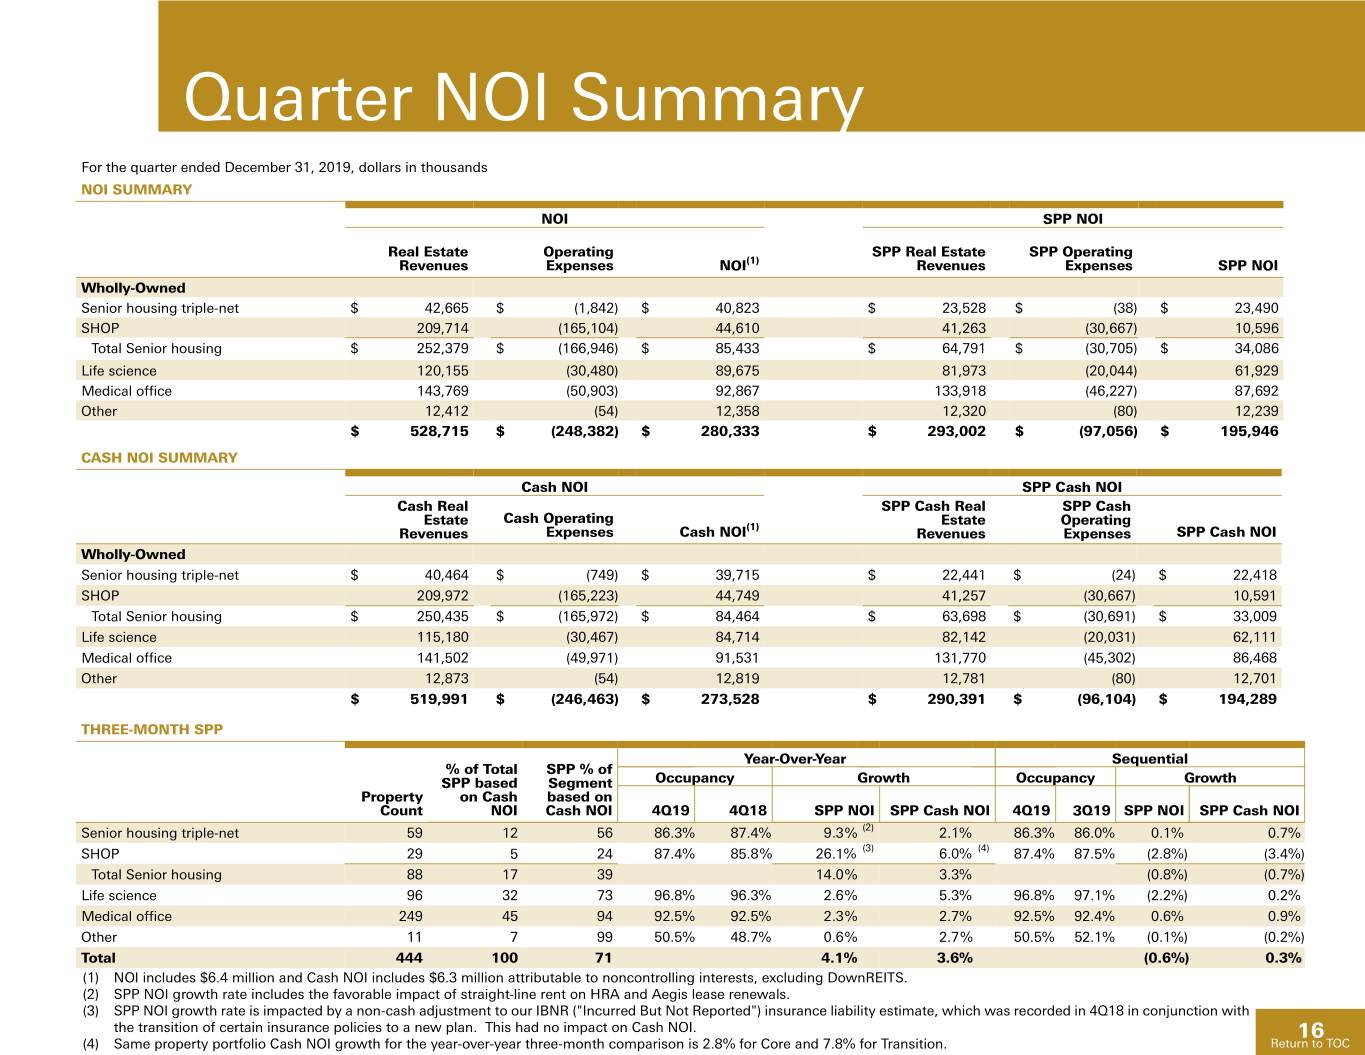
Quarter NOI Summary For the quarter ended December 31, 2019, dollars in thousands NOI SUMMARY NOI SPP NOI Real Estate Operating SPP Real Estate SPP Operating Revenues Expenses NOI(1) Revenues Expenses SPP NOI Wholly-Owned Senior housing triple-net $ 42,665 $ (1,842) $ 40,823 $ 23,528 $ (38) $ 23,490 SHOP 209,714 (165,104) 44,610 41,263 (30,667) 10,596 Total Senior housing $ 252,379 $ (166,946) $ 85,433 $ 64,791 $ (30,705) $ 34,086 Life science 120,155 (30,480) 89,675 81,973 (20,044) 61,929 Medical office 143,769 (50,903) 92,867 133,918 (46,227) 87,692 Other 12,412 (54) 12,358 12,320 (80) 12,239 $ 528,715 $ (248,382) $ 280,333 $ 293,002 $ (97,056) $ 195,946 CASH NOI SUMMARY Cash NOI SPP Cash NOI Cash Real SPP Cash Real SPP Cash Cash Operating Estate (1) Estate Operating Revenues Expenses Cash NOI Revenues Expenses SPP Cash NOI Wholly-Owned Senior housing triple-net $ 40,464 $ (749) $ 39,715 $ 22,441 $ (24) $ 22,418 SHOP 209,972 (165,223) 44,749 41,257 (30,667) 10,591 Total Senior housing $ 250,435 $ (165,972) $ 84,464 $ 63,698 $ (30,691) $ 33,009 Life science 115,180 (30,467) 84,714 82,142 (20,031) 62,111 Medical office 141,502 (49,971) 91,531 131,770 (45,302) 86,468 Other 12,873 (54) 12,819 12,781 (80) 12,701 $ 519,991 $ (246,463) $ 273,528 $ 290,391 $ (96,104) $ 194,289 THREE-MONTH SPP Year-Over-Year Sequential % of Total SPP % of SPP based Segment Occupancy Growth Occupancy Growth Property on Cash based on Count NOI Cash NOI 4Q19 4Q18 SPP NOI SPP Cash NOI 4Q19 3Q19 SPP NOI SPP Cash NOI Senior housing triple-net 59 12 56 86.3% 87.4% 9.3% (2) 2.1% 86.3% 86.0% 0.1% 0.7% SHOP 29 5 24 87.4% 85.8% 26.1% (3) 6.0% (4) 87.4% 87.5% (2.8%) (3.4%) Total Senior housing 88 17 39 14.0% 3.3% (0.8%) (0.7%) Life science 96 32 73 96.8% 96.3% 2.6% 5.3% 96.8% 97.1% (2.2%) 0.2% Medical office 249 45 94 92.5% 92.5% 2.3% 2.7% 92.5% 92.4% 0.6% 0.9% Other 11 7 99 50.5% 48.7% 0.6% 2.7% 50.5% 52.1% (0.1%) (0.2%) Total 444 100 71 4.1% 3.6% (0.6%) 0.3% (1) NOI includes $6.4 million and Cash NOI includes $6.3 million attributable to noncontrolling interests, excluding DownREITS. (2) SPP NOI growth rate includes the favorable impact of straight-line rent on HRA and Aegis lease renewals. (3) SPP NOI growth rate is impacted by a non-cash adjustment to our IBNR ("Incurred But Not Reported") insurance liability estimate, which was recorded in 4Q18 in conjunction with the transition of certain insurance policies to a new plan. This had no impact on Cash NOI. 16 (4) Same property portfolio Cash NOI growth for the year-over-year three-month comparison is 2.8% for Core and 7.8% for Transition. Return to TOC
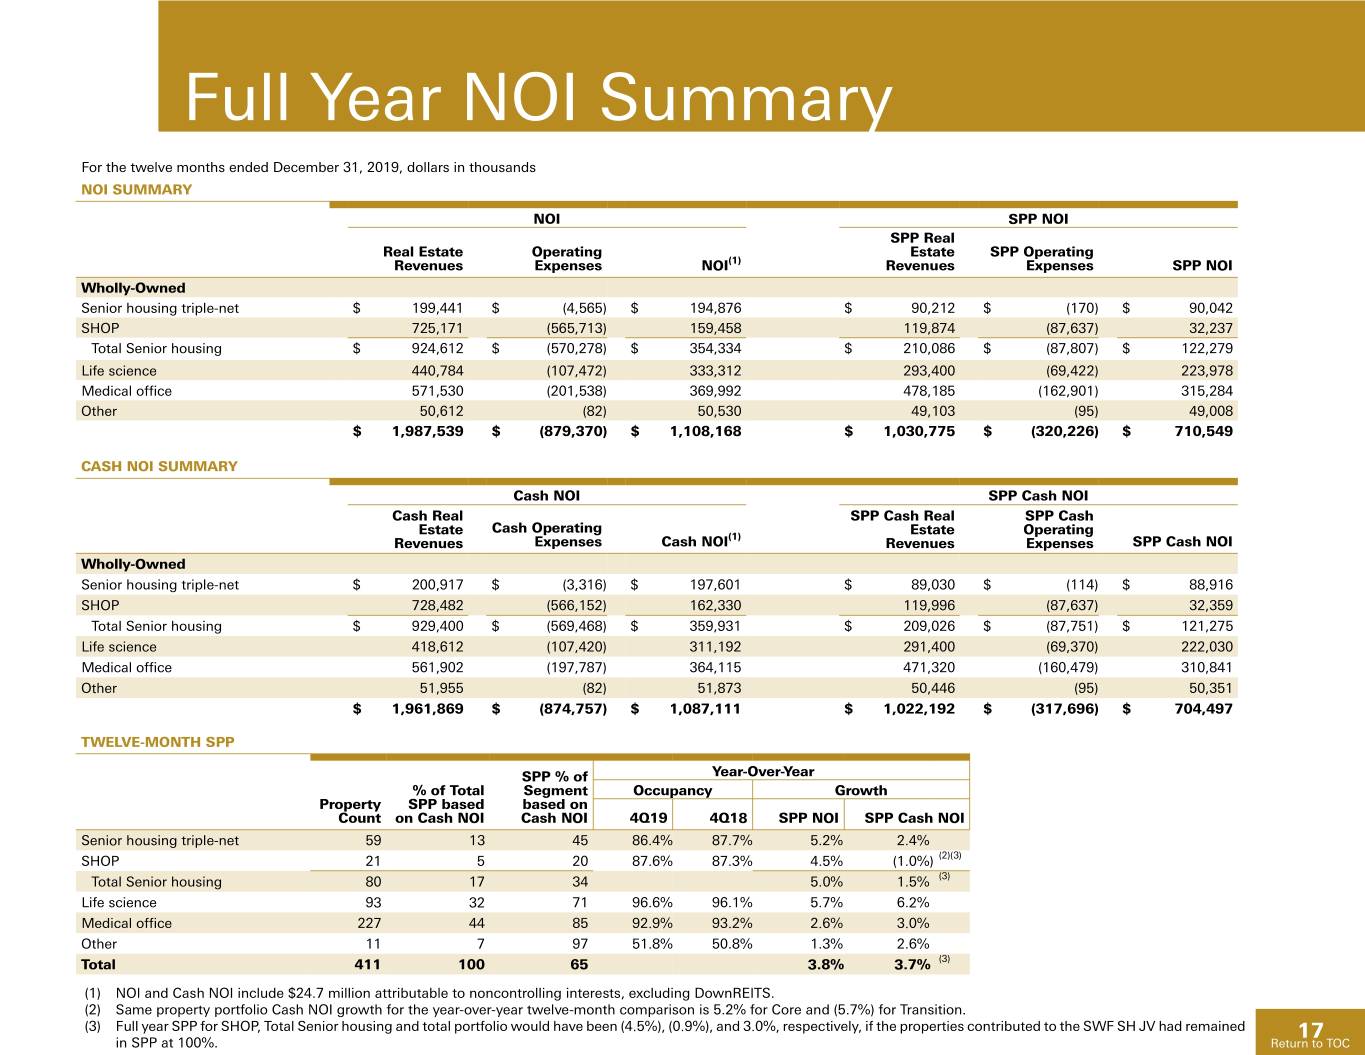
Full Year NOI Summary For the twelve months ended December 31, 2019, dollars in thousands NOI SUMMARY NOI SPP NOI SPP Real Real Estate Operating Estate SPP Operating Revenues Expenses NOI(1) Revenues Expenses SPP NOI Wholly-Owned Senior housing triple-net $ 199,441 $ (4,565) $ 194,876 $ 90,212 $ (170) $ 90,042 SHOP 725,171 (565,713) 159,458 119,874 (87,637) 32,237 Total Senior housing $ 924,612 $ (570,278) $ 354,334 $ 210,086 $ (87,807) $ 122,279 Life science 440,784 (107,472) 333,312 293,400 (69,422) 223,978 Medical office 571,530 (201,538) 369,992 478,185 (162,901) 315,284 Other 50,612 (82) 50,530 49,103 (95) 49,008 $ 1,987,539 $ (879,370) $ 1,108,168 $ 1,030,775 $ (320,226) $ 710,549 CASH NOI SUMMARY Cash NOI SPP Cash NOI Cash Real SPP Cash Real SPP Cash Cash Operating Estate (1) Estate Operating Revenues Expenses Cash NOI Revenues Expenses SPP Cash NOI Wholly-Owned Senior housing triple-net $ 200,917 $ (3,316) $ 197,601 $ 89,030 $ (114) $ 88,916 SHOP 728,482 (566,152) 162,330 119,996 (87,637) 32,359 Total Senior housing $ 929,400 $ (569,468) $ 359,931 $ 209,026 $ (87,751) $ 121,275 Life science 418,612 (107,420) 311,192 291,400 (69,370) 222,030 Medical office 561,902 (197,787) 364,115 471,320 (160,479) 310,841 Other 51,955 (82) 51,873 50,446 (95) 50,351 $ 1,961,869 $ (874,757) $ 1,087,111 $ 1,022,192 $ (317,696) $ 704,497 TWELVE-MONTH SPP SPP % of Year-Over-Year % of Total Segment Occupancy Growth Property SPP based based on Count on Cash NOI Cash NOI 4Q19 4Q18 SPP NOI SPP Cash NOI Senior housing triple-net 59 13 45 86.4% 87.7% 5.2% 2.4% SHOP 21 5 20 87.6% 87.3% 4.5% (1.0%) (2)(3) Total Senior housing 80 17 34 5.0% 1.5% (3) Life science 93 32 71 96.6% 96.1% 5.7% 6.2% Medical office 227 44 85 92.9% 93.2% 2.6% 3.0% Other 11 7 97 51.8% 50.8% 1.3% 2.6% Total 411 100 65 3.8% 3.7% (3) (1) NOI and Cash NOI include $24.7 million attributable to noncontrolling interests, excluding DownREITS. (2) Same property portfolio Cash NOI growth for the year-over-year twelve-month comparison is 5.2% for Core and (5.7%) for Transition. (3) Full year SPP for SHOP, Total Senior housing and total portfolio would have been (4.5%), (0.9%), and 3.0%, respectively, if the properties contributed to the SWF SH JV had remained 17 in SPP at 100%. Return to TOC
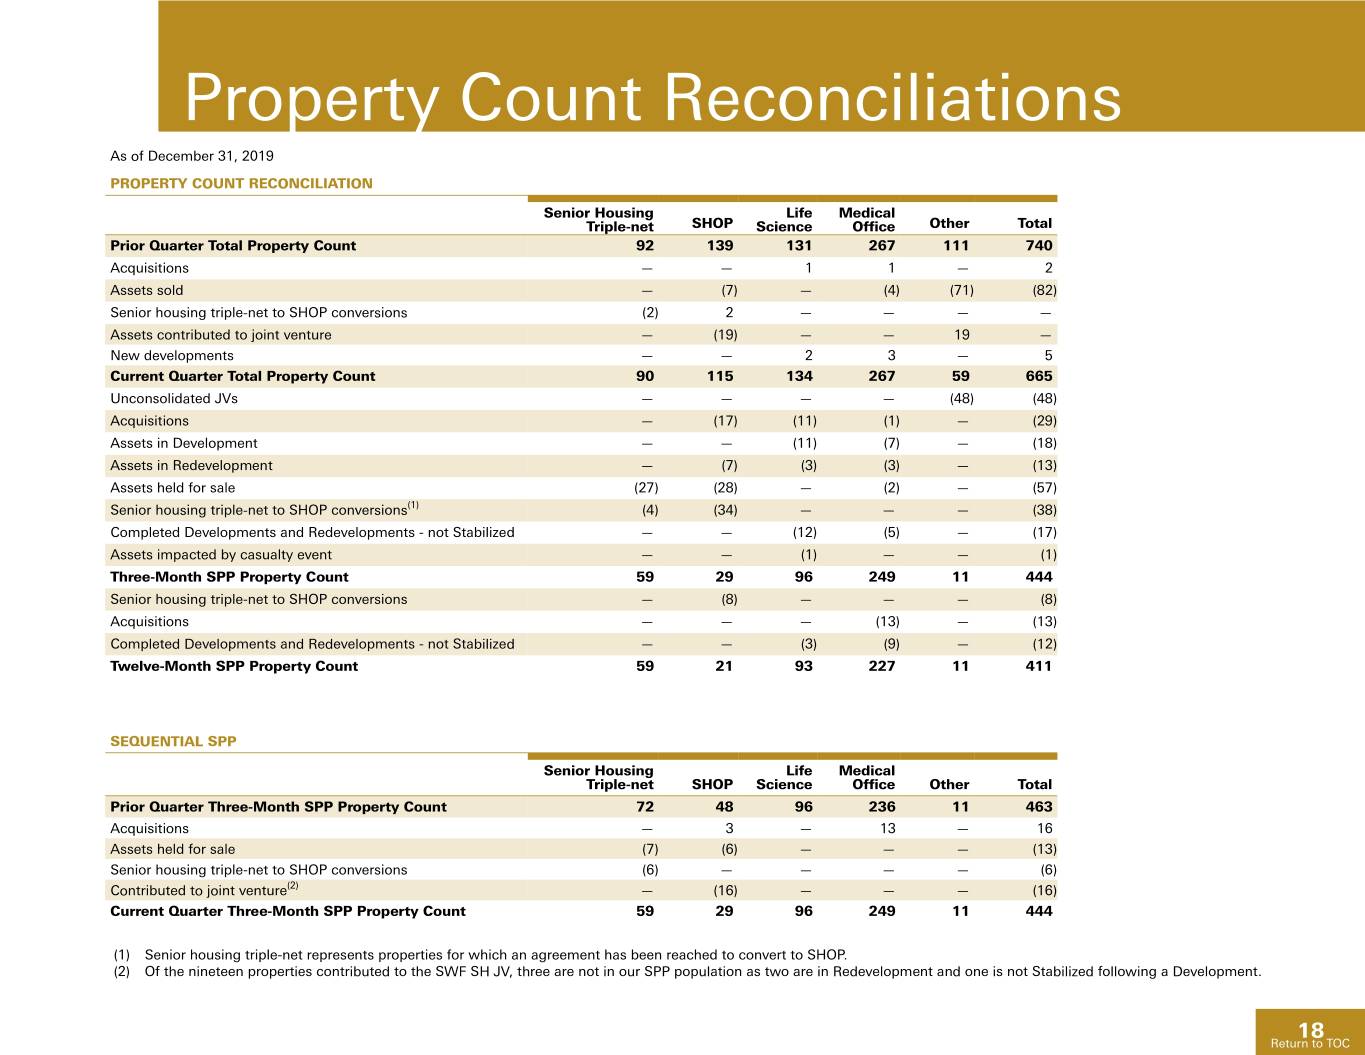
Property Count Reconciliations As of December 31, 2019 PROPERTY COUNT RECONCILIATION Senior Housing Life Medical Triple-net SHOP Science Office Other Total Prior Quarter Total Property Count 92 139 131 267 111 740 Acquisitions — — 1 1 — 2 Assets sold — (7) — (4) (71) (82) Senior housing triple-net to SHOP conversions (2) 2 — — — — Assets contributed to joint venture — (19) — — 19 — New developments — — 2 3 — 5 Current Quarter Total Property Count 90 115 134 267 59 665 Unconsolidated JVs — — — — (48) (48) Acquisitions — (17) (11) (1) — (29) Assets in Development — — (11) (7) — (18) Assets in Redevelopment — (7) (3) (3) — (13) Assets held for sale (27) (28) — (2) — (57) Senior housing triple-net to SHOP conversions(1) (4) (34) — — — (38) Completed Developments and Redevelopments - not Stabilized — — (12) (5) — (17) Assets impacted by casualty event — — (1) — — (1) Three-Month SPP Property Count 59 29 96 249 11 444 Senior housing triple-net to SHOP conversions — (8) — — — (8) Acquisitions — — — (13) — (13) Completed Developments and Redevelopments - not Stabilized — — (3) (9) — (12) Twelve-Month SPP Property Count 59 21 93 227 11 411 SEQUENTIAL SPP Senior Housing Life Medical Triple-net SHOP Science Office Other Total Prior Quarter Three-Month SPP Property Count 72 48 96 236 11 463 Acquisitions — 3 — 13 — 16 Assets held for sale (7) (6) — — — (13) Senior housing triple-net to SHOP conversions (6) — — — — (6) Contributed to joint venture(2) — (16) — — — (16) Current Quarter Three-Month SPP Property Count 59 29 96 249 11 444 (1) Senior housing triple-net represents properties for which an agreement has been reached to convert to SHOP. (2) Of the nineteen properties contributed to the SWF SH JV, three are not in our SPP population as two are in Redevelopment and one is not Stabilized following a Development. 18 Return to TOC
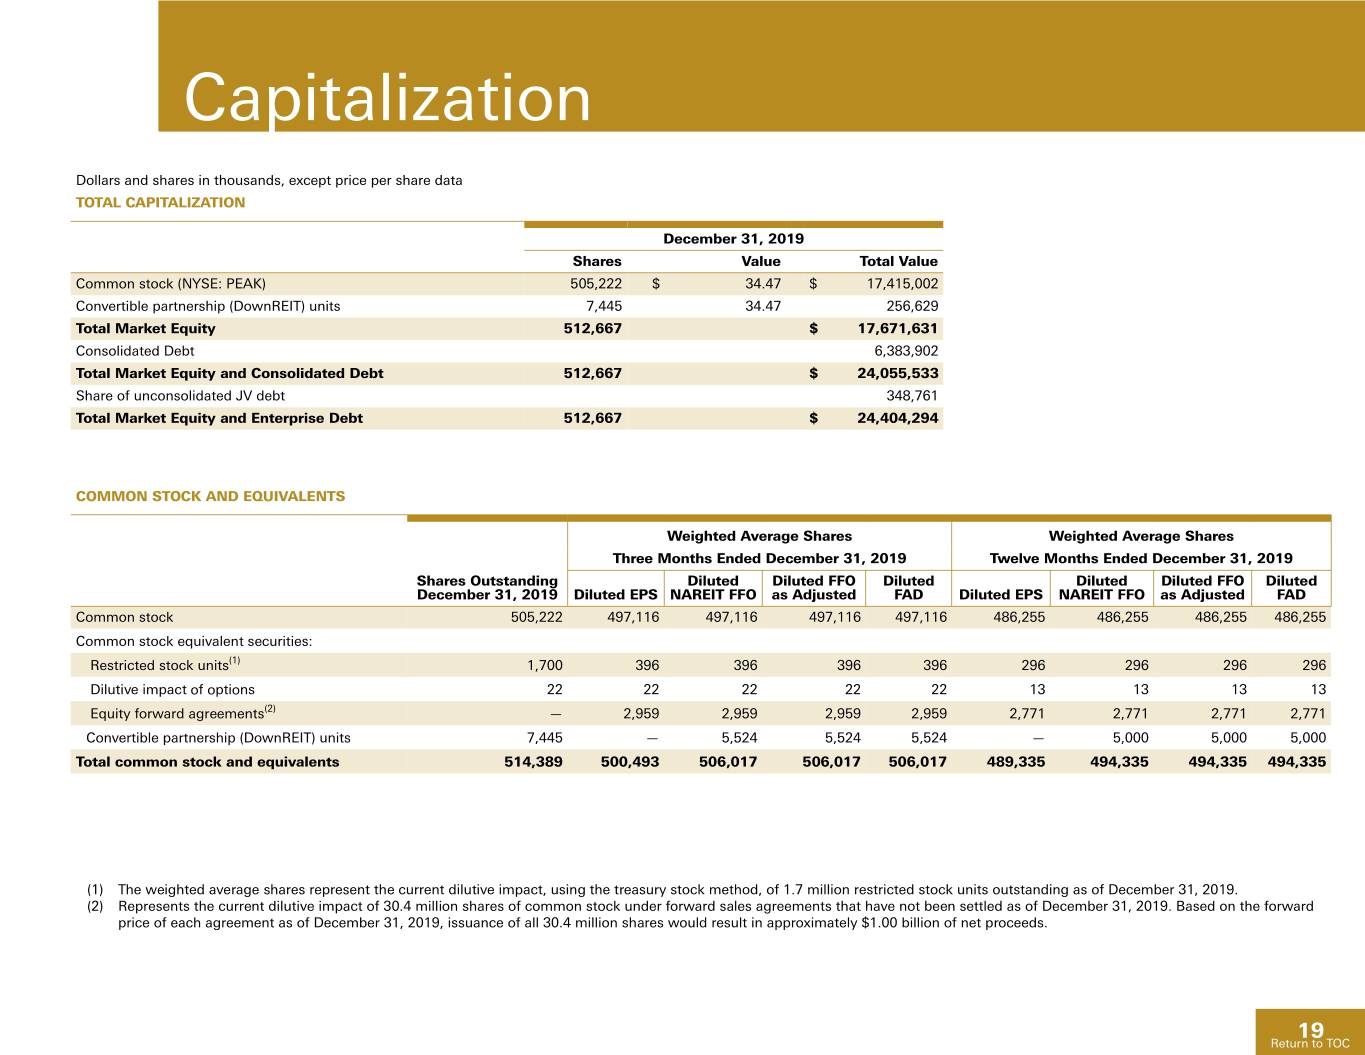
Capitalization Dollars and shares in thousands, except price per share data TOTAL CAPITALIZATION December 31, 2019 Shares Value Total Value Common stock (NYSE: PEAK) 505,222 $ 34.47 $ 17,415,002 Convertible partnership (DownREIT) units 7,445 34.47 256,629 Total Market Equity 512,667 $ 17,671,631 Consolidated Debt 6,383,902 Total Market Equity and Consolidated Debt 512,667 $ 24,055,533 Share of unconsolidated JV debt 348,761 Total Market Equity and Enterprise Debt 512,667 $ 24,404,294 COMMON STOCK AND EQUIVALENTS Weighted Average Shares Weighted Average Shares Three Months Ended December 31, 2019 Twelve Months Ended December 31, 2019 Shares Outstanding Diluted Diluted FFO Diluted Diluted Diluted FFO Diluted December 31, 2019 Diluted EPS NAREIT FFO as Adjusted FAD Diluted EPS NAREIT FFO as Adjusted FAD Common stock 505,222 497,116 497,116 497,116 497,116 486,255 486,255 486,255 486,255 Common stock equivalent securities: Restricted stock units(1) 1,700 396 396 396 396 296 296 296 296 Dilutive impact of options 22 22 22 22 22 13 13 13 13 Equity forward agreements(2) — 2,959 2,959 2,959 2,959 2,771 2,771 2,771 2,771 Convertible partnership (DownREIT) units 7,445 — 5,524 5,524 5,524 — 5,000 5,000 5,000 Total common stock and equivalents 514,389 500,493 506,017 506,017 506,017 489,335 494,335 494,335 494,335 (1) The weighted average shares represent the current dilutive impact, using the treasury stock method, of 1.7 million restricted stock units outstanding as of December 31, 2019. (2) Represents the current dilutive impact of 30.4 million shares of common stock under forward sales agreements that have not been settled as of December 31, 2019. Based on the forward price of each agreement as of December 31, 2019, issuance of all 30.4 million shares would result in approximately $1.00 billion of net proceeds. 19 Return to TOC
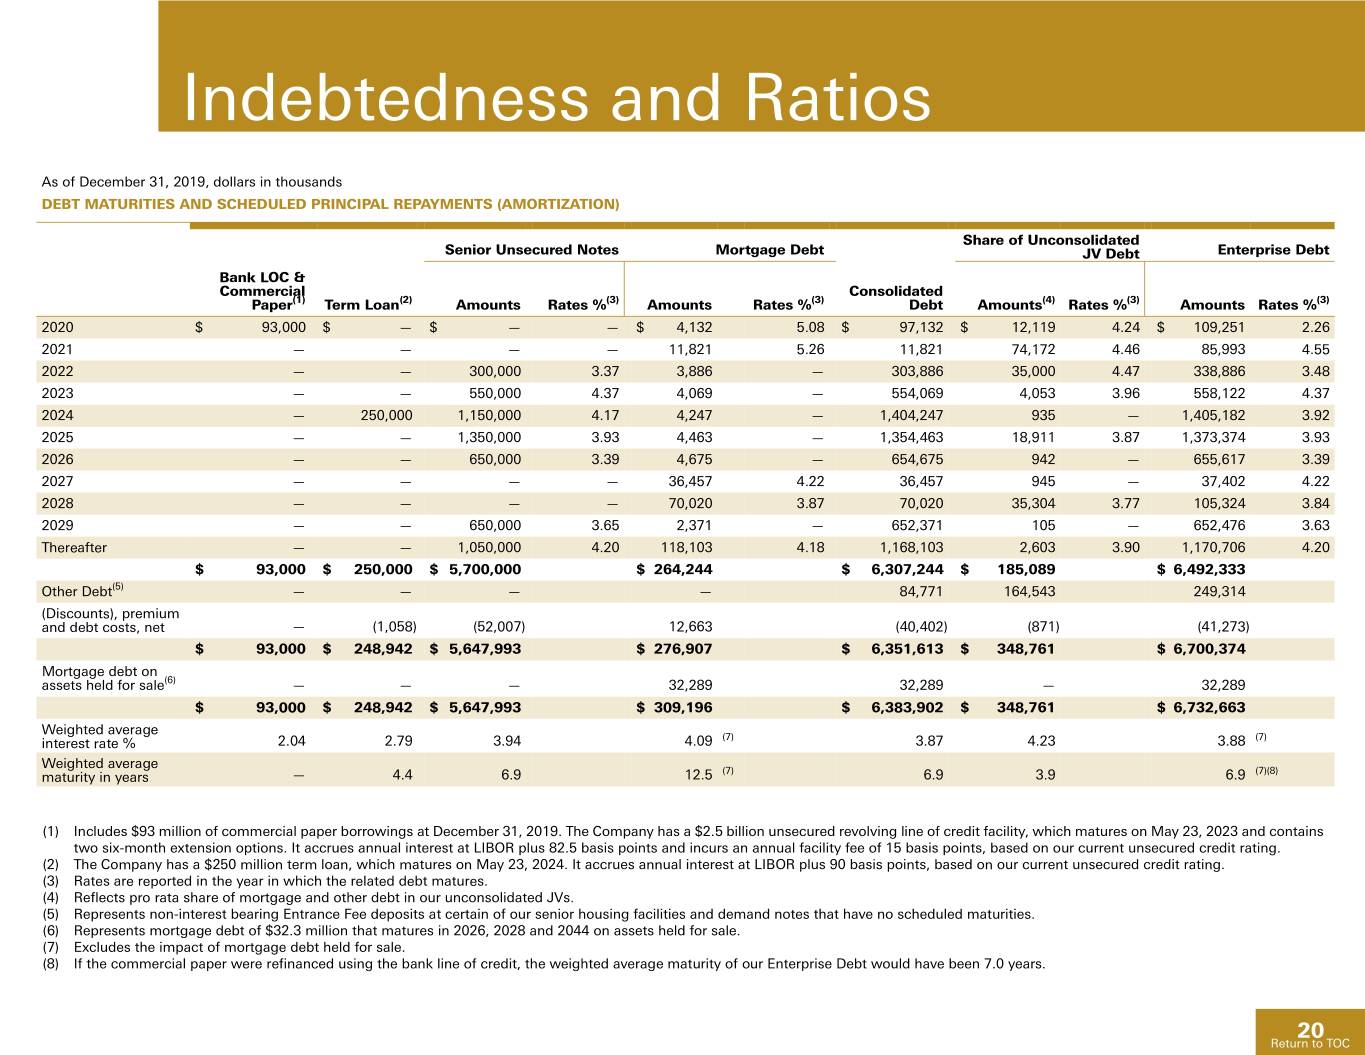
Indebtedness and Ratios As of December 31, 2019, dollars in thousands DEBT MATURITIES AND SCHEDULED PRINCIPAL REPAYMENTS (AMORTIZATION) Share of Unconsolidated Senior Unsecured Notes Mortgage Debt JV Debt Enterprise Debt Bank LOC & Commercial Consolidated Paper(1) Term Loan(2) Amounts Rates %(3) Amounts Rates %(3) Debt Amounts(4) Rates %(3) Amounts Rates %(3) 2020 $ 93,000 $ — $ — — $ 4,132 5.08 $ 97,132 $ 12,119 4.24 $ 109,251 2.26 2021 — — — — 11,821 5.26 11,821 74,172 4.46 85,993 4.55 2022 — — 300,000 3.37 3,886 — 303,886 35,000 4.47 338,886 3.48 2023 — — 550,000 4.37 4,069 — 554,069 4,053 3.96 558,122 4.37 2024 — 250,000 1,150,000 4.17 4,247 — 1,404,247 935 — 1,405,182 3.92 2025 — — 1,350,000 3.93 4,463 — 1,354,463 18,911 3.87 1,373,374 3.93 2026 — — 650,000 3.39 4,675 — 654,675 942 — 655,617 3.39 2027 — — — — 36,457 4.22 36,457 945 — 37,402 4.22 2028 — — — — 70,020 3.87 70,020 35,304 3.77 105,324 3.84 2029 — — 650,000 3.65 2,371 — 652,371 105 — 652,476 3.63 Thereafter — — 1,050,000 4.20 118,103 4.18 1,168,103 2,603 3.90 1,170,706 4.20 $ 93,000 $ 250,000 $ 5,700,000 $ 264,244 $ 6,307,244 $ 185,089 $ 6,492,333 Other Debt(5) — — — — 84,771 164,543 249,314 (Discounts), premium and debt costs, net — (1,058) (52,007) 12,663 (40,402) (871) (41,273) $ 93,000 $ 248,942 $ 5,647,993 $ 276,907 $ 6,351,613 $ 348,761 $ 6,700,374 Mortgage debt on assets held for sale(6) — — — 32,289 32,289 — 32,289 $ 93,000 $ 248,942 $ 5,647,993 $ 309,196 $ 6,383,902 $ 348,761 $ 6,732,663 Weighted average (7) (7) interest rate % 2.04 2.79 3.94 4.09 3.87 4.23 3.88 Weighted average (7) (7)(8) maturity in years — 4.4 6.9 12.5 6.9 3.9 6.9 (1) Includes $93 million of commercial paper borrowings at December 31, 2019. The Company has a $2.5 billion unsecured revolving line of credit facility, which matures on May 23, 2023 and contains two six-month extension options. It accrues annual interest at LIBOR plus 82.5 basis points and incurs an annual facility fee of 15 basis points, based on our current unsecured credit rating. (2) The Company has a $250 million term loan, which matures on May 23, 2024. It accrues annual interest at LIBOR plus 90 basis points, based on our current unsecured credit rating. (3) Rates are reported in the year in which the related debt matures. (4) Reflects pro rata share of mortgage and other debt in our unconsolidated JVs. (5) Represents non-interest bearing Entrance Fee deposits at certain of our senior housing facilities and demand notes that have no scheduled maturities. (6) Represents mortgage debt of $32.3 million that matures in 2026, 2028 and 2044 on assets held for sale. (7) Excludes the impact of mortgage debt held for sale. (8) If the commercial paper were refinanced using the bank line of credit, the weighted average maturity of our Enterprise Debt would have been 7.0 years. 20 Return to TOC
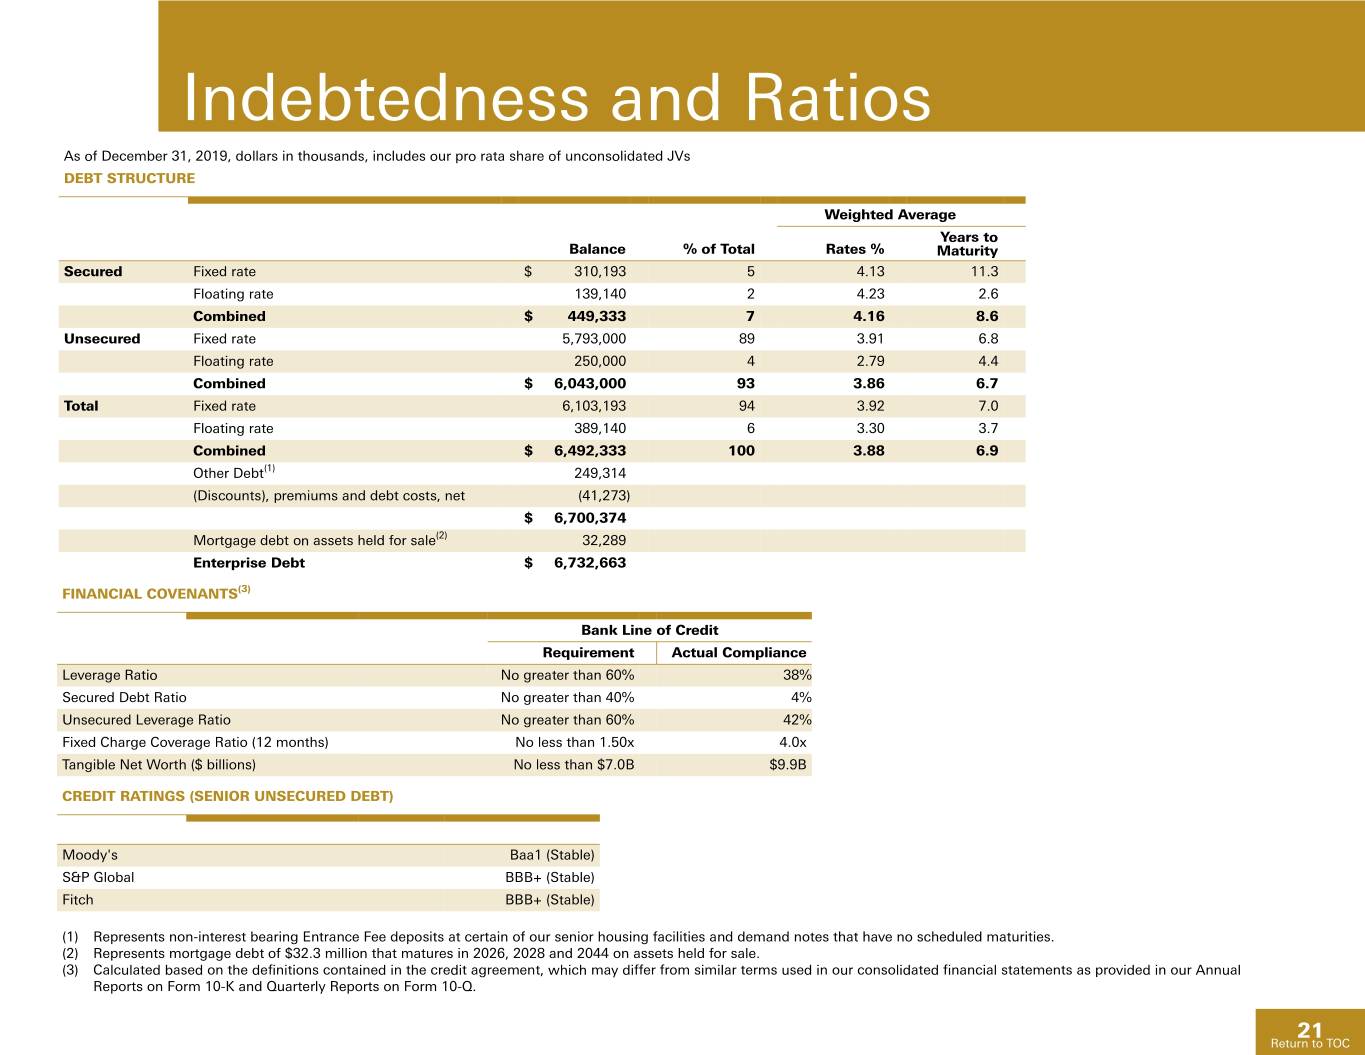
Indebtedness and Ratios As of December 31, 2019, dollars in thousands, includes our pro rata share of unconsolidated JVs DEBT STRUCTURE Weighted Average Years to Balance % of Total Rates % Maturity Secured Fixed rate $ 310,193 5 4.13 11.3 Floating rate 139,140 2 4.23 2.6 Combined $ 449,333 7 4.16 8.6 Unsecured Fixed rate 5,793,000 89 3.91 6.8 Floating rate 250,000 4 2.79 4.4 Combined $ 6,043,000 93 3.86 6.7 Total Fixed rate 6,103,193 94 3.92 7.0 Floating rate 389,140 6 3.30 3.7 Combined $ 6,492,333 100 3.88 6.9 Other Debt(1) 249,314 (Discounts), premiums and debt costs, net (41,273) $ 6,700,374 Mortgage debt on assets held for sale(2) 32,289 Enterprise Debt $ 6,732,663 FINANCIAL COVENANTS(3) Bank Line of Credit Requirement Actual Compliance Leverage Ratio No greater than 60% 38% Secured Debt Ratio No greater than 40% 4% Unsecured Leverage Ratio No greater than 60% 42% Fixed Charge Coverage Ratio (12 months) No less than 1.50x 4.0x Tangible Net Worth ($ billions) No less than $7.0B $9.9B CREDIT RATINGS (SENIOR UNSECURED DEBT) Moody's Baa1 (Stable) S&P Global BBB+ (Stable) Fitch BBB+ (Stable) (1) Represents non-interest bearing Entrance Fee deposits at certain of our senior housing facilities and demand notes that have no scheduled maturities. (2) Represents mortgage debt of $32.3 million that matures in 2026, 2028 and 2044 on assets held for sale. (3) Calculated based on the definitions contained in the credit agreement, which may differ from similar terms used in our consolidated financial statements as provided in our Annual Reports on Form 10-K and Quarterly Reports on Form 10-Q. 21 Return to TOC
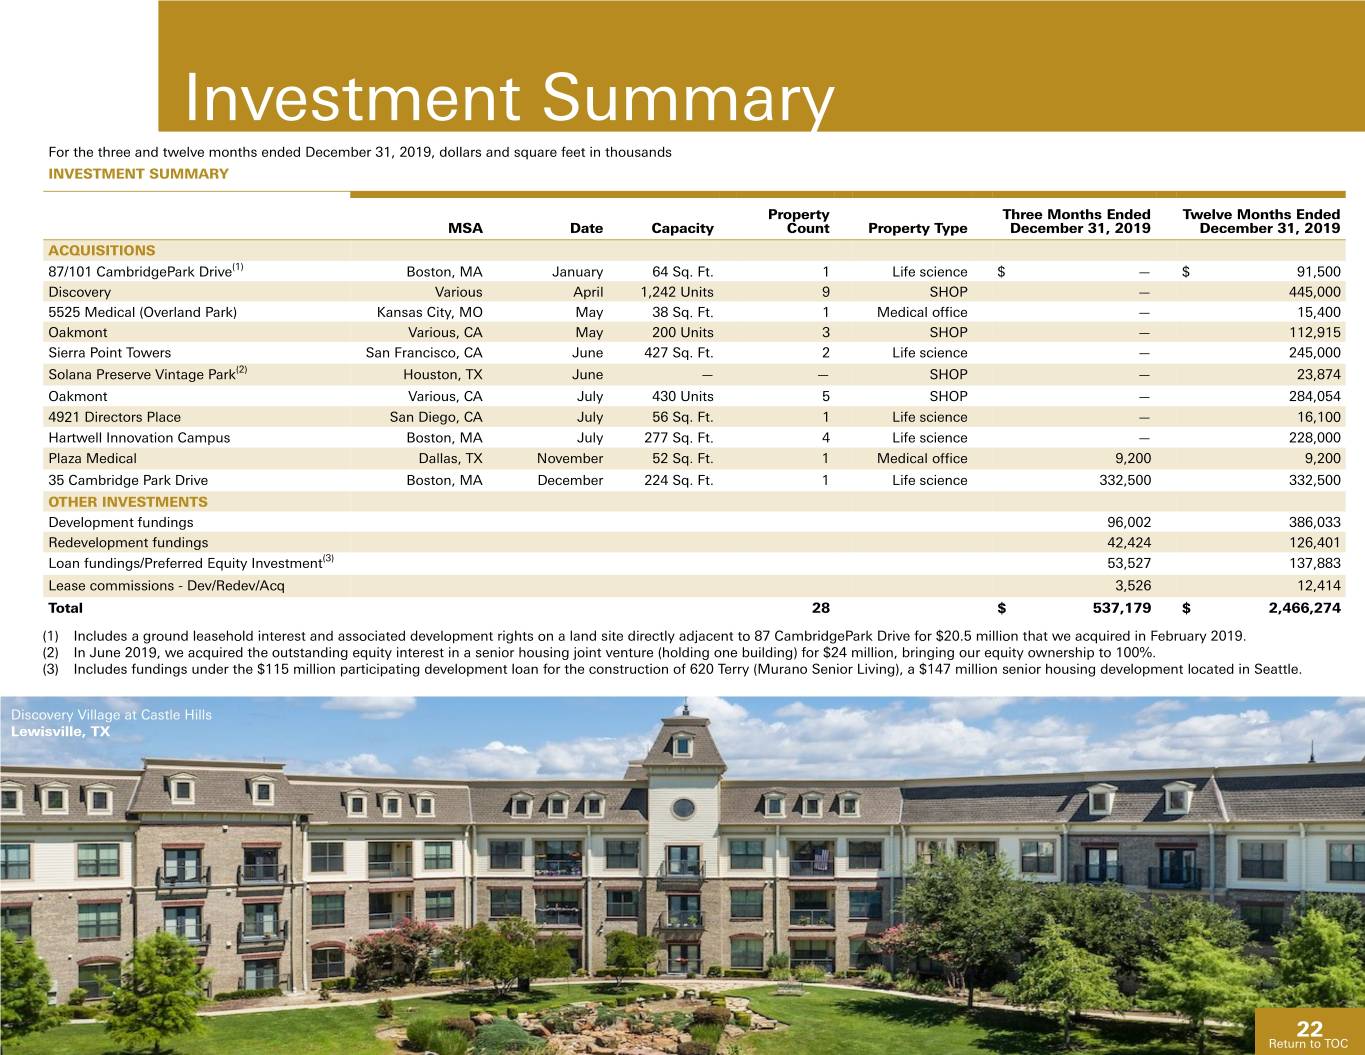
Investment Summary For the three and twelve months ended December 31, 2019, dollars and square feet in thousands INVESTMENT SUMMARY Property Three Months Ended Twelve Months Ended MSA Date Capacity Count Property Type December 31, 2019 December 31, 2019 ACQUISITIONS 87/101 CambridgePark Drive(1) Boston, MA January 64 Sq. Ft. 1 Life science $ — $ 91,500 Discovery Various April 1,242 Units 9 SHOP — 445,000 5525 Medical (Overland Park) Kansas City, MO May 38 Sq. Ft. 1 Medical office — 15,400 Oakmont Various, CA May 200 Units 3 SHOP — 112,915 Sierra Point Towers San Francisco, CA June 427 Sq. Ft. 2 Life science — 245,000 Solana Preserve Vintage Park(2) Houston, TX June — — SHOP — 23,874 Oakmont Various, CA July 430 Units 5 SHOP — 284,054 4921 Directors Place San Diego, CA July 56 Sq. Ft. 1 Life science — 16,100 Hartwell Innovation Campus Boston, MA July 277 Sq. Ft. 4 Life science — 228,000 Plaza Medical Dallas, TX November 52 Sq. Ft. 1 Medical office 9,200 9,200 35 Cambridge Park Drive Boston, MA December 224 Sq. Ft. 1 Life science 332,500 332,500 OTHER INVESTMENTS Development fundings 96,002 386,033 Redevelopment fundings 42,424 126,401 Loan fundings/Preferred Equity Investment(3) 53,527 137,883 Lease commissions - Dev/Redev/Acq 3,526 12,414 Total 28 $ 537,179 $ 2,466,274 (1) Includes a ground leasehold interest and associated development rights on a land site directly adjacent to 87 CambridgePark Drive for $20.5 million that we acquired in February 2019. (2) In June 2019, we acquired the outstanding equity interest in a senior housing joint venture (holding one building) for $24 million, bringing our equity ownership to 100%. (3) Includes fundings under the $115 million participating development loan for the construction of 620 Terry (Murano Senior Living), a $147 million senior housing development located in Seattle. Discovery Village at Castle Hills Lewisville, TX 22 ReturnReturn toto TOCTOC
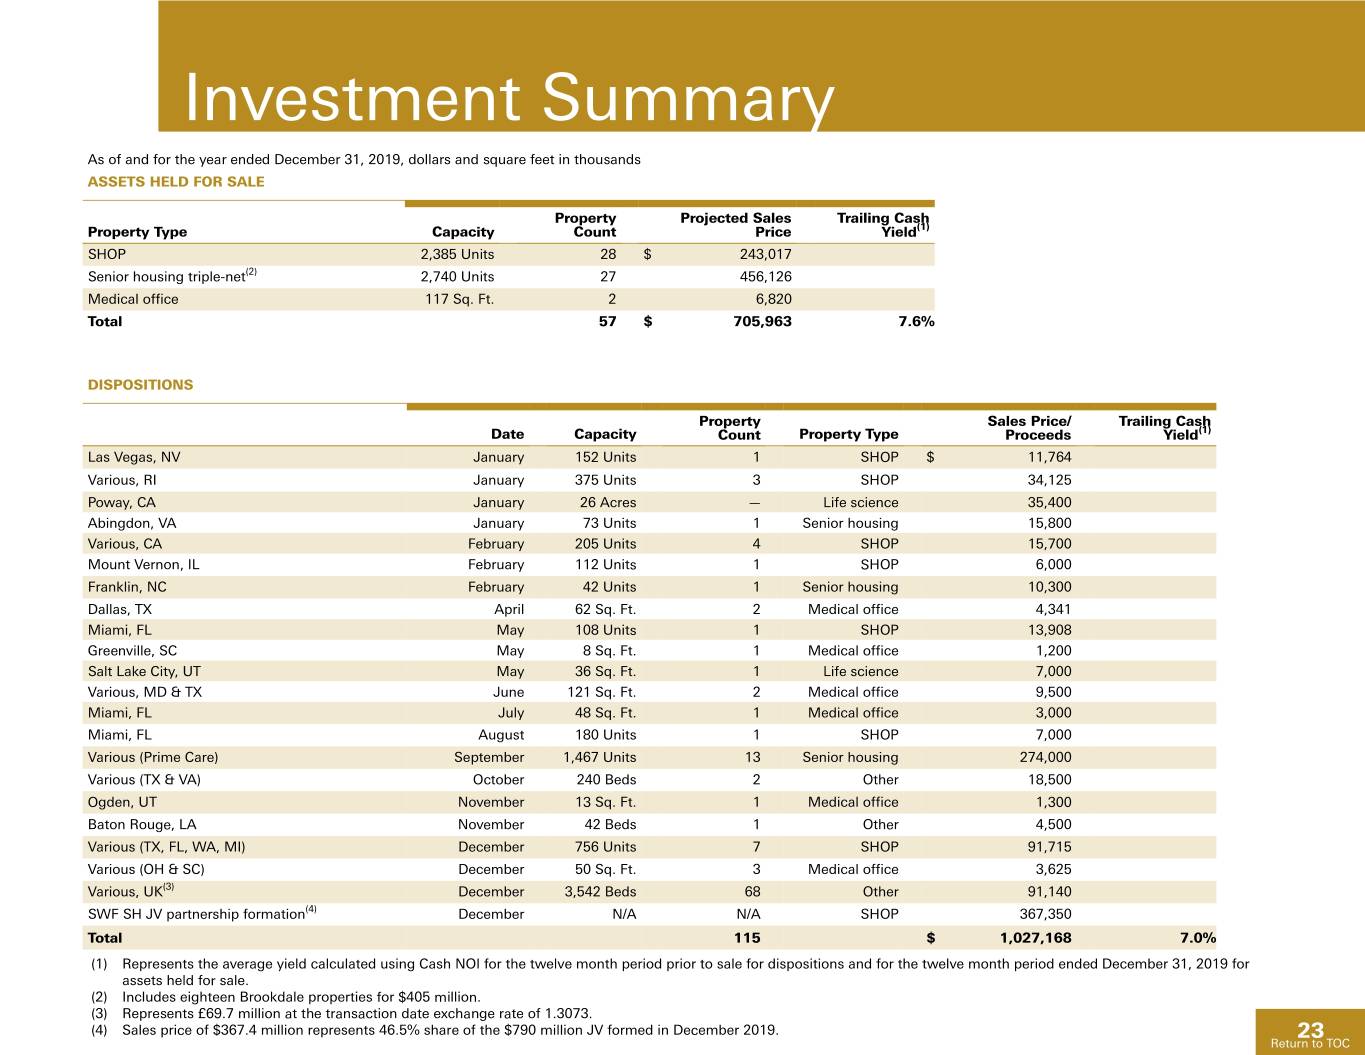
Investment Summary As of and for the year ended December 31, 2019, dollars and square feet in thousands ASSETS HELD FOR SALE Property Projected Sales Trailing Cash Property Type Capacity Count Price Yield(1) SHOP 2,385 Units 28 $ 243,017 Senior housing triple-net(2) 2,740 Units 27 456,126 Medical office 117 Sq. Ft. 2 6,820 Total 57 $ 705,963 7.6% DISPOSITIONS Property Sales Price/ Trailing Cash Date Capacity Count Property Type Proceeds Yield(1) Las Vegas, NV January 152 Units 1 SHOP $ 11,764 Various, RI January 375 Units 3 SHOP 34,125 Poway, CA January 26 Acres — Life science 35,400 Abingdon, VA January 73 Units 1 Senior housing 15,800 Various, CA February 205 Units 4 SHOP 15,700 Mount Vernon, IL February 112 Units 1 SHOP 6,000 Franklin, NC February 42 Units 1 Senior housing 10,300 Dallas, TX April 62 Sq. Ft. 2 Medical office 4,341 Miami, FL May 108 Units 1 SHOP 13,908 Greenville, SC May 8 Sq. Ft. 1 Medical office 1,200 Salt Lake City, UT May 36 Sq. Ft. 1 Life science 7,000 Various, MD & TX June 121 Sq. Ft. 2 Medical office 9,500 Miami, FL July 48 Sq. Ft. 1 Medical office 3,000 Miami, FL August 180 Units 1 SHOP 7,000 Various (Prime Care) September 1,467 Units 13 Senior housing 274,000 Various (TX & VA) October 240 Beds 2 Other 18,500 Ogden, UT November 13 Sq. Ft. 1 Medical office 1,300 Baton Rouge, LA November 42 Beds 1 Other 4,500 Various (TX, FL, WA, MI) December 756 Units 7 SHOP 91,715 Various (OH & SC) December 50 Sq. Ft. 3 Medical office 3,625 Various, UK(3) December 3,542 Beds 68 Other 91,140 SWF SH JV partnership formation(4) December N/A N/A SHOP 367,350 Total 115 $ 1,027,168 7.0% (1) Represents the average yield calculated using Cash NOI for the twelve month period prior to sale for dispositions and for the twelve month period ended December 31, 2019 for assets held for sale. (2) Includes eighteen Brookdale properties for $405 million. (3) Represents £69.7 million at the transaction date exchange rate of 1.3073. (4) Sales price of $367.4 million represents 46.5% share of the $790 million JV formed in December 2019. 23 Return to TOC
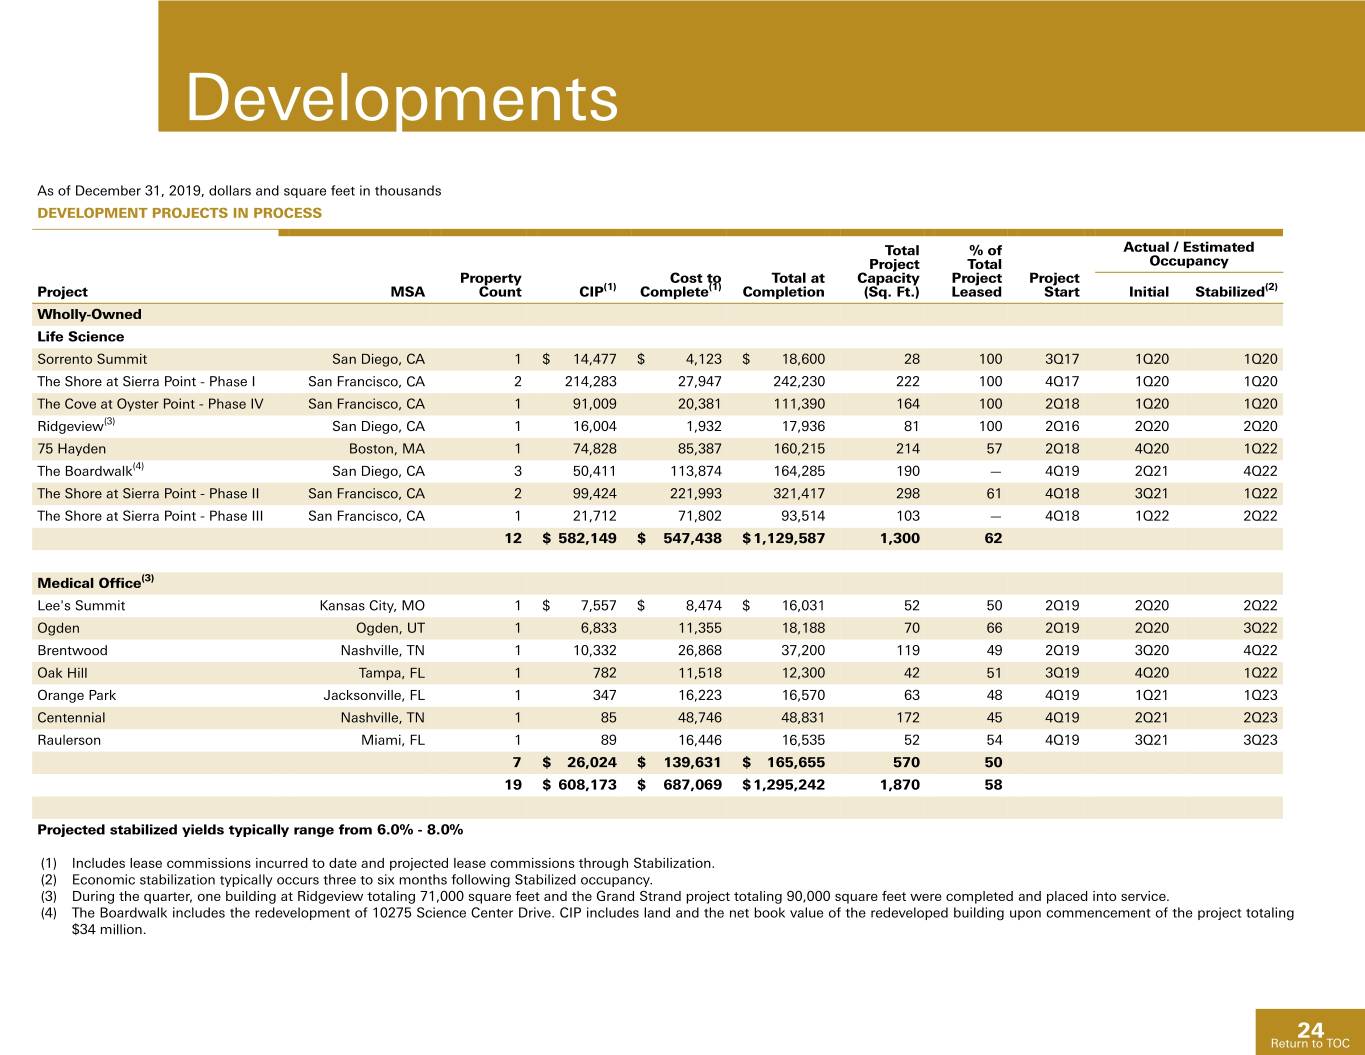
Developments As of December 31, 2019, dollars and square feet in thousands DEVELOPMENT PROJECTS IN PROCESS Total % of Actual / Estimated Project Total Occupancy Property Cost to Total at Capacity Project Project Project MSA Count CIP(1) Complete(1) Completion (Sq. Ft.) Leased Start Initial Stabilized(2) Wholly-Owned Life Science Sorrento Summit San Diego, CA 1 $ 14,477 $ 4,123 $ 18,600 28 100 3Q17 1Q20 1Q20 The Shore at Sierra Point - Phase I San Francisco, CA 2 214,283 27,947 242,230 222 100 4Q17 1Q20 1Q20 The Cove at Oyster Point - Phase IV San Francisco, CA 1 91,009 20,381 111,390 164 100 2Q18 1Q20 1Q20 Ridgeview(3) San Diego, CA 1 16,004 1,932 17,936 81 100 2Q16 2Q20 2Q20 75 Hayden Boston, MA 1 74,828 85,387 160,215 214 57 2Q18 4Q20 1Q22 The Boardwalk(4) San Diego, CA 3 50,411 113,874 164,285 190 — 4Q19 2Q21 4Q22 The Shore at Sierra Point - Phase II San Francisco, CA 2 99,424 221,993 321,417 298 61 4Q18 3Q21 1Q22 The Shore at Sierra Point - Phase III San Francisco, CA 1 21,712 71,802 93,514 103 — 4Q18 1Q22 2Q22 12 $ 582,149 $ 547,438 $ 1,129,587 1,300 62 Medical Office(3) Lee's Summit Kansas City, MO 1 $ 7,557 $ 8,474 $ 16,031 52 50 2Q19 2Q20 2Q22 Ogden Ogden, UT 1 6,833 11,355 18,188 70 66 2Q19 2Q20 3Q22 Brentwood Nashville, TN 1 10,332 26,868 37,200 119 49 2Q19 3Q20 4Q22 Oak Hill Tampa, FL 1 782 11,518 12,300 42 51 3Q19 4Q20 1Q22 Orange Park Jacksonville, FL 1 347 16,223 16,570 63 48 4Q19 1Q21 1Q23 Centennial Nashville, TN 1 85 48,746 48,831 172 45 4Q19 2Q21 2Q23 Raulerson Miami, FL 1 89 16,446 16,535 52 54 4Q19 3Q21 3Q23 7 $ 26,024 $ 139,631 $ 165,655 570 50 19 $ 608,173 $ 687,069 $ 1,295,242 1,870 58 Projected stabilized yields typically range from 6.0% - 8.0% (1) Includes lease commissions incurred to date and projected lease commissions through Stabilization. (2) Economic stabilization typically occurs three to six months following Stabilized occupancy. (3) During the quarter, one building at Ridgeview totaling 71,000 square feet and the Grand Strand project totaling 90,000 square feet were completed and placed into service. (4) The Boardwalk includes the redevelopment of 10275 Science Center Drive. CIP includes land and the net book value of the redeveloped building upon commencement of the project totaling $34 million. 24 Return to TOC
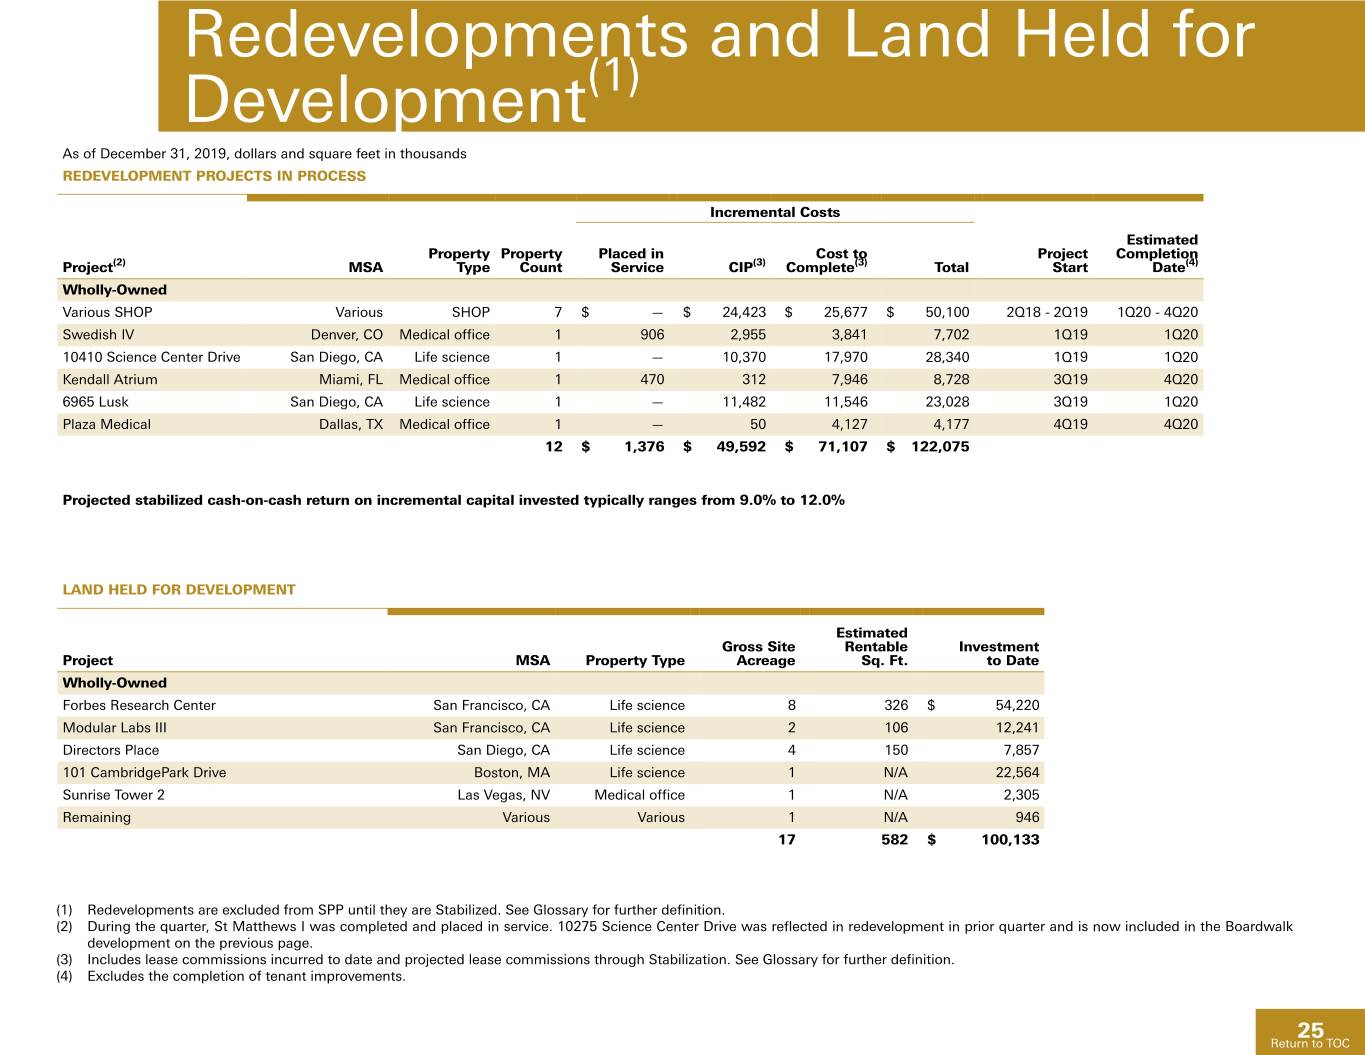
Redevelopments and Land Held for Development(1) As of December 31, 2019, dollars and square feet in thousands REDEVELOPMENT PROJECTS IN PROCESS Incremental Costs Estimated Property Property Placed in Cost to Project Completion Project(2) MSA Type Count Service CIP(3) Complete(3) Total Start Date(4) Wholly-Owned Various SHOP Various SHOP 7 $ — $ 24,423 $ 25,677 $ 50,100 2Q18 - 2Q19 1Q20 - 4Q20 Swedish IV Denver, CO Medical office 1 906 2,955 3,841 7,702 1Q19 1Q20 10410 Science Center Drive San Diego, CA Life science 1 — 10,370 17,970 28,340 1Q19 1Q20 Kendall Atrium Miami, FL Medical office 1 470 312 7,946 8,728 3Q19 4Q20 6965 Lusk San Diego, CA Life science 1 — 11,482 11,546 23,028 3Q19 1Q20 Plaza Medical Dallas, TX Medical office 1 — 50 4,127 4,177 4Q19 4Q20 12 $ 1,376 $ 49,592 $ 71,107 $ 122,075 Projected stabilized cash-on-cash return on incremental capital invested typically ranges from 9.0% to 12.0% LAND HELD FOR DEVELOPMENT Estimated Gross Site Rentable Investment Project MSA Property Type Acreage Sq. Ft. to Date Wholly-Owned Forbes Research Center San Francisco, CA Life science 8 326 $ 54,220 Modular Labs III San Francisco, CA Life science 2 106 12,241 Directors Place San Diego, CA Life science 4 150 7,857 101 CambridgePark Drive Boston, MA Life science 1 N/A 22,564 Sunrise Tower 2 Las Vegas, NV Medical office 1 N/A 2,305 Remaining Various Various 1 N/A 946 17 582 $ 100,133 (1) Redevelopments are excluded from SPP until they are Stabilized. See Glossary for further definition. (2) During the quarter, St Matthews I was completed and placed in service. 10275 Science Center Drive was reflected in redevelopment in prior quarter and is now included in the Boardwalk development on the previous page. (3) Includes lease commissions incurred to date and projected lease commissions through Stabilization. See Glossary for further definition. (4) Excludes the completion of tenant improvements. 25 Return to TOC
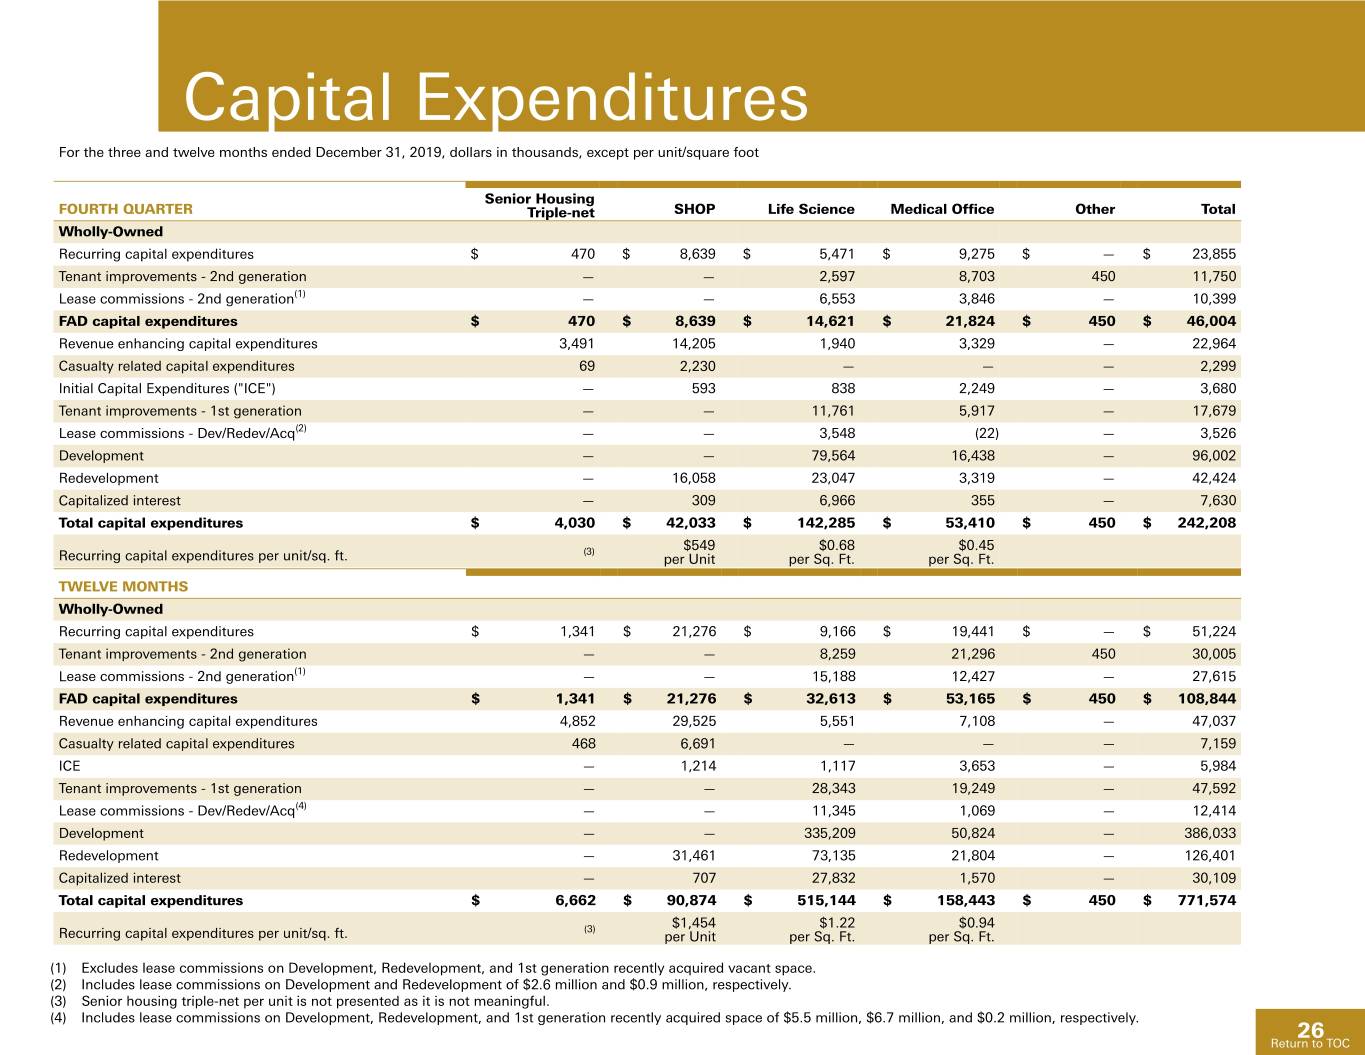
Capital Expenditures For the three and twelve months ended December 31, 2019, dollars in thousands, except per unit/square foot Senior Housing FOURTH QUARTER Triple-net SHOP Life Science Medical Office Other Total Wholly-Owned Recurring capital expenditures $ 470 $ 8,639 $ 5,471 $ 9,275 $ — $ 23,855 Tenant improvements - 2nd generation — — 2,597 8,703 450 11,750 Lease commissions - 2nd generation(1) — — 6,553 3,846 — 10,399 FAD capital expenditures $ 470 $ 8,639 $ 14,621 $ 21,824 $ 450 $ 46,004 Revenue enhancing capital expenditures 3,491 14,205 1,940 3,329 — 22,964 Casualty related capital expenditures 69 2,230 — — — 2,299 Initial Capital Expenditures ("ICE") — 593 838 2,249 — 3,680 Tenant improvements - 1st generation — — 11,761 5,917 — 17,679 Lease commissions - Dev/Redev/Acq(2) — — 3,548 (22) — 3,526 Development — — 79,564 16,438 — 96,002 Redevelopment — 16,058 23,047 3,319 — 42,424 Capitalized interest — 309 6,966 355 — 7,630 Total capital expenditures $ 4,030 $ 42,033 $ 142,285 $ 53,410 $ 450 $ 242,208 (3) $549 $0.68 $0.45 Recurring capital expenditures per unit/sq. ft. per Unit per Sq. Ft. per Sq. Ft. TWELVE MONTHS Wholly-Owned Recurring capital expenditures $ 1,341 $ 21,276 $ 9,166 $ 19,441 $ — $ 51,224 Tenant improvements - 2nd generation — — 8,259 21,296 450 30,005 Lease commissions - 2nd generation(1) — — 15,188 12,427 — 27,615 FAD capital expenditures $ 1,341 $ 21,276 $ 32,613 $ 53,165 $ 450 $ 108,844 Revenue enhancing capital expenditures 4,852 29,525 5,551 7,108 — 47,037 Casualty related capital expenditures 468 6,691 — — — 7,159 ICE — 1,214 1,117 3,653 — 5,984 Tenant improvements - 1st generation — — 28,343 19,249 — 47,592 Lease commissions - Dev/Redev/Acq(4) — — 11,345 1,069 — 12,414 Development — — 335,209 50,824 — 386,033 Redevelopment — 31,461 73,135 21,804 — 126,401 Capitalized interest — 707 27,832 1,570 — 30,109 Total capital expenditures $ 6,662 $ 90,874 $ 515,144 $ 158,443 $ 450 $ 771,574 (3) $1,454 $1.22 $0.94 Recurring capital expenditures per unit/sq. ft. per Unit per Sq. Ft. per Sq. Ft. (1) Excludes lease commissions on Development, Redevelopment, and 1st generation recently acquired vacant space. (2) Includes lease commissions on Development and Redevelopment of $2.6 million and $0.9 million, respectively. (3) Senior housing triple-net per unit is not presented as it is not meaningful. (4) Includes lease commissions on Development, Redevelopment, and 1st generation recently acquired space of $5.5 million, $6.7 million, and $0.2 million, respectively. 26 Return to TOC
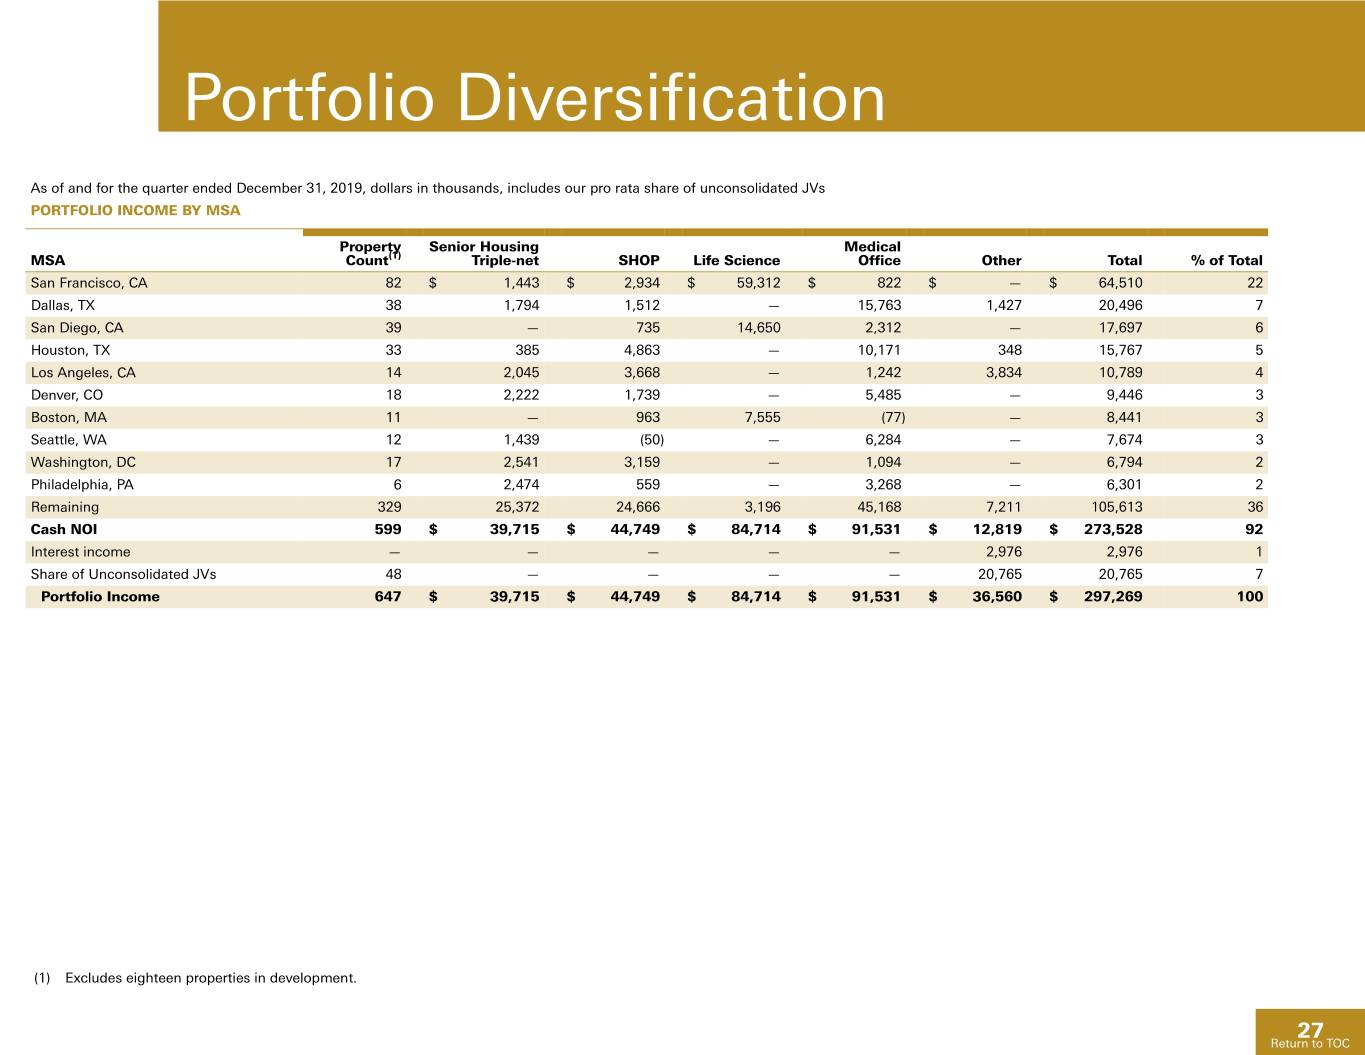
Portfolio Diversification As of and for the quarter ended December 31, 2019, dollars in thousands, includes our pro rata share of unconsolidated JVs PORTFOLIO INCOME BY MSA Property Senior Housing Medical MSA Count(1) Triple-net SHOP Life Science Office Other Total % of Total San Francisco, CA 82 $ 1,443 $ 2,934 $ 59,312 $ 822 $ — $ 64,510 22 Dallas, TX 38 1,794 1,512 — 15,763 1,427 20,496 7 San Diego, CA 39 — 735 14,650 2,312 — 17,697 6 Houston, TX 33 385 4,863 — 10,171 348 15,767 5 Los Angeles, CA 14 2,045 3,668 — 1,242 3,834 10,789 4 Denver, CO 18 2,222 1,739 — 5,485 — 9,446 3 Boston, MA 11 — 963 7,555 (77) — 8,441 3 Seattle, WA 12 1,439 (50) — 6,284 — 7,674 3 Washington, DC 17 2,541 3,159 — 1,094 — 6,794 2 Philadelphia, PA 6 2,474 559 — 3,268 — 6,301 2 Remaining 329 25,372 24,666 3,196 45,168 7,211 105,613 36 Cash NOI 599 $ 39,715 $ 44,749 $ 84,714 $ 91,531 $ 12,819 $ 273,528 92 Interest income — — — — — 2,976 2,976 1 Share of Unconsolidated JVs 48 — — — — 20,765 20,765 7 Portfolio Income 647 $ 39,715 $ 44,749 $ 84,714 $ 91,531 $ 36,560 $ 297,269 100 (1) Excludes eighteen properties in development. 27 Return to TOC
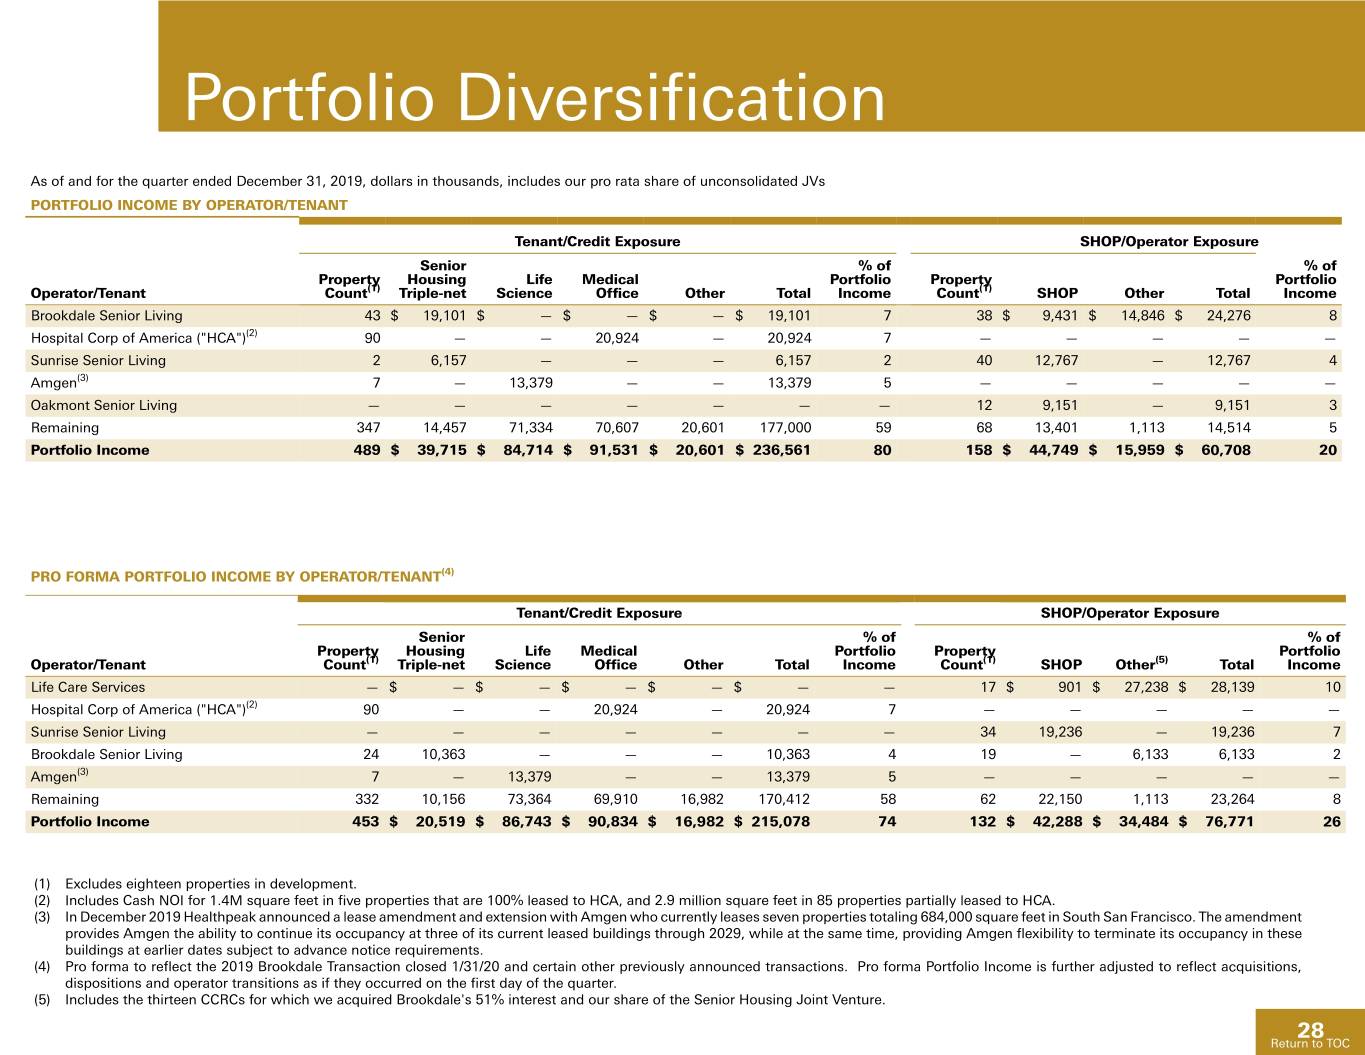
Portfolio Diversification As of and for the quarter ended December 31, 2019, dollars in thousands, includes our pro rata share of unconsolidated JVs PORTFOLIO INCOME BY OPERATOR/TENANT Tenant/Credit Exposure SHOP/Operator Exposure Senior % of % of Property Housing Life Medical Portfolio Property Portfolio Operator/Tenant Count(1) Triple-net Science Office Other Total Income Count(1) SHOP Other Total Income Brookdale Senior Living 43 $ 19,101 $ — $ — $ — $ 19,101 7 38 $ 9,431 $ 14,846 $ 24,276 8 Hospital Corp of America ("HCA")(2) 90 — — 20,924 — 20,924 7 — — — — — Sunrise Senior Living 2 6,157 — — — 6,157 2 40 12,767 — 12,767 4 Amgen(3) 7 — 13,379 — — 13,379 5 — — — — — Oakmont Senior Living — — — — — — — 12 9,151 — 9,151 3 Remaining 347 14,457 71,334 70,607 20,601 177,000 59 68 13,401 1,113 14,514 5 Portfolio Income 489 $ 39,715 $ 84,714 $ 91,531 $ 20,601 $ 236,561 80 158 $ 44,749 $ 15,959 $ 60,708 20 PRO FORMA PORTFOLIO INCOME BY OPERATOR/TENANT(4) Tenant/Credit Exposure SHOP/Operator Exposure Senior % of % of Property Housing Life Medical Portfolio Property Portfolio Operator/Tenant Count(1) Triple-net Science Office Other Total Income Count(1) SHOP Other(5) Total Income Life Care Services — $ — $ — $ — $ — $ — — 17 $ 901 $ 27,238 $ 28,139 10 Hospital Corp of America ("HCA")(2) 90 — — 20,924 — 20,924 7 — — — — — Sunrise Senior Living — — — — — — — 34 19,236 — 19,236 7 Brookdale Senior Living 24 10,363 — — — 10,363 4 19 — 6,133 6,133 2 Amgen(3) 7 — 13,379 — — 13,379 5 — — — — — Remaining 332 10,156 73,364 69,910 16,982 170,412 58 62 22,150 1,113 23,264 8 Portfolio Income 453 $ 20,519 $ 86,743 $ 90,834 $ 16,982 $ 215,078 74 132 $ 42,288 $ 34,484 $ 76,771 26 (1) Excludes eighteen properties in development. (2) Includes Cash NOI for 1.4M square feet in five properties that are 100% leased to HCA, and 2.9 million square feet in 85 properties partially leased to HCA. (3) In December 2019 Healthpeak announced a lease amendment and extension with Amgen who currently leases seven properties totaling 684,000 square feet in South San Francisco. The amendment provides Amgen the ability to continue its occupancy at three of its current leased buildings through 2029, while at the same time, providing Amgen flexibility to terminate its occupancy in these buildings at earlier dates subject to advance notice requirements. (4) Pro forma to reflect the 2019 Brookdale Transaction closed 1/31/20 and certain other previously announced transactions. Pro forma Portfolio Income is further adjusted to reflect acquisitions, dispositions and operator transitions as if they occurred on the first day of the quarter. (5) Includes the thirteen CCRCs for which we acquired Brookdale's 51% interest and our share of the Senior Housing Joint Venture. 28 Return to TOC
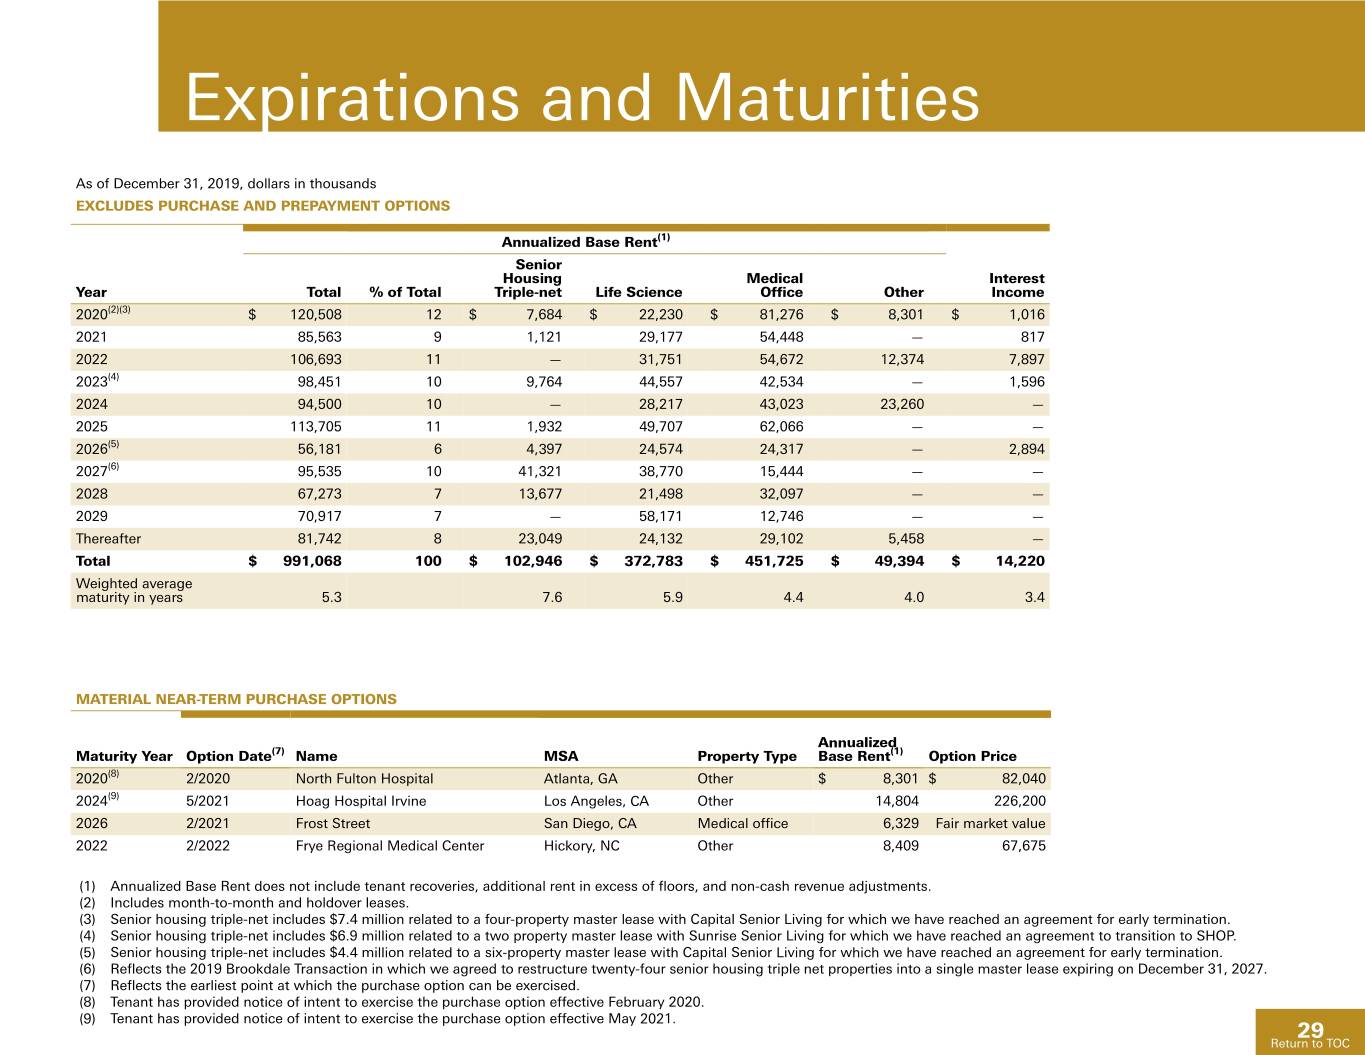
Expirations and Maturities As of December 31, 2019, dollars in thousands EXCLUDES PURCHASE AND PREPAYMENT OPTIONS Annualized Base Rent(1) Senior Housing Medical Interest Year Total % of Total Triple-net Life Science Office Other Income 2020(2)(3) $ 120,508 12 $ 7,684 $ 22,230 $ 81,276 $ 8,301 $ 1,016 2021 85,563 9 1,121 29,177 54,448 — 817 2022 106,693 11 — 31,751 54,672 12,374 7,897 2023(4) 98,451 10 9,764 44,557 42,534 — 1,596 2024 94,500 10 — 28,217 43,023 23,260 — 2025 113,705 11 1,932 49,707 62,066 — — 2026(5) 56,181 6 4,397 24,574 24,317 — 2,894 2027(6) 95,535 10 41,321 38,770 15,444 — — 2028 67,273 7 13,677 21,498 32,097 — — 2029 70,917 7 — 58,171 12,746 — — Thereafter 81,742 8 23,049 24,132 29,102 5,458 — Total $ 991,068 100 $ 102,946 $ 372,783 $ 451,725 $ 49,394 $ 14,220 Weighted average maturity in years 5.3 7.6 5.9 4.4 4.0 3.4 MATERIAL NEAR-TERM PURCHASE OPTIONS Annualized Maturity Year Option Date(7) Name MSA Property Type Base Rent(1) Option Price 2020(8) 2/2020 North Fulton Hospital Atlanta, GA Other $ 8,301 $ 82,040 2024(9) 5/2021 Hoag Hospital Irvine Los Angeles, CA Other 14,804 226,200 2026 2/2021 Frost Street San Diego, CA Medical office 6,329 Fair market value 2022 2/2022 Frye Regional Medical Center Hickory, NC Other 8,409 67,675 (1) Annualized Base Rent does not include tenant recoveries, additional rent in excess of floors, and non-cash revenue adjustments. (2) Includes month-to-month and holdover leases. (3) Senior housing triple-net includes $7.4 million related to a four-property master lease with Capital Senior Living for which we have reached an agreement for early termination. (4) Senior housing triple-net includes $6.9 million related to a two property master lease with Sunrise Senior Living for which we have reached an agreement to transition to SHOP. (5) Senior housing triple-net includes $4.4 million related to a six-property master lease with Capital Senior Living for which we have reached an agreement for early termination. (6) Reflects the 2019 Brookdale Transaction in which we agreed to restructure twenty-four senior housing triple net properties into a single master lease expiring on December 31, 2027. (7) Reflects the earliest point at which the purchase option can be exercised. (8) Tenant has provided notice of intent to exercise the purchase option effective February 2020. (9) Tenant has provided notice of intent to exercise the purchase option effective May 2021. 29 Return to TOC
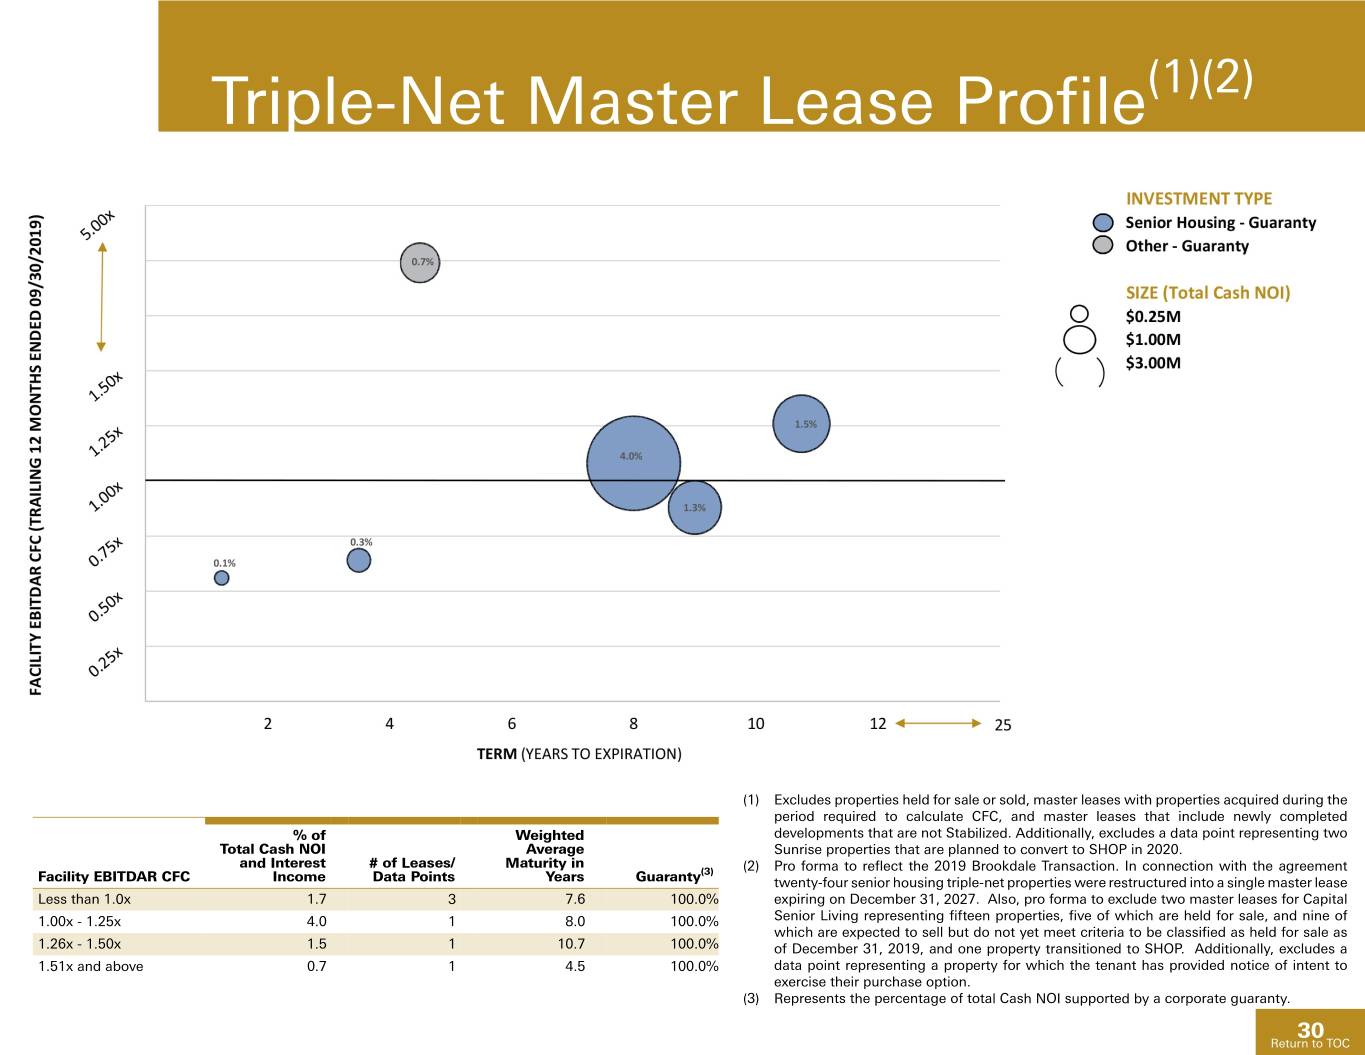
Triple-Net Master Lease Profile(1)(2) (1) Excludes properties held for sale or sold, master leases with properties acquired during the period required to calculate CFC, and master leases that include newly completed % of Weighted developments that are not Stabilized. Additionally, excludes a data point representing two Total Cash NOI Average Sunrise properties that are planned to convert to SHOP in 2020. and Interest # of Leases/ Maturity in (3) (2) Pro forma to reflect the 2019 Brookdale Transaction. In connection with the agreement Facility EBITDAR CFC Income Data Points Years Guaranty twenty-four senior housing triple-net properties were restructured into a single master lease Less than 1.0x 1.7 3 7.6 100.0% expiring on December 31, 2027. Also, pro forma to exclude two master leases for Capital 1.00x - 1.25x 4.0 1 8.0 100.0% Senior Living representing fifteen properties, five of which are held for sale, and nine of which are expected to sell but do not yet meet criteria to be classified as held for sale as 1.26x - 1.50x 1.5 1 10.7 100.0% of December 31, 2019, and one property transitioned to SHOP. Additionally, excludes a 1.51x and above 0.7 1 4.5 100.0% data point representing a property for which the tenant has provided notice of intent to exercise their purchase option. (3) Represents the percentage of total Cash NOI supported by a corporate guaranty. 30 Return to TOC
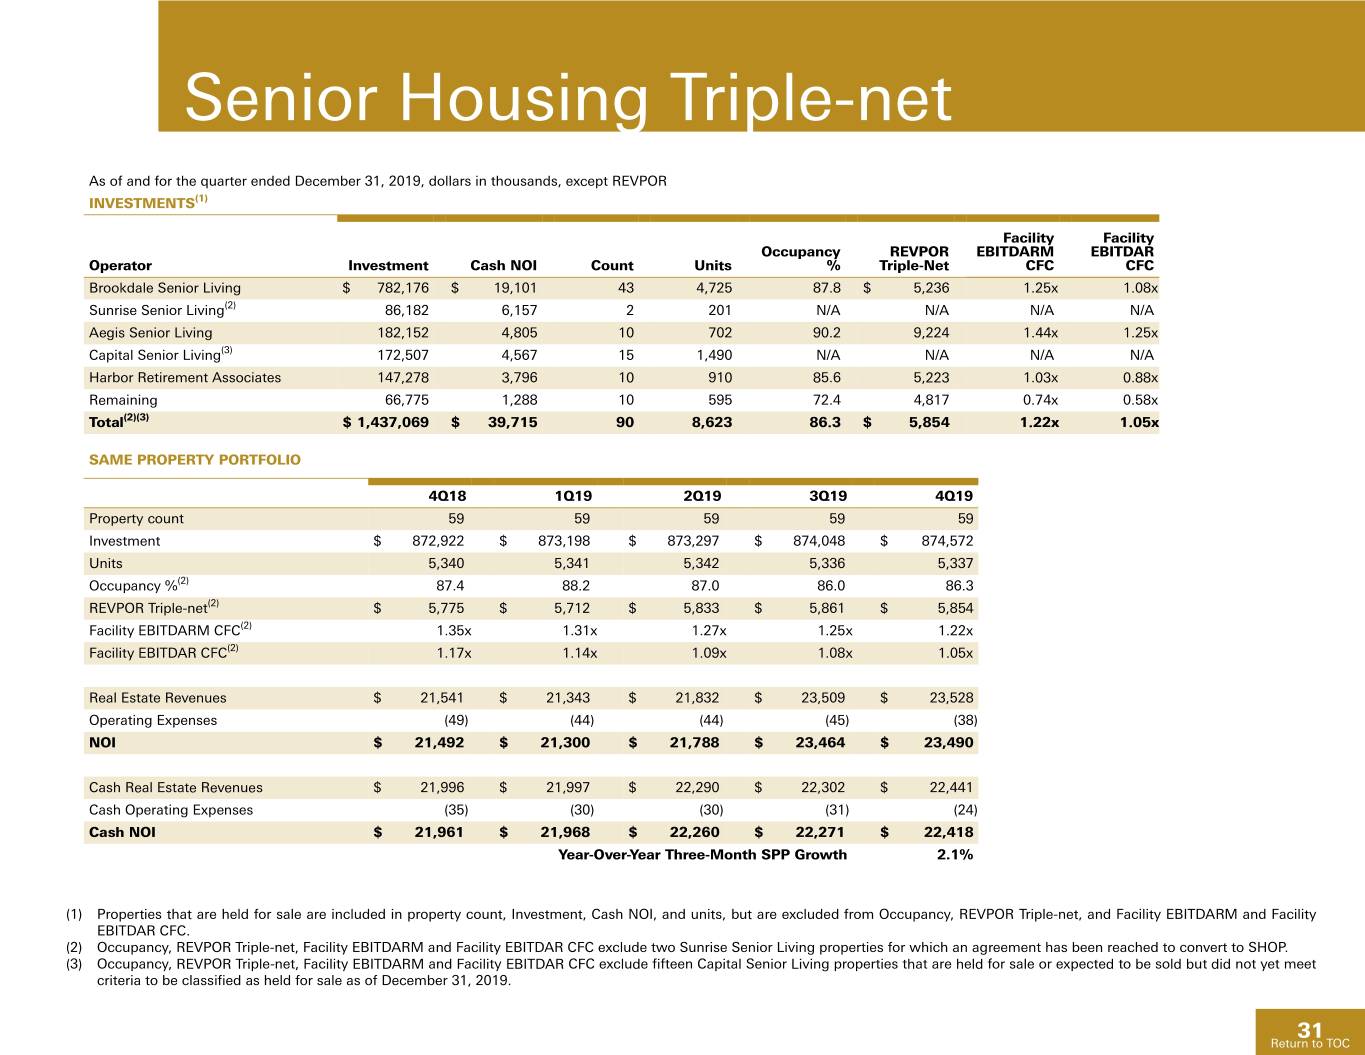
Senior Housing Triple-net As of and for the quarter ended December 31, 2019, dollars in thousands, except REVPOR INVESTMENTS(1) Facility Facility Occupancy REVPOR EBITDARM EBITDAR Operator Investment Cash NOI Count Units % Triple-Net CFC CFC Brookdale Senior Living $ 782,176 $ 19,101 43 4,725 87.8 $ 5,236 1.25x 1.08x Sunrise Senior Living(2) 86,182 6,157 2 201 N/A N/A N/A N/A Aegis Senior Living 182,152 4,805 10 702 90.2 9,224 1.44x 1.25x Capital Senior Living(3) 172,507 4,567 15 1,490 N/A N/A N/A N/A Harbor Retirement Associates 147,278 3,796 10 910 85.6 5,223 1.03x 0.88x Remaining 66,775 1,288 10 595 72.4 4,817 0.74x 0.58x Total(2)(3) $ 1,437,069 $ 39,715 90 8,623 86.3 $ 5,854 1.22x 1.05x SAME PROPERTY PORTFOLIO 4Q18 1Q19 2Q19 3Q19 4Q19 Property count 59 59 59 59 59 Investment $ 872,922 $ 873,198 $ 873,297 $ 874,048 $ 874,572 Units 5,340 5,341 5,342 5,336 5,337 Occupancy %(2) 87.4 88.2 87.0 86.0 86.3 REVPOR Triple-net(2) $ 5,775 $ 5,712 $ 5,833 $ 5,861 $ 5,854 Facility EBITDARM CFC(2) 1.35x 1.31x 1.27x 1.25x 1.22x Facility EBITDAR CFC(2) 1.17x 1.14x 1.09x 1.08x 1.05x Real Estate Revenues $ 21,541 $ 21,343 $ 21,832 $ 23,509 $ 23,528 Operating Expenses (49) (44) (44) (45) (38) NOI $ 21,492 $ 21,300 $ 21,788 $ 23,464 $ 23,490 Cash Real Estate Revenues $ 21,996 $ 21,997 $ 22,290 $ 22,302 $ 22,441 Cash Operating Expenses (35) (30) (30) (31) (24) Cash NOI $ 21,961 $ 21,968 $ 22,260 $ 22,271 $ 22,418 Year-Over-Year Three-Month SPP Growth 2.1% (1) Properties that are held for sale are included in property count, Investment, Cash NOI, and units, but are excluded from Occupancy, REVPOR Triple-net, and Facility EBITDARM and Facility EBITDAR CFC. (2) Occupancy, REVPOR Triple-net, Facility EBITDARM and Facility EBITDAR CFC exclude two Sunrise Senior Living properties for which an agreement has been reached to convert to SHOP. (3) Occupancy, REVPOR Triple-net, Facility EBITDARM and Facility EBITDAR CFC exclude fifteen Capital Senior Living properties that are held for sale or expected to be sold but did not yet meet criteria to be classified as held for sale as of December 31, 2019. 31 Return to TOC
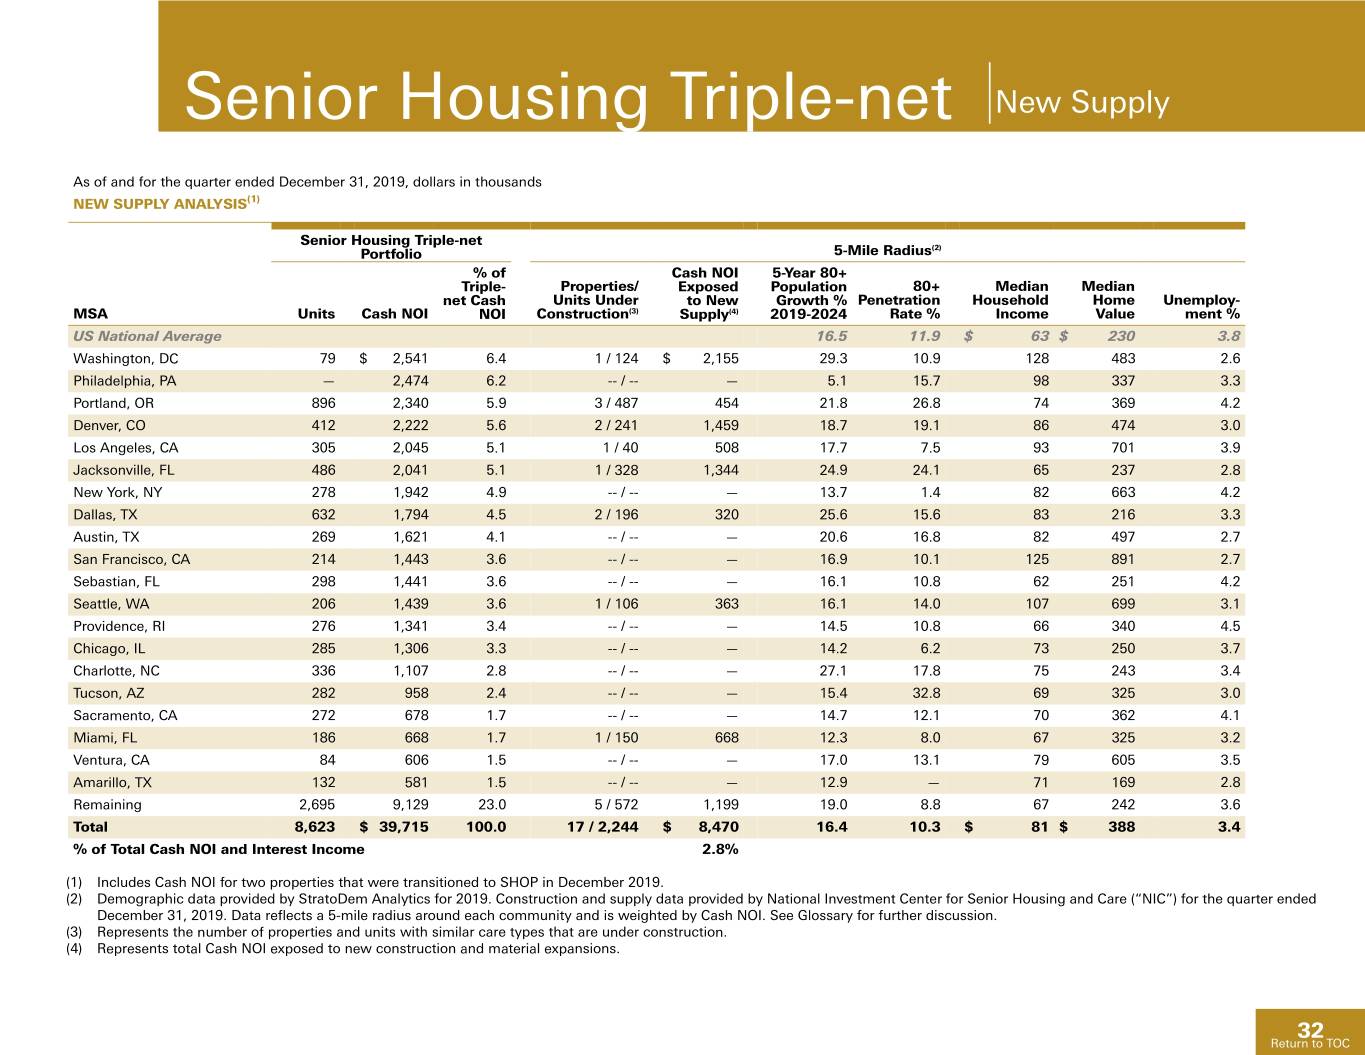
Senior Housing Triple-net New Supply As of and for the quarter ended December 31, 2019, dollars in thousands NEW SUPPLY ANALYSIS(1) Senior Housing Triple-net (2) Portfolio 5-Mile Radius % of Cash NOI 5-Year 80+ Triple- Properties/ Exposed Population 80+ Median Median net Cash Units Under to New Growth % Penetration Household Home Unemploy- MSA Units Cash NOI NOI Construction(3) Supply(4) 2019-2024 Rate % Income Value ment % US National Average 16.5 11.9 $ 63 $ 230 3.8 Washington, DC 79 $ 2,541 6.4 1 / 124 $ 2,155 29.3 10.9 128 483 2.6 Philadelphia, PA — 2,474 6.2 -- / -- — 5.1 15.7 98 337 3.3 Portland, OR 896 2,340 5.9 3 / 487 454 21.8 26.8 74 369 4.2 Denver, CO 412 2,222 5.6 2 / 241 1,459 18.7 19.1 86 474 3.0 Los Angeles, CA 305 2,045 5.1 1 / 40 508 17.7 7.5 93 701 3.9 Jacksonville, FL 486 2,041 5.1 1 / 328 1,344 24.9 24.1 65 237 2.8 New York, NY 278 1,942 4.9 -- / -- — 13.7 1.4 82 663 4.2 Dallas, TX 632 1,794 4.5 2 / 196 320 25.6 15.6 83 216 3.3 Austin, TX 269 1,621 4.1 -- / -- — 20.6 16.8 82 497 2.7 San Francisco, CA 214 1,443 3.6 -- / -- — 16.9 10.1 125 891 2.7 Sebastian, FL 298 1,441 3.6 -- / -- — 16.1 10.8 62 251 4.2 Seattle, WA 206 1,439 3.6 1 / 106 363 16.1 14.0 107 699 3.1 Providence, RI 276 1,341 3.4 -- / -- — 14.5 10.8 66 340 4.5 Chicago, IL 285 1,306 3.3 -- / -- — 14.2 6.2 73 250 3.7 Charlotte, NC 336 1,107 2.8 -- / -- — 27.1 17.8 75 243 3.4 Tucson, AZ 282 958 2.4 -- / -- — 15.4 32.8 69 325 3.0 Sacramento, CA 272 678 1.7 -- / -- — 14.7 12.1 70 362 4.1 Miami, FL 186 668 1.7 1 / 150 668 12.3 8.0 67 325 3.2 Ventura, CA 84 606 1.5 -- / -- — 17.0 13.1 79 605 3.5 Amarillo, TX 132 581 1.5 -- / -- — 12.9 — 71 169 2.8 Remaining 2,695 9,129 23.0 5 / 572 1,199 19.0 8.8 67 242 3.6 Total 8,623 $ 39,715 100.0 17 / 2,244 $ 8,470 16.4 10.3 $ 81 $ 388 3.4 % of Total Cash NOI and Interest Income 2.8% (1) Includes Cash NOI for two properties that were transitioned to SHOP in December 2019. (2) Demographic data provided by StratoDem Analytics for 2019. Construction and supply data provided by National Investment Center for Senior Housing and Care (“NIC”) for the quarter ended December 31, 2019. Data reflects a 5-mile radius around each community and is weighted by Cash NOI. See Glossary for further discussion. (3) Represents the number of properties and units with similar care types that are under construction. (4) Represents total Cash NOI exposed to new construction and material expansions. 32 Return to TOC
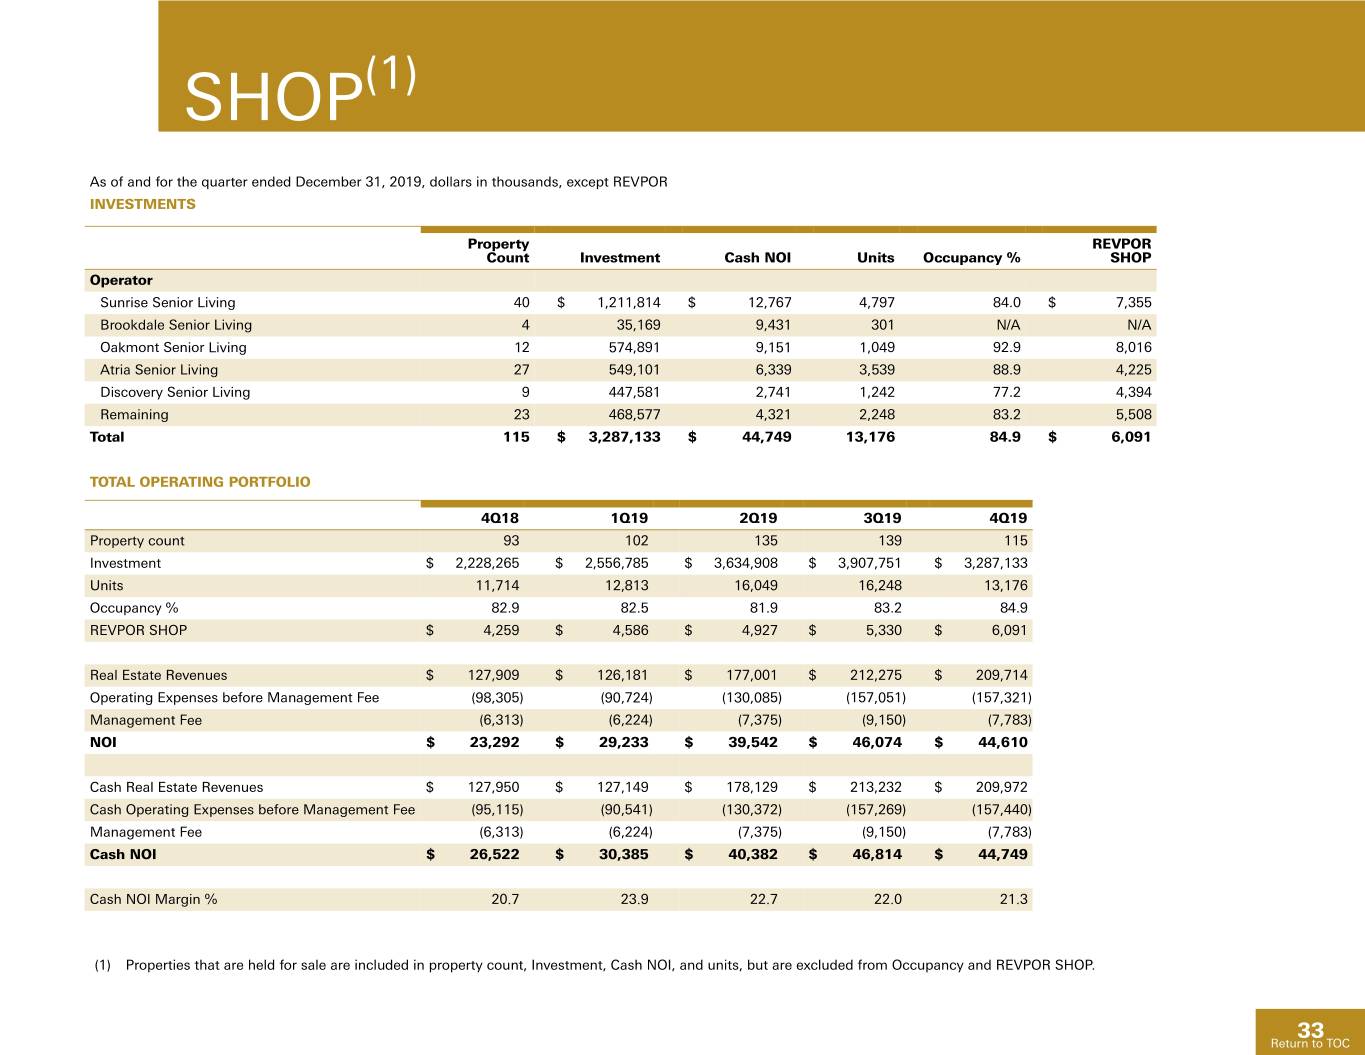
SHOP(1) As of and for the quarter ended December 31, 2019, dollars in thousands, except REVPOR INVESTMENTS Property REVPOR Count Investment Cash NOI Units Occupancy % SHOP Operator Sunrise Senior Living 40 $ 1,211,814 $ 12,767 4,797 84.0 $ 7,355 Brookdale Senior Living 4 35,169 9,431 301 N/A N/A Oakmont Senior Living 12 574,891 9,151 1,049 92.9 8,016 Atria Senior Living 27 549,101 6,339 3,539 88.9 4,225 Discovery Senior Living 9 447,581 2,741 1,242 77.2 4,394 Remaining 23 468,577 4,321 2,248 83.2 5,508 Total 115 $ 3,287,133 $ 44,749 13,176 84.9 $ 6,091 TOTAL OPERATING PORTFOLIO 4Q18 1Q19 2Q19 3Q19 4Q19 Property count 93 102 135 139 115 Investment $ 2,228,265 $ 2,556,785 $ 3,634,908 $ 3,907,751 $ 3,287,133 Units 11,714 12,813 16,049 16,248 13,176 Occupancy % 82.9 82.5 81.9 83.2 84.9 REVPOR SHOP $ 4,259 $ 4,586 $ 4,927 $ 5,330 $ 6,091 Real Estate Revenues $ 127,909 $ 126,181 $ 177,001 $ 212,275 $ 209,714 Operating Expenses before Management Fee (98,305) (90,724) (130,085) (157,051) (157,321) Management Fee (6,313) (6,224) (7,375) (9,150) (7,783) NOI $ 23,292 $ 29,233 $ 39,542 $ 46,074 $ 44,610 Cash Real Estate Revenues $ 127,950 $ 127,149 $ 178,129 $ 213,232 $ 209,972 Cash Operating Expenses before Management Fee (95,115) (90,541) (130,372) (157,269) (157,440) Management Fee (6,313) (6,224) (7,375) (9,150) (7,783) Cash NOI $ 26,522 $ 30,385 $ 40,382 $ 46,814 $ 44,749 Cash NOI Margin % 20.7 23.9 22.7 22.0 21.3 (1) Properties that are held for sale are included in property count, Investment, Cash NOI, and units, but are excluded from Occupancy and REVPOR SHOP. 33 Return to TOC
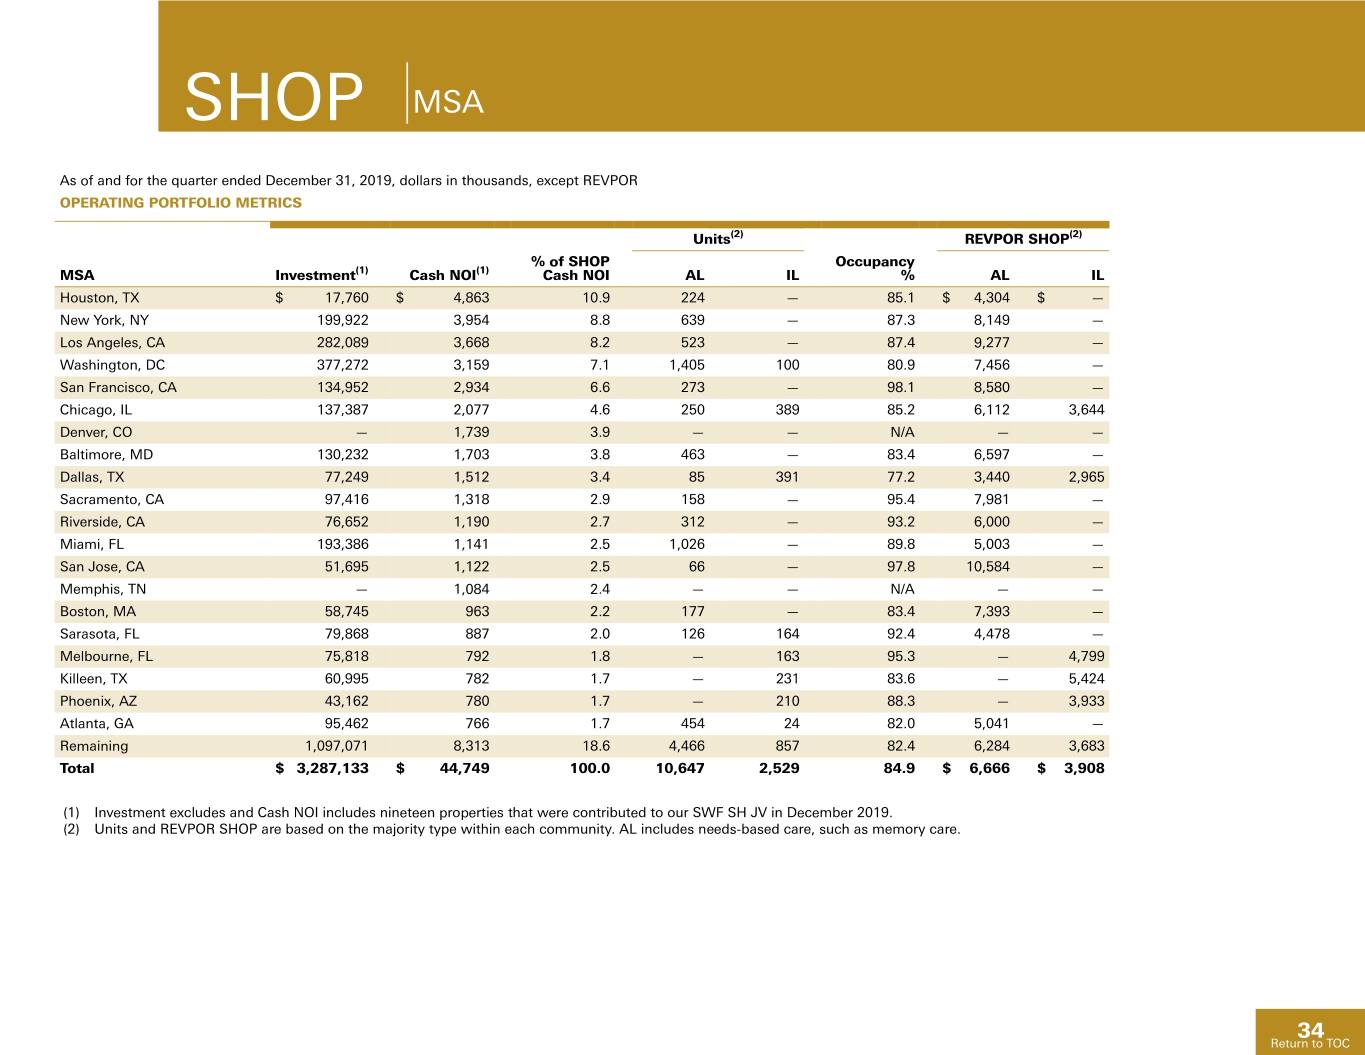
SHOP MSA As of and for the quarter ended December 31, 2019, dollars in thousands, except REVPOR OPERATING PORTFOLIO METRICS Units(2) REVPOR SHOP(2) % of SHOP Occupancy MSA Investment(1) Cash NOI(1) Cash NOI AL IL % AL IL Houston, TX $ 17,760 $ 4,863 10.9 224 — 85.1 $ 4,304 $ — New York, NY 199,922 3,954 8.8 639 — 87.3 8,149 — Los Angeles, CA 282,089 3,668 8.2 523 — 87.4 9,277 — Washington, DC 377,272 3,159 7.1 1,405 100 80.9 7,456 — San Francisco, CA 134,952 2,934 6.6 273 — 98.1 8,580 — Chicago, IL 137,387 2,077 4.6 250 389 85.2 6,112 3,644 Denver, CO — 1,739 3.9 — — N/A — — Baltimore, MD 130,232 1,703 3.8 463 — 83.4 6,597 — Dallas, TX 77,249 1,512 3.4 85 391 77.2 3,440 2,965 Sacramento, CA 97,416 1,318 2.9 158 — 95.4 7,981 — Riverside, CA 76,652 1,190 2.7 312 — 93.2 6,000 — Miami, FL 193,386 1,141 2.5 1,026 — 89.8 5,003 — San Jose, CA 51,695 1,122 2.5 66 — 97.8 10,584 — Memphis, TN — 1,084 2.4 — — N/A — — Boston, MA 58,745 963 2.2 177 — 83.4 7,393 — Sarasota, FL 79,868 887 2.0 126 164 92.4 4,478 — Melbourne, FL 75,818 792 1.8 — 163 95.3 — 4,799 Killeen, TX 60,995 782 1.7 — 231 83.6 — 5,424 Phoenix, AZ 43,162 780 1.7 — 210 88.3 — 3,933 Atlanta, GA 95,462 766 1.7 454 24 82.0 5,041 — Remaining 1,097,071 8,313 18.6 4,466 857 82.4 6,284 3,683 Total $ 3,287,133 $ 44,749 100.0 10,647 2,529 84.9 $ 6,666 $ 3,908 (1) Investment excludes and Cash NOI includes nineteen properties that were contributed to our SWF SH JV in December 2019. (2) Units and REVPOR SHOP are based on the majority type within each community. AL includes needs-based care, such as memory care. 34 Return to TOC
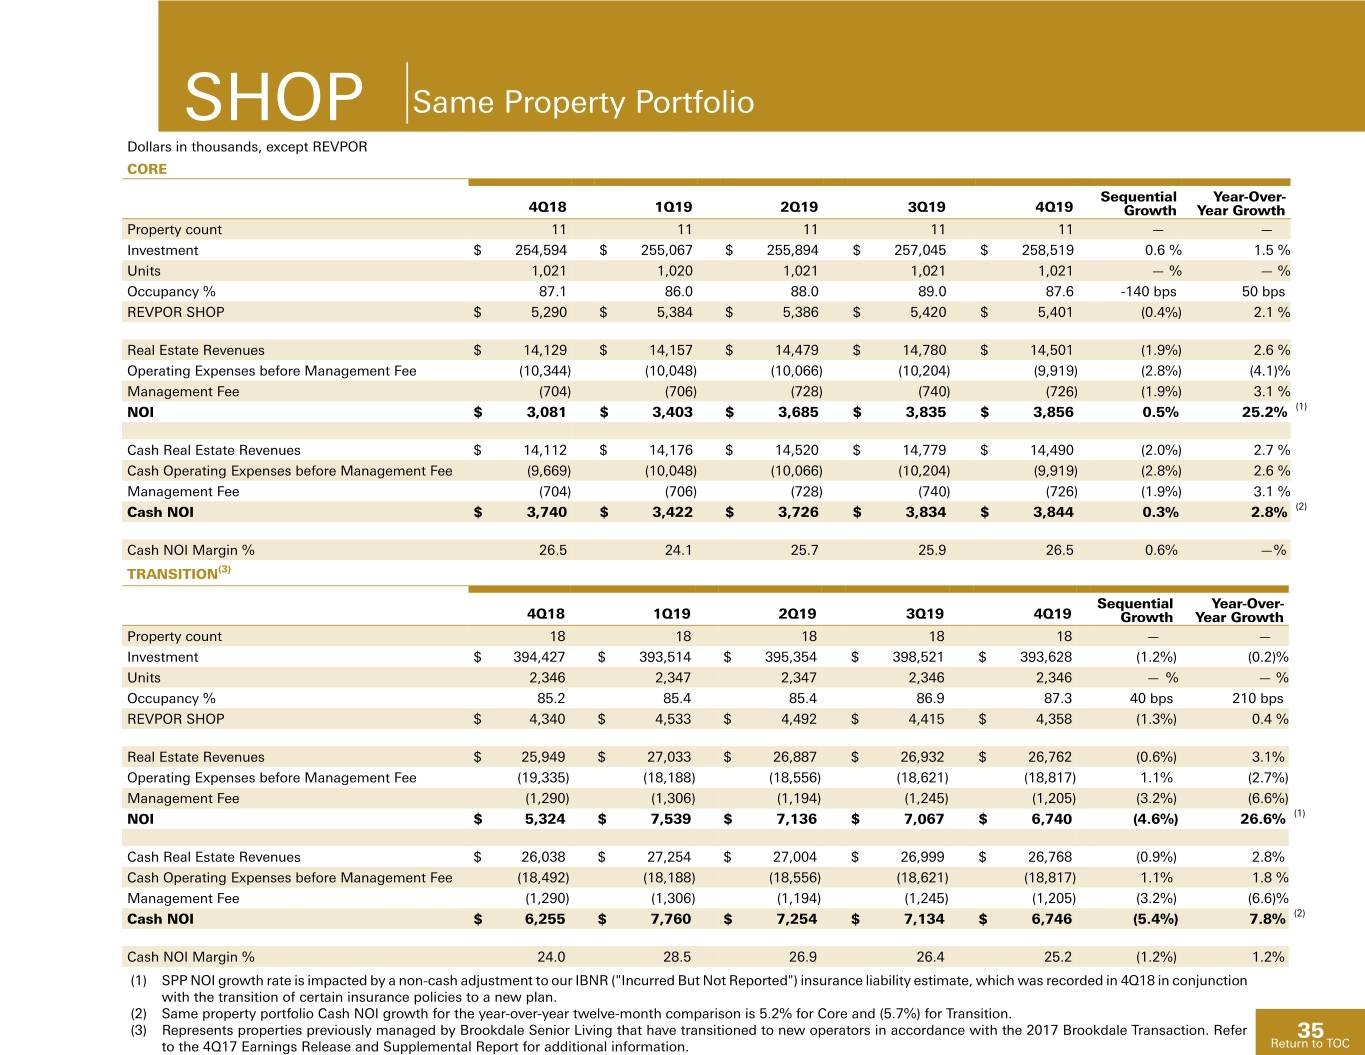
SHOP Same Property Portfolio Dollars in thousands, except REVPOR CORE Sequential Year-Over- 4Q18 1Q19 2Q19 3Q19 4Q19 Growth Year Growth Property count 11 11 11 11 11 — — Investment $ 254,594 $ 255,067 $ 255,894 $ 257,045 $ 258,519 0.6 % 1.5 % Units 1,021 1,020 1,021 1,021 1,021 — % — % Occupancy % 87.1 86.0 88.0 89.0 87.6 -140 bps 50 bps REVPOR SHOP $ 5,290 $ 5,384 $ 5,386 $ 5,420 $ 5,401 (0.4%) 2.1 % Real Estate Revenues $ 14,129 $ 14,157 $ 14,479 $ 14,780 $ 14,501 (1.9%) 2.6 % Operating Expenses before Management Fee (10,344) (10,048) (10,066) (10,204) (9,919) (2.8%) (4.1)% Management Fee (704) (706) (728) (740) (726) (1.9%) 3.1 % NOI $ 3,081 $ 3,403 $ 3,685 $ 3,835 $ 3,856 0.5% 25.2% (1) Cash Real Estate Revenues $ 14,112 $ 14,176 $ 14,520 $ 14,779 $ 14,490 (2.0%) 2.7 % Cash Operating Expenses before Management Fee (9,669) (10,048) (10,066) (10,204) (9,919) (2.8%) 2.6 % Management Fee (704) (706) (728) (740) (726) (1.9%) 3.1 % Cash NOI $ 3,740 $ 3,422 $ 3,726 $ 3,834 $ 3,844 0.3% 2.8% (2) Cash NOI Margin % 26.5 24.1 25.7 25.9 26.5 0.6% —% TRANSITION(3) Sequential Year-Over- 4Q18 1Q19 2Q19 3Q19 4Q19 Growth Year Growth Property count 18 18 18 18 18 — — Investment $ 394,427 $ 393,514 $ 395,354 $ 398,521 $ 393,628 (1.2%) (0.2)% Units 2,346 2,347 2,347 2,346 2,346 — % — % Occupancy % 85.2 85.4 85.4 86.9 87.3 40 bps 210 bps REVPOR SHOP $ 4,340 $ 4,533 $ 4,492 $ 4,415 $ 4,358 (1.3%) 0.4 % Real Estate Revenues $ 25,949 $ 27,033 $ 26,887 $ 26,932 $ 26,762 (0.6%) 3.1% Operating Expenses before Management Fee (19,335) (18,188) (18,556) (18,621) (18,817) 1.1% (2.7%) Management Fee (1,290) (1,306) (1,194) (1,245) (1,205) (3.2%) (6.6%) NOI $ 5,324 $ 7,539 $ 7,136 $ 7,067 $ 6,740 (4.6%) 26.6% (1) Cash Real Estate Revenues $ 26,038 $ 27,254 $ 27,004 $ 26,999 $ 26,768 (0.9%) 2.8% Cash Operating Expenses before Management Fee (18,492) (18,188) (18,556) (18,621) (18,817) 1.1% 1.8 % Management Fee (1,290) (1,306) (1,194) (1,245) (1,205) (3.2%) (6.6)% Cash NOI $ 6,255 $ 7,760 $ 7,254 $ 7,134 $ 6,746 (5.4%) 7.8% (2) Cash NOI Margin % 24.0 28.5 26.9 26.4 25.2 (1.2%) 1.2% (1) SPP NOI growth rate is impacted by a non-cash adjustment to our IBNR ("Incurred But Not Reported") insurance liability estimate, which was recorded in 4Q18 in conjunction with the transition of certain insurance policies to a new plan. (2) Same property portfolio Cash NOI growth for the year-over-year twelve-month comparison is 5.2% for Core and (5.7%) for Transition. (3) Represents properties previously managed by Brookdale Senior Living that have transitioned to new operators in accordance with the 2017 Brookdale Transaction. Refer 35 to the 4Q17 Earnings Release and Supplemental Report for additional information. Return to TOC
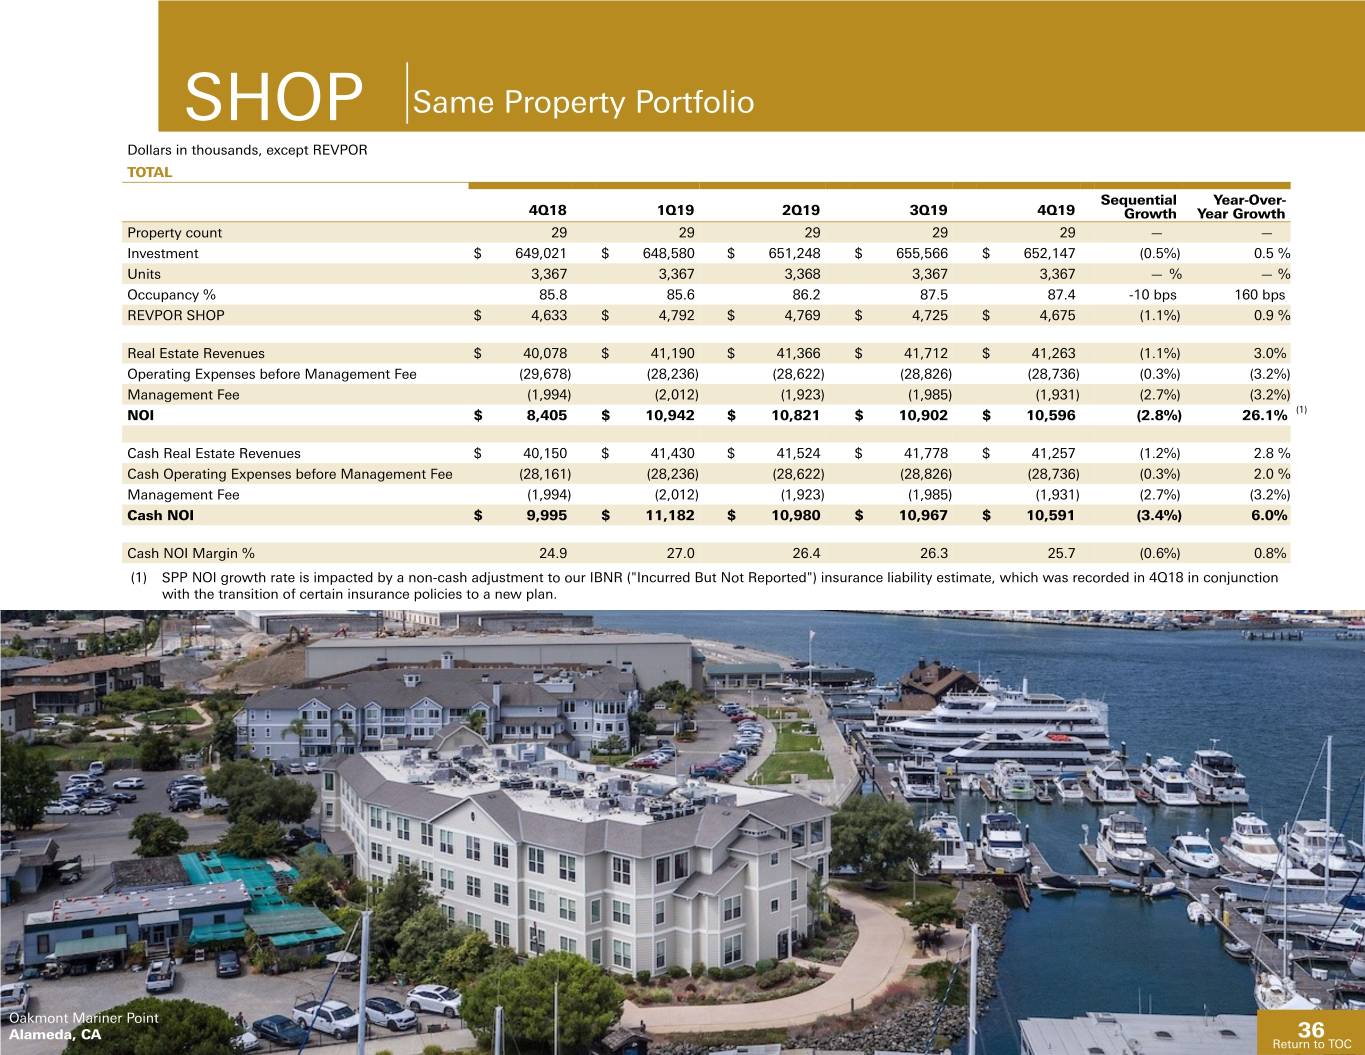
SHOP Same Property Portfolio Dollars in thousands, except REVPOR TOTAL Sequential Year-Over- 4Q18 1Q19 2Q19 3Q19 4Q19 Growth Year Growth Property count 29 29 29 29 29 — — Investment $ 649,021 $ 648,580 $ 651,248 $ 655,566 $ 652,147 (0.5%) 0.5 % Units 3,367 3,367 3,368 3,367 3,367 — % — % Occupancy % 85.8 85.6 86.2 87.5 87.4 -10 bps 160 bps REVPOR SHOP $ 4,633 $ 4,792 $ 4,769 $ 4,725 $ 4,675 (1.1%) 0.9 % Real Estate Revenues $ 40,078 $ 41,190 $ 41,366 $ 41,712 $ 41,263 (1.1%) 3.0% Operating Expenses before Management Fee (29,678) (28,236) (28,622) (28,826) (28,736) (0.3%) (3.2%) Management Fee (1,994) (2,012) (1,923) (1,985) (1,931) (2.7%) (3.2%) NOI $ 8,405 $ 10,942 $ 10,821 $ 10,902 $ 10,596 (2.8%) 26.1% (1) Cash Real Estate Revenues $ 40,150 $ 41,430 $ 41,524 $ 41,778 $ 41,257 (1.2%) 2.8 % Cash Operating Expenses before Management Fee (28,161) (28,236) (28,622) (28,826) (28,736) (0.3%) 2.0 % Management Fee (1,994) (2,012) (1,923) (1,985) (1,931) (2.7%) (3.2%) Cash NOI $ 9,995 $ 11,182 $ 10,980 $ 10,967 $ 10,591 (3.4%) 6.0% Cash NOI Margin % 24.9 27.0 26.4 26.3 25.7 (0.6%) 0.8% (1) SPP NOI growth rate is impacted by a non-cash adjustment to our IBNR ("Incurred But Not Reported") insurance liability estimate, which was recorded in 4Q18 in conjunction with the transition of certain insurance policies to a new plan. Oakmont Mariner Point Alameda, CA 36 ReturnReturn toto TOCTOC
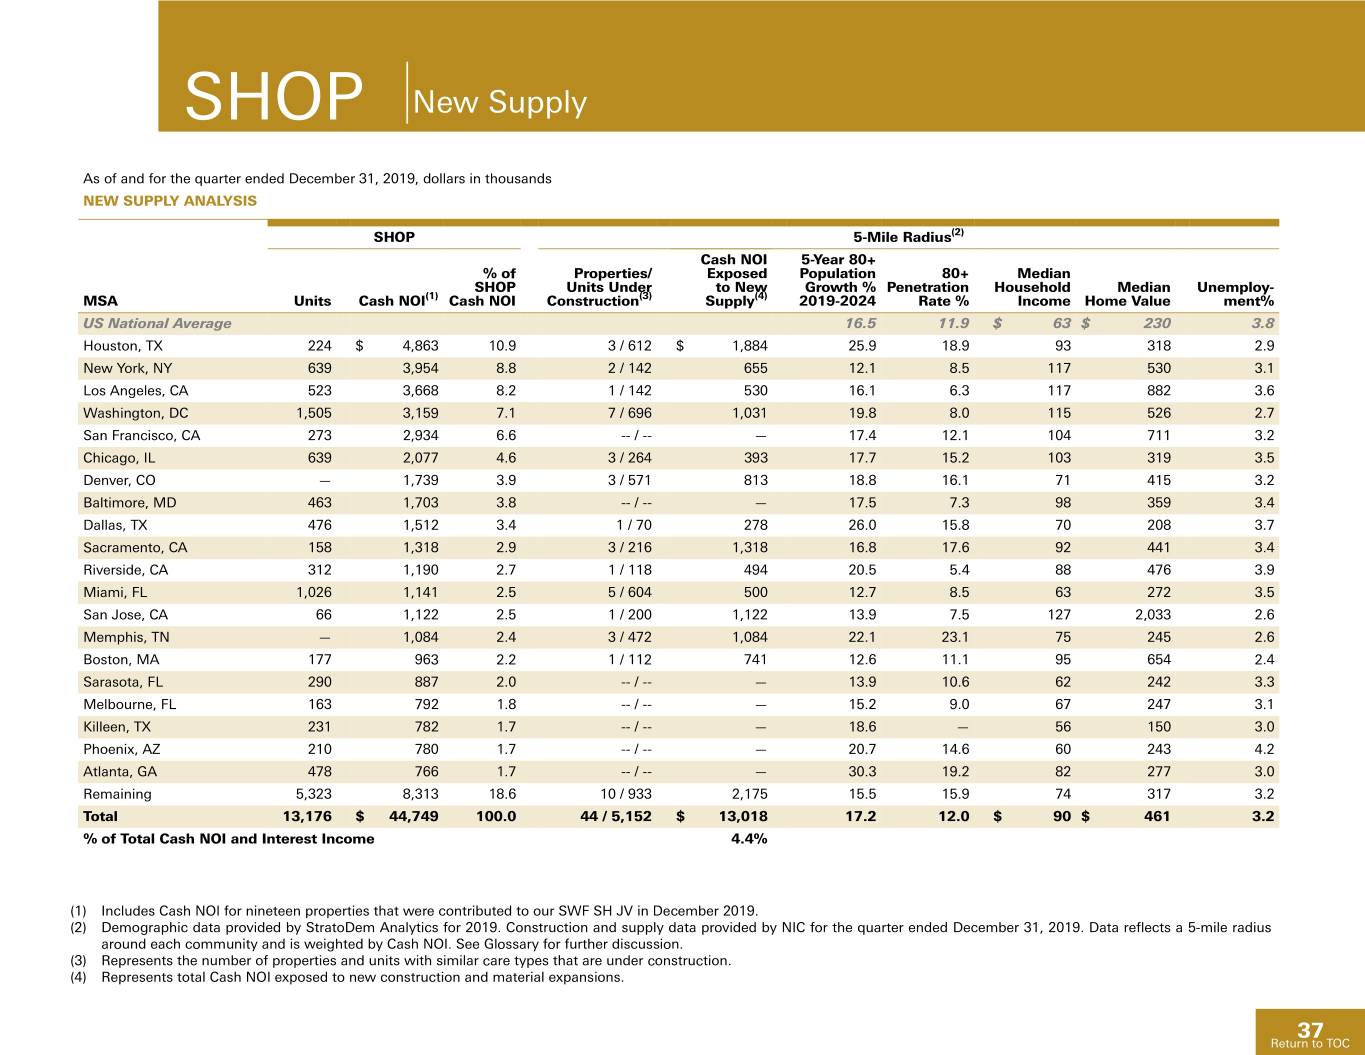
SHOP New Supply As of and for the quarter ended December 31, 2019, dollars in thousands NEW SUPPLY ANALYSIS SHOP 5-Mile Radius(2) Cash NOI 5-Year 80+ % of Properties/ Exposed Population 80+ Median SHOP Units Under to New Growth % Penetration Household Median Unemploy- MSA Units Cash NOI(1) Cash NOI Construction(3) Supply(4) 2019-2024 Rate % Income Home Value ment% US National Average 16.5 11.9 $ 63 $ 230 3.8 Houston, TX 224 $ 4,863 10.9 3 / 612 $ 1,884 25.9 18.9 93 318 2.9 New York, NY 639 3,954 8.8 2 / 142 655 12.1 8.5 117 530 3.1 Los Angeles, CA 523 3,668 8.2 1 / 142 530 16.1 6.3 117 882 3.6 Washington, DC 1,505 3,159 7.1 7 / 696 1,031 19.8 8.0 115 526 2.7 San Francisco, CA 273 2,934 6.6 -- / -- — 17.4 12.1 104 711 3.2 Chicago, IL 639 2,077 4.6 3 / 264 393 17.7 15.2 103 319 3.5 Denver, CO — 1,739 3.9 3 / 571 813 18.8 16.1 71 415 3.2 Baltimore, MD 463 1,703 3.8 -- / -- — 17.5 7.3 98 359 3.4 Dallas, TX 476 1,512 3.4 1 / 70 278 26.0 15.8 70 208 3.7 Sacramento, CA 158 1,318 2.9 3 / 216 1,318 16.8 17.6 92 441 3.4 Riverside, CA 312 1,190 2.7 1 / 118 494 20.5 5.4 88 476 3.9 Miami, FL 1,026 1,141 2.5 5 / 604 500 12.7 8.5 63 272 3.5 San Jose, CA 66 1,122 2.5 1 / 200 1,122 13.9 7.5 127 2,033 2.6 Memphis, TN — 1,084 2.4 3 / 472 1,084 22.1 23.1 75 245 2.6 Boston, MA 177 963 2.2 1 / 112 741 12.6 11.1 95 654 2.4 Sarasota, FL 290 887 2.0 -- / -- — 13.9 10.6 62 242 3.3 Melbourne, FL 163 792 1.8 -- / -- — 15.2 9.0 67 247 3.1 Killeen, TX 231 782 1.7 -- / -- — 18.6 — 56 150 3.0 Phoenix, AZ 210 780 1.7 -- / -- — 20.7 14.6 60 243 4.2 Atlanta, GA 478 766 1.7 -- / -- — 30.3 19.2 82 277 3.0 Remaining 5,323 8,313 18.6 10 / 933 2,175 15.5 15.9 74 317 3.2 Total 13,176 $ 44,749 100.0 44 / 5,152 $ 13,018 17.2 12.0 $ 90 $ 461 3.2 % of Total Cash NOI and Interest Income 4.4% (1) Includes Cash NOI for nineteen properties that were contributed to our SWF SH JV in December 2019. (2) Demographic data provided by StratoDem Analytics for 2019. Construction and supply data provided by NIC for the quarter ended December 31, 2019. Data reflects a 5-mile radius around each community and is weighted by Cash NOI. See Glossary for further discussion. (3) Represents the number of properties and units with similar care types that are under construction. (4) Represents total Cash NOI exposed to new construction and material expansions. 37 Return to TOC
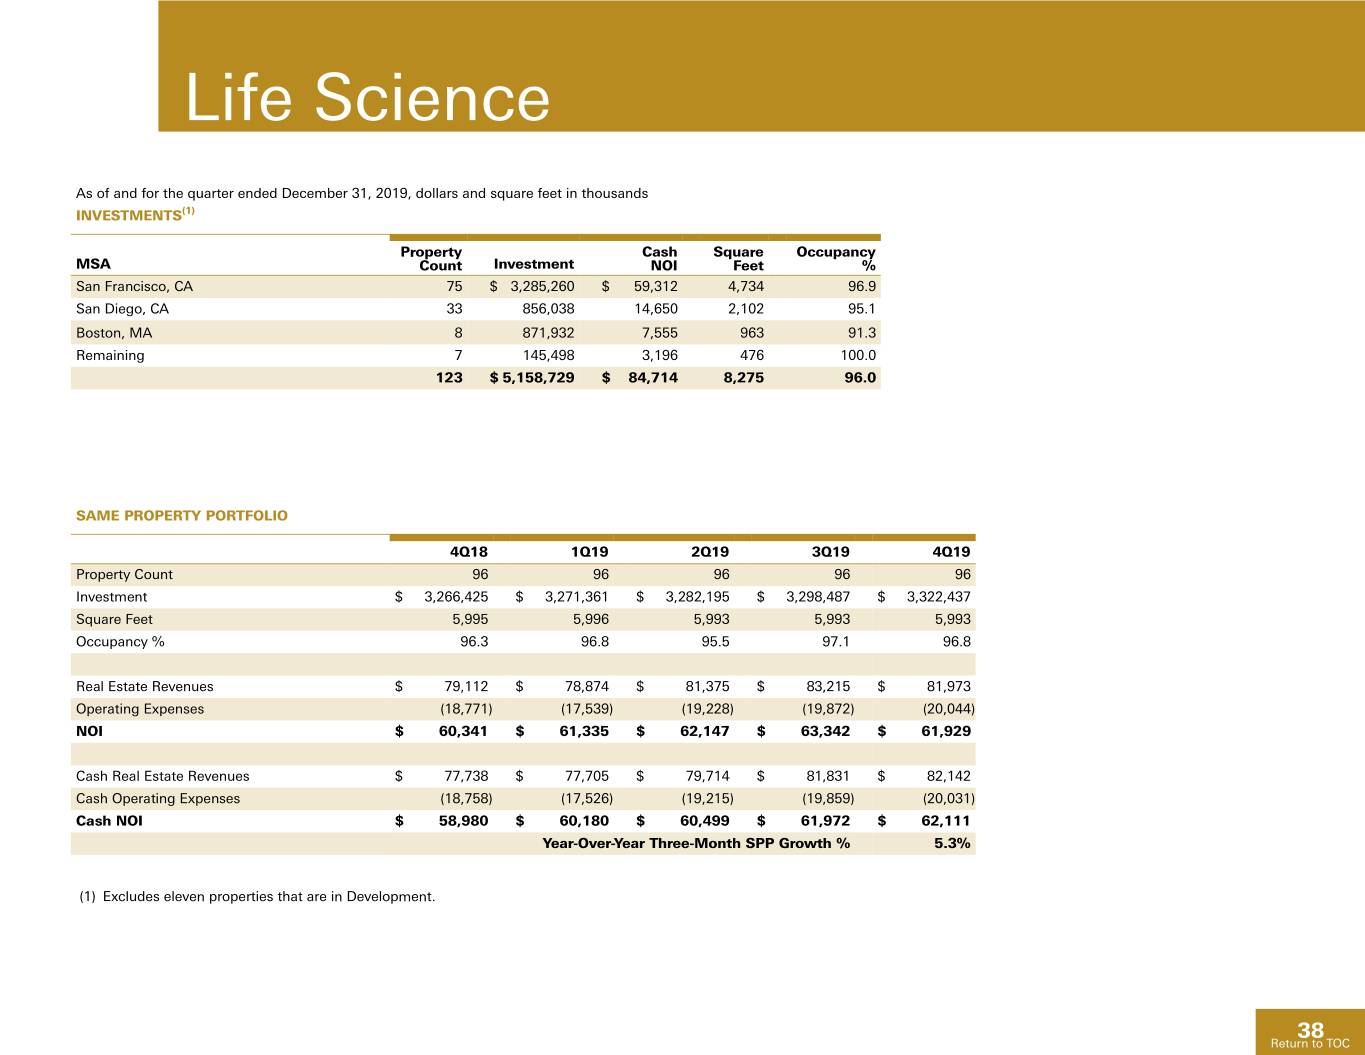
Life Science As of and for the quarter ended December 31, 2019, dollars and square feet in thousands INVESTMENTS(1) Property Cash Square Occupancy MSA Count Investment NOI Feet % San Francisco, CA 75 $ 3,285,260 $ 59,312 4,734 96.9 San Diego, CA 33 856,038 14,650 2,102 95.1 Boston, MA 8 871,932 7,555 963 91.3 Remaining 7 145,498 3,196 476 100.0 123 $ 5,158,729 $ 84,714 8,275 96.0 SAME PROPERTY PORTFOLIO 4Q18 1Q19 2Q19 3Q19 4Q19 Property Count 96 96 96 96 96 Investment $ 3,266,425 $ 3,271,361 $ 3,282,195 $ 3,298,487 $ 3,322,437 Square Feet 5,995 5,996 5,993 5,993 5,993 Occupancy % 96.3 96.8 95.5 97.1 96.8 Real Estate Revenues $ 79,112 $ 78,874 $ 81,375 $ 83,215 $ 81,973 Operating Expenses (18,771) (17,539) (19,228) (19,872) (20,044) NOI $ 60,341 $ 61,335 $ 62,147 $ 63,342 $ 61,929 Cash Real Estate Revenues $ 77,738 $ 77,705 $ 79,714 $ 81,831 $ 82,142 Cash Operating Expenses (18,758) (17,526) (19,215) (19,859) (20,031) Cash NOI $ 58,980 $ 60,180 $ 60,499 $ 61,972 $ 62,111 Year-Over-Year Three-Month SPP Growth % 5.3% (1) Excludes eleven properties that are in Development. 38 Return to TOC
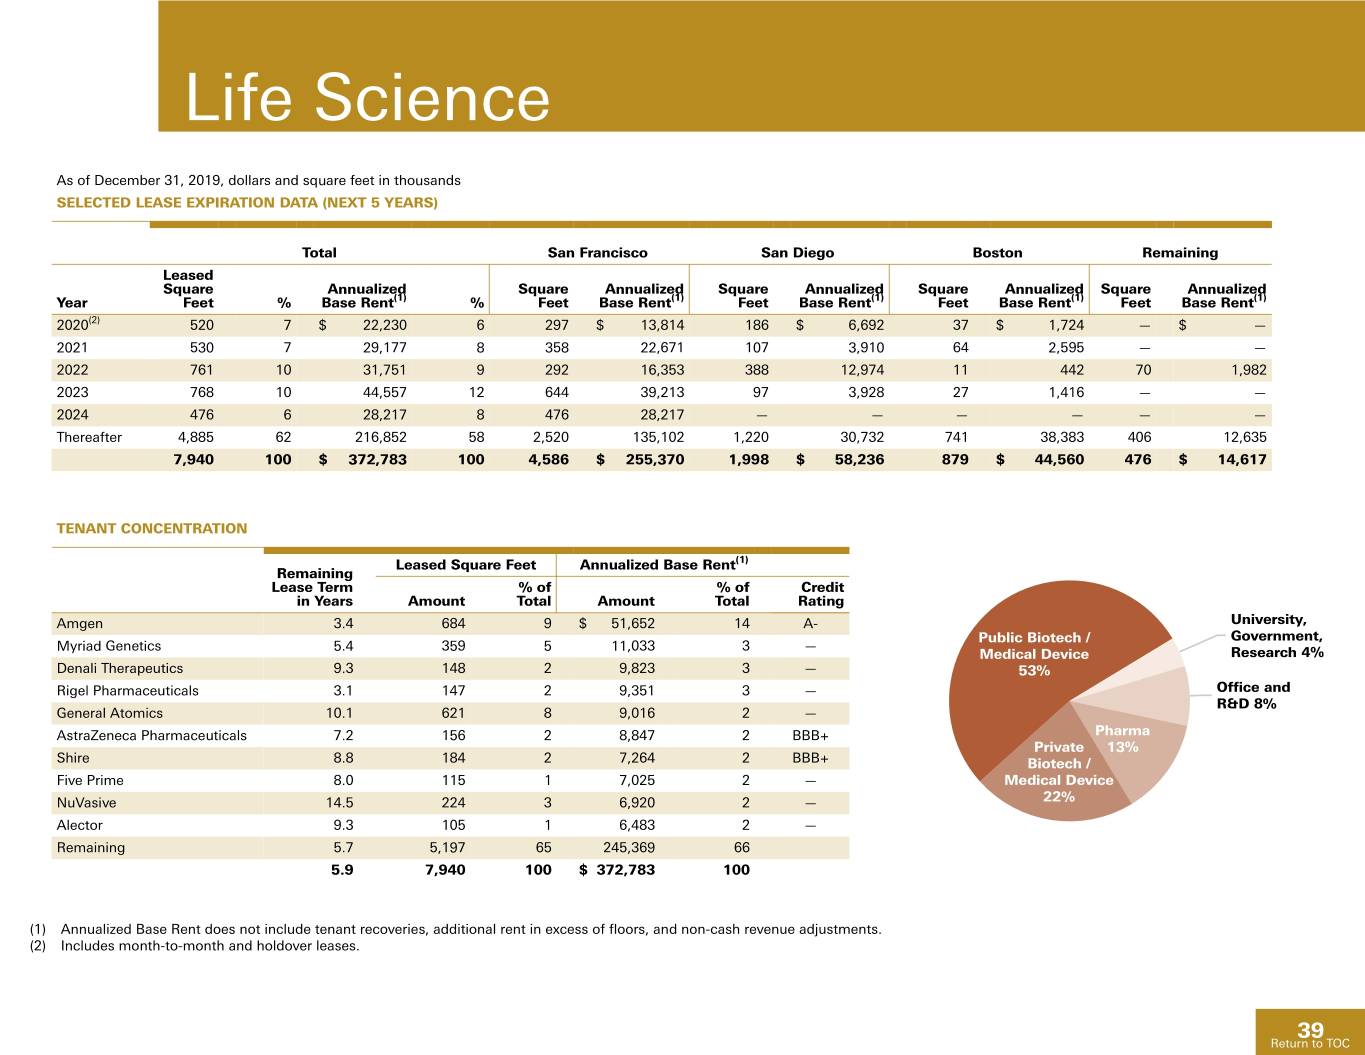
Life Science As of December 31, 2019, dollars and square feet in thousands SELECTED LEASE EXPIRATION DATA (NEXT 5 YEARS) Total San Francisco San Diego Boston Remaining Leased Square Annualized Square Annualized Square Annualized Square Annualized Square Annualized Year Feet % Base Rent(1) % Feet Base Rent(1) Feet Base Rent(1) Feet Base Rent(1) Feet Base Rent(1) 2020(2) 520 7 $ 22,230 6 297 $ 13,814 186 $ 6,692 37 $ 1,724 — $ — 2021 530 7 29,177 8 358 22,671 107 3,910 64 2,595 — — 2022 761 10 31,751 9 292 16,353 388 12,974 11 442 70 1,982 2023 768 10 44,557 12 644 39,213 97 3,928 27 1,416 — — 2024 476 6 28,217 8 476 28,217 — — — — — — Thereafter 4,885 62 216,852 58 2,520 135,102 1,220 30,732 741 38,383 406 12,635 7,940 100 $ 372,783 100 4,586 $ 255,370 1,998 $ 58,236 879 $ 44,560 476 $ 14,617 TENANT CONCENTRATION Leased Square Feet Annualized Base Rent(1) Remaining Lease Term % of % of Credit in Years Amount Total Amount Total Rating Amgen 3.4 684 9 $ 51,652 14 A- University, Public Biotech / Government, Myriad Genetics 5.4 359 5 11,033 3 — Medical Device Research 4% Denali Therapeutics 9.3 148 2 9,823 3 — 53% Rigel Pharmaceuticals 3.1 147 2 9,351 3 — Office and R&D 8% General Atomics 10.1 621 8 9,016 2 — AstraZeneca Pharmaceuticals 7.2 156 2 8,847 2 BBB+ Pharma Private 13% Shire 8.8 184 2 7,264 2 BBB+ Biotech / Five Prime 8.0 115 1 7,025 2 — Medical Device NuVasive 14.5 224 3 6,920 2 — 22% Alector 9.3 105 1 6,483 2 — Remaining 5.7 5,197 65 245,369 66 5.9 7,940 100 $ 372,783 100 (1) Annualized Base Rent does not include tenant recoveries, additional rent in excess of floors, and non-cash revenue adjustments. (2) Includes month-to-month and holdover leases. 39 Return to TOC
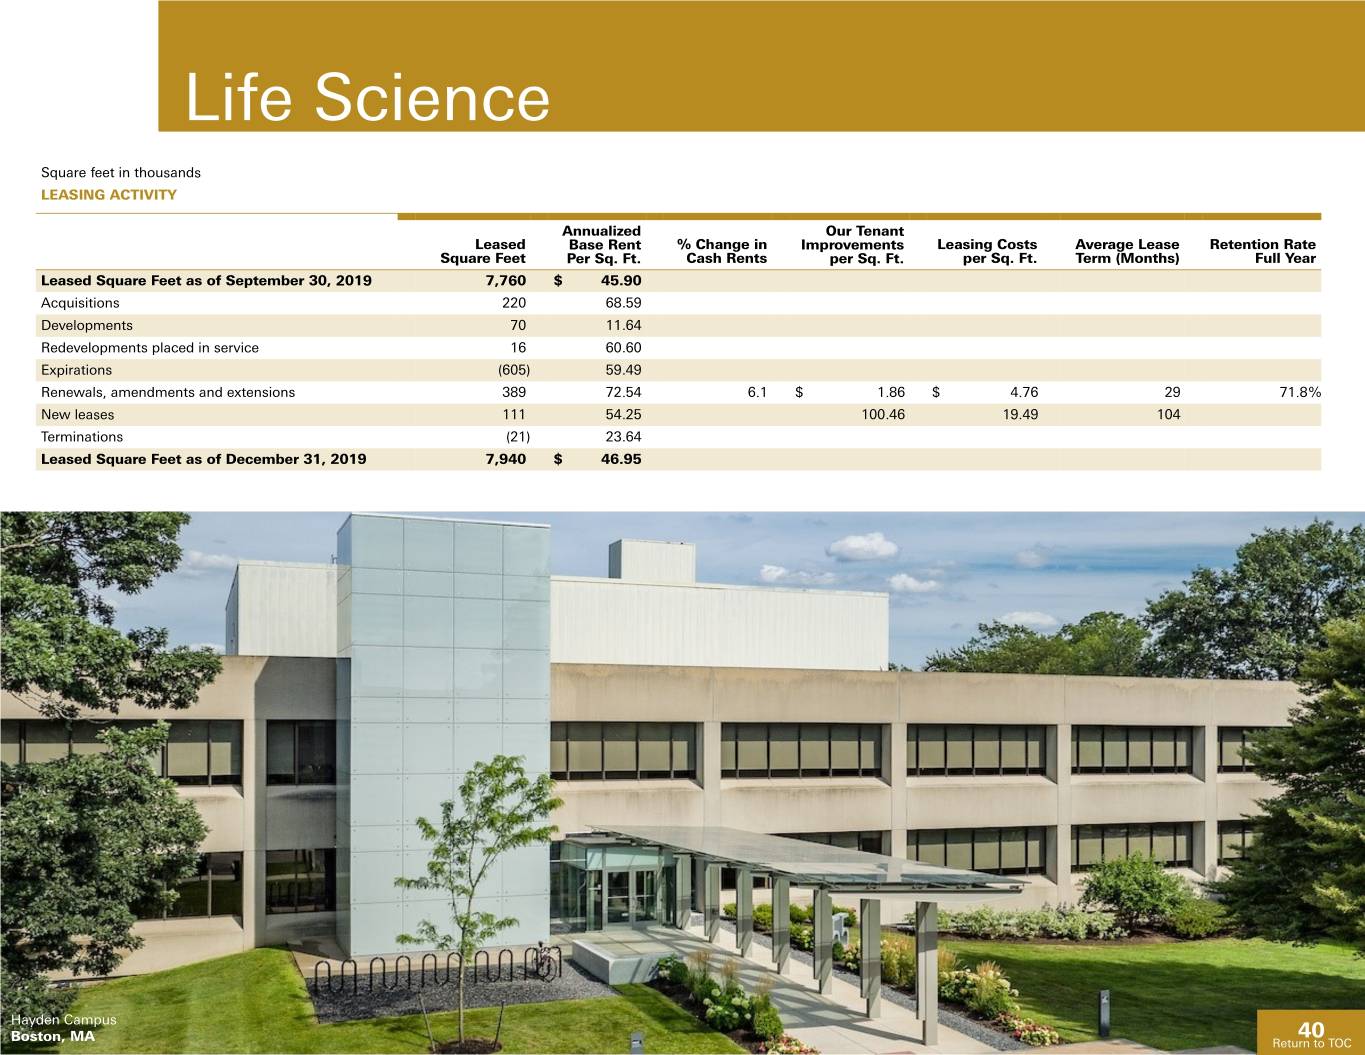
Life Science Square feet in thousands LEASING ACTIVITY Annualized Our Tenant Leased Base Rent % Change in Improvements Leasing Costs Average Lease Retention Rate Square Feet Per Sq. Ft. Cash Rents per Sq. Ft. per Sq. Ft. Term (Months) Full Year Leased Square Feet as of September 30, 2019 7,760 $ 45.90 Acquisitions 220 68.59 Developments 70 11.64 Redevelopments placed in service 16 60.60 Expirations (605) 59.49 Renewals, amendments and extensions 389 72.54 6.1 $ 1.86 $ 4.76 29 71.8% New leases 111 54.25 100.46 19.49 104 Terminations (21) 23.64 Leased Square Feet as of December 31, 2019 7,940 $ 46.95 Hayden Campus Boston, MA 40 ReturnReturn toto TOCTOC
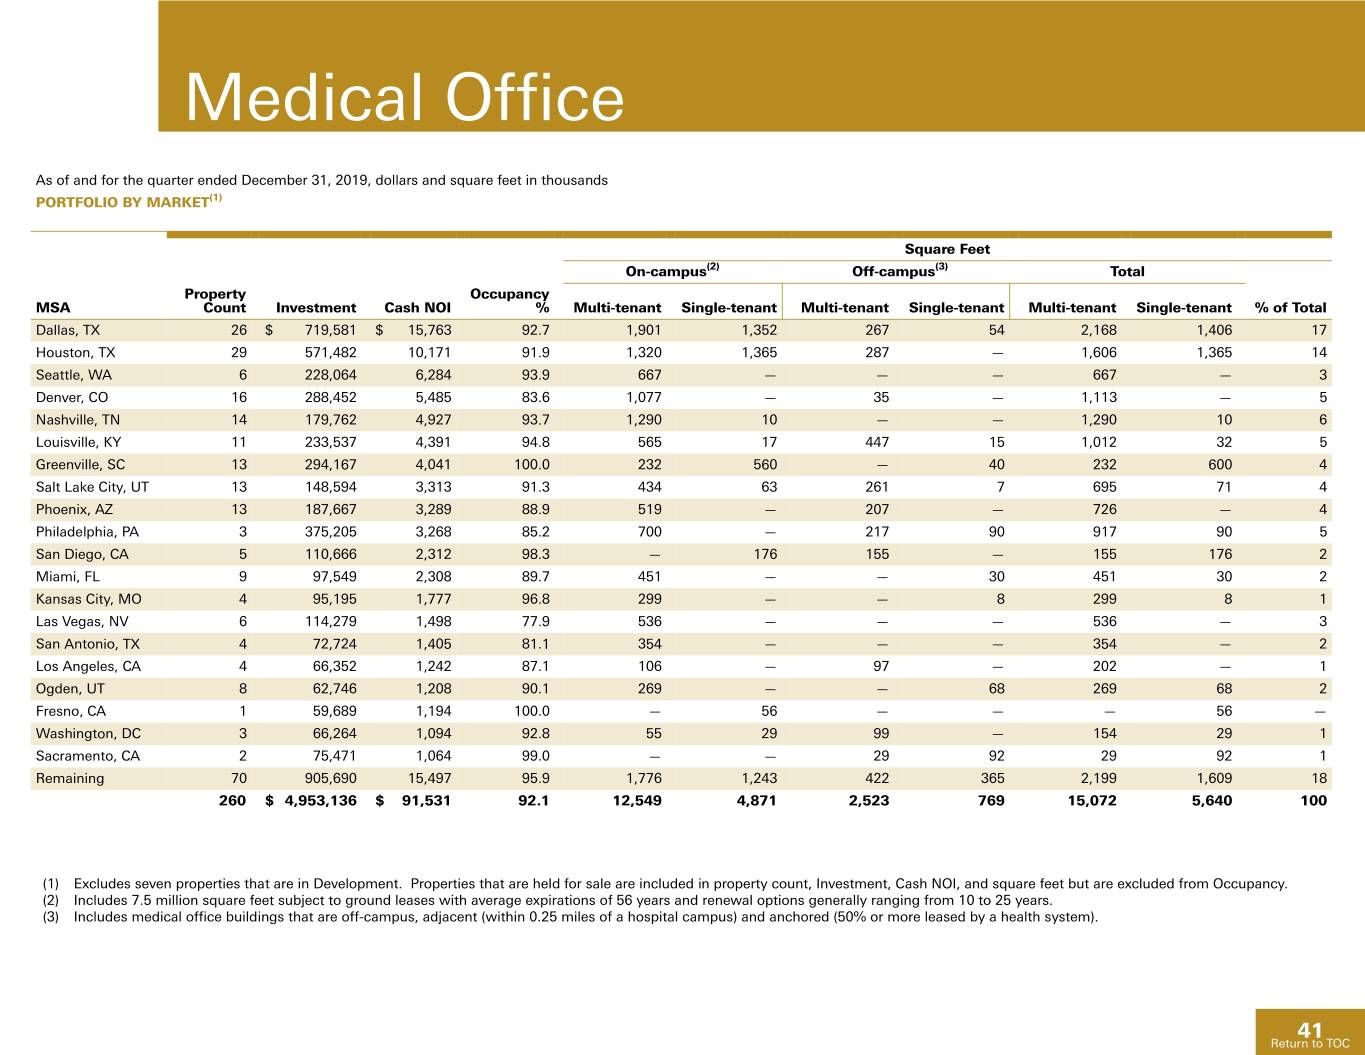
Medical Office As of and for the quarter ended December 31, 2019, dollars and square feet in thousands PORTFOLIO BY MARKET(1) Square Feet On-campus(2) Off-campus(3) Total Property Occupancy MSA Count Investment Cash NOI % Multi-tenant Single-tenant Multi-tenant Single-tenant Multi-tenant Single-tenant % of Total Dallas, TX 26 $ 719,581 $ 15,763 92.7 1,901 1,352 267 54 2,168 1,406 17 Houston, TX 29 571,482 10,171 91.9 1,320 1,365 287 — 1,606 1,365 14 Seattle, WA 6 228,064 6,284 93.9 667 — — — 667 — 3 Denver, CO 16 288,452 5,485 83.6 1,077 — 35 — 1,113 — 5 Nashville, TN 14 179,762 4,927 93.7 1,290 10 — — 1,290 10 6 Louisville, KY 11 233,537 4,391 94.8 565 17 447 15 1,012 32 5 Greenville, SC 13 294,167 4,041 100.0 232 560 — 40 232 600 4 Salt Lake City, UT 13 148,594 3,313 91.3 434 63 261 7 695 71 4 Phoenix, AZ 13 187,667 3,289 88.9 519 — 207 — 726 — 4 Philadelphia, PA 3 375,205 3,268 85.2 700 — 217 90 917 90 5 San Diego, CA 5 110,666 2,312 98.3 — 176 155 — 155 176 2 Miami, FL 9 97,549 2,308 89.7 451 — — 30 451 30 2 Kansas City, MO 4 95,195 1,777 96.8 299 — — 8 299 8 1 Las Vegas, NV 6 114,279 1,498 77.9 536 — — — 536 — 3 San Antonio, TX 4 72,724 1,405 81.1 354 — — — 354 — 2 Los Angeles, CA 4 66,352 1,242 87.1 106 — 97 — 202 — 1 Ogden, UT 8 62,746 1,208 90.1 269 — — 68 269 68 2 Fresno, CA 1 59,689 1,194 100.0 — 56 — — — 56 — Washington, DC 3 66,264 1,094 92.8 55 29 99 — 154 29 1 Sacramento, CA 2 75,471 1,064 99.0 — — 29 92 29 92 1 Remaining 70 905,690 15,497 95.9 1,776 1,243 422 365 2,199 1,609 18 260 $ 4,953,136 $ 91,531 92.1 12,549 4,871 2,523 769 15,072 5,640 100 (1) Excludes seven properties that are in Development. Properties that are held for sale are included in property count, Investment, Cash NOI, and square feet but are excluded from Occupancy. (2) Includes 7.5 million square feet subject to ground leases with average expirations of 56 years and renewal options generally ranging from 10 to 25 years. (3) Includes medical office buildings that are off-campus, adjacent (within 0.25 miles of a hospital campus) and anchored (50% or more leased by a health system). 41 Return to TOC
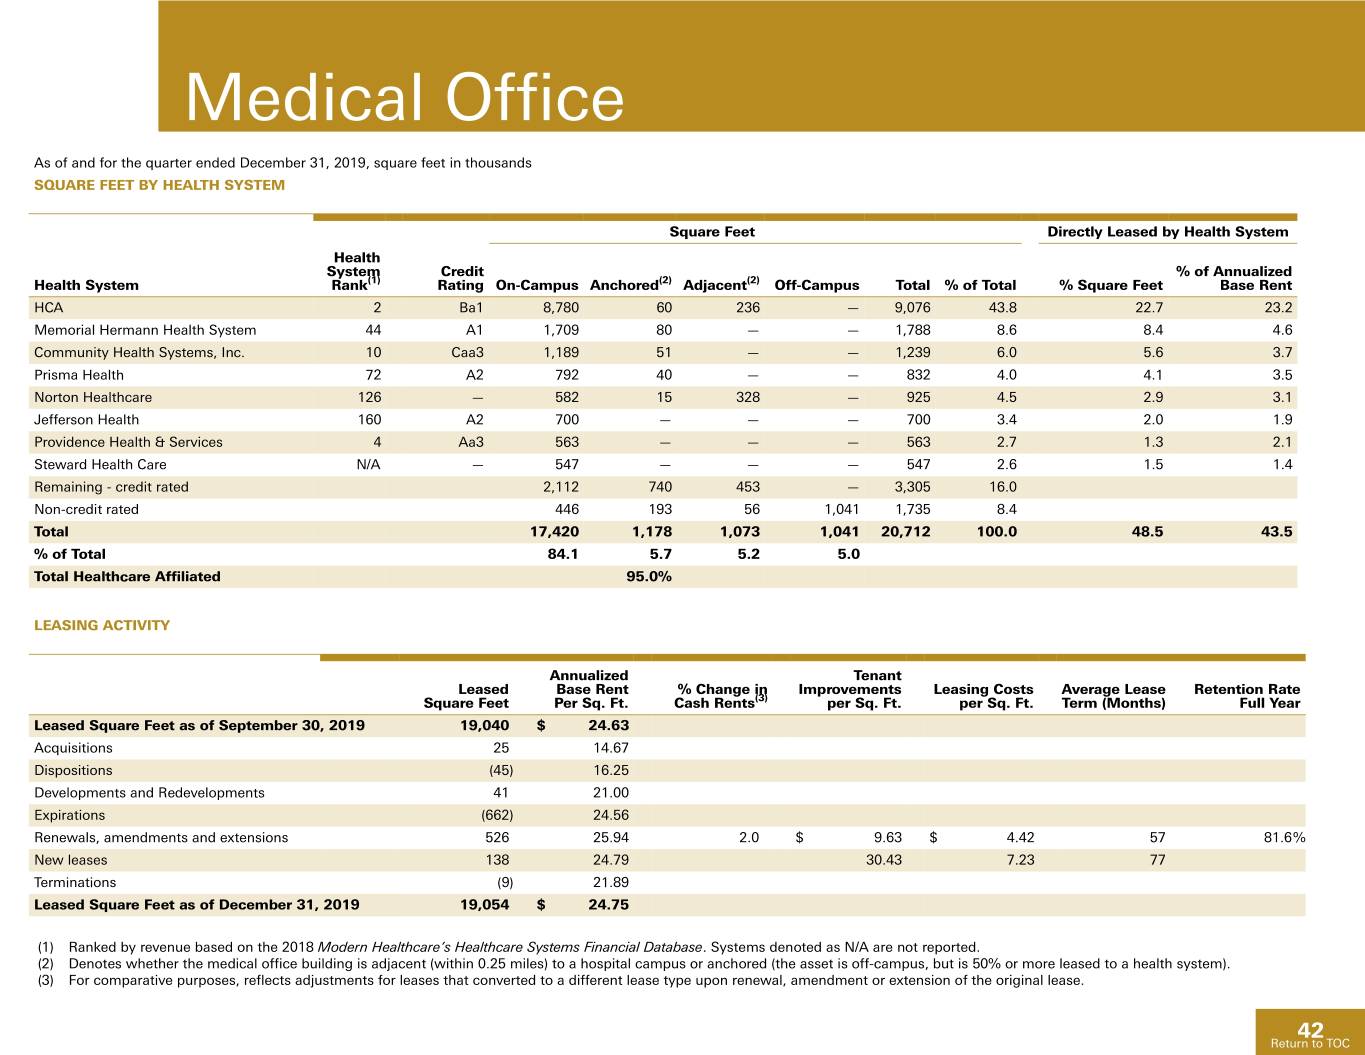
Medical Office As of and for the quarter ended December 31, 2019, square feet in thousands SQUARE FEET BY HEALTH SYSTEM Square Feet Directly Leased by Health System Health System Credit % of Annualized Health System Rank(1) Rating On-Campus Anchored(2) Adjacent(2) Off-Campus Total % of Total % Square Feet Base Rent HCA 2 Ba1 8,780 60 236 — 9,076 43.8 22.7 23.2 Memorial Hermann Health System 44 A1 1,709 80 — — 1,788 8.6 8.4 4.6 Community Health Systems, Inc. 10 Caa3 1,189 51 — — 1,239 6.0 5.6 3.7 Prisma Health 72 A2 792 40 — — 832 4.0 4.1 3.5 Norton Healthcare 126 — 582 15 328 — 925 4.5 2.9 3.1 Jefferson Health 160 A2 700 — — — 700 3.4 2.0 1.9 Providence Health & Services 4 Aa3 563 — — — 563 2.7 1.3 2.1 Steward Health Care N/A — 547 — — — 547 2.6 1.5 1.4 Remaining - credit rated 2,112 740 453 — 3,305 16.0 Non-credit rated 446 193 56 1,041 1,735 8.4 Total 17,420 1,178 1,073 1,041 20,712 100.0 48.5 43.5 % of Total 84.1 5.7 5.2 5.0 Total Healthcare Affiliated 95.0% LEASING ACTIVITY Annualized Tenant Leased Base Rent % Change in Improvements Leasing Costs Average Lease Retention Rate Square Feet Per Sq. Ft. Cash Rents(3) per Sq. Ft. per Sq. Ft. Term (Months) Full Year Leased Square Feet as of September 30, 2019 19,040 $ 24.63 Acquisitions 25 14.67 Dispositions (45) 16.25 Developments and Redevelopments 41 21.00 Expirations (662) 24.56 Renewals, amendments and extensions 526 25.94 2.0 $ 9.63 $ 4.42 57 81.6% New leases 138 24.79 30.43 7.23 77 Terminations (9) 21.89 Leased Square Feet as of December 31, 2019 19,054 $ 24.75 (1) Ranked by revenue based on the 2018 Modern Healthcare’s Healthcare Systems Financial Database. Systems denoted as N/A are not reported. (2) Denotes whether the medical office building is adjacent (within 0.25 miles) to a hospital campus or anchored (the asset is off-campus, but is 50% or more leased to a health system). (3) For comparative purposes, reflects adjustments for leases that converted to a different lease type upon renewal, amendment or extension of the original lease. 42 Return to TOC
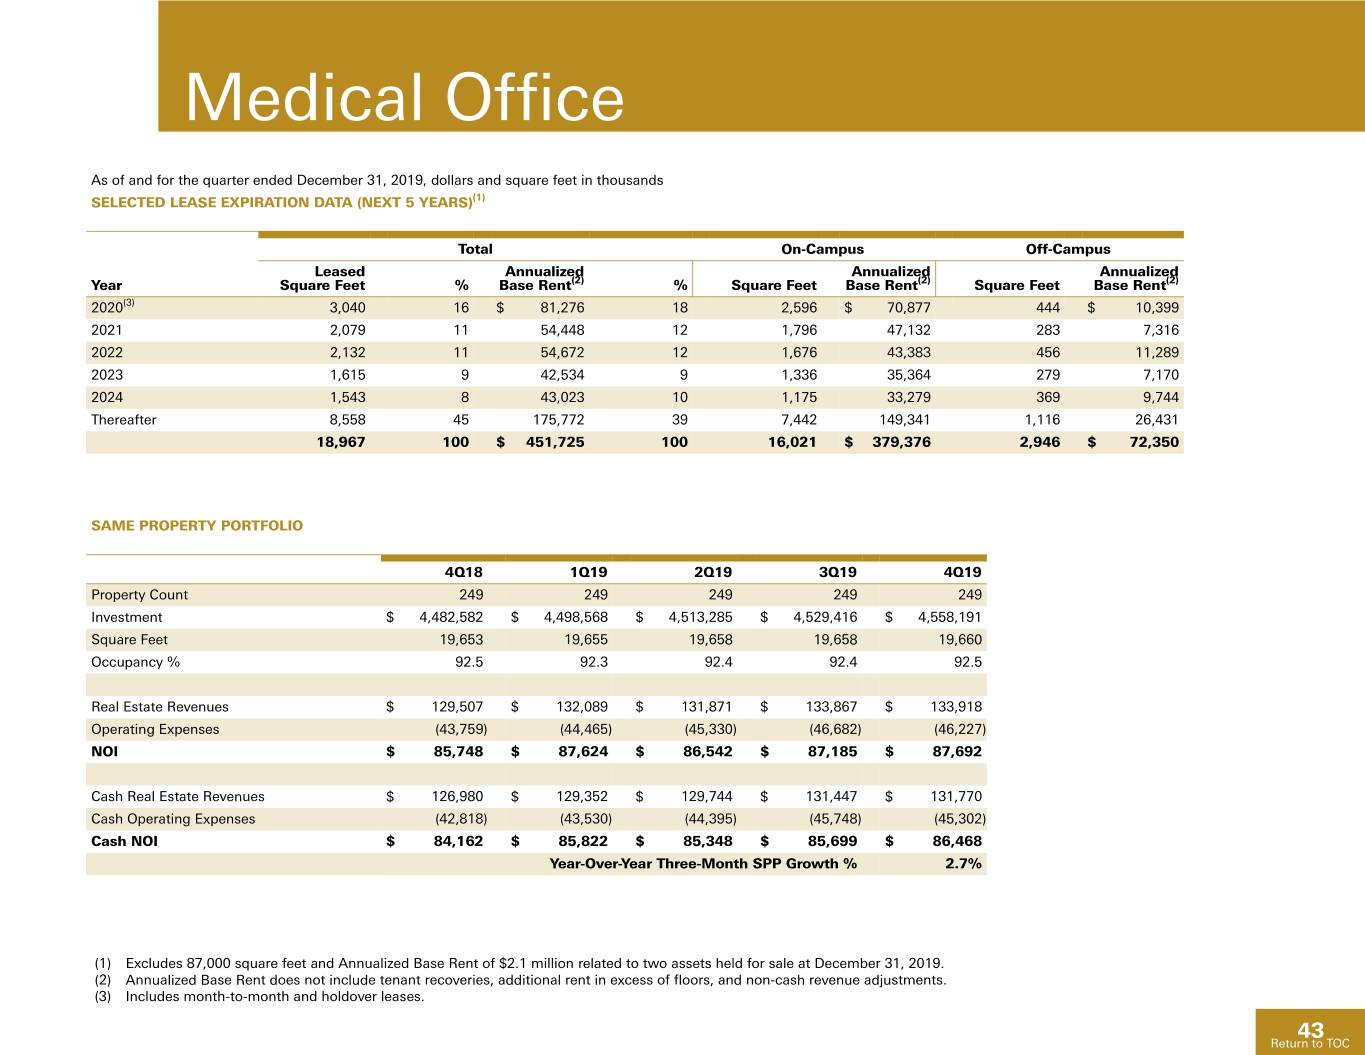
Medical Office As of and for the quarter ended December 31, 2019, dollars and square feet in thousands SELECTED LEASE EXPIRATION DATA (NEXT 5 YEARS)(1) Total On-Campus Off-Campus Leased Annualized Annualized Annualized Year Square Feet % Base Rent(2) % Square Feet Base Rent(2) Square Feet Base Rent(2) 2020(3) 3,040 16 $ 81,276 18 2,596 $ 70,877 444 $ 10,399 2021 2,079 11 54,448 12 1,796 47,132 283 7,316 2022 2,132 11 54,672 12 1,676 43,383 456 11,289 2023 1,615 9 42,534 9 1,336 35,364 279 7,170 2024 1,543 8 43,023 10 1,175 33,279 369 9,744 Thereafter 8,558 45 175,772 39 7,442 149,341 1,116 26,431 18,967 100 $ 451,725 100 16,021 $ 379,376 2,946 $ 72,350 SAME PROPERTY PORTFOLIO 4Q18 1Q19 2Q19 3Q19 4Q19 Property Count 249 249 249 249 249 Investment $ 4,482,582 $ 4,498,568 $ 4,513,285 $ 4,529,416 $ 4,558,191 Square Feet 19,653 19,655 19,658 19,658 19,660 Occupancy % 92.5 92.3 92.4 92.4 92.5 Real Estate Revenues $ 129,507 $ 132,089 $ 131,871 $ 133,867 $ 133,918 Operating Expenses (43,759) (44,465) (45,330) (46,682) (46,227) NOI $ 85,748 $ 87,624 $ 86,542 $ 87,185 $ 87,692 Cash Real Estate Revenues $ 126,980 $ 129,352 $ 129,744 $ 131,447 $ 131,770 Cash Operating Expenses (42,818) (43,530) (44,395) (45,748) (45,302) Cash NOI $ 84,162 $ 85,822 $ 85,348 $ 85,699 $ 86,468 Year-Over-Year Three-Month SPP Growth % 2.7% (1) Excludes 87,000 square feet and Annualized Base Rent of $2.1 million related to two assets held for sale at December 31, 2019. (2) Annualized Base Rent does not include tenant recoveries, additional rent in excess of floors, and non-cash revenue adjustments. (3) Includes month-to-month and holdover leases. 43 Return to TOC
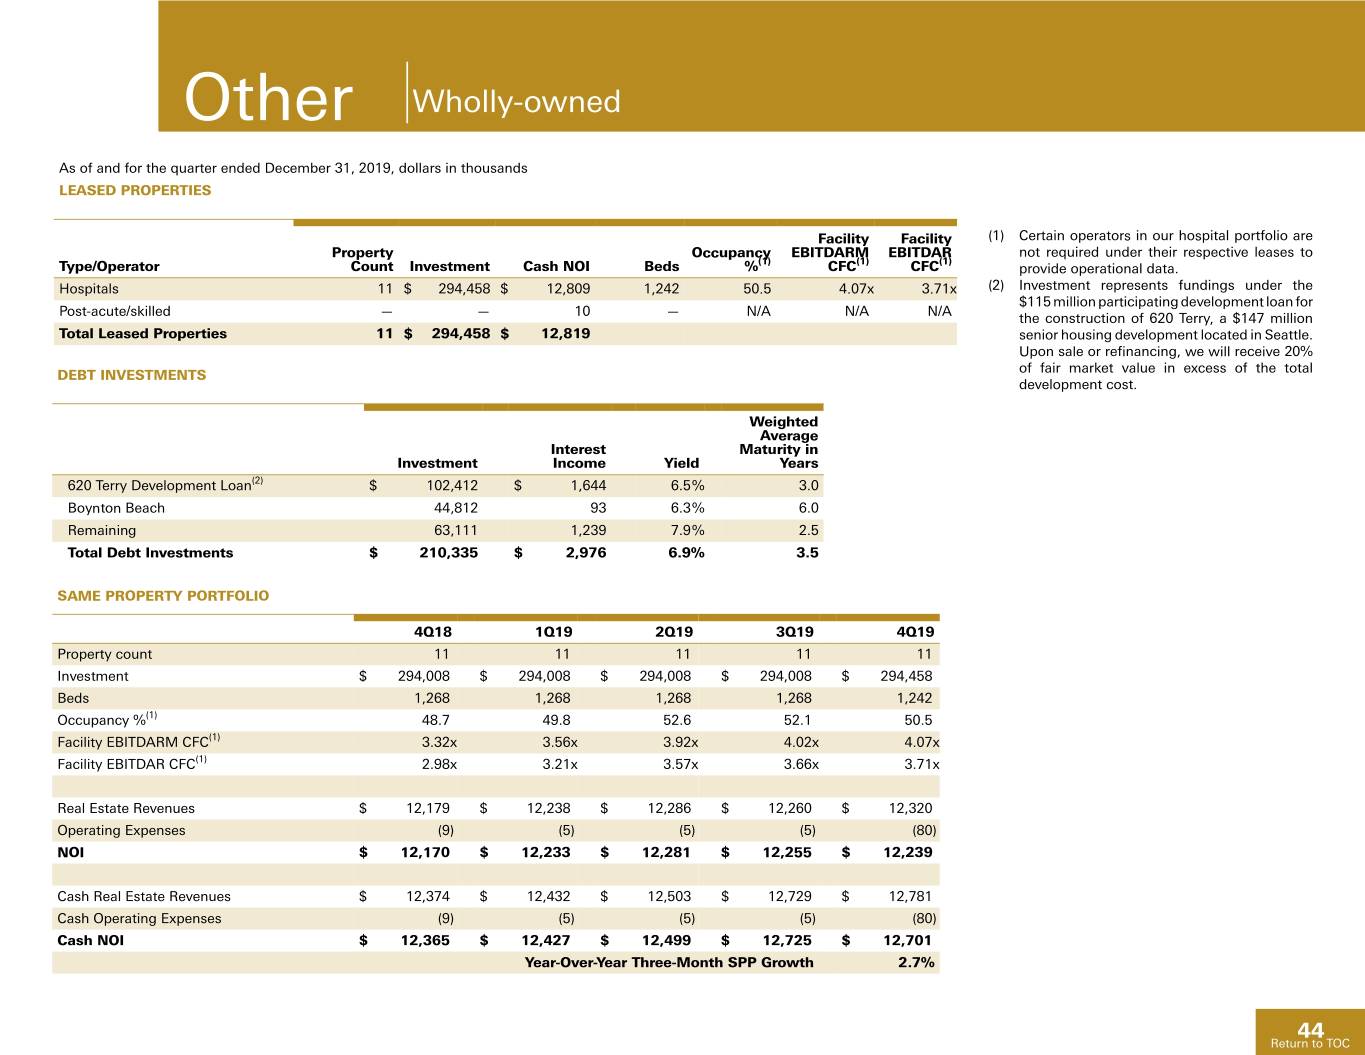
Other Wholly-owned As of and for the quarter ended December 31, 2019, dollars in thousands LEASED PROPERTIES Facility Facility (1) Certain operators in our hospital portfolio are Property Occupancy EBITDARM EBITDAR not required under their respective leases to (1) (1) (1) Type/Operator Count Investment Cash NOI Beds % CFC CFC provide operational data. Hospitals 11 $ 294,458 $ 12,809 1,242 50.5 4.07x 3.71x (2) Investment represents fundings under the $115 million participating development loan for Post-acute/skilled — — 10 — N/A N/A N/A the construction of 620 Terry, a $147 million Total Leased Properties 11 $ 294,458 $ 12,819 senior housing development located in Seattle. Upon sale or refinancing, we will receive 20% of fair market value in excess of the total DEBT INVESTMENTS development cost. Weighted Average Interest Maturity in Investment Income Yield Years 620 Terry Development Loan(2) $ 102,412 $ 1,644 6.5% 3.0 Boynton Beach 44,812 93 6.3% 6.0 Remaining 63,111 1,239 7.9% 2.5 Total Debt Investments $ 210,335 $ 2,976 6.9% 3.5 SAME PROPERTY PORTFOLIO 4Q18 1Q19 2Q19 3Q19 4Q19 Property count 11 11 11 11 11 Investment $ 294,008 $ 294,008 $ 294,008 $ 294,008 $ 294,458 Beds 1,268 1,268 1,268 1,268 1,242 Occupancy %(1) 48.7 49.8 52.6 52.1 50.5 Facility EBITDARM CFC(1) 3.32x 3.56x 3.92x 4.02x 4.07x Facility EBITDAR CFC(1) 2.98x 3.21x 3.57x 3.66x 3.71x Real Estate Revenues $ 12,179 $ 12,238 $ 12,286 $ 12,260 $ 12,320 Operating Expenses (9) (5) (5) (5) (80) NOI $ 12,170 $ 12,233 $ 12,281 $ 12,255 $ 12,239 Cash Real Estate Revenues $ 12,374 $ 12,432 $ 12,503 $ 12,729 $ 12,781 Cash Operating Expenses (9) (5) (5) (5) (80) Cash NOI $ 12,365 $ 12,427 $ 12,499 $ 12,725 $ 12,701 Year-Over-Year Three-Month SPP Growth 2.7% 44 Return to TOC
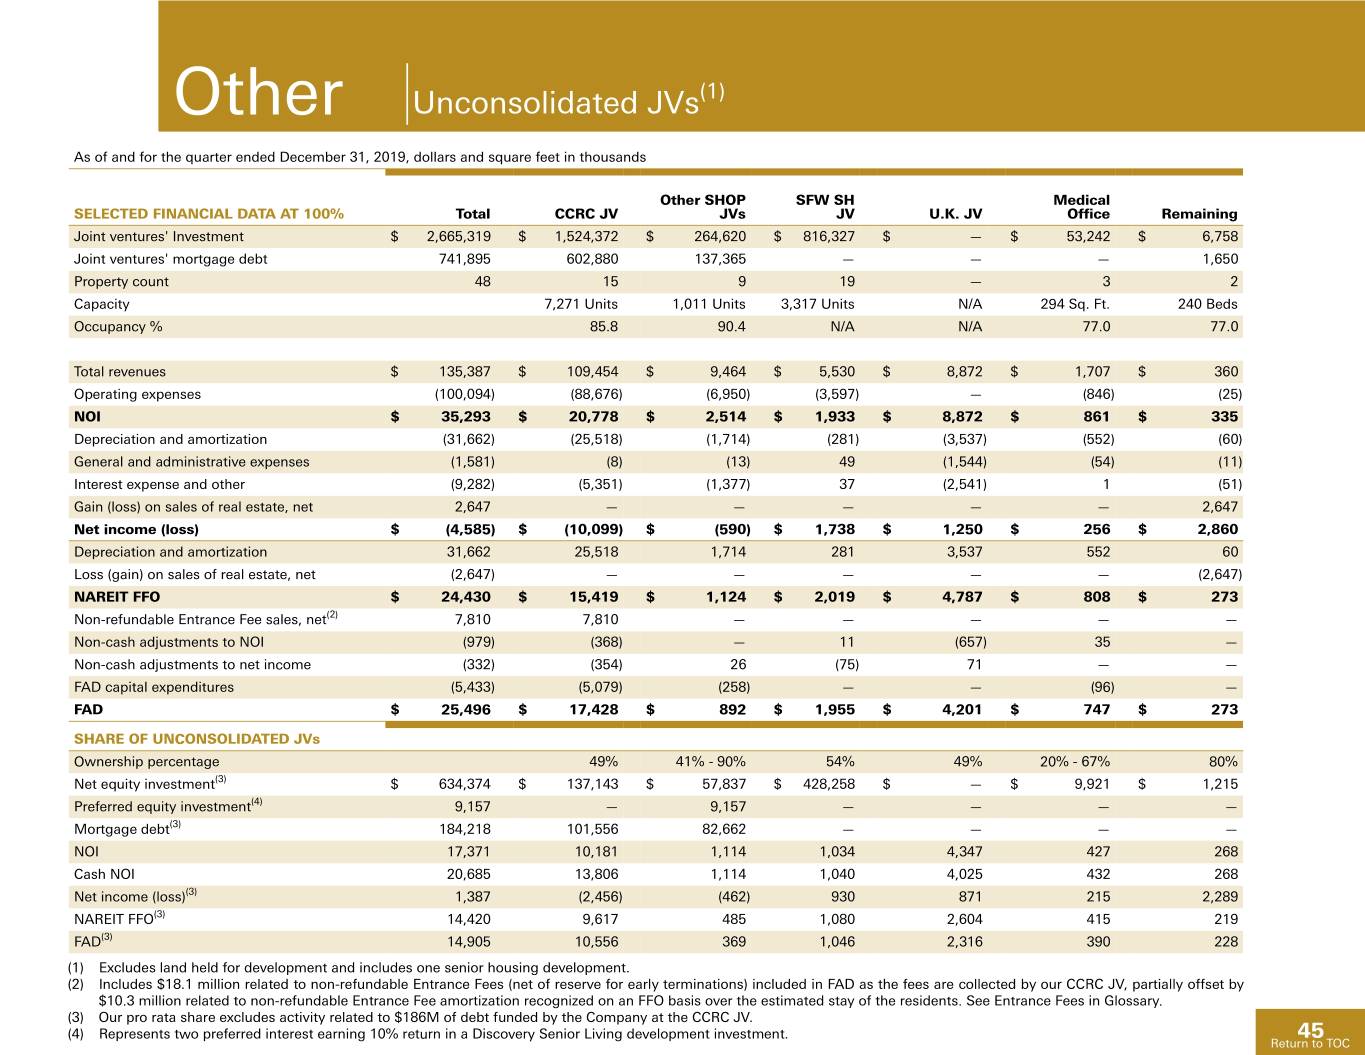
Other Unconsolidated JVs(1) As of and for the quarter ended December 31, 2019, dollars and square feet in thousands Other SHOP SFW SH Medical SELECTED FINANCIAL DATA AT 100% Total CCRC JV JVs JV U.K. JV Office Remaining Joint ventures' Investment $ 2,665,319 $ 1,524,372 $ 264,620 $ 816,327 $ — $ 53,242 $ 6,758 Joint ventures' mortgage debt 741,895 602,880 137,365 — — — 1,650 Property count 48 15 9 19 — 3 2 Capacity 7,271 Units 1,011 Units 3,317 Units N/A 294 Sq. Ft. 240 Beds Occupancy % 85.8 90.4 N/A N/A 77.0 77.0 Total revenues $ 135,387 $ 109,454 $ 9,464 $ 5,530 $ 8,872 $ 1,707 $ 360 Operating expenses (100,094) (88,676) (6,950) (3,597) — (846) (25) NOI $ 35,293 $ 20,778 $ 2,514 $ 1,933 $ 8,872 $ 861 $ 335 Depreciation and amortization (31,662) (25,518) (1,714) (281) (3,537) (552) (60) General and administrative expenses (1,581) (8) (13) 49 (1,544) (54) (11) Interest expense and other (9,282) (5,351) (1,377) 37 (2,541) 1 (51) Gain (loss) on sales of real estate, net 2,647 — — — — — 2,647 Net income (loss) $ (4,585) $ (10,099) $ (590) $ 1,738 $ 1,250 $ 256 $ 2,860 Depreciation and amortization 31,662 25,518 1,714 281 3,537 552 60 Loss (gain) on sales of real estate, net (2,647) — — — — — (2,647) NAREIT FFO $ 24,430 $ 15,419 $ 1,124 $ 2,019 $ 4,787 $ 808 $ 273 Non-refundable Entrance Fee sales, net(2) 7,810 7,810 — — — — — Non-cash adjustments to NOI (979) (368) — 11 (657) 35 — Non-cash adjustments to net income (332) (354) 26 (75) 71 — — FAD capital expenditures (5,433) (5,079) (258) — — (96) — FAD $ 25,496 $ 17,428 $ 892 $ 1,955 $ 4,201 $ 747 $ 273 SHARE OF UNCONSOLIDATED JVs Ownership percentage 49% 41% - 90% 54% 49% 20% - 67% 80% Net equity investment(3) $ 634,374 $ 137,143 $ 57,837 $ 428,258 $ — $ 9,921 $ 1,215 Preferred equity investment(4) 9,157 — 9,157 — — — — Mortgage debt(3) 184,218 101,556 82,662 — — — — NOI 17,371 10,181 1,114 1,034 4,347 427 268 Cash NOI 20,685 13,806 1,114 1,040 4,025 432 268 Net income (loss)(3) 1,387 (2,456) (462) 930 871 215 2,289 NAREIT FFO(3) 14,420 9,617 485 1,080 2,604 415 219 FAD(3) 14,905 10,556 369 1,046 2,316 390 228 (1) Excludes land held for development and includes one senior housing development. (2) Includes $18.1 million related to non-refundable Entrance Fees (net of reserve for early terminations) included in FAD as the fees are collected by our CCRC JV, partially offset by $10.3 million related to non-refundable Entrance Fee amortization recognized on an FFO basis over the estimated stay of the residents. See Entrance Fees in Glossary. (3) Our pro rata share excludes activity related to $186M of debt funded by the Company at the CCRC JV. (4) Represents two preferred interest earning 10% return in a Discovery Senior Living development investment. 45 Return to TOC
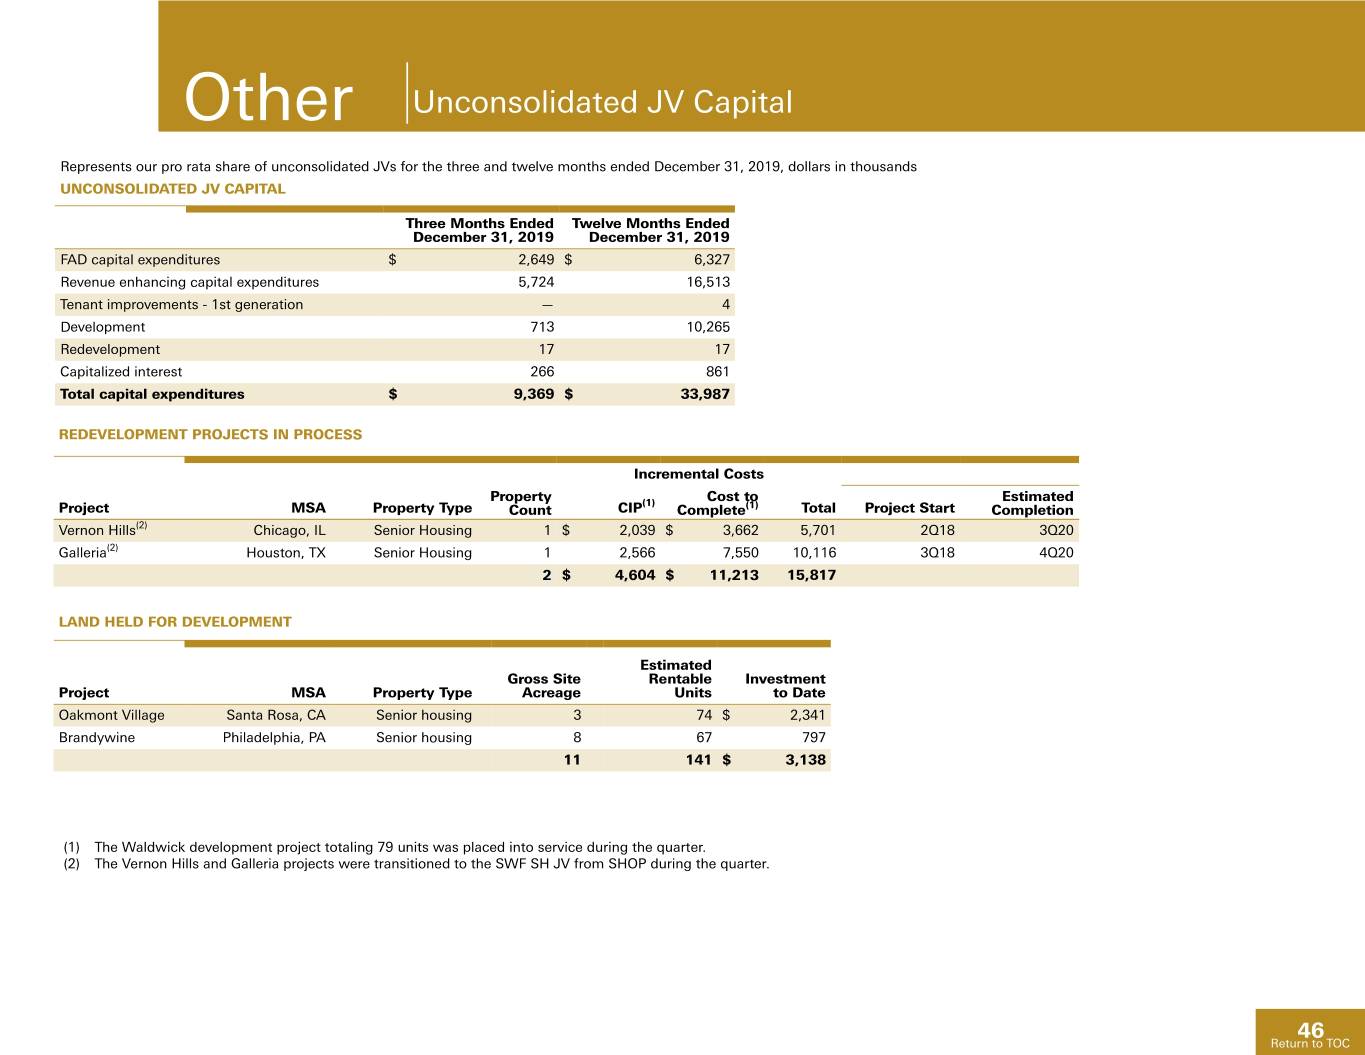
Other Unconsolidated JV Capital Represents our pro rata share of unconsolidated JVs for the three and twelve months ended December 31, 2019, dollars in thousands UNCONSOLIDATED JV CAPITAL Three Months Ended Twelve Months Ended December 31, 2019 December 31, 2019 FAD capital expenditures $ 2,649 $ 6,327 Revenue enhancing capital expenditures 5,724 16,513 Tenant improvements - 1st generation — 4 Development 713 10,265 Redevelopment 17 17 Capitalized interest 266 861 Total capital expenditures $ 9,369 $ 33,987 REDEVELOPMENT PROJECTS IN PROCESS Incremental Costs Property (1) Cost to Estimated Project MSA Property Type Count CIP Complete(1) Total Project Start Completion Vernon Hills(2) Chicago, IL Senior Housing 1 $ 2,039 $ 3,662 5,701 2Q18 3Q20 Galleria(2) Houston, TX Senior Housing 1 2,566 7,550 10,116 3Q18 4Q20 2 $ 4,604 $ 11,213 15,817 LAND HELD FOR DEVELOPMENT Estimated Gross Site Rentable Investment Project MSA Property Type Acreage Units to Date Oakmont Village Santa Rosa, CA Senior housing 3 74 $ 2,341 Brandywine Philadelphia, PA Senior housing 8 67 797 11 141 $ 3,138 (1) The Waldwick development project totaling 79 units was placed into service during the quarter. (2) The Vernon Hills and Galleria projects were transitioned to the SWF SH JV from SHOP during the quarter. 46 Return to TOC
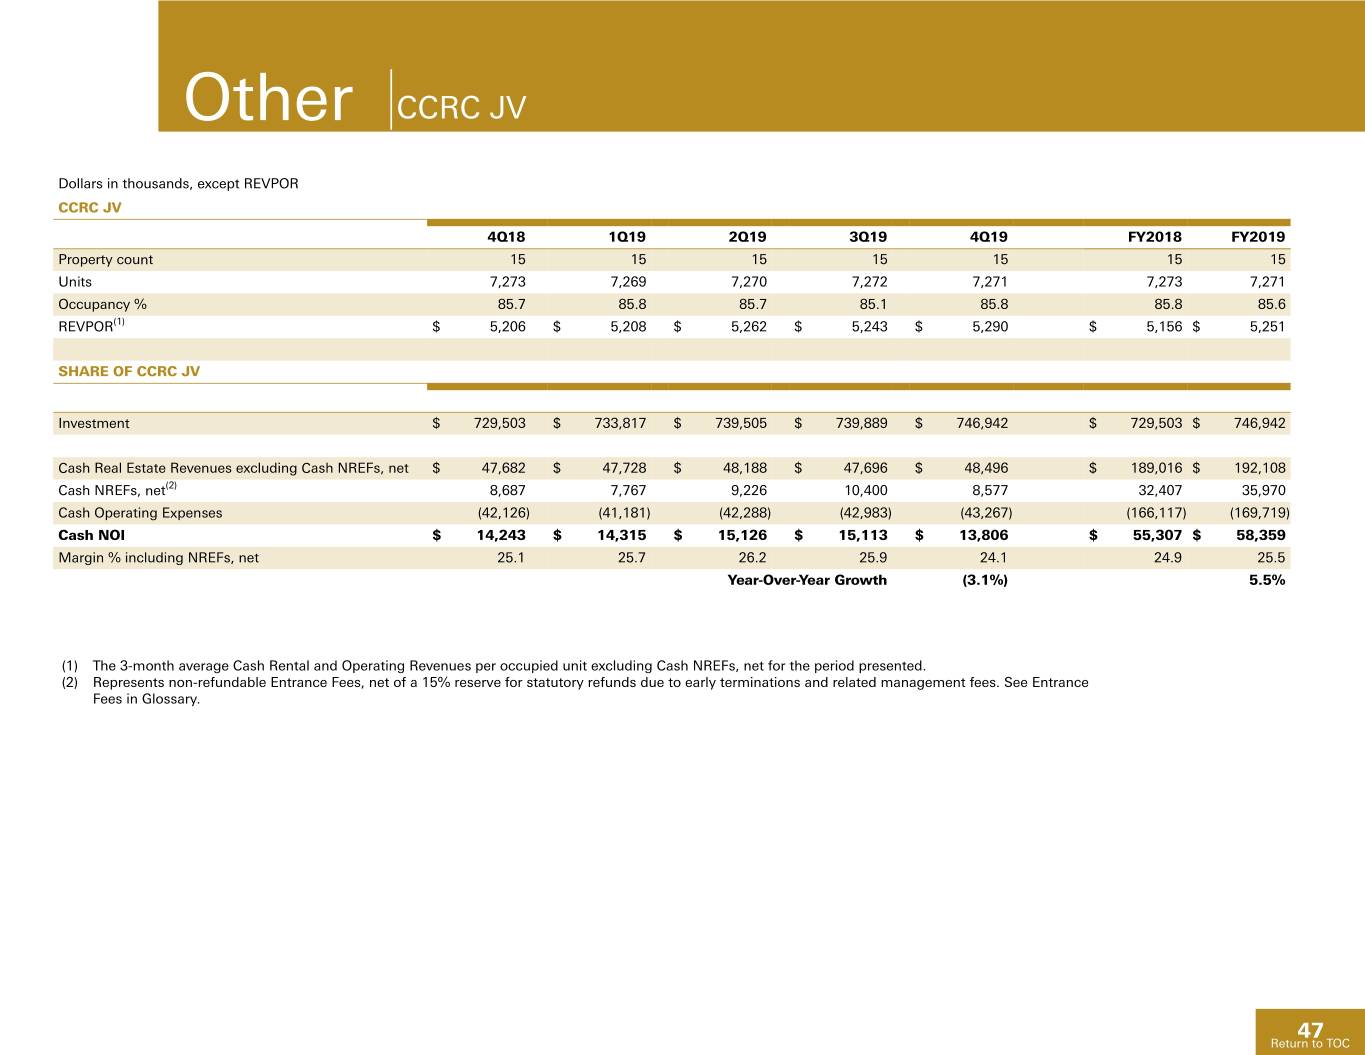
Other CCRC JV Dollars in thousands, except REVPOR CCRC JV 4Q18 1Q19 2Q19 3Q19 4Q19 FY2018 FY2019 Property count 15 15 15 15 15 15 15 Units 7,273 7,269 7,270 7,272 7,271 7,273 7,271 Occupancy % 85.7 85.8 85.7 85.1 85.8 85.8 85.6 REVPOR(1) $ 5,206 $ 5,208 $ 5,262 $ 5,243 $ 5,290 $ 5,156 $ 5,251 SHARE OF CCRC JV Investment $ 729,503 $ 733,817 $ 739,505 $ 739,889 $ 746,942 $ 729,503 $ 746,942 Cash Real Estate Revenues excluding Cash NREFs, net $ 47,682 $ 47,728 $ 48,188 $ 47,696 $ 48,496 $ 189,016 $ 192,108 Cash NREFs, net(2) 8,687 7,767 9,226 10,400 8,577 32,407 35,970 Cash Operating Expenses (42,126) (41,181) (42,288) (42,983) (43,267) (166,117) (169,719) Cash NOI $ 14,243 $ 14,315 $ 15,126 $ 15,113 $ 13,806 $ 55,307 $ 58,359 Margin % including NREFs, net 25.1 25.7 26.2 25.9 24.1 24.9 25.5 Year-Over-Year Growth (3.1%) 5.5% (1) The 3-month average Cash Rental and Operating Revenues per occupied unit excluding Cash NREFs, net for the period presented. (2) Represents non-refundable Entrance Fees, net of a 15% reserve for statutory refunds due to early terminations and related management fees. See Entrance Fees in Glossary. 47 Return to TOC
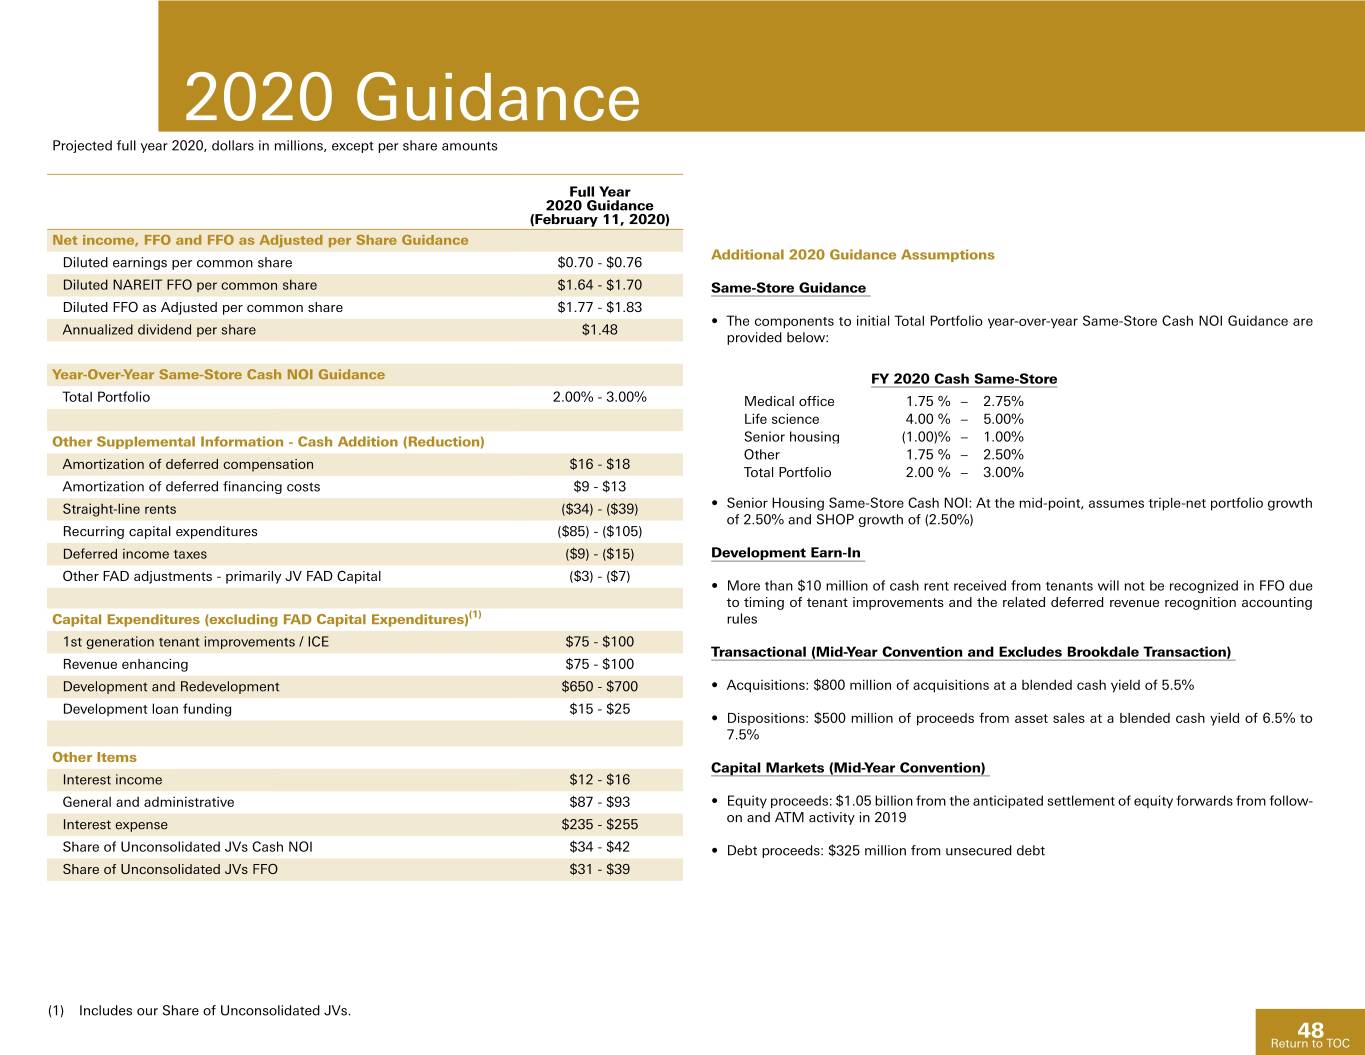
2020 Guidance Projected full year 2020, dollars in millions, except per share amounts Full Year 2020 Guidance (February 11, 2020) Net income, FFO and FFO as Adjusted per Share Guidance Additional 2020 Guidance Assumptions Diluted earnings per common share $0.70 - $0.76 Diluted NAREIT FFO per common share $1.64 - $1.70 Same-Store Guidance Diluted FFO as Adjusted per common share $1.77 - $1.83 • The components to initial Total Portfolio year-over-year Same-Store Cash NOI Guidance are Annualized dividend per share $1.48 provided below: Year-Over-Year Same-Store Cash NOI Guidance FY 2020 Cash Same-Store Total Portfolio 2.00% - 3.00% Medical office 1.75 % – 2.75% Life science 4.00 % – 5.00% Other Supplemental Information - Cash Addition (Reduction) Senior housing (1.00)% – 1.00% Other 1.75 % – 2.50% Amortization of deferred compensation $16 - $18 Total Portfolio 2.00 % – 3.00% Amortization of deferred financing costs $9 - $13 Straight-line rents ($34) - ($39) • Senior Housing Same-Store Cash NOI: At the mid-point, assumes triple-net portfolio growth of 2.50% and SHOP growth of (2.50%) Recurring capital expenditures ($85) - ($105) Deferred income taxes ($9) - ($15) Development Earn-In Other FAD adjustments - primarily JV FAD Capital ($3) - ($7) • More than $10 million of cash rent received from tenants will not be recognized in FFO due to timing of tenant improvements and the related deferred revenue recognition accounting Capital Expenditures (excluding FAD Capital Expenditures)(1) rules 1st generation tenant improvements / ICE $75 - $100 Transactional (Mid-Year Convention and Excludes Brookdale Transaction) Revenue enhancing $75 - $100 Development and Redevelopment $650 - $700 • Acquisitions: $800 million of acquisitions at a blended cash yield of 5.5% Development loan funding $15 - $25 • Dispositions: $500 million of proceeds from asset sales at a blended cash yield of 6.5% to 7.5% Other Items Capital Markets (Mid-Year Convention) Interest income $12 - $16 General and administrative $87 - $93 • Equity proceeds: $1.05 billion from the anticipated settlement of equity forwards from follow- on and ATM activity in 2019 Interest expense $235 - $255 Share of Unconsolidated JVs Cash NOI $34 - $42 • Debt proceeds: $325 million from unsecured debt Share of Unconsolidated JVs FFO $31 - $39 (1) Includes our Share of Unconsolidated JVs. 48 Return to TOC
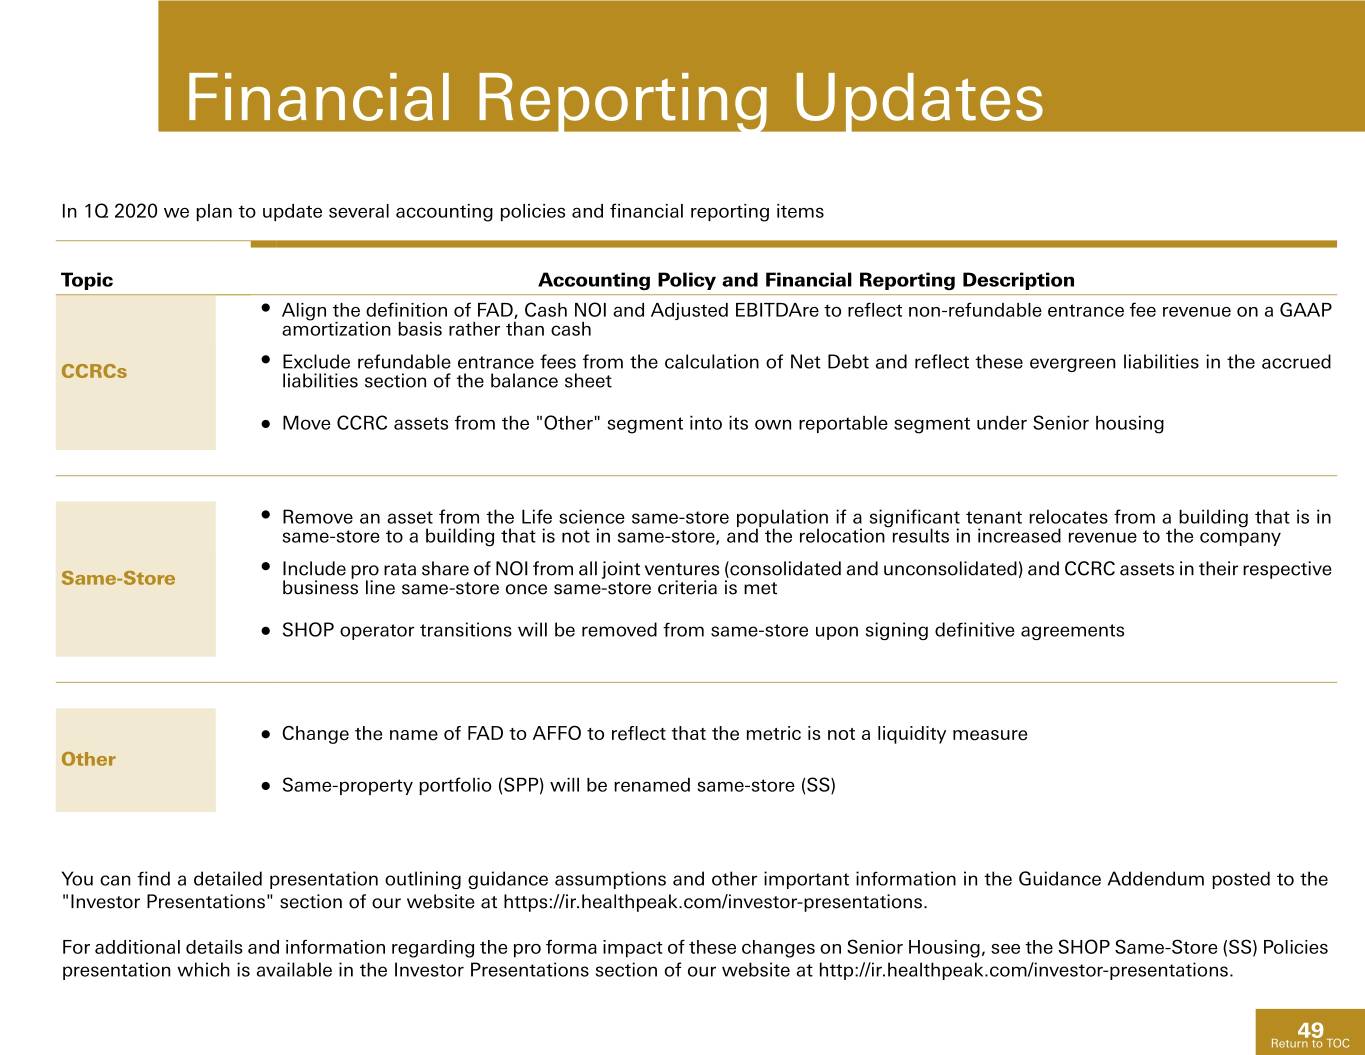
Financial Reporting Updates In 1Q 2020 we plan to update several accounting policies and financial reporting items Topic Accounting Policy and Financial Reporting Description ● Align the definition of FAD, Cash NOI and Adjusted EBITDAre to reflect non-refundable entrance fee revenue on a GAAP amortization basis rather than cash ● Exclude refundable entrance fees from the calculation of Net Debt and reflect these evergreen liabilities in the accrued CCRCs liabilities section of the balance sheet ● Move CCRC assets from the "Other" segment into its own reportable segment under Senior housing ● Remove an asset from the Life science same-store population if a significant tenant relocates from a building that is in same-store to a building that is not in same-store, and the relocation results in increased revenue to the company ● Include pro rata share of NOI from all joint ventures (consolidated and unconsolidated) and CCRC assets in their respective Same-Store business line same-store once same-store criteria is met ● SHOP operator transitions will be removed from same-store upon signing definitive agreements ● Change the name of FAD to AFFO to reflect that the metric is not a liquidity measure Other ● Same-property portfolio (SPP) will be renamed same-store (SS) You can find a detailed presentation outlining guidance assumptions and other important information in the Guidance Addendum posted to the "Investor Presentations" section of our website at https://ir.healthpeak.com/investor-presentations. For additional details and information regarding the pro forma impact of these changes on Senior Housing, see the SHOP Same-Store (SS) Policies presentation which is available in the Investor Presentations section of our website at http://ir.healthpeak.com/investor-presentations. 49 Return to TOC
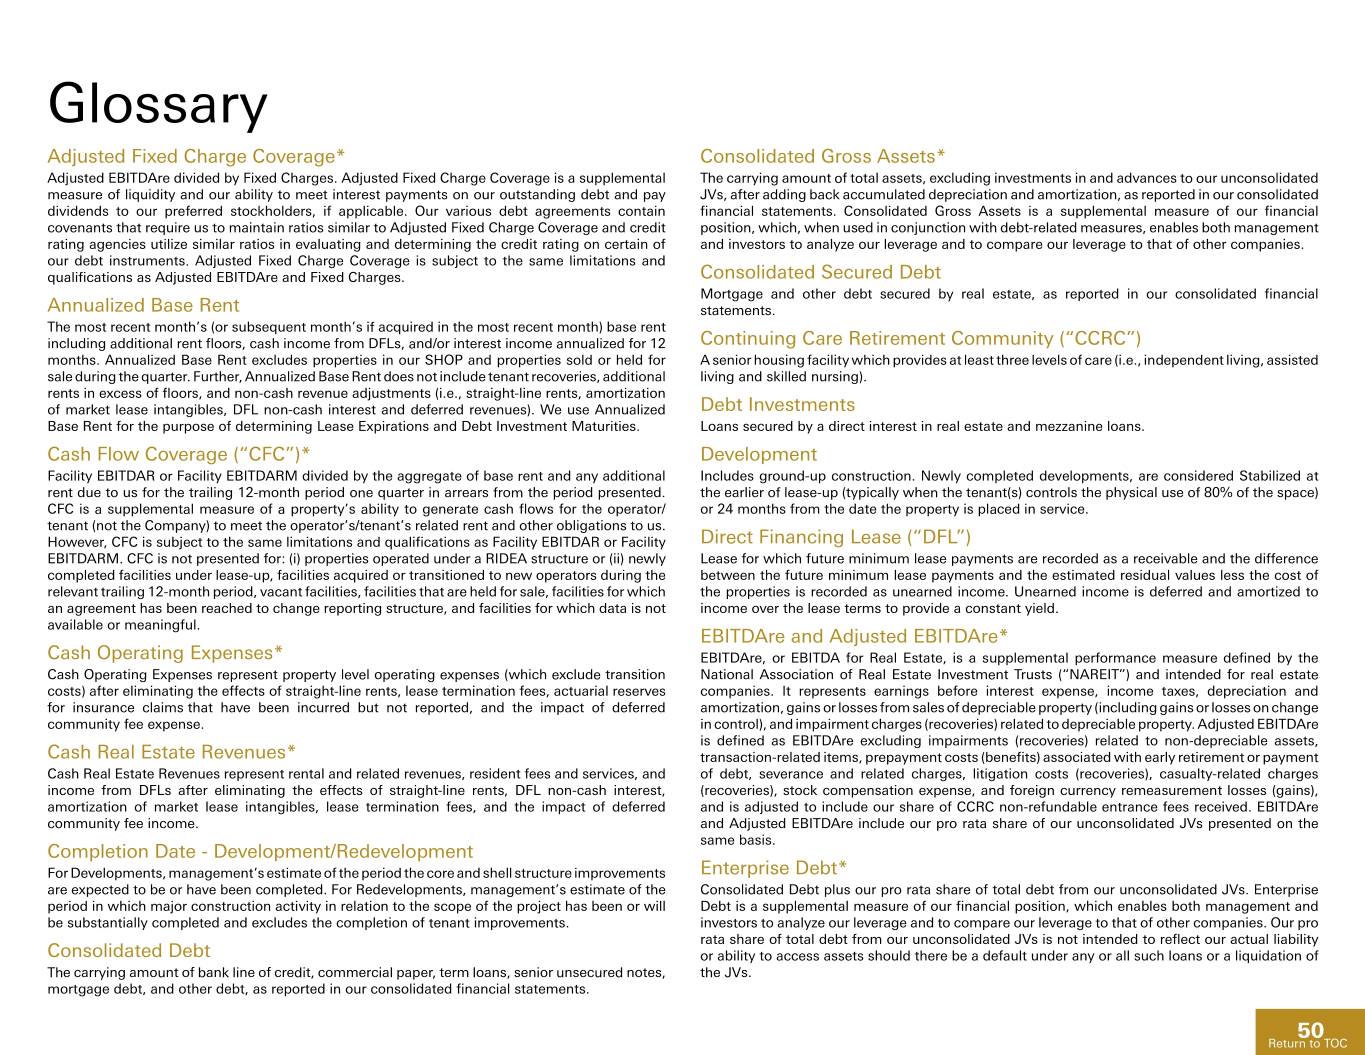
Glossary Adjusted Fixed Charge Coverage* Consolidated Gross Assets* Adjusted EBITDAre divided by Fixed Charges. Adjusted Fixed Charge Coverage is a supplemental The carrying amount of total assets, excluding investments in and advances to our unconsolidated measure of liquidity and our ability to meet interest payments on our outstanding debt and pay JVs, after adding back accumulated depreciation and amortization, as reported in our consolidated dividends to our preferred stockholders, if applicable. Our various debt agreements contain financial statements. Consolidated Gross Assets is a supplemental measure of our financial covenants that require us to maintain ratios similar to Adjusted Fixed Charge Coverage and credit position, which, when used in conjunction with debt-related measures, enables both management rating agencies utilize similar ratios in evaluating and determining the credit rating on certain of and investors to analyze our leverage and to compare our leverage to that of other companies. our debt instruments. Adjusted Fixed Charge Coverage is subject to the same limitations and qualifications as Adjusted EBITDAre and Fixed Charges. Consolidated Secured Debt Mortgage and other debt secured by real estate, as reported in our consolidated financial Annualized Base Rent statements. The most recent month’s (or subsequent month’s if acquired in the most recent month) base rent including additional rent floors, cash income from DFLs, and/or interest income annualized for 12 Continuing Care Retirement Community (“CCRC”) months. Annualized Base Rent excludes properties in our SHOP and properties sold or held for A senior housing facility which provides at least three levels of care (i.e., independent living, assisted sale during the quarter. Further, Annualized Base Rent does not include tenant recoveries, additional living and skilled nursing). rents in excess of floors, and non-cash revenue adjustments (i.e., straight-line rents, amortization of market lease intangibles, DFL non-cash interest and deferred revenues). We use Annualized Debt Investments Base Rent for the purpose of determining Lease Expirations and Debt Investment Maturities. Loans secured by a direct interest in real estate and mezzanine loans. Cash Flow Coverage (“CFC”)* Development Facility EBITDAR or Facility EBITDARM divided by the aggregate of base rent and any additional Includes ground-up construction. Newly completed developments, are considered Stabilized at rent due to us for the trailing 12-month period one quarter in arrears from the period presented. the earlier of lease-up (typically when the tenant(s) controls the physical use of 80% of the space) CFC is a supplemental measure of a property’s ability to generate cash flows for the operator/ or 24 months from the date the property is placed in service. tenant (not the Company) to meet the operator’s/tenant’s related rent and other obligations to us. However, CFC is subject to the same limitations and qualifications as Facility EBITDAR or Facility Direct Financing Lease (“DFL”) EBITDARM. CFC is not presented for: (i) properties operated under a RIDEA structure or (ii) newly Lease for which future minimum lease payments are recorded as a receivable and the difference completed facilities under lease-up, facilities acquired or transitioned to new operators during the between the future minimum lease payments and the estimated residual values less the cost of relevant trailing 12-month period, vacant facilities, facilities that are held for sale, facilities for which the properties is recorded as unearned income. Unearned income is deferred and amortized to an agreement has been reached to change reporting structure, and facilities for which data is not income over the lease terms to provide a constant yield. available or meaningful. EBITDAre and Adjusted EBITDAre* Cash Operating Expenses* EBITDAre, or EBITDA for Real Estate, is a supplemental performance measure defined by the Cash Operating Expenses represent property level operating expenses (which exclude transition National Association of Real Estate Investment Trusts (“NAREIT”) and intended for real estate costs) after eliminating the effects of straight-line rents, lease termination fees, actuarial reserves companies. It represents earnings before interest expense, income taxes, depreciation and for insurance claims that have been incurred but not reported, and the impact of deferred amortization, gains or losses from sales of depreciable property (including gains or losses on change community fee expense. in control), and impairment charges (recoveries) related to depreciable property. Adjusted EBITDAre is defined as EBITDAre excluding impairments (recoveries) related to non-depreciable assets, Cash Real Estate Revenues* transaction-related items, prepayment costs (benefits) associated with early retirement or payment Cash Real Estate Revenues represent rental and related revenues, resident fees and services, and of debt, severance and related charges, litigation costs (recoveries), casualty-related charges income from DFLs after eliminating the effects of straight-line rents, DFL non-cash interest, (recoveries), stock compensation expense, and foreign currency remeasurement losses (gains), amortization of market lease intangibles, lease termination fees, and the impact of deferred and is adjusted to include our share of CCRC non-refundable entrance fees received. EBITDAre community fee income. and Adjusted EBITDAre include our pro rata share of our unconsolidated JVs presented on the same basis. Completion Date - Development/Redevelopment For Developments, management’s estimate of the period the core and shell structure improvements Enterprise Debt* are expected to be or have been completed. For Redevelopments, management’s estimate of the Consolidated Debt plus our pro rata share of total debt from our unconsolidated JVs. Enterprise period in which major construction activity in relation to the scope of the project has been or will Debt is a supplemental measure of our financial position, which enables both management and be substantially completed and excludes the completion of tenant improvements. investors to analyze our leverage and to compare our leverage to that of other companies. Our pro rata share of total debt from our unconsolidated JVs is not intended to reflect our actual liability Consolidated Debt or ability to access assets should there be a default under any or all such loans or a liquidation of The carrying amount of bank line of credit, commercial paper, term loans, senior unsecured notes, the JVs. mortgage debt, and other debt, as reported in our consolidated financial statements. 50 ReturnReturn to to TOC TOC
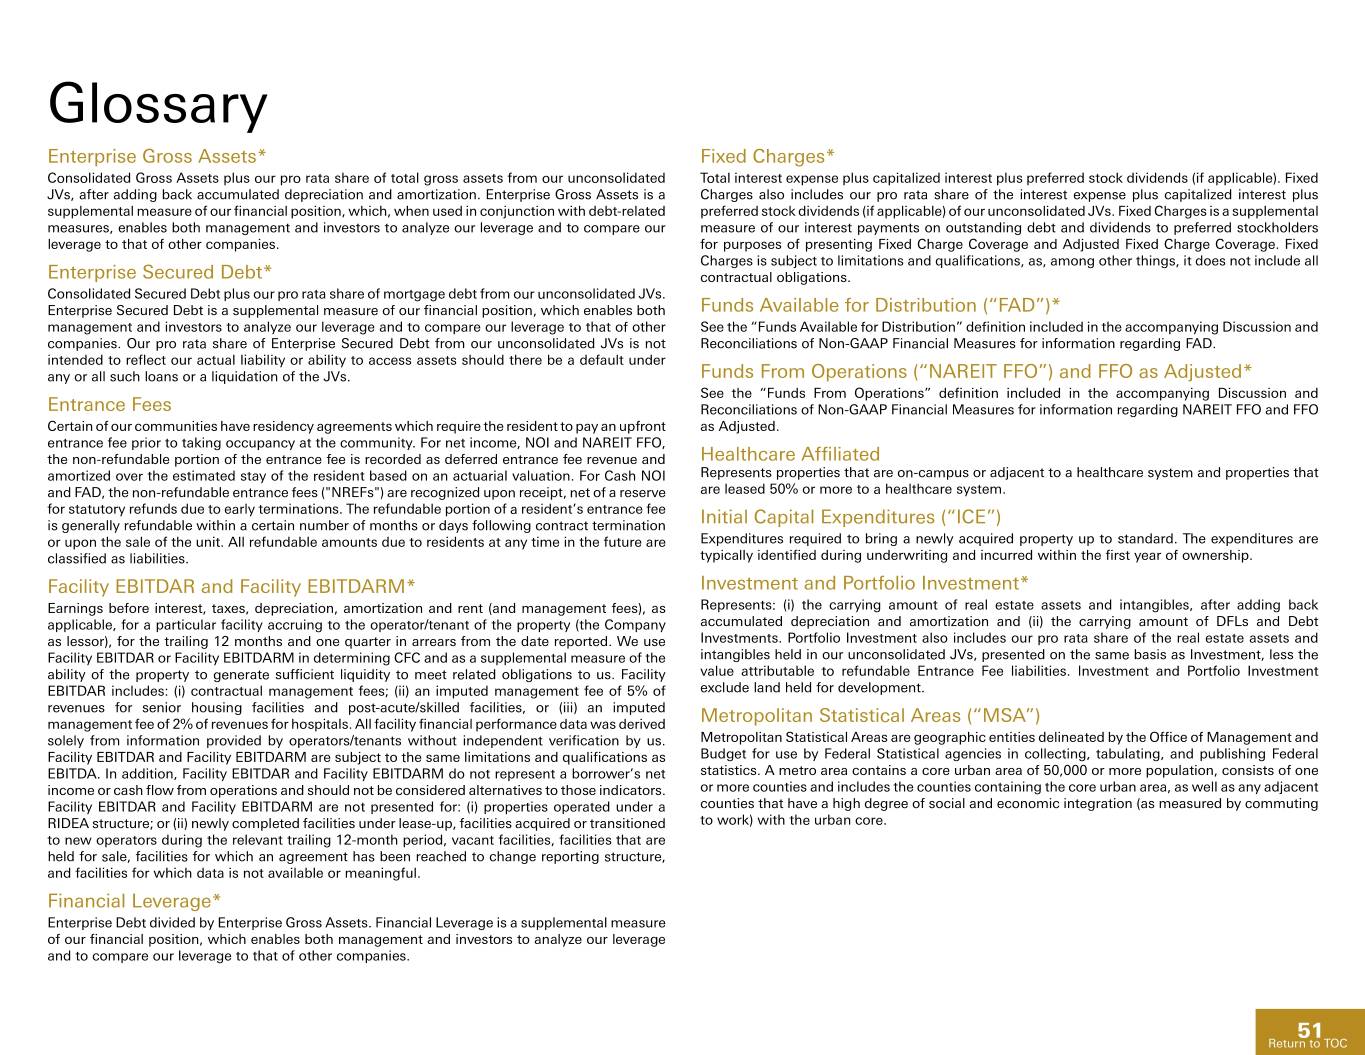
Glossary Enterprise Gross Assets* Fixed Charges* Consolidated Gross Assets plus our pro rata share of total gross assets from our unconsolidated Total interest expense plus capitalized interest plus preferred stock dividends (if applicable). Fixed JVs, after adding back accumulated depreciation and amortization. Enterprise Gross Assets is a Charges also includes our pro rata share of the interest expense plus capitalized interest plus supplemental measure of our financial position, which, when used in conjunction with debt-related preferred stock dividends (if applicable) of our unconsolidated JVs. Fixed Charges is a supplemental measures, enables both management and investors to analyze our leverage and to compare our measure of our interest payments on outstanding debt and dividends to preferred stockholders leverage to that of other companies. for purposes of presenting Fixed Charge Coverage and Adjusted Fixed Charge Coverage. Fixed Charges is subject to limitations and qualifications, as, among other things, it does not include all Enterprise Secured Debt* contractual obligations. Consolidated Secured Debt plus our pro rata share of mortgage debt from our unconsolidated JVs. Enterprise Secured Debt is a supplemental measure of our financial position, which enables both Funds Available for Distribution (“FAD”)* management and investors to analyze our leverage and to compare our leverage to that of other See the “Funds Available for Distribution” definition included in the accompanying Discussion and companies. Our pro rata share of Enterprise Secured Debt from our unconsolidated JVs is not Reconciliations of Non-GAAP Financial Measures for information regarding FAD. intended to reflect our actual liability or ability to access assets should there be a default under any or all such loans or a liquidation of the JVs. Funds From Operations (“NAREIT FFO”) and FFO as Adjusted* See the “Funds From Operations” definition included in the accompanying Discussion and Entrance Fees Reconciliations of Non-GAAP Financial Measures for information regarding NAREIT FFO and FFO Certain of our communities have residency agreements which require the resident to pay an upfront as Adjusted. entrance fee prior to taking occupancy at the community. For net income, NOI and NAREIT FFO, the non-refundable portion of the entrance fee is recorded as deferred entrance fee revenue and Healthcare Affiliated amortized over the estimated stay of the resident based on an actuarial valuation. For Cash NOI Represents properties that are on-campus or adjacent to a healthcare system and properties that and FAD, the non-refundable entrance fees ("NREFs") are recognized upon receipt, net of a reserve are leased 50% or more to a healthcare system. for statutory refunds due to early terminations. The refundable portion of a resident’s entrance fee is generally refundable within a certain number of months or days following contract termination Initial Capital Expenditures (“ICE”) or upon the sale of the unit. All refundable amounts due to residents at any time in the future are Expenditures required to bring a newly acquired property up to standard. The expenditures are classified as liabilities. typically identified during underwriting and incurred within the first year of ownership. Facility EBITDAR and Facility EBITDARM* Investment and Portfolio Investment* Earnings before interest, taxes, depreciation, amortization and rent (and management fees), as Represents: (i) the carrying amount of real estate assets and intangibles, after adding back applicable, for a particular facility accruing to the operator/tenant of the property (the Company accumulated depreciation and amortization and (ii) the carrying amount of DFLs and Debt as lessor), for the trailing 12 months and one quarter in arrears from the date reported. We use Investments. Portfolio Investment also includes our pro rata share of the real estate assets and Facility EBITDAR or Facility EBITDARM in determining CFC and as a supplemental measure of the intangibles held in our unconsolidated JVs, presented on the same basis as Investment, less the ability of the property to generate sufficient liquidity to meet related obligations to us. Facility value attributable to refundable Entrance Fee liabilities. Investment and Portfolio Investment EBITDAR includes: (i) contractual management fees; (ii) an imputed management fee of 5% of exclude land held for development. revenues for senior housing facilities and post-acute/skilled facilities, or (iii) an imputed management fee of 2% of revenues for hospitals. All facility financial performance data was derived Metropolitan Statistical Areas (“MSA”) solely from information provided by operators/tenants without independent verification by us. Metropolitan Statistical Areas are geographic entities delineated by the Office of Management and Facility EBITDAR and Facility EBITDARM are subject to the same limitations and qualifications as Budget for use by Federal Statistical agencies in collecting, tabulating, and publishing Federal EBITDA. In addition, Facility EBITDAR and Facility EBITDARM do not represent a borrower’s net statistics. A metro area contains a core urban area of 50,000 or more population, consists of one income or cash flow from operations and should not be considered alternatives to those indicators. or more counties and includes the counties containing the core urban area, as well as any adjacent Facility EBITDAR and Facility EBITDARM are not presented for: (i) properties operated under a counties that have a high degree of social and economic integration (as measured by commuting RIDEA structure; or (ii) newly completed facilities under lease-up, facilities acquired or transitioned to work) with the urban core. to new operators during the relevant trailing 12-month period, vacant facilities, facilities that are held for sale, facilities for which an agreement has been reached to change reporting structure, and facilities for which data is not available or meaningful. Financial Leverage* Enterprise Debt divided by Enterprise Gross Assets. Financial Leverage is a supplemental measure of our financial position, which enables both management and investors to analyze our leverage and to compare our leverage to that of other companies. 51 ReturnReturn to to TOC TOC
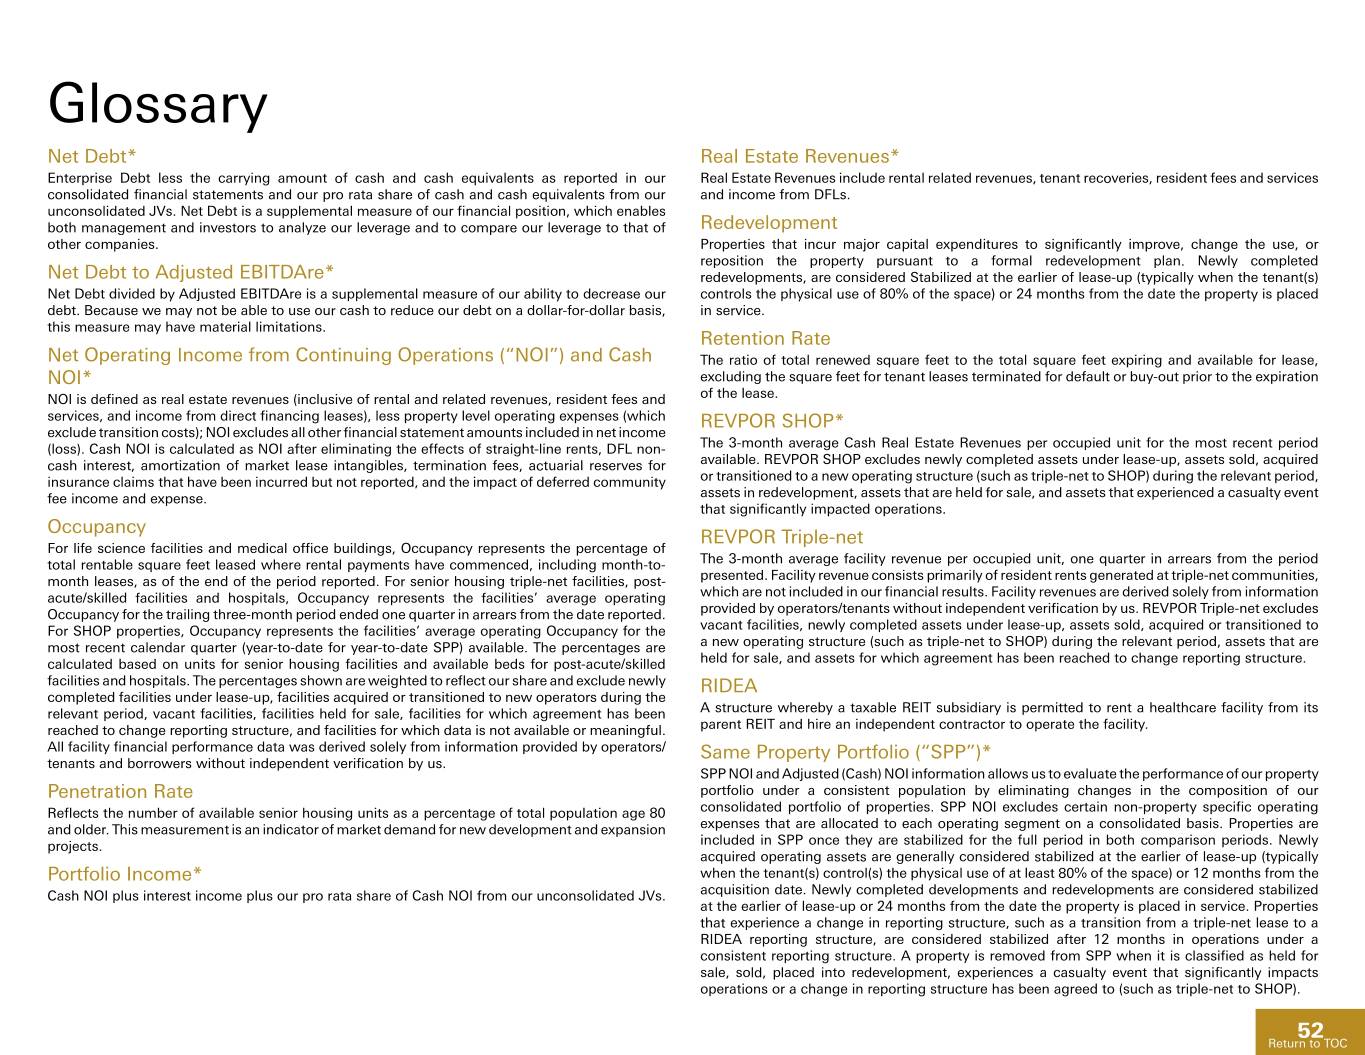
Glossary Net Debt* Real Estate Revenues* Enterprise Debt less the carrying amount of cash and cash equivalents as reported in our Real Estate Revenues include rental related revenues, tenant recoveries, resident fees and services consolidated financial statements and our pro rata share of cash and cash equivalents from our and income from DFLs. unconsolidated JVs. Net Debt is a supplemental measure of our financial position, which enables both management and investors to analyze our leverage and to compare our leverage to that of Redevelopment other companies. Properties that incur major capital expenditures to significantly improve, change the use, or reposition the property pursuant to a formal redevelopment plan. Newly completed Net Debt to Adjusted EBITDAre* redevelopments, are considered Stabilized at the earlier of lease-up (typically when the tenant(s) Net Debt divided by Adjusted EBITDAre is a supplemental measure of our ability to decrease our controls the physical use of 80% of the space) or 24 months from the date the property is placed debt. Because we may not be able to use our cash to reduce our debt on a dollar-for-dollar basis, in service. this measure may have material limitations. Retention Rate Net Operating Income from Continuing Operations (“NOI”) and Cash The ratio of total renewed square feet to the total square feet expiring and available for lease, NOI* excluding the square feet for tenant leases terminated for default or buy-out prior to the expiration NOI is defined as real estate revenues (inclusive of rental and related revenues, resident fees and of the lease. services, and income from direct financing leases), less property level operating expenses (which REVPOR SHOP* exclude transition costs); NOI excludes all other financial statement amounts included in net income (loss). Cash NOI is calculated as NOI after eliminating the effects of straight-line rents, DFL non- The 3-month average Cash Real Estate Revenues per occupied unit for the most recent period cash interest, amortization of market lease intangibles, termination fees, actuarial reserves for available. REVPOR SHOP excludes newly completed assets under lease-up, assets sold, acquired insurance claims that have been incurred but not reported, and the impact of deferred community or transitioned to a new operating structure (such as triple-net to SHOP) during the relevant period, fee income and expense. assets in redevelopment, assets that are held for sale, and assets that experienced a casualty event that significantly impacted operations. Occupancy REVPOR Triple-net For life science facilities and medical office buildings, Occupancy represents the percentage of total rentable square feet leased where rental payments have commenced, including month-to- The 3-month average facility revenue per occupied unit, one quarter in arrears from the period month leases, as of the end of the period reported. For senior housing triple-net facilities, post- presented. Facility revenue consists primarily of resident rents generated at triple-net communities, acute/skilled facilities and hospitals, Occupancy represents the facilities’ average operating which are not included in our financial results. Facility revenues are derived solely from information Occupancy for the trailing three-month period ended one quarter in arrears from the date reported. provided by operators/tenants without independent verification by us. REVPOR Triple-net excludes For SHOP properties, Occupancy represents the facilities’ average operating Occupancy for the vacant facilities, newly completed assets under lease-up, assets sold, acquired or transitioned to most recent calendar quarter (year-to-date for year-to-date SPP) available. The percentages are a new operating structure (such as triple-net to SHOP) during the relevant period, assets that are calculated based on units for senior housing facilities and available beds for post-acute/skilled held for sale, and assets for which agreement has been reached to change reporting structure. facilities and hospitals. The percentages shown are weighted to reflect our share and exclude newly RIDEA completed facilities under lease-up, facilities acquired or transitioned to new operators during the relevant period, vacant facilities, facilities held for sale, facilities for which agreement has been A structure whereby a taxable REIT subsidiary is permitted to rent a healthcare facility from its reached to change reporting structure, and facilities for which data is not available or meaningful. parent REIT and hire an independent contractor to operate the facility. All facility financial performance data was derived solely from information provided by operators/ Same Property Portfolio (“SPP”)* tenants and borrowers without independent verification by us. SPP NOI and Adjusted (Cash) NOI information allows us to evaluate the performance of our property Penetration Rate portfolio under a consistent population by eliminating changes in the composition of our Reflects the number of available senior housing units as a percentage of total population age 80 consolidated portfolio of properties. SPP NOI excludes certain non-property specific operating and older. This measurement is an indicator of market demand for new development and expansion expenses that are allocated to each operating segment on a consolidated basis. Properties are projects. included in SPP once they are stabilized for the full period in both comparison periods. Newly acquired operating assets are generally considered stabilized at the earlier of lease-up (typically Portfolio Income* when the tenant(s) control(s) the physical use of at least 80% of the space) or 12 months from the Cash NOI plus interest income plus our pro rata share of Cash NOI from our unconsolidated JVs. acquisition date. Newly completed developments and redevelopments are considered stabilized at the earlier of lease-up or 24 months from the date the property is placed in service. Properties that experience a change in reporting structure, such as a transition from a triple-net lease to a RIDEA reporting structure, are considered stabilized after 12 months in operations under a consistent reporting structure. A property is removed from SPP when it is classified as held for sale, sold, placed into redevelopment, experiences a casualty event that significantly impacts operations or a change in reporting structure has been agreed to (such as triple-net to SHOP). 52 ReturnReturn to to TOC TOC
Glossary Secured Debt Ratio* Enterprise Secured Debt divided by Enterprise Gross Assets. Secured Debt Ratio is a supplemental measure of our financial position, which enables both management and investors to analyze our leverage and to compare our leverage to that of other companies. Share of Unconsolidated Joint Ventures ("JVs") Our pro rata share information is prepared on a basis consistent with the comparable consolidated amounts by applying our actual ownership percentage for the period and is intended to reflect our proportionate economic interest in the financial position and operating results of properties in our portfolio. Stabilized / Stabilization Newly acquired operating assets are generally considered Stabilized at the earlier of lease-up (typically when the tenant(s) control(s) the physical use of at least 80% of the space) or 12 months from the acquisition date. Newly completed developments and redevelopments are considered Stabilized at the earlier of lease-up or 24 months from the date the property is placed in service. Properties that experience a change in reporting structure, such as a transition from a triple-net lease to a RIDEA reporting structure, are considered stabilized after 12 months in operations under a consistent reporting structure. Total Market Equity The total number of outstanding shares of our common stock multiplied by the closing price per share of our common stock on the New York Stock Exchange as of period end, plus the total number of convertible partnership units multiplied by the closing price per share of our common stock on the New York Stock Exchange as of period end (adjusted for stock splits). Units/Square Feet/Beds Senior housing facilities are measured in available units (e.g., studio, one or two bedroom units). Life science facilities and medical office buildings are measured in square feet, excluding square footage for development or redevelopment properties prior to completion. Post-acute/skilled facilities and hospitals are measured in available beds. Capacities are presented at 100%. * Non-GAAP Supplemental Measures Reconciliations, definitions, and important discussions regarding the usefulness and limitations of the Non-GAAP Financial Measures used in this report can be found at http://ir.healthpeak.com/quarterly-results. 53 ReturnReturn to to TOC TOC
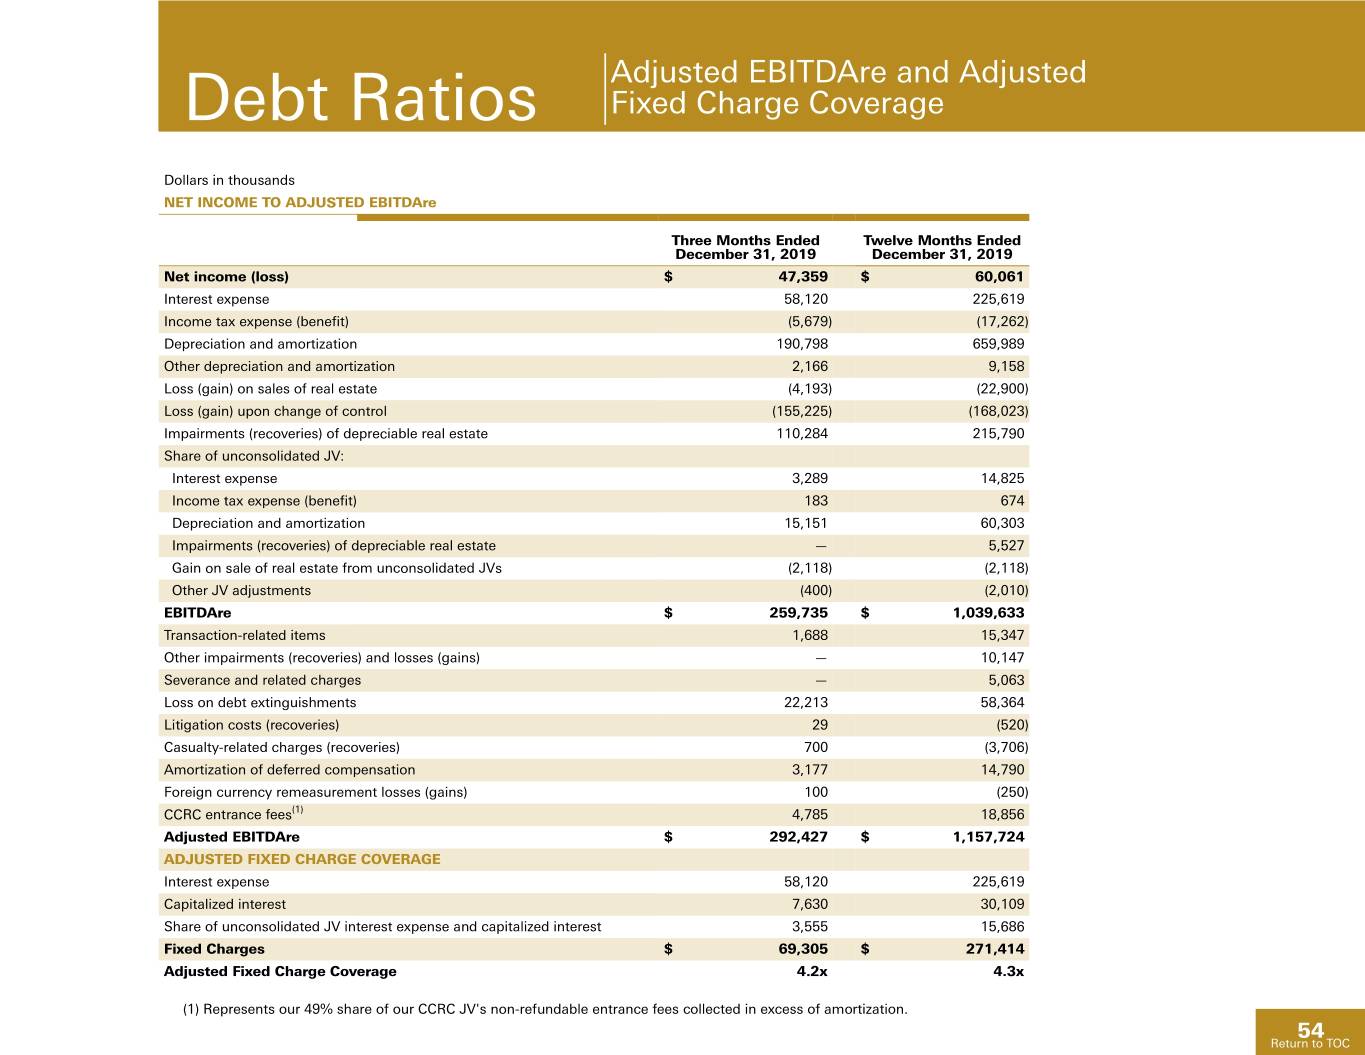
Adjusted EBITDAre and Adjusted Debt Ratios Fixed Charge Coverage Dollars in thousands NET INCOME TO ADJUSTED EBITDAre Three Months Ended Twelve Months Ended December 31, 2019 December 31, 2019 Net income (loss) $ 47,359 $ 60,061 Interest expense 58,120 225,619 Income tax expense (benefit) (5,679) (17,262) Depreciation and amortization 190,798 659,989 Other depreciation and amortization 2,166 9,158 Loss (gain) on sales of real estate (4,193) (22,900) Loss (gain) upon change of control (155,225) (168,023) Impairments (recoveries) of depreciable real estate 110,284 215,790 Share of unconsolidated JV: Interest expense 3,289 14,825 Income tax expense (benefit) 183 674 Depreciation and amortization 15,151 60,303 Impairments (recoveries) of depreciable real estate — 5,527 Gain on sale of real estate from unconsolidated JVs (2,118) (2,118) Other JV adjustments (400) (2,010) EBITDAre $ 259,735 $ 1,039,633 Transaction-related items 1,688 15,347 Other impairments (recoveries) and losses (gains) — 10,147 Severance and related charges — 5,063 Loss on debt extinguishments 22,213 58,364 Litigation costs (recoveries) 29 (520) Casualty-related charges (recoveries) 700 (3,706) Amortization of deferred compensation 3,177 14,790 Foreign currency remeasurement losses (gains) 100 (250) CCRC entrance fees(1) 4,785 18,856 Adjusted EBITDAre $ 292,427 $ 1,157,724 ADJUSTED FIXED CHARGE COVERAGE Interest expense 58,120 225,619 Capitalized interest 7,630 30,109 Share of unconsolidated JV interest expense and capitalized interest 3,555 15,686 Fixed Charges $ 69,305 $ 271,414 Adjusted Fixed Charge Coverage 4.2x 4.3x (1) Represents our 49% share of our CCRC JV's non-refundable entrance fees collected in excess of amortization. 54 Return to TOC
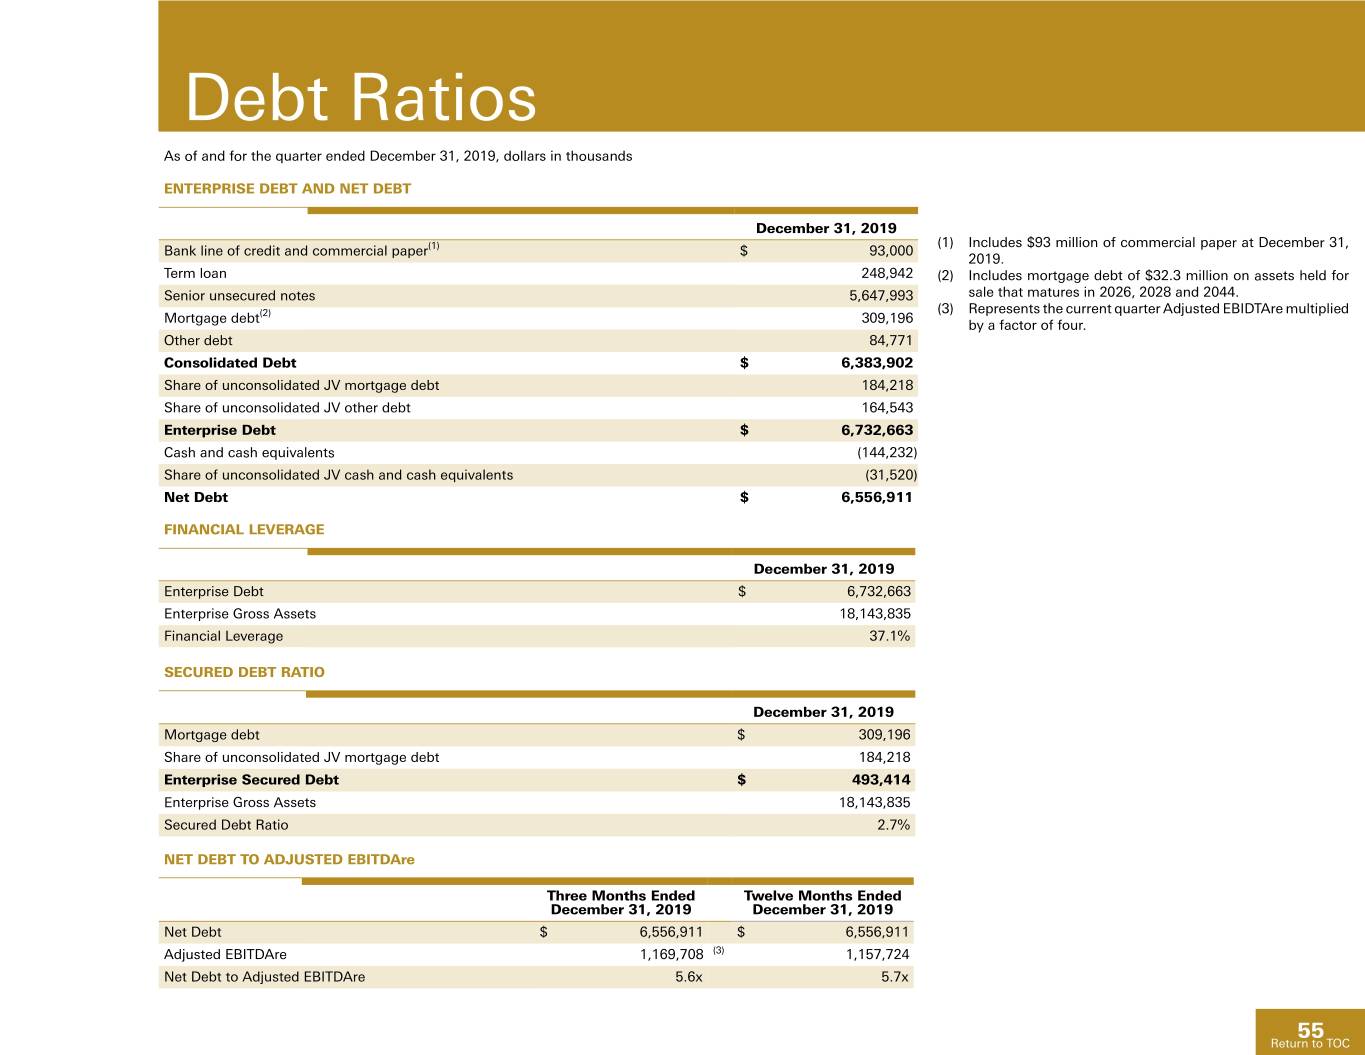
Debt Ratios As of and for the quarter ended December 31, 2019, dollars in thousands ENTERPRISE DEBT AND NET DEBT December 31, 2019 (1) Includes $93 million of commercial paper at December 31, Bank line of credit and commercial paper(1) $ 93,000 2019. Term loan 248,942 (2) Includes mortgage debt of $32.3 million on assets held for Senior unsecured notes 5,647,993 sale that matures in 2026, 2028 and 2044. (3) Represents the current quarter Adjusted EBIDTAre multiplied Mortgage debt(2) 309,196 by a factor of four. Other debt 84,771 Consolidated Debt $ 6,383,902 Share of unconsolidated JV mortgage debt 184,218 Share of unconsolidated JV other debt 164,543 Enterprise Debt $ 6,732,663 Cash and cash equivalents (144,232) Share of unconsolidated JV cash and cash equivalents (31,520) Net Debt $ 6,556,911 FINANCIAL LEVERAGE December 31, 2019 Enterprise Debt $ 6,732,663 Enterprise Gross Assets 18,143,835 Financial Leverage 37.1% SECURED DEBT RATIO December 31, 2019 Mortgage debt $ 309,196 Share of unconsolidated JV mortgage debt 184,218 Enterprise Secured Debt $ 493,414 Enterprise Gross Assets 18,143,835 Secured Debt Ratio 2.7% NET DEBT TO ADJUSTED EBITDAre Three Months Ended Twelve Months Ended December 31, 2019 December 31, 2019 Net Debt $ 6,556,911 $ 6,556,911 Adjusted EBITDAre 1,169,708 (3) 1,157,724 Net Debt to Adjusted EBITDAre 5.6x 5.7x 55 Return to TOC

COMPANY Information BOARD OF DIRECTORS BRIAN G. CARTWRIGHT DAVID B. HENRY Chairman of the Board, Healthpeak Properties, Inc. Former Vice Chairman and Chief Executive Officer, Former General Counsel, Kimco Realty Corporation U.S. Securities and Exchange Commission LYDIA H. KENNARD THOMAS M. HERZOG President and Chief Executive Officer, Chief Executive Officer, Healthpeak Properties, Inc. KDG Construction Consulting CHRISTINE N. GARVEY SARA GROOTWASSINK LEWIS Former Global Head of Corporate Founder and Chief Executive Officer, Real Estate Services, Deutsche Bank AG Lewis Corporate Advisors, LLC R. KENT GRIFFIN, JR. KATHERINE M. SANDSTROM Managing Director, PHICAS Investors Former Senior Managing Director, Former President, BioMed Realty Trust, Inc. Heitman, LLC EXECUTIVE MANAGEMENT THOMAS M. HERZOG PETER A. SCOTT Chief Executive Officer Executive Vice President Chief Financial Officer SCOTT M. BRINKER President SHAWN G. JOHNSTON Chief Investment Officer Executive Vice President Chief Accounting Officer THOMAS M. KLARITCH Executive Vice President JEFFREY H. MILLER Chief Development Officer Executive Vice President, Chief Operating Officer Senior Housing TROY E. MCHENRY LISA A. ALONSO Executive Vice President Executive Vice President Chief Legal Officer Chief Human Resources Officer General Counsel Corporate Secretary 56 ReturnReturn to to TOC TOC
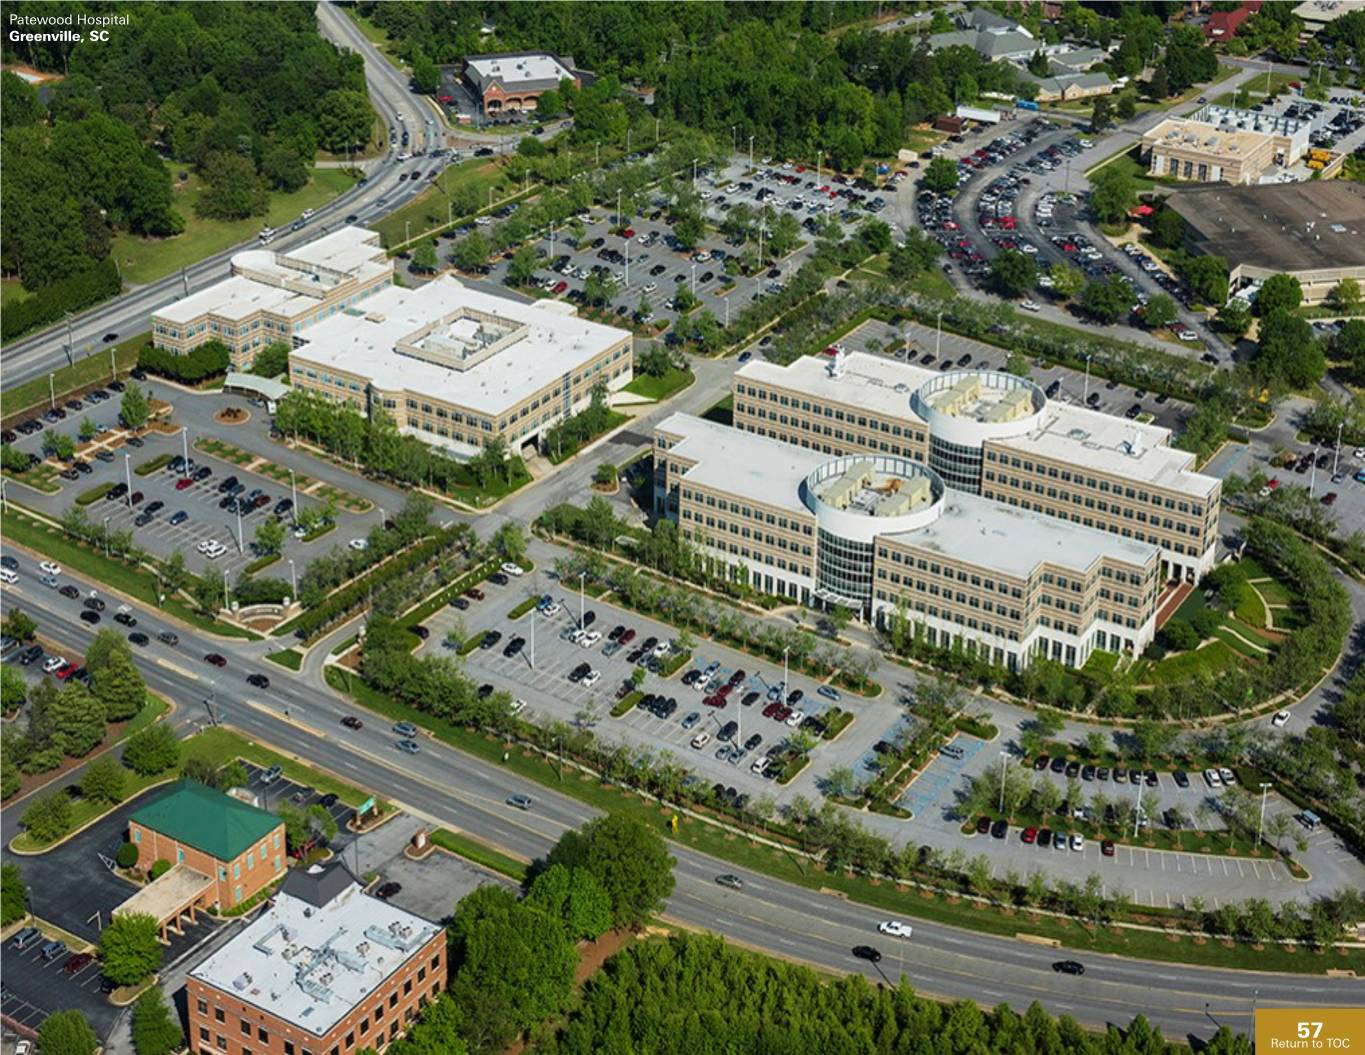
Patewood Hospital Greenville, SC 57 ReturnReturn toto TOCTOC
Medical City Hospital Forward-Looking Statements Dallas, TX & Risk Factors Statements contained in this supplemental report which are not historical facts are "forward- looking statements" within the meaning of Section 27A of the Securities Act of 1933, as amended, and Section 21E of the Securities Exchange Act of 1934, as amended. Forward- looking statements include, among other things, statements regarding our and our officers’ intent, belief or expectation as identified by the use of words such as “may,” “will,” “project,” “expect,” “believe,” “intend,” “anticipate,” “seek,” “target,” “forecast,” “plan,” “potential,” “estimate,” “could,” “would,” “should” and other comparable and derivative terms or the negatives thereof. Examples of forward-looking statements include, among other things: (i) statements regarding timing, outcomes and other details relating to current, pending or contemplated acquisitions, dispositions, transitions, developments, redevelopments, joint venture transactions, capital recycling plans, financing activities, or other transactions; (ii) future new supply and demographics; and (iii) the Company’s 2020 guidance and assumptions with respect thereto. Forward-looking statements reflect our current expectations and views about future events and are subject to risks and uncertainties that could significantly affect our future financial condition and results of operations. While forward-looking statements reflect our good faith belief and assumptions we believe to be reasonable based upon current information, we can give no assurance that our expectations or forecasts will be attained. Further, we cannot guarantee the accuracy of any such forward-looking statement contained in this supplemental report, and such forward-looking statements are subject to known and unknown risks and uncertainties that are difficult to predict. These risks and uncertainties include, but are not limited to: the financial condition of the Company’s existing and future tenants, operators and borrowers, including potential bankruptcies and downturns in their businesses, and their legal and regulatory proceedings, which results in uncertainties regarding the Company’s ability to continue to realize the full benefit of such tenants’ and operators’ leases and borrowers’ loans; the ability of the Company’s existing and future tenants, operators and borrowers to conduct their respective businesses in a manner sufficient to maintain or increase their revenues and manage their expenses in order to generate sufficient income to make rent and loan payments to the Company and the Company’s ability to recover investments made, if applicable, in their operations; the Company’s concentration in the healthcare property sector, particularly in senior housing, life sciences and medical office buildings, which makes its profitability more vulnerable to a downturn in a specific sector than if the Company were investing in multiple industries; operational risks associated with third party management contracts, including the additional regulation and liabilities of RIDEA lease structures; the effect on the Company and its tenants and operators of legislation, executive orders and other legal requirements, including compliance with the Americans with Disabilities Act, fire, safety and health regulations, environmental laws, the Affordable Care Act, licensure, certification and inspection requirements, and laws addressing entitlement programs and related services, including Medicare and Medicaid, which may result in future reductions in reimbursements or fines for noncompliance; the Company’s ability to identify replacement tenants and operators and the potential renovation costs and regulatory approvals associated therewith; the risks associated with property development and redevelopment, including costs above original estimates, project delays and lower occupancy rates and rents than expected; the potential impact of uninsured or underinsured losses; the risks associated with the Company’s investments in joint ventures and unconsolidated entities, including its lack of sole decision making authority and its reliance on its partners’ financial condition and continued cooperation; competition for the acquisition and financing of suitable healthcare properties as well as competition for tenants and operators, including with respect to new leases and mortgages Continued 58 ReturnReturn toto TOCTOC
2201 Medical Plaza Forward-Looking Statements Nashville, TN & Risk Factors (concluded) and the renewal or rollover of existing leases; the Company’s or its counterparties’ ability to fulfill obligations, such as financing conditions and/or regulatory approval requirements, required to successfully consummate acquisitions, dispositions, transitions, developments, redevelopments, joint venture transactions or other transactions; the Company’s ability to achieve the benefits of acquisitions or other investments within expected time frames or at all, or within expected cost projections; the potential impact on the Company and its tenants, operators and borrowers from current and future litigation matters, including the possibility of larger than expected litigation costs, adverse results and related developments; changes in federal, state or local laws and regulations, including those affecting the healthcare industry that affect the Company’s costs of compliance or increase the costs, or otherwise affect the operations, of its tenants and operators; the Company’s ability to foreclose on collateral securing its real estate-related loans; volatility or uncertainty in the capital markets, the availability and cost of capital as impacted by interest rates, changes in the Company’s credit ratings, and the value of its common stock, and other conditions that may adversely impact the Company’s ability to fund its obligations or consummate transactions, or reduce the earnings from potential transactions; changes in global, national and local economic and other conditions, the Company’s ability to manage its indebtedness level and changes in the terms of such indebtedness; competition for skilled management and other key personnel; the Company’s reliance on information technology systems and the potential impact of system failures, disruptions or breaches; the Company’s ability to maintain its qualification as a real estate investment trust; and other risks and uncertainties described from time to time in the Company’s Securities and Exchange Commission (SEC) filings. Except as required by law, we do not undertake, and hereby disclaim, any obligation to update any forward-looking statements, which speak only as of the date on which they are made. The information in this supplemental report should be read in conjunction with the Company’s Annual Reports on Form 10-K, Quarterly Reports on Form 10-Q, Current Reports on Form 8-K and other information filed with the SEC. The Reporting Definitions (and Reconciliations of Non-GAAP Financial Measures) are an integral part of the information presented herein. You can access these documents on the Company’s website, www.healthpeak.com, free of charge, as well as amendments to those reports filed or furnished pursuant to Section 13(a) or 15(d) of the Exchange Act, as soon as reasonably practicable after such material is electronically filed with, or furnished to, the SEC. The information contained on the Company’s website is not incorporated by reference into, and should not be considered a part of, this supplemental report. In addition, the SEC maintains a website that contains reports, proxy and information statements, and other information regarding issuers, including the Company, that file electronically with the SEC at www.sec.gov. This supplemental report also includes market and industry data that the Company has obtained from market research, publicly available information and industry publications. The accuracy and completeness of such information are not guaranteed. The market and industry data is often based on industry surveys and preparers’ experience in the industry. Similarly, although the Company believes that the surveys and market research that others have performed are reliable, it has not independently verified this information. For more information, contact Barbat Rodgers, Senior Director - Investor Relations, at (949) 407-0400. 59 ReturnReturn toto TOCTOC
_________________________________________________________ Corporate HQ, Irvine, CA 1920 Main Street, Suite 1200 Irvine, CA 92614 (949) 407 - 0700 ________________________________________________________ San Francisco, CA 950 Tower Lane, Suite 1650 Foster City, CA 94404 _______________________________________________________ Nashville, TN 3000 Meridian Boulevard, Suite 200 Franklin, TN 37067 healthpeak.com 60 ReturnReturn to to TOC TOC