The Post Boston, MA Earnings Release and Supplemental Report ___________________________________________________________________ First Quarter 2020
TABLE OF Contents Earnings Release 3 Consolidated Financial Statements 7 Overview 11 Portfolio Summary 12 Property Count Reconciliations 14 Capitalization and Indebtedness 15 Investment Summary 18 Developments and Redevelopments 20 Capital Expenditures 22 Portfolio Diversification 23 Expirations, Maturities and Purchase Options 25 Triple-net Master Lease Profile 26 Portfolio Senior Housing Triple-net 27 Senior Housing Operating Portfolio 29 CCRC 34 Life Science 35 Medical Office 38 Other 41 2020 Outlook and Additional Information 42 Glossary and Debt Ratios 44 Company Information 50 Forward-Looking Statements & Risk Factors 52 Discussion and Reconciliation of Non-GAAP Financial Measures Hayden Research Campus Lexington, MA 2
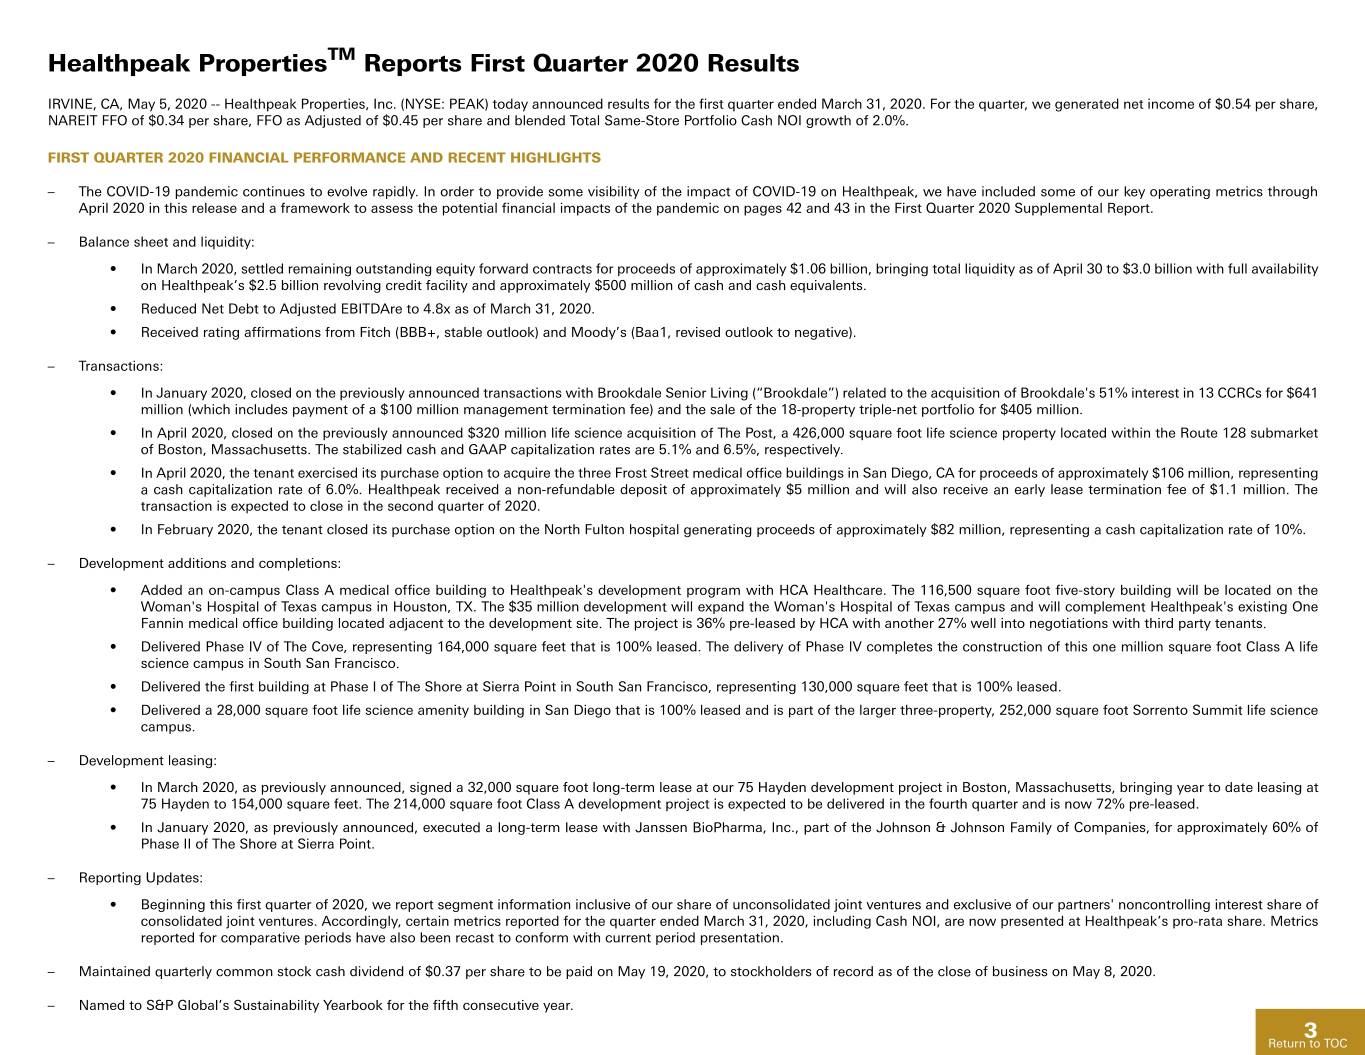
Healthpeak PropertiesTM Reports First Quarter 2020 Results IRVINE, CA, May 5, 2020 -- Healthpeak Properties, Inc. (NYSE: PEAK) today announced results for the first quarter ended March 31, 2020. For the quarter, we generated net income of $0.54 per share, NAREIT FFO of $0.34 per share, FFO as Adjusted of $0.45 per share and blended Total Same-Store Portfolio Cash NOI growth of 2.0%. FIRST QUARTER 2020 FINANCIAL PERFORMANCE AND RECENT HIGHLIGHTS – The COVID-19 pandemic continues to evolve rapidly. In order to provide some visibility of the impact of COVID-19 on Healthpeak, we have included some of our key operating metrics through April 2020 in this release and a framework to assess the potential financial impacts of the pandemic on pages 42 and 43 in the First Quarter 2020 Supplemental Report. – Balance sheet and liquidity: • In March 2020, settled remaining outstanding equity forward contracts for proceeds of approximately $1.06 billion, bringing total liquidity as of April 30 to $3.0 billion with full availability on Healthpeak’s $2.5 billion revolving credit facility and approximately $500 million of cash and cash equivalents. • Reduced Net Debt to Adjusted EBITDAre to 4.8x as of March 31, 2020. • Received rating affirmations from Fitch (BBB+, stable outlook) and Moody’s (Baa1, revised outlook to negative). – Transactions: • In January 2020, closed on the previously announced transactions with Brookdale Senior Living (“Brookdale”) related to the acquisition of Brookdale's 51% interest in 13 CCRCs for $641 million (which includes payment of a $100 million management termination fee) and the sale of the 18-property triple-net portfolio for $405 million. • In April 2020, closed on the previously announced $320 million life science acquisition of The Post, a 426,000 square foot life science property located within the Route 128 submarket of Boston, Massachusetts. The stabilized cash and GAAP capitalization rates are 5.1% and 6.5%, respectively. • In April 2020, the tenant exercised its purchase option to acquire the three Frost Street medical office buildings in San Diego, CA for proceeds of approximately $106 million, representing a cash capitalization rate of 6.0%. Healthpeak received a non-refundable deposit of approximately $5 million and will also receive an early lease termination fee of $1.1 million. The transaction is expected to close in the second quarter of 2020. • In February 2020, the tenant closed its purchase option on the North Fulton hospital generating proceeds of approximately $82 million, representing a cash capitalization rate of 10%. – Development additions and completions: • Added an on-campus Class A medical office building to Healthpeak's development program with HCA Healthcare. The 116,500 square foot five-story building will be located on the Woman's Hospital of Texas campus in Houston, TX. The $35 million development will expand the Woman's Hospital of Texas campus and will complement Healthpeak's existing One Fannin medical office building located adjacent to the development site. The project is 36% pre-leased by HCA with another 27% well into negotiations with third party tenants. • Delivered Phase IV of The Cove, representing 164,000 square feet that is 100% leased. The delivery of Phase IV completes the construction of this one million square foot Class A life science campus in South San Francisco. • Delivered the first building at Phase I of The Shore at Sierra Point in South San Francisco, representing 130,000 square feet that is 100% leased. • Delivered a 28,000 square foot life science amenity building in San Diego that is 100% leased and is part of the larger three-property, 252,000 square foot Sorrento Summit life science campus. – Development leasing: • In March 2020, as previously announced, signed a 32,000 square foot long-term lease at our 75 Hayden development project in Boston, Massachusetts, bringing year to date leasing at 75 Hayden to 154,000 square feet. The 214,000 square foot Class A development project is expected to be delivered in the fourth quarter and is now 72% pre-leased. • In January 2020, as previously announced, executed a long-term lease with Janssen BioPharma, Inc., part of the Johnson & Johnson Family of Companies, for approximately 60% of Phase II of The Shore at Sierra Point. – Reporting Updates: • Beginning this first quarter of 2020, we report segment information inclusive of our share of unconsolidated joint ventures and exclusive of our partners' noncontrolling interest share of consolidated joint ventures. Accordingly, certain metrics reported for the quarter ended March 31, 2020, including Cash NOI, are now presented at Healthpeak’s pro-rata share. Metrics reported for comparative periods have also been recast to conform with current period presentation. – Maintained quarterly common stock cash dividend of $0.37 per share to be paid on May 19, 2020, to stockholders of record as of the close of business on May 8, 2020. – Named to S&P Global’s Sustainability Yearbook for the fifth consecutive year. 3 ReturnReturn to to TOC TOC
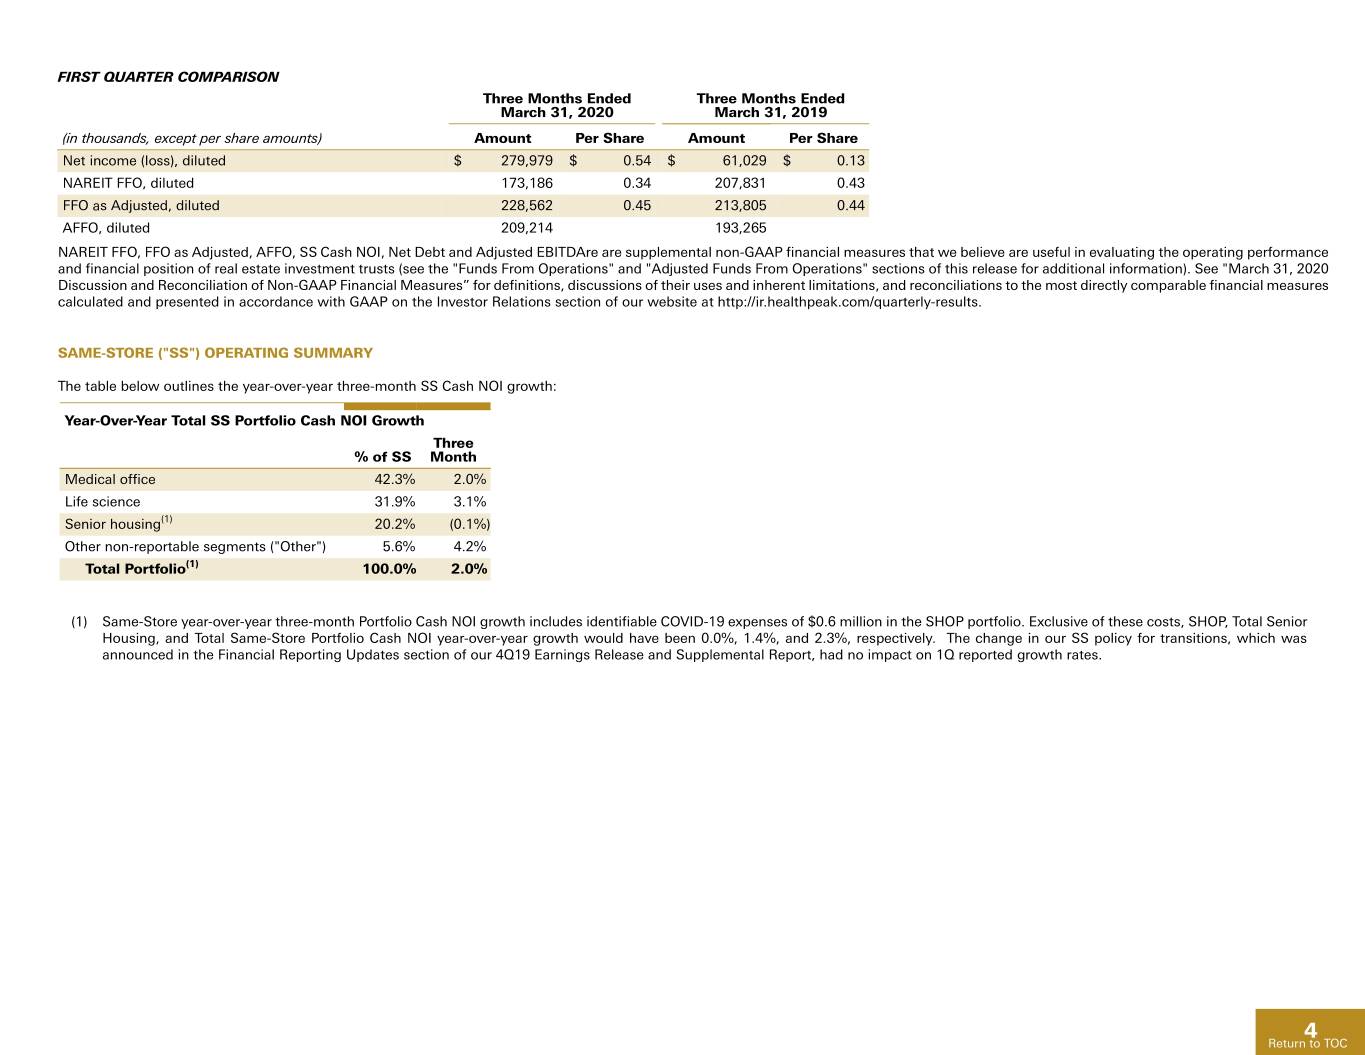
FIRST QUARTER COMPARISON Three Months Ended Three Months Ended March 31, 2020 March 31, 2019 (in thousands, except per share amounts) Amount Per Share Amount Per Share Net income (loss), diluted $ 279,979 $ 0.54 $ 61,029 $ 0.13 NAREIT FFO, diluted 173,186 0.34 207,831 0.43 FFO as Adjusted, diluted 228,562 0.45 213,805 0.44 AFFO, diluted 209,214 193,265 NAREIT FFO, FFO as Adjusted, AFFO, SS Cash NOI, Net Debt and Adjusted EBITDAre are supplemental non-GAAP financial measures that we believe are useful in evaluating the operating performance and financial position of real estate investment trusts (see the "Funds From Operations" and "Adjusted Funds From Operations" sections of this release for additional information). See "March 31, 2020 Discussion and Reconciliation of Non-GAAP Financial Measures” for definitions, discussions of their uses and inherent limitations, and reconciliations to the most directly comparable financial measures calculated and presented in accordance with GAAP on the Investor Relations section of our website at http://ir.healthpeak.com/quarterly-results. SAME-STORE ("SS") OPERATING SUMMARY The table below outlines the year-over-year three-month SS Cash NOI growth: Year-Over-Year Total SS Portfolio Cash NOI Growth Three % of SS Month Medical office 42.3% 2.0% Life science 31.9% 3.1% Senior housing(1) 20.2% (0.1%) Other non-reportable segments ("Other") 5.6% 4.2% Total Portfolio(1) 100.0% 2.0% (1) Same-Store year-over-year three-month Portfolio Cash NOI growth includes identifiable COVID-19 expenses of $0.6 million in the SHOP portfolio. Exclusive of these costs, SHOP, Total Senior Housing, and Total Same-Store Portfolio Cash NOI year-over-year growth would have been 0.0%, 1.4%, and 2.3%, respectively. The change in our SS policy for transitions, which was announced in the Financial Reporting Updates section of our 4Q19 Earnings Release and Supplemental Report, had no impact on 1Q reported growth rates. 4 ReturnReturn to to TOC TOC
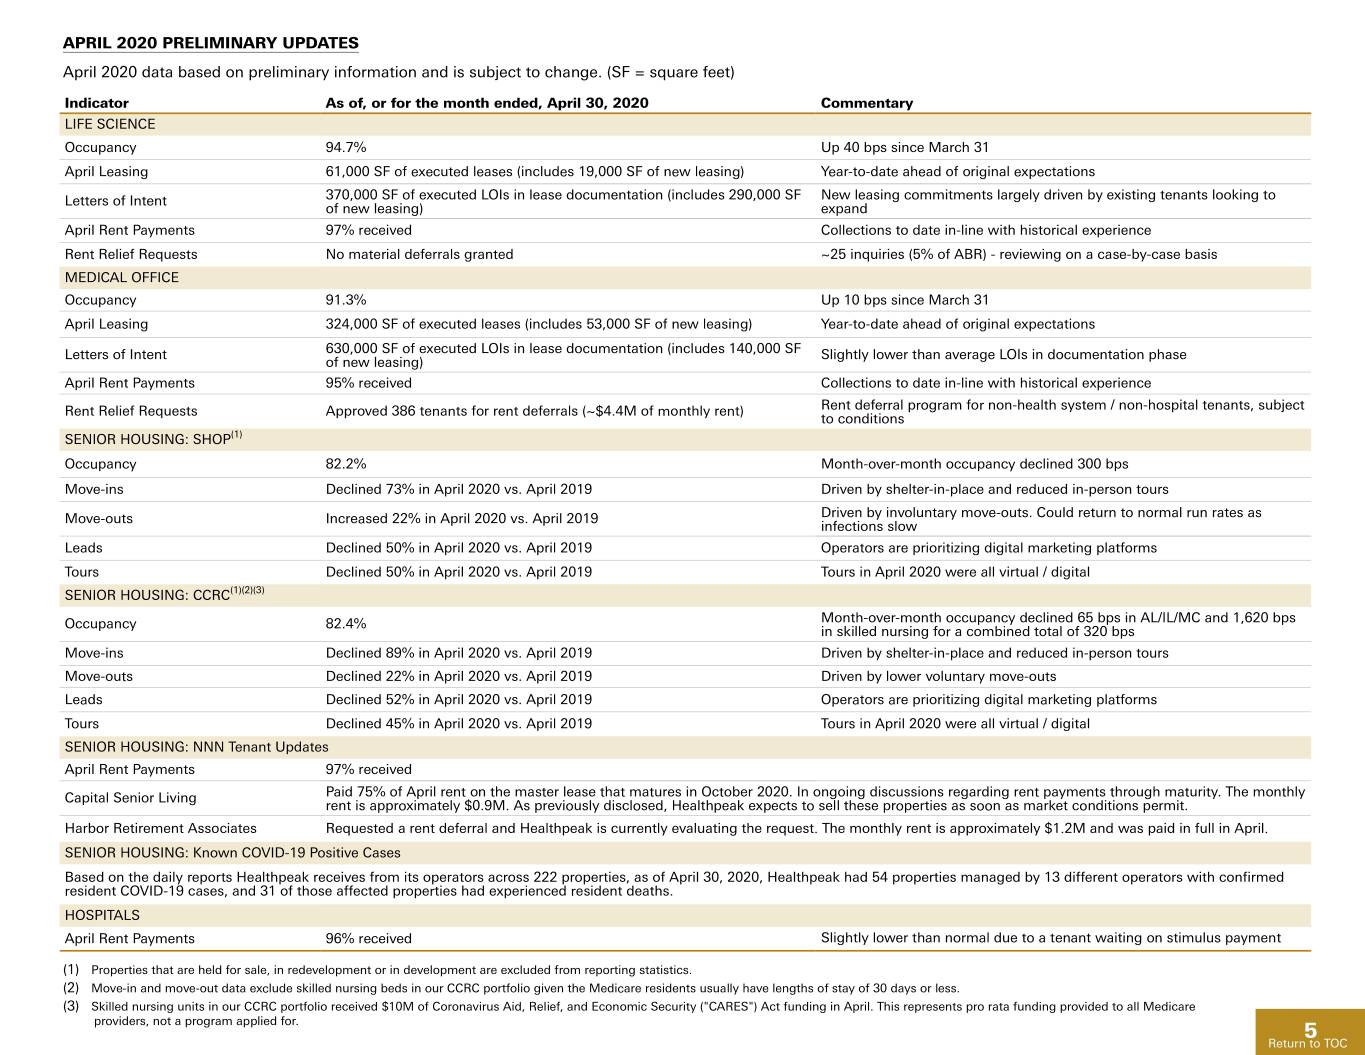
APRIL 2020 PRELIMINARY UPDATES April 2020 data based on preliminary information and is subject to change. (SF = square feet) Indicator As of, or for the month ended, April 30, 2020 Commentary LIFE SCIENCE Occupancy 94.7% Up 40 bps since March 31 April Leasing 61,000 SF of executed leases (includes 19,000 SF of new leasing) Year-to-date ahead of original expectations Letters of Intent 370,000 SF of executed LOIs in lease documentation (includes 290,000 SF New leasing commitments largely driven by existing tenants looking to of new leasing) expand April Rent Payments 97% received Collections to date in-line with historical experience Rent Relief Requests No material deferrals granted ~25 inquiries (5% of ABR) - reviewing on a case-by-case basis MEDICAL OFFICE Occupancy 91.3% Up 10 bps since March 31 April Leasing 324,000 SF of executed leases (includes 53,000 SF of new leasing) Year-to-date ahead of original expectations Letters of Intent 630,000 SF of executed LOIs in lease documentation (includes 140,000 SF Slightly lower than average LOIs in documentation phase of new leasing) April Rent Payments 95% received Collections to date in-line with historical experience Rent Relief Requests Approved 386 tenants for rent deferrals (~$4.4M of monthly rent) Rent deferral program for non-health system / non-hospital tenants, subject to conditions SENIOR HOUSING: SHOP(1) Occupancy 82.2% Month-over-month occupancy declined 300 bps Move-ins Declined 73% in April 2020 vs. April 2019 Driven by shelter-in-place and reduced in-person tours Move-outs Increased 22% in April 2020 vs. April 2019 Driven by involuntary move-outs. Could return to normal run rates as infections slow Leads Declined 50% in April 2020 vs. April 2019 Operators are prioritizing digital marketing platforms Tours Declined 50% in April 2020 vs. April 2019 Tours in April 2020 were all virtual / digital SENIOR HOUSING: CCRC(1)(2)(3) Occupancy 82.4% Month-over-month occupancy declined 65 bps in AL/IL/MC and 1,620 bps in skilled nursing for a combined total of 320 bps Move-ins Declined 89% in April 2020 vs. April 2019 Driven by shelter-in-place and reduced in-person tours Move-outs Declined 22% in April 2020 vs. April 2019 Driven by lower voluntary move-outs Leads Declined 52% in April 2020 vs. April 2019 Operators are prioritizing digital marketing platforms Tours Declined 45% in April 2020 vs. April 2019 Tours in April 2020 were all virtual / digital SENIOR HOUSING: NNN Tenant Updates April Rent Payments 97% received Capital Senior Living Paid 75% of April rent on the master lease that matures in October 2020. In ongoing discussions regarding rent payments through maturity. The monthly rent is approximately $0.9M. As previously disclosed, Healthpeak expects to sell these properties as soon as market conditions permit. Harbor Retirement Associates Requested a rent deferral and Healthpeak is currently evaluating the request. The monthly rent is approximately $1.2M and was paid in full in April. SENIOR HOUSING: Known COVID-19 Positive Cases Based on the daily reports Healthpeak receives from its operators across 222 properties, as of April 30, 2020, Healthpeak had 54 properties managed by 13 different operators with confirmed resident COVID-19 cases, and 31 of those affected properties had experienced resident deaths. HOSPITALS April Rent Payments 96% received Slightly lower than normal due to a tenant waiting on stimulus payment (1) Properties that are held for sale, in redevelopment or in development are excluded from reporting statistics. (2) Move-in and move-out data exclude skilled nursing beds in our CCRC portfolio given the Medicare residents usually have lengths of stay of 30 days or less. (3) Skilled nursing units in our CCRC portfolio received $10M of Coronavirus Aid, Relief, and Economic Security ("CARES") Act funding in April. This represents pro rata funding provided to all Medicare providers, not a program applied for. 5 ReturnReturn to to TOC TOC
2020 GUIDANCE UPDATE In March 2020, Healthpeak withdrew previously provided guidance due to uncertainty related to the COVID-19 pandemic. Please see pages 42 and 43 in the First Quarter 2020 Supplemental Report for more information. COMPANY INFORMATION Healthpeak has scheduled a conference call and webcast for Wednesday, May 6, 2020, at 9:00 a.m. Pacific Time (12:00 p.m. Eastern Time) to present its performance and operating results for the first quarter ended March 31, 2020. The conference call is accessible by dialing (888) 317-6003 (U.S.) or (412) 317-6061 (International). The conference ID number is 9192903. You may also access the conference call via webcast in the Investor Relations section of our website at http://ir.healthpeak.com. An archive of the webcast will be available on Healthpeak's website through May 6, 2021, and a telephonic replay can be accessed through May 20, 2020, by dialing (877) 344-7529 (U.S.) or (412) 317-0088 (International) and entering conference ID number 10142114. Our Supplemental Report for the current period is also available, with this earnings release, in the Investor Relations section of our website. ABOUT HEALTHPEAK Healthpeak Properties, Inc. is a fully integrated real estate investment trust (REIT) and S&P 500 company. Healthpeak owns and develops high-quality real estate in the three private-pay healthcare asset classes of Life Science, Senior Housing and Medical Office, designed to provide stability through the inevitable industry cycles. At Healthpeak, we pair our deep understanding of the healthcare real estate market with a strong vision for long-term growth. For more information regarding Healthpeak, visit www.healthpeak.com. FORWARD-LOOKING STATEMENTS Statements in this release that are not historical facts are "forward-looking statements" within the meaning of Section 27A of the Securities Act of 1933, as amended, and Section 21E of the Securities Exchange Act of 1934, as amended. Forward-looking statements include, among other things, statements regarding our and our officers' intent, belief or expectation as identified by the use of words such as "may," "will," "project," "expect," "believe," "intend," "anticipate," "seek," "target," "forecast," "plan," "potential," "estimate," "could," "would," "should" and other comparable and derivative terms or the negatives thereof. Examples of forward-looking statements include, among other things: (i) statements regarding timing, outcomes and other details relating to current, pending or contemplated acquisitions, dispositions, transitions, developments, redevelopments, joint venture transactions, leasing activity, capital recycling plans, financing activities, or other transactions discussed in this release; (ii) the payment of a quarterly cash dividend; and (iii) statements regarding the impact of the COVID-19 pandemic on our business, financial condition and results of operations. Forward- looking statements reflect our current expectations and views about future events and are subject to risks and uncertainties that could significantly affect our future financial condition and results of operations. While forward-looking statements reflect our good faith belief and assumptions we believe to be reasonable based upon current information, we can give no assurance that our expectations or forecasts will be attained. Further, we cannot guarantee the accuracy of any such forward-looking statement contained in this release, and such forward-looking statements are subject to known and unknown risks and uncertainties that are difficult to predict. These risks and uncertainties include, but are not limited to: the severity and duration of the COVID-19 pandemic; actions that may be taken by governmental authorities to contain the COVID-19 outbreak or to treat its impact; the impact of the COVID-19 pandemic and health and safety measures taken to reduce the spread; operational risks associated with third party management contracts, including the additional regulation and liabilities of our RIDEA lease structures; the ability of our existing and future tenants, operators and borrowers to conduct their respective businesses in a manner sufficient to maintain or increase their revenues and manage their expenses in order to generate sufficient income to make rent and loan payments to us and our ability to recover investments made, if applicable, in their operations; the imposition of laws or regulations prohibiting the eviction of our tenants, including new governmental efforts in response to COVID-19; the financial condition of our existing and future tenants, operators and borrowers, including potential bankruptcies and downturns in their businesses, and their legal and regulatory proceedings, which results in uncertainties regarding our ability to continue to realize the full benefit of such tenants’ and operators’ leases and borrowers’ loans; our concentration in the healthcare property sector, particularly in senior housing, life sciences and medical office buildings, which makes our profitability more vulnerable to a downturn in a specific sector than if we were investing in multiple industries; the effect on us and our tenants and operators of legislation, executive orders and other legal requirements, including compliance with the Americans with Disabilities Act, fire, safety and health regulations, environmental laws, the Affordable Care Act, licensure, certification and inspection requirements, and laws addressing entitlement programs and related services, including Medicare and Medicaid, which may result in future reductions in reimbursements or fines for noncompliance; our ability to identify replacement tenants and operators and the potential renovation costs and regulatory approvals associated therewith; the risks associated with property development and redevelopment, including costs above original estimates, project delays and lower occupancy rates and rents than expected; the potential impact of uninsured or underinsured losses, including as a result of hurricanes, earthquakes and other natural disasters, pandemics such as COVID-19, acts of war and/or terrorism and other events that may cause such losses and/or performance declines by us or our tenants and operators; the risks associated with our investments in joint ventures and unconsolidated entities, including our lack of sole decision making authority and our reliance on our partners’ financial condition and continued cooperation; competition for the acquisition and financing of suitable healthcare properties as well as competition for tenants and operators, including with respect to new leases and mortgages and the renewal or rollover of existing leases; our or our counterparties’ ability to fulfill obligations, such as financing conditions and/or regulatory approval requirements, required to successfully consummate acquisitions, dispositions, transitions, developments, redevelopments, joint venture transactions or other transactions; our ability to achieve the benefits of acquisitions or other investments within expected time frames or at all, or within expected cost projections; the potential impact on us and our tenants, operators and borrowers from current and future litigation matters, including the possibility of larger than expected litigation costs, adverse results and related developments; changes in federal, state or local laws and regulations, including those affecting the healthcare industry that affect our costs of compliance or increase the costs, or otherwise affect the operations, of our tenants and operators; our ability to foreclose on collateral securing our real estate-related loans; volatility or uncertainty in the capital markets, the availability and cost of capital as impacted by interest rates, changes in our credit ratings, the value of our common stock, and other conditions that may adversely impact our ability to fund our obligations or consummate transactions, or reduce the earnings from potential transactions; changes in global, national and local economic and other conditions, including the ongoing economic downturn, volatility in the financial markets and high unemployment rates; our ability to manage our indebtedness level and changes in the terms of such indebtedness; competition for skilled management and other key personnel; our reliance on information technology systems and the potential impact of system failures, disruptions or breaches; our ability to maintain our qualification as a real estate investment trust; and other risks and uncertainties described from time to time in our Securities and Exchange Commission filings. Except as required by law, we do not undertake, and hereby disclaim, any obligation to update any forward-looking statements, which speak only as of the date on which they are made. CONTACT Barbat Rodgers Senior Director – Investor Relations 6 949-407-0400 ReturnReturn to to TOC TOC
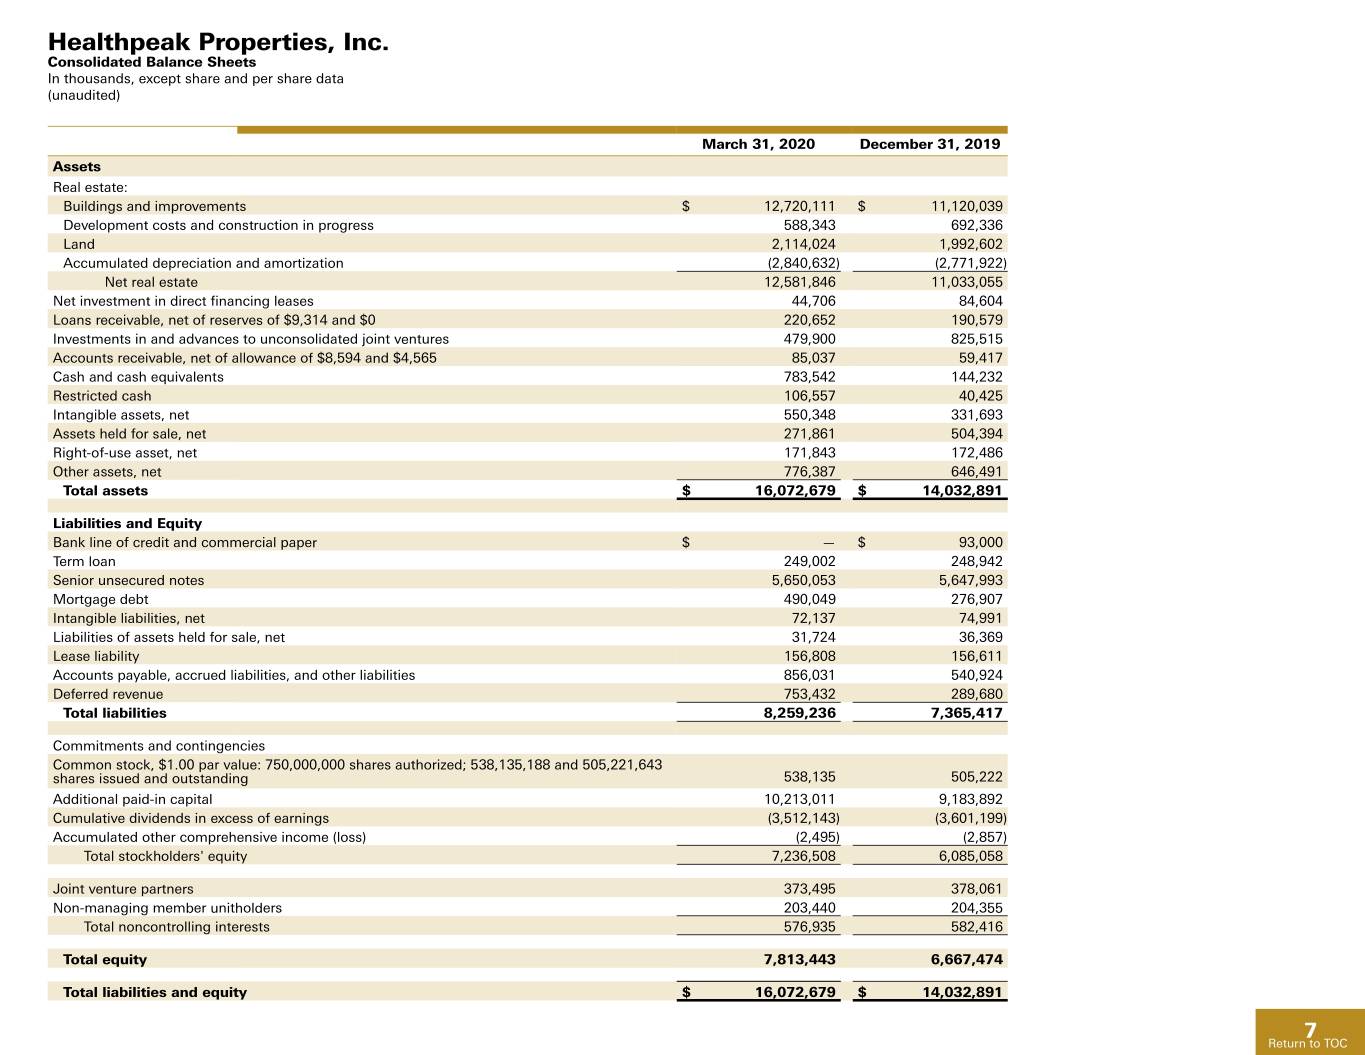
Healthpeak Properties, Inc. Consolidated Balance Sheets In thousands, except share and per share data (unaudited) March 31, 2020 December 31, 2019 Assets Real estate: Buildings and improvements $ 12,720,111 $ 11,120,039 Development costs and construction in progress 588,343 692,336 Land 2,114,024 1,992,602 Accumulated depreciation and amortization (2,840,632) (2,771,922) Net real estate 12,581,846 11,033,055 Net investment in direct financing leases 44,706 84,604 Loans receivable, net of reserves of $9,314 and $0 220,652 190,579 Investments in and advances to unconsolidated joint ventures 479,900 825,515 Accounts receivable, net of allowance of $8,594 and $4,565 85,037 59,417 Cash and cash equivalents 783,542 144,232 Restricted cash 106,557 40,425 Intangible assets, net 550,348 331,693 Assets held for sale, net 271,861 504,394 Right-of-use asset, net 171,843 172,486 Other assets, net 776,387 646,491 Total assets $ 16,072,679 $ 14,032,891 Liabilities and Equity Bank line of credit and commercial paper $ — $ 93,000 Term loan 249,002 248,942 Senior unsecured notes 5,650,053 5,647,993 Mortgage debt 490,049 276,907 Intangible liabilities, net 72,137 74,991 Liabilities of assets held for sale, net 31,724 36,369 Lease liability 156,808 156,611 Accounts payable, accrued liabilities, and other liabilities 856,031 540,924 Deferred revenue 753,432 289,680 Total liabilities 8,259,236 7,365,417 Commitments and contingencies Common stock, $1.00 par value: 750,000,000 shares authorized; 538,135,188 and 505,221,643 shares issued and outstanding 538,135 505,222 Additional paid-in capital 10,213,011 9,183,892 Cumulative dividends in excess of earnings (3,512,143) (3,601,199) Accumulated other comprehensive income (loss) (2,495) (2,857) Total stockholders' equity 7,236,508 6,085,058 Joint venture partners 373,495 378,061 Non-managing member unitholders 203,440 204,355 Total noncontrolling interests 576,935 582,416 Total equity 7,813,443 6,667,474 Total liabilities and equity $ 16,072,679 $ 14,032,891 7 ReturnReturn to to TOC TOC
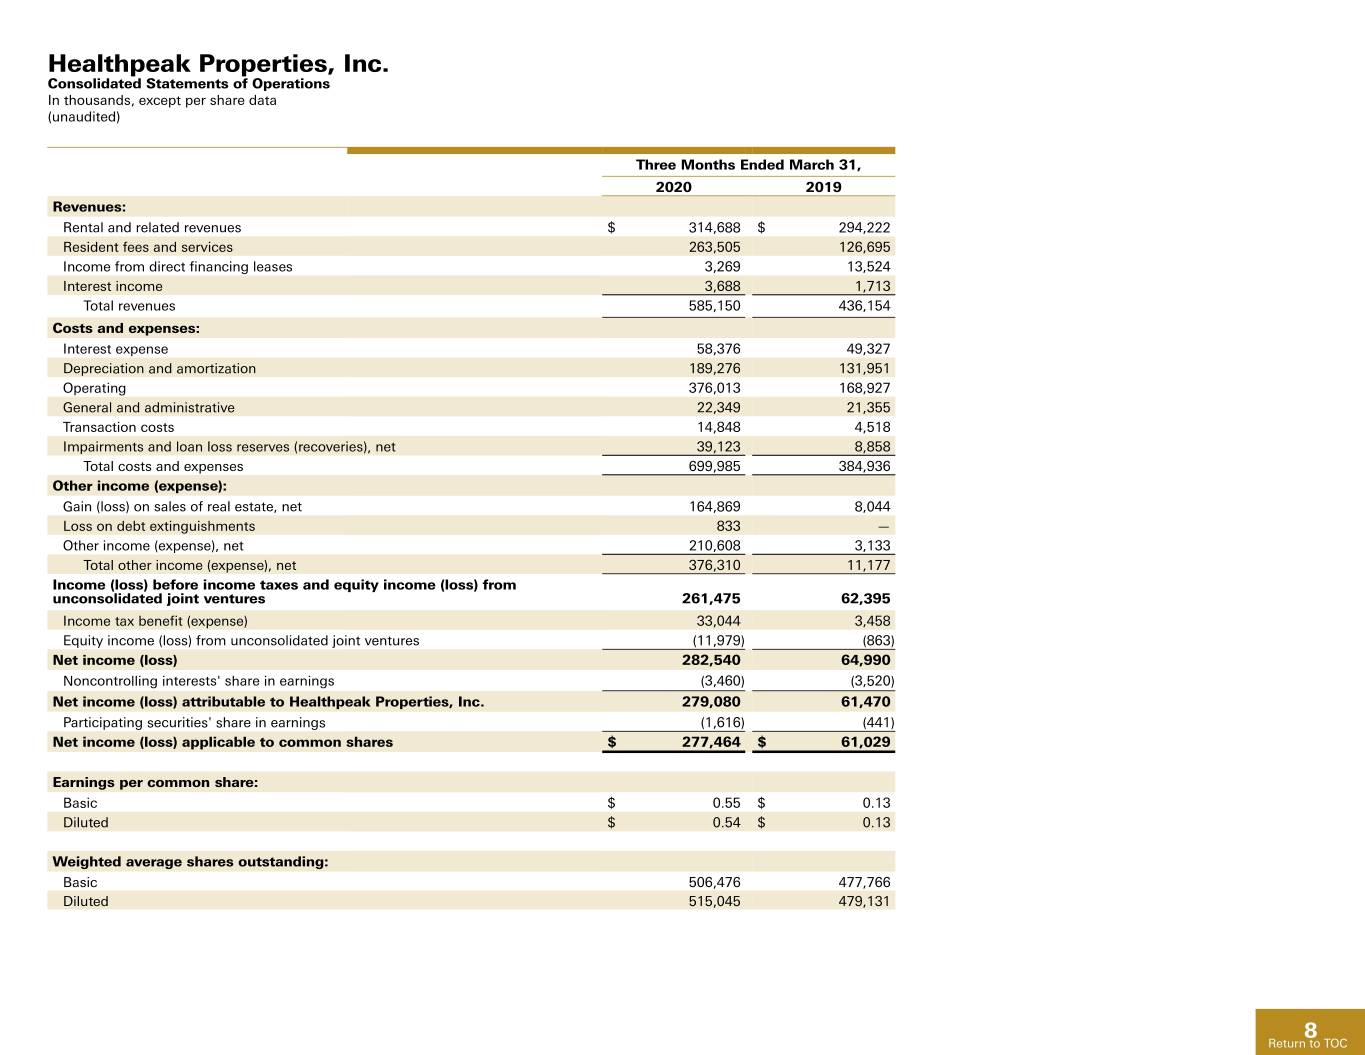
Healthpeak Properties, Inc. Consolidated Statements of Operations In thousands, except per share data (unaudited) Three Months Ended March 31, 2020 2019 Revenues: Rental and related revenues $ 314,688 $ 294,222 Resident fees and services 263,505 126,695 Income from direct financing leases 3,269 13,524 Interest income 3,688 1,713 Total revenues 585,150 436,154 Costs and expenses: Interest expense 58,376 49,327 Depreciation and amortization 189,276 131,951 Operating 376,013 168,927 General and administrative 22,349 21,355 Transaction costs 14,848 4,518 Impairments and loan loss reserves (recoveries), net 39,123 8,858 Total costs and expenses 699,985 384,936 Other income (expense): Gain (loss) on sales of real estate, net 164,869 8,044 Loss on debt extinguishments 833 — Other income (expense), net 210,608 3,133 Total other income (expense), net 376,310 11,177 Income (loss) before income taxes and equity income (loss) from unconsolidated joint ventures 261,475 62,395 Income tax benefit (expense) 33,044 3,458 Equity income (loss) from unconsolidated joint ventures (11,979) (863) Net income (loss) 282,540 64,990 Noncontrolling interests' share in earnings (3,460) (3,520) Net income (loss) attributable to Healthpeak Properties, Inc. 279,080 61,470 Participating securities' share in earnings (1,616) (441) Net income (loss) applicable to common shares $ 277,464 $ 61,029 Earnings per common share: Basic $ 0.55 $ 0.13 Diluted $ 0.54 $ 0.13 Weighted average shares outstanding: Basic 506,476 477,766 Diluted 515,045 479,131 8 ReturnReturn to to TOC TOC
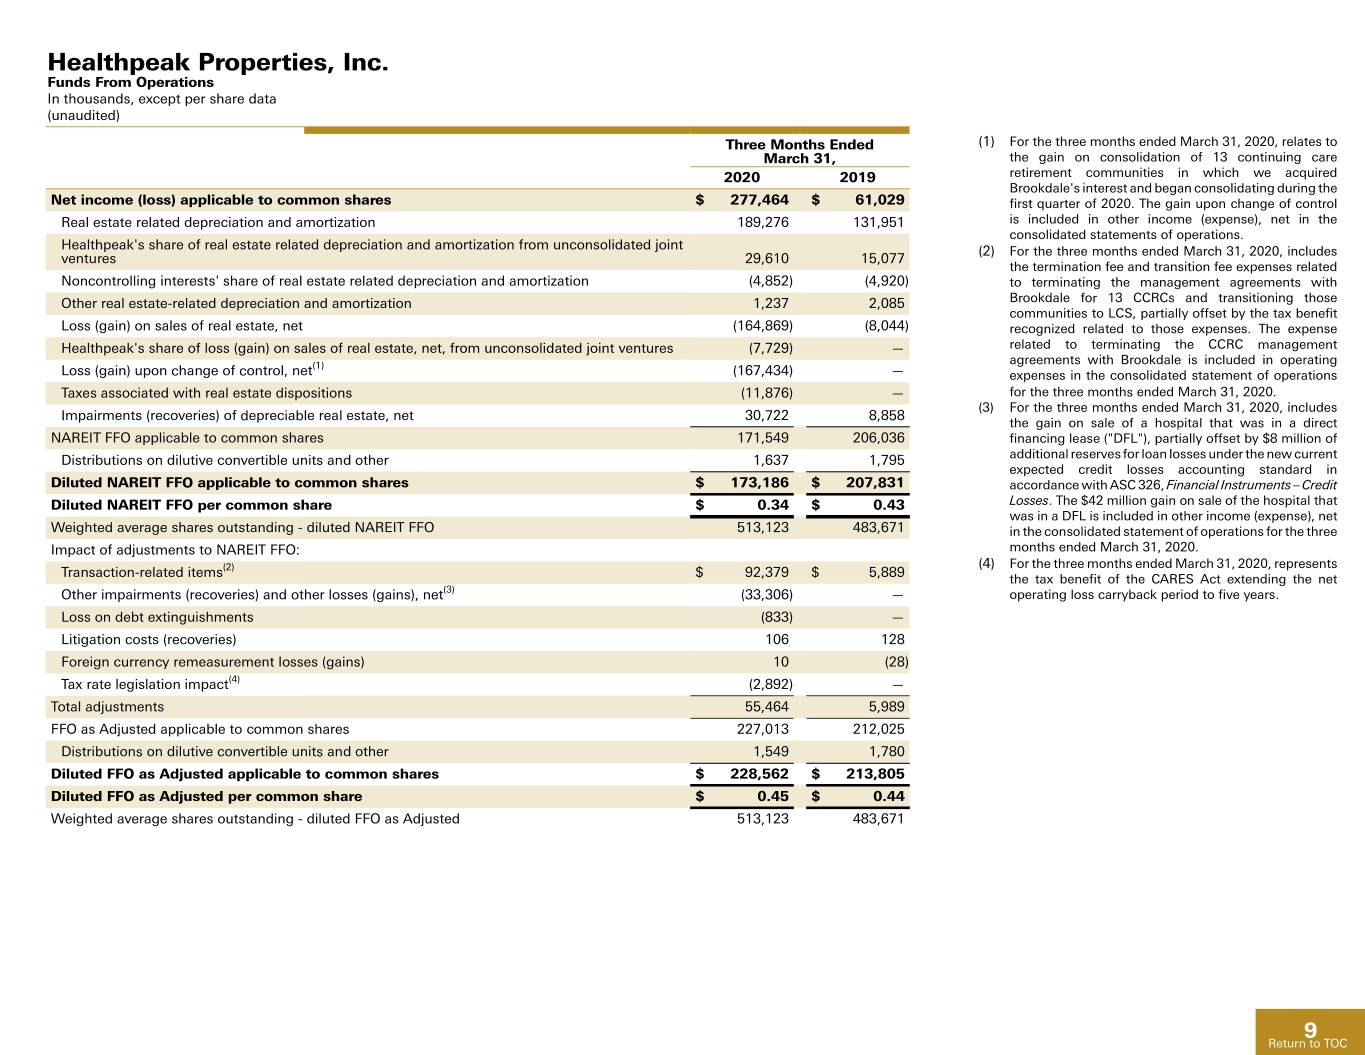
Healthpeak Properties, Inc. Funds From Operations In thousands, except per share data (unaudited) Three Months Ended (1) For the three months ended March 31, 2020, relates to March 31, the gain on consolidation of 13 continuing care 2020 2019 retirement communities in which we acquired Brookdale's interest and began consolidating during the Net income (loss) applicable to common shares $ 277,464 $ 61,029 first quarter of 2020. The gain upon change of control Real estate related depreciation and amortization 189,276 131,951 is included in other income (expense), net in the consolidated statements of operations. Healthpeak's share of real estate related depreciation and amortization from unconsolidated joint (2) For the three months ended March 31, 2020, includes ventures 29,610 15,077 the termination fee and transition fee expenses related Noncontrolling interests' share of real estate related depreciation and amortization (4,852) (4,920) to terminating the management agreements with Other real estate-related depreciation and amortization 1,237 2,085 Brookdale for 13 CCRCs and transitioning those communities to LCS, partially offset by the tax benefit Loss (gain) on sales of real estate, net (164,869) (8,044) recognized related to those expenses. The expense Healthpeak's share of loss (gain) on sales of real estate, net, from unconsolidated joint ventures (7,729) — related to terminating the CCRC management (1) agreements with Brookdale is included in operating Loss (gain) upon change of control, net (167,434) — expenses in the consolidated statement of operations Taxes associated with real estate dispositions (11,876) — for the three months ended March 31, 2020. (3) For the three months ended March 31, 2020, includes Impairments (recoveries) of depreciable real estate, net 30,722 8,858 the gain on sale of a hospital that was in a direct NAREIT FFO applicable to common shares 171,549 206,036 financing lease ("DFL"), partially offset by $8 million of Distributions on dilutive convertible units and other 1,637 1,795 additional reserves for loan losses under the new current expected credit losses accounting standard in Diluted NAREIT FFO applicable to common shares $ 173,186 $ 207,831 accordance with ASC 326, Financial Instruments – Credit Diluted NAREIT FFO per common share $ 0.34 $ 0.43 Losses. The $42 million gain on sale of the hospital that was in a DFL is included in other income (expense), net Weighted average shares outstanding - diluted NAREIT FFO 513,123 483,671 in the consolidated statement of operations for the three Impact of adjustments to NAREIT FFO: months ended March 31, 2020. (2) (4) For the three months ended March 31, 2020, represents Transaction-related items $ 92,379 $ 5,889 the tax benefit of the CARES Act extending the net Other impairments (recoveries) and other losses (gains), net(3) (33,306) — operating loss carryback period to five years. Loss on debt extinguishments (833) — Litigation costs (recoveries) 106 128 Foreign currency remeasurement losses (gains) 10 (28) Tax rate legislation impact(4) (2,892) — Total adjustments 55,464 5,989 FFO as Adjusted applicable to common shares 227,013 212,025 Distributions on dilutive convertible units and other 1,549 1,780 Diluted FFO as Adjusted applicable to common shares $ 228,562 $ 213,805 Diluted FFO as Adjusted per common share $ 0.45 $ 0.44 Weighted average shares outstanding - diluted FFO as Adjusted 513,123 483,671 9 ReturnReturn to to TOC TOC
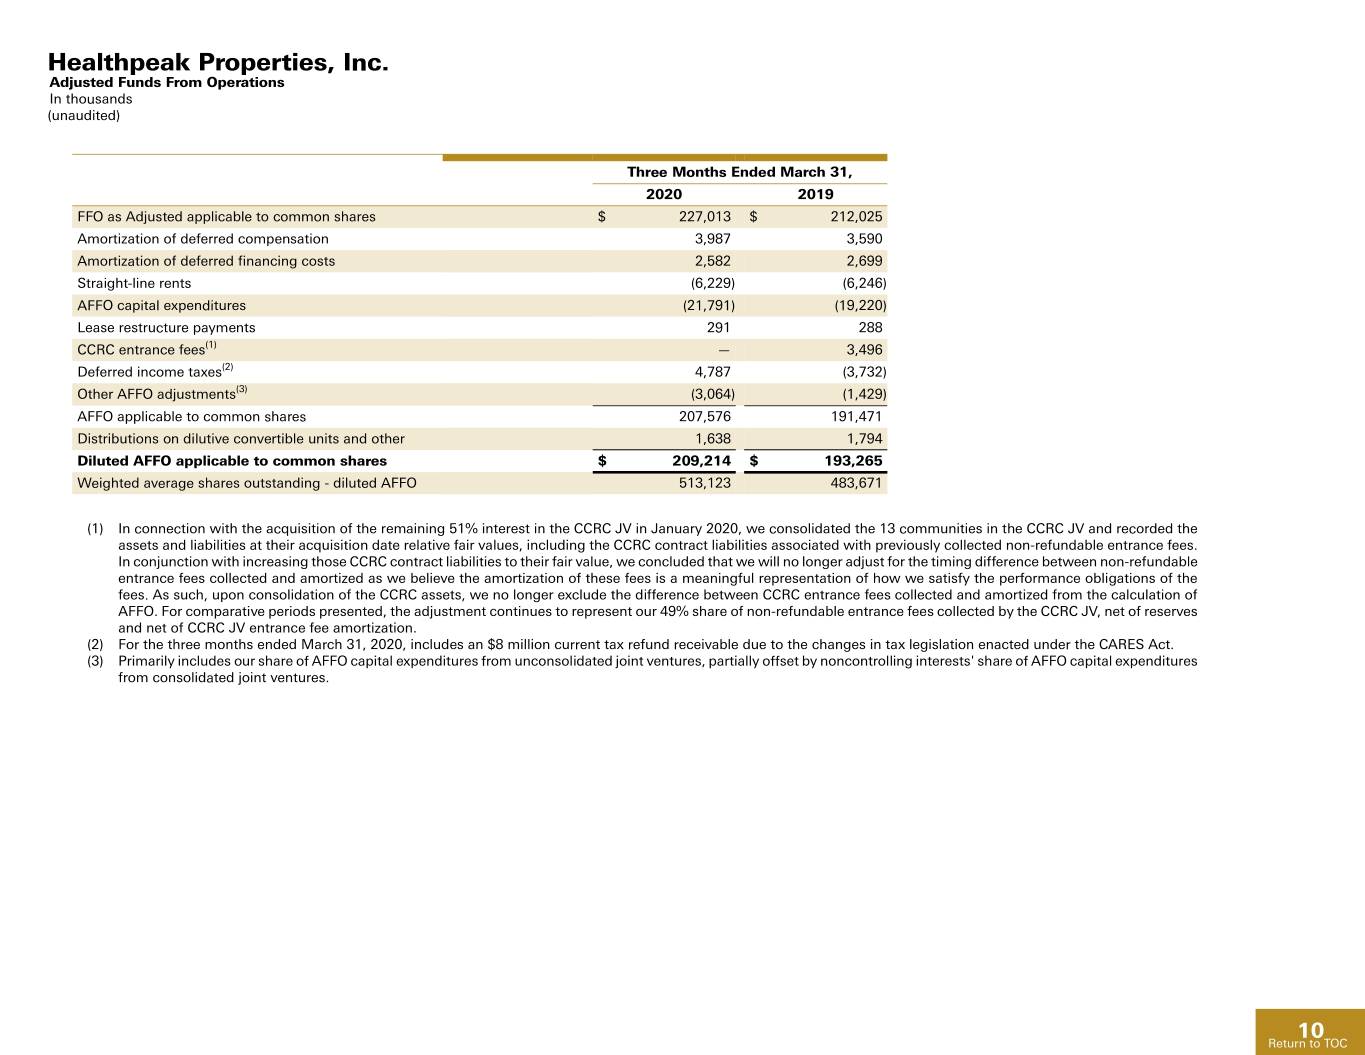
Healthpeak Properties, Inc. Adjusted Funds From Operations In thousands (unaudited) Three Months Ended March 31, 2020 2019 FFO as Adjusted applicable to common shares $ 227,013 $ 212,025 Amortization of deferred compensation 3,987 3,590 Amortization of deferred financing costs 2,582 2,699 Straight-line rents (6,229) (6,246) AFFO capital expenditures (21,791) (19,220) Lease restructure payments 291 288 CCRC entrance fees(1) — 3,496 Deferred income taxes(2) 4,787 (3,732) Other AFFO adjustments(3) (3,064) (1,429) AFFO applicable to common shares 207,576 191,471 Distributions on dilutive convertible units and other 1,638 1,794 Diluted AFFO applicable to common shares $ 209,214 $ 193,265 Weighted average shares outstanding - diluted AFFO 513,123 483,671 (1) In connection with the acquisition of the remaining 51% interest in the CCRC JV in January 2020, we consolidated the 13 communities in the CCRC JV and recorded the assets and liabilities at their acquisition date relative fair values, including the CCRC contract liabilities associated with previously collected non-refundable entrance fees. In conjunction with increasing those CCRC contract liabilities to their fair value, we concluded that we will no longer adjust for the timing difference between non-refundable entrance fees collected and amortized as we believe the amortization of these fees is a meaningful representation of how we satisfy the performance obligations of the fees. As such, upon consolidation of the CCRC assets, we no longer exclude the difference between CCRC entrance fees collected and amortized from the calculation of AFFO. For comparative periods presented, the adjustment continues to represent our 49% share of non-refundable entrance fees collected by the CCRC JV, net of reserves and net of CCRC JV entrance fee amortization. (2) For the three months ended March 31, 2020, includes an $8 million current tax refund receivable due to the changes in tax legislation enacted under the CARES Act. (3) Primarily includes our share of AFFO capital expenditures from unconsolidated joint ventures, partially offset by noncontrolling interests' share of AFFO capital expenditures from consolidated joint ventures. 10 ReturnReturn to to TOC TOC
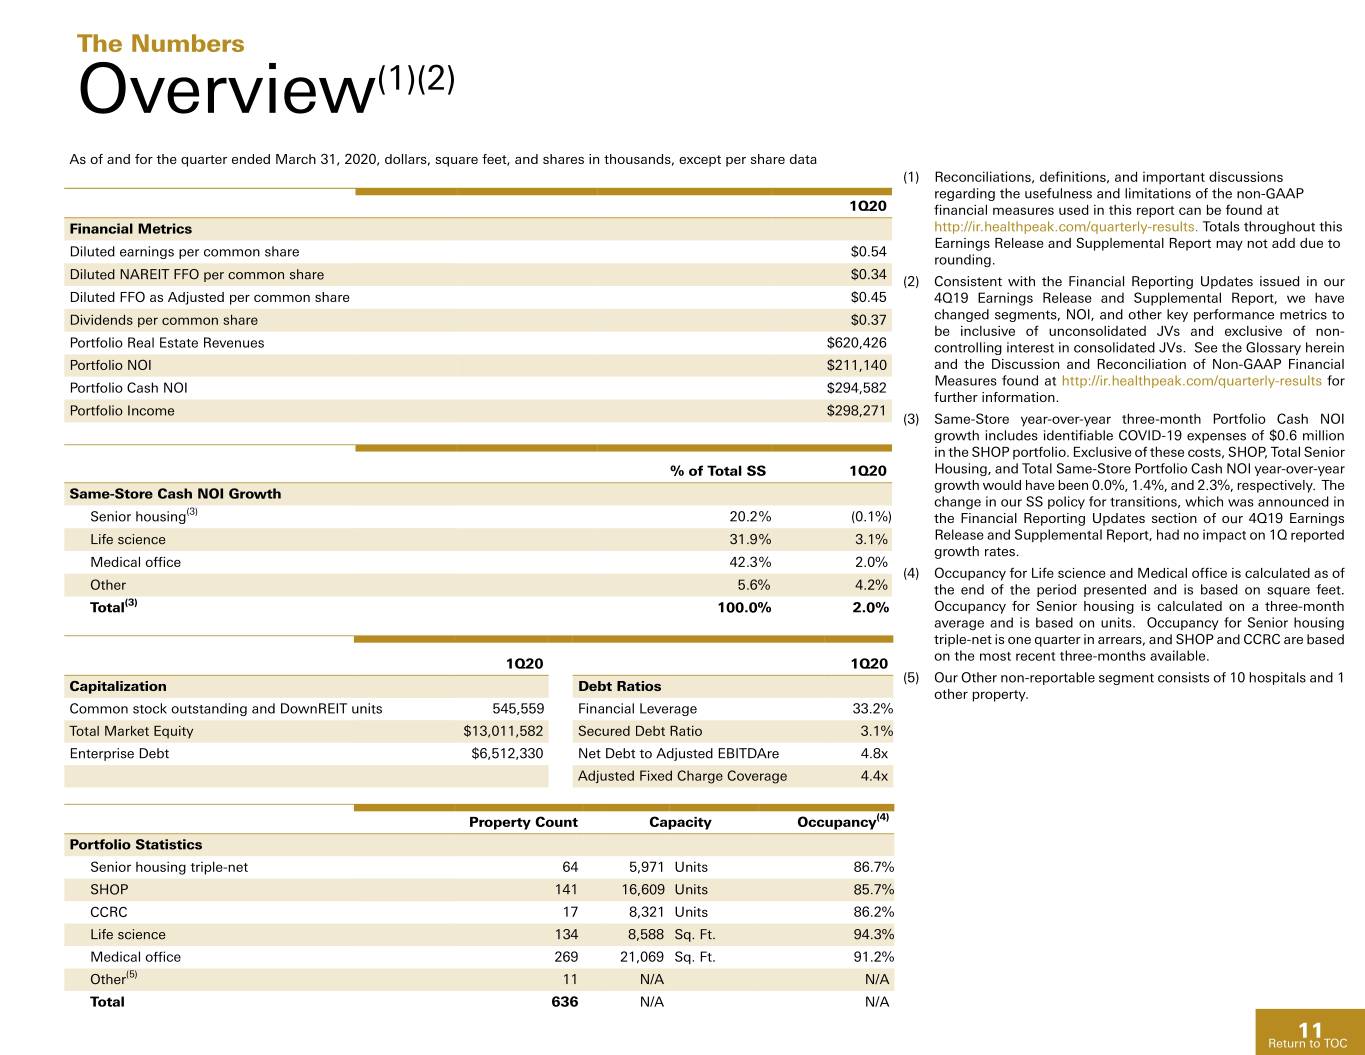
The Numbers Overview(1)(2) As of and for the quarter ended March 31, 2020, dollars, square feet, and shares in thousands, except per share data (1) Reconciliations, definitions, and important discussions regarding the usefulness and limitations of the non-GAAP 1Q20 financial measures used in this report can be found at Financial Metrics http://ir.healthpeak.com/quarterly-results. Totals throughout this Earnings Release and Supplemental Report may not add due to Diluted earnings per common share $0.54 rounding. Diluted NAREIT FFO per common share $0.34 (2) Consistent with the Financial Reporting Updates issued in our Diluted FFO as Adjusted per common share $0.45 4Q19 Earnings Release and Supplemental Report, we have Dividends per common share $0.37 changed segments, NOI, and other key performance metrics to be inclusive of unconsolidated JVs and exclusive of non- Portfolio Real Estate Revenues $620,426 controlling interest in consolidated JVs. See the Glossary herein Portfolio NOI $211,140 and the Discussion and Reconciliation of Non-GAAP Financial Measures found at http://ir.healthpeak.com/quarterly-results for Portfolio Cash NOI $294,582 further information. Portfolio Income $298,271 (3) Same-Store year-over-year three-month Portfolio Cash NOI growth includes identifiable COVID-19 expenses of $0.6 million in the SHOP portfolio. Exclusive of these costs, SHOP, Total Senior % of Total SS 1Q20 Housing, and Total Same-Store Portfolio Cash NOI year-over-year growth would have been 0.0%, 1.4%, and 2.3%, respectively. The Same-Store Cash NOI Growth change in our SS policy for transitions, which was announced in (3) Senior housing 20.2% (0.1%) the Financial Reporting Updates section of our 4Q19 Earnings Life science 31.9% 3.1% Release and Supplemental Report, had no impact on 1Q reported growth rates. Medical office 42.3% 2.0% (4) Occupancy for Life science and Medical office is calculated as of Other 5.6% 4.2% the end of the period presented and is based on square feet. Total(3) 100.0% 2.0% Occupancy for Senior housing is calculated on a three-month average and is based on units. Occupancy for Senior housing triple-net is one quarter in arrears, and SHOP and CCRC are based on the most recent three-months available. 1Q20 1Q20 (5) Our Other non-reportable segment consists of 10 hospitals and 1 Capitalization Debt Ratios other property. Common stock outstanding and DownREIT units 545,559 Financial Leverage 33.2% Total Market Equity $13,011,582 Secured Debt Ratio 3.1% Enterprise Debt $6,512,330 Net Debt to Adjusted EBITDAre 4.8x Adjusted Fixed Charge Coverage 4.4x Property Count Capacity Occupancy(4) Portfolio Statistics Senior housing triple-net 64 5,971 Units 86.7% SHOP 141 16,609 Units 85.7% CCRC 17 8,321 Units 86.2% Life science 134 8,588 Sq. Ft. 94.3% Medical office 269 21,069 Sq. Ft. 91.2% Other(5) 11 N/A N/A Total 636 N/A N/A 11 ReturnReturn to to TOC TOC
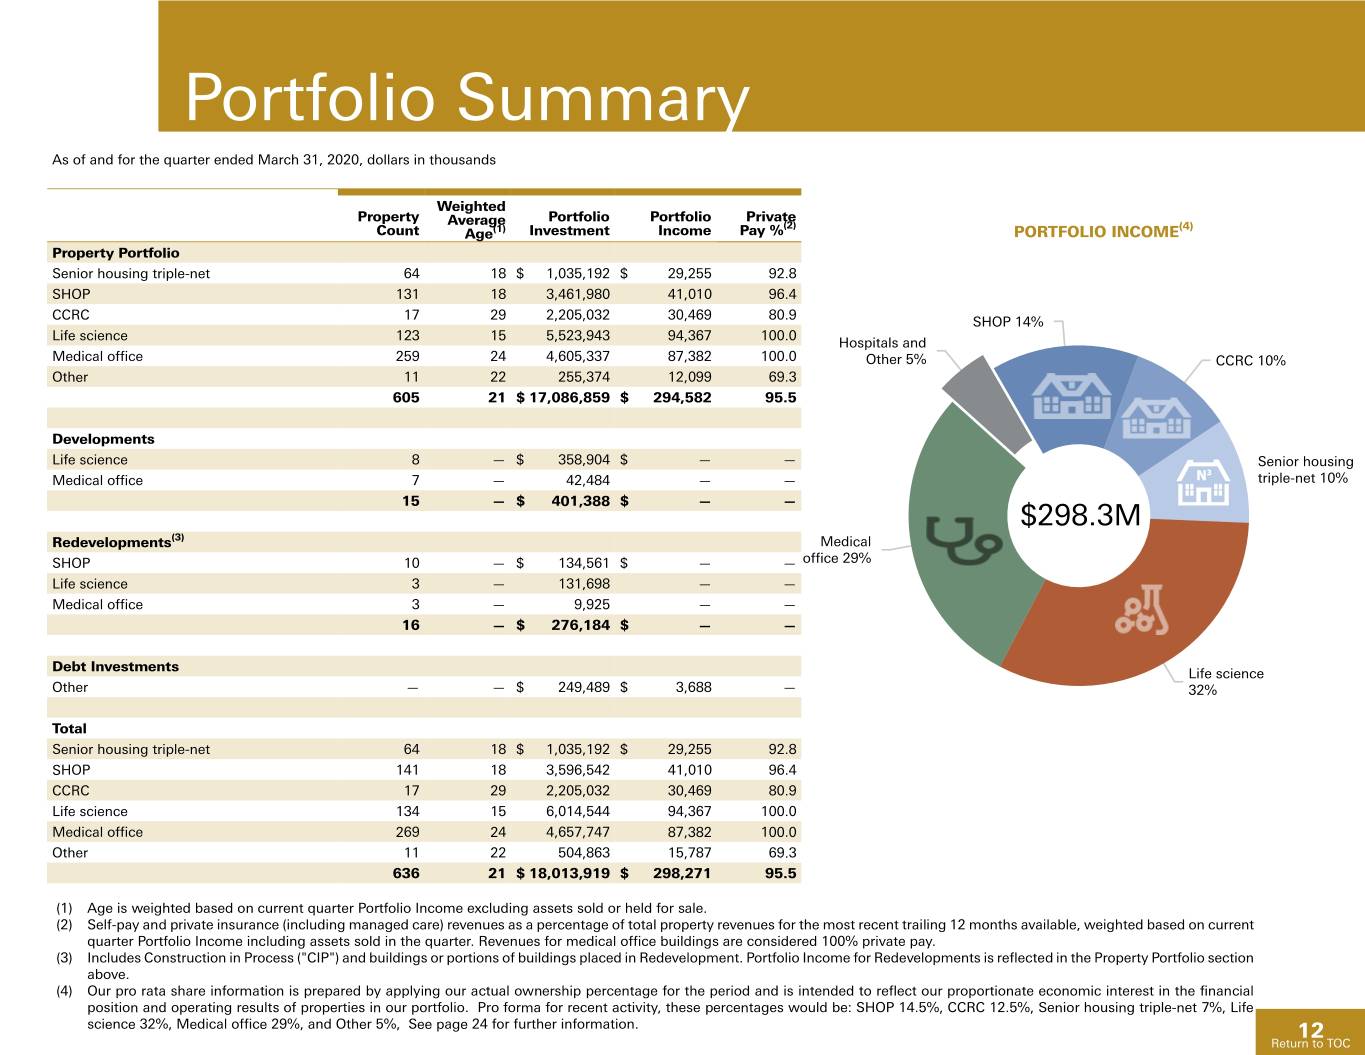
Portfolio Summary As of and for the quarter ended March 31, 2020, dollars in thousands Weighted Property Portfolio Portfolio Private Average (2) (4) Count Age(1) Investment Income Pay % PORTFOLIO INCOME Property Portfolio Senior housing triple-net 64 18 $ 1,035,192 $ 29,255 92.8 SHOP 131 18 3,461,980 41,010 96.4 CCRC 17 29 2,205,032 30,469 80.9 SHOP 14% Life science 123 15 5,523,943 94,367 100.0 Hospitals and Medical office 259 24 4,605,337 87,382 100.0 Other 5% CCRC 10% Other 11 22 255,374 12,099 69.3 605 21 $ 17,086,859 $ 294,582 95.5 Developments Life science 8 — $ 358,904 $ — — Senior housing Medical office 7 — 42,484 — — triple-net 10% 15 — $ 401,388 $ — — $298.3M Redevelopments(3) Medical SHOP 10 — $ 134,561 $ — — office 29% Life science 3 — 131,698 — — Medical office 3 — 9,925 — — 16 — $ 276,184 $ — — Debt Investments Life science Other — — $ 249,489 $ 3,688 — 32% Total Senior housing triple-net 64 18 $ 1,035,192 $ 29,255 92.8 SHOP 141 18 3,596,542 41,010 96.4 CCRC 17 29 2,205,032 30,469 80.9 Life science 134 15 6,014,544 94,367 100.0 Medical office 269 24 4,657,747 87,382 100.0 Other 11 22 504,863 15,787 69.3 636 21 $ 18,013,919 $ 298,271 95.5 (1) Age is weighted based on current quarter Portfolio Income excluding assets sold or held for sale. (2) Self-pay and private insurance (including managed care) revenues as a percentage of total property revenues for the most recent trailing 12 months available, weighted based on current quarter Portfolio Income including assets sold in the quarter. Revenues for medical office buildings are considered 100% private pay. (3) Includes Construction in Process ("CIP") and buildings or portions of buildings placed in Redevelopment. Portfolio Income for Redevelopments is reflected in the Property Portfolio section above. (4) Our pro rata share information is prepared by applying our actual ownership percentage for the period and is intended to reflect our proportionate economic interest in the financial position and operating results of properties in our portfolio. Pro forma for recent activity, these percentages would be: SHOP 14.5%, CCRC 12.5%, Senior housing triple-net 7%, Life science 32%, Medical office 29%, and Other 5%, See page 24 for further information. 12 Return to TOC
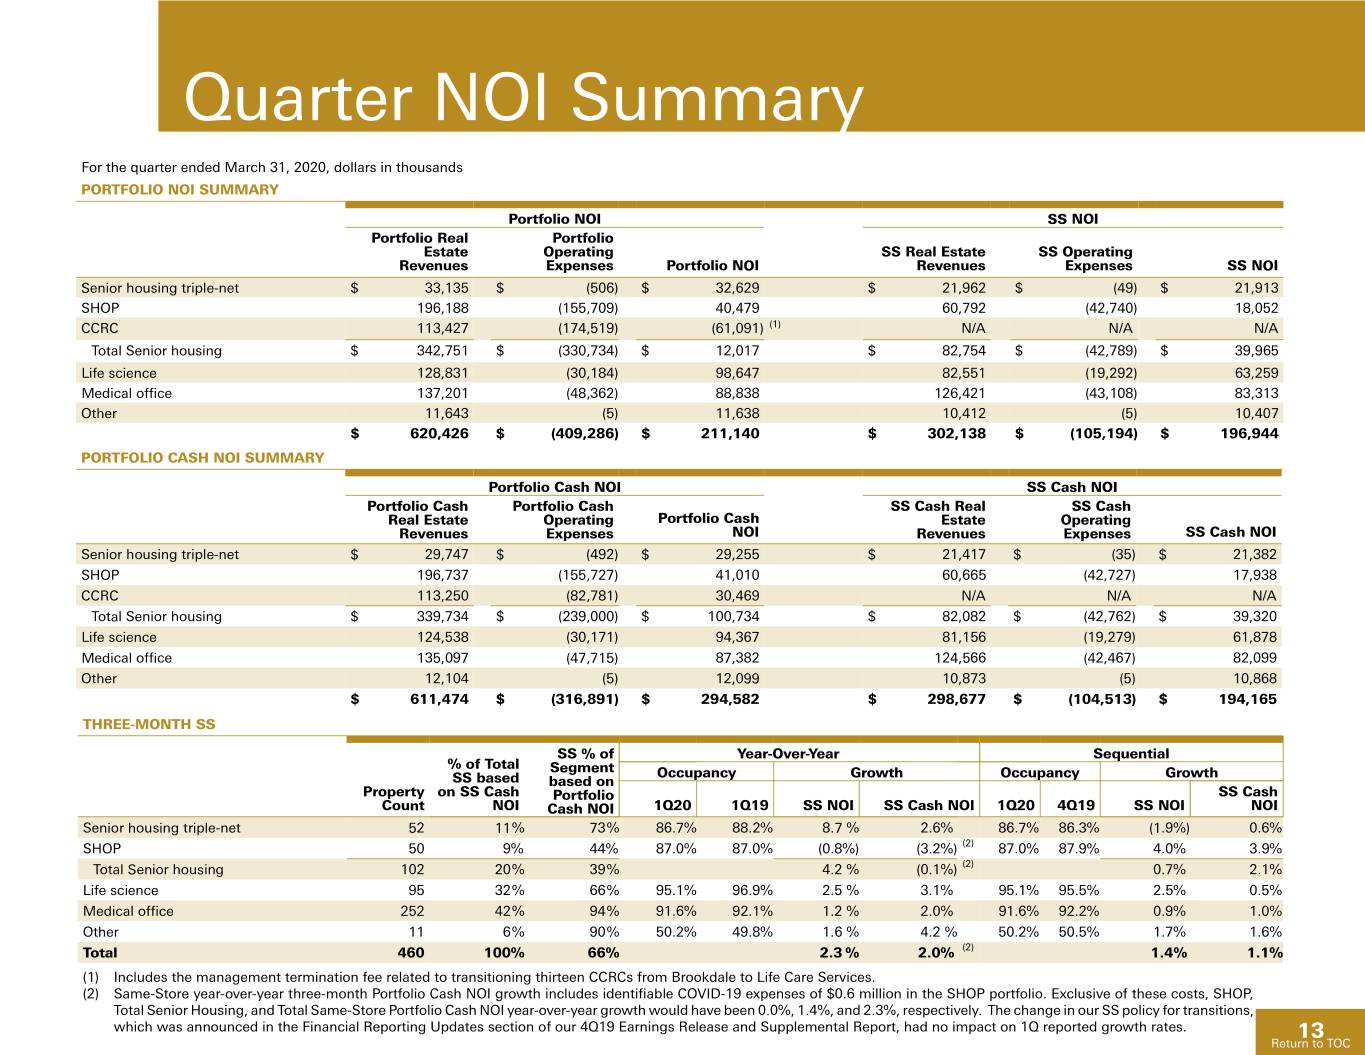
Quarter NOI Summary For the quarter ended March 31, 2020, dollars in thousands PORTFOLIO NOI SUMMARY Portfolio NOI SS NOI Portfolio Real Portfolio Estate Operating SS Real Estate SS Operating Revenues Expenses Portfolio NOI Revenues Expenses SS NOI Senior housing triple-net $ 33,135 $ (506) $ 32,629 $ 21,962 $ (49) $ 21,913 SHOP 196,188 (155,709) 40,479 60,792 (42,740) 18,052 CCRC 113,427 (174,519) (61,091) (1) N/A N/A N/A Total Senior housing $ 342,751 $ (330,734) $ 12,017 $ 82,754 $ (42,789) $ 39,965 Life science 128,831 (30,184) 98,647 82,551 (19,292) 63,259 Medical office 137,201 (48,362) 88,838 126,421 (43,108) 83,313 Other 11,643 (5) 11,638 10,412 (5) 10,407 $ 620,426 $ (409,286) $ 211,140 $ 302,138 $ (105,194) $ 196,944 PORTFOLIO CASH NOI SUMMARY Portfolio Cash NOI SS Cash NOI Portfolio Cash Portfolio Cash SS Cash Real SS Cash Real Estate Operating Portfolio Cash Estate Operating Revenues Expenses NOI Revenues Expenses SS Cash NOI Senior housing triple-net $ 29,747 $ (492) $ 29,255 $ 21,417 $ (35) $ 21,382 SHOP 196,737 (155,727) 41,010 60,665 (42,727) 17,938 CCRC 113,250 (82,781) 30,469 N/A N/A N/A Total Senior housing $ 339,734 $ (239,000) $ 100,734 $ 82,082 $ (42,762) $ 39,320 Life science 124,538 (30,171) 94,367 81,156 (19,279) 61,878 Medical office 135,097 (47,715) 87,382 124,566 (42,467) 82,099 Other 12,104 (5) 12,099 10,873 (5) 10,868 $ 611,474 $ (316,891) $ 294,582 $ 298,677 $ (104,513) $ 194,165 THREE-MONTH SS SS % of Year-Over-Year Sequential % of Total Segment Occupancy Growth Occupancy Growth SS based based on Property on SS Cash Portfolio SS Cash Count NOI Cash NOI 1Q20 1Q19 SS NOI SS Cash NOI 1Q20 4Q19 SS NOI NOI Senior housing triple-net 52 11% 73% 86.7% 88.2% 8.7 % 2.6% 86.7% 86.3% (1.9%) 0.6% SHOP 50 9% 44% 87.0% 87.0% (0.8%) (3.2%) (2) 87.0% 87.9% 4.0% 3.9% Total Senior housing 102 20% 39% 4.2 % (0.1%) (2) 0.7% 2.1% Life science 95 32% 66% 95.1% 96.9% 2.5 % 3.1% 95.1% 95.5% 2.5% 0.5% Medical office 252 42% 94% 91.6% 92.1% 1.2 % 2.0% 91.6% 92.2% 0.9% 1.0% Other 11 6% 90% 50.2% 49.8% 1.6 % 4.2 % 50.2% 50.5% 1.7% 1.6% Total 460 100% 66% 2.3 % 2.0% (2) 1.4% 1.1% (1) Includes the management termination fee related to transitioning thirteen CCRCs from Brookdale to Life Care Services. (2) Same-Store year-over-year three-month Portfolio Cash NOI growth includes identifiable COVID-19 expenses of $0.6 million in the SHOP portfolio. Exclusive of these costs, SHOP, Total Senior Housing, and Total Same-Store Portfolio Cash NOI year-over-year growth would have been 0.0%, 1.4%, and 2.3%, respectively. The change in our SS policy for transitions, which was announced in the Financial Reporting Updates section of our 4Q19 Earnings Release and Supplemental Report, had no impact on 1Q reported growth rates. 13 Return to TOC
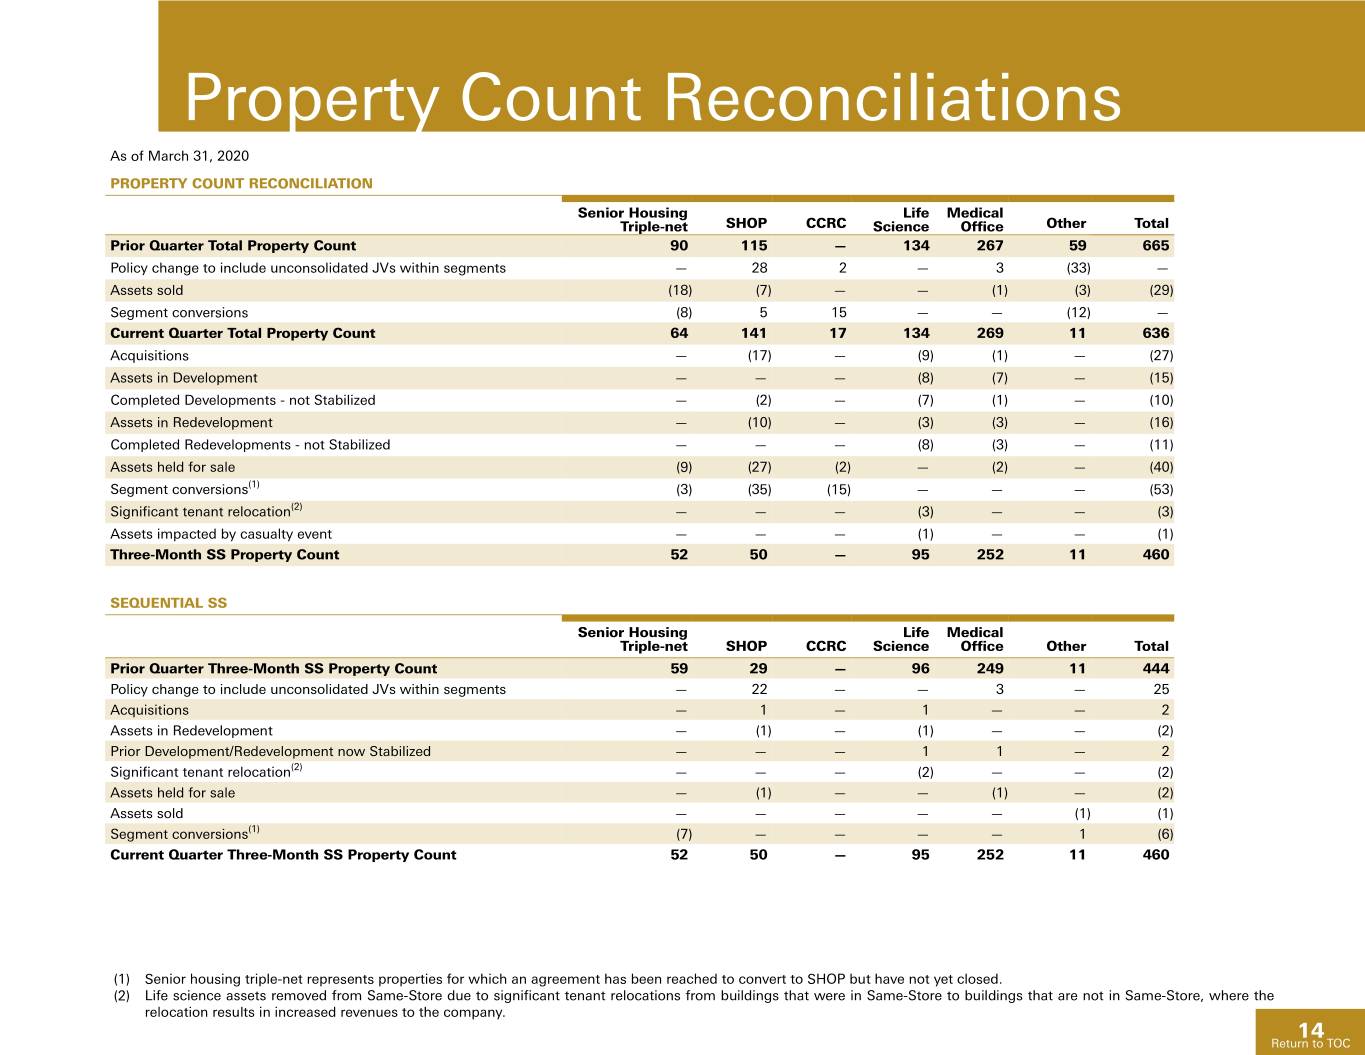
Property Count Reconciliations As of March 31, 2020 PROPERTY COUNT RECONCILIATION Senior Housing Life Medical Triple-net SHOP CCRC Science Office Other Total Prior Quarter Total Property Count 90 115 — 134 267 59 665 Policy change to include unconsolidated JVs within segments — 28 2 — 3 (33) — Assets sold (18) (7) — — (1) (3) (29) Segment conversions (8) 5 15 — — (12) — Current Quarter Total Property Count 64 141 17 134 269 11 636 Acquisitions — (17) — (9) (1) — (27) Assets in Development — — — (8) (7) — (15) Completed Developments - not Stabilized — (2) — (7) (1) — (10) Assets in Redevelopment — (10) — (3) (3) — (16) Completed Redevelopments - not Stabilized — — — (8) (3) — (11) Assets held for sale (9) (27) (2) — (2) — (40) Segment conversions(1) (3) (35) (15) — — — (53) Significant tenant relocation(2) — — — (3) — — (3) Assets impacted by casualty event — — — (1) — — (1) Three-Month SS Property Count 52 50 — 95 252 11 460 SEQUENTIAL SS Senior Housing Life Medical Triple-net SHOP CCRC Science Office Other Total Prior Quarter Three-Month SS Property Count 59 29 — 96 249 11 444 Policy change to include unconsolidated JVs within segments — 22 — — 3 — 25 Acquisitions — 1 — 1 — — 2 Assets in Redevelopment — (1) — (1) — — (2) Prior Development/Redevelopment now Stabilized — — — 1 1 — 2 Significant tenant relocation(2) — — — (2) — — (2) Assets held for sale — (1) — — (1) — (2) Assets sold — — — — — (1) (1) Segment conversions(1) (7) — — — — 1 (6) Current Quarter Three-Month SS Property Count 52 50 — 95 252 11 460 (1) Senior housing triple-net represents properties for which an agreement has been reached to convert to SHOP but have not yet closed. (2) Life science assets removed from Same-Store due to significant tenant relocations from buildings that were in Same-Store to buildings that are not in Same-Store, where the relocation results in increased revenues to the company. 14 Return to TOC
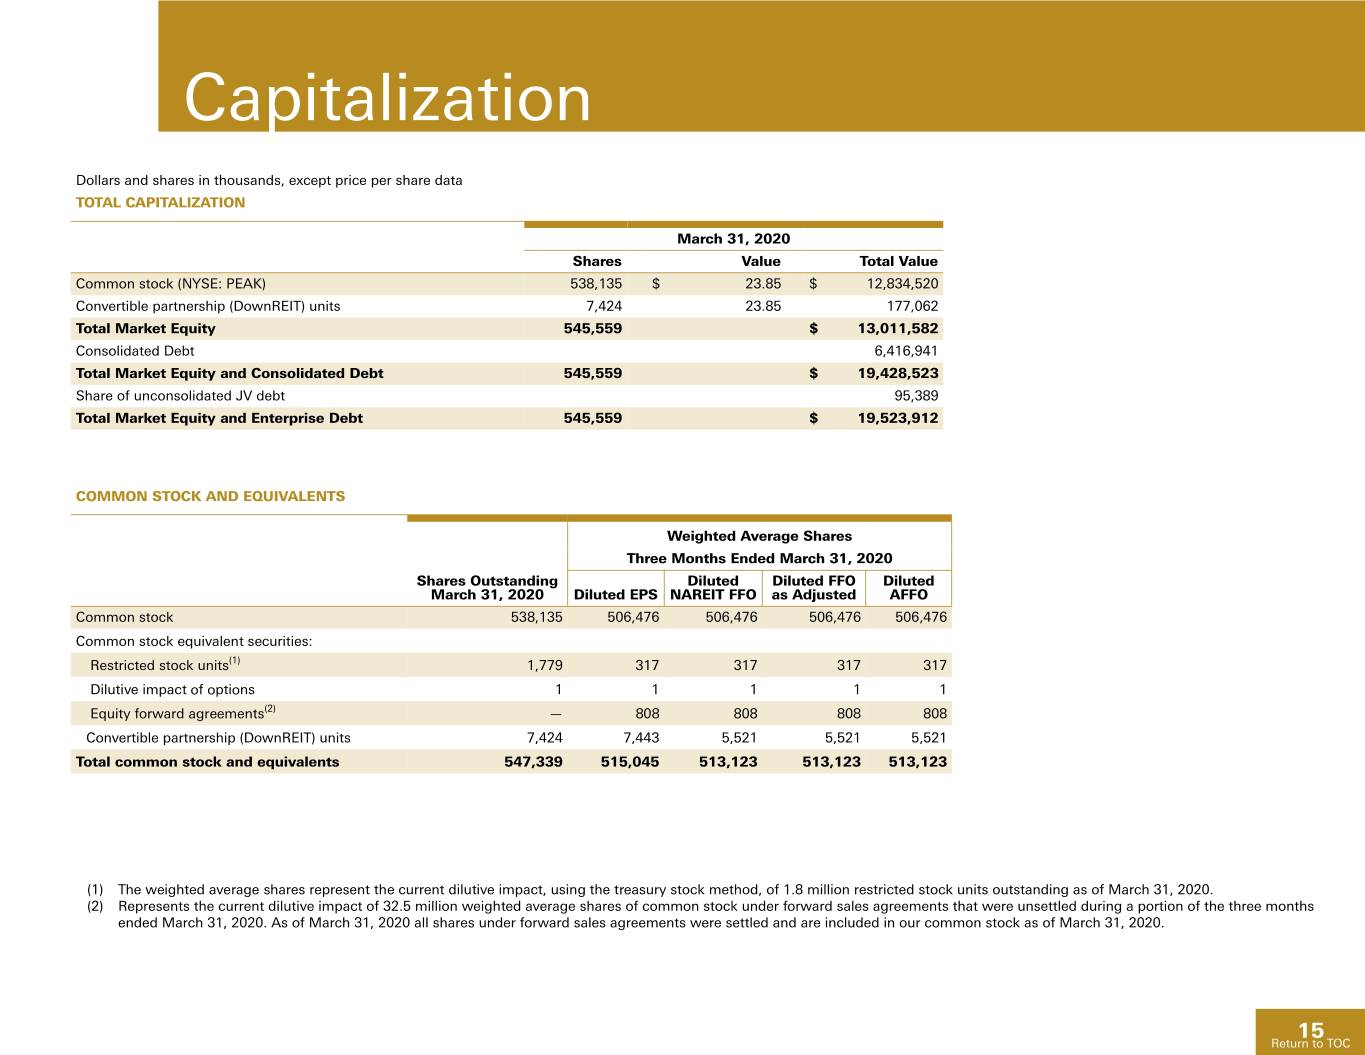
Capitalization Dollars and shares in thousands, except price per share data TOTAL CAPITALIZATION March 31, 2020 Shares Value Total Value Common stock (NYSE: PEAK) 538,135 $ 23.85 $ 12,834,520 Convertible partnership (DownREIT) units 7,424 23.85 177,062 Total Market Equity 545,559 $ 13,011,582 Consolidated Debt 6,416,941 Total Market Equity and Consolidated Debt 545,559 $ 19,428,523 Share of unconsolidated JV debt 95,389 Total Market Equity and Enterprise Debt 545,559 $ 19,523,912 COMMON STOCK AND EQUIVALENTS Weighted Average Shares Three Months Ended March 31, 2020 Shares Outstanding Diluted Diluted FFO Diluted March 31, 2020 Diluted EPS NAREIT FFO as Adjusted AFFO Common stock 538,135 506,476 506,476 506,476 506,476 Common stock equivalent securities: Restricted stock units(1) 1,779 317 317 317 317 Dilutive impact of options 1 1 1 1 1 Equity forward agreements(2) — 808 808 808 808 Convertible partnership (DownREIT) units 7,424 7,443 5,521 5,521 5,521 Total common stock and equivalents 547,339 515,045 513,123 513,123 513,123 (1) The weighted average shares represent the current dilutive impact, using the treasury stock method, of 1.8 million restricted stock units outstanding as of March 31, 2020. (2) Represents the current dilutive impact of 32.5 million weighted average shares of common stock under forward sales agreements that were unsettled during a portion of the three months ended March 31, 2020. As of March 31, 2020 all shares under forward sales agreements were settled and are included in our common stock as of March 31, 2020. 15 Return to TOC
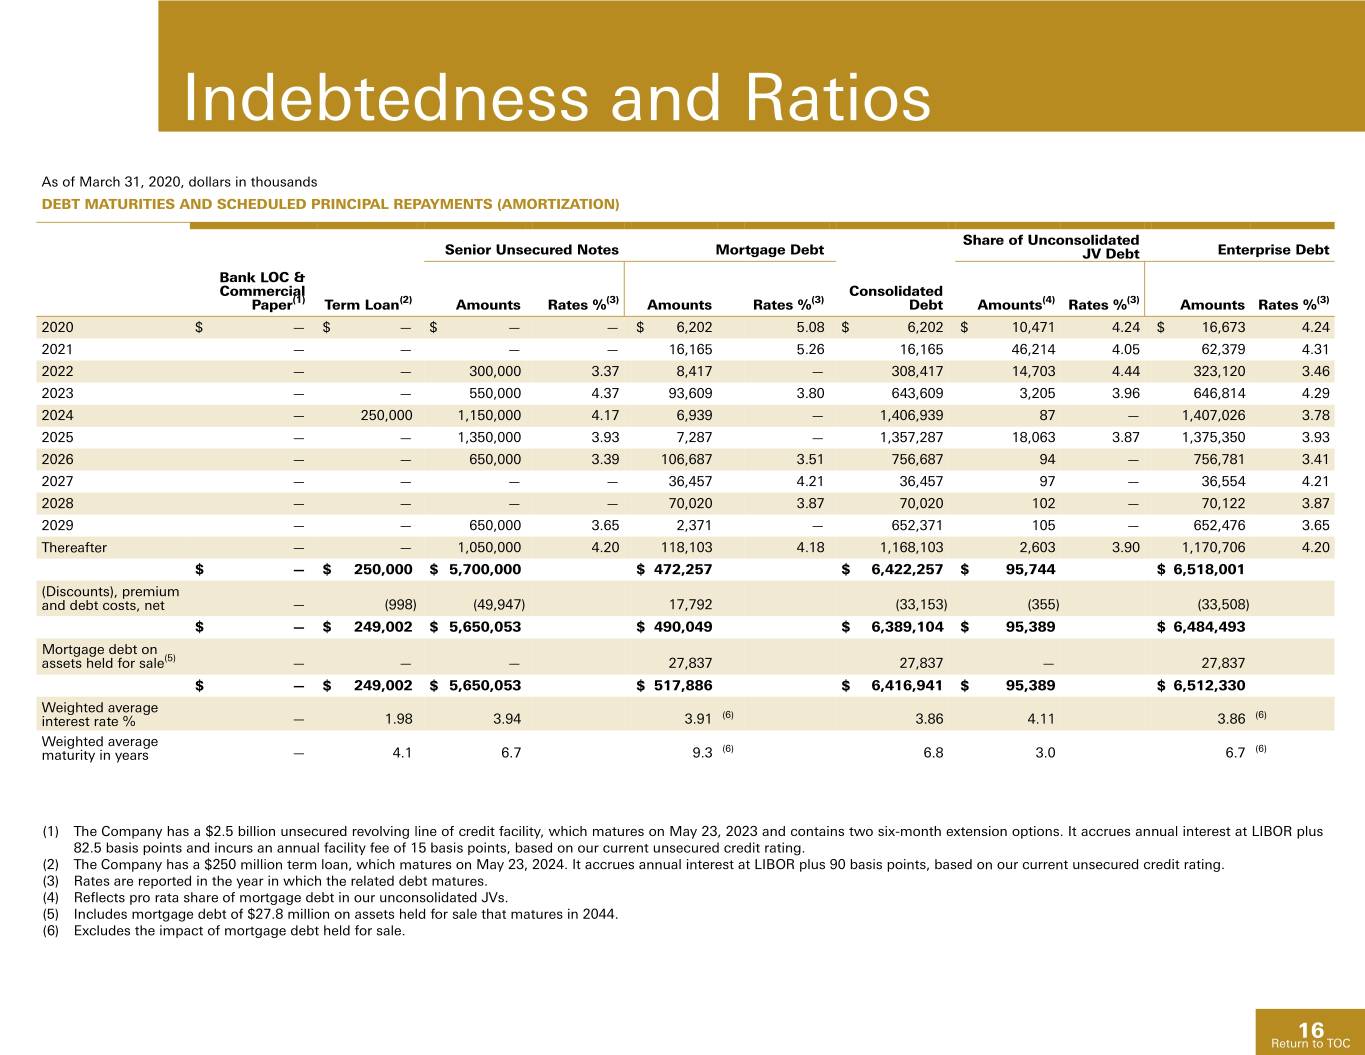
Indebtedness and Ratios As of March 31, 2020, dollars in thousands DEBT MATURITIES AND SCHEDULED PRINCIPAL REPAYMENTS (AMORTIZATION) Share of Unconsolidated Senior Unsecured Notes Mortgage Debt JV Debt Enterprise Debt Bank LOC & Commercial Consolidated Paper(1) Term Loan(2) Amounts Rates %(3) Amounts Rates %(3) Debt Amounts(4) Rates %(3) Amounts Rates %(3) 2020 $ — $ — $ — — $ 6,202 5.08 $ 6,202 $ 10,471 4.24 $ 16,673 4.24 2021 — — — — 16,165 5.26 16,165 46,214 4.05 62,379 4.31 2022 — — 300,000 3.37 8,417 — 308,417 14,703 4.44 323,120 3.46 2023 — — 550,000 4.37 93,609 3.80 643,609 3,205 3.96 646,814 4.29 2024 — 250,000 1,150,000 4.17 6,939 — 1,406,939 87 — 1,407,026 3.78 2025 — — 1,350,000 3.93 7,287 — 1,357,287 18,063 3.87 1,375,350 3.93 2026 — — 650,000 3.39 106,687 3.51 756,687 94 — 756,781 3.41 2027 — — — — 36,457 4.21 36,457 97 — 36,554 4.21 2028 — — — — 70,020 3.87 70,020 102 — 70,122 3.87 2029 — — 650,000 3.65 2,371 — 652,371 105 — 652,476 3.65 Thereafter — — 1,050,000 4.20 118,103 4.18 1,168,103 2,603 3.90 1,170,706 4.20 $ — $ 250,000 $ 5,700,000 $ 472,257 $ 6,422,257 $ 95,744 $ 6,518,001 (Discounts), premium and debt costs, net — (998) (49,947) 17,792 (33,153) (355) (33,508) $ — $ 249,002 $ 5,650,053 $ 490,049 $ 6,389,104 $ 95,389 $ 6,484,493 Mortgage debt on assets held for sale(5) — — — 27,837 27,837 — 27,837 $ — $ 249,002 $ 5,650,053 $ 517,886 $ 6,416,941 $ 95,389 $ 6,512,330 Weighted average (6) (6) interest rate % — 1.98 3.94 3.91 3.86 4.11 3.86 Weighted average (6) (6) maturity in years — 4.1 6.7 9.3 6.8 3.0 6.7 (1) The Company has a $2.5 billion unsecured revolving line of credit facility, which matures on May 23, 2023 and contains two six-month extension options. It accrues annual interest at LIBOR plus 82.5 basis points and incurs an annual facility fee of 15 basis points, based on our current unsecured credit rating. (2) The Company has a $250 million term loan, which matures on May 23, 2024. It accrues annual interest at LIBOR plus 90 basis points, based on our current unsecured credit rating. (3) Rates are reported in the year in which the related debt matures. (4) Reflects pro rata share of mortgage debt in our unconsolidated JVs. (5) Includes mortgage debt of $27.8 million on assets held for sale that matures in 2044. (6) Excludes the impact of mortgage debt held for sale. 16 Return to TOC
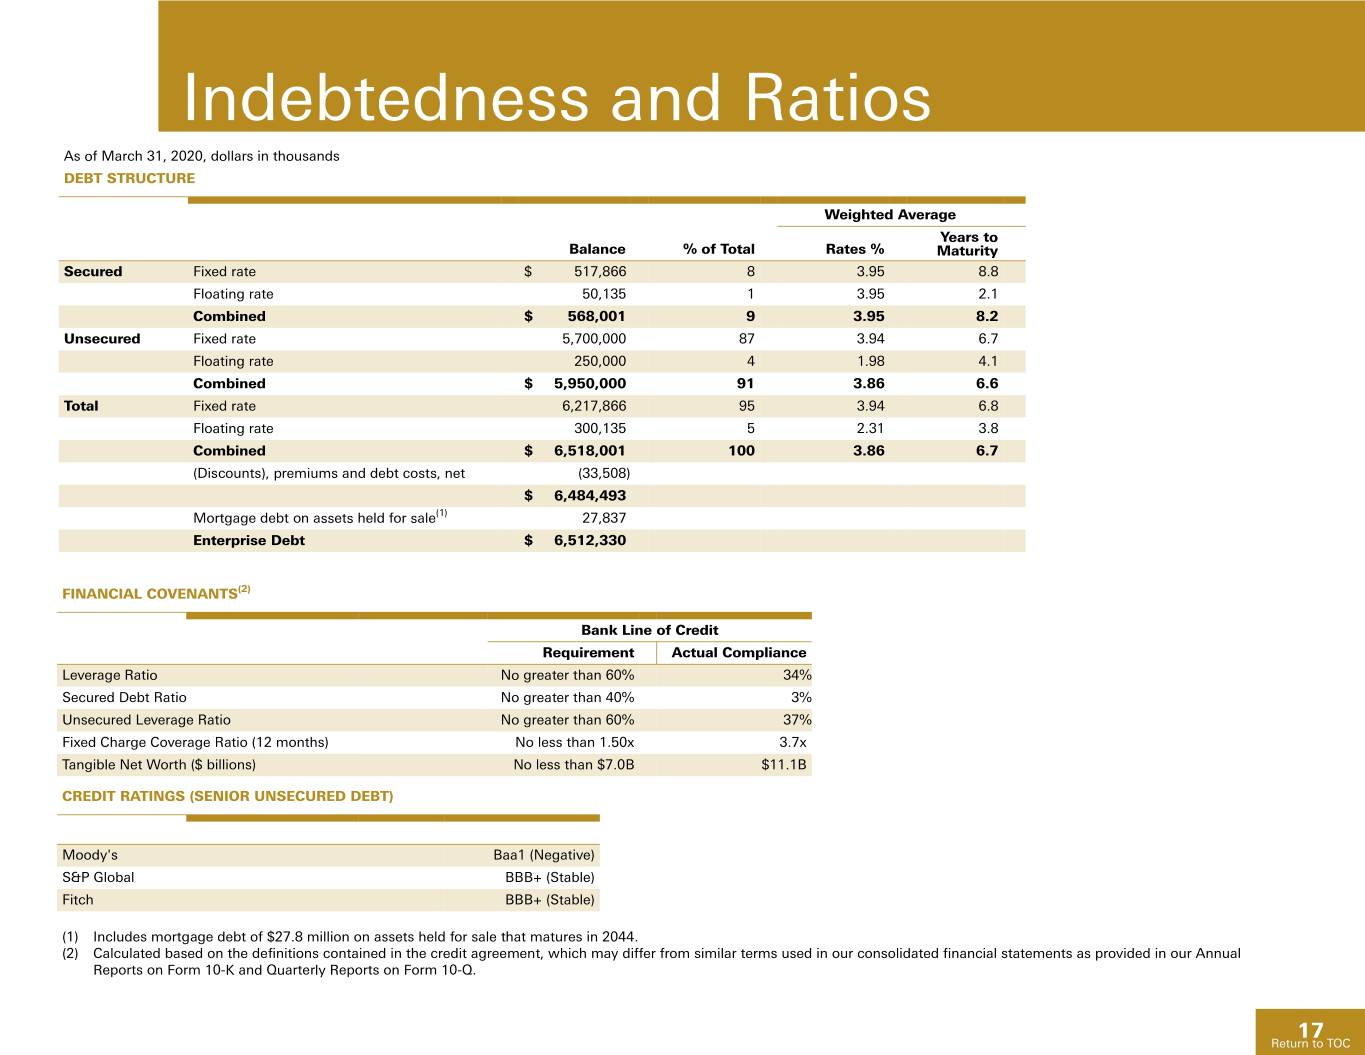
Indebtedness and Ratios As of March 31, 2020, dollars in thousands DEBT STRUCTURE Weighted Average Years to Balance % of Total Rates % Maturity Secured Fixed rate $ 517,866 8 3.95 8.8 Floating rate 50,135 1 3.95 2.1 Combined $ 568,001 9 3.95 8.2 Unsecured Fixed rate 5,700,000 87 3.94 6.7 Floating rate 250,000 4 1.98 4.1 Combined $ 5,950,000 91 3.86 6.6 Total Fixed rate 6,217,866 95 3.94 6.8 Floating rate 300,135 5 2.31 3.8 Combined $ 6,518,001 100 3.86 6.7 (Discounts), premiums and debt costs, net (33,508) $ 6,484,493 Mortgage debt on assets held for sale(1) 27,837 Enterprise Debt $ 6,512,330 FINANCIAL COVENANTS(2) Bank Line of Credit Requirement Actual Compliance Leverage Ratio No greater than 60% 34% Secured Debt Ratio No greater than 40% 3% Unsecured Leverage Ratio No greater than 60% 37% Fixed Charge Coverage Ratio (12 months) No less than 1.50x 3.7x Tangible Net Worth ($ billions) No less than $7.0B $11.1B CREDIT RATINGS (SENIOR UNSECURED DEBT) Moody's Baa1 (Negative) S&P Global BBB+ (Stable) Fitch BBB+ (Stable) (1) Includes mortgage debt of $27.8 million on assets held for sale that matures in 2044. (2) Calculated based on the definitions contained in the credit agreement, which may differ from similar terms used in our consolidated financial statements as provided in our Annual Reports on Form 10-K and Quarterly Reports on Form 10-Q. 17 Return to TOC
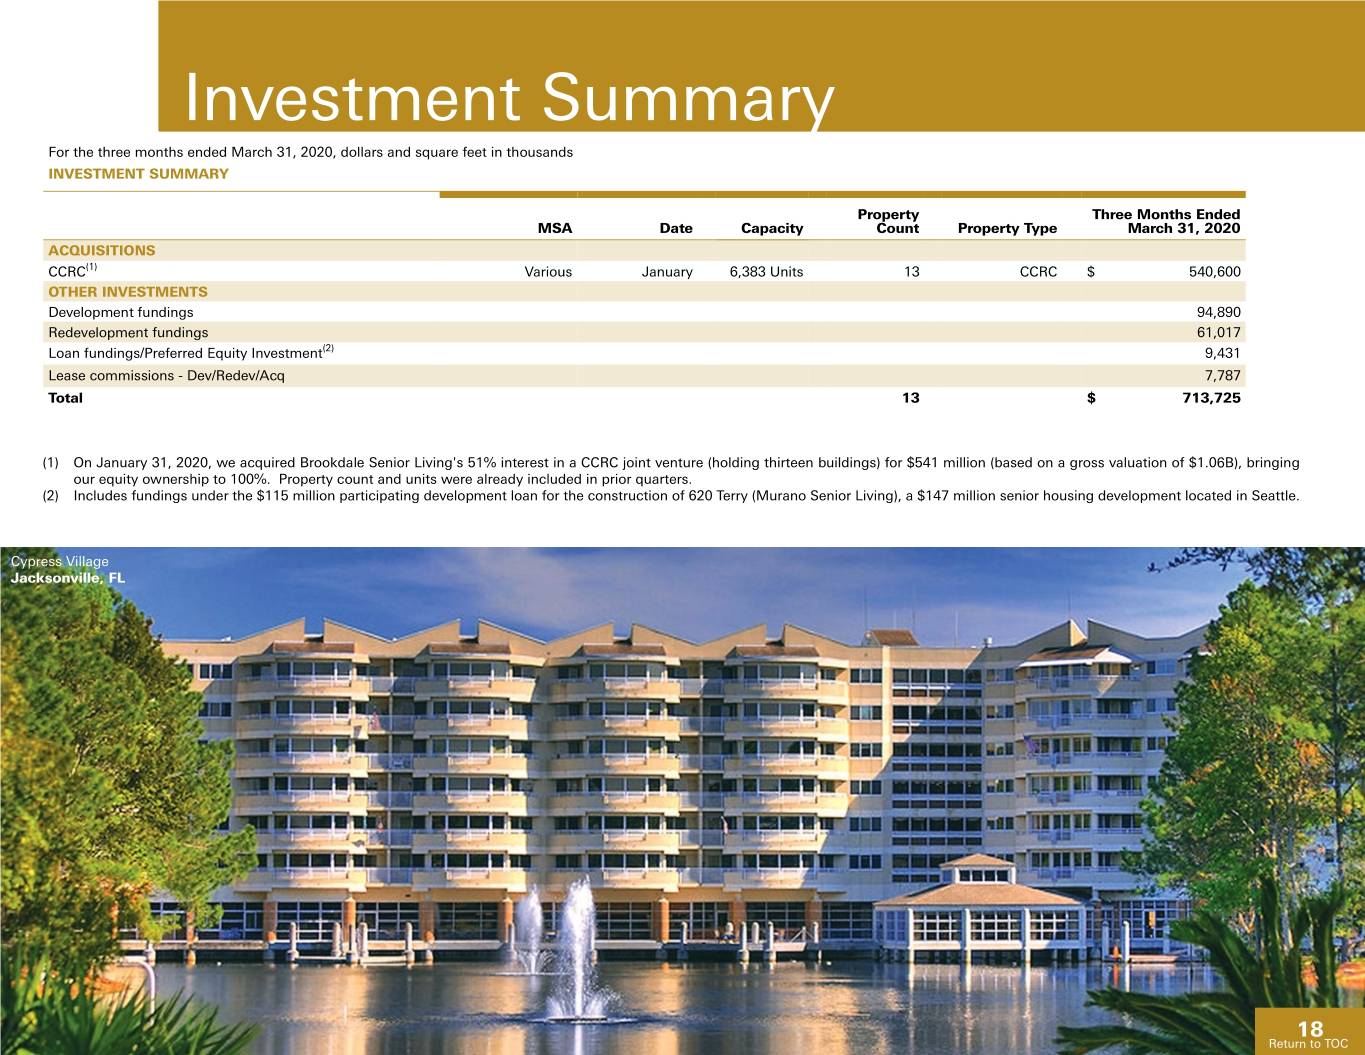
Investment Summary For the three months ended March 31, 2020, dollars and square feet in thousands INVESTMENT SUMMARY Property Three Months Ended MSA Date Capacity Count Property Type March 31, 2020 ACQUISITIONS CCRC(1) Various January 6,383 Units 13 CCRC $ 540,600 OTHER INVESTMENTS Development fundings 94,890 Redevelopment fundings 61,017 Loan fundings/Preferred Equity Investment(2) 9,431 Lease commissions - Dev/Redev/Acq 7,787 Total 13 $ 713,725 (1) On January 31, 2020, we acquired Brookdale Senior Living's 51% interest in a CCRC joint venture (holding thirteen buildings) for $541 million (based on a gross valuation of $1.06B), bringing our equity ownership to 100%. Property count and units were already included in prior quarters. (2) Includes fundings under the $115 million participating development loan for the construction of 620 Terry (Murano Senior Living), a $147 million senior housing development located in Seattle. Cypress Village Jacksonville, FL 18 ReturnReturn toto TOCTOC
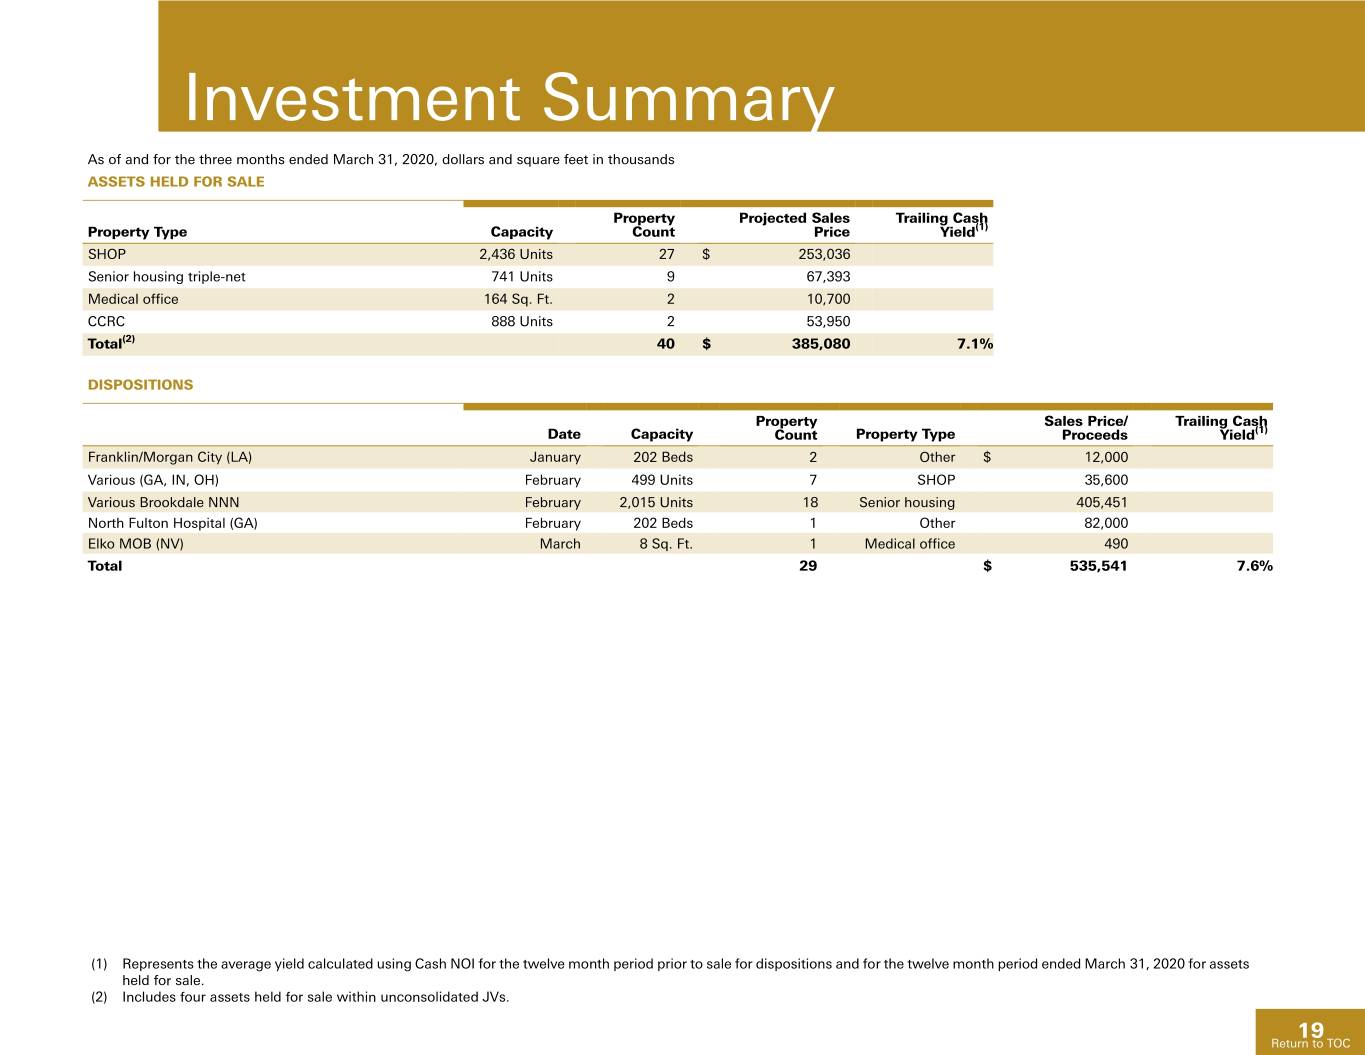
Investment Summary As of and for the three months ended March 31, 2020, dollars and square feet in thousands ASSETS HELD FOR SALE Property Projected Sales Trailing Cash Property Type Capacity Count Price Yield(1) SHOP 2,436 Units 27 $ 253,036 Senior housing triple-net 741 Units 9 67,393 Medical office 164 Sq. Ft. 2 10,700 CCRC 888 Units 2 53,950 Total(2) 40 $ 385,080 7.1% DISPOSITIONS Property Sales Price/ Trailing Cash Date Capacity Count Property Type Proceeds Yield(1) Franklin/Morgan City (LA) January 202 Beds 2 Other $ 12,000 Various (GA, IN, OH) February 499 Units 7 SHOP 35,600 Various Brookdale NNN February 2,015 Units 18 Senior housing 405,451 North Fulton Hospital (GA) February 202 Beds 1 Other 82,000 Elko MOB (NV) March 8 Sq. Ft. 1 Medical office 490 Total 29 $ 535,541 7.6% (1) Represents the average yield calculated using Cash NOI for the twelve month period prior to sale for dispositions and for the twelve month period ended March 31, 2020 for assets held for sale. (2) Includes four assets held for sale within unconsolidated JVs. 19 Return to TOC
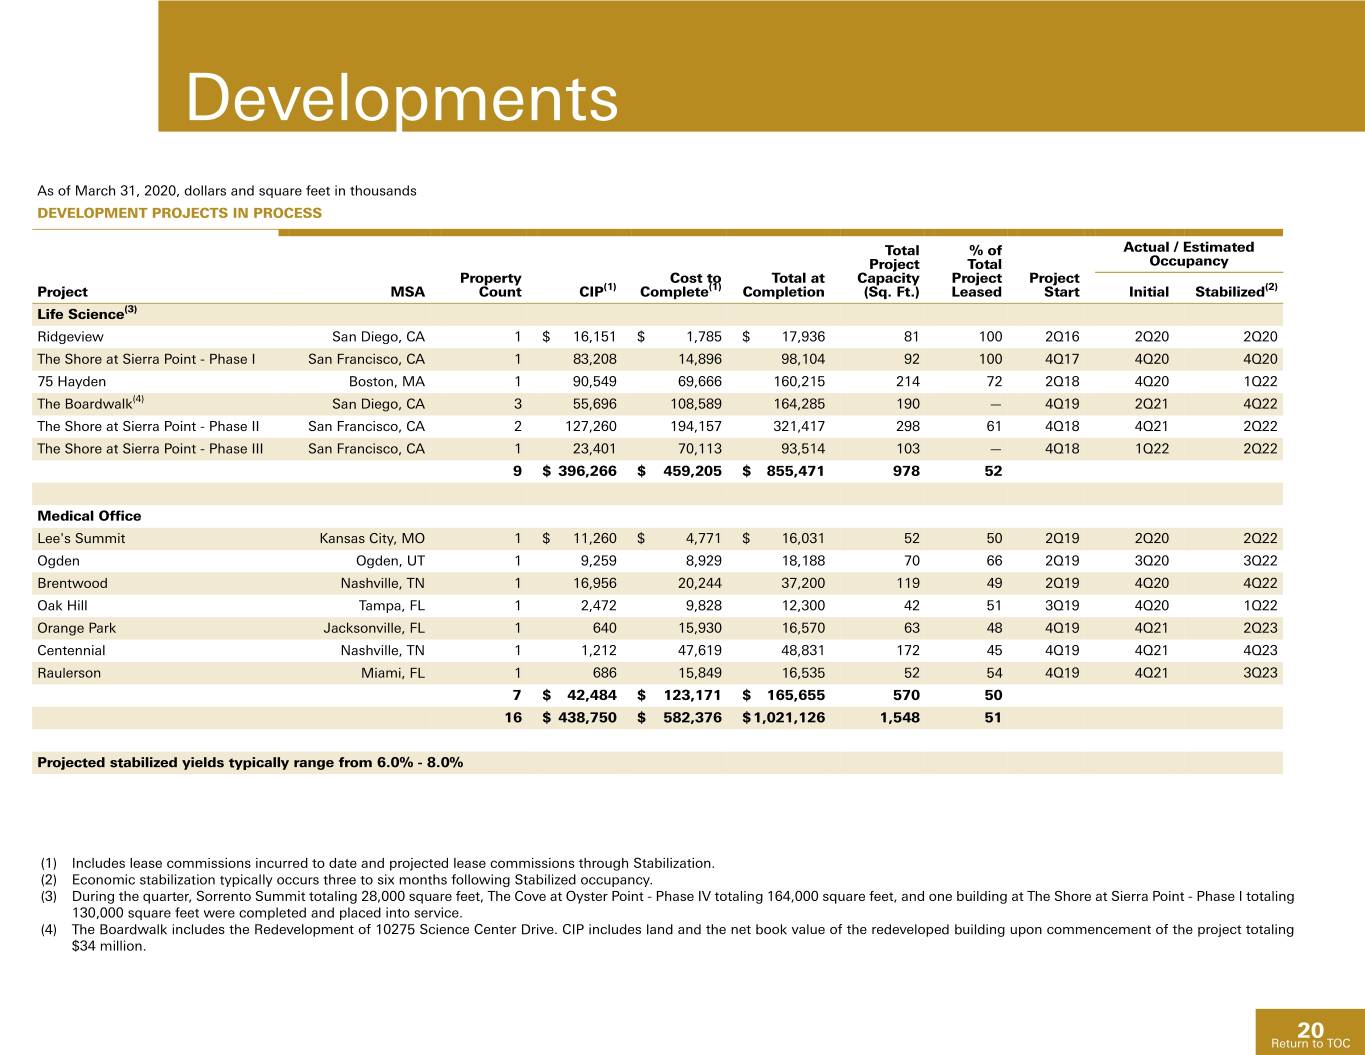
Developments As of March 31, 2020, dollars and square feet in thousands DEVELOPMENT PROJECTS IN PROCESS Total % of Actual / Estimated Project Total Occupancy Property Cost to Total at Capacity Project Project Project MSA Count CIP(1) Complete(1) Completion (Sq. Ft.) Leased Start Initial Stabilized(2) Life Science(3) Ridgeview San Diego, CA 1 $ 16,151 $ 1,785 $ 17,936 81 100 2Q16 2Q20 2Q20 The Shore at Sierra Point - Phase I San Francisco, CA 1 83,208 14,896 98,104 92 100 4Q17 4Q20 4Q20 75 Hayden Boston, MA 1 90,549 69,666 160,215 214 72 2Q18 4Q20 1Q22 The Boardwalk(4) San Diego, CA 3 55,696 108,589 164,285 190 — 4Q19 2Q21 4Q22 The Shore at Sierra Point - Phase II San Francisco, CA 2 127,260 194,157 321,417 298 61 4Q18 4Q21 2Q22 The Shore at Sierra Point - Phase III San Francisco, CA 1 23,401 70,113 93,514 103 — 4Q18 1Q22 2Q22 9 $ 396,266 $ 459,205 $ 855,471 978 52 Medical Office Lee's Summit Kansas City, MO 1 $ 11,260 $ 4,771 $ 16,031 52 50 2Q19 2Q20 2Q22 Ogden Ogden, UT 1 9,259 8,929 18,188 70 66 2Q19 3Q20 3Q22 Brentwood Nashville, TN 1 16,956 20,244 37,200 119 49 2Q19 4Q20 4Q22 Oak Hill Tampa, FL 1 2,472 9,828 12,300 42 51 3Q19 4Q20 1Q22 Orange Park Jacksonville, FL 1 640 15,930 16,570 63 48 4Q19 4Q21 2Q23 Centennial Nashville, TN 1 1,212 47,619 48,831 172 45 4Q19 4Q21 4Q23 Raulerson Miami, FL 1 686 15,849 16,535 52 54 4Q19 4Q21 3Q23 7 $ 42,484 $ 123,171 $ 165,655 570 50 16 $ 438,750 $ 582,376 $ 1,021,126 1,548 51 Projected stabilized yields typically range from 6.0% - 8.0% (1) Includes lease commissions incurred to date and projected lease commissions through Stabilization. (2) Economic stabilization typically occurs three to six months following Stabilized occupancy. (3) During the quarter, Sorrento Summit totaling 28,000 square feet, The Cove at Oyster Point - Phase IV totaling 164,000 square feet, and one building at The Shore at Sierra Point - Phase I totaling 130,000 square feet were completed and placed into service. (4) The Boardwalk includes the Redevelopment of 10275 Science Center Drive. CIP includes land and the net book value of the redeveloped building upon commencement of the project totaling $34 million. 20 Return to TOC
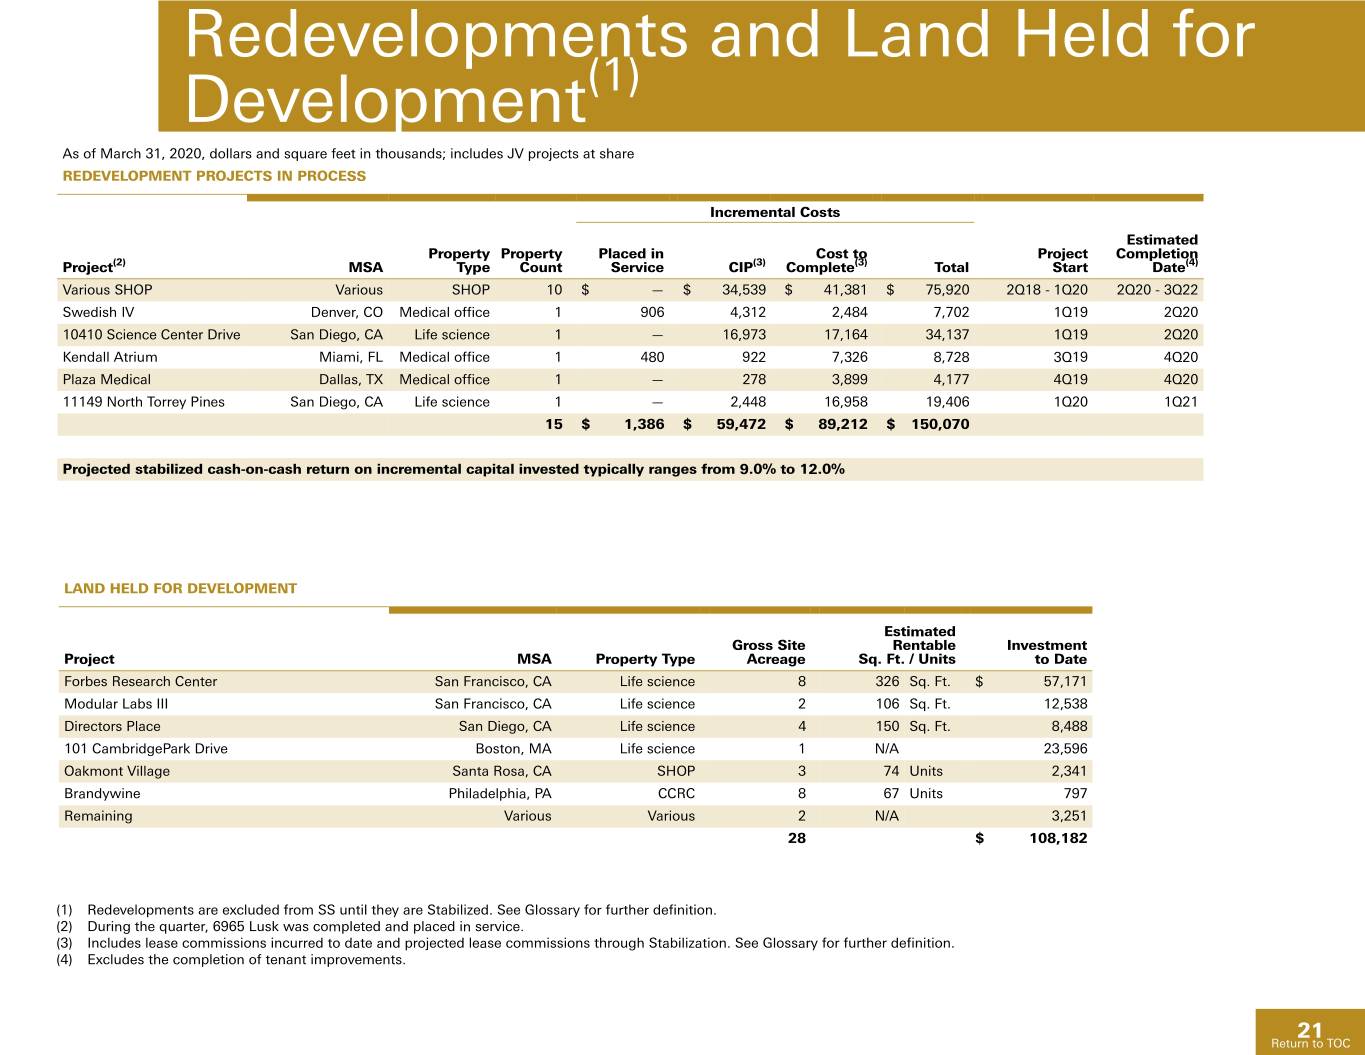
Redevelopments and Land Held for Development(1) As of March 31, 2020, dollars and square feet in thousands; includes JV projects at share REDEVELOPMENT PROJECTS IN PROCESS Incremental Costs Estimated Property Property Placed in Cost to Project Completion Project(2) MSA Type Count Service CIP(3) Complete(3) Total Start Date(4) Various SHOP Various SHOP 10 $ — $ 34,539 $ 41,381 $ 75,920 2Q18 - 1Q20 2Q20 - 3Q22 Swedish IV Denver, CO Medical office 1 906 4,312 2,484 7,702 1Q19 2Q20 10410 Science Center Drive San Diego, CA Life science 1 — 16,973 17,164 34,137 1Q19 2Q20 Kendall Atrium Miami, FL Medical office 1 480 922 7,326 8,728 3Q19 4Q20 Plaza Medical Dallas, TX Medical office 1 — 278 3,899 4,177 4Q19 4Q20 11149 North Torrey Pines San Diego, CA Life science 1 — 2,448 16,958 19,406 1Q20 1Q21 15 $ 1,386 $ 59,472 $ 89,212 $ 150,070 Projected stabilized cash-on-cash return on incremental capital invested typically ranges from 9.0% to 12.0% LAND HELD FOR DEVELOPMENT Estimated Gross Site Rentable Investment Project MSA Property Type Acreage Sq. Ft. / Units to Date Forbes Research Center San Francisco, CA Life science 8 326 Sq. Ft. $ 57,171 Modular Labs III San Francisco, CA Life science 2 106 Sq. Ft. 12,538 Directors Place San Diego, CA Life science 4 150 Sq. Ft. 8,488 101 CambridgePark Drive Boston, MA Life science 1 N/A 23,596 Oakmont Village Santa Rosa, CA SHOP 3 74 Units 2,341 Brandywine Philadelphia, PA CCRC 8 67 Units 797 Remaining Various Various 2 N/A 3,251 28 $ 108,182 (1) Redevelopments are excluded from SS until they are Stabilized. See Glossary for further definition. (2) During the quarter, 6965 Lusk was completed and placed in service. (3) Includes lease commissions incurred to date and projected lease commissions through Stabilization. See Glossary for further definition. (4) Excludes the completion of tenant improvements. 21 Return to TOC
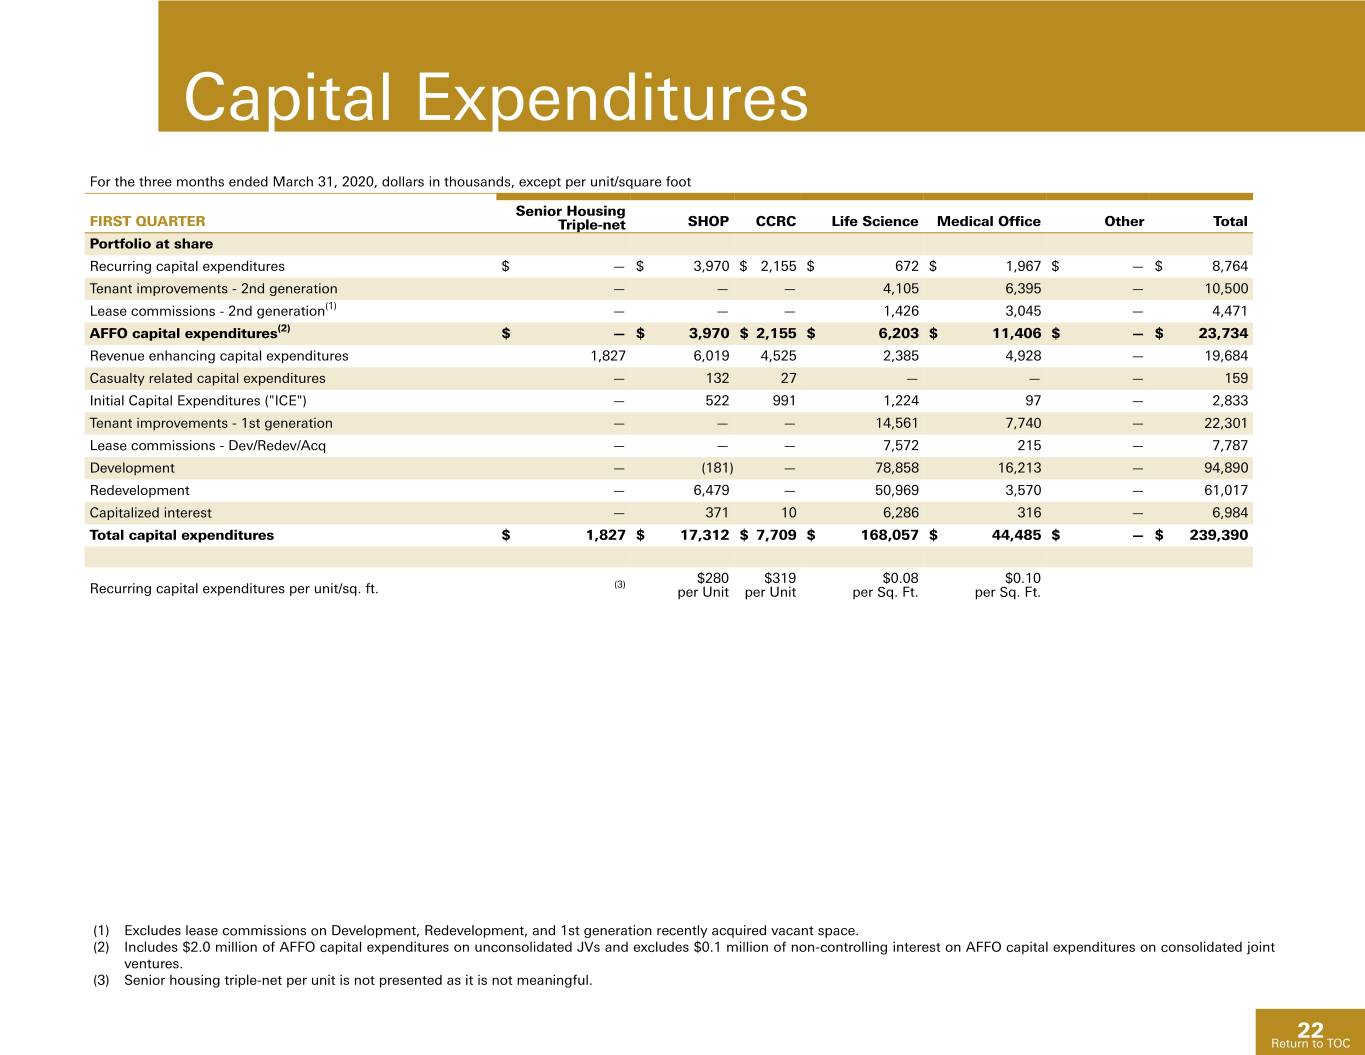
Capital Expenditures For the three months ended March 31, 2020, dollars in thousands, except per unit/square foot Senior Housing FIRST QUARTER Triple-net SHOP CCRC Life Science Medical Office Other Total Portfolio at share Recurring capital expenditures $ — $ 3,970 $ 2,155 $ 672 $ 1,967 $ — $ 8,764 Tenant improvements - 2nd generation — — — 4,105 6,395 — 10,500 Lease commissions - 2nd generation(1) — — — 1,426 3,045 — 4,471 AFFO capital expenditures(2) $ — $ 3,970 $ 2,155 $ 6,203 $ 11,406 $ — $ 23,734 Revenue enhancing capital expenditures 1,827 6,019 4,525 2,385 4,928 — 19,684 Casualty related capital expenditures — 132 27 — — — 159 Initial Capital Expenditures ("ICE") — 522 991 1,224 97 — 2,833 Tenant improvements - 1st generation — — — 14,561 7,740 — 22,301 Lease commissions - Dev/Redev/Acq — — — 7,572 215 — 7,787 Development — (181) — 78,858 16,213 — 94,890 Redevelopment — 6,479 — 50,969 3,570 — 61,017 Capitalized interest — 371 10 6,286 316 — 6,984 Total capital expenditures $ 1,827 $ 17,312 $ 7,709 $ 168,057 $ 44,485 $ — $ 239,390 (3) $280 $319 $0.08 $0.10 Recurring capital expenditures per unit/sq. ft. per Unit per Unit per Sq. Ft. per Sq. Ft. (1) Excludes lease commissions on Development, Redevelopment, and 1st generation recently acquired vacant space. (2) Includes $2.0 million of AFFO capital expenditures on unconsolidated JVs and excludes $0.1 million of non-controlling interest on AFFO capital expenditures on consolidated joint ventures. (3) Senior housing triple-net per unit is not presented as it is not meaningful. 22 Return to TOC
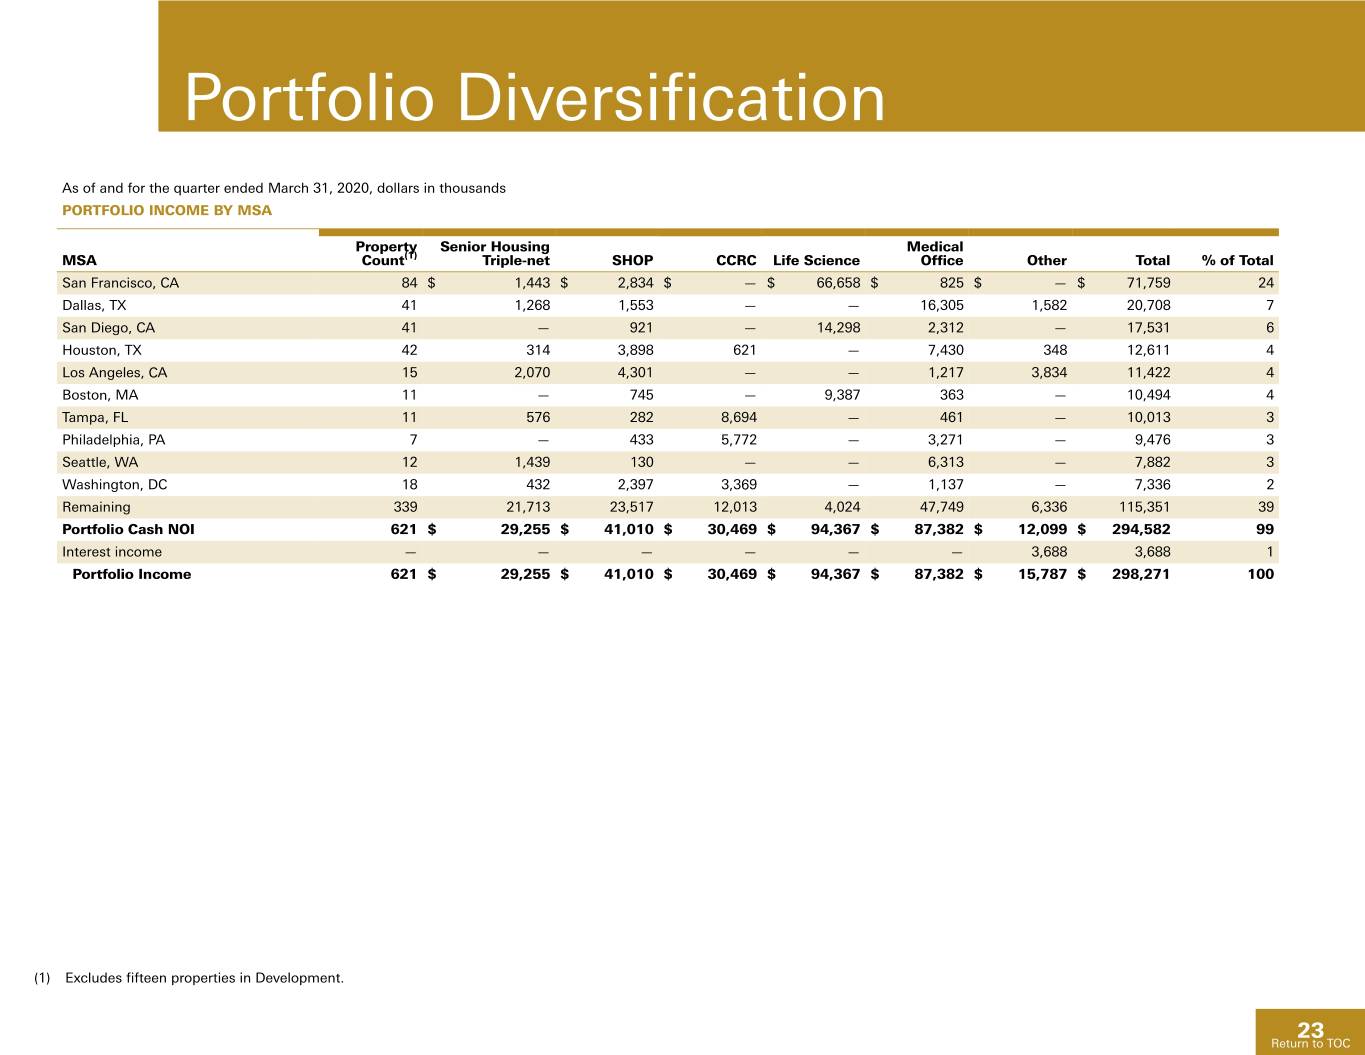
Portfolio Diversification As of and for the quarter ended March 31, 2020, dollars in thousands PORTFOLIO INCOME BY MSA Property Senior Housing Medical MSA Count(1) Triple-net SHOP CCRC Life Science Office Other Total % of Total San Francisco, CA 84 $ 1,443 $ 2,834 $ — $ 66,658 $ 825 $ — $ 71,759 24 Dallas, TX 41 1,268 1,553 — — 16,305 1,582 20,708 7 San Diego, CA 41 — 921 — 14,298 2,312 — 17,531 6 Houston, TX 42 314 3,898 621 — 7,430 348 12,611 4 Los Angeles, CA 15 2,070 4,301 — — 1,217 3,834 11,422 4 Boston, MA 11 — 745 — 9,387 363 — 10,494 4 Tampa, FL 11 576 282 8,694 — 461 — 10,013 3 Philadelphia, PA 7 — 433 5,772 — 3,271 — 9,476 3 Seattle, WA 12 1,439 130 — — 6,313 — 7,882 3 Washington, DC 18 432 2,397 3,369 — 1,137 — 7,336 2 Remaining 339 21,713 23,517 12,013 4,024 47,749 6,336 115,351 39 Portfolio Cash NOI 621 $ 29,255 $ 41,010 $ 30,469 $ 94,367 $ 87,382 $ 12,099 $ 294,582 99 Interest income — — — — — — 3,688 3,688 1 Portfolio Income 621 $ 29,255 $ 41,010 $ 30,469 $ 94,367 $ 87,382 $ 15,787 $ 298,271 100 (1) Excludes fifteen properties in Development. 23 Return to TOC
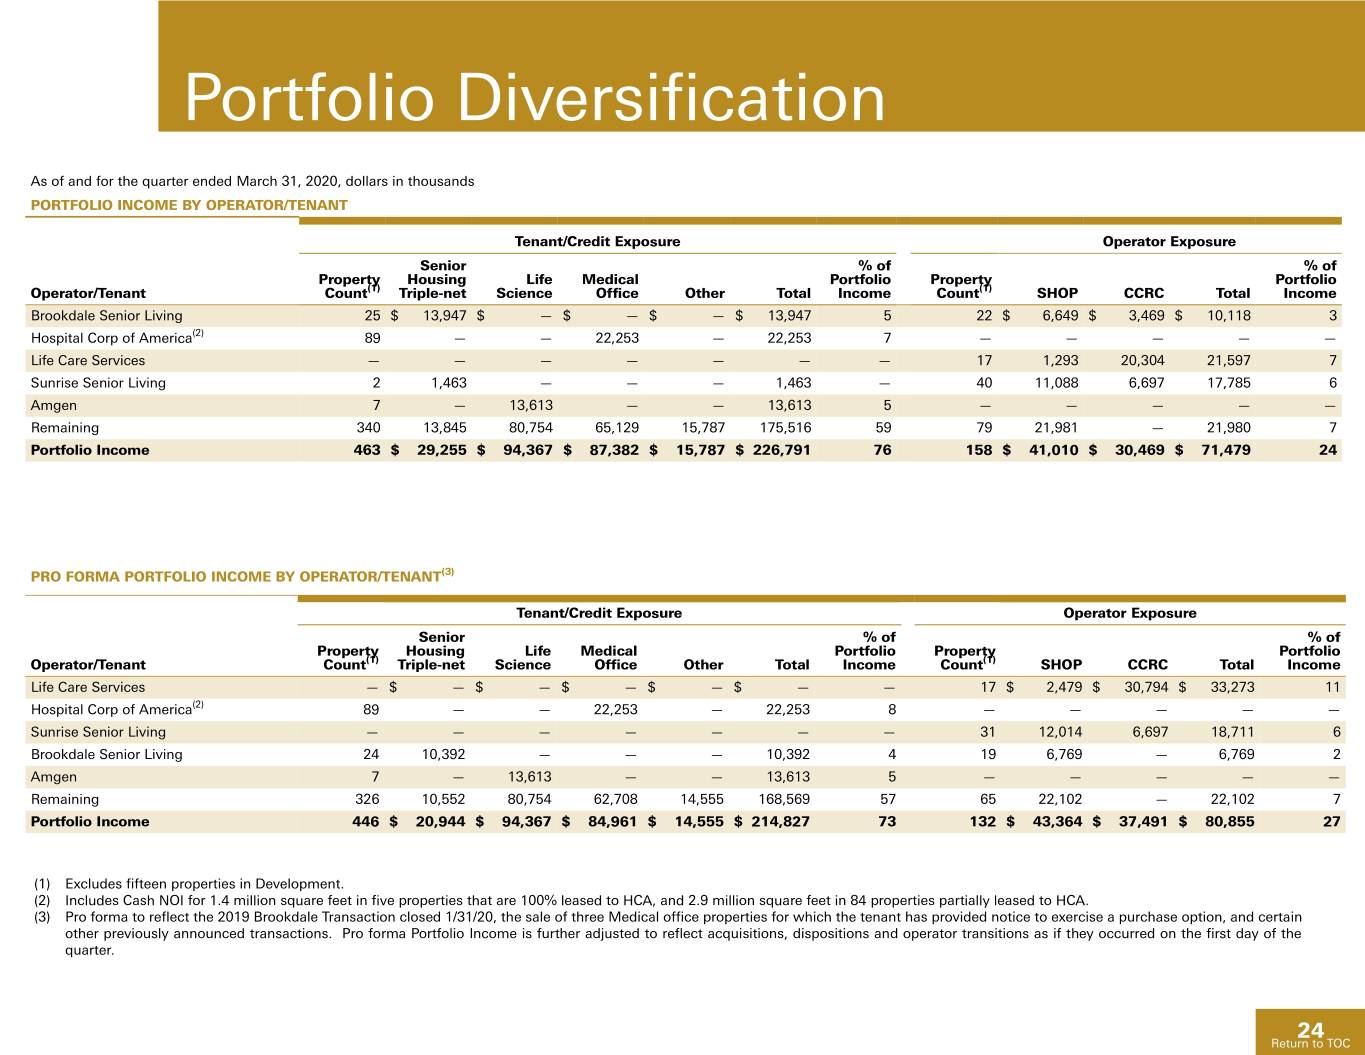
Portfolio Diversification As of and for the quarter ended March 31, 2020, dollars in thousands PORTFOLIO INCOME BY OPERATOR/TENANT Tenant/Credit Exposure Operator Exposure Senior % of % of Property Housing Life Medical Portfolio Property Portfolio Operator/Tenant Count(1) Triple-net Science Office Other Total Income Count(1) SHOP CCRC Total Income Brookdale Senior Living 25 $ 13,947 $ — $ — $ — $ 13,947 5 22 $ 6,649 $ 3,469 $ 10,118 3 Hospital Corp of America(2) 89 — — 22,253 — 22,253 7 — — — — — Life Care Services — — — — — — — 17 1,293 20,304 21,597 7 Sunrise Senior Living 2 1,463 — — — 1,463 — 40 11,088 6,697 17,785 6 Amgen 7 — 13,613 — — 13,613 5 — — — — — Remaining 340 13,845 80,754 65,129 15,787 175,516 59 79 21,981 — 21,980 7 Portfolio Income 463 $ 29,255 $ 94,367 $ 87,382 $ 15,787 $ 226,791 76 158 $ 41,010 $ 30,469 $ 71,479 24 PRO FORMA PORTFOLIO INCOME BY OPERATOR/TENANT(3) Tenant/Credit Exposure Operator Exposure Senior % of % of Property Housing Life Medical Portfolio Property Portfolio Operator/Tenant Count(1) Triple-net Science Office Other Total Income Count(1) SHOP CCRC Total Income Life Care Services — $ — $ — $ — $ — $ — — 17 $ 2,479 $ 30,794 $ 33,273 11 Hospital Corp of America(2) 89 — — 22,253 — 22,253 8 — — — — — Sunrise Senior Living — — — — — — — 31 12,014 6,697 18,711 6 Brookdale Senior Living 24 10,392 — — — 10,392 4 19 6,769 — 6,769 2 Amgen 7 — 13,613 — — 13,613 5 — — — — — Remaining 326 10,552 80,754 62,708 14,555 168,569 57 65 22,102 — 22,102 7 Portfolio Income 446 $ 20,944 $ 94,367 $ 84,961 $ 14,555 $ 214,827 73 132 $ 43,364 $ 37,491 $ 80,855 27 (1) Excludes fifteen properties in Development. (2) Includes Cash NOI for 1.4 million square feet in five properties that are 100% leased to HCA, and 2.9 million square feet in 84 properties partially leased to HCA. (3) Pro forma to reflect the 2019 Brookdale Transaction closed 1/31/20, the sale of three Medical office properties for which the tenant has provided notice to exercise a purchase option, and certain other previously announced transactions. Pro forma Portfolio Income is further adjusted to reflect acquisitions, dispositions and operator transitions as if they occurred on the first day of the quarter. 24 Return to TOC
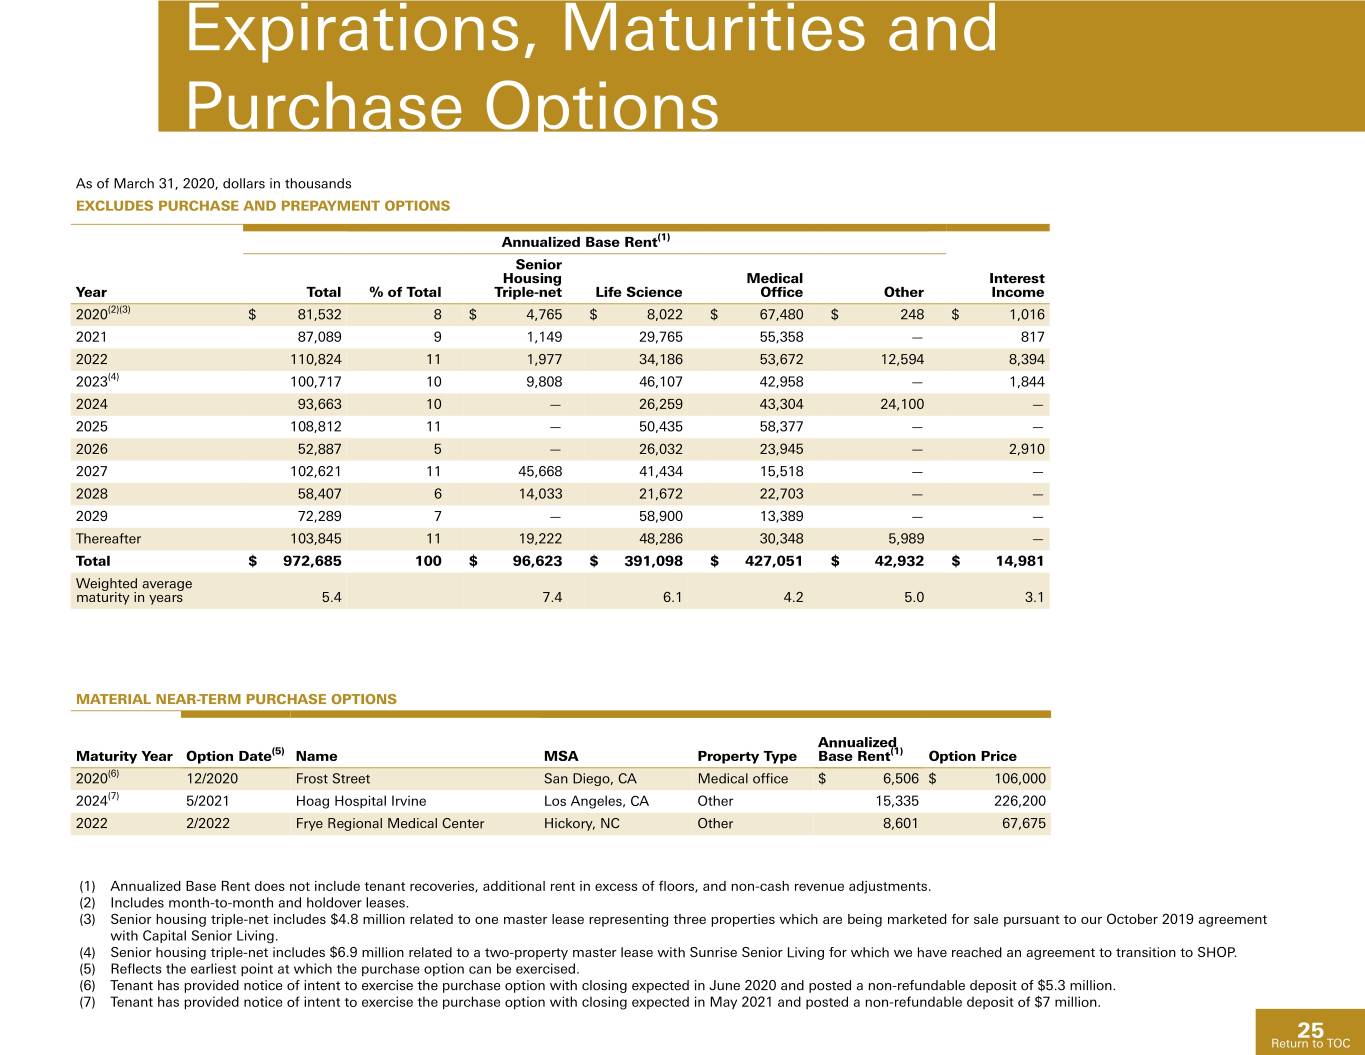
Expirations, Maturities and Purchase Options As of March 31, 2020, dollars in thousands EXCLUDES PURCHASE AND PREPAYMENT OPTIONS Annualized Base Rent(1) Senior Housing Medical Interest Year Total % of Total Triple-net Life Science Office Other Income 2020(2)(3) $ 81,532 8 $ 4,765 $ 8,022 $ 67,480 $ 248 $ 1,016 2021 87,089 9 1,149 29,765 55,358 — 817 2022 110,824 11 1,977 34,186 53,672 12,594 8,394 2023(4) 100,717 10 9,808 46,107 42,958 — 1,844 2024 93,663 10 — 26,259 43,304 24,100 — 2025 108,812 11 — 50,435 58,377 — — 2026 52,887 5 — 26,032 23,945 — 2,910 2027 102,621 11 45,668 41,434 15,518 — — 2028 58,407 6 14,033 21,672 22,703 — — 2029 72,289 7 — 58,900 13,389 — — Thereafter 103,845 11 19,222 48,286 30,348 5,989 — Total $ 972,685 100 $ 96,623 $ 391,098 $ 427,051 $ 42,932 $ 14,981 Weighted average maturity in years 5.4 7.4 6.1 4.2 5.0 3.1 MATERIAL NEAR-TERM PURCHASE OPTIONS Annualized Maturity Year Option Date(5) Name MSA Property Type Base Rent(1) Option Price 2020(6) 12/2020 Frost Street San Diego, CA Medical office $ 6,506 $ 106,000 2024(7) 5/2021 Hoag Hospital Irvine Los Angeles, CA Other 15,335 226,200 2022 2/2022 Frye Regional Medical Center Hickory, NC Other 8,601 67,675 (1) Annualized Base Rent does not include tenant recoveries, additional rent in excess of floors, and non-cash revenue adjustments. (2) Includes month-to-month and holdover leases. (3) Senior housing triple-net includes $4.8 million related to one master lease representing three properties which are being marketed for sale pursuant to our October 2019 agreement with Capital Senior Living. (4) Senior housing triple-net includes $6.9 million related to a two-property master lease with Sunrise Senior Living for which we have reached an agreement to transition to SHOP. (5) Reflects the earliest point at which the purchase option can be exercised. (6) Tenant has provided notice of intent to exercise the purchase option with closing expected in June 2020 and posted a non-refundable deposit of $5.3 million. (7) Tenant has provided notice of intent to exercise the purchase option with closing expected in May 2021 and posted a non-refundable deposit of $7 million. 25 Return to TOC
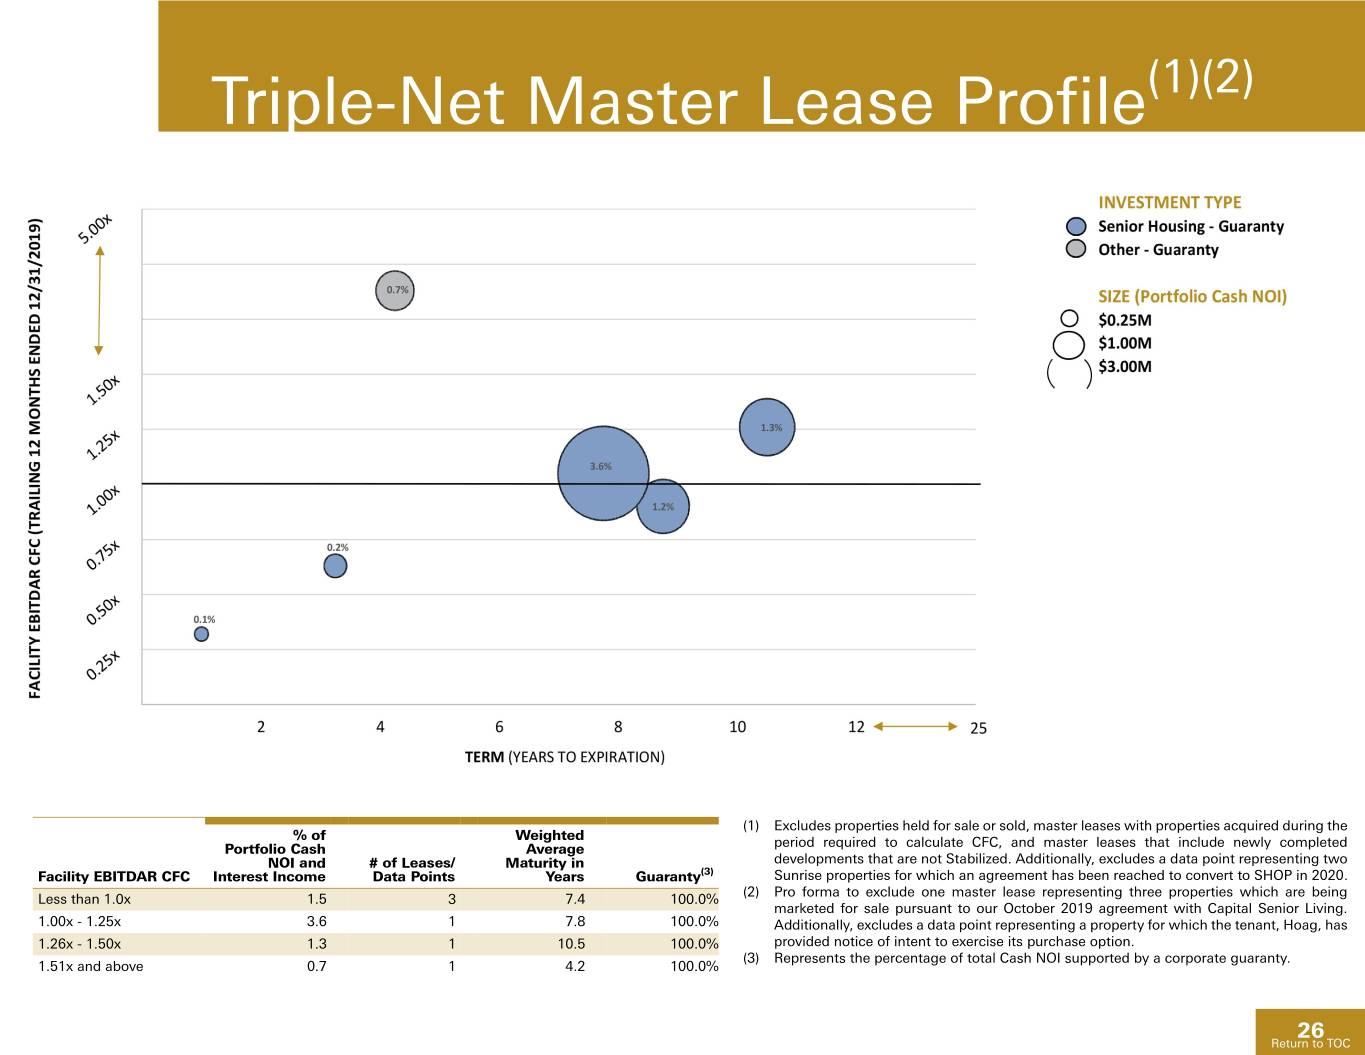
Triple-Net Master Lease Profile(1)(2) (1) Excludes properties held for sale or sold, master leases with properties acquired during the % of Weighted Portfolio Cash Average period required to calculate CFC, and master leases that include newly completed NOI and # of Leases/ Maturity in developments that are not Stabilized. Additionally, excludes a data point representing two Facility EBITDAR CFC Interest Income Data Points Years Guaranty(3) Sunrise properties for which an agreement has been reached to convert to SHOP in 2020. (2) Pro forma to exclude one master lease representing three properties which are being Less than 1.0x 1.5 3 7.4 100.0% marketed for sale pursuant to our October 2019 agreement with Capital Senior Living. 1.00x - 1.25x 3.6 1 7.8 100.0% Additionally, excludes a data point representing a property for which the tenant, Hoag, has 1.26x - 1.50x 1.3 1 10.5 100.0% provided notice of intent to exercise its purchase option. (3) Represents the percentage of total Cash NOI supported by a corporate guaranty. 1.51x and above 0.7 1 4.2 100.0% 26 Return to TOC
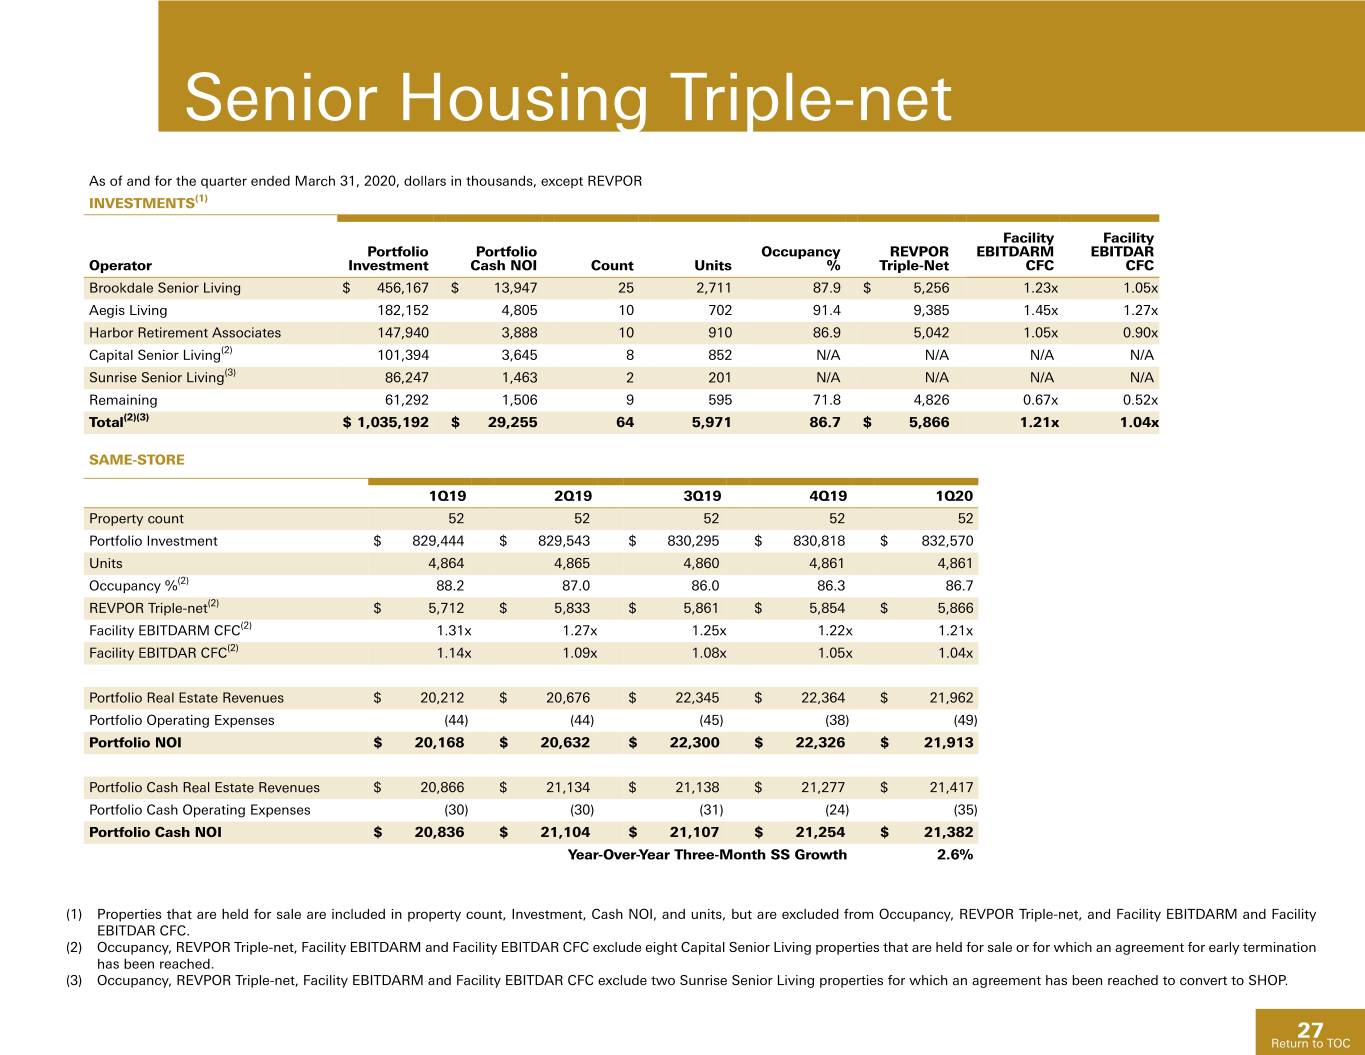
Senior Housing Triple-net As of and for the quarter ended March 31, 2020, dollars in thousands, except REVPOR INVESTMENTS(1) Facility Facility Portfolio Portfolio Occupancy REVPOR EBITDARM EBITDAR Operator Investment Cash NOI Count Units % Triple-Net CFC CFC Brookdale Senior Living $ 456,167 $ 13,947 25 2,711 87.9 $ 5,256 1.23x 1.05x Aegis Living 182,152 4,805 10 702 91.4 9,385 1.45x 1.27x Harbor Retirement Associates 147,940 3,888 10 910 86.9 5,042 1.05x 0.90x Capital Senior Living(2) 101,394 3,645 8 852 N/A N/A N/A N/A Sunrise Senior Living(3) 86,247 1,463 2 201 N/A N/A N/A N/A Remaining 61,292 1,506 9 595 71.8 4,826 0.67x 0.52x Total(2)(3) $ 1,035,192 $ 29,255 64 5,971 86.7 $ 5,866 1.21x 1.04x SAME-STORE 1Q19 2Q19 3Q19 4Q19 1Q20 Property count 52 52 52 52 52 Portfolio Investment $ 829,444 $ 829,543 $ 830,295 $ 830,818 $ 832,570 Units 4,864 4,865 4,860 4,861 4,861 Occupancy %(2) 88.2 87.0 86.0 86.3 86.7 REVPOR Triple-net(2) $ 5,712 $ 5,833 $ 5,861 $ 5,854 $ 5,866 Facility EBITDARM CFC(2) 1.31x 1.27x 1.25x 1.22x 1.21x Facility EBITDAR CFC(2) 1.14x 1.09x 1.08x 1.05x 1.04x Portfolio Real Estate Revenues $ 20,212 $ 20,676 $ 22,345 $ 22,364 $ 21,962 Portfolio Operating Expenses (44) (44) (45) (38) (49) Portfolio NOI $ 20,168 $ 20,632 $ 22,300 $ 22,326 $ 21,913 Portfolio Cash Real Estate Revenues $ 20,866 $ 21,134 $ 21,138 $ 21,277 $ 21,417 Portfolio Cash Operating Expenses (30) (30) (31) (24) (35) Portfolio Cash NOI $ 20,836 $ 21,104 $ 21,107 $ 21,254 $ 21,382 Year-Over-Year Three-Month SS Growth 2.6% (1) Properties that are held for sale are included in property count, Investment, Cash NOI, and units, but are excluded from Occupancy, REVPOR Triple-net, and Facility EBITDARM and Facility EBITDAR CFC. (2) Occupancy, REVPOR Triple-net, Facility EBITDARM and Facility EBITDAR CFC exclude eight Capital Senior Living properties that are held for sale or for which an agreement for early termination has been reached. (3) Occupancy, REVPOR Triple-net, Facility EBITDARM and Facility EBITDAR CFC exclude two Sunrise Senior Living properties for which an agreement has been reached to convert to SHOP. 27 Return to TOC
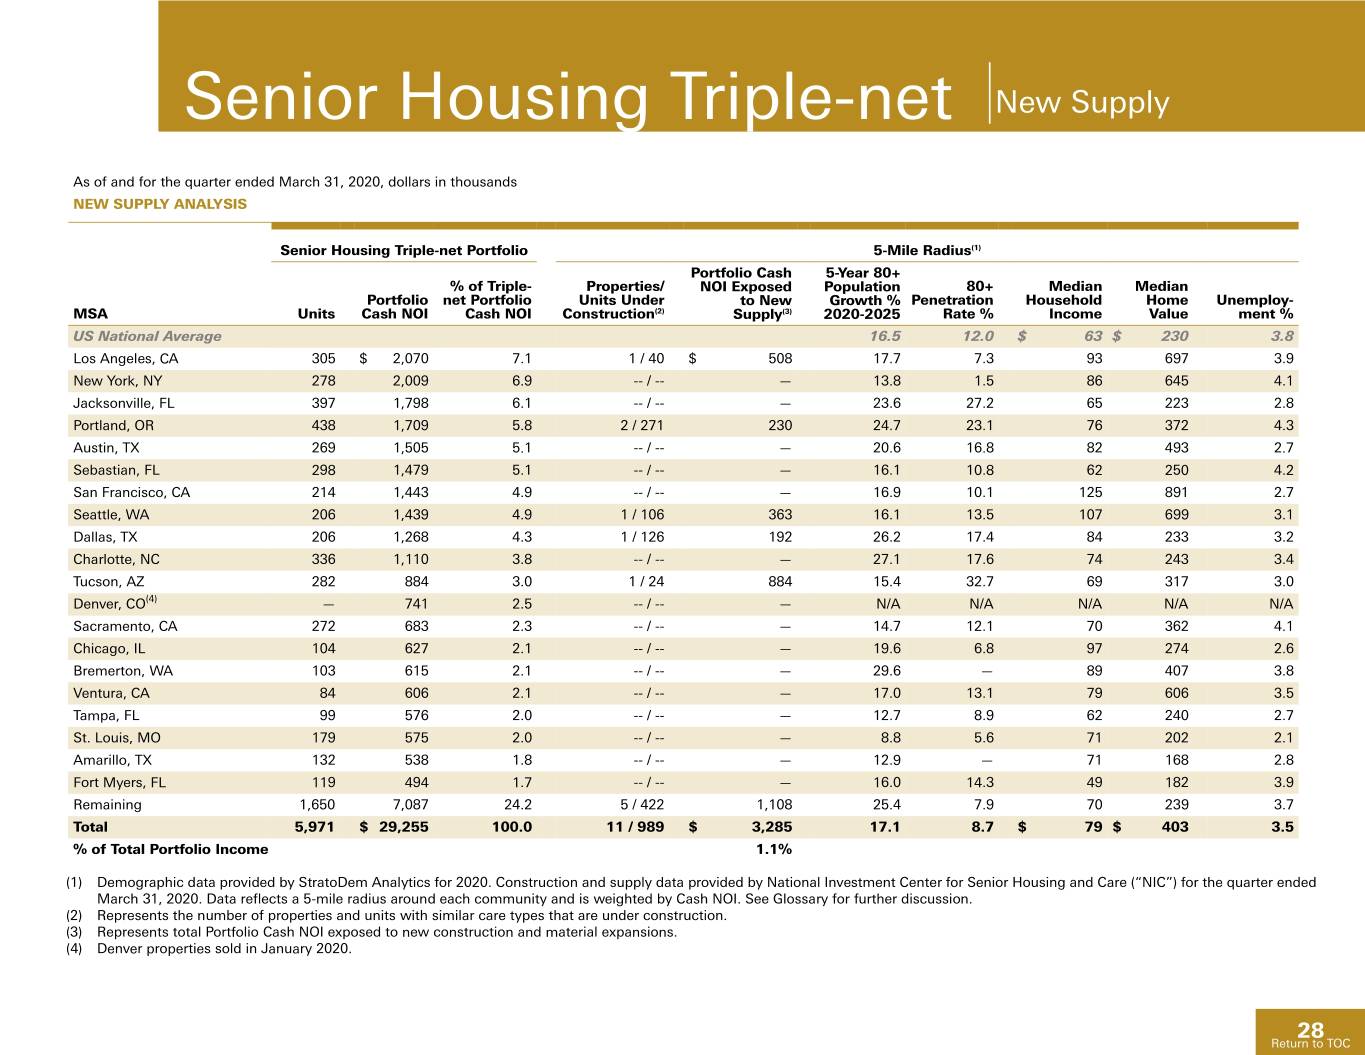
Senior Housing Triple-net New Supply As of and for the quarter ended March 31, 2020, dollars in thousands NEW SUPPLY ANALYSIS Senior Housing Triple-net Portfolio 5-Mile Radius(1) Portfolio Cash 5-Year 80+ % of Triple- Properties/ NOI Exposed Population 80+ Median Median Portfolio net Portfolio Units Under to New Growth % Penetration Household Home Unemploy- MSA Units Cash NOI Cash NOI Construction(2) Supply(3) 2020-2025 Rate % Income Value ment % US National Average 16.5 12.0 $ 63 $ 230 3.8 Los Angeles, CA 305 $ 2,070 7.1 1 / 40 $ 508 17.7 7.3 93 697 3.9 New York, NY 278 2,009 6.9 -- / -- — 13.8 1.5 86 645 4.1 Jacksonville, FL 397 1,798 6.1 -- / -- — 23.6 27.2 65 223 2.8 Portland, OR 438 1,709 5.8 2 / 271 230 24.7 23.1 76 372 4.3 Austin, TX 269 1,505 5.1 -- / -- — 20.6 16.8 82 493 2.7 Sebastian, FL 298 1,479 5.1 -- / -- — 16.1 10.8 62 250 4.2 San Francisco, CA 214 1,443 4.9 -- / -- — 16.9 10.1 125 891 2.7 Seattle, WA 206 1,439 4.9 1 / 106 363 16.1 13.5 107 699 3.1 Dallas, TX 206 1,268 4.3 1 / 126 192 26.2 17.4 84 233 3.2 Charlotte, NC 336 1,110 3.8 -- / -- — 27.1 17.6 74 243 3.4 Tucson, AZ 282 884 3.0 1 / 24 884 15.4 32.7 69 317 3.0 Denver, CO(4) — 741 2.5 -- / -- — N/A N/A N/A N/A N/A Sacramento, CA 272 683 2.3 -- / -- — 14.7 12.1 70 362 4.1 Chicago, IL 104 627 2.1 -- / -- — 19.6 6.8 97 274 2.6 Bremerton, WA 103 615 2.1 -- / -- — 29.6 — 89 407 3.8 Ventura, CA 84 606 2.1 -- / -- — 17.0 13.1 79 606 3.5 Tampa, FL 99 576 2.0 -- / -- — 12.7 8.9 62 240 2.7 St. Louis, MO 179 575 2.0 -- / -- — 8.8 5.6 71 202 2.1 Amarillo, TX 132 538 1.8 -- / -- — 12.9 — 71 168 2.8 Fort Myers, FL 119 494 1.7 -- / -- — 16.0 14.3 49 182 3.9 Remaining 1,650 7,087 24.2 5 / 422 1,108 25.4 7.9 70 239 3.7 Total 5,971 $ 29,255 100.0 11 / 989 $ 3,285 17.1 8.7 $ 79 $ 403 3.5 % of Total Portfolio Income 1.1% (1) Demographic data provided by StratoDem Analytics for 2020. Construction and supply data provided by National Investment Center for Senior Housing and Care (“NIC”) for the quarter ended March 31, 2020. Data reflects a 5-mile radius around each community and is weighted by Cash NOI. See Glossary for further discussion. (2) Represents the number of properties and units with similar care types that are under construction. (3) Represents total Portfolio Cash NOI exposed to new construction and material expansions. (4) Denver properties sold in January 2020. 28 Return to TOC
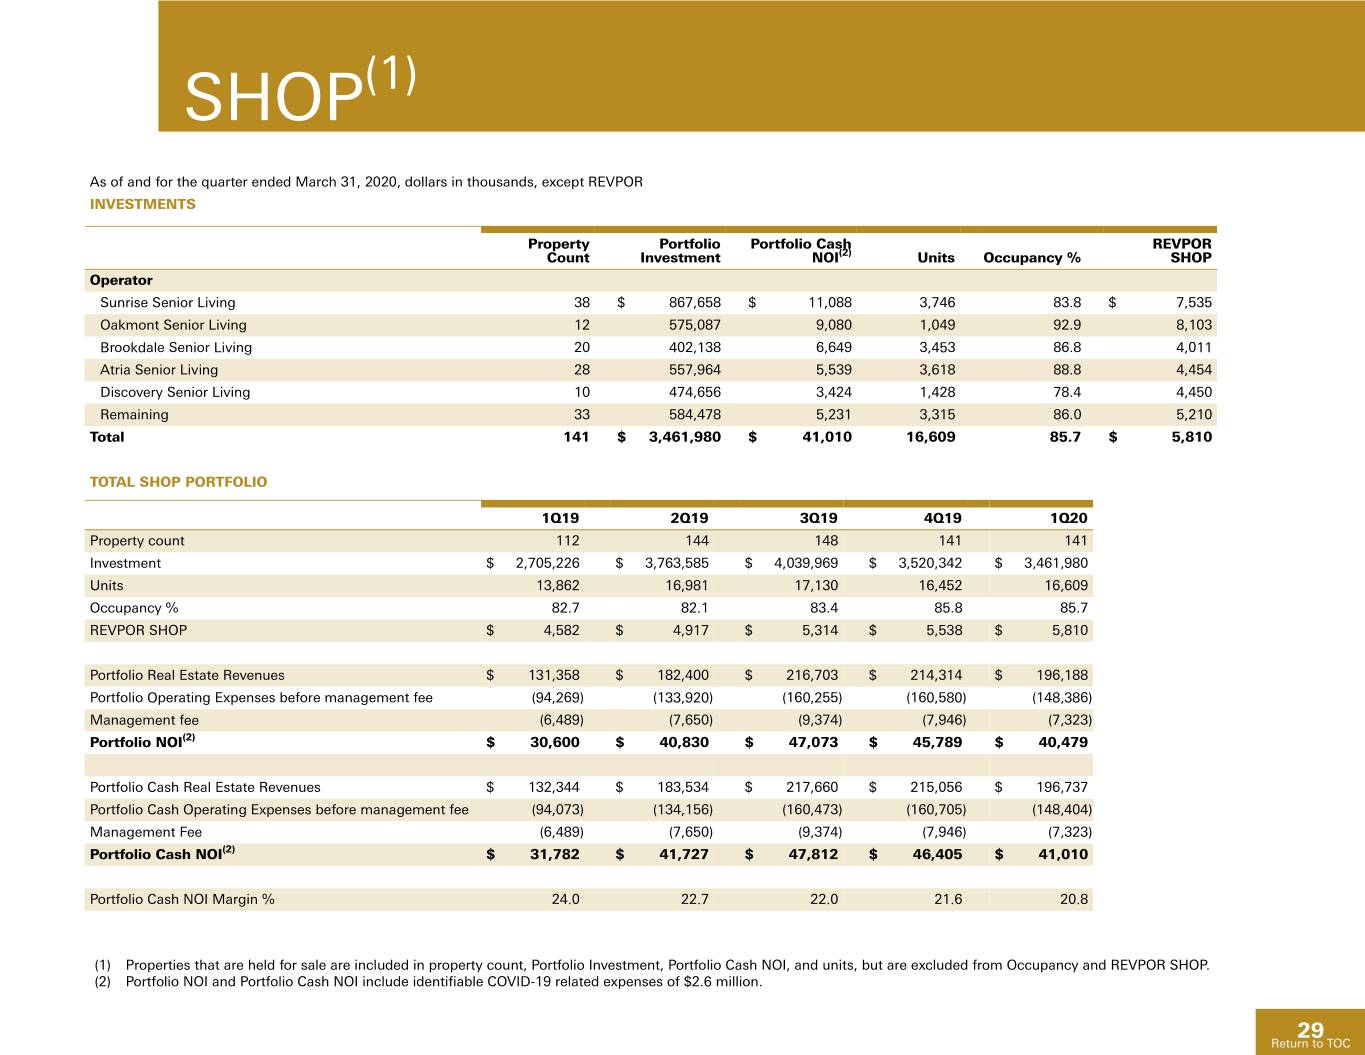
SHOP(1) As of and for the quarter ended March 31, 2020, dollars in thousands, except REVPOR INVESTMENTS Property Portfolio Portfolio Cash REVPOR Count Investment NOI(2) Units Occupancy % SHOP Operator Sunrise Senior Living 38 $ 867,658 $ 11,088 3,746 83.8 $ 7,535 Oakmont Senior Living 12 575,087 9,080 1,049 92.9 8,103 Brookdale Senior Living 20 402,138 6,649 3,453 86.8 4,011 Atria Senior Living 28 557,964 5,539 3,618 88.8 4,454 Discovery Senior Living 10 474,656 3,424 1,428 78.4 4,450 Remaining 33 584,478 5,231 3,315 86.0 5,210 Total 141 $ 3,461,980 $ 41,010 16,609 85.7 $ 5,810 TOTAL SHOP PORTFOLIO 1Q19 2Q19 3Q19 4Q19 1Q20 Property count 112 144 148 141 141 Investment $ 2,705,226 $ 3,763,585 $ 4,039,969 $ 3,520,342 $ 3,461,980 Units 13,862 16,981 17,130 16,452 16,609 Occupancy % 82.7 82.1 83.4 85.8 85.7 REVPOR SHOP $ 4,582 $ 4,917 $ 5,314 $ 5,538 $ 5,810 Portfolio Real Estate Revenues $ 131,358 $ 182,400 $ 216,703 $ 214,314 $ 196,188 Portfolio Operating Expenses before management fee (94,269) (133,920) (160,255) (160,580) (148,386) Management fee (6,489) (7,650) (9,374) (7,946) (7,323) Portfolio NOI(2) $ 30,600 $ 40,830 $ 47,073 $ 45,789 $ 40,479 Portfolio Cash Real Estate Revenues $ 132,344 $ 183,534 $ 217,660 $ 215,056 $ 196,737 Portfolio Cash Operating Expenses before management fee (94,073) (134,156) (160,473) (160,705) (148,404) Management Fee (6,489) (7,650) (9,374) (7,946) (7,323) Portfolio Cash NOI(2) $ 31,782 $ 41,727 $ 47,812 $ 46,405 $ 41,010 Portfolio Cash NOI Margin % 24.0 22.7 22.0 21.6 20.8 (1) Properties that are held for sale are included in property count, Portfolio Investment, Portfolio Cash NOI, and units, but are excluded from Occupancy and REVPOR SHOP. (2) Portfolio NOI and Portfolio Cash NOI include identifiable COVID-19 related expenses of $2.6 million. 29 Return to TOC
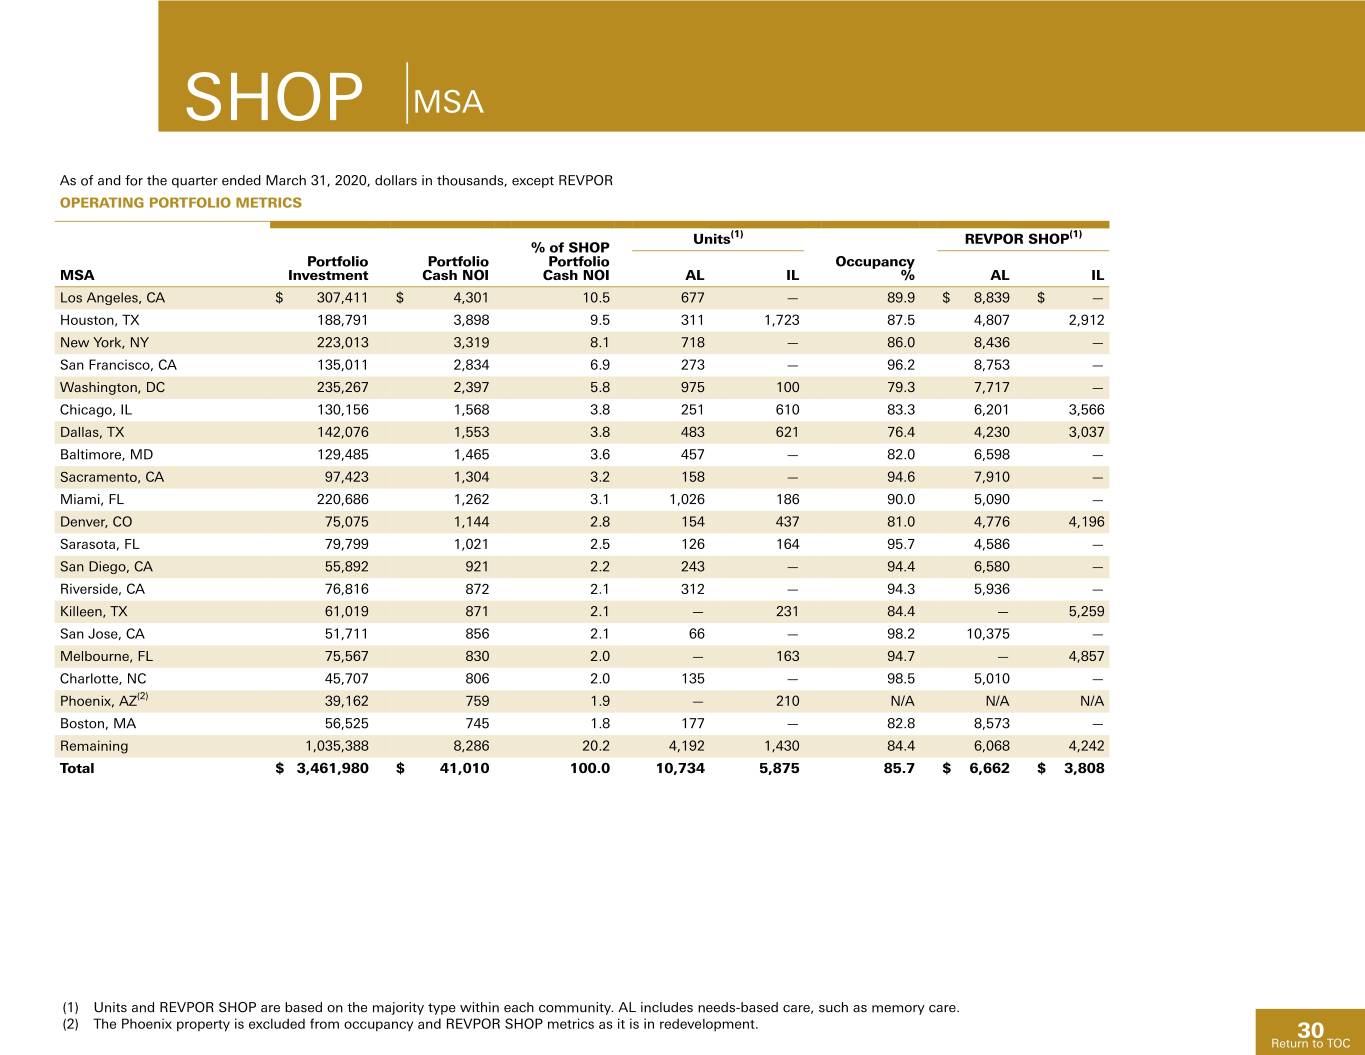
SHOP MSA As of and for the quarter ended March 31, 2020, dollars in thousands, except REVPOR OPERATING PORTFOLIO METRICS Units(1) REVPOR SHOP(1) % of SHOP Portfolio Portfolio Portfolio Occupancy MSA Investment Cash NOI Cash NOI AL IL % AL IL Los Angeles, CA $ 307,411 $ 4,301 10.5 677 — 89.9 $ 8,839 $ — Houston, TX 188,791 3,898 9.5 311 1,723 87.5 4,807 2,912 New York, NY 223,013 3,319 8.1 718 — 86.0 8,436 — San Francisco, CA 135,011 2,834 6.9 273 — 96.2 8,753 — Washington, DC 235,267 2,397 5.8 975 100 79.3 7,717 — Chicago, IL 130,156 1,568 3.8 251 610 83.3 6,201 3,566 Dallas, TX 142,076 1,553 3.8 483 621 76.4 4,230 3,037 Baltimore, MD 129,485 1,465 3.6 457 — 82.0 6,598 — Sacramento, CA 97,423 1,304 3.2 158 — 94.6 7,910 — Miami, FL 220,686 1,262 3.1 1,026 186 90.0 5,090 — Denver, CO 75,075 1,144 2.8 154 437 81.0 4,776 4,196 Sarasota, FL 79,799 1,021 2.5 126 164 95.7 4,586 — San Diego, CA 55,892 921 2.2 243 — 94.4 6,580 — Riverside, CA 76,816 872 2.1 312 — 94.3 5,936 — Killeen, TX 61,019 871 2.1 — 231 84.4 — 5,259 San Jose, CA 51,711 856 2.1 66 — 98.2 10,375 — Melbourne, FL 75,567 830 2.0 — 163 94.7 — 4,857 Charlotte, NC 45,707 806 2.0 135 — 98.5 5,010 — Phoenix, AZ(2) 39,162 759 1.9 — 210 N/A N/A N/A Boston, MA 56,525 745 1.8 177 — 82.8 8,573 — Remaining 1,035,388 8,286 20.2 4,192 1,430 84.4 6,068 4,242 Total $ 3,461,980 $ 41,010 100.0 10,734 5,875 85.7 $ 6,662 $ 3,808 (1) Units and REVPOR SHOP are based on the majority type within each community. AL includes needs-based care, such as memory care. (2) The Phoenix property is excluded from occupancy and REVPOR SHOP metrics as it is in redevelopment. 30 Return to TOC
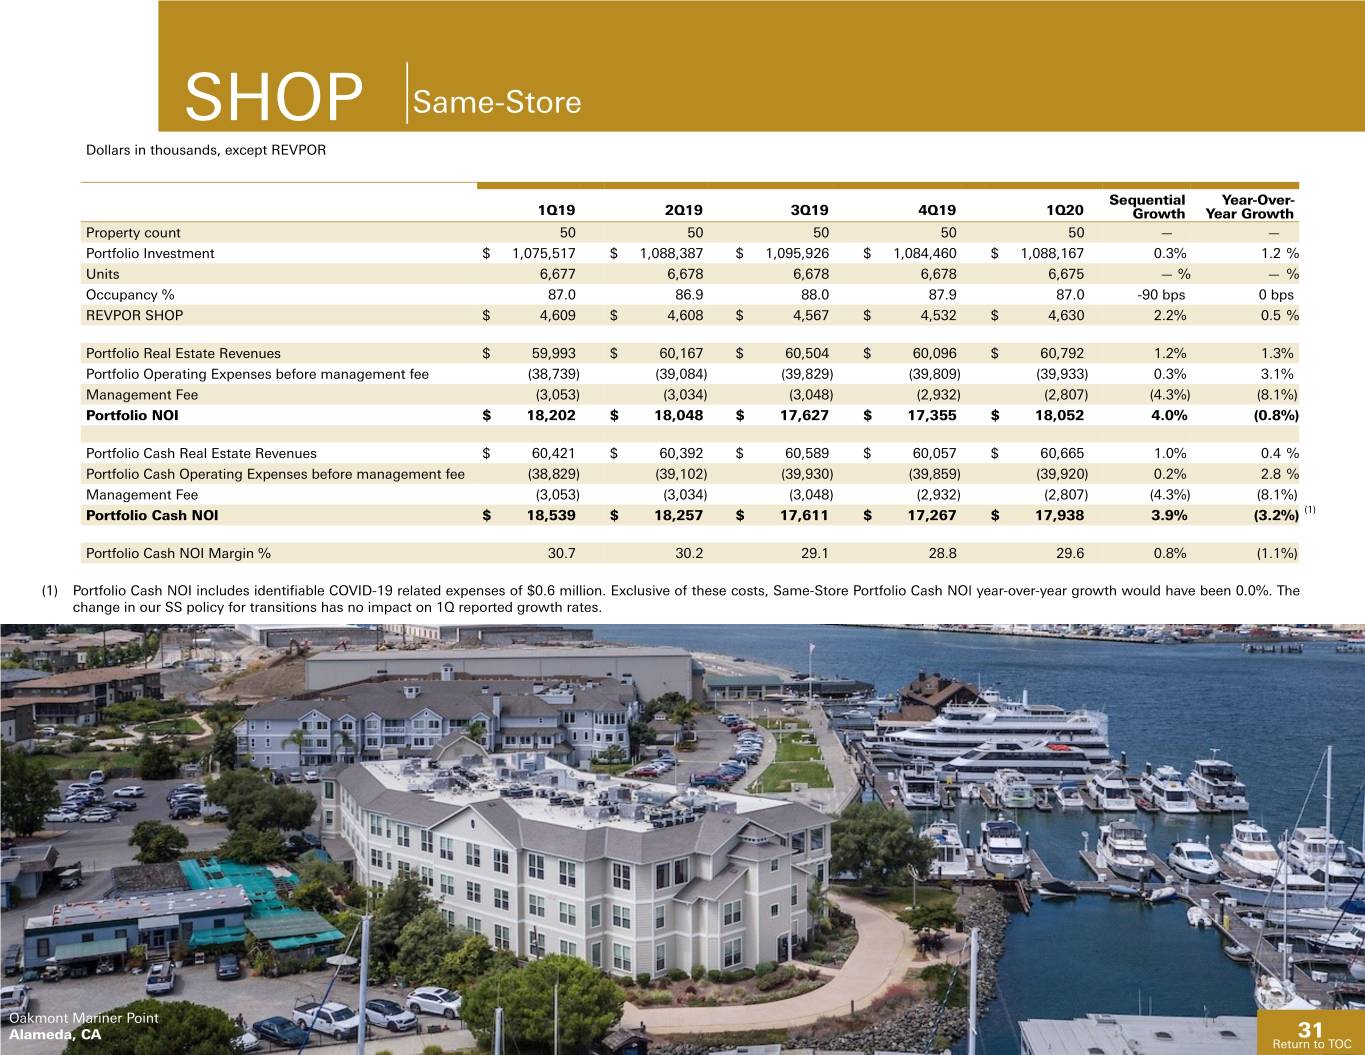
SHOP Same-Store Dollars in thousands, except REVPOR Sequential Year-Over- 1Q19 2Q19 3Q19 4Q19 1Q20 Growth Year Growth Property count 50 50 50 50 50 — — Portfolio Investment $ 1,075,517 $ 1,088,387 $ 1,095,926 $ 1,084,460 $ 1,088,167 0.3% 1.2 % Units 6,677 6,678 6,678 6,678 6,675 — % — % Occupancy % 87.0 86.9 88.0 87.9 87.0 -90 bps 0 bps REVPOR SHOP $ 4,609 $ 4,608 $ 4,567 $ 4,532 $ 4,630 2.2% 0.5 % Portfolio Real Estate Revenues $ 59,993 $ 60,167 $ 60,504 $ 60,096 $ 60,792 1.2% 1.3% Portfolio Operating Expenses before management fee (38,739) (39,084) (39,829) (39,809) (39,933) 0.3% 3.1% Management Fee (3,053) (3,034) (3,048) (2,932) (2,807) (4.3%) (8.1%) Portfolio NOI $ 18,202 $ 18,048 $ 17,627 $ 17,355 $ 18,052 4.0% (0.8%) Portfolio Cash Real Estate Revenues $ 60,421 $ 60,392 $ 60,589 $ 60,057 $ 60,665 1.0% 0.4 % Portfolio Cash Operating Expenses before management fee (38,829) (39,102) (39,930) (39,859) (39,920) 0.2% 2.8 % Management Fee (3,053) (3,034) (3,048) (2,932) (2,807) (4.3%) (8.1%) Portfolio Cash NOI $ 18,539 $ 18,257 $ 17,611 $ 17,267 $ 17,938 3.9% (3.2%) (1) Portfolio Cash NOI Margin % 30.7 30.2 29.1 28.8 29.6 0.8% (1.1%) (1) Portfolio Cash NOI includes identifiable COVID-19 related expenses of $0.6 million. Exclusive of these costs, Same-Store Portfolio Cash NOI year-over-year growth would have been 0.0%. The change in our SS policy for transitions has no impact on 1Q reported growth rates. Oakmont Mariner Point Alameda, CA 31 Return to TOC
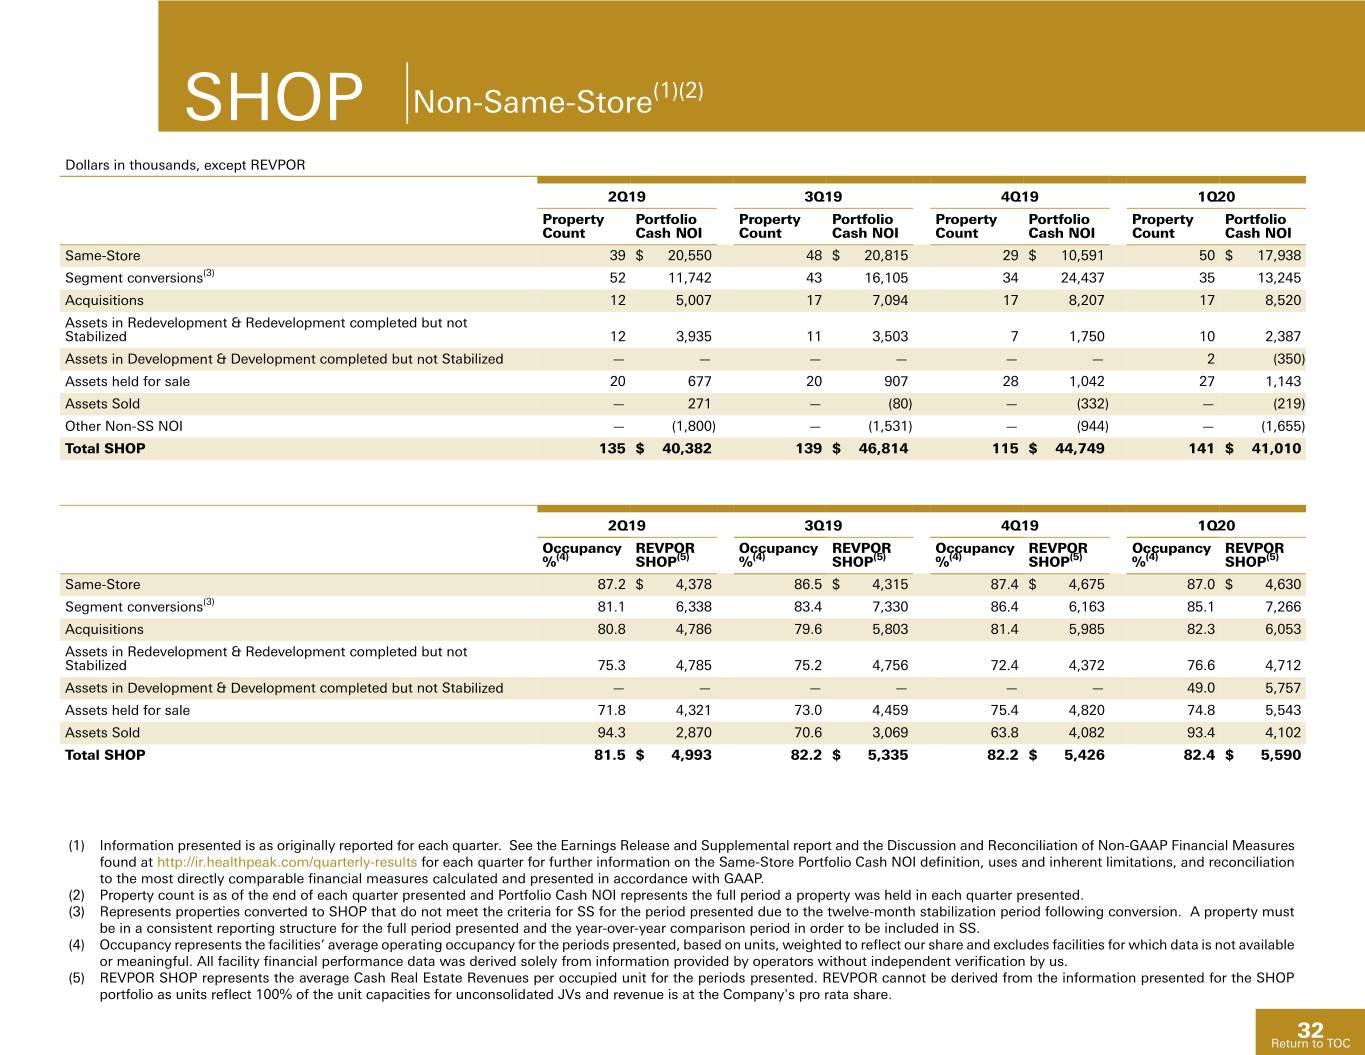
SHOP Non-Same-Store(1)(2) Dollars in thousands, except REVPOR 2Q19 3Q19 4Q19 1Q20 Property Portfolio Property Portfolio Property Portfolio Property Portfolio Count Cash NOI Count Cash NOI Count Cash NOI Count Cash NOI Same-Store 39 $ 20,550 48 $ 20,815 29 $ 10,591 50 $ 17,938 Segment conversions(3) 52 11,742 43 16,105 34 24,437 35 13,245 Acquisitions 12 5,007 17 7,094 17 8,207 17 8,520 Assets in Redevelopment & Redevelopment completed but not Stabilized 12 3,935 11 3,503 7 1,750 10 2,387 Assets in Development & Development completed but not Stabilized — — — — — — 2 (350) Assets held for sale 20 677 20 907 28 1,042 27 1,143 Assets Sold — 271 — (80) — (332) — (219) Other Non-SS NOI — (1,800) — (1,531) — (944) — (1,655) Total SHOP 135 $ 40,382 139 $ 46,814 115 $ 44,749 141 $ 41,010 2Q19 3Q19 4Q19 1Q20 Occupancy REVPOR Occupancy REVPOR Occupancy REVPOR Occupancy REVPOR %(4) SHOP(5) %(4) SHOP(5) %(4) SHOP(5) %(4) SHOP(5) Same-Store 87.2 $ 4,378 86.5 $ 4,315 87.4 $ 4,675 87.0 $ 4,630 Segment conversions(3) 81.1 6,338 83.4 7,330 86.4 6,163 85.1 7,266 Acquisitions 80.8 4,786 79.6 5,803 81.4 5,985 82.3 6,053 Assets in Redevelopment & Redevelopment completed but not Stabilized 75.3 4,785 75.2 4,756 72.4 4,372 76.6 4,712 Assets in Development & Development completed but not Stabilized — — — — — — 49.0 5,757 Assets held for sale 71.8 4,321 73.0 4,459 75.4 4,820 74.8 5,543 Assets Sold 94.3 2,870 70.6 3,069 63.8 4,082 93.4 4,102 Total SHOP 81.5 $ 4,993 82.2 $ 5,335 82.2 $ 5,426 82.4 $ 5,590 (1) Information presented is as originally reported for each quarter. See the Earnings Release and Supplemental report and the Discussion and Reconciliation of Non-GAAP Financial Measures found at http://ir.healthpeak.com/quarterly-results for each quarter for further information on the Same-Store Portfolio Cash NOI definition, uses and inherent limitations, and reconciliation to the most directly comparable financial measures calculated and presented in accordance with GAAP. (2) Property count is as of the end of each quarter presented and Portfolio Cash NOI represents the full period a property was held in each quarter presented. (3) Represents properties converted to SHOP that do not meet the criteria for SS for the period presented due to the twelve-month stabilization period following conversion. A property must be in a consistent reporting structure for the full period presented and the year-over-year comparison period in order to be included in SS. (4) Occupancy represents the facilities’ average operating occupancy for the periods presented, based on units, weighted to reflect our share and excludes facilities for which data is not available or meaningful. All facility financial performance data was derived solely from information provided by operators without independent verification by us. (5) REVPOR SHOP represents the average Cash Real Estate Revenues per occupied unit for the periods presented. REVPOR cannot be derived from the information presented for the SHOP portfolio as units reflect 100% of the unit capacities for unconsolidated JVs and revenue is at the Company's pro rata share. 32 Return to TOC
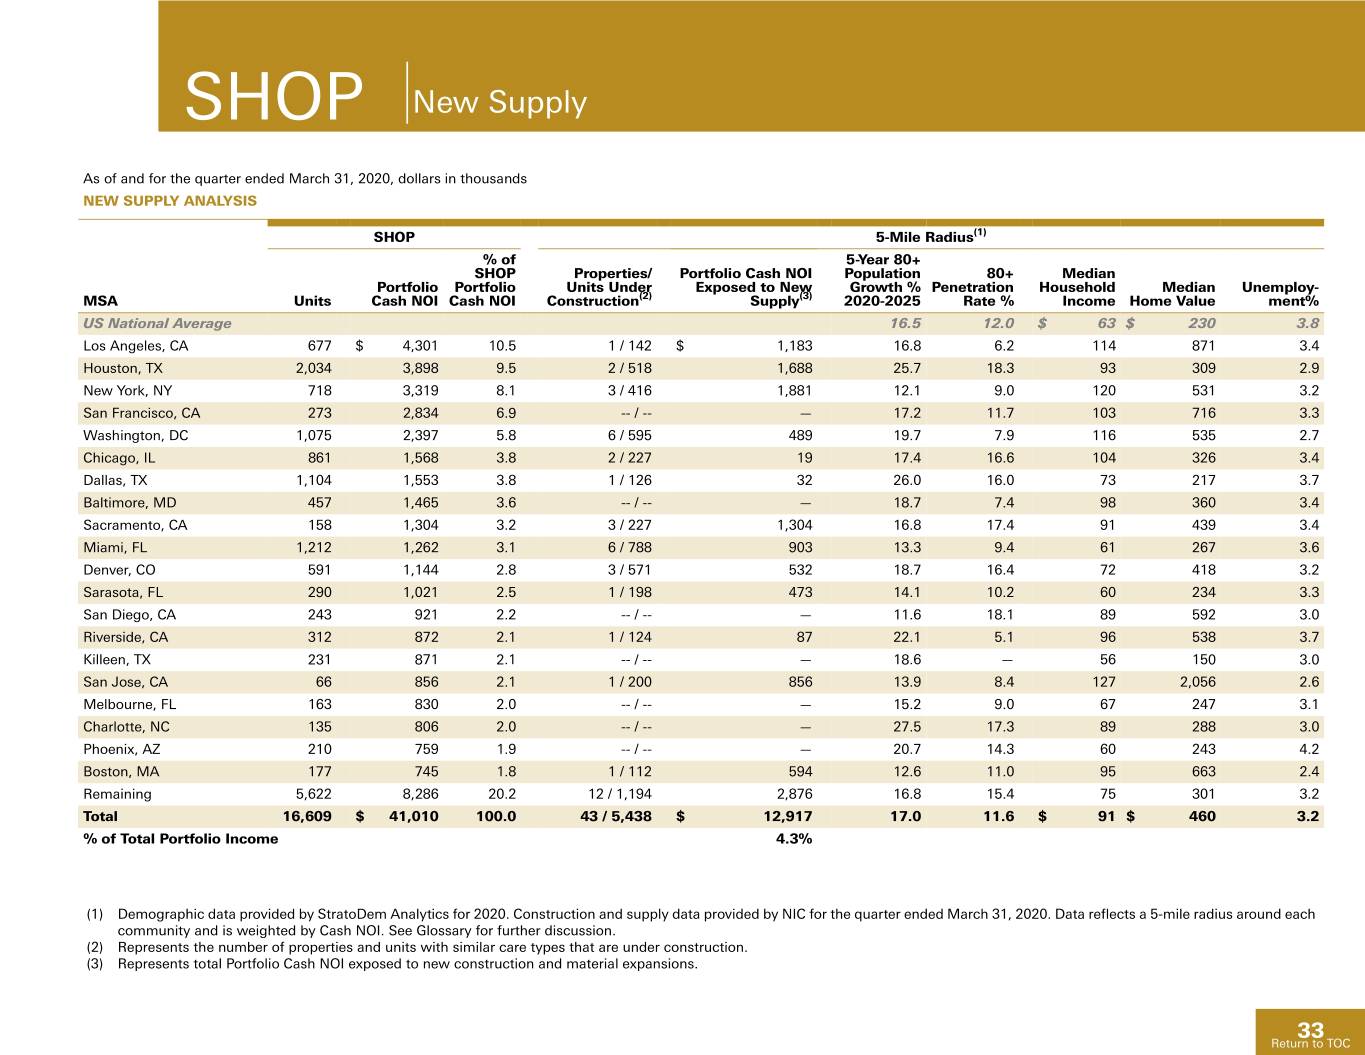
SHOP New Supply As of and for the quarter ended March 31, 2020, dollars in thousands NEW SUPPLY ANALYSIS SHOP 5-Mile Radius(1) % of 5-Year 80+ SHOP Properties/ Portfolio Cash NOI Population 80+ Median Portfolio Portfolio Units Under Exposed to New Growth % Penetration Household Median Unemploy- MSA Units Cash NOI Cash NOI Construction(2) Supply(3) 2020-2025 Rate % Income Home Value ment% US National Average 16.5 12.0 $ 63 $ 230 3.8 Los Angeles, CA 677 $ 4,301 10.5 1 / 142 $ 1,183 16.8 6.2 114 871 3.4 Houston, TX 2,034 3,898 9.5 2 / 518 1,688 25.7 18.3 93 309 2.9 New York, NY 718 3,319 8.1 3 / 416 1,881 12.1 9.0 120 531 3.2 San Francisco, CA 273 2,834 6.9 -- / -- — 17.2 11.7 103 716 3.3 Washington, DC 1,075 2,397 5.8 6 / 595 489 19.7 7.9 116 535 2.7 Chicago, IL 861 1,568 3.8 2 / 227 19 17.4 16.6 104 326 3.4 Dallas, TX 1,104 1,553 3.8 1 / 126 32 26.0 16.0 73 217 3.7 Baltimore, MD 457 1,465 3.6 -- / -- — 18.7 7.4 98 360 3.4 Sacramento, CA 158 1,304 3.2 3 / 227 1,304 16.8 17.4 91 439 3.4 Miami, FL 1,212 1,262 3.1 6 / 788 903 13.3 9.4 61 267 3.6 Denver, CO 591 1,144 2.8 3 / 571 532 18.7 16.4 72 418 3.2 Sarasota, FL 290 1,021 2.5 1 / 198 473 14.1 10.2 60 234 3.3 San Diego, CA 243 921 2.2 -- / -- — 11.6 18.1 89 592 3.0 Riverside, CA 312 872 2.1 1 / 124 87 22.1 5.1 96 538 3.7 Killeen, TX 231 871 2.1 -- / -- — 18.6 — 56 150 3.0 San Jose, CA 66 856 2.1 1 / 200 856 13.9 8.4 127 2,056 2.6 Melbourne, FL 163 830 2.0 -- / -- — 15.2 9.0 67 247 3.1 Charlotte, NC 135 806 2.0 -- / -- — 27.5 17.3 89 288 3.0 Phoenix, AZ 210 759 1.9 -- / -- — 20.7 14.3 60 243 4.2 Boston, MA 177 745 1.8 1 / 112 594 12.6 11.0 95 663 2.4 Remaining 5,622 8,286 20.2 12 / 1,194 2,876 16.8 15.4 75 301 3.2 Total 16,609 $ 41,010 100.0 43 / 5,438 $ 12,917 17.0 11.6 $ 91 $ 460 3.2 % of Total Portfolio Income 4.3% (1) Demographic data provided by StratoDem Analytics for 2020. Construction and supply data provided by NIC for the quarter ended March 31, 2020. Data reflects a 5-mile radius around each community and is weighted by Cash NOI. See Glossary for further discussion. (2) Represents the number of properties and units with similar care types that are under construction. (3) Represents total Portfolio Cash NOI exposed to new construction and material expansions. 33 Return to TOC
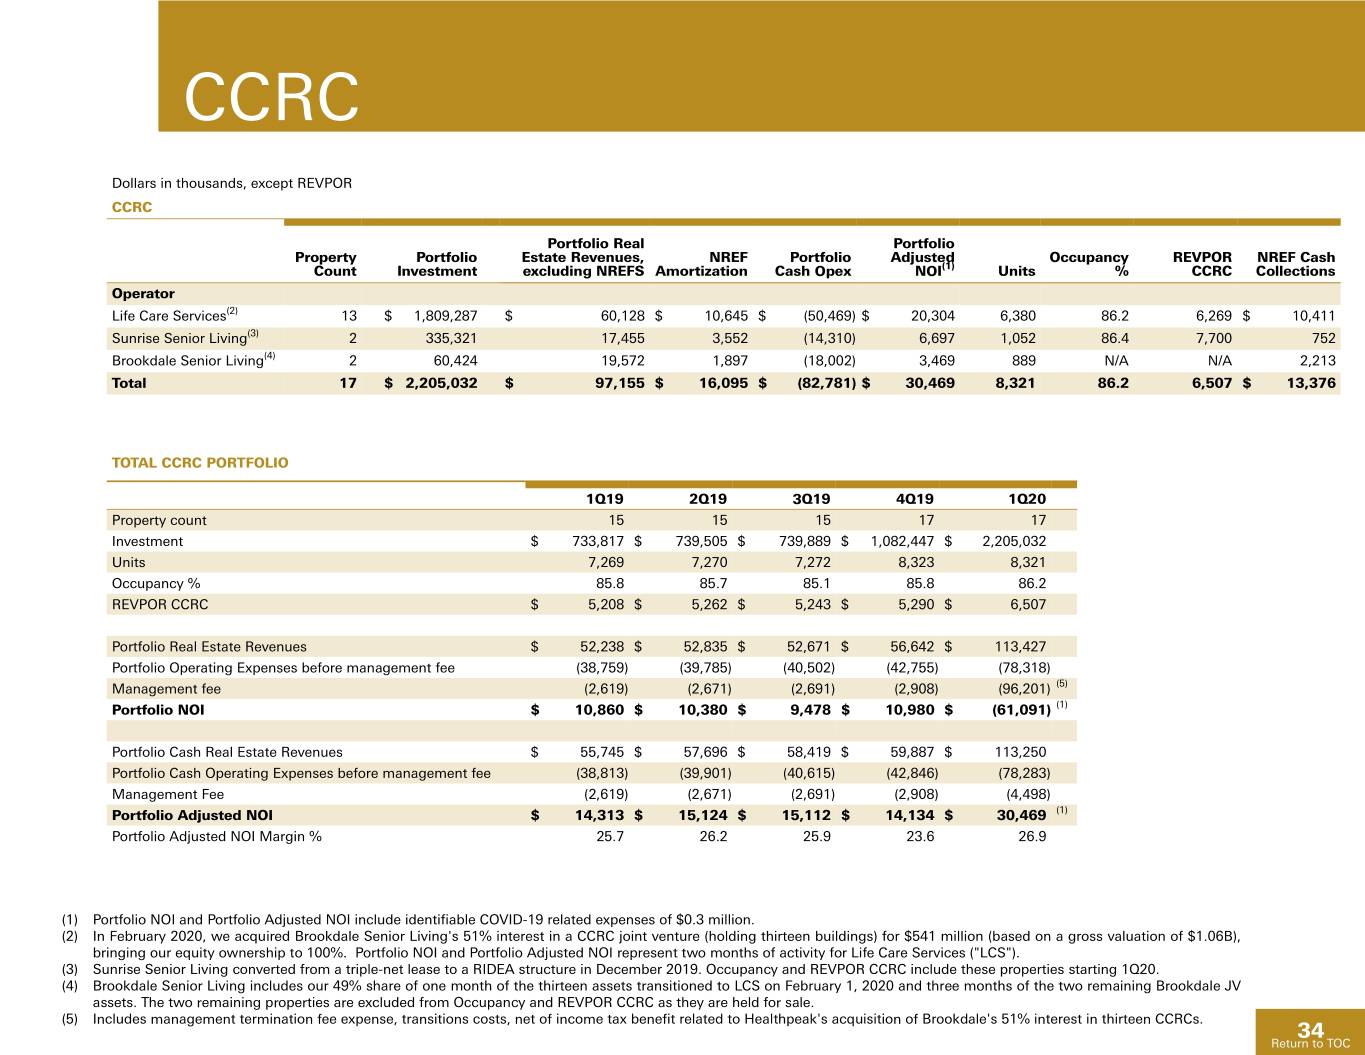
CCRC Dollars in thousands, except REVPOR CCRC Portfolio Real Portfolio Property Portfolio Estate Revenues, NREF Portfolio Adjusted Occupancy REVPOR NREF Cash Count Investment excluding NREFS Amortization Cash Opex NOI(1) Units % CCRC Collections Operator Life Care Services(2) 13 $ 1,809,287 $ 60,128 $ 10,645 $ (50,469) $ 20,304 6,380 86.2 6,269 $ 10,411 Sunrise Senior Living(3) 2 335,321 17,455 3,552 (14,310) 6,697 1,052 86.4 7,700 752 Brookdale Senior Living(4) 2 60,424 19,572 1,897 (18,002) 3,469 889 N/A N/A 2,213 Total 17 $ 2,205,032 $ 97,155 $ 16,095 $ (82,781) $ 30,469 8,321 86.2 6,507 $ 13,376 TOTAL CCRC PORTFOLIO 1Q19 2Q19 3Q19 4Q19 1Q20 Property count 15 15 15 17 17 Investment $ 733,817 $ 739,505 $ 739,889 $ 1,082,447 $ 2,205,032 Units 7,269 7,270 7,272 8,323 8,321 Occupancy % 85.8 85.7 85.1 85.8 86.2 REVPOR CCRC $ 5,208 $ 5,262 $ 5,243 $ 5,290 $ 6,507 Portfolio Real Estate Revenues $ 52,238 $ 52,835 $ 52,671 $ 56,642 $ 113,427 Portfolio Operating Expenses before management fee (38,759) (39,785) (40,502) (42,755) (78,318) Management fee (2,619) (2,671) (2,691) (2,908) (96,201) (5) Portfolio NOI $ 10,860 $ 10,380 $ 9,478 $ 10,980 $ (61,091) (1) Portfolio Cash Real Estate Revenues $ 55,745 $ 57,696 $ 58,419 $ 59,887 $ 113,250 Portfolio Cash Operating Expenses before management fee (38,813) (39,901) (40,615) (42,846) (78,283) Management Fee (2,619) (2,671) (2,691) (2,908) (4,498) Portfolio Adjusted NOI $ 14,313 $ 15,124 $ 15,112 $ 14,134 $ 30,469 (1) Portfolio Adjusted NOI Margin % 25.7 26.2 25.9 23.6 26.9 (1) Portfolio NOI and Portfolio Adjusted NOI include identifiable COVID-19 related expenses of $0.3 million. (2) In February 2020, we acquired Brookdale Senior Living's 51% interest in a CCRC joint venture (holding thirteen buildings) for $541 million (based on a gross valuation of $1.06B), bringing our equity ownership to 100%. Portfolio NOI and Portfolio Adjusted NOI represent two months of activity for Life Care Services ("LCS"). (3) Sunrise Senior Living converted from a triple-net lease to a RIDEA structure in December 2019. Occupancy and REVPOR CCRC include these properties starting 1Q20. (4) Brookdale Senior Living includes our 49% share of one month of the thirteen assets transitioned to LCS on February 1, 2020 and three months of the two remaining Brookdale JV assets. The two remaining properties are excluded from Occupancy and REVPOR CCRC as they are held for sale. (5) Includes management termination fee expense, transitions costs, net of income tax benefit related to Healthpeak's acquisition of Brookdale's 51% interest in thirteen CCRCs. 34 Return to TOC
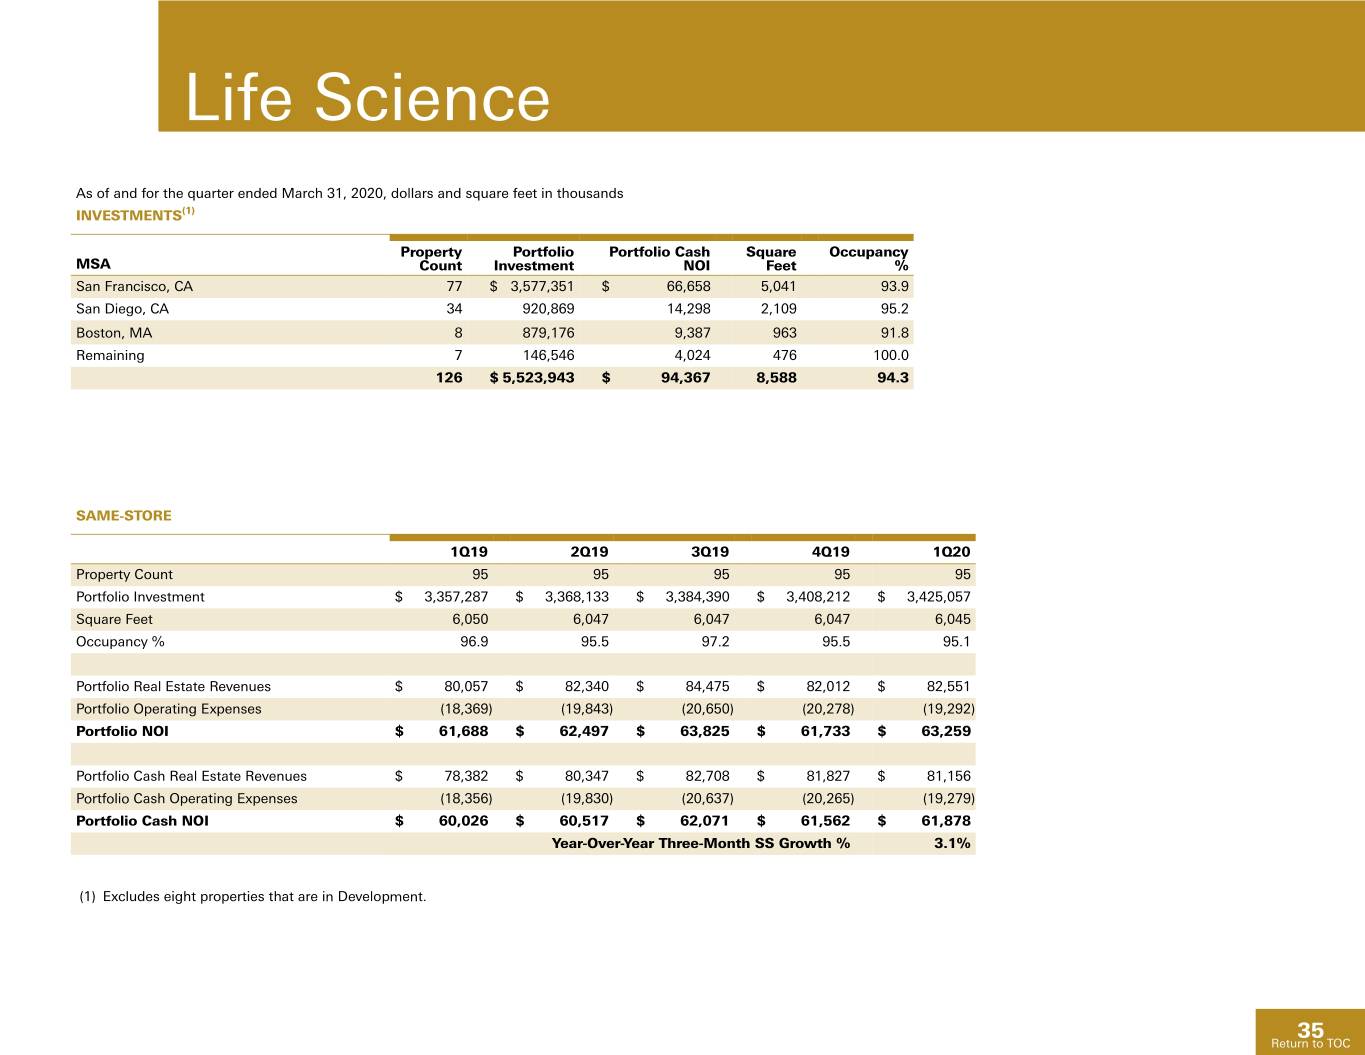
Life Science As of and for the quarter ended March 31, 2020, dollars and square feet in thousands INVESTMENTS(1) Property Portfolio Portfolio Cash Square Occupancy MSA Count Investment NOI Feet % San Francisco, CA 77 $ 3,577,351 $ 66,658 5,041 93.9 San Diego, CA 34 920,869 14,298 2,109 95.2 Boston, MA 8 879,176 9,387 963 91.8 Remaining 7 146,546 4,024 476 100.0 126 $ 5,523,943 $ 94,367 8,588 94.3 SAME-STORE 1Q19 2Q19 3Q19 4Q19 1Q20 Property Count 95 95 95 95 95 Portfolio Investment $ 3,357,287 $ 3,368,133 $ 3,384,390 $ 3,408,212 $ 3,425,057 Square Feet 6,050 6,047 6,047 6,047 6,045 Occupancy % 96.9 95.5 97.2 95.5 95.1 Portfolio Real Estate Revenues $ 80,057 $ 82,340 $ 84,475 $ 82,012 $ 82,551 Portfolio Operating Expenses (18,369) (19,843) (20,650) (20,278) (19,292) Portfolio NOI $ 61,688 $ 62,497 $ 63,825 $ 61,733 $ 63,259 Portfolio Cash Real Estate Revenues $ 78,382 $ 80,347 $ 82,708 $ 81,827 $ 81,156 Portfolio Cash Operating Expenses (18,356) (19,830) (20,637) (20,265) (19,279) Portfolio Cash NOI $ 60,026 $ 60,517 $ 62,071 $ 61,562 $ 61,878 Year-Over-Year Three-Month SS Growth % 3.1% (1) Excludes eight properties that are in Development. 35 Return to TOC
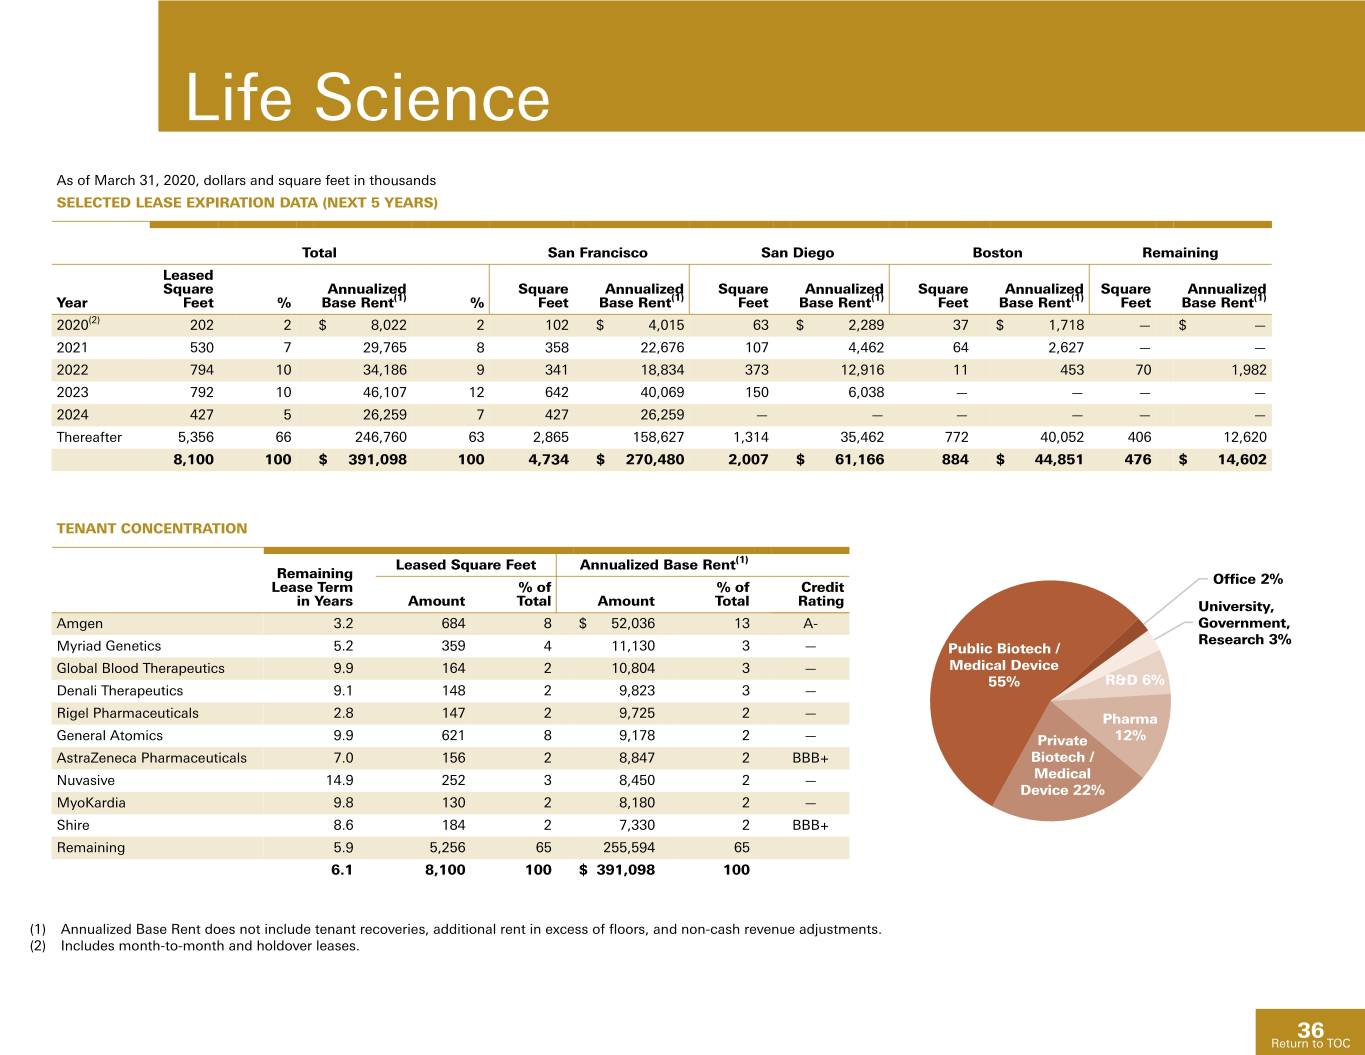
Life Science As of March 31, 2020, dollars and square feet in thousands SELECTED LEASE EXPIRATION DATA (NEXT 5 YEARS) Total San Francisco San Diego Boston Remaining Leased Square Annualized Square Annualized Square Annualized Square Annualized Square Annualized Year Feet % Base Rent(1) % Feet Base Rent(1) Feet Base Rent(1) Feet Base Rent(1) Feet Base Rent(1) 2020(2) 202 2 $ 8,022 2 102 $ 4,015 63 $ 2,289 37 $ 1,718 — $ — 2021 530 7 29,765 8 358 22,676 107 4,462 64 2,627 — — 2022 794 10 34,186 9 341 18,834 373 12,916 11 453 70 1,982 2023 792 10 46,107 12 642 40,069 150 6,038 — — — — 2024 427 5 26,259 7 427 26,259 — — — — — — Thereafter 5,356 66 246,760 63 2,865 158,627 1,314 35,462 772 40,052 406 12,620 8,100 100 $ 391,098 100 4,734 $ 270,480 2,007 $ 61,166 884 $ 44,851 476 $ 14,602 TENANT CONCENTRATION Leased Square Feet Annualized Base Rent(1) Remaining Office 2% Lease Term % of % of Credit in Years Amount Total Amount Total Rating University, Amgen 3.2 684 8 $ 52,036 13 A- Government, Research 3% Myriad Genetics 5.2 359 4 11,130 3 — Public Biotech / Global Blood Therapeutics 9.9 164 2 10,804 3 — Medical Device 55% R&D 6% Denali Therapeutics 9.1 148 2 9,823 3 — Rigel Pharmaceuticals 2.8 147 2 9,725 2 — Pharma General Atomics 9.9 621 8 9,178 2 — Private 12% AstraZeneca Pharmaceuticals 7.0 156 2 8,847 2 BBB+ Biotech / Nuvasive 14.9 252 3 8,450 2 — Medical Device 22% MyoKardia 9.8 130 2 8,180 2 — Shire 8.6 184 2 7,330 2 BBB+ Remaining 5.9 5,256 65 255,594 65 6.1 8,100 100 $ 391,098 100 (1) Annualized Base Rent does not include tenant recoveries, additional rent in excess of floors, and non-cash revenue adjustments. (2) Includes month-to-month and holdover leases. 36 Return to TOC
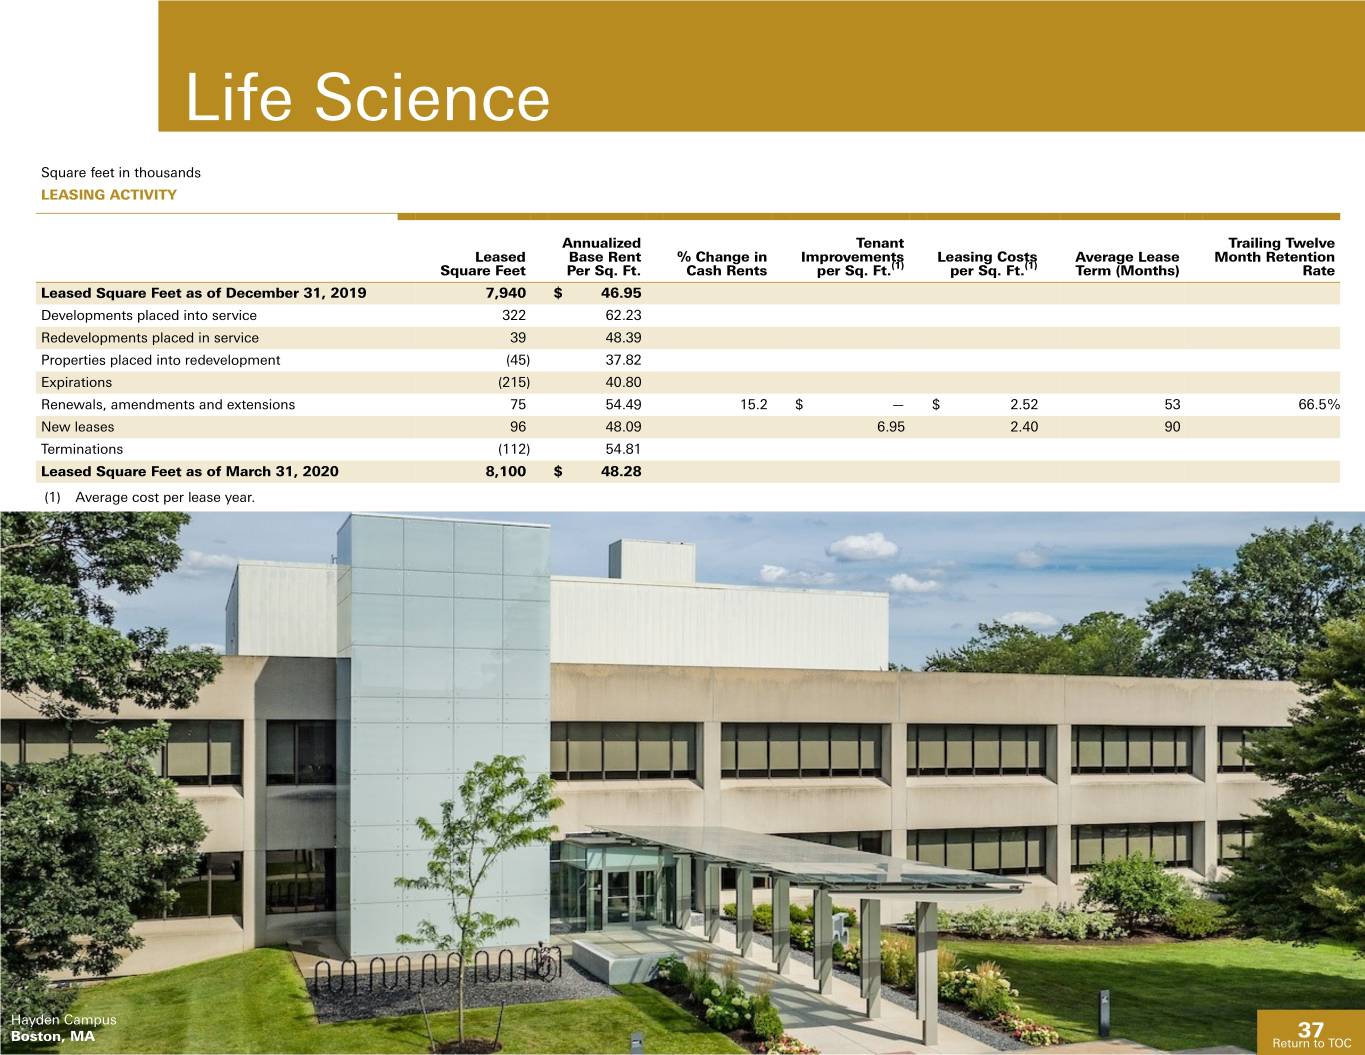
Life Science Square feet in thousands LEASING ACTIVITY Annualized Tenant Trailing Twelve Leased Base Rent % Change in Improvements Leasing Costs Average Lease Month Retention Square Feet Per Sq. Ft. Cash Rents per Sq. Ft.(1) per Sq. Ft.(1) Term (Months) Rate Leased Square Feet as of December 31, 2019 7,940 $ 46.95 Developments placed into service 322 62.23 Redevelopments placed in service 39 48.39 Properties placed into redevelopment (45) 37.82 Expirations (215) 40.80 Renewals, amendments and extensions 75 54.49 15.2 $ — $ 2.52 53 66.5% New leases 96 48.09 6.95 2.40 90 Terminations (112) 54.81 Leased Square Feet as of March 31, 2020 8,100 $ 48.28 (1) Average cost per lease year. Hayden Campus Boston, MA 37 Return to TOC
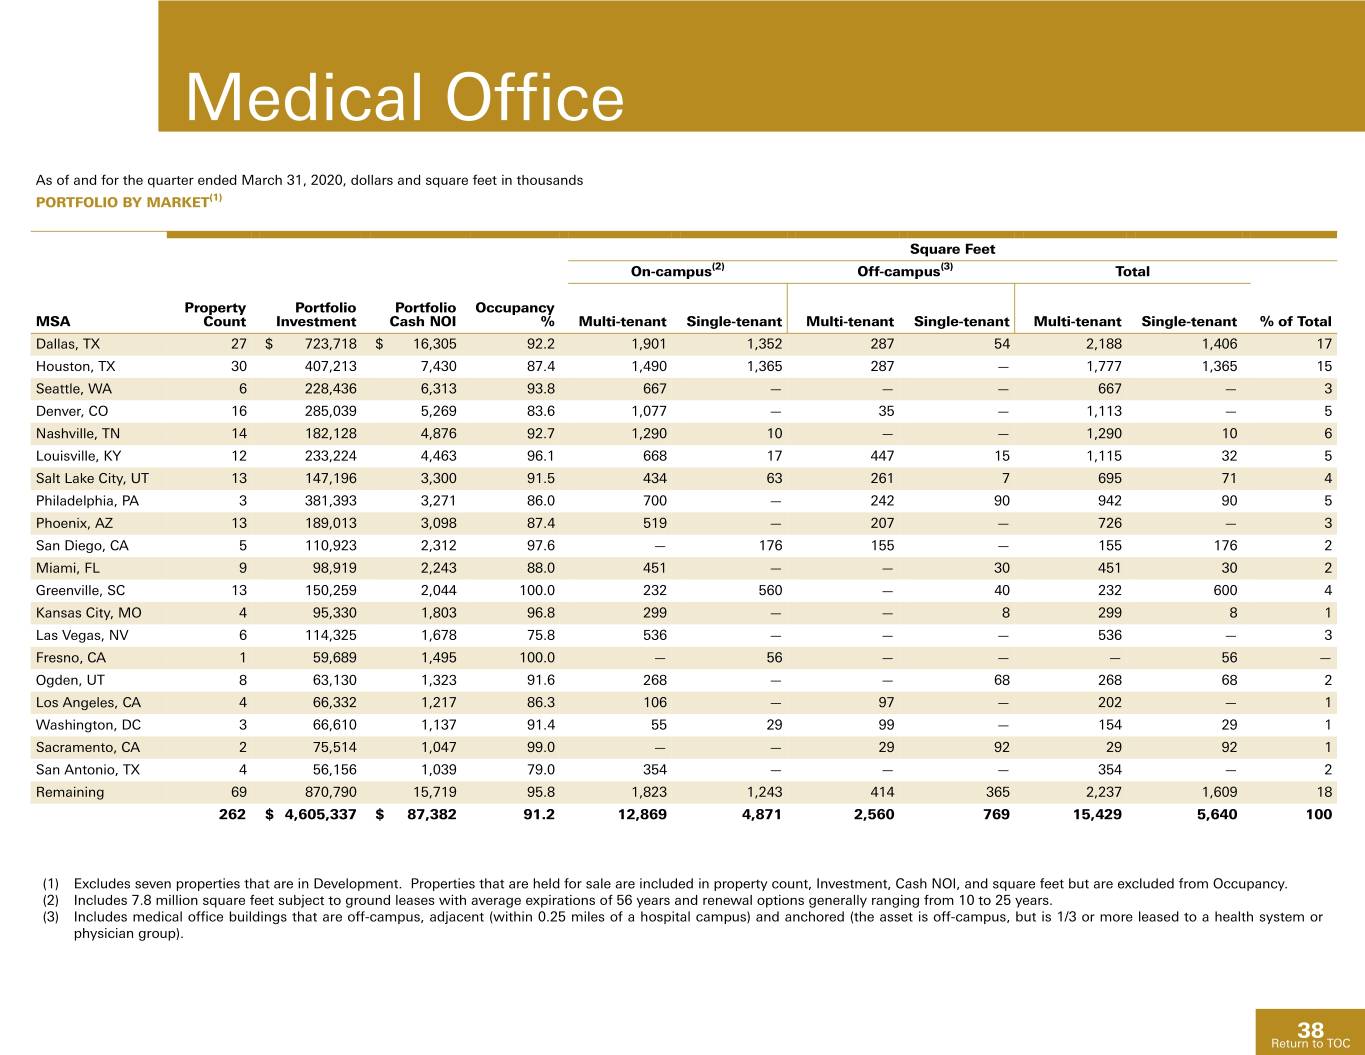
Medical Office As of and for the quarter ended March 31, 2020, dollars and square feet in thousands PORTFOLIO BY MARKET(1) Square Feet On-campus(2) Off-campus(3) Total Property Portfolio Portfolio Occupancy MSA Count Investment Cash NOI % Multi-tenant Single-tenant Multi-tenant Single-tenant Multi-tenant Single-tenant % of Total Dallas, TX 27 $ 723,718 $ 16,305 92.2 1,901 1,352 287 54 2,188 1,406 17 Houston, TX 30 407,213 7,430 87.4 1,490 1,365 287 — 1,777 1,365 15 Seattle, WA 6 228,436 6,313 93.8 667 — — — 667 — 3 Denver, CO 16 285,039 5,269 83.6 1,077 — 35 — 1,113 — 5 Nashville, TN 14 182,128 4,876 92.7 1,290 10 — — 1,290 10 6 Louisville, KY 12 233,224 4,463 96.1 668 17 447 15 1,115 32 5 Salt Lake City, UT 13 147,196 3,300 91.5 434 63 261 7 695 71 4 Philadelphia, PA 3 381,393 3,271 86.0 700 — 242 90 942 90 5 Phoenix, AZ 13 189,013 3,098 87.4 519 — 207 — 726 — 3 San Diego, CA 5 110,923 2,312 97.6 — 176 155 — 155 176 2 Miami, FL 9 98,919 2,243 88.0 451 — — 30 451 30 2 Greenville, SC 13 150,259 2,044 100.0 232 560 — 40 232 600 4 Kansas City, MO 4 95,330 1,803 96.8 299 — — 8 299 8 1 Las Vegas, NV 6 114,325 1,678 75.8 536 — — — 536 — 3 Fresno, CA 1 59,689 1,495 100.0 — 56 — — — 56 — Ogden, UT 8 63,130 1,323 91.6 268 — — 68 268 68 2 Los Angeles, CA 4 66,332 1,217 86.3 106 — 97 — 202 — 1 Washington, DC 3 66,610 1,137 91.4 55 29 99 — 154 29 1 Sacramento, CA 2 75,514 1,047 99.0 — — 29 92 29 92 1 San Antonio, TX 4 56,156 1,039 79.0 354 — — — 354 — 2 Remaining 69 870,790 15,719 95.8 1,823 1,243 414 365 2,237 1,609 18 262 $ 4,605,337 $ 87,382 91.2 12,869 4,871 2,560 769 15,429 5,640 100 (1) Excludes seven properties that are in Development. Properties that are held for sale are included in property count, Investment, Cash NOI, and square feet but are excluded from Occupancy. (2) Includes 7.8 million square feet subject to ground leases with average expirations of 56 years and renewal options generally ranging from 10 to 25 years. (3) Includes medical office buildings that are off-campus, adjacent (within 0.25 miles of a hospital campus) and anchored (the asset is off-campus, but is 1/3 or more leased to a health system or physician group). 38 Return to TOC
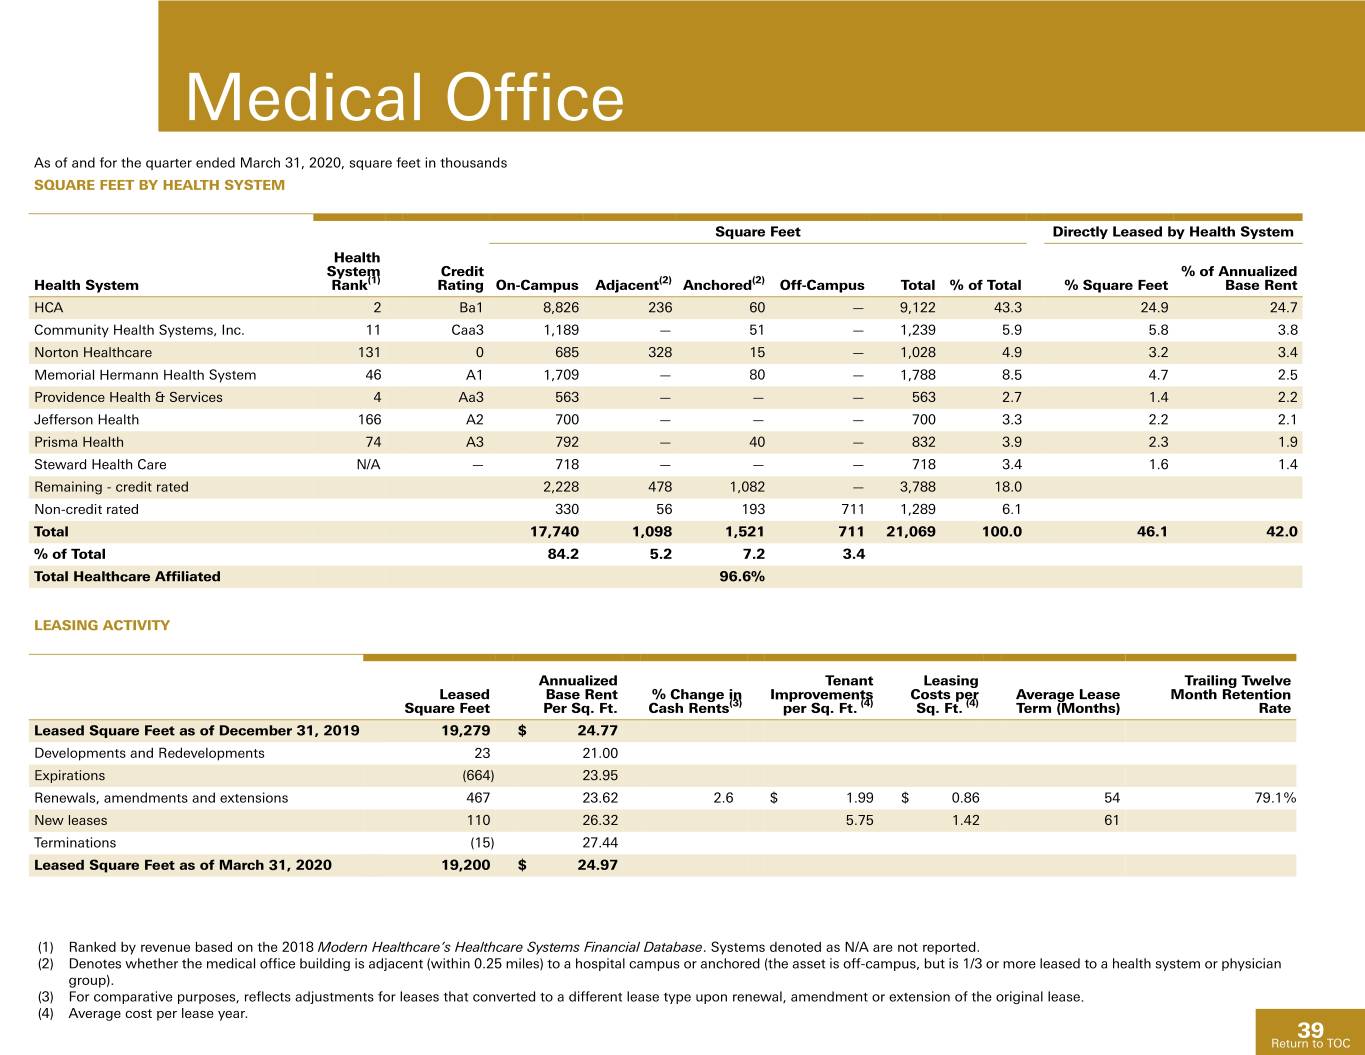
Medical Office As of and for the quarter ended March 31, 2020, square feet in thousands SQUARE FEET BY HEALTH SYSTEM Square Feet Directly Leased by Health System Health System Credit % of Annualized Health System Rank(1) Rating On-Campus Adjacent(2) Anchored(2) Off-Campus Total % of Total % Square Feet Base Rent HCA 2 Ba1 8,826 236 60 — 9,122 43.3 24.9 24.7 Community Health Systems, Inc. 11 Caa3 1,189 — 51 — 1,239 5.9 5.8 3.8 Norton Healthcare 131 0 685 328 15 — 1,028 4.9 3.2 3.4 Memorial Hermann Health System 46 A1 1,709 — 80 — 1,788 8.5 4.7 2.5 Providence Health & Services 4 Aa3 563 — — — 563 2.7 1.4 2.2 Jefferson Health 166 A2 700 — — — 700 3.3 2.2 2.1 Prisma Health 74 A3 792 — 40 — 832 3.9 2.3 1.9 Steward Health Care N/A — 718 — — — 718 3.4 1.6 1.4 Remaining - credit rated 2,228 478 1,082 — 3,788 18.0 Non-credit rated 330 56 193 711 1,289 6.1 Total 17,740 1,098 1,521 711 21,069 100.0 46.1 42.0 % of Total 84.2 5.2 7.2 3.4 Total Healthcare Affiliated 96.6% LEASING ACTIVITY Annualized Tenant Leasing Trailing Twelve Leased Base Rent % Change in Improvements Costs per Average Lease Month Retention Square Feet Per Sq. Ft. Cash Rents(3) per Sq. Ft. (4) Sq. Ft. (4) Term (Months) Rate Leased Square Feet as of December 31, 2019 19,279 $ 24.77 Developments and Redevelopments 23 21.00 Expirations (664) 23.95 Renewals, amendments and extensions 467 23.62 2.6 $ 1.99 $ 0.86 54 79.1% New leases 110 26.32 5.75 1.42 61 Terminations (15) 27.44 Leased Square Feet as of March 31, 2020 19,200 $ 24.97 (1) Ranked by revenue based on the 2018 Modern Healthcare’s Healthcare Systems Financial Database. Systems denoted as N/A are not reported. (2) Denotes whether the medical office building is adjacent (within 0.25 miles) to a hospital campus or anchored (the asset is off-campus, but is 1/3 or more leased to a health system or physician group). (3) For comparative purposes, reflects adjustments for leases that converted to a different lease type upon renewal, amendment or extension of the original lease. (4) Average cost per lease year. 39 Return to TOC
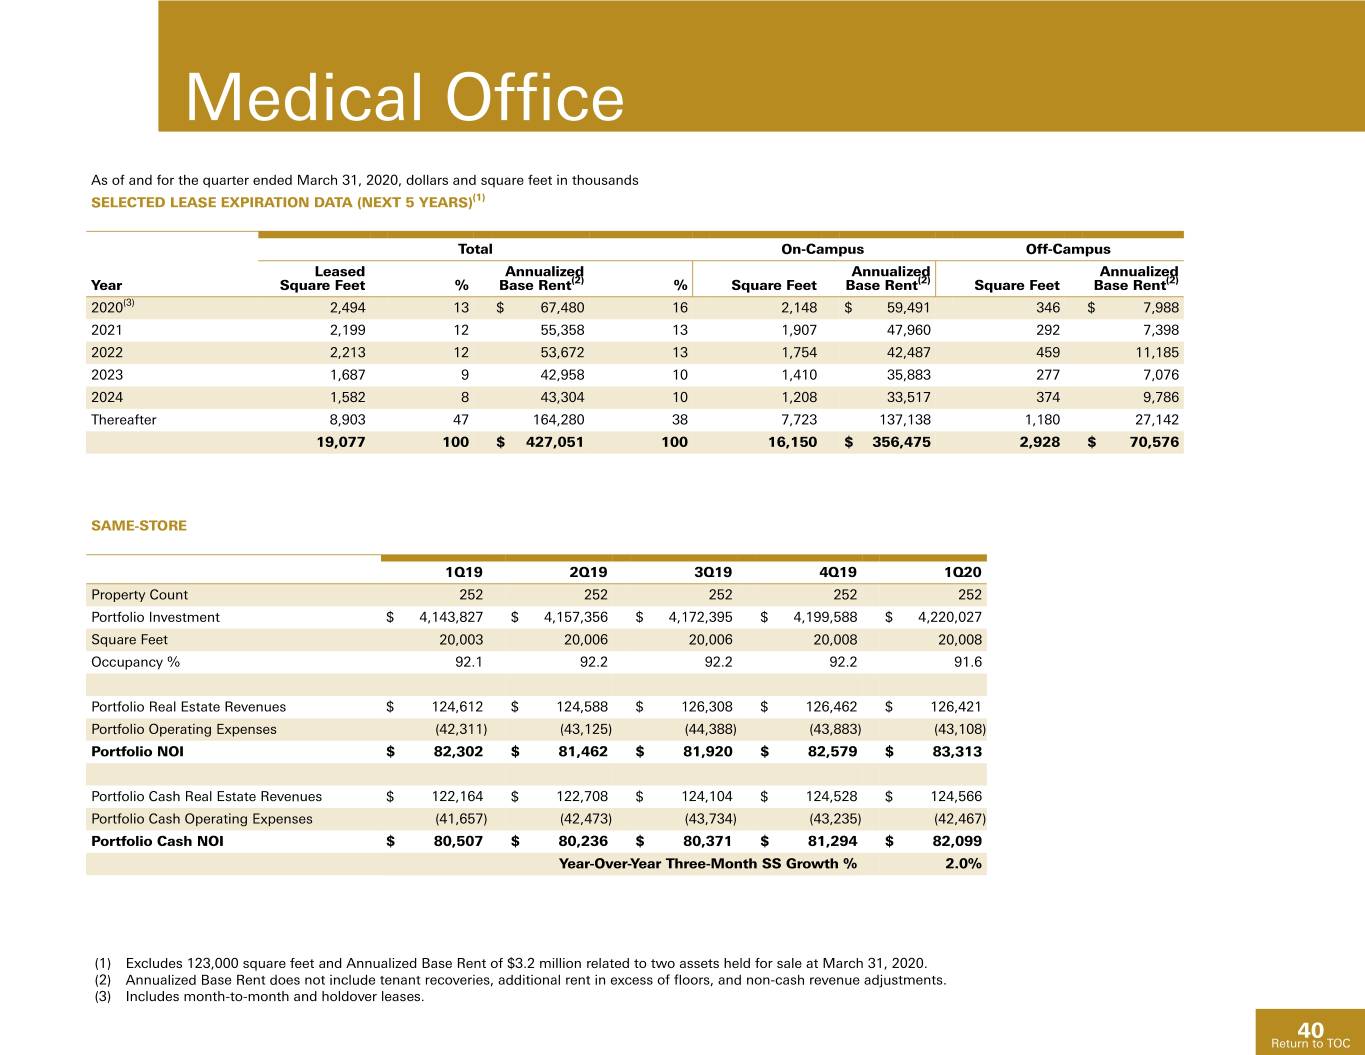
Medical Office As of and for the quarter ended March 31, 2020, dollars and square feet in thousands SELECTED LEASE EXPIRATION DATA (NEXT 5 YEARS)(1) Total On-Campus Off-Campus Leased Annualized Annualized Annualized Year Square Feet % Base Rent(2) % Square Feet Base Rent(2) Square Feet Base Rent(2) 2020(3) 2,494 13 $ 67,480 16 2,148 $ 59,491 346 $ 7,988 2021 2,199 12 55,358 13 1,907 47,960 292 7,398 2022 2,213 12 53,672 13 1,754 42,487 459 11,185 2023 1,687 9 42,958 10 1,410 35,883 277 7,076 2024 1,582 8 43,304 10 1,208 33,517 374 9,786 Thereafter 8,903 47 164,280 38 7,723 137,138 1,180 27,142 19,077 100 $ 427,051 100 16,150 $ 356,475 2,928 $ 70,576 SAME-STORE 1Q19 2Q19 3Q19 4Q19 1Q20 Property Count 252 252 252 252 252 Portfolio Investment $ 4,143,827 $ 4,157,356 $ 4,172,395 $ 4,199,588 $ 4,220,027 Square Feet 20,003 20,006 20,006 20,008 20,008 Occupancy % 92.1 92.2 92.2 92.2 91.6 Portfolio Real Estate Revenues $ 124,612 $ 124,588 $ 126,308 $ 126,462 $ 126,421 Portfolio Operating Expenses (42,311) (43,125) (44,388) (43,883) (43,108) Portfolio NOI $ 82,302 $ 81,462 $ 81,920 $ 82,579 $ 83,313 Portfolio Cash Real Estate Revenues $ 122,164 $ 122,708 $ 124,104 $ 124,528 $ 124,566 Portfolio Cash Operating Expenses (41,657) (42,473) (43,734) (43,235) (42,467) Portfolio Cash NOI $ 80,507 $ 80,236 $ 80,371 $ 81,294 $ 82,099 Year-Over-Year Three-Month SS Growth % 2.0% (1) Excludes 123,000 square feet and Annualized Base Rent of $3.2 million related to two assets held for sale at March 31, 2020. (2) Annualized Base Rent does not include tenant recoveries, additional rent in excess of floors, and non-cash revenue adjustments. (3) Includes month-to-month and holdover leases. 40 Return to TOC
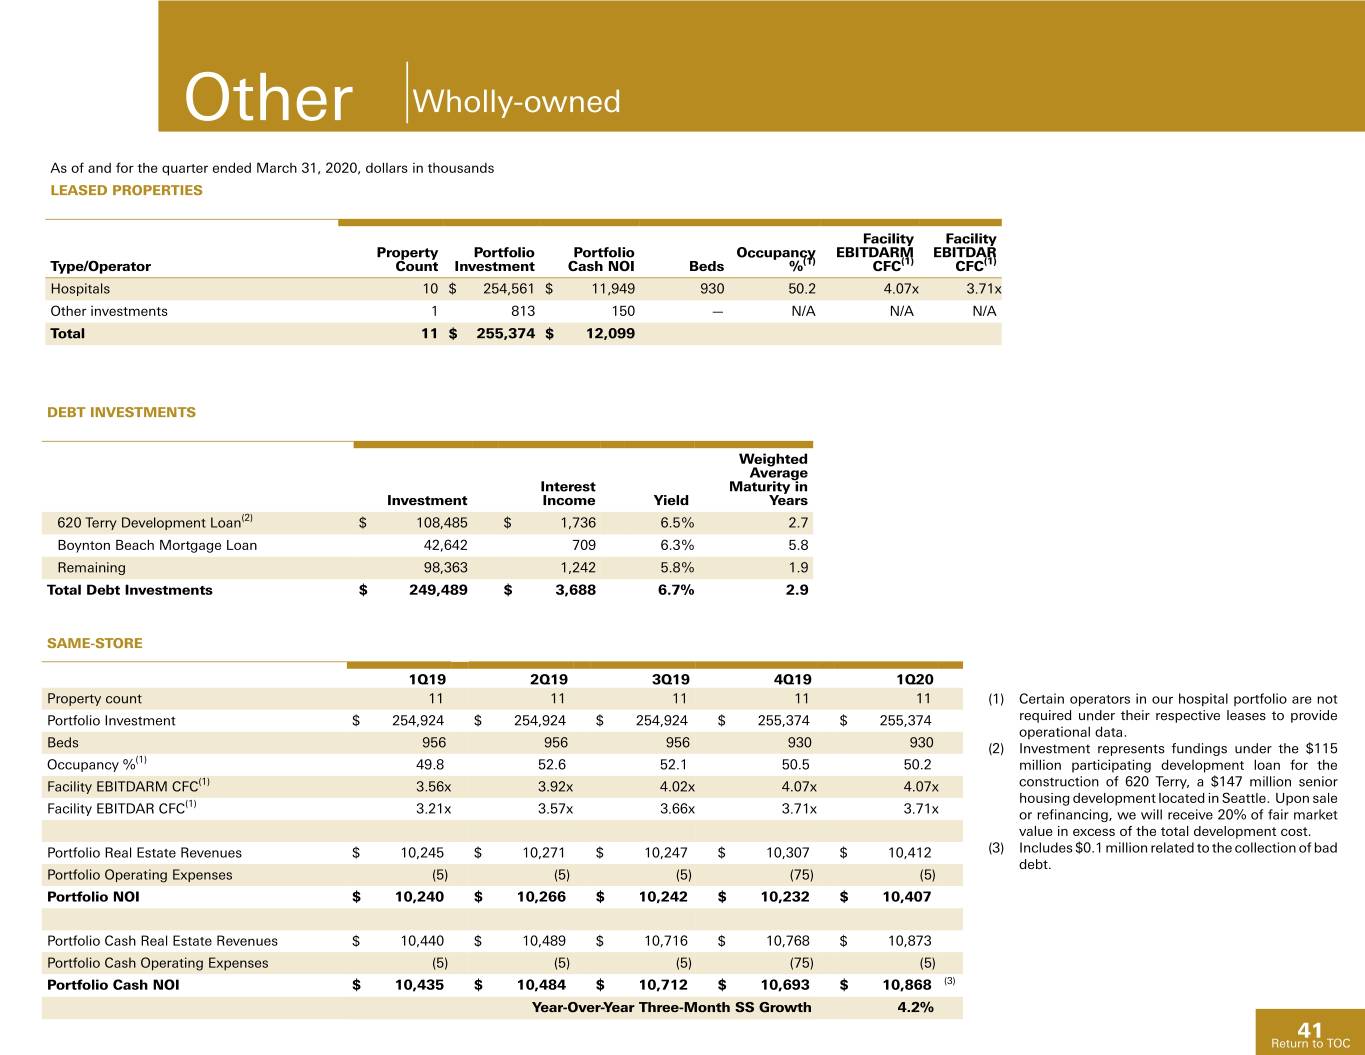
Other Wholly-owned As of and for the quarter ended March 31, 2020, dollars in thousands LEASED PROPERTIES Facility Facility Property Portfolio Portfolio Occupancy EBITDARM EBITDAR Type/Operator Count Investment Cash NOI Beds %(1) CFC(1) CFC(1) Hospitals 10 $ 254,561 $ 11,949 930 50.2 4.07x 3.71x Other investments 1 813 150 — N/A N/A N/A Total 11 $ 255,374 $ 12,099 DEBT INVESTMENTS Weighted Average Interest Maturity in Investment Income Yield Years 620 Terry Development Loan(2) $ 108,485 $ 1,736 6.5% 2.7 Boynton Beach Mortgage Loan 42,642 709 6.3% 5.8 Remaining 98,363 1,242 5.8% 1.9 Total Debt Investments $ 249,489 $ 3,688 6.7% 2.9 SAME-STORE 1Q19 2Q19 3Q19 4Q19 1Q20 Property count 11 11 11 11 11 (1) Certain operators in our hospital portfolio are not Portfolio Investment $ 254,924 $ 254,924 $ 254,924 $ 255,374 $ 255,374 required under their respective leases to provide operational data. Beds 956 956 956 930 930 (2) Investment represents fundings under the $115 Occupancy %(1) 49.8 52.6 52.1 50.5 50.2 million participating development loan for the Facility EBITDARM CFC(1) 3.56x 3.92x 4.02x 4.07x 4.07x construction of 620 Terry, a $147 million senior (1) housing development located in Seattle. Upon sale Facility EBITDAR CFC 3.21x 3.57x 3.66x 3.71x 3.71x or refinancing, we will receive 20% of fair market value in excess of the total development cost. Portfolio Real Estate Revenues $ 10,245 $ 10,271 $ 10,247 $ 10,307 $ 10,412 (3) Includes $0.1 million related to the collection of bad debt. Portfolio Operating Expenses (5) (5) (5) (75) (5) Portfolio NOI $ 10,240 $ 10,266 $ 10,242 $ 10,232 $ 10,407 Portfolio Cash Real Estate Revenues $ 10,440 $ 10,489 $ 10,716 $ 10,768 $ 10,873 Portfolio Cash Operating Expenses (5) (5) (5) (75) (5) Portfolio Cash NOI $ 10,435 $ 10,484 $ 10,712 $ 10,693 $ 10,868 (3) Year-Over-Year Three-Month SS Growth 4.2% 41 Return to TOC
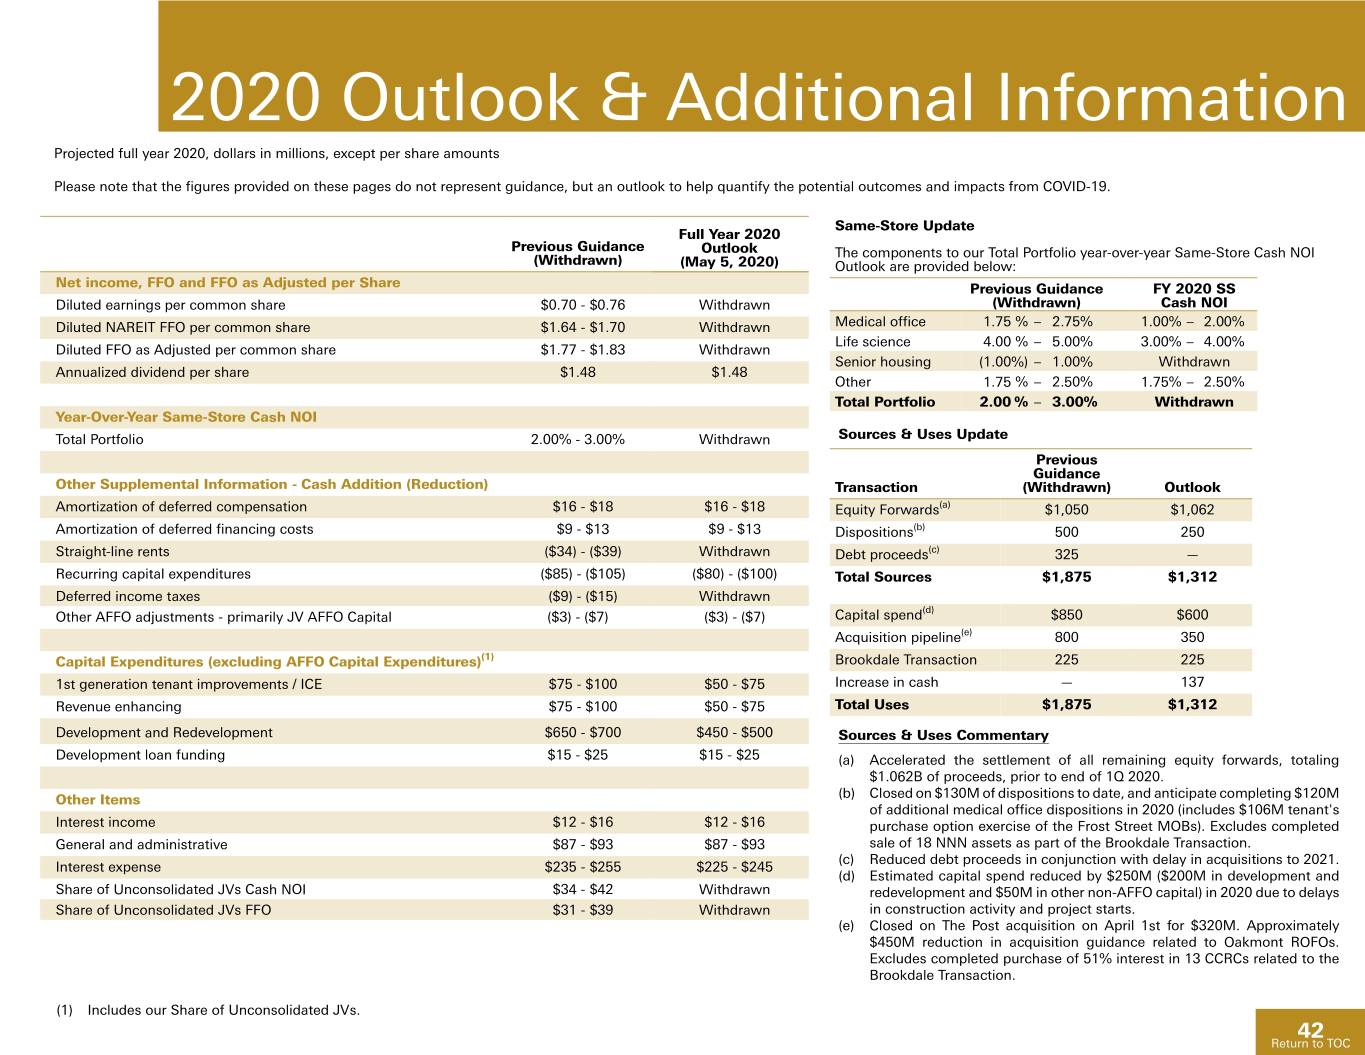
2020 Outlook & Additional Information Projected full year 2020, dollars in millions, except per share amounts Please note that the figures provided on these pages do not represent guidance, but an outlook to help quantify the potential outcomes and impacts from COVID-19. Same-Store Update Full Year 2020 Previous Guidance Outlook The components to our Total Portfolio year-over-year Same-Store Cash NOI (Withdrawn) (May 5, 2020) Outlook are provided below: Net income, FFO and FFO as Adjusted per Share Previous Guidance FY 2020 SS Diluted earnings per common share $0.70 - $0.76 Withdrawn (Withdrawn) Cash NOI Diluted NAREIT FFO per common share $1.64 - $1.70 Withdrawn Medical office 1.75 % – 2.75% 1.00% – 2.00% Life science 4.00 % – 5.00% 3.00% – 4.00% Diluted FFO as Adjusted per common share $1.77 - $1.83 Withdrawn Senior housing (1.00%) – 1.00% Withdrawn Annualized dividend per share $1.48 $1.48 Other 1.75 % – 2.50% 1.75% – 2.50% Total Portfolio 2.00 % – 3.00% Withdrawn Year-Over-Year Same-Store Cash NOI Total Portfolio 2.00% - 3.00% Withdrawn Sources & Uses Update Previous Guidance Other Supplemental Information - Cash Addition (Reduction) Transaction (Withdrawn) Outlook Amortization of deferred compensation $16 - $18 $16 - $18 Equity Forwards(a) $1,050 $1,062 Amortization of deferred financing costs $9 - $13 $9 - $13 Dispositions(b) 500 250 Straight-line rents ($34) - ($39) Withdrawn Debt proceeds(c) 325 — Recurring capital expenditures ($85) - ($105) ($80) - ($100) Total Sources $1,875 $1,312 Deferred income taxes ($9) - ($15) Withdrawn (d) Other AFFO adjustments - primarily JV AFFO Capital ($3) - ($7) ($3) - ($7) Capital spend $850 $600 Acquisition pipeline(e) 800 350 Capital Expenditures (excluding AFFO Capital Expenditures)(1) Brookdale Transaction 225 225 1st generation tenant improvements / ICE $75 - $100 $50 - $75 Increase in cash — 137 Revenue enhancing $75 - $100 $50 - $75 Total Uses $1,875 $1,312 Development and Redevelopment $650 - $700 $450 - $500 Sources & Uses Commentary Development loan funding $15 - $25 $15 - $25 (a) Accelerated the settlement of all remaining equity forwards, totaling $1.062B of proceeds, prior to end of 1Q 2020. Other Items (b) Closed on $130M of dispositions to date, and anticipate completing $120M of additional medical office dispositions in 2020 (includes $106M tenant's Interest income $12 - $16 $12 - $16 purchase option exercise of the Frost Street MOBs). Excludes completed General and administrative $87 - $93 $87 - $93 sale of 18 NNN assets as part of the Brookdale Transaction. (c) Reduced debt proceeds in conjunction with delay in acquisitions to 2021. Interest expense $235 - $255 $225 - $245 (d) Estimated capital spend reduced by $250M ($200M in development and Share of Unconsolidated JVs Cash NOI $34 - $42 Withdrawn redevelopment and $50M in other non-AFFO capital) in 2020 due to delays Share of Unconsolidated JVs FFO $31 - $39 Withdrawn in construction activity and project starts. (e) Closed on The Post acquisition on April 1st for $320M. Approximately $450M reduction in acquisition guidance related to Oakmont ROFOs. Excludes completed purchase of 51% interest in 13 CCRCs related to the Brookdale Transaction. (1) Includes our Share of Unconsolidated JVs. 42 Return to TOC
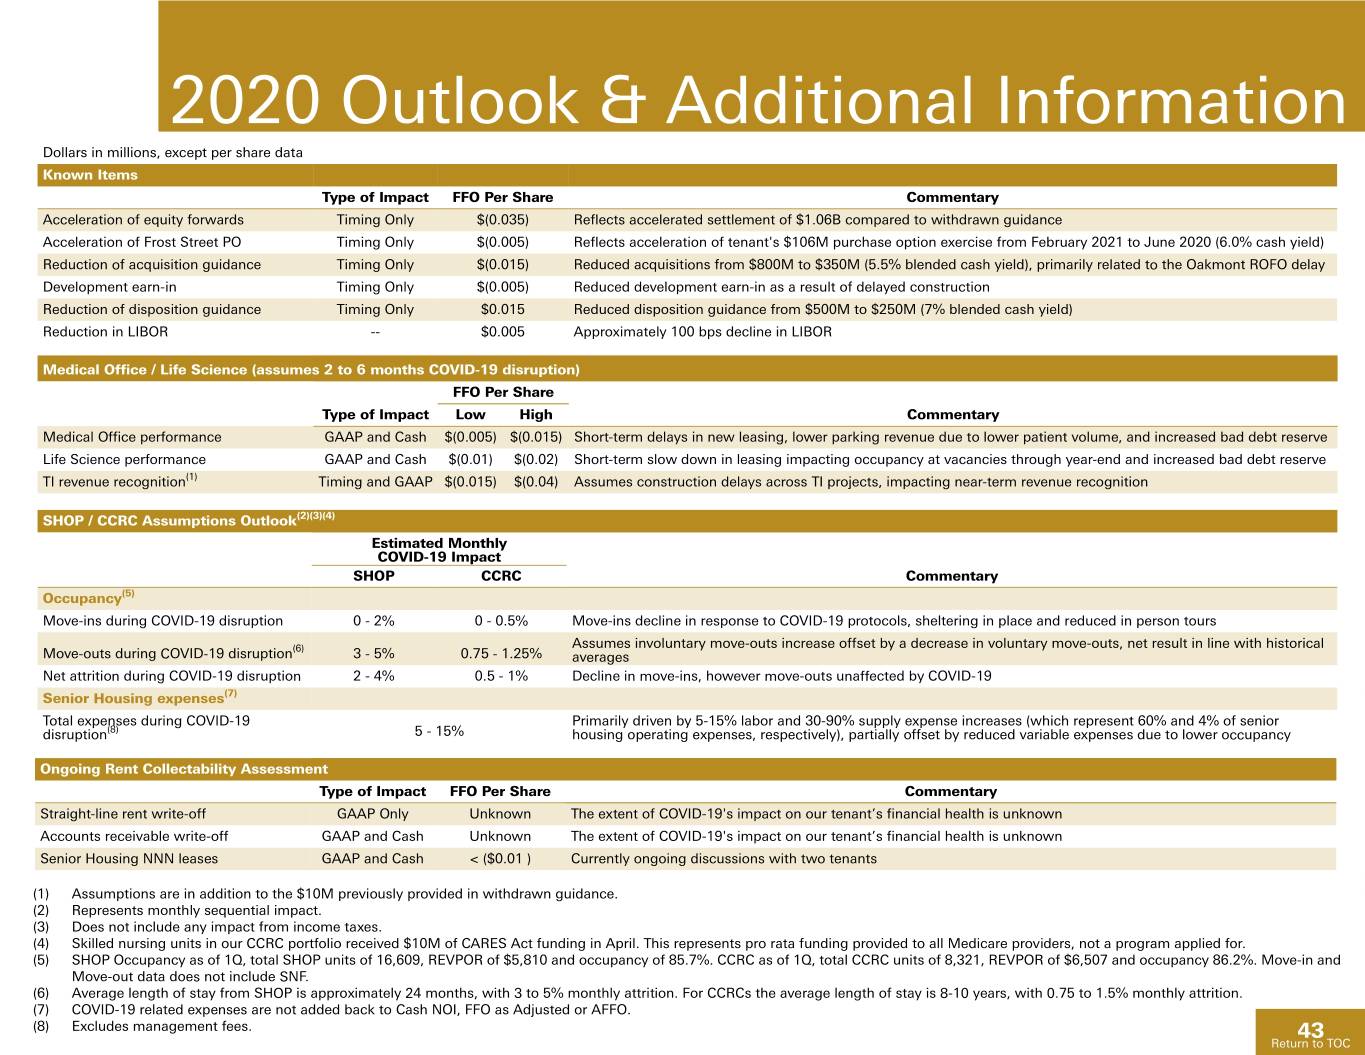
2020 Outlook & Additional Information Dollars in millions, except per share data Known Items Type of Impact FFO Per Share Commentary Acceleration of equity forwards Timing Only $(0.035) Reflects accelerated settlement of $1.06B compared to withdrawn guidance Acceleration of Frost Street PO Timing Only $(0.005) Reflects acceleration of tenant's $106M purchase option exercise from February 2021 to June 2020 (6.0% cash yield) Reduction of acquisition guidance Timing Only $(0.015) Reduced acquisitions from $800M to $350M (5.5% blended cash yield), primarily related to the Oakmont ROFO delay Development earn-in Timing Only $(0.005) Reduced development earn-in as a result of delayed construction Reduction of disposition guidance Timing Only $0.015 Reduced disposition guidance from $500M to $250M (7% blended cash yield) Reduction in LIBOR -- $0.005 Approximately 100 bps decline in LIBOR Medical Office / Life Science (assumes 2 to 6 months COVID-19 disruption) FFO Per Share Type of Impact Low High Commentary Medical Office performance GAAP and Cash $(0.005) $(0.015) Short-term delays in new leasing, lower parking revenue due to lower patient volume, and increased bad debt reserve Life Science performance GAAP and Cash $(0.01) $(0.02) Short-term slow down in leasing impacting occupancy at vacancies through year-end and increased bad debt reserve TI revenue recognition(1) Timing and GAAP $(0.015) $(0.04) Assumes construction delays across TI projects, impacting near-term revenue recognition SHOP / CCRC Assumptions Outlook(2)(3)(4) Estimated Monthly COVID-19 Impact SHOP CCRC Commentary Occupancy(5) Move-ins during COVID-19 disruption 0 - 2% 0 - 0.5% Move-ins decline in response to COVID-19 protocols, sheltering in place and reduced in person tours (6) Assumes involuntary move-outs increase offset by a decrease in voluntary move-outs, net result in line with historical Move-outs during COVID-19 disruption 3 - 5% 0.75 - 1.25% averages Net attrition during COVID-19 disruption 2 - 4% 0.5 - 1% Decline in move-ins, however move-outs unaffected by COVID-19 Senior Housing expenses(7) Total expenses during COVID-19 Primarily driven by 5-15% labor and 30-90% supply expense increases (which represent 60% and 4% of senior disruption(8) 5 - 15% housing operating expenses, respectively), partially offset by reduced variable expenses due to lower occupancy Ongoing Rent Collectability Assessment Type of Impact FFO Per Share Commentary Straight-line rent write-off GAAP Only Unknown The extent of COVID-19's impact on our tenant’s financial health is unknown Accounts receivable write-off GAAP and Cash Unknown The extent of COVID-19's impact on our tenant’s financial health is unknown Senior Housing NNN leases GAAP and Cash < ($0.01 ) Currently ongoing discussions with two tenants (1) Assumptions are in addition to the $10M previously provided in withdrawn guidance. (2) Represents monthly sequential impact. (3) Does not include any impact from income taxes. (4) Skilled nursing units in our CCRC portfolio received $10M of CARES Act funding in April. This represents pro rata funding provided to all Medicare providers, not a program applied for. (5) SHOP Occupancy as of 1Q, total SHOP units of 16,609, REVPOR of $5,810 and occupancy of 85.7%. CCRC as of 1Q, total CCRC units of 8,321, REVPOR of $6,507 and occupancy 86.2%. Move-in and Move-out data does not include SNF. (6) Average length of stay from SHOP is approximately 24 months, with 3 to 5% monthly attrition. For CCRCs the average length of stay is 8-10 years, with 0.75 to 1.5% monthly attrition. (7) COVID-19 related expenses are not added back to Cash NOI, FFO as Adjusted or AFFO. (8) Excludes management fees. 43 Return to TOC
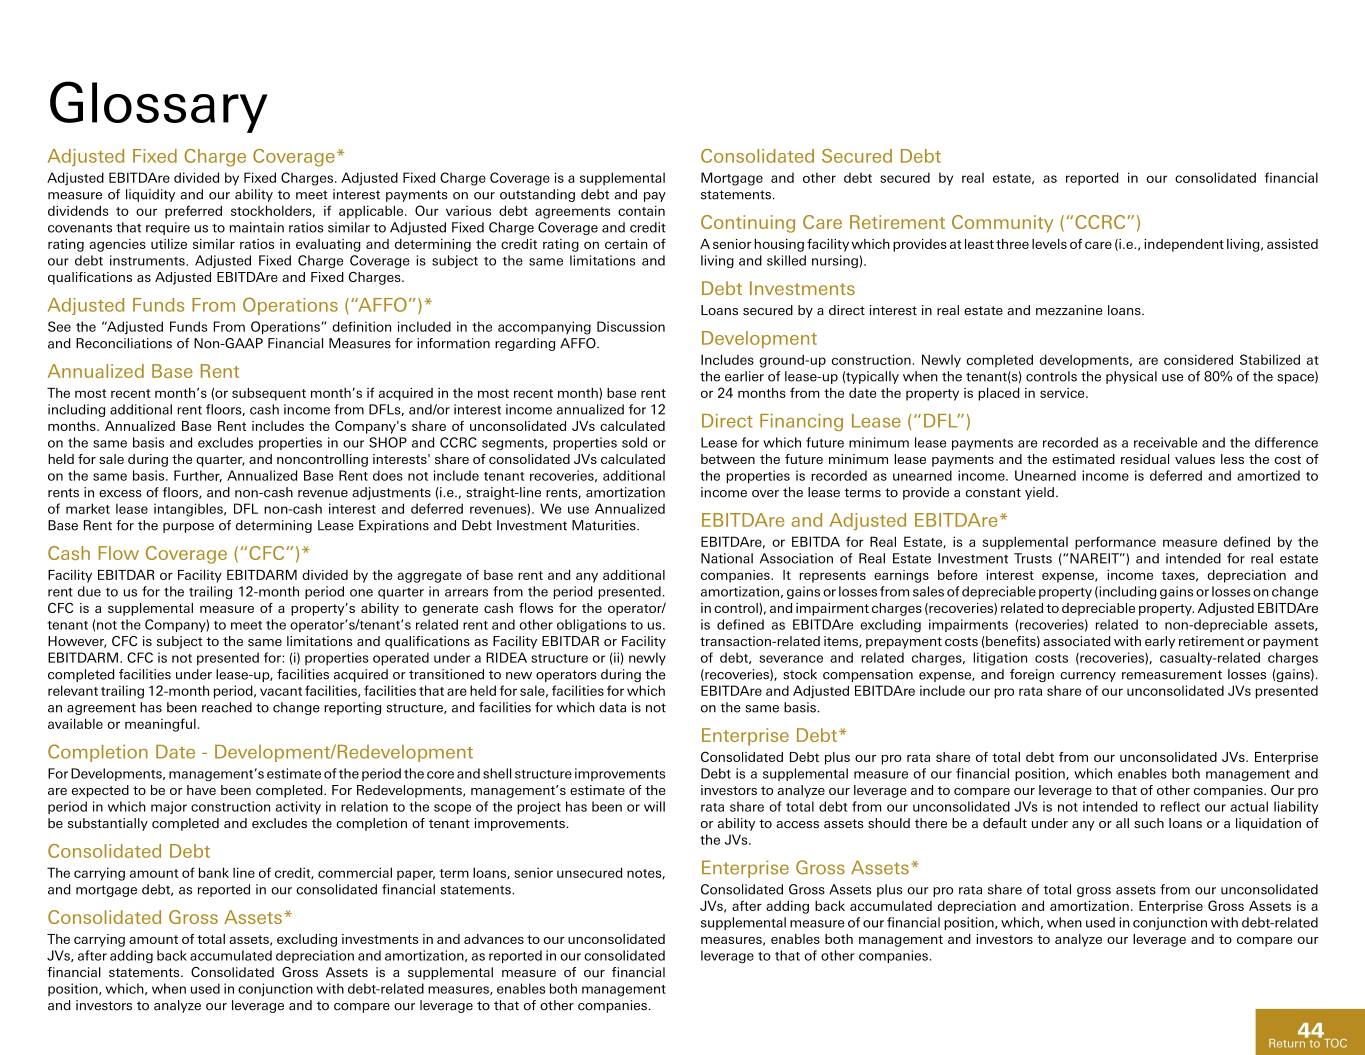
Glossary Adjusted Fixed Charge Coverage* Consolidated Secured Debt Adjusted EBITDAre divided by Fixed Charges. Adjusted Fixed Charge Coverage is a supplemental Mortgage and other debt secured by real estate, as reported in our consolidated financial measure of liquidity and our ability to meet interest payments on our outstanding debt and pay statements. dividends to our preferred stockholders, if applicable. Our various debt agreements contain covenants that require us to maintain ratios similar to Adjusted Fixed Charge Coverage and credit Continuing Care Retirement Community (“CCRC”) rating agencies utilize similar ratios in evaluating and determining the credit rating on certain of A senior housing facility which provides at least three levels of care (i.e., independent living, assisted our debt instruments. Adjusted Fixed Charge Coverage is subject to the same limitations and living and skilled nursing). qualifications as Adjusted EBITDAre and Fixed Charges. Debt Investments Adjusted Funds From Operations (“AFFO”)* Loans secured by a direct interest in real estate and mezzanine loans. See the “Adjusted Funds From Operations” definition included in the accompanying Discussion and Reconciliations of Non-GAAP Financial Measures for information regarding AFFO. Development Includes ground-up construction. Newly completed developments, are considered Stabilized at Annualized Base Rent the earlier of lease-up (typically when the tenant(s) controls the physical use of 80% of the space) The most recent month’s (or subsequent month’s if acquired in the most recent month) base rent or 24 months from the date the property is placed in service. including additional rent floors, cash income from DFLs, and/or interest income annualized for 12 months. Annualized Base Rent includes the Company's share of unconsolidated JVs calculated Direct Financing Lease (“DFL”) on the same basis and excludes properties in our SHOP and CCRC segments, properties sold or Lease for which future minimum lease payments are recorded as a receivable and the difference held for sale during the quarter, and noncontrolling interests' share of consolidated JVs calculated between the future minimum lease payments and the estimated residual values less the cost of on the same basis. Further, Annualized Base Rent does not include tenant recoveries, additional the properties is recorded as unearned income. Unearned income is deferred and amortized to rents in excess of floors, and non-cash revenue adjustments (i.e., straight-line rents, amortization income over the lease terms to provide a constant yield. of market lease intangibles, DFL non-cash interest and deferred revenues). We use Annualized Base Rent for the purpose of determining Lease Expirations and Debt Investment Maturities. EBITDAre and Adjusted EBITDAre* EBITDAre, or EBITDA for Real Estate, is a supplemental performance measure defined by the Cash Flow Coverage (“CFC”)* National Association of Real Estate Investment Trusts (“NAREIT”) and intended for real estate Facility EBITDAR or Facility EBITDARM divided by the aggregate of base rent and any additional companies. It represents earnings before interest expense, income taxes, depreciation and rent due to us for the trailing 12-month period one quarter in arrears from the period presented. amortization, gains or losses from sales of depreciable property (including gains or losses on change CFC is a supplemental measure of a property’s ability to generate cash flows for the operator/ in control), and impairment charges (recoveries) related to depreciable property. Adjusted EBITDAre tenant (not the Company) to meet the operator’s/tenant’s related rent and other obligations to us. is defined as EBITDAre excluding impairments (recoveries) related to non-depreciable assets, However, CFC is subject to the same limitations and qualifications as Facility EBITDAR or Facility transaction-related items, prepayment costs (benefits) associated with early retirement or payment EBITDARM. CFC is not presented for: (i) properties operated under a RIDEA structure or (ii) newly of debt, severance and related charges, litigation costs (recoveries), casualty-related charges completed facilities under lease-up, facilities acquired or transitioned to new operators during the (recoveries), stock compensation expense, and foreign currency remeasurement losses (gains). relevant trailing 12-month period, vacant facilities, facilities that are held for sale, facilities for which EBITDAre and Adjusted EBITDAre include our pro rata share of our unconsolidated JVs presented an agreement has been reached to change reporting structure, and facilities for which data is not on the same basis. available or meaningful. Enterprise Debt* Completion Date - Development/Redevelopment Consolidated Debt plus our pro rata share of total debt from our unconsolidated JVs. Enterprise For Developments, management’s estimate of the period the core and shell structure improvements Debt is a supplemental measure of our financial position, which enables both management and are expected to be or have been completed. For Redevelopments, management’s estimate of the investors to analyze our leverage and to compare our leverage to that of other companies. Our pro period in which major construction activity in relation to the scope of the project has been or will rata share of total debt from our unconsolidated JVs is not intended to reflect our actual liability be substantially completed and excludes the completion of tenant improvements. or ability to access assets should there be a default under any or all such loans or a liquidation of the JVs. Consolidated Debt The carrying amount of bank line of credit, commercial paper, term loans, senior unsecured notes, Enterprise Gross Assets* and mortgage debt, as reported in our consolidated financial statements. Consolidated Gross Assets plus our pro rata share of total gross assets from our unconsolidated JVs, after adding back accumulated depreciation and amortization. Enterprise Gross Assets is a Consolidated Gross Assets* supplemental measure of our financial position, which, when used in conjunction with debt-related The carrying amount of total assets, excluding investments in and advances to our unconsolidated measures, enables both management and investors to analyze our leverage and to compare our JVs, after adding back accumulated depreciation and amortization, as reported in our consolidated leverage to that of other companies. financial statements. Consolidated Gross Assets is a supplemental measure of our financial position, which, when used in conjunction with debt-related measures, enables both management and investors to analyze our leverage and to compare our leverage to that of other companies. 44 ReturnReturn to to TOC TOC
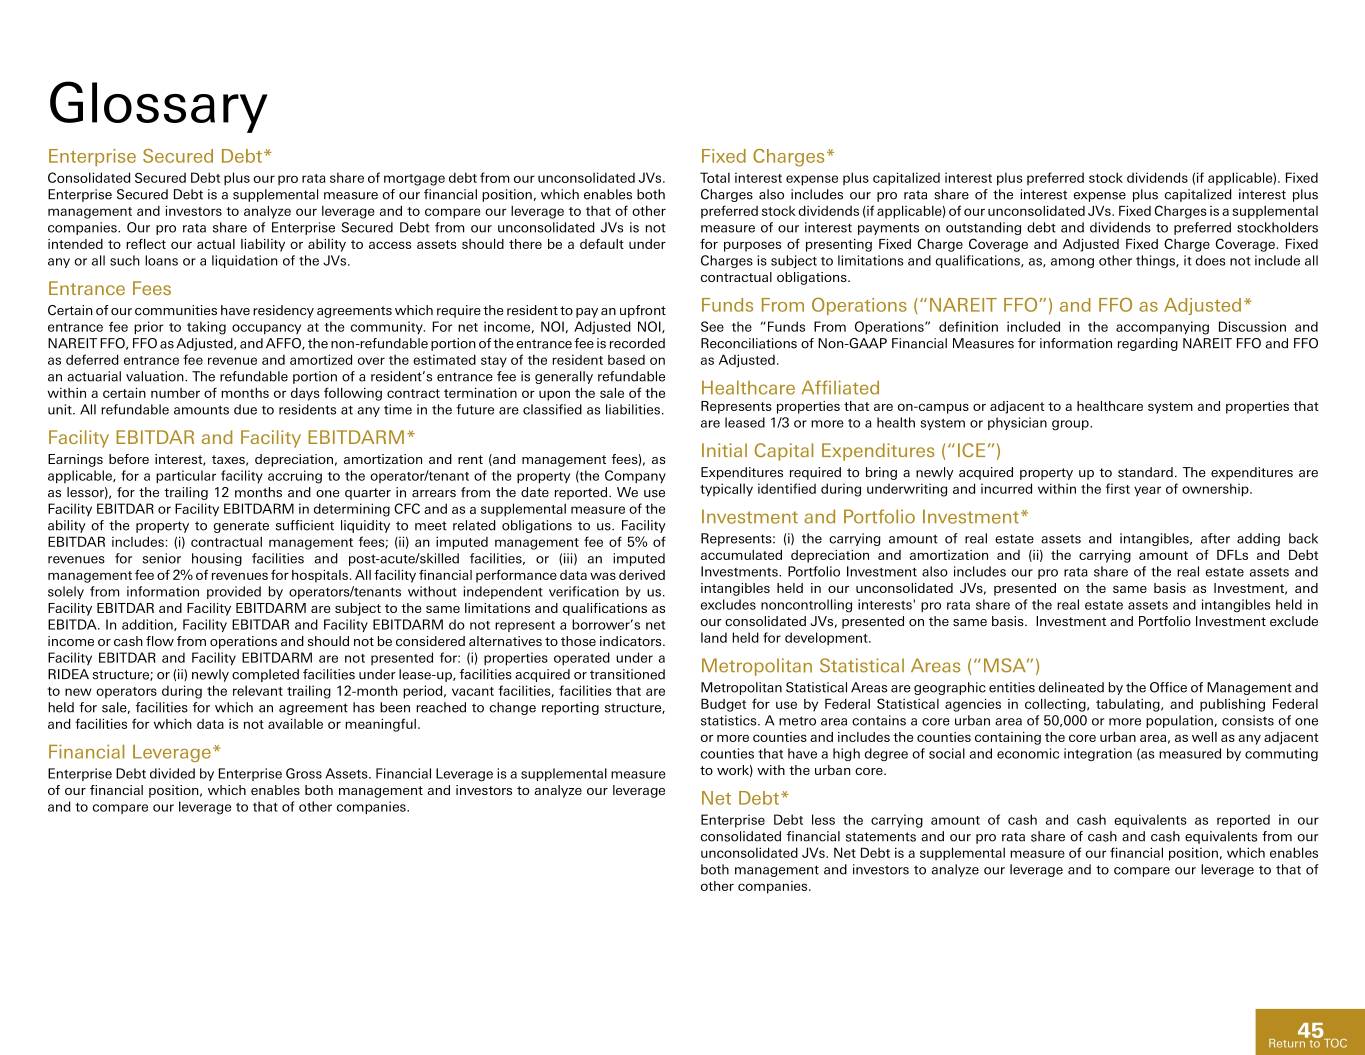
Glossary Enterprise Secured Debt* Fixed Charges* Consolidated Secured Debt plus our pro rata share of mortgage debt from our unconsolidated JVs. Total interest expense plus capitalized interest plus preferred stock dividends (if applicable). Fixed Enterprise Secured Debt is a supplemental measure of our financial position, which enables both Charges also includes our pro rata share of the interest expense plus capitalized interest plus management and investors to analyze our leverage and to compare our leverage to that of other preferred stock dividends (if applicable) of our unconsolidated JVs. Fixed Charges is a supplemental companies. Our pro rata share of Enterprise Secured Debt from our unconsolidated JVs is not measure of our interest payments on outstanding debt and dividends to preferred stockholders intended to reflect our actual liability or ability to access assets should there be a default under for purposes of presenting Fixed Charge Coverage and Adjusted Fixed Charge Coverage. Fixed any or all such loans or a liquidation of the JVs. Charges is subject to limitations and qualifications, as, among other things, it does not include all contractual obligations. Entrance Fees Certain of our communities have residency agreements which require the resident to pay an upfront Funds From Operations (“NAREIT FFO”) and FFO as Adjusted* entrance fee prior to taking occupancy at the community. For net income, NOI, Adjusted NOI, See the “Funds From Operations” definition included in the accompanying Discussion and NAREIT FFO, FFO as Adjusted, and AFFO, the non-refundable portion of the entrance fee is recorded Reconciliations of Non-GAAP Financial Measures for information regarding NAREIT FFO and FFO as deferred entrance fee revenue and amortized over the estimated stay of the resident based on as Adjusted. an actuarial valuation. The refundable portion of a resident’s entrance fee is generally refundable within a certain number of months or days following contract termination or upon the sale of the Healthcare Affiliated unit. All refundable amounts due to residents at any time in the future are classified as liabilities. Represents properties that are on-campus or adjacent to a healthcare system and properties that are leased 1/3 or more to a health system or physician group. Facility EBITDAR and Facility EBITDARM* Earnings before interest, taxes, depreciation, amortization and rent (and management fees), as Initial Capital Expenditures (“ICE”) applicable, for a particular facility accruing to the operator/tenant of the property (the Company Expenditures required to bring a newly acquired property up to standard. The expenditures are as lessor), for the trailing 12 months and one quarter in arrears from the date reported. We use typically identified during underwriting and incurred within the first year of ownership. Facility EBITDAR or Facility EBITDARM in determining CFC and as a supplemental measure of the ability of the property to generate sufficient liquidity to meet related obligations to us. Facility Investment and Portfolio Investment* EBITDAR includes: (i) contractual management fees; (ii) an imputed management fee of 5% of Represents: (i) the carrying amount of real estate assets and intangibles, after adding back revenues for senior housing facilities and post-acute/skilled facilities, or (iii) an imputed accumulated depreciation and amortization and (ii) the carrying amount of DFLs and Debt management fee of 2% of revenues for hospitals. All facility financial performance data was derived Investments. Portfolio Investment also includes our pro rata share of the real estate assets and solely from information provided by operators/tenants without independent verification by us. intangibles held in our unconsolidated JVs, presented on the same basis as Investment, and Facility EBITDAR and Facility EBITDARM are subject to the same limitations and qualifications as excludes noncontrolling interests' pro rata share of the real estate assets and intangibles held in EBITDA. In addition, Facility EBITDAR and Facility EBITDARM do not represent a borrower’s net our consolidated JVs, presented on the same basis. Investment and Portfolio Investment exclude income or cash flow from operations and should not be considered alternatives to those indicators. land held for development. Facility EBITDAR and Facility EBITDARM are not presented for: (i) properties operated under a RIDEA structure; or (ii) newly completed facilities under lease-up, facilities acquired or transitioned Metropolitan Statistical Areas (“MSA”) to new operators during the relevant trailing 12-month period, vacant facilities, facilities that are Metropolitan Statistical Areas are geographic entities delineated by the Office of Management and held for sale, facilities for which an agreement has been reached to change reporting structure, Budget for use by Federal Statistical agencies in collecting, tabulating, and publishing Federal and facilities for which data is not available or meaningful. statistics. A metro area contains a core urban area of 50,000 or more population, consists of one or more counties and includes the counties containing the core urban area, as well as any adjacent Financial Leverage* counties that have a high degree of social and economic integration (as measured by commuting Enterprise Debt divided by Enterprise Gross Assets. Financial Leverage is a supplemental measure to work) with the urban core. of our financial position, which enables both management and investors to analyze our leverage and to compare our leverage to that of other companies. Net Debt* Enterprise Debt less the carrying amount of cash and cash equivalents as reported in our consolidated financial statements and our pro rata share of cash and cash equivalents from our unconsolidated JVs. Net Debt is a supplemental measure of our financial position, which enables both management and investors to analyze our leverage and to compare our leverage to that of other companies. 45 ReturnReturn to to TOC TOC
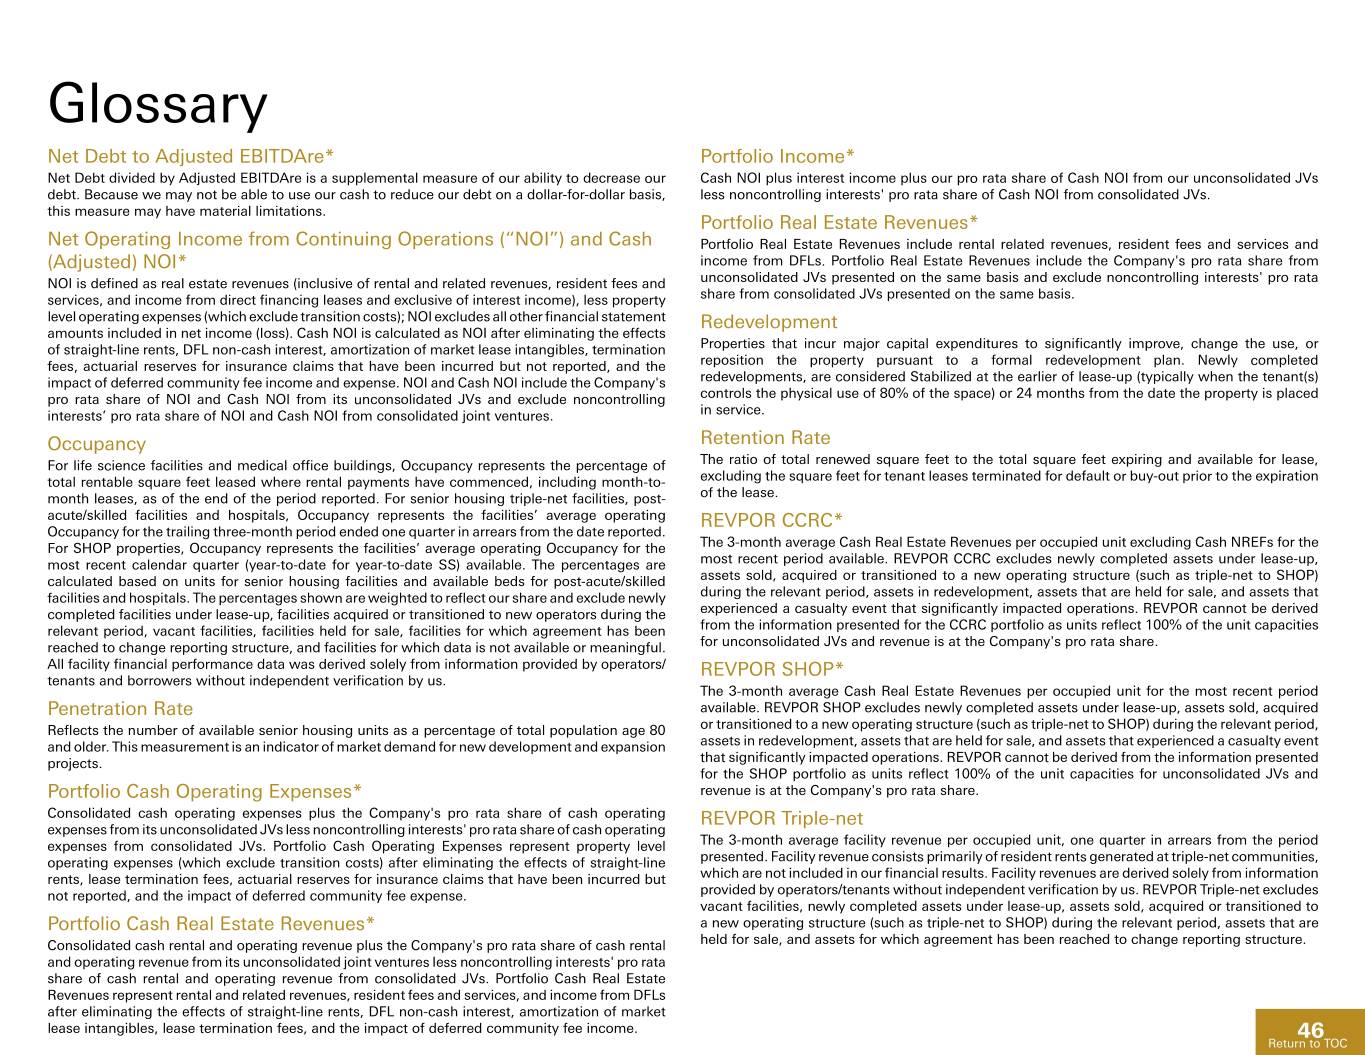
Glossary Net Debt to Adjusted EBITDAre* Portfolio Income* Net Debt divided by Adjusted EBITDAre is a supplemental measure of our ability to decrease our Cash NOI plus interest income plus our pro rata share of Cash NOI from our unconsolidated JVs debt. Because we may not be able to use our cash to reduce our debt on a dollar-for-dollar basis, less noncontrolling interests' pro rata share of Cash NOI from consolidated JVs. this measure may have material limitations. Portfolio Real Estate Revenues* Net Operating Income from Continuing Operations (“NOI”) and Cash Portfolio Real Estate Revenues include rental related revenues, resident fees and services and (Adjusted) NOI* income from DFLs. Portfolio Real Estate Revenues include the Company's pro rata share from NOI is defined as real estate revenues (inclusive of rental and related revenues, resident fees and unconsolidated JVs presented on the same basis and exclude noncontrolling interests' pro rata services, and income from direct financing leases and exclusive of interest income), less property share from consolidated JVs presented on the same basis. level operating expenses (which exclude transition costs); NOI excludes all other financial statement Redevelopment amounts included in net income (loss). Cash NOI is calculated as NOI after eliminating the effects of straight-line rents, DFL non-cash interest, amortization of market lease intangibles, termination Properties that incur major capital expenditures to significantly improve, change the use, or fees, actuarial reserves for insurance claims that have been incurred but not reported, and the reposition the property pursuant to a formal redevelopment plan. Newly completed impact of deferred community fee income and expense. NOI and Cash NOI include the Company's redevelopments, are considered Stabilized at the earlier of lease-up (typically when the tenant(s) pro rata share of NOI and Cash NOI from its unconsolidated JVs and exclude noncontrolling controls the physical use of 80% of the space) or 24 months from the date the property is placed interests’ pro rata share of NOI and Cash NOI from consolidated joint ventures. in service. Occupancy Retention Rate For life science facilities and medical office buildings, Occupancy represents the percentage of The ratio of total renewed square feet to the total square feet expiring and available for lease, total rentable square feet leased where rental payments have commenced, including month-to- excluding the square feet for tenant leases terminated for default or buy-out prior to the expiration month leases, as of the end of the period reported. For senior housing triple-net facilities, post- of the lease. acute/skilled facilities and hospitals, Occupancy represents the facilities’ average operating REVPOR CCRC* Occupancy for the trailing three-month period ended one quarter in arrears from the date reported. For SHOP properties, Occupancy represents the facilities’ average operating Occupancy for the The 3-month average Cash Real Estate Revenues per occupied unit excluding Cash NREFs for the most recent calendar quarter (year-to-date for year-to-date SS) available. The percentages are most recent period available. REVPOR CCRC excludes newly completed assets under lease-up, calculated based on units for senior housing facilities and available beds for post-acute/skilled assets sold, acquired or transitioned to a new operating structure (such as triple-net to SHOP) facilities and hospitals. The percentages shown are weighted to reflect our share and exclude newly during the relevant period, assets in redevelopment, assets that are held for sale, and assets that completed facilities under lease-up, facilities acquired or transitioned to new operators during the experienced a casualty event that significantly impacted operations. REVPOR cannot be derived relevant period, vacant facilities, facilities held for sale, facilities for which agreement has been from the information presented for the CCRC portfolio as units reflect 100% of the unit capacities reached to change reporting structure, and facilities for which data is not available or meaningful. for unconsolidated JVs and revenue is at the Company's pro rata share. All facility financial performance data was derived solely from information provided by operators/ REVPOR SHOP* tenants and borrowers without independent verification by us. The 3-month average Cash Real Estate Revenues per occupied unit for the most recent period Penetration Rate available. REVPOR SHOP excludes newly completed assets under lease-up, assets sold, acquired Reflects the number of available senior housing units as a percentage of total population age 80 or transitioned to a new operating structure (such as triple-net to SHOP) during the relevant period, and older. This measurement is an indicator of market demand for new development and expansion assets in redevelopment, assets that are held for sale, and assets that experienced a casualty event projects. that significantly impacted operations. REVPOR cannot be derived from the information presented for the SHOP portfolio as units reflect 100% of the unit capacities for unconsolidated JVs and Portfolio Cash Operating Expenses* revenue is at the Company's pro rata share. Consolidated cash operating expenses plus the Company's pro rata share of cash operating REVPOR Triple-net expenses from its unconsolidated JVs less noncontrolling interests' pro rata share of cash operating expenses from consolidated JVs. Portfolio Cash Operating Expenses represent property level The 3-month average facility revenue per occupied unit, one quarter in arrears from the period operating expenses (which exclude transition costs) after eliminating the effects of straight-line presented. Facility revenue consists primarily of resident rents generated at triple-net communities, rents, lease termination fees, actuarial reserves for insurance claims that have been incurred but which are not included in our financial results. Facility revenues are derived solely from information not reported, and the impact of deferred community fee expense. provided by operators/tenants without independent verification by us. REVPOR Triple-net excludes vacant facilities, newly completed assets under lease-up, assets sold, acquired or transitioned to Portfolio Cash Real Estate Revenues* a new operating structure (such as triple-net to SHOP) during the relevant period, assets that are Consolidated cash rental and operating revenue plus the Company's pro rata share of cash rental held for sale, and assets for which agreement has been reached to change reporting structure. and operating revenue from its unconsolidated joint ventures less noncontrolling interests' pro rata share of cash rental and operating revenue from consolidated JVs. Portfolio Cash Real Estate Revenues represent rental and related revenues, resident fees and services, and income from DFLs after eliminating the effects of straight-line rents, DFL non-cash interest, amortization of market lease intangibles, lease termination fees, and the impact of deferred community fee income. 46 ReturnReturn to to TOC TOC
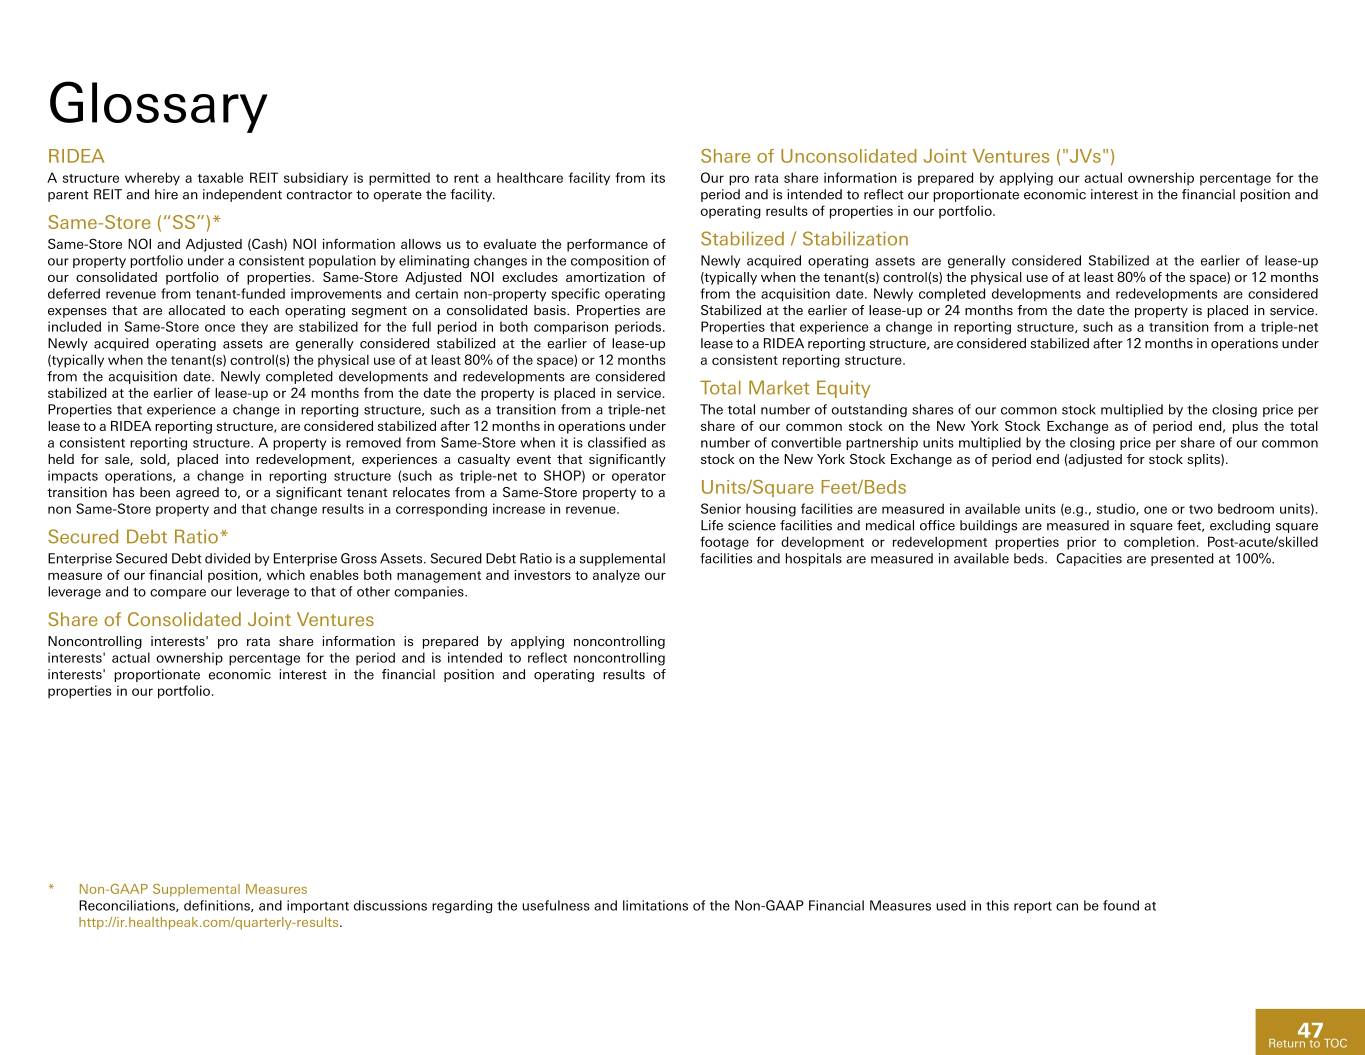
Glossary RIDEA Share of Unconsolidated Joint Ventures ("JVs") A structure whereby a taxable REIT subsidiary is permitted to rent a healthcare facility from its Our pro rata share information is prepared by applying our actual ownership percentage for the parent REIT and hire an independent contractor to operate the facility. period and is intended to reflect our proportionate economic interest in the financial position and operating results of properties in our portfolio. Same-Store (“SS”)* Same-Store NOI and Adjusted (Cash) NOI information allows us to evaluate the performance of Stabilized / Stabilization our property portfolio under a consistent population by eliminating changes in the composition of Newly acquired operating assets are generally considered Stabilized at the earlier of lease-up our consolidated portfolio of properties. Same-Store Adjusted NOI excludes amortization of (typically when the tenant(s) control(s) the physical use of at least 80% of the space) or 12 months deferred revenue from tenant-funded improvements and certain non-property specific operating from the acquisition date. Newly completed developments and redevelopments are considered expenses that are allocated to each operating segment on a consolidated basis. Properties are Stabilized at the earlier of lease-up or 24 months from the date the property is placed in service. included in Same-Store once they are stabilized for the full period in both comparison periods. Properties that experience a change in reporting structure, such as a transition from a triple-net Newly acquired operating assets are generally considered stabilized at the earlier of lease-up lease to a RIDEA reporting structure, are considered stabilized after 12 months in operations under (typically when the tenant(s) control(s) the physical use of at least 80% of the space) or 12 months a consistent reporting structure. from the acquisition date. Newly completed developments and redevelopments are considered stabilized at the earlier of lease-up or 24 months from the date the property is placed in service. Total Market Equity Properties that experience a change in reporting structure, such as a transition from a triple-net The total number of outstanding shares of our common stock multiplied by the closing price per lease to a RIDEA reporting structure, are considered stabilized after 12 months in operations under share of our common stock on the New York Stock Exchange as of period end, plus the total a consistent reporting structure. A property is removed from Same-Store when it is classified as number of convertible partnership units multiplied by the closing price per share of our common held for sale, sold, placed into redevelopment, experiences a casualty event that significantly stock on the New York Stock Exchange as of period end (adjusted for stock splits). impacts operations, a change in reporting structure (such as triple-net to SHOP) or operator transition has been agreed to, or a significant tenant relocates from a Same-Store property to a Units/Square Feet/Beds non Same-Store property and that change results in a corresponding increase in revenue. Senior housing facilities are measured in available units (e.g., studio, one or two bedroom units). Life science facilities and medical office buildings are measured in square feet, excluding square Secured Debt Ratio* footage for development or redevelopment properties prior to completion. Post-acute/skilled Enterprise Secured Debt divided by Enterprise Gross Assets. Secured Debt Ratio is a supplemental facilities and hospitals are measured in available beds. Capacities are presented at 100%. measure of our financial position, which enables both management and investors to analyze our leverage and to compare our leverage to that of other companies. Share of Consolidated Joint Ventures Noncontrolling interests' pro rata share information is prepared by applying noncontrolling interests' actual ownership percentage for the period and is intended to reflect noncontrolling interests' proportionate economic interest in the financial position and operating results of properties in our portfolio. * Non-GAAP Supplemental Measures Reconciliations, definitions, and important discussions regarding the usefulness and limitations of the Non-GAAP Financial Measures used in this report can be found at http://ir.healthpeak.com/quarterly-results. 47 ReturnReturn to to TOC TOC
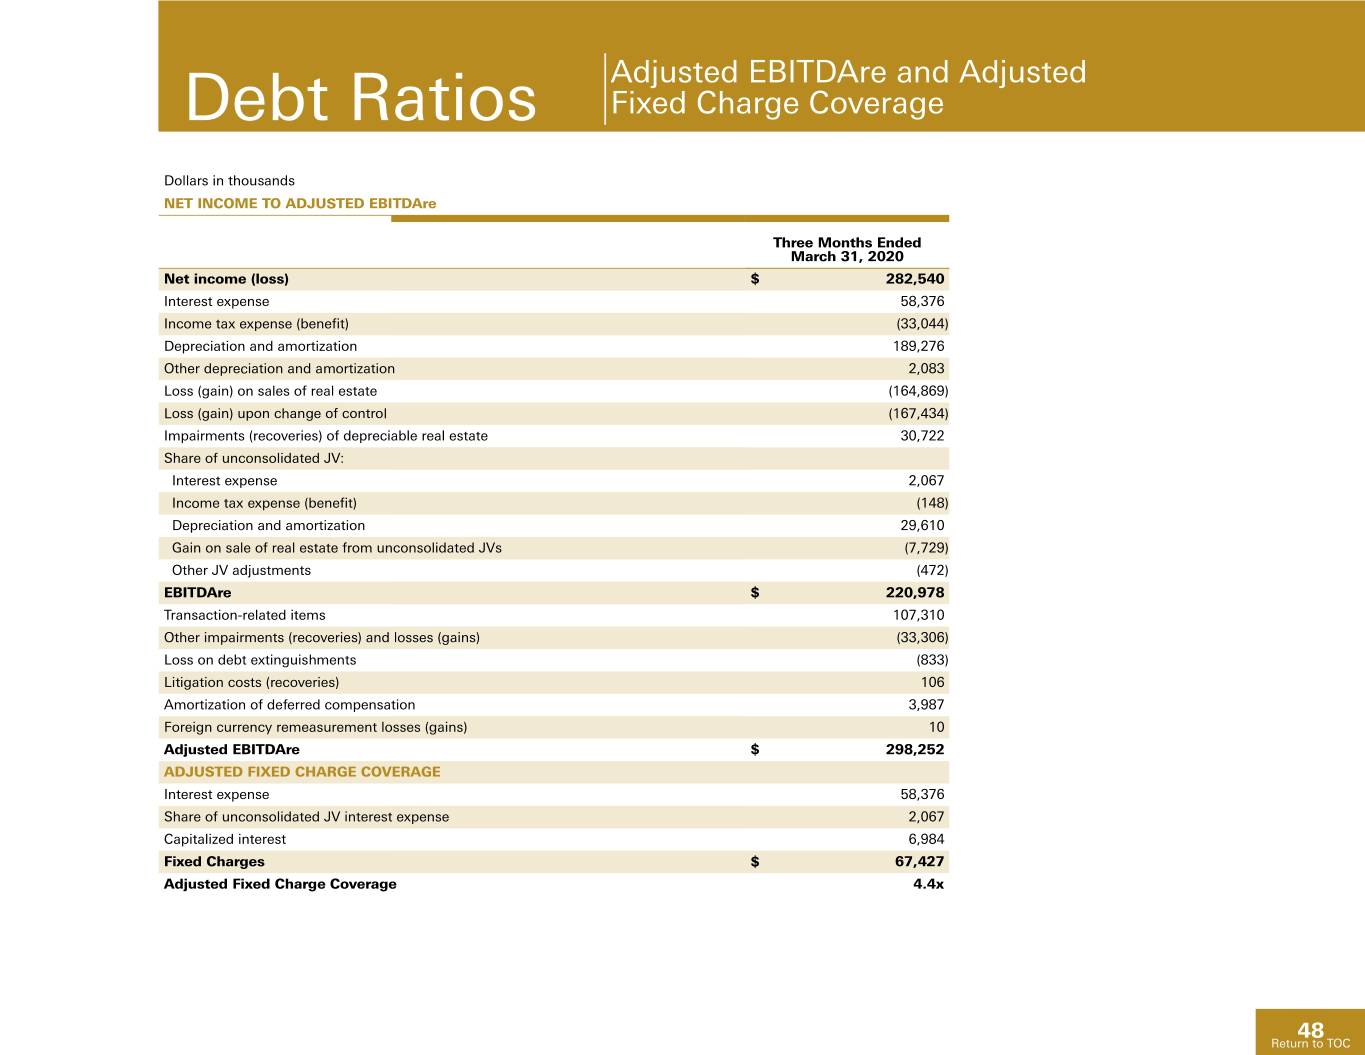
Adjusted EBITDAre and Adjusted Debt Ratios Fixed Charge Coverage Dollars in thousands NET INCOME TO ADJUSTED EBITDAre Three Months Ended March 31, 2020 Net income (loss) $ 282,540 Interest expense 58,376 Income tax expense (benefit) (33,044) Depreciation and amortization 189,276 Other depreciation and amortization 2,083 Loss (gain) on sales of real estate (164,869) Loss (gain) upon change of control (167,434) Impairments (recoveries) of depreciable real estate 30,722 Share of unconsolidated JV: Interest expense 2,067 Income tax expense (benefit) (148) Depreciation and amortization 29,610 Gain on sale of real estate from unconsolidated JVs (7,729) Other JV adjustments (472) EBITDAre $ 220,978 Transaction-related items 107,310 Other impairments (recoveries) and losses (gains) (33,306) Loss on debt extinguishments (833) Litigation costs (recoveries) 106 Amortization of deferred compensation 3,987 Foreign currency remeasurement losses (gains) 10 Adjusted EBITDAre $ 298,252 ADJUSTED FIXED CHARGE COVERAGE Interest expense 58,376 Share of unconsolidated JV interest expense 2,067 Capitalized interest 6,984 Fixed Charges $ 67,427 Adjusted Fixed Charge Coverage 4.4x 48 Return to TOC
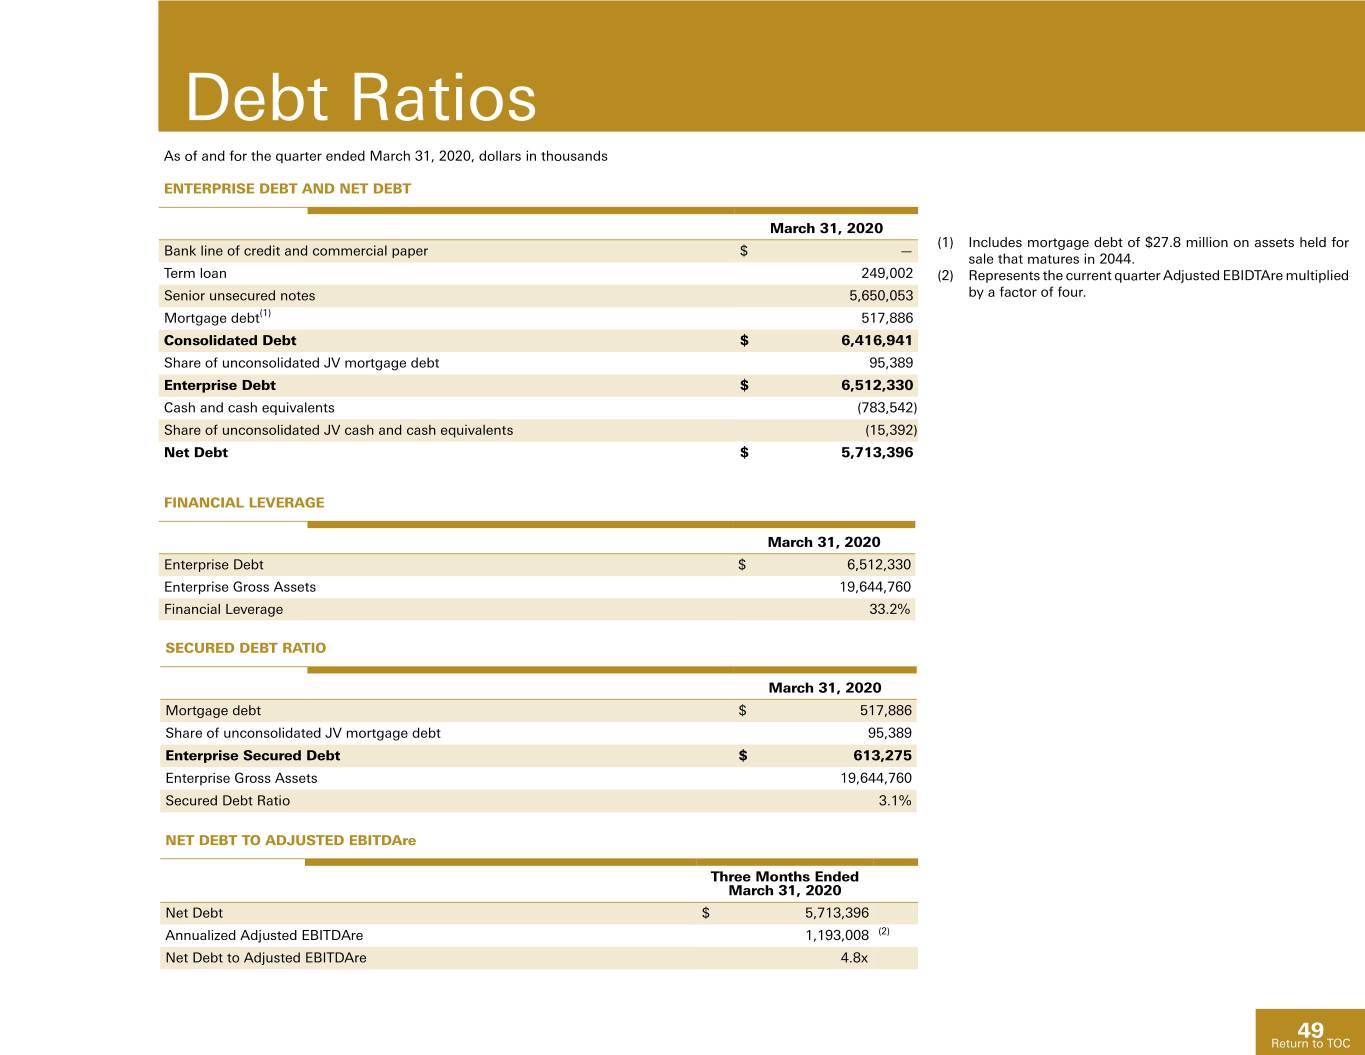
Debt Ratios As of and for the quarter ended March 31, 2020, dollars in thousands ENTERPRISE DEBT AND NET DEBT March 31, 2020 (1) Includes mortgage debt of $27.8 million on assets held for Bank line of credit and commercial paper $ — sale that matures in 2044. Term loan 249,002 (2) Represents the current quarter Adjusted EBIDTAre multiplied Senior unsecured notes 5,650,053 by a factor of four. Mortgage debt(1) 517,886 Consolidated Debt $ 6,416,941 Share of unconsolidated JV mortgage debt 95,389 Enterprise Debt $ 6,512,330 Cash and cash equivalents (783,542) Share of unconsolidated JV cash and cash equivalents (15,392) Net Debt $ 5,713,396 FINANCIAL LEVERAGE March 31, 2020 Enterprise Debt $ 6,512,330 Enterprise Gross Assets 19,644,760 Financial Leverage 33.2% SECURED DEBT RATIO March 31, 2020 Mortgage debt $ 517,886 Share of unconsolidated JV mortgage debt 95,389 Enterprise Secured Debt $ 613,275 Enterprise Gross Assets 19,644,760 Secured Debt Ratio 3.1% NET DEBT TO ADJUSTED EBITDAre Three Months Ended March 31, 2020 Net Debt $ 5,713,396 Annualized Adjusted EBITDAre 1,193,008 (2) Net Debt to Adjusted EBITDAre 4.8x 49 Return to TOC

COMPANY Information BOARD OF DIRECTORS BRIAN G. CARTWRIGHT DAVID B. HENRY Chairman of the Board, Healthpeak Properties, Inc. Former Vice Chairman and Chief Executive Officer, Former General Counsel, Kimco Realty Corporation U.S. Securities and Exchange Commission LYDIA H. KENNARD THOMAS M. HERZOG President and Chief Executive Officer, Chief Executive Officer, Healthpeak Properties, Inc. KDG Construction Consulting CHRISTINE N. GARVEY SARA GROOTWASSINK LEWIS Former Global Head of Corporate Founder and Chief Executive Officer, Real Estate Services, Deutsche Bank AG Lewis Corporate Advisors, LLC R. KENT GRIFFIN, JR. KATHERINE M. SANDSTROM Managing Director, PHICAS Investors Former Senior Managing Director, Former President, BioMed Realty Trust, Inc. Heitman, LLC EXECUTIVE MANAGEMENT THOMAS M. HERZOG PETER A. SCOTT Chief Executive Officer Executive Vice President Chief Financial Officer SCOTT M. BRINKER President SHAWN G. JOHNSTON Chief Investment Officer Executive Vice President Chief Accounting Officer THOMAS M. KLARITCH Executive Vice President JEFFREY H. MILLER Chief Development Officer Executive Vice President Chief Operating Officer Senior Housing TROY E. MCHENRY LISA A. ALONSO Executive Vice President Executive Vice President Chief Legal Officer Chief Human Resources Officer General Counsel Corporate Secretary 50 ReturnReturn to to TOC TOC
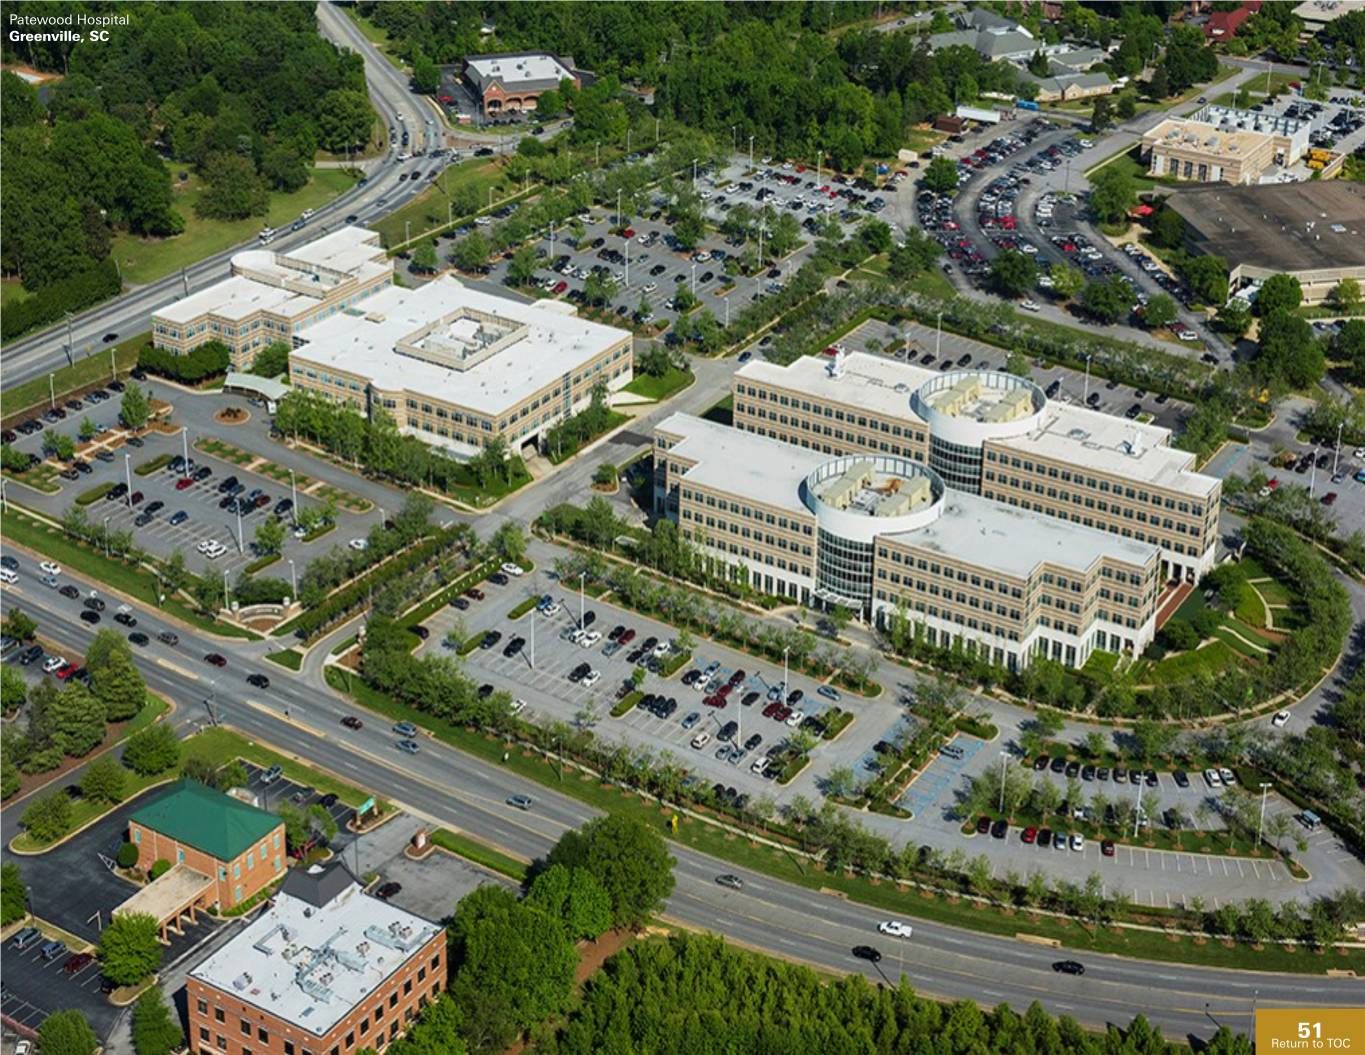
Patewood Hospital Greenville, SC 51 51 ReturnReturn toto TOCTOC
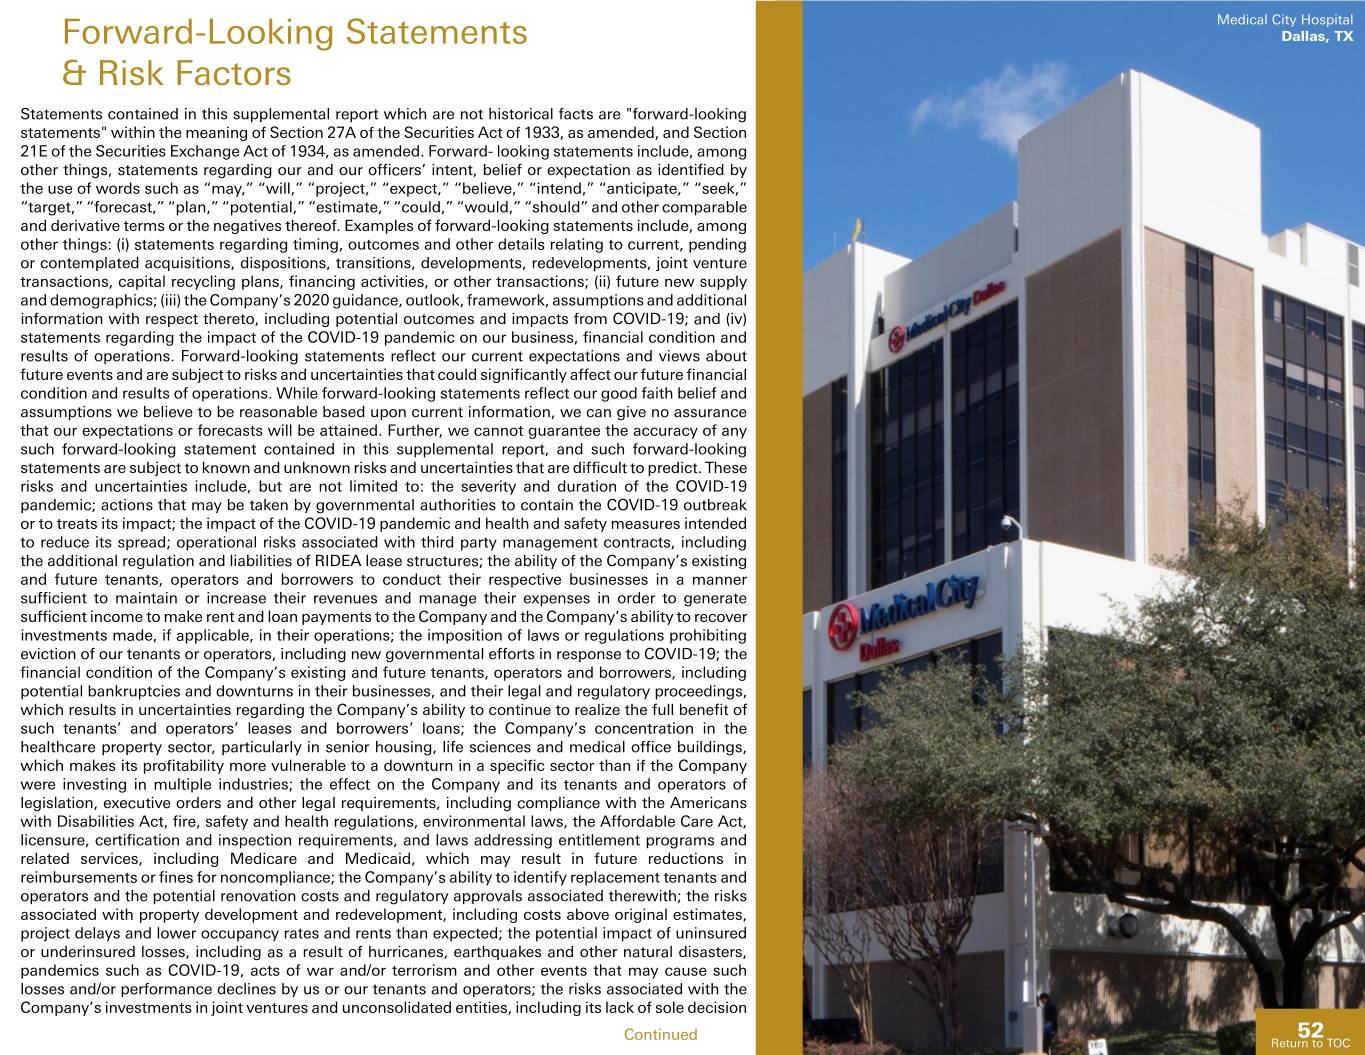
Medical City Hospital Forward-Looking Statements Dallas, TX & Risk Factors Statements contained in this supplemental report which are not historical facts are "forward-looking statements" within the meaning of Section 27A of the Securities Act of 1933, as amended, and Section 21E of the Securities Exchange Act of 1934, as amended. Forward- looking statements include, among other things, statements regarding our and our officers’ intent, belief or expectation as identified by the use of words such as “may,” “will,” “project,” “expect,” “believe,” “intend,” “anticipate,” “seek,” “target,” “forecast,” “plan,” “potential,” “estimate,” “could,” “would,” “should” and other comparable and derivative terms or the negatives thereof. Examples of forward-looking statements include, among other things: (i) statements regarding timing, outcomes and other details relating to current, pending or contemplated acquisitions, dispositions, transitions, developments, redevelopments, joint venture transactions, capital recycling plans, financing activities, or other transactions; (ii) future new supply and demographics; (iii) the Company’s 2020 guidance, outlook, framework, assumptions and additional information with respect thereto, including potential outcomes and impacts from COVID-19; and (iv) statements regarding the impact of the COVID-19 pandemic on our business, financial condition and results of operations. Forward-looking statements reflect our current expectations and views about future events and are subject to risks and uncertainties that could significantly affect our future financial condition and results of operations. While forward-looking statements reflect our good faith belief and assumptions we believe to be reasonable based upon current information, we can give no assurance that our expectations or forecasts will be attained. Further, we cannot guarantee the accuracy of any such forward-looking statement contained in this supplemental report, and such forward-looking statements are subject to known and unknown risks and uncertainties that are difficult to predict. These risks and uncertainties include, but are not limited to: the severity and duration of the COVID-19 pandemic; actions that may be taken by governmental authorities to contain the COVID-19 outbreak or to treats its impact; the impact of the COVID-19 pandemic and health and safety measures intended to reduce its spread; operational risks associated with third party management contracts, including the additional regulation and liabilities of RIDEA lease structures; the ability of the Company’s existing and future tenants, operators and borrowers to conduct their respective businesses in a manner sufficient to maintain or increase their revenues and manage their expenses in order to generate sufficient income to make rent and loan payments to the Company and the Company’s ability to recover investments made, if applicable, in their operations; the imposition of laws or regulations prohibiting eviction of our tenants or operators, including new governmental efforts in response to COVID-19; the financial condition of the Company’s existing and future tenants, operators and borrowers, including potential bankruptcies and downturns in their businesses, and their legal and regulatory proceedings, which results in uncertainties regarding the Company’s ability to continue to realize the full benefit of such tenants’ and operators’ leases and borrowers’ loans; the Company’s concentration in the healthcare property sector, particularly in senior housing, life sciences and medical office buildings, which makes its profitability more vulnerable to a downturn in a specific sector than if the Company were investing in multiple industries; the effect on the Company and its tenants and operators of legislation, executive orders and other legal requirements, including compliance with the Americans with Disabilities Act, fire, safety and health regulations, environmental laws, the Affordable Care Act, licensure, certification and inspection requirements, and laws addressing entitlement programs and related services, including Medicare and Medicaid, which may result in future reductions in reimbursements or fines for noncompliance; the Company’s ability to identify replacement tenants and operators and the potential renovation costs and regulatory approvals associated therewith; the risks associated with property development and redevelopment, including costs above original estimates, project delays and lower occupancy rates and rents than expected; the potential impact of uninsured or underinsured losses, including as a result of hurricanes, earthquakes and other natural disasters, pandemics such as COVID-19, acts of war and/or terrorism and other events that may cause such losses and/or performance declines by us or our tenants and operators; the risks associated with the Company’s investments in joint ventures and unconsolidated entities, including its lack of sole decision Continued 52 ReturnReturn toto TOCTOC
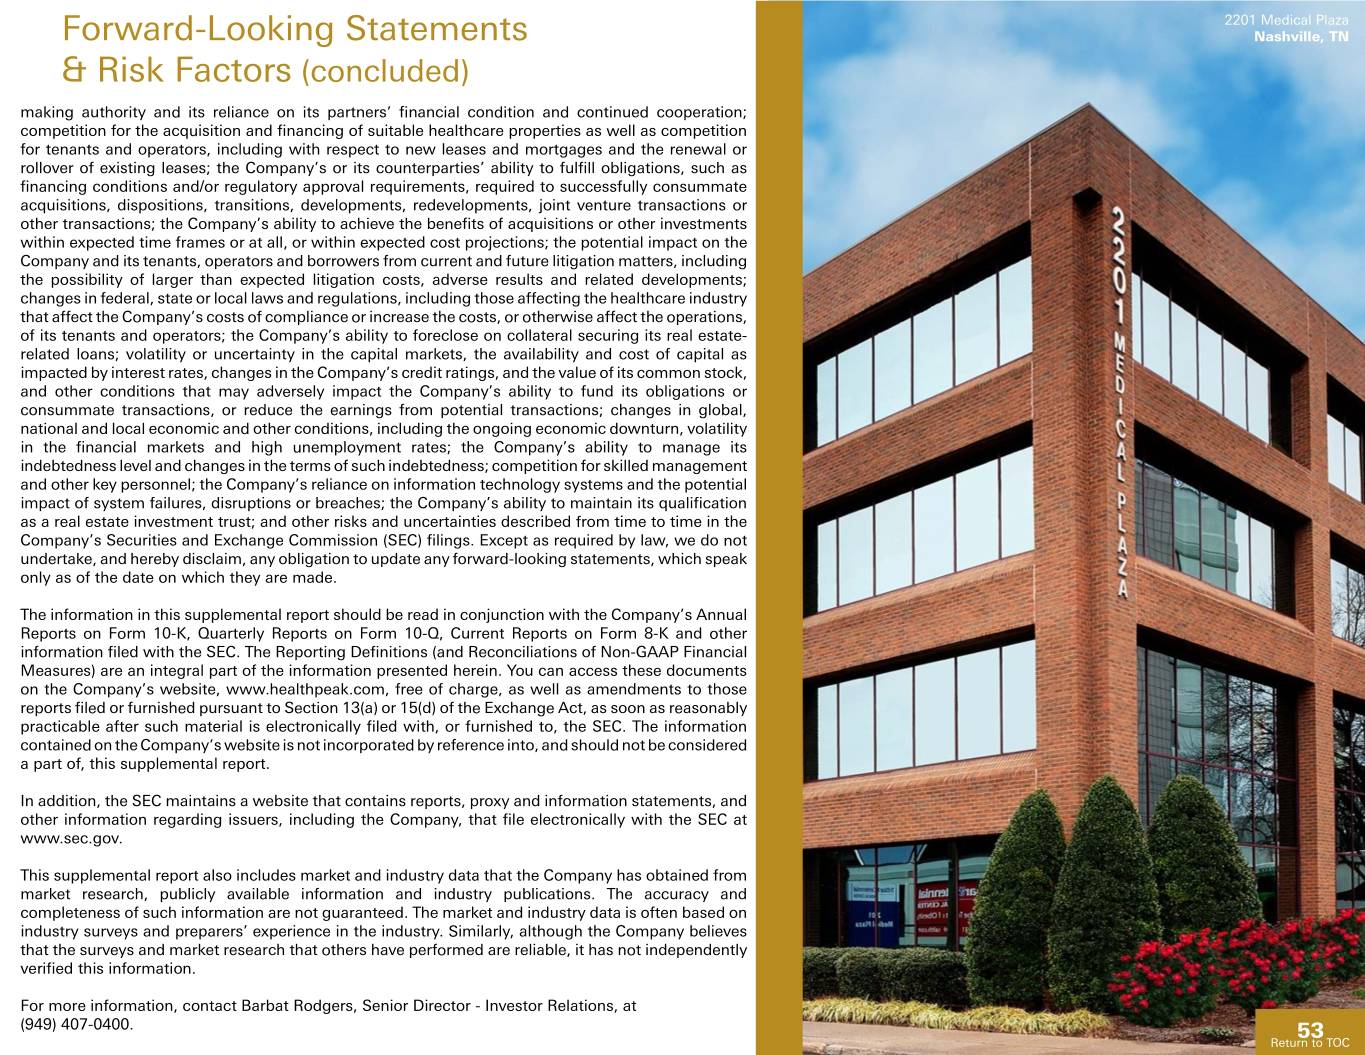
2201 Medical Plaza Forward-Looking Statements Nashville, TN & Risk Factors (concluded) making authority and its reliance on its partners’ financial condition and continued cooperation; competition for the acquisition and financing of suitable healthcare properties as well as competition for tenants and operators, including with respect to new leases and mortgages and the renewal or rollover of existing leases; the Company’s or its counterparties’ ability to fulfill obligations, such as financing conditions and/or regulatory approval requirements, required to successfully consummate acquisitions, dispositions, transitions, developments, redevelopments, joint venture transactions or other transactions; the Company’s ability to achieve the benefits of acquisitions or other investments within expected time frames or at all, or within expected cost projections; the potential impact on the Company and its tenants, operators and borrowers from current and future litigation matters, including the possibility of larger than expected litigation costs, adverse results and related developments; changes in federal, state or local laws and regulations, including those affecting the healthcare industry that affect the Company’s costs of compliance or increase the costs, or otherwise affect the operations, of its tenants and operators; the Company’s ability to foreclose on collateral securing its real estate- related loans; volatility or uncertainty in the capital markets, the availability and cost of capital as impacted by interest rates, changes in the Company’s credit ratings, and the value of its common stock, and other conditions that may adversely impact the Company’s ability to fund its obligations or consummate transactions, or reduce the earnings from potential transactions; changes in global, national and local economic and other conditions, including the ongoing economic downturn, volatility in the financial markets and high unemployment rates; the Company’s ability to manage its indebtedness level and changes in the terms of such indebtedness; competition for skilled management and other key personnel; the Company’s reliance on information technology systems and the potential impact of system failures, disruptions or breaches; the Company’s ability to maintain its qualification as a real estate investment trust; and other risks and uncertainties described from time to time in the Company’s Securities and Exchange Commission (SEC) filings. Except as required by law, we do not undertake, and hereby disclaim, any obligation to update any forward-looking statements, which speak only as of the date on which they are made. The information in this supplemental report should be read in conjunction with the Company’s Annual Reports on Form 10-K, Quarterly Reports on Form 10-Q, Current Reports on Form 8-K and other information filed with the SEC. The Reporting Definitions (and Reconciliations of Non-GAAP Financial Measures) are an integral part of the information presented herein. You can access these documents on the Company’s website, www.healthpeak.com, free of charge, as well as amendments to those reports filed or furnished pursuant to Section 13(a) or 15(d) of the Exchange Act, as soon as reasonably practicable after such material is electronically filed with, or furnished to, the SEC. The information contained on the Company’s website is not incorporated by reference into, and should not be considered a part of, this supplemental report. In addition, the SEC maintains a website that contains reports, proxy and information statements, and other information regarding issuers, including the Company, that file electronically with the SEC at www.sec.gov. This supplemental report also includes market and industry data that the Company has obtained from market research, publicly available information and industry publications. The accuracy and completeness of such information are not guaranteed. The market and industry data is often based on industry surveys and preparers’ experience in the industry. Similarly, although the Company believes that the surveys and market research that others have performed are reliable, it has not independently verified this information. For more information, contact Barbat Rodgers, Senior Director - Investor Relations, at (949) 407-0400. 53 ReturnReturn toto TOCTOC
_________________________________________________________ Corporate HQ, Irvine, CA 1920 Main Street, Suite 1200 Irvine, CA 92614 (949) 407 - 0700 ________________________________________________________ San Francisco, CA 950 Tower Lane, Suite 1650 Foster City, CA 94404 _______________________________________________________ Nashville, TN 3000 Meridian Boulevard, Suite 200 Franklin, TN 37067 healthpeak.com 54 ReturnReturn to to TOC TOC