Healthpeak Properties Reports First Quarter 2025 Results
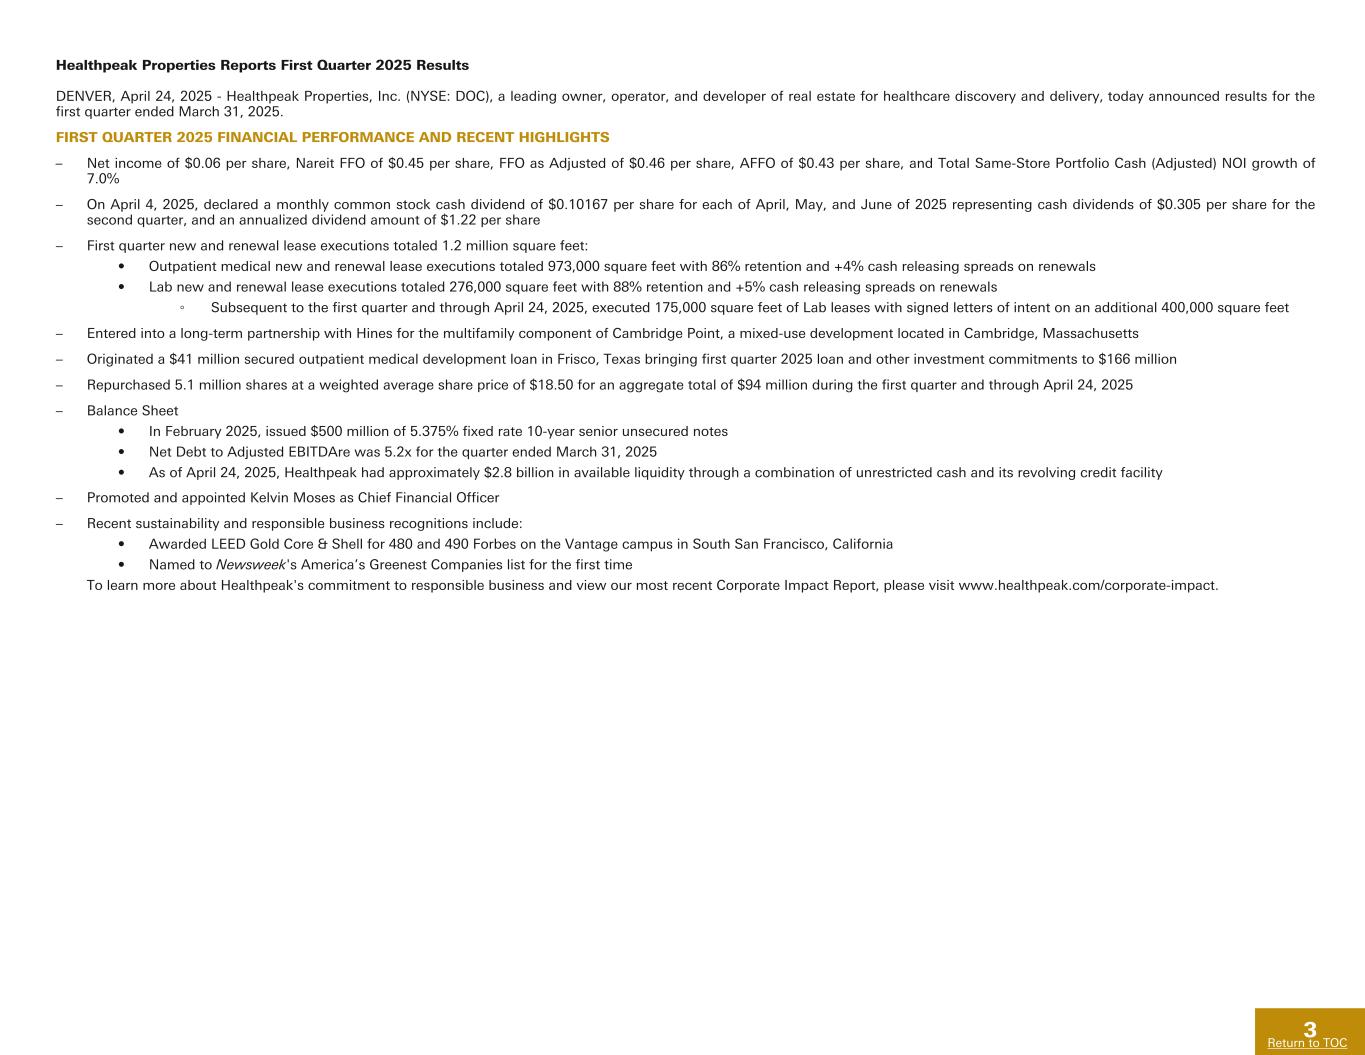
DENVER, April 24, 2025 - Healthpeak Properties, Inc. (NYSE: DOC), a leading owner, operator, and developer of real estate for healthcare discovery and delivery, today announced results for the first quarter ended March 31, 2025.
FIRST QUARTER 2025 FINANCIAL PERFORMANCE AND RECENT HIGHLIGHTS
–Net income of $0.06 per share, Nareit FFO of $0.45 per share, FFO as Adjusted of $0.46 per share, AFFO of $0.43 per share, and Total Same-Store Portfolio Cash (Adjusted) NOI growth of 7.0%
–On April 4, 2025, declared a monthly common stock cash dividend of $0.10167 per share for each of April, May, and June of 2025 representing cash dividends of $0.305 per share for the second quarter, and an annualized dividend amount of $1.22 per share
–First quarter new and renewal lease executions totaled 1.2 million square feet:
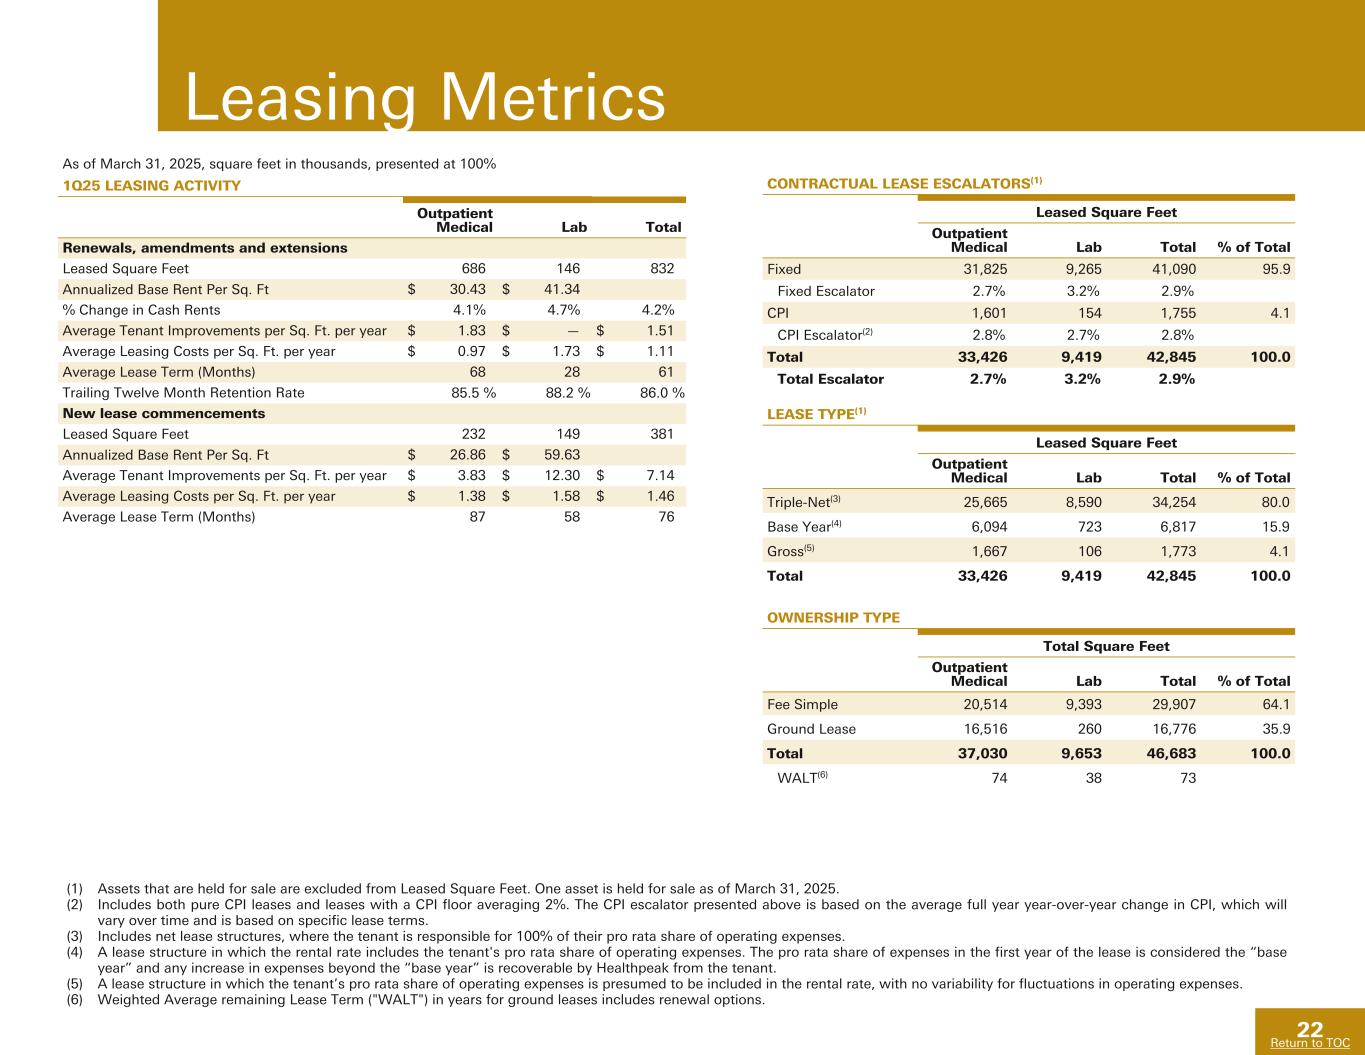
•Outpatient medical new and renewal lease executions totaled 973,000 square feet with 86% retention and +4% cash releasing spreads on renewals
•Lab new and renewal lease executions totaled 276,000 square feet with 88% retention and +5% cash releasing spreads on renewals
◦Subsequent to the first quarter and through April 24, 2025, executed 175,000 square feet of Lab leases with signed letters of intent on an additional 400,000 square feet
–Entered into a long-term partnership with Hines for the multifamily component of Cambridge Point, a mixed-use development located in Cambridge, Massachusetts
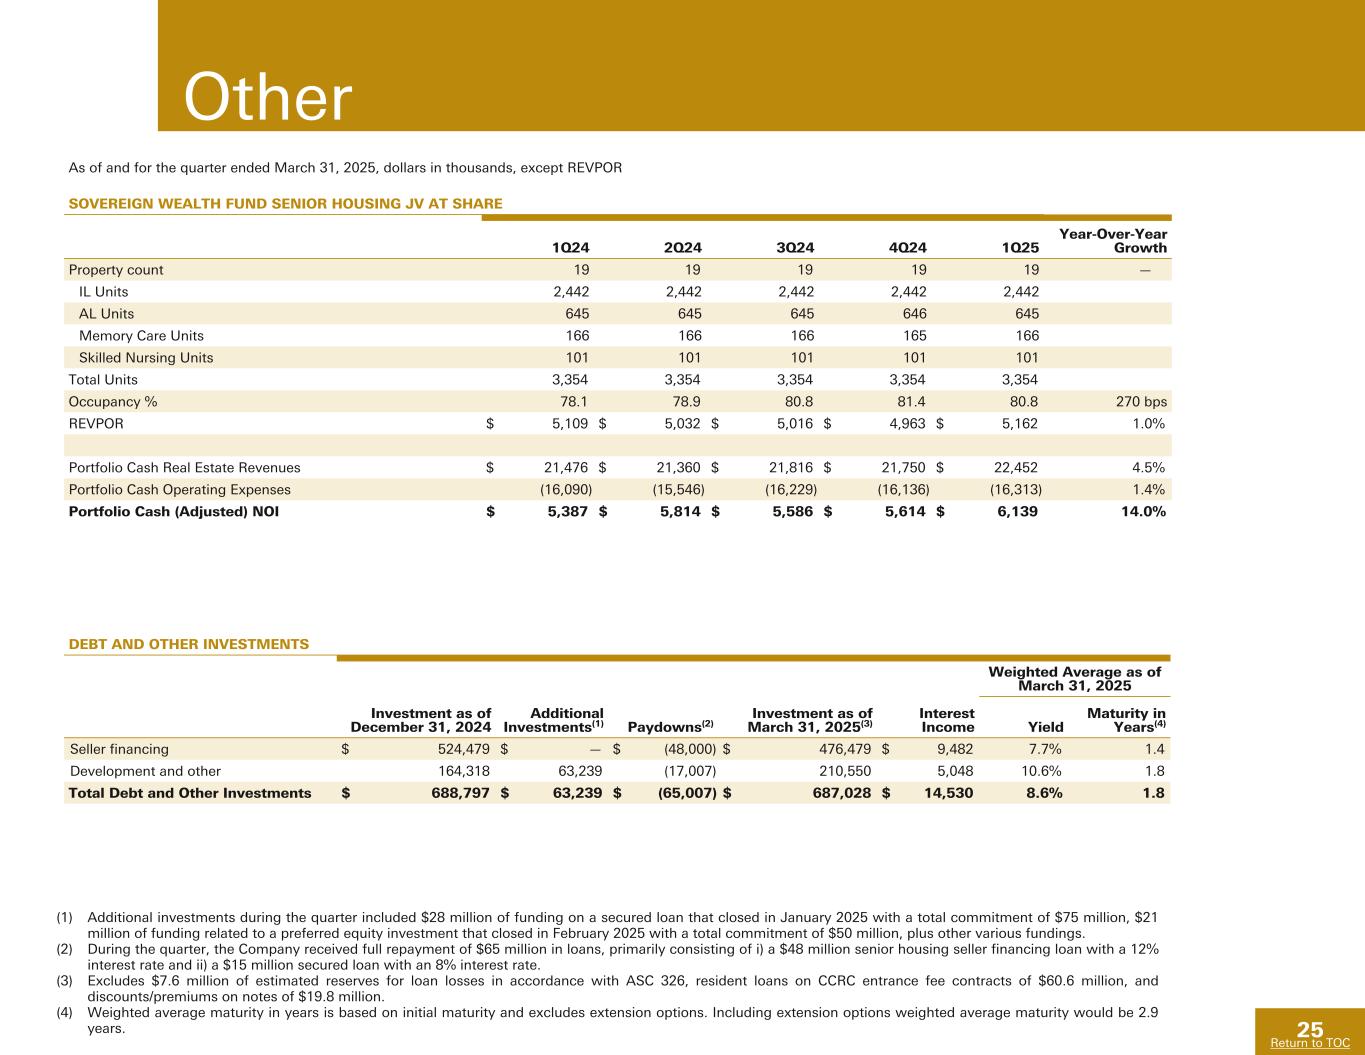
–Originated a $41 million secured outpatient medical development loan in Frisco, Texas bringing first quarter 2025 loan and other investment commitments to $166 million
–Repurchased 5.1 million shares at a weighted average share price of $18.50 for an aggregate total of $94 million during the first quarter and through April 24, 2025
–Balance Sheet
•In February 2025, issued $500 million of 5.375% fixed rate 10-year senior unsecured notes
•Net Debt to Adjusted EBITDAre was 5.2x for the quarter ended March 31, 2025
•As of April 24, 2025, Healthpeak had approximately $2.8 billion in available liquidity through a combination of unrestricted cash and its revolving credit facility
–Promoted and appointed Kelvin Moses as Chief Financial Officer
–Recent sustainability and responsible business recognitions include:
•Awarded LEED Gold Core & Shell for 480 and 490 Forbes on the Vantage campus in South San Francisco, California
•Named to Newsweek's America’s Greenest Companies list for the first time
To learn more about Healthpeak's commitment to responsible business and view our most recent Corporate Impact Report, please visit www.healthpeak.com/corporate-impact.
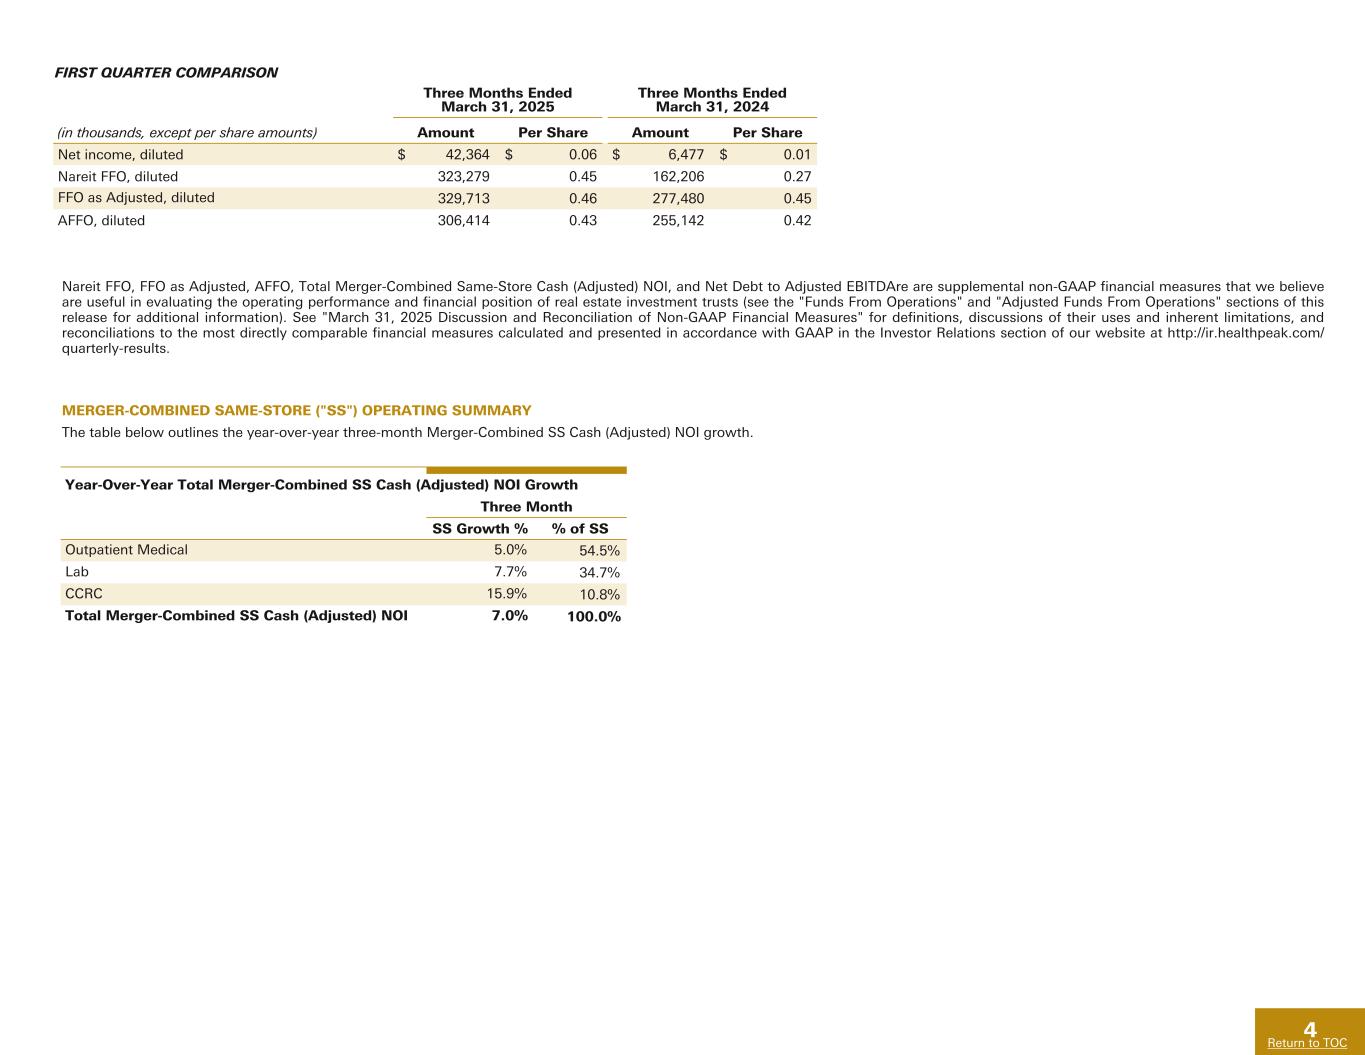
FIRST QUARTER COMPARISON
| | | | | | | | | | | | | | | | | | | | | | | | | | | | | | | | | | |
| | Three Months Ended
March 31, 2025 | | Three Months Ended
March 31, 2024 | | | | | | | | | | | |
| (in thousands, except per share amounts) | Amount | | Per Share | | Amount | | Per Share | | | | | | | | | | | |
| Net income, diluted | $ | 42,364 | | | $ | 0.06 | | | $ | 6,477 | | | $ | 0.01 | | | | | | | | | | | | |
| Nareit FFO, diluted | 323,279 | | | 0.45 | | | 162,206 | | | 0.27 | | | | | | | | | | | | |
| FFO as Adjusted, diluted | 329,713 | | | 0.46 | | | 277,480 | | | 0.45 | | | | | | | | | | | | |
| AFFO, diluted | 306,414 | | | 0.43 | | | 255,142 | | | 0.42 | | | | | | | | | | | | |
Nareit FFO, FFO as Adjusted, AFFO, Total Merger-Combined Same-Store Cash (Adjusted) NOI, and Net Debt to Adjusted EBITDAre are supplemental non-GAAP financial measures that we believe are useful in evaluating the
operating performance and financial position of real estate investment trusts (see the "Funds From Operations" and "Adjusted Funds From Operations" sections of this release for additional information). See "March 31, 2025 Discussion and Reconciliation of Non-GAAP Financial Measures" for definitions, discussions of their uses and inherent limitations, and reconciliations to the most directly comparable financial measures calculated and presented in accordance with GAAP in the Investor Relations section of our website at http://ir.healthpeak.com/quarterly-results.
MERGER-COMBINED SAME-STORE ("SS") OPERATING SUMMARY
The table below outlines the year-over-year three-month Merger-Combined SS Cash (Adjusted) NOI growth.
| | | | | | | | |
| Year-Over-Year Total Merger-Combined SS Cash (Adjusted) NOI Growth |
| Three Month |
| SS Growth % | % of SS |
| Outpatient Medical | 5.0 | % | 54.5 | % |
| Lab | 7.7 | % | 34.7 | % |
| CCRC | 15.9 | % | 10.8 | % |
| Total Merger-Combined SS Cash (Adjusted) NOI | 7.0 | % | 100.0 | % |
DIVIDEND
On April 4, 2025, Healthpeak's Board of Directors declared a monthly common stock cash dividend of $0.10167 per share for each of April, May, and June of 2025 representing cash dividends of $0.305 per share for the second quarter, and an annualized dividend amount of $1.22 per share. The dividend is payable on the payment dates set forth in the table below to stockholders of record as of the close of business on the corresponding record date.
| | | | | | | | |
| Record Date | Payment Date | Amount |
| April 18, 2025 | April 30, 2025 | $0.10167 per common share |
| May 19, 2025 | May 30, 2025 | $0.10167 per common share |
| June 16, 2025 | June 27, 2025 | $0.10167 per common share |
CAMBRIDGE POINT MULTIFAMILY RESIDENTIAL DEVELOPMENT PARTNERSHIP
In April 2025, Healthpeak entered into a long-term partnership with global real estate investment manager Hines to develop the residential components of Healthpeak’s Cambridge Point master-planned district in the Alewife neighborhood of Cambridge, Massachusetts. Hines will lead the residential development in coordination with Healthpeak as master developer. Hines, with its partners, will capitalize the residential developments and intends to commence construction on the first residential building within the first 12 months following receipt of entitlements, which is anticipated in the second half of 2026.
Healthpeak’s Cambridge Point master plan encompasses approximately 40 acres and can support development potential of up to five million square feet, including multifamily residential units, research and lab space, and community-oriented ground-floor neighborhood retail uses.
A copy of the corresponding press release with additional details is available on the Investor Relations section of our website at https://ir.healthpeak.com.
INVESTMENT ACTIVITY
In March 2025, Healthpeak originated a secured loan for the development of a 83,000 square foot outpatient medical building in Frisco, Texas. The development is located within the Frisco Station mixed-use district, home to the Dallas Cowboys' World Headquarters and adjacent to the Baylor Scott & White Regional Medical Center at Frisco. Total funding available to the borrower under the three-year loan is approximately $41 million with an 8.3% interest rate. Healthpeak retains certain purchase rights on the development project.
As previously disclosed, in January 2025, Healthpeak originated a secured loan to provide the borrower funding for the acquisition and redevelopment of a lab building in the Torrey Pines submarket of San Diego, California. Total funding available under the four-year loan is $75 million with an 8% interest rate.
As previously disclosed, in February 2025, Healthpeak originated a preferred equity investment in a two-building, 244,000 square foot Class A lab campus that is currently under construction in the Sorrento Mesa submarket of San Diego, California. Total commitment for the preferred investment is $50 million with a 12% preferred return over the four-year term.
SHARE REPURCHASE ACTIVITY
During the first quarter of 2025, Healthpeak repurchased 1.1 million shares at a weighted average share price of $19.45 for approximately $22 million under its $500 million share repurchase program.
From the beginning of the second quarter through and including April 24, 2025, Healthpeak repurchased 3.9 million shares at a weighted average share price of $18.22 for an aggregate total of $72 million.
As of April 24, 2025, approximately $406 million remained available for share repurchases under the program.
BALANCE SHEET
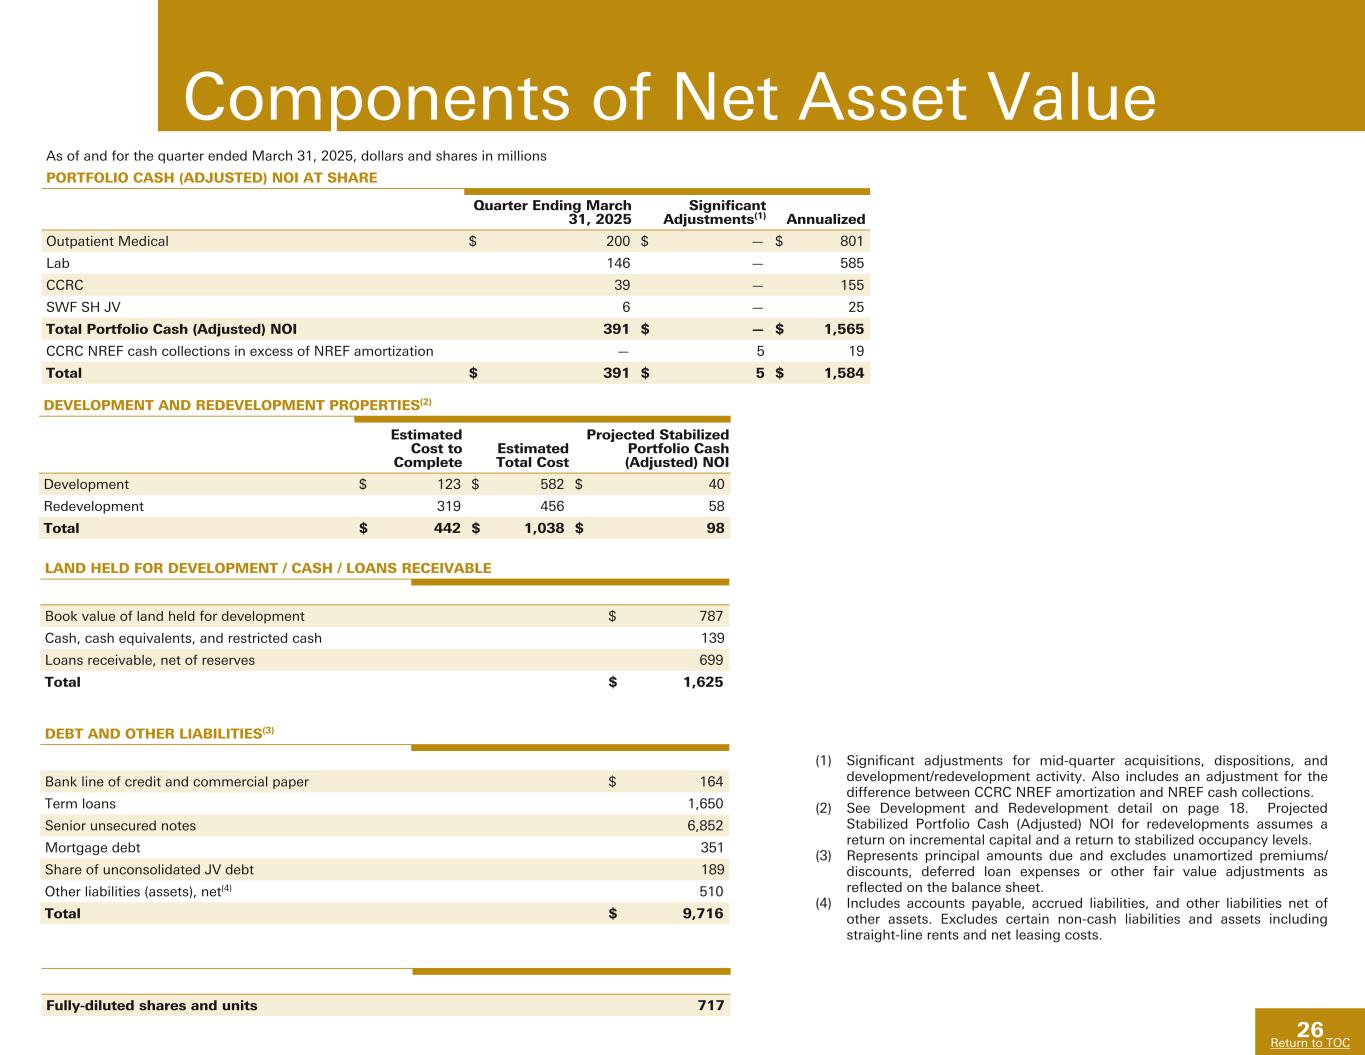
In February 2025, Healthpeak completed a public offering of $500 million of 5.375% fixed-rate senior unsecured notes due 2035. The notes priced at an approximate 102 basis point spread over the benchmark 10-year U.S. Treasury, representing the tightest 10-year spread in Healthpeak’s history. Net proceeds from the offering were used to repay a portion of Healthpeak’s outstanding commercial paper and for general corporate purposes.
As of April 24, 2025, Healthpeak had approximately $2.8 billion in available liquidity through a combination of unrestricted cash and its revolving credit facility.
2025 GUIDANCE
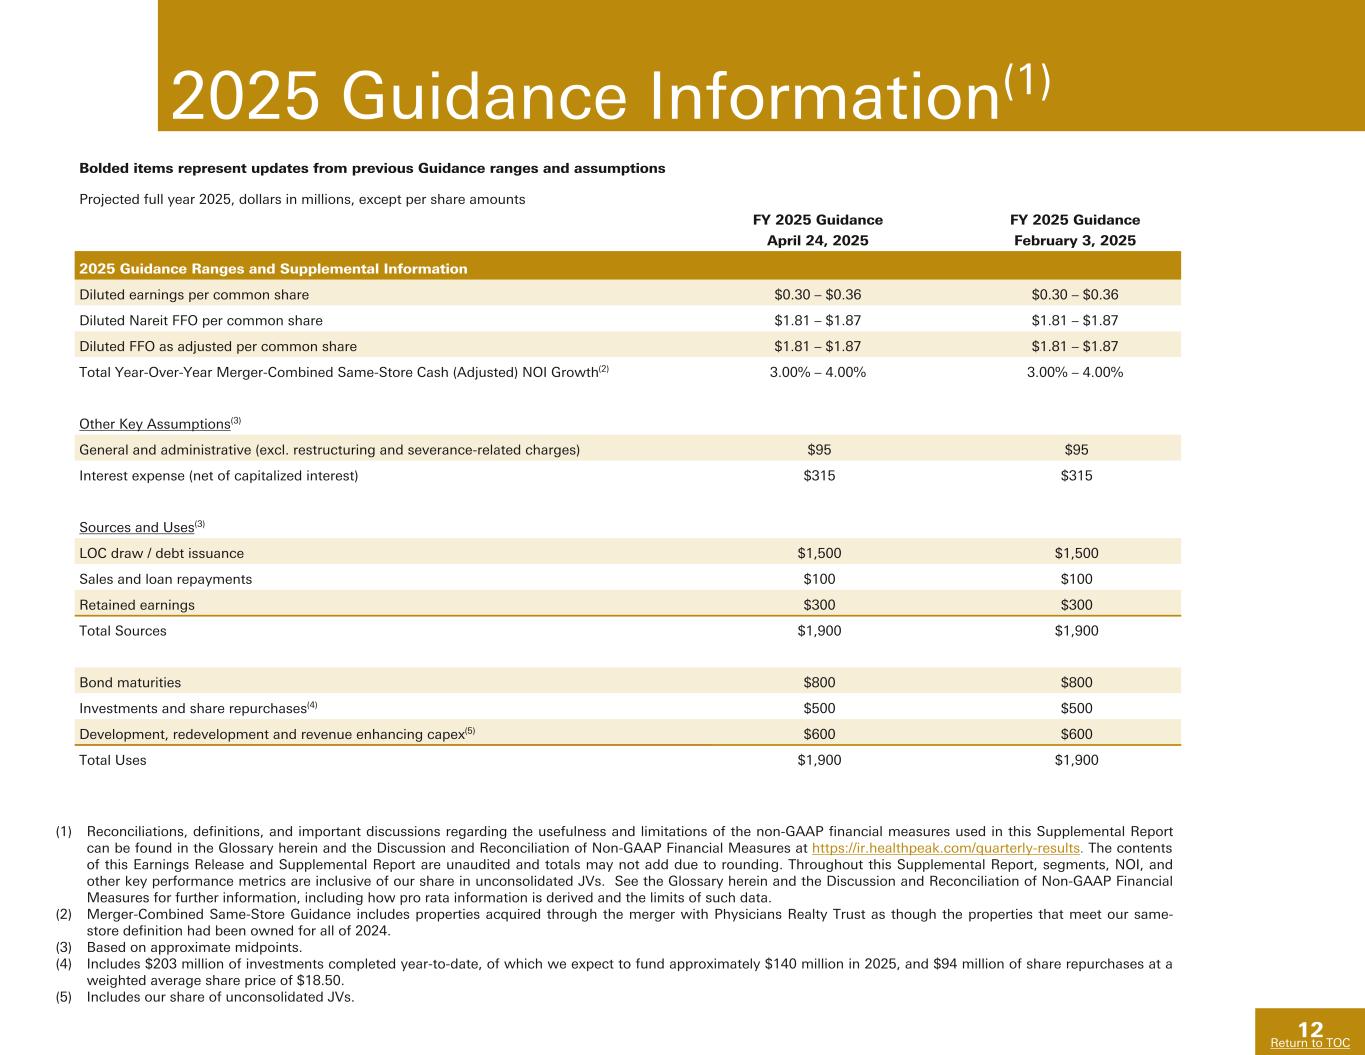
We are reaffirming the following guidance ranges for full year 2025:
•Diluted earnings per common share of $0.30 – $0.36
•Diluted Nareit FFO per share of $1.81 – $1.87
•Diluted FFO as Adjusted per share of $1.81 – $1.87
•Total Merger-Combined Same-Store Cash (Adjusted) NOI growth from 3.0% – 4.0%
These estimates are based on our current view of existing market conditions, transaction timing, and other assumptions for the year ending December 31, 2025. For additional details and assumptions, please see page 12 in our corresponding Supplemental Report and the Discussion and Reconciliation of Non-GAAP Financial Measures, both of which are available in the Investor Relations section of our website at http://ir.healthpeak.com.
CONFERENCE CALL INFORMATION
Healthpeak has scheduled a conference call and webcast for Friday, April 25, 2025, at 8:00 a.m. Mountain Time.
The conference call can be accessed in the following ways:
•Healthpeak’s website: https://ir.healthpeak.com/news-events
•Webcast: https://events.q4inc.com/attendee/794734425. Joining via webcast is recommended for those who will not be asking questions.
•Telephone: The participant dial-in number is (800) 715-9871
An archive of the webcast will be available on Healthpeak’s website through April 24, 2026, and a telephonic replay can be accessed through May 2, 2025, by dialing (800) 770-2030 and entering conference ID number 95156.
ABOUT HEALTHPEAK
Healthpeak Properties, Inc. is a fully integrated real estate investment trust (REIT) and S&P 500 company. Healthpeak owns, operates, and develops high-quality real estate focused on healthcare discovery and delivery.
FORWARD-LOOKING STATEMENTS
Statements contained in this release that are not historical facts are "forward-looking statements" within the meaning of Section 27A of the Securities Act of 1933, as amended, and Section 21E of the Securities Exchange Act of 1934, as amended. Forward-looking statements include, among other things, statements regarding our and our officers' intent, belief or expectation as identified by the use of words such as "may," "will," "project," "expect," "believe," "intend," "anticipate," "seek," "target," "forecast," "plan," "potential," "estimate," "could," "would," "should" and other comparable and derivative terms or the negatives thereof. Examples of forward-looking statements include, among other things: (i) statements regarding timing, outcomes and other details relating to current, pending or contemplated acquisitions, dispositions, developments, redevelopments, joint venture transactions, leasing activity and commitments, financing activities, or other transactions discussed in this release; (ii) the payment of a quarterly cash dividend; and (iii) the information presented under the heading "2025 Guidance Information." Pending acquisitions, dispositions, joint venture transactions, leasing activity, and financing activity, including those subject to binding agreements, remain subject to closing conditions and may not be completed within the anticipated timeframes or at all. Forward-looking statements reflect our current expectations and views about future events and are subject to risks and uncertainties that could significantly affect our future financial condition and results of operations. While forward-looking statements reflect our good faith belief and assumptions we believe to be reasonable based upon current information, we can give no assurance that our expectations or forecasts will be attained. Further, we cannot guarantee the accuracy of any such forward-looking statement contained in this release, and such forward-looking statements are subject to known and unknown risks and uncertainties that are difficult to predict. These risks and uncertainties include, but are not limited to: macroeconomic trends that may increase construction, labor and other operating costs; changes within the life science industry; significant regulation, funding requirements, and uncertainty faced by our lab tenants; factors adversely affecting our tenants’, operators’, or borrowers’ ability to meet their financial and other contractual obligations to us; the insolvency or bankruptcy of one or more of our major tenants, operators, or borrowers; our concentration of real estate investments in the healthcare property sector, which makes us more vulnerable to a downturn in that specific sector than if we invested across multiple sectors; the illiquidity of real estate investments; our ability to identify and secure new or replacement tenants and operators; our property development, redevelopment, and tenant improvement risks, which can render a project less profitable or unprofitable and delay or prevent its undertaking or completion; the ability of the hospitals on whose campuses our outpatient medical buildings are located and their affiliated healthcare systems to remain competitive or financially viable; our ability to develop, maintain, or expand hospital and health system client relationships; operational risks associated with our senior housing properties managed by third parties, including our properties operated through structures permitted by the Housing and Economic Recovery Act of 2008, which includes most of the provisions previously proposed in the REIT Investment Diversification and Empowerment Act of 2007 (commonly referred to as “RIDEA”); economic conditions, natural disasters, weather, and other conditions that negatively affect geographic areas where we have concentrated investments; uninsured or underinsured losses, which could result in a significant loss of capital invested in a property, lower than expected future revenues, and unanticipated expenses; our use of joint ventures may limit our returns on and our flexibility with jointly owned investments; our use of rent escalators or contingent rent provisions in our leases; competition for suitable healthcare properties to grow our investment portfolio; our ability to exercise rights on collateral securing our real estate-related loans; any requirement that we recognize reserves, allowances, credit losses, or impairment charges; investment of substantial resources and time in transactions that are not consummated; our ability to successfully integrate or operate acquisitions or internalize property management; the potential impact of unfavorable resolution of litigation or disputes and resulting rising liability and insurance costs; environmental compliance costs and liabilities associated with our real estate investments; our ability to satisfy environmental, social and governance and sustainability commitments and requirements, as well as stakeholder expectations; epidemics, pandemics, or other infectious diseases, including the coronavirus disease (Covid), and health and safety measures intended to reduce their spread; human capital risks, including the loss or limited availability of our key personnel; our reliance on information technology and any material failure, inadequacy, interruption, or security
failure of that technology; the use of, or inability to use, artificial intelligence by us, our tenants, our vendors, and our investors; volatility, disruption, or uncertainty in the financial markets; increased borrowing costs, which could impact our ability to refinance existing debt, sell properties, and conduct investment activities; cash available for distribution to stockholders and our ability to make dividend distributions at expected levels; the availability of external capital on acceptable terms or at all; an increase in our level of indebtedness; covenants in our debt instruments, which may limit our operational flexibility, and breaches of these covenants; volatility in the market price and trading volume of our common stock; adverse changes in our credit ratings; the failure of our tenants, operators, and borrowers to comply with federal, state, and local laws and regulations, including resident health and safety requirements, as well as licensure, certification, and inspection requirements; required regulatory approvals to transfer our senior housing properties; compliance with the Americans with Disabilities Act and fire, safety, and other regulations; laws or regulations prohibiting eviction of our tenants; the requirements of, or changes to, governmental reimbursement programs such as Medicare or Medicaid; legislation to address federal government operations and administrative decisions affecting the Centers for Medicare and Medicaid Services; our participation in the Coronavirus, Aid, Relief and Economic Security Act Provider Relief Fund and other Covid-related stimulus and relief programs; changes in federal, state, or local laws or regulations that may limit our opportunities to participate in the ownership of, or investment in, healthcare real estate; our ability to successfully integrate our operations with Physicians Realty Trust and realize the anticipated synergies of our merger with Physicians Realty Trust and benefits of property management internalization; our ability to maintain our qualification as a real estate investment trust (“REIT”); our taxable REIT subsidiaries being subject to corporate level tax; tax imposed on any net income from “prohibited transactions”; changes to U.S. federal income tax laws, and potential deferred and contingent tax liabilities from corporate acquisitions; calculating non-REIT tax earnings and profits distributions; tax protection agreements that may limit our ability to dispose of certain properties and may require us to maintain certain debt levels; ownership limits in our charter that restrict ownership in our stock; provisions of Maryland law and our charter that could prevent a transaction that may otherwise be in the interest of our stockholders; conflicts of interest between the interests of our stockholders and the interests of holders of Healthpeak OP, LLC (“Healthpeak OP”) common units; provisions in the operating agreement of Healthpeak OP and other agreements that may delay or prevent unsolicited acquisitions and other transactions; our status as a holding company of Healthpeak OP; and other risks and uncertainties described from time to time in our Securities and Exchange Commission filings.
Moreover, other risks and uncertainties of which we are not currently aware may also affect our forward-looking statements, and may cause actual results and the timing of events to differ materially from those anticipated. The forward-looking statements made in this communication are made only as of the date hereof or as of the dates indicated in the forward-looking statements, even if they are subsequently made available by us on our website or otherwise. We do not undertake any obligation to update or supplement any forward-looking statements to reflect actual results, new information, future events, changes in its expectations or other circumstances that exist after the date as of which the forward-looking statements were made.
CONTACT
Andrew Johns, CFA
Senior Vice President – Finance and Investor Relations
720-428-5400
Healthpeak Properties, Inc.
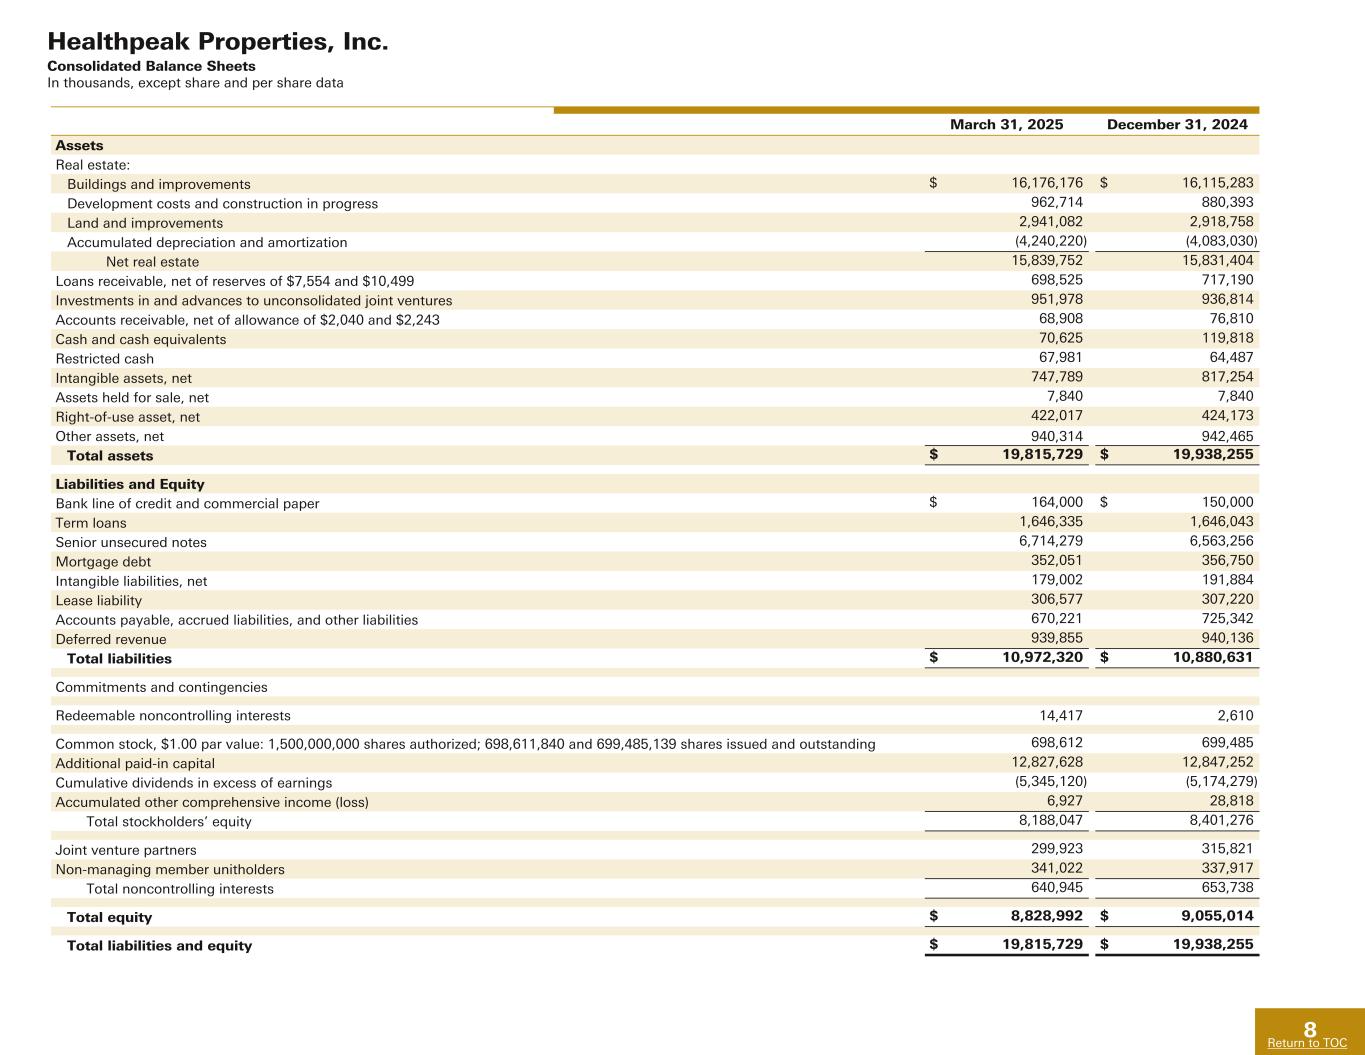
Consolidated Balance Sheets
In thousands, except share and per share data
| | | | | | | | | | | |
| March 31,
2025 | | December 31,
2024 |
| Assets | | | |
| Real estate: | | | |
| Buildings and improvements | $ | 16,176,176 | | | $ | 16,115,283 | |
| Development costs and construction in progress | 962,714 | | | 880,393 | |
| Land and improvements | 2,941,082 | | | 2,918,758 | |
| Accumulated depreciation and amortization | (4,240,220) | | | (4,083,030) | |
| Net real estate | 15,839,752 | | | 15,831,404 | |
| | | |
| Loans receivable, net of reserves of $7,554 and $10,499 | 698,525 | | | 717,190 | |
| Investments in and advances to unconsolidated joint ventures | 951,978 | | | 936,814 | |
| Accounts receivable, net of allowance of $2,040 and $2,243 | 68,908 | | | 76,810 | |
| Cash and cash equivalents | 70,625 | | | 119,818 | |
| Restricted cash | 67,981 | | | 64,487 | |
| Intangible assets, net | 747,789 | | | 817,254 | |
| Assets held for sale, net | 7,840 | | | 7,840 | |
| Right-of-use asset, net | 422,017 | | | 424,173 | |
| Other assets, net | 940,314 | | | 942,465 | |
| Total assets | $ | 19,815,729 | | | $ | 19,938,255 | |
| | | |
| Liabilities and Equity | | | |
| Bank line of credit and commercial paper | $ | 164,000 | | | $ | 150,000 | |
| Term loans | 1,646,335 | | | 1,646,043 | |
| Senior unsecured notes | 6,714,279 | | | 6,563,256 | |
| Mortgage debt | 352,051 | | | 356,750 | |
| Intangible liabilities, net | 179,002 | | | 191,884 | |
| | | |
| Lease liability | 306,577 | | | 307,220 | |
| Accounts payable, accrued liabilities, and other liabilities | 670,221 | | | 725,342 | |
| Deferred revenue | 939,855 | | | 940,136 | |
| Total liabilities | 10,972,320 | | | 10,880,631 | |
| | | |
| Commitments and contingencies | | | |
| | | |
| | | |
| Redeemable noncontrolling interests | 14,417 | | | 2,610 | |
| | | |
| Common stock, $1.00 par value: 1,500,000,000 shares authorized; 698,611,840 and 699,485,139 shares issued and outstanding | 698,612 | | | 699,485 | |
| Additional paid-in capital | 12,827,628 | | | 12,847,252 | |
| Cumulative dividends in excess of earnings | (5,345,120) | | | (5,174,279) | |
| Accumulated other comprehensive income (loss) | 6,927 | | | 28,818 | |
| Total stockholders’ equity | 8,188,047 | | | 8,401,276 | |
| | | |
| Joint venture partners | 299,923 | | | 315,821 | |
| Non-managing member unitholders | 341,022 | | | 337,917 | |
| Total noncontrolling interests | 640,945 | | | 653,738 | |
| | | |
| Total equity | 8,828,992 | | | 9,055,014 | |
| | | |
| Total liabilities and equity | $ | 19,815,729 | | | $ | 19,938,255 | |
Healthpeak Properties, Inc.
Consolidated Statements of Operations
In thousands, except per share data
| | | | | | | | | | | | | | | |
| | Three Months Ended
March 31, | | |
| | 2025 | | 2024 | | | | |
| | | | | |
| Revenues: | | | | | |
| Rental and related revenues | $ | 538,141 | | | $ | 462,033 | | | | | |
| Resident fees and services | 148,927 | | | 138,776 | | | | | |
| Interest income and other | 15,821 | | | 5,751 | | | | | |
| | | | | | | |
| Total revenues | 702,889 | | | 606,560 | | | | | |
| | | | | | | |
| Costs and expenses: | | | | | | | |
| Interest expense | 72,693 | | | 60,907 | | | | | |
| Depreciation and amortization | 268,546 | | | 219,219 | | | | | |
| Operating | 273,143 | | | 243,729 | | | | | |
| General and administrative | 26,118 | | | 23,299 | | | | | |
| Transaction and merger-related costs | 5,534 | | | 107,220 | | | | | |
| | | | | | | |
| Impairments and loan loss reserves (recoveries), net | (3,562) | | | 11,458 | | | | | |
| Total costs and expenses | 642,472 | | | 665,832 | | | | | |
| Other income (expense): | | | | | | | |
| Gain (loss) on sales of real estate, net | — | | | 3,255 | | | | | |
| | | | | | | |
| Other income (expense), net | (6,126) | | | 78,516 | | | | | |
| Total other income (expense), net | (6,126) | | | 81,771 | | | | | |
| | | | | | | |
| Income (loss) before income taxes and equity income (loss) from unconsolidated joint ventures | 54,291 | | | 22,499 | | | | | |
| Income tax benefit (expense) | (2,080) | | | (13,698) | | | | | |
| Equity income (loss) from unconsolidated joint ventures | (2,147) | | | 2,376 | | | | | |
| | | | | | | |
| | | | | | | |
| | | | | | | |
| | | | | | | |
| Net income (loss) | 50,064 | | | 11,177 | | | | | |
| Noncontrolling interests’ share in earnings | (7,236) | | | (4,501) | | | | | |
| | | | | | | |
| Net income (loss) attributable to Healthpeak Properties, Inc. | 42,828 | | | 6,676 | | | | | |
| | | | | | | |
| Participating securities’ share in earnings | (464) | | | (199) | | | | | |
| Net income (loss) applicable to common shares | $ | 42,364 | | | $ | 6,477 | | | | | |
| | | | | | | |
| | | | | | | |
| | | | | | | |
| | | | | | | |
| | | | | | | |
| | | | | | | |
| | | | | | | |
| | | | | | | |
| | | | | | | |
| | | | | | | |
| Earnings (loss) per common share: | | | | | | | |
| Basic | $ | 0.06 | | | $ | 0.01 | | | | | |
| Diluted | $ | 0.06 | | | $ | 0.01 | | | | | |
| Weighted average shares outstanding: | | | | | | | |
| Basic | 699,067 | | | 600,898 | | | | | |
| Diluted | 699,118 | | | 601,188 | | | | | |
Healthpeak Properties, Inc.
Funds From Operations
In thousands, except per share data
| | | | | | | | | | | | | | | | | | |
| | | Three Months Ended
March 31, | | |
| | | 2025 | | 2024 | | | | |
| | | | | | |
| Net income (loss) applicable to common shares | | $ | 42,364 | | | $ | 6,477 | | | | | |
| Real estate related depreciation and amortization | | 268,546 | | | 219,219 | | | | | |
| Healthpeak’s share of real estate related depreciation and amortization from unconsolidated joint ventures | | 12,200 | | | 8,772 | | | | | |
| Noncontrolling interests’ share of real estate related depreciation and amortization | | (4,454) | | | (4,452) | | | | | |
| | | | | | | | |
| Loss (gain) on sales of depreciable real estate, net | | — | | | (3,255) | | | | | |
| | | | | | | | |
| | | | | | | | |
Loss (gain) upon change of control, net(1) | | — | | | (77,781) | | | | | |
Taxes associated with real estate dispositions(2) | | — | | | 11,608 | | | | | |
| | | | | | | | |
| | | | | | | | |
| | | | | | | | |
| Nareit FFO applicable to common shares | | 318,656 | | | 160,588 | | | | | |
| Distributions on dilutive convertible units and other | | 4,623 | | | 1,618 | | | | | |
| Diluted Nareit FFO applicable to common shares | | $ | 323,279 | | | $ | 162,206 | | | | | |
| Diluted Nareit FFO per common share | | $ | 0.45 | | | $ | 0.27 | | | | | |
| Weighted average shares outstanding - Diluted Nareit FFO | | 714,174 | | | 608,807 | | | | | |
| Impact of adjustments to Nareit FFO: | | | | | | | | |
Transaction and merger-related items(3) | | $ | 5,534 | | | $ | 102,829 | | | | | |
Other impairments (recoveries) and other losses (gains), net(4) | | (3,320) | | | 11,853 | | | | | |
| | | | | | | | |
| | | | | | | | |
| | | | | | | | |
| | | | | | | | |
Casualty-related charges (recoveries), net(5) | | 4,226 | | | — | | | | | |
| | | | | | | | |
| | | | | | | | |
| | | | | | | | |
| Total adjustments | | 6,440 | | | 114,682 | | | | | |
| FFO as Adjusted applicable to common shares | | 325,096 | | | 275,270 | | | | | |
| Distributions on dilutive convertible units and other | | 4,617 | | | 2,210 | | | | | |
| Diluted FFO as Adjusted applicable to common shares | | $ | 329,713 | | | $ | 277,480 | | | | | |
| Diluted FFO as Adjusted per common share | | $ | 0.46 | | | $ | 0.45 | | | | | |
| Weighted average shares outstanding - Diluted FFO as Adjusted | | 714,174 | | | 610,632 | | | | | |
_______________________________________
(1)The three months ended March 31, 2024 includes a gain upon change of control related to the sale of a 65% interest in two lab buildings in San Diego, California. The gain upon change of control is included in other income (expense), net in the Consolidated Statements of Operations.
(2)The three months ended March 31, 2024 includes non-cash income tax expense related to the sale of a 65% interest in two lab buildings in San Diego, California.
(3)The three months ended March 31, 2025 and 2024 includes costs related to the merger, which are primarily comprised of advisory, legal, accounting, tax, information technology, post-combination severance and stock compensation expense, and other costs of combining operations with Physicians Realty Trust that were incurred during the period. For the three months ended March 31, 2024, these costs were partially offset by termination fee income of $4 million associated with Graphite Bio, Inc., which later merged with LENZ Therapeutics, Inc. in March 2024, for which the lease terms were modified to accelerate expiration of the lease to December 2024. This termination fee income is included in rental and related revenues on the Consolidated Statements of Operations, but is excluded from Portfolio Cash Real Estate Revenues and FFO as Adjusted.
(4)The three months ended March 31, 2025 and 2024 includes reserves and (recoveries) for expected loan losses recognized in impairments and loan loss reserves (recoveries), net in the Consolidated Statements of Operations.
(5)Casualty-related charges (recoveries), net are recognized in other income (expense), net, equity income (loss) from unconsolidated joint ventures, and noncontrolling interests' share in earnings in the Consolidated Statements of Operations.
Healthpeak Properties, Inc.
Adjusted Funds From Operations
In thousands, except per share data
| | | | | | | | | | | | | | | |
| | Three Months Ended
March 31, | | |
| | 2025 | | 2024 | | | | |
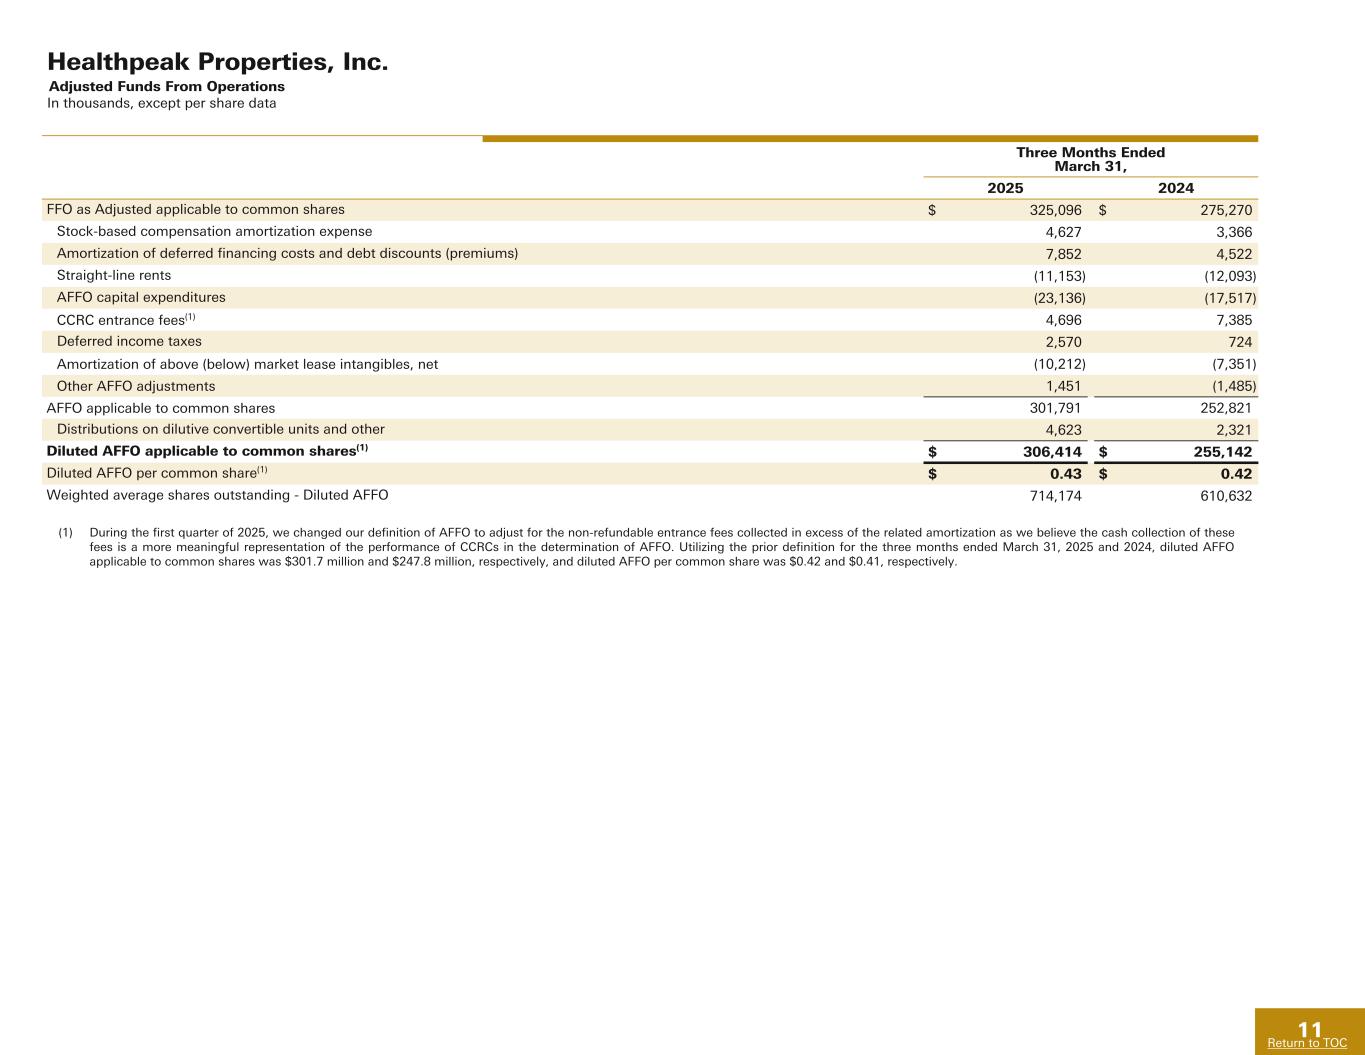
| FFO as Adjusted applicable to common shares | $ | 325,096 | | | $ | 275,270 | | | | | |
| Stock-based compensation amortization expense | 4,627 | | | 3,366 | | | | | |
| Amortization of deferred financing costs and debt discounts (premiums) | 7,852 | | | 4,522 | | | | | |
| Straight-line rents | (11,153) | | | (12,093) | | | | | |
| | | | | | | |
| AFFO capital expenditures | (23,136) | | | (17,517) | | | | | |
| | | | | | | |
CCRC entrance fees(1) | 4,696 | | | 7,385 | | | | | |
| Deferred income taxes | 2,570 | | | 724 | | | | | |
| Amortization of above (below) market lease intangibles, net | (10,212) | | | (7,351) | | | | | |
| Other AFFO adjustments | 1,451 | | | (1,485) | | | | | |
| AFFO applicable to common shares | 301,791 | | | 252,821 | | | | | |
| Distributions on dilutive convertible units and other | 4,623 | | | 2,321 | | | | | |
Diluted AFFO applicable to common shares(1) | $ | 306,414 | | | $ | 255,142 | | | | | |
Diluted AFFO per common share(1) | $ | 0.43 | | | $ | 0.42 | | | | | |
| Weighted average shares outstanding - Diluted AFFO | 714,174 | | | 610,632 | | | | | |
_______________________________________
(1)During the first quarter of 2025, we changed our definition of AFFO to adjust for the non-refundable entrance fees collected in excess of the related amortization as we believe the cash collection of these fees is a more meaningful representation of the performance of CCRCs in the determination of AFFO. Utilizing the prior definition for the three months ended March 31, 2025 and 2024, diluted AFFO applicable to common shares was $301.7 million and $247.8 million, respectively, and diluted AFFO per common share was $0.42 and $0.41, respectively.
Exhibit 99.3
Discussion and
Reconciliation of Non-
GAAP Financial Measures
March 31, 2025
(Unaudited)
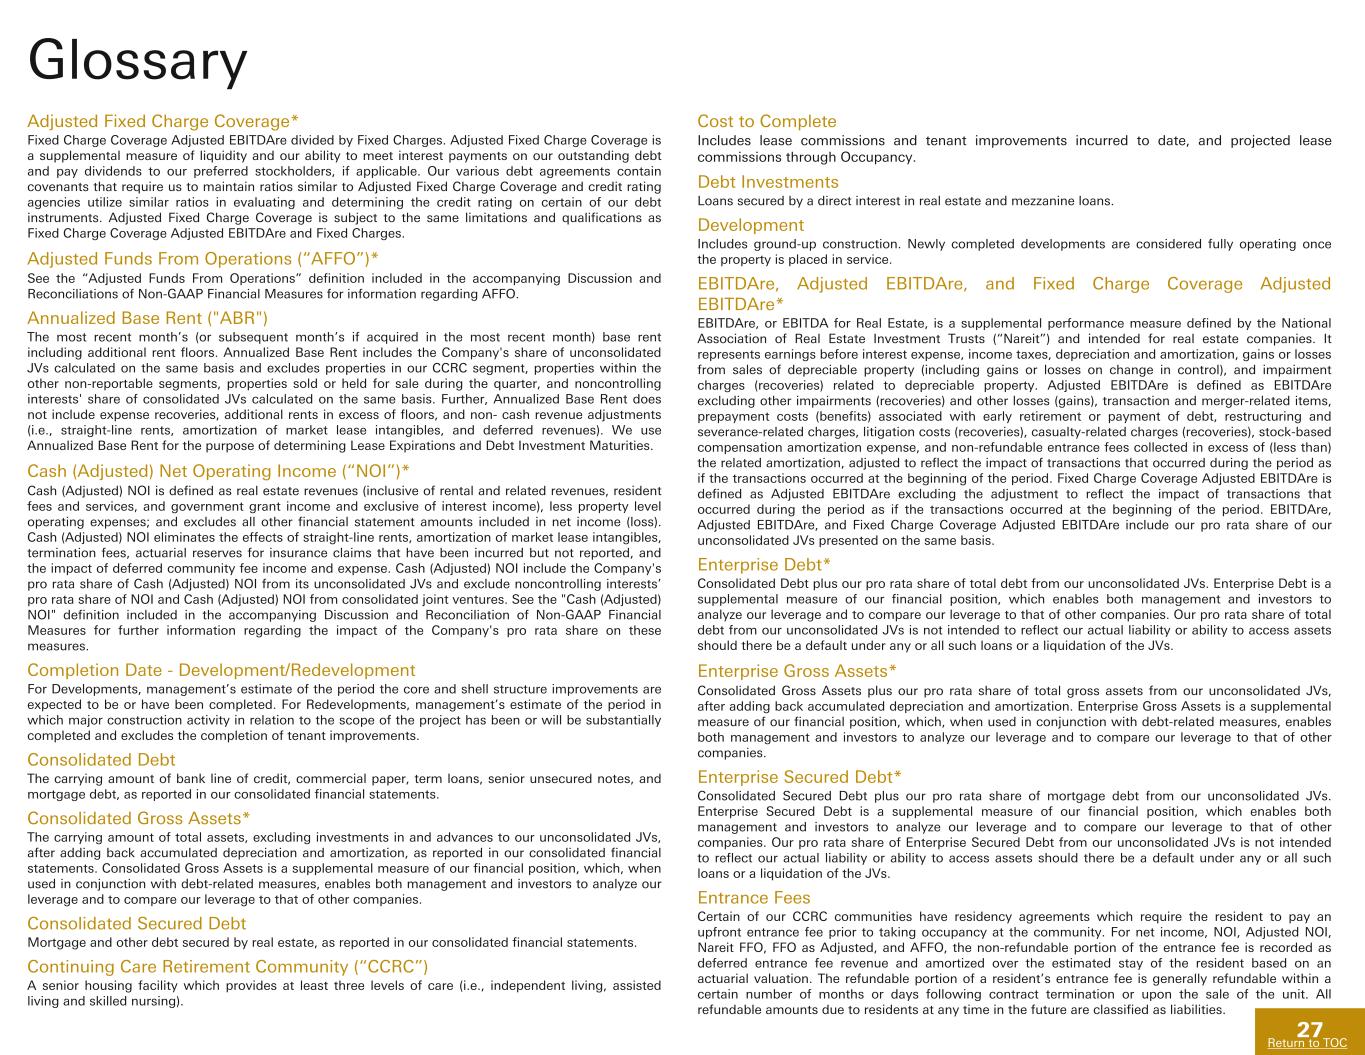
Adjusted Fixed Charge Coverage Fixed Charge Coverage Adjusted EBITDAre divided by Fixed Charges. Adjusted Fixed Charge Coverage is a supplemental measure of liquidity and our ability to meet interest payments on our outstanding debt and pay dividends to our preferred stockholders, if applicable. Our various debt agreements contain covenants that require us to maintain ratios similar to Adjusted Fixed Charge Coverage and credit rating agencies utilize similar ratios in evaluating and determining the credit rating on certain of our debt instruments. Adjusted Fixed Charge Coverage is subject to the same limitations and qualifications as Fixed Charge Coverage Adjusted EBITDAre and Fixed Charges.
Adjusted Funds From Operations (“AFFO”) AFFO is defined as FFO as Adjusted after excluding the impact of the following: (i) stock-based compensation amortization expense, (ii) amortization of deferred financing costs and debt discounts (premiums), (iii) straight-line rents, (iv) deferred income taxes, (v) amortization of above (below) market lease intangibles, net, (vi) non-refundable entrance fees collected in excess of (less than) the related amortization, and (vii) other AFFO adjustments, which include: (a) lease incentive amortization (reduction of straight-line rents), (b) actuarial reserves for insurance claims that have been incurred but not reported, and (c) amortization of deferred revenues, excluding amounts amortized into rental income that are associated with tenant funded improvements owned/recognized by us and up-front cash payments made by tenants to reduce their contractual rents. Also, AFFO is computed after deducting recurring capital expenditures, including second generation leasing costs and second generation tenant and capital improvements (“AFFO capital expenditures”). All adjustments are reflective of our pro rata share of both our consolidated and unconsolidated joint ventures (reported in “other AFFO adjustments”). We reflect our share of AFFO for unconsolidated joint ventures by applying our actual ownership percentage for the period to the applicable reconciling items on an entity by entity basis. We reflect our share for consolidated joint ventures in which we do not own 100% of the equity by adjusting our AFFO to remove the third-party ownership share of the applicable reconciling items based on actual ownership percentage for the applicable periods. See “Nareit FFO” below for further disclosures regarding our use of pro rata share information and its limitations. We believe AFFO is an alternative run-rate performance measure that improves the understanding of our operating results among investors and makes comparisons with: (i) expected results, (ii) results of previous periods, and (iii) results among REITs more meaningful. AFFO does not represent cash generated from operating activities determined in accordance with GAAP and is not indicative of cash available to fund cash needs as it excludes the following items which generally flow through our cash flows from operating activities: (i) adjustments for changes in working capital or the actual timing of the payment of income or expense items that are accrued in the period, (ii) transaction-related costs, (iii) litigation settlement expenses, and (iv) restructuring and severance-related charges. Furthermore, AFFO is adjusted for recurring capital expenditures, which are generally not considered when determining cash flows from operations or liquidity. Other REITs or real estate companies may use different methodologies for calculating AFFO, and accordingly, our AFFO may not be comparable to those reported by other REITs. Management believes AFFO provides a meaningful supplemental measure of our performance and is frequently used by analysts, investors, and other interested parties in the evaluation of our performance as a REIT, and by presenting AFFO, we are assisting these parties in their evaluation. AFFO is a non-GAAP supplemental financial measure and should not be considered as an alternative to net income (loss) determined in accordance with GAAP and should only be considered together with and as a supplement to our financial information prepared in accordance with GAAP.
Adjusted Net Operating Income and Cash (Adjusted) Net Operating Income (“NOI”) Adjusted NOI is a non-U.S. generally accepted accounting principles (“GAAP”) supplemental financial measure used to evaluate the operating performance of real estate. Adjusted NOI represents real estate revenues (inclusive of rental and related revenues, resident fees and services, and government grant income and exclusive of interest income), less property level operating expenses; Adjusted NOI excludes all other financial statement amounts included in net income (loss). Adjusted NOI eliminates the effects of straight-line rents, amortization of market lease intangibles, termination fees, actuarial reserves for insurance claims that have been incurred but not reported, and the impact of deferred community fee income and expense. Adjusted NOI is calculated as Adjusted NOI from consolidated properties, plus our share of Adjusted NOI from unconsolidated joint ventures (calculated by applying our actual ownership percentage for the period), less noncontrolling interests’ share of Adjusted NOI from consolidated joint ventures (calculated by applying our actual ownership percentage for the period). We utilize our share of Adjusted NOI in assessing our performance as we have various joint ventures that contribute to our performance. Our share of Adjusted NOI should not be considered a substitute for, and should only be considered together with and as a supplement to, our financial information presented in accordance with GAAP.
Adjusted NOI is oftentimes referred to as “Cash NOI.” Management believes Adjusted NOI is an important supplemental measure because it provides relevant and useful information by reflecting only income and operating expense items that are incurred at the property level and presents them on an unlevered basis. We use Adjusted NOI to make decisions about resource allocations, to assess and compare property level performance, and to evaluate our Merger-Combined Same-Store (“Merger-Combined SS”) performance, as described below. We believe that net income (loss) is the most directly comparable GAAP measure to Adjusted NOI. Adjusted NOI should not be viewed as an alternative measure of operating performance to net income (loss) as defined by GAAP since it does not reflect various excluded items. Further, our definition of Adjusted NOI may not be comparable to the definitions used by other REITs or real estate companies, as they may use different methodologies for calculating Adjusted NOI.
Operating expenses generally relate to leased outpatient medical and lab buildings, as well as CCRC facilities. We generally recover all or a portion of our leased outpatient medical and lab property expenses through tenant recoveries, which are recognized within rental and related revenues.
Consolidated Debt The carrying amount of bank line of credit, commercial paper, term loans, senior unsecured notes, and mortgage debt, as reported in our consolidated financial statements.
Consolidated Gross Assets The carrying amount of total assets, excluding investments in and advances to our unconsolidated JVs, after adding back accumulated depreciation and amortization, as reported in our consolidated financial statements. Consolidated Gross Assets is a supplemental measure of our financial position, which, when used in conjunction with debt-related measures, enables both management and investors to analyze our leverage and to compare our leverage to that of other companies.
Consolidated Secured Debt Mortgage and other debt secured by real estate, as reported in our consolidated financial statements.
Continuing Care Retirement Community (“CCRC”) A senior housing facility which provides at least three levels of care (i.e., independent living, assisted living and skilled nursing).
Debt Investments Loans secured by a direct interest in real estate and mezzanine loans.
Development Includes ground-up construction. Newly completed developments are considered fully operating once the property is placed in service.
EBITDAre, Adjusted EBITDAre, and Fixed Charge Coverage Adjusted EBITDAre EBITDAre, or EBITDA for Real Estate, is a supplemental performance measure defined by the National Association of Real Estate Investment Trusts (“Nareit”) and intended for real estate companies. It represents earnings before interest expense, income taxes, depreciation and amortization, gains or losses from sales of depreciable property (including gains or losses on change in control), and impairment charges (recoveries) related to depreciable property. Adjusted EBITDAre is defined as EBITDAre excluding other impairments (recoveries) and other losses (gains), transaction and merger-related items, prepayment costs (benefits) associated with early retirement or payment of debt, restructuring and severance-related charges, litigation costs (recoveries), casualty-related charges (recoveries), stock-based compensation amortization expense, and non-refundable entrance fees collected in excess of (less than) the related amortization, adjusted to reflect the impact of transactions that occurred during the period as if the transactions occurred at the beginning of the period. Fixed Charge Coverage Adjusted EBITDAre is defined as Adjusted EBITDAre excluding the adjustment to reflect the impact of transactions that occurred during the period as if the transactions occurred at the beginning of the period. EBITDAre, Adjusted EBITDAre, and Fixed Charge Coverage Adjusted EBITDAre include our pro rata share of our unconsolidated JVs presented on the same basis. We consider EBITDAre and Adjusted EBITDAre important supplemental measures to net income (loss) because they provide an additional manner in which to evaluate our operating performance and serve as additional indicators of our ability to service our debt obligations. Net income (loss) is the most directly comparable U.S. generally accepted accounting principles (“GAAP”) measure to EBITDAre and Adjusted EBITDAre.
Enterprise Debt Consolidated Debt plus our pro rata share of total debt from our unconsolidated JVs. Enterprise Debt is a supplemental measure of our financial position, which enables both management and investors to analyze our leverage and to compare our leverage to that of other companies. Our pro rata share of total debt from our unconsolidated JVs is not intended to reflect our actual liability or ability to access assets should there be a default under any or all such loans or a liquidation of the JVs.
Enterprise Gross Assets Consolidated Gross Assets plus our pro rata share of total gross assets from our unconsolidated JVs, after adding back accumulated depreciation and amortization. Enterprise Gross Assets is a supplemental measure of our financial position, which, when used in conjunction with debt-related measures, enables both management and investors to analyze our leverage and to compare our leverage to that of other companies.
Enterprise Secured Debt Consolidated Secured Debt plus our pro rata share of mortgage debt from our unconsolidated JVs. Enterprise Secured Debt is a supplemental measure of our financial position, which enables both management and investors to analyze our leverage and to compare our leverage to that of other companies. Our pro rata share of Enterprise Secured Debt from our unconsolidated JVs is not intended to reflect our actual liability or ability to access assets should there be a default under any or all such loans or a liquidation of the JVs.
Entrance Fees Certain of our CCRC communities have residency agreements which require the resident to pay an upfront entrance fee prior to taking occupancy at the community. For net income, NOI, Adjusted NOI, Nareit FFO, FFO as Adjusted, and AFFO, the non-refundable portion of the entrance fee is recorded as deferred entrance fee revenue and amortized over the estimated stay of the resident based on an actuarial valuation. The refundable portion of a resident’s entrance fee is generally refundable within a certain number of months or days following contract termination or upon the sale of the unit. All refundable amounts due to residents at any time in the future are classified as liabilities.
Financial Leverage Enterprise Debt divided by Enterprise Gross Assets. Financial Leverage is a supplemental measure of our financial position, which enables both management and investors to analyze our leverage and to compare our leverage to that of other companies. Our pro rata share information is calculated by applying our actual ownership percentage for the period and excludes debt funded by us to our JVs. Our pro rata share of total debt from our unconsolidated JVs is not intended to reflect our actual liability or ability to access assets should there be a default under any or all such loans or a liquidation of the JVs.
Fixed Charges Total interest expense plus capitalized interest plus preferred stock dividends (if applicable). Fixed Charges also includes our pro rata share of the interest expense plus capitalized interest plus preferred stock dividends (if applicable) of our unconsolidated JVs. Fixed Charges is a supplemental measure of our interest payments on outstanding debt and dividends to preferred stockholders for purposes of presenting Fixed Charge Coverage and Adjusted Fixed Charge Coverage. Fixed Charges is subject to limitations and qualifications, as, among other things, it does not include all contractual obligations.
Funds From Operations (“Nareit FFO”) and FFO as Adjusted Nareit FFO. Funds from Operations (“FFO”), as defined by the National Association of Real Estate Investment Trusts (“Nareit”), is net income (loss) applicable to common shares (computed in accordance with GAAP), excluding gains or losses from sales of depreciable property, including any current and deferred taxes directly associated with sales of depreciable property, impairments of, or related to, depreciable real estate, plus real estate-related depreciation and amortization, and adjustments to compute our share of Nareit FFO from joint ventures. Adjustments for joint ventures are calculated to reflect our pro rata share of both our consolidated and unconsolidated joint ventures. We reflect our share of Nareit FFO for unconsolidated joint ventures by applying our actual ownership percentage for the period to the applicable reconciling items on an entity by entity basis. For consolidated joint ventures in which we do not own 100%, we reflect our share of the equity by adjusting our Nareit FFO to remove the third-party ownership share of the applicable reconciling items based on actual ownership percentage for the applicable periods. Our pro rata share information is prepared on a basis consistent with the comparable consolidated amounts, is intended to reflect our proportionate economic interest in the operating results of properties in our portfolio and is calculated by applying our actual ownership percentage for the period. We do not control the unconsolidated joint ventures, and the pro rata presentations of reconciling items included in Nareit FFO do not represent our legal claim to such items. The joint venture members or partners are entitled to profit or loss allocations and distributions of cash flows according to the joint venture agreements, which provide for such allocations generally according to their invested capital.
The presentation of pro rata information has limitations, which include, but are not limited to, the following: (i) the amounts shown on the individual line items were derived by applying our overall economic ownership interest percentage determined when applying the equity method of accounting and do not necessarily represent our legal claim to the assets and liabilities, or the revenues and expenses and (ii) other companies in our industry may calculate their pro rata interest differently, limiting the usefulness as a comparative measure. Because of these limitations, the pro rata financial information should not be considered independently or as a substitute for our financial statements as reported
under GAAP. We compensate for these limitations by relying primarily on our GAAP financial statements, using the pro rata financial information as a supplement.
We believe Nareit FFO applicable to common shares and diluted Nareit FFO applicable to common shares are important supplemental non-GAAP measures of operating performance for a REIT. Because the historical cost accounting convention used for real estate assets utilizes straight-line depreciation (except on land), such accounting presentation implies that the value of real estate assets diminishes predictably over time. Since real estate values instead have historically risen and fallen with market conditions, presentations of operating results for a REIT that use historical cost accounting for depreciation could be less informative. The term Nareit FFO was designed by the REIT industry to address this issue.
Nareit FFO does not represent cash generated from operating activities in accordance with GAAP, is not necessarily indicative of cash available to fund cash needs and should not be considered an alternative to net income (loss). We compute Nareit FFO in accordance with the current Nareit definition; however, other REITs may report Nareit FFO differently or have a different interpretation of the current Nareit definition from ours. For a reconciliation of net income (loss) to Nareit FFO and other relevant disclosures, refer to “Non-GAAP Financial Measures Reconciliations” below.
FFO as Adjusted. In addition, we present Nareit FFO on an adjusted basis before the impact of non-comparable items including, but not limited to, transaction and merger-related items, other impairments (recoveries) and other losses (gains), restructuring and severance-related charges, prepayment costs (benefits) associated with early retirement or payment of debt, litigation costs (recoveries), casualty-related charges (recoveries), deferred tax asset valuation allowances, and changes in tax legislation (“FFO as Adjusted”). These adjustments are net of tax, when applicable, and are reflective of our share of our joint ventures. Adjustments for joint ventures are calculated to reflect our pro rata share of both our consolidated and unconsolidated joint ventures. We reflect our share of FFO as Adjusted for unconsolidated joint ventures by applying our actual ownership percentage for the period to the applicable reconciling items on an entity by entity basis. We reflect our share for consolidated joint ventures in which we do not own 100% of the equity by adjusting our FFO as Adjusted to remove the third-party ownership share of the applicable reconciling items based on actual ownership percentage for the applicable periods. See “Nareit FFO” above for further disclosures regarding our use of pro rata share information and its limitations. Transaction and merger-related items include transaction expenses and gains/charges incurred as a result of mergers and acquisitions and lease amendment or termination activities. Prepayment costs (benefits) associated with early retirement of debt include the write-off of unamortized deferred financing fees, or additional costs, expenses, discounts, make-whole payments, penalties or premiums incurred as a result of early retirement or payment of debt. Other impairments (recoveries) and other losses (gains) include interest income associated with early and partial repayments of loans receivable and other losses or gains associated with non-depreciable assets including goodwill, undeveloped land parcels, and loans receivable. Management believes that FFO as Adjusted provides a meaningful supplemental measurement of our FFO run-rate and is frequently used by analysts, investors, and other interested parties in the evaluation of our performance as a REIT. At the same time that Nareit created and defined its FFO measure for the REIT industry, it also recognized that “management of each of its member companies has the responsibility and authority to publish financial information that it regards as useful to the financial community.” We believe stockholders, potential investors, and financial analysts who review our operating performance are best served by an FFO run-rate earnings measure that includes certain other adjustments to net income (loss), in addition to adjustments made to arrive at the Nareit defined measure of FFO. FFO as Adjusted is used by management in analyzing our business and the performance of our properties and we believe it is important that stockholders, potential investors, and financial analysts understand this measure used by management. We use FFO as Adjusted to: (i) evaluate our performance in comparison with expected results and results of previous periods, relative to resource allocation decisions, (ii) evaluate the performance of our management, (iii) budget and forecast future results to assist in the allocation of resources, (iv) assess our performance as compared with similar real estate companies and the industry in general, and (v) evaluate how a specific potential investment will impact our future results. Other REITs or real estate companies may use different methodologies for calculating an adjusted FFO measure, and accordingly, our FFO as Adjusted may not be comparable to those reported by other REITs.
Investment and Portfolio Investment Represents: (i) the carrying amount of real estate assets and intangibles, after adding back accumulated depreciation and amortization and (ii) the carrying amount of Debt Investments. Portfolio Investment also includes our pro rata share of the real estate assets and intangibles held in our unconsolidated JVs, presented on the same basis as Investment, and excludes noncontrolling interests' pro rata share of the real estate assets and intangibles held in our consolidated JVs, presented on the same basis. Investment and Portfolio Investment include land held for development.
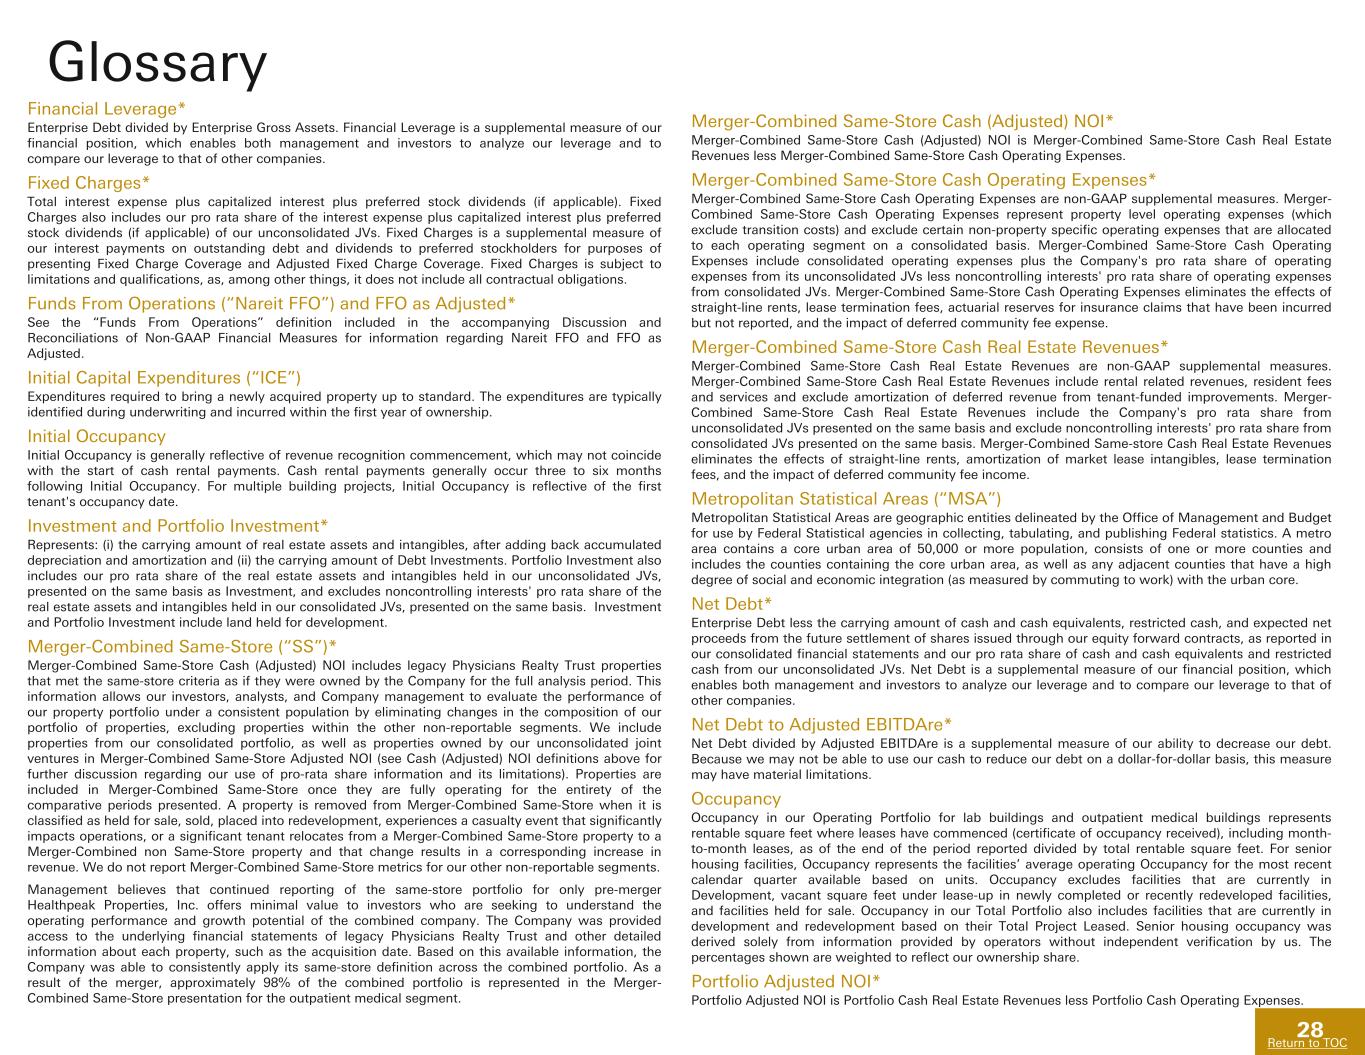
Merger-Combined Same-Store (“SS”) Merger-Combined Same-Store Cash (Adjusted) NOI includes legacy Physicians Realty Trust properties that met the same-store criteria as if they were owned by the Company for the full analysis period. This information allows our investors, analysts, and Company management to evaluate the performance of our property portfolio under a consistent population by eliminating changes in the composition of our portfolio of properties, excluding properties within the other non-reportable segments. We include properties from our consolidated portfolio, as well as properties owned by our unconsolidated joint ventures in Merger-Combined Same-Store Adjusted NOI (see Cash (Adjusted) NOI definitions above for further discussion regarding our use of pro-rata share information and its limitations). Properties are included in Merger-Combined Same-Store once they are fully operating for the entirety of the comparative periods presented. A property is removed from Merger-Combined Same-Store when it is classified as held for sale, sold, placed into redevelopment, experiences a casualty event that significantly impacts operations, or a significant tenant relocates from a Merger-Combined Same-Store property to a Merger-Combined non Same-Store property and that change results in a corresponding increase in revenue. We do not report Merger-Combined Same-Store metrics for our other non-reportable segments.
Management believes that continued reporting of the same-store portfolio for only pre-merger Healthpeak Properties, Inc. offers minimal value to investors who are seeking to understand the operating performance and growth potential of the combined company. The Company was provided access to the underlying financial statements of legacy Physicians Realty Trust and other detailed information about each property, such as the acquisition date. Based on this available information, the Company was able to consistently apply its same-store definition across the combined portfolio. As a result of the merger, approximately 98% of the combined portfolio is represented in the Merger-Combined Same-Store presentation for the outpatient medical segment.
Merger-Combined Same-Store Cash (Adjusted) NOI Merger-Combined Same-Store Cash (Adjusted) NOI is Merger-Combined Same-Store Cash Real Estate Revenues less Merger-Combined Same-Store Cash Operating Expenses.
Merger-Combined Same-Store Cash Operating Expenses Merger-Combined Same-Store Cash Operating Expenses are non-GAAP supplemental measures. Merger-Combined Same-Store Cash Operating Expenses represent property level operating expenses (which exclude transition costs) and exclude certain non-property specific operating expenses that are allocated to each operating segment on a consolidated basis. Merger-Combined Same-Store Cash Operating Expenses include consolidated operating expenses plus the Company's pro rata share of operating expenses from its unconsolidated JVs less noncontrolling interests' pro rata share of operating expenses from consolidated JVs. Merger-Combined Same-Store Cash Operating Expenses eliminates the effects of straight-line rents, lease termination fees, actuarial reserves for insurance claims that have been incurred but not reported, and the impact of deferred community fee expense.
Merger-Combined Same-Store Cash Real Estate Revenues Merger-Combined Same-Store Cash Real Estate Revenues are non-GAAP supplemental measures. Merger-Combined Same-Store Cash Real Estate Revenues include rental related revenues, resident fees and services and exclude amortization of deferred revenue from tenant-funded improvements. Merger-Combined Same-Store Cash Real Estate Revenues include the Company's pro rata share from unconsolidated JVs presented on the same basis and exclude noncontrolling interests' pro rata share from consolidated JVs presented on the same basis. Merger-Combined Same-store Cash Real Estate Revenues eliminates the effects of straight-line rents, amortization of market lease intangibles, lease termination fees, and the impact of deferred community fee income.
Net Debt Enterprise Debt less the carrying amount of cash and cash equivalents, restricted cash, and expected net proceeds from the future settlement of shares issued through our equity forward contracts, as reported in our consolidated financial statements and our pro rata share of cash and cash equivalents and restricted cash from our unconsolidated JVs. Consolidated Debt is the most directly comparable GAAP measure to Net Debt. Net Debt is a supplemental measure of our financial position, which enables both management and investors to analyze our leverage and to compare our leverage to that of other companies.
Net Debt to Adjusted EBITDAre Net Debt divided by Adjusted EBITDAre is a supplemental measure of our ability to decrease our debt. Because we may not be able to use our cash to reduce our debt on a dollar-for-dollar basis, this measure may have material limitations.
Portfolio Adjusted NOI Portfolio Adjusted NOI is Portfolio Cash Real Estate Revenues less Portfolio Cash Operating Expenses.
Portfolio Cash Operating Expenses Portfolio Cash Operating Expenses are non-GAAP supplemental measures. Portfolio Cash Operating Expenses represent property level operating expenses (which exclude transition costs). Portfolio Cash Operating Expenses include consolidated operating expenses plus the Company's pro rata share of operating expenses from its unconsolidated JVs less noncontrolling interests' pro rata share of operating expenses from consolidated JVs. Portfolio Cash Operating Expenses eliminates the effects of straight-line rents, lease termination fees, actuarial reserves for insurance claims that have been incurred but not reported, and the impact of deferred community fee expense.
Portfolio Cash Real Estate Revenues Portfolio Cash Real Estate Revenues are non-GAAP supplemental measures. Portfolio Cash Real Estate Revenues include rental related revenues, resident fees and services, and government grant income which is included in Other income (expense), net in our Consolidated Statement of Operations. Portfolio Cash Real Estate Revenues include the Company's pro rata share from unconsolidated JVs presented on the same basis and exclude noncontrolling interests' pro rata share from consolidated JVs presented on the same basis. Portfolio Cash Real Estate Revenues eliminates the effects of straight-line rents, amortization of market lease intangibles, lease termination fees, and the impact of deferred community fee income.
Portfolio Income Cash (Adjusted) NOI plus interest income plus our pro rata share of Cash (Adjusted) NOI from our unconsolidated JVs less noncontrolling interests' pro rata share of Cash (Adjusted) NOI from consolidated JVs. Management believes that Portfolio Income is an important supplemental measure because it provides relevant and useful information regarding our performance; specifically, it is a measure of our property level profitability of the Company inclusive of interest income. Management believes that net income (loss) is the most directly comparable GAAP measure to Portfolio Income. Portfolio Income should not be viewed as an alternative measure of operating performance to net income (loss) as defined by GAAP since it does not reflect various excluded items.
Projected Stabilized Cash Yield Projected Cash (Adjusted) NOI at stabilization divided by the expected total development costs. Management considers Projected Stabilized Yield a useful metric for investors as it helps provide context to the expected effects that development projects will have on the Company’s future performance once stabilized.
Redevelopment Properties that incur major capital expenditures to significantly improve, change the use, or reposition the property pursuant to a formal redevelopment plan. Newly completed redevelopments, are considered fully operating once the property is placed in service. Redevelopment costs include only the incremental costs for the project.
REVPOR The 3-month average Cash Real Estate Revenues per occupied unit for the most recent period available. REVPOR excludes newly completed assets under lease-up, assets sold, acquired or converted to a new operating structure during the relevant period, assets in redevelopment, assets that are held for sale, and assets that experienced a casualty event that significantly impacted operations. REVPOR cannot be derived from the information presented for the Other portfolio as units reflect 100% of the unit capacities for unconsolidated JVs and revenue is at the Company's pro rata share. All facility occupancy data was derived solely from information provided by operators without independent verification by us. REVPOR relates to our Other non-reportable segment. REVPOR is a metric used to evaluate the revenue-generating capacity and profit potential of our other assets independent of fluctuating occupancy rates. It is also used in comparison against industry and competitor statistics, if known, to evaluate the quality of our other assets.
REVPOR CCRC The 3-month average Cash Real Estate Revenues per occupied unit excluding Cash NREFs for the most recent period available. REVPOR CCRC excludes newly completed assets under lease-up, assets sold, or acquired during the relevant period, assets in redevelopment, assets that are held for sale, and assets that experienced a casualty event that significantly impacted operations. All facility occupancy data was derived solely from information provided by operators without independent verification by us. REVPOR CCRC is a metric used to evaluate the revenue-generating capacity and profit potential of our CCRC assets independent of fluctuating occupancy rates. It is also used in comparison against industry and competitor statistics, if known, to evaluate the quality of our CCRC assets.
RIDEA A structure whereby a taxable REIT subsidiary is permitted to rent a healthcare facility from its parent REIT and hire an independent contractor to operate the facility.
Secured Debt Ratio Enterprise Secured Debt divided by Enterprise Gross Assets. Secured Debt Ratio is a supplemental measure of our financial position, which enables both management and investors to analyze our leverage and to compare our leverage to that of other companies. Our pro rata share information is calculated by applying our actual ownership percentage for the period and excludes debt funded by us to our JVs. Our pro rata share of Total Secured Debt from our unconsolidated JVs is not intended to reflect our actual liability or ability to access assets should there be a default under any or all such loans or a liquidation of the JVs.
Segments The Company’s diverse portfolio is comprised of investments in the following reportable healthcare segments: (i) outpatient medical; (ii) lab; and (iii) continuing care retirement community (“CCRC”).
Share of Consolidated Joint Ventures ("JVs") Noncontrolling interests' pro rata share information is prepared by applying noncontrolling interests' actual ownership percentage for the period and is intended to reflect noncontrolling interests' proportionate economic interest in the financial position and operating results of properties in our portfolio.
Share of Unconsolidated Joint Ventures Our pro rata share information is prepared by applying our actual ownership percentage for the period and is intended to reflect our proportionate economic interest in the financial position and operating results of properties in our portfolio. Certain unconsolidated joint ventures are excluded from leasing statistics when leasing information is not available.
In thousands, except per share data
| | | | | | | | | | | | | | | |
| Three Months Ended
March 31, | | |
| | 2025 | | 2024 | | | | |
| Net income (loss) applicable to common shares | $ | 42,364 | | | $ | 6,477 | | | | | |
| Real estate related depreciation and amortization | 268,546 | | | 219,219 | | | | | |
| Healthpeak’s share of real estate related depreciation and amortization from unconsolidated joint ventures | 12,200 | | | 8,772 | | | | | |
| Noncontrolling interests’ share of real estate related depreciation and amortization | (4,454) | | | (4,452) | | | | | |
| | | | | | | |
| Loss (gain) on sales of depreciable real estate, net | — | | | (3,255) | | | | | |
| | | | | | | |
| | | | | | | |
Loss (gain) upon change of control, net(1) | — | | | (77,781) | | | | | |
Taxes associated with real estate dispositions(2) | — | | | 11,608 | | | | | |
| | | | | | | |
| | | | | | | |
| | | | | | | |
| Nareit FFO applicable to common shares | 318,656 | | | 160,588 | | | | | |
| Distributions on dilutive convertible units and other | 4,623 | | | 1,618 | | | | | |
| Diluted Nareit FFO applicable to common shares | $ | 323,279 | | | $ | 162,206 | | | | | |
| | | | | | | |
| Weighted average shares outstanding - Diluted Nareit FFO | 714,174 | | | 608,807 | | | | | |
| | | | | | | |
| Impact of adjustments to Nareit FFO: | | | | | | | |
Transaction and merger-related items(3) | $ | 5,534 | | | $ | 102,829 | | | | | |
Other impairments (recoveries) and other losses (gains), net(4) | (3,320) | | | 11,853 | | | | | |
| | | | | | | |
| | | | | | | |
| | | | | | | |
Casualty-related charges (recoveries), net(5) | 4,226 | | | — | | | | | |
| | | | | | | |
| | | | | | | |
| | | | | | | |
| Total adjustments | $ | 6,440 | | | $ | 114,682 | | | | | |
| | | | | | | |
| FFO as Adjusted applicable to common shares | $ | 325,096 | | | $ | 275,270 | | | | | |
| Distributions on dilutive convertible units and other | 4,617 | | | 2,210 | | | | | |
| Diluted FFO as Adjusted applicable to common shares | $ | 329,713 | | | $ | 277,480 | | | | | |
| | | | | | | |
| Weighted average shares outstanding - Diluted FFO as Adjusted | 714,174 | | | 610,632 | | | | | |
| | | | | | | |
| FFO as Adjusted applicable to common shares | $ | 325,096 | | | $ | 275,270 | | | | | |
| Stock-based compensation amortization expense | 4,627 | | | 3,366 | | | | | |
| Amortization of deferred financing costs and debt discounts (premiums) | 7,852 | | | 4,522 | | | | | |
| Straight-line rents | (11,153) | | | (12,093) | | | | | |
| AFFO capital expenditures | (23,136) | | | (17,517) | | | | | |
| | | | | | | |
CCRC entrance fees(6) | 4,696 | | | 7,385 | | | | | |
| Deferred income taxes | 2,570 | | | 724 | | | | | |
| Amortization of above (below) market lease intangibles, net | (10,212) | | | (7,351) | | | | | |
| Other AFFO adjustments | 1,451 | | | (1,485) | | | | | |
| AFFO applicable to common shares | 301,791 | | | 252,821 | | | | | |
| Distributions on dilutive convertible units and other | 4,623 | | | 2,321 | | | | | |
Diluted AFFO applicable to common shares(6) | $ | 306,414 | | | $ | 255,142 | | | | | |
| | | | | | | |
| Weighted average shares outstanding - Diluted AFFO | 714,174 | | | 610,632 | | | | | |
In thousands, except per share data
| | | | | | | | | | | | | | | |
| Three Months Ended
March 31, | | |
| | 2025 | | 2024 | | | | |
| Diluted earnings per common share | $ | 0.06 | | | $ | 0.01 | | | | | |
| Depreciation and amortization | 0.39 | | | 0.37 | | | | | |
| | | | | | | |
Loss (gain) upon change of control, net(1) | — | | | (0.13) | | | | | |
Taxes associated with real estate dispositions(2) | — | | | 0.02 | | | | | |
| | | | | | | |
| Diluted Nareit FFO per common share | $ | 0.45 | | | $ | 0.27 | | | | | |
Transaction and merger-related items(3) | 0.01 | | | 0.17 | | | | | |
Other impairments (recoveries) and other losses (gains), net(4) | (0.01) | | | 0.01 | | | | | |
| | | | | | | |
| | | | | | | |
| | | | | | | |
Casualty-related charges (recoveries), net(5) | 0.01 | | | — | | | | | |
| | | | | | | |
| | | | | | | |
| | | | | | | |
| Diluted FFO as Adjusted per common share | $ | 0.46 | | | $ | 0.45 | | | | | |
| Stock-based compensation amortization expense | 0.01 | | | 0.01 | | | | | |
| Amortization of deferred financing costs and debt discounts (premiums) | 0.01 | | | 0.01 | | | | | |
| Straight-line rents | (0.02) | | | (0.02) | | | | | |
| AFFO capital expenditures | (0.03) | | | (0.03) | | | | | |
CCRC entrance fees(6) | 0.01 | | | 0.01 | | | | | |
| Deferred income taxes | 0.00 | | | 0.00 | | | | | |
| Amortization of above (below) market lease intangibles, net | (0.01) | | | (0.01) | | | | | |
| Other AFFO adjustments | 0.00 | | | 0.00 | | | | | |
Diluted AFFO per common share(6) | $ | 0.43 | | | $ | 0.42 | | | | | |
______________________________________
(1)The three months ended March 31, 2024 includes a gain upon change of control related to the sale of a 65% interest in two lab buildings in San Diego, California. The gain upon change of control is included in other income (expense), net in the Consolidated Statements of Operations.
(2)The three months ended March 31, 2024 includes non-cash income tax expense related to the sale of a 65% interest in two lab buildings in San Diego, California.
(3)The three months ended March 31, 2025 and 2024 includes costs related to the merger, which are primarily comprised of advisory, legal, accounting, tax, information technology, post-combination severance and stock compensation expense, and other costs of combining operations with Physicians Realty Trust that were incurred during the period. For the three months ended March 31, 2024, these costs were partially offset by termination fee income of $4 million associated with Graphite Bio, Inc., which later merged with LENZ Therapeutics, Inc. in March 2024, for which the lease terms were modified to accelerate expiration of the lease to December 2024. This termination fee income is included in rental and related revenues on the Consolidated Statements of Operations, but is excluded from Portfolio Cash Real Estate Revenues and FFO as Adjusted.
(4)The three months ended March 31, 2025 and 2024 includes reserves and (recoveries) for expected loan losses recognized in impairments and loan loss reserves (recoveries), net in the Consolidated Statements of Operations.
(5)Casualty-related charges (recoveries), net are recognized in other income (expense), net, equity income (loss) from unconsolidated joint ventures, and noncontrolling interests' share in earnings in the Consolidated Statements of Operations.
(6)During the first quarter of 2025, we changed our definition of AFFO to adjust for the non-refundable entrance fees collected in excess of the related amortization as we believe the cash collection of these fees is a more meaningful representation of the performance of CCRCs in the determination of AFFO. Utilizing the prior definition for the three months ended March 31, 2025 and 2024, diluted AFFO applicable to common shares was $301.7 million and $247.8 million, respectively, and diluted AFFO per common share was $0.42 and $0.41, respectively.
Per share data
| | | | | | | | | | | | |
| 2025 Guidance Ranges | |
| Low | | High | |
| Diluted earnings per common share | $ | 0.30 | | | $ | 0.36 | | |
| Real estate related depreciation and amortization | 1.47 | | | 1.47 | | |
| Healthpeak's share of real estate related depreciation and amortization from unconsolidated joint ventures | 0.07 | | | 0.07 | | |
| Noncontrolling interests' share of real estate related depreciation and amortization | (0.02) | | | (0.02) | | |
| | | | |
| Loss (gain) on sales of depreciable real estate, net | (0.01) | | | (0.01) | | |
| | | | |
| | | | |
| | | | |
| Diluted Nareit FFO per common share | $ | 1.81 | | | $ | 1.87 | | |
| | | | |
| | | | |
| Other impairments (recoveries) and other losses (gains), net | (0.01) | | | (0.01) | | |
| Casualty-related charges (recoveries), net | 0.01 | | | 0.01 | | |
| Diluted FFO as Adjusted per common share | $ | 1.81 | | | $ | 1.87 | | |
| | | | |
| | | | |
| | | | |
| | | | |
| | | | |
| | | | |
| | | | |
| | | | |
______________________________________
(1)The foregoing projections reflect management's view of current and future market conditions as of April 24, 2025 including assumptions with respect to rental rates, occupancy levels, development items, and the earnings impact of the events referenced in our earnings press release that was issued on April 24, 2025. However, these projections do not reflect the impact of unannounced future transactions, except as described herein. Our actual results may differ materially from the projections set forth above. Except as otherwise required by law, management assumes no, and hereby disclaims any, obligation to update any of the foregoing projections as a result of new information or new or future developments.
In millions
For the projected year 2025 (low)
| | | | | | |
| Total Portfolio | |
| Net Income | $ | 243 | | |
| Real estate related depreciation and amortization | 1,031 | | |
| Loss (gain) on sales of depreciable real estate, net | (3) | | |
| Other impairments (recoveries) and other losses (gains), net | (4) | | |
| Other income, costs, and expense adjustments for Cash (Adjusted) NOI | 265 | | |
| Cash (Adjusted) NOI | $ | 1,532 | | |
| | |
| Merger-Combined non-SS Adjusted NOI | (124) | | |
Total Merger-Combined Same-Store Cash (Adjusted) NOI(2) | $ | 1,408 | | |
For the projected year 2025 (high)
| | | | | |
| Total Portfolio |
| Net Income | $ | 278 | |
| Real estate related depreciation and amortization | 1,031 | |
| Loss (gain) on sales of depreciable real estate, net | (3) | |
| Other impairments (recoveries) and other losses (gains), net | (4) | |
| Other income, costs, and expense adjustments for Cash (Adjusted) NOI | 247 | |
| Cash (Adjusted) NOI | $ | 1,550 | |
| |
| Merger-Combined non-SS Adjusted NOI | (128) | |
Total Merger-Combined Same-Store Cash (Adjusted) NOI(2) | $ | 1,422 | |
For the year-ended December 31, 2024
| | | | | |
| Total Portfolio |
| Net Income | $ | 267 | |
| Real estate related depreciation and amortization | 1,057 | |
| Loss (gain) on sales of depreciable real estate, net | (179) | |
| Other impairments (recoveries) and other losses (gains), net | 23 | |
| Other income, costs, and expense adjustments for Cash (Adjusted) NOI | 329 | |
| Cash (Adjusted) NOI | $ | 1,498 | |
| Pre-Merger legacy Physicians Realty Trust Adjusted NOI | 53 | |
| Merger-Combined non-SS Adjusted NOI | (183) | |
Total Merger-Combined Same-Store Cash (Adjusted) NOI(2) | $ | 1,367 | |
Projected Merger-Combined Cash Same-Store for the full year 2025
______________________________________
(1)The foregoing projections reflect management's view of current and future market conditions as of April 24, 2025 including assumptions with respect to rental rates, occupancy levels, development items, and the earnings impact of the events referenced in our earnings press release that was issued on April 24, 2025. However, these projections do not reflect the impact of unannounced future transactions, except as described herein. Our actual results may differ materially from the projections set forth above. Except as otherwise required by law, management assumes no, and hereby disclaims any, obligation to update any of the foregoing projections as a result of new information or new or future developments. May not foot or recalculate due to the rounding.
(2)Total Merger-Combined Same-Store Cash (Adjusted) NOI include the results from operations of the legacy Physicians Realty Trust properties that met the same-store definition as if they were owned by the Company for the entirety of the periods presented.
In thousands
| | | | | | | | | | | | | | | | | | | |
| | | | | | | | | | | | | | | March 31, 2025 |
Consolidated total assets(1) | | | | | | | | | | | | | | | $ | 19,815,729 | |
| Investments in and advances to unconsolidated joint ventures | | | | | | | | | | | | | | | (951,978) | |
| Accumulated depreciation and amortization of real estate | | | | | | | | | | | | | | | 4,240,220 | |
| Accumulated amortization of real estate intangibles | | | | | | | | | | | | | | | 714,975 | |
| Accumulated depreciation and amortization of real estate assets held for sale | | | | | | | | | | | | | | | 2,815 | |
| Consolidated Gross Assets | | | | | | | | | | | | | | | $ | 23,821,761 | |
| Healthpeak's share of unconsolidated joint venture gross assets | | | | | | | | | | | | | | | 1,398,455 | |
| Enterprise Gross Assets | | | | | | | | | | | | | | | $ | 25,220,216 | |
| | | | | | | | | | | | | | | |
| | | | | | | | | | | | | | | |
| | | | | | | | | | | | | | | |
| | | | | | | | | | | | | | | |
| | | | | | | | | | | | | | | |
| | | | | | | | | | | | | | | |
| | | | | | | | | | | | | | | |
| | | | | | | | | | | | | | | |
______________________________________
(1)Consolidated total assets represents total assets on the Consolidated Balance Sheet as of March 31, 2025 presented on page 8 within the Earnings Release and Supplemental Report for the quarter ended March 31, 2025.
In thousands
| | | | | | | | | | | | | | | | | | | | | | | | | | | | | |
| March 31, 2025 |
| Outpatient
Medical | | Lab | | CCRC | | Other | | Total |
| Net real estate | $ | 7,042,340 | | | $ | 7,192,472 | | | $ | 1,604,940 | | | $ | — | | | $ | 15,839,752 | |
| Real estate assets held for sale, net | 7,840 | | | — | | | — | | | — | | | 7,840 | |
| Intangible assets, net | 635,704 | | | 50,389 | | | 61,696 | | | — | | | 747,789 | |
| Accumulated depreciation and amortization of real estate | 2,092,332 | | | 1,692,885 | | | 455,003 | | | — | | | 4,240,220 | |
| | | | | | | | | |
| Accumulated amortization of real estate intangibles assets | 364,419 | | | 75,574 | | | 274,982 | | | — | | | 714,975 | |
| Accumulated depreciation and amortization of real estate assets held for sale | 2,815 | | | — | | | — | | | — | | | 2,815 | |
| Healthpeak's share of unconsolidated joint venture gross real estate assets | 237,182 | | | 583,825 | | | — | | | 482,876 | | | 1,303,883 | |
| Fully depreciated and amortized real estate and intangibles assets | 812,677 | | | 598,931 | | | 26,361 | | | — | | | 1,437,969 | |
| Leasing commissions and other | 182,637 | | | 111,779 | | | — | | | — | | | 294,416 | |
| Debt investments | — | | | — | | | — | | | 687,028 | | | 687,028 | |
| | | | | | | | | |
| Real estate intangible liabilities, gross | (241,567) | | | (190,922) | | | — | | | — | | | (432,489) | |
| Noncontrolling interests' share of consolidated joint venture real estate and related intangibles | (423,083) | | | — | | | — | | | — | | | (423,083) | |
| Portfolio Investment | $ | 10,713,296 | | | $ | 10,114,933 | | | $ | 2,422,982 | | | $ | 1,169,904 | | | $ | 24,421,115 | |
In thousands
| | | | | | | | | | | | | | | | | | | | | | | | | | | | | | | | |
| | Three Months Ended |
| | March 31,
2024 | | June 30,
2024 | | September 30,
2024 | | December 31,
2024 | | March 31,
2025 |
| Outpatient Medical | | $ | 238,272 | | | $ | 332,515 | | | $ | 317,659 | | | $ | 317,298 | | | $ | 320,548 | |
| Lab | | 223,761 | | | 214,266 | | | 225,592 | | | 217,833 | | | 217,593 | |
| CCRC | | 138,776 | | | 140,891 | | | 142,845 | | | 145,963 | | | 148,927 | |
| Other | | 5,059 | | | 6,878 | | | 13,126 | | | 15,199 | | | 14,332 | |
| Corporate Non-segment | | 692 | | | 954 | | | 1,175 | | | 1,695 | | | 1,489 | |
| | | | | | | | | | |
| | | | | | | | | | |
| Total revenues | | $ | 606,560 | | | $ | 695,504 | | | $ | 700,397 | | | $ | 697,988 | | | $ | 702,889 | |
| | | | | | | | | | |
| | | | | | | | | | |
| | | | | | | | | | |
| | | | | | | | | | |
| | | | | | | | | | |
| | | | | | | | | | |
| | | | | | | | | | |
| | | | | | | | | | |
| Outpatient Medical | | — | | | — | | | — | | | — | | | — | |
| Lab | | — | | | — | | | — | | | — | | | — | |
| CCRC | | — | | | — | | | — | | | — | | | — | |
| Other | | (5,059) | | | (6,878) | | | (13,126) | | | (15,199) | | | (14,332) | |
| Corporate Non-segment | | (692) | | | (954) | | | (1,175) | | | (1,695) | | | (1,489) | |
| | | | | | | | | | |
| | | | | | | | | | |
| Less: Interest income and other | | $ | (5,751) | | | $ | (7,832) | | | $ | (14,301) | | | $ | (16,894) | | | $ | (15,821) | |
| Outpatient Medical | | 2,739 | | | 6,903 | | | 7,065 | | | 7,334 | | | 7,259 | |
| Lab | | 4,861 | | | 4,301 | | | 5,242 | | | 5,329 | | | 2,800 | |
| CCRC | | — | | | — | | | — | | | — | | | — | |
| Other | | 21,533 | | | 21,378 | | | 21,886 | | | 21,845 | | | 22,459 | |
| Corporate Non-segment | | — | | | — | | | — | | | — | | | — | |
| | | | | | | | | | |
| | | | | | | | | | |
| Healthpeak's share of unconsolidated joint venture real estate revenues | | $ | 29,133 | | | $ | 32,582 | | | $ | 34,193 | | | $ | 34,508 | | | $ | 32,518 | |
| | | | | | | | | | |
| | | | | | | | | | |
| | | | | | | | | | |
| | | | | | | | | | |
| | | | | | | | | | |
| | | | | | | | | | |
| | | | | | | | | | |
| | | | | | | | | | |
| Outpatient Medical | | (8,876) | | | (9,341) | | | (9,734) | | | (9,692) | | | (9,973) | |
| Lab | | (163) | | | (33) | | | — | | | — | | | — | |
| CCRC | | — | | | — | | | — | | | — | | | — | |
| Other | | — | | | — | | | — | | | — | | | — | |
| Corporate Non-segment | | — | | | — | | | — | | | — | | | — | |
| | | | | | | | | | |
| | | | | | | | | | |
| Noncontrolling interests' share of consolidated joint venture real estate revenues | | $ | (9,039) | | | $ | (9,374) | | | $ | (9,734) | | | $ | (9,692) | | | $ | (9,973) | |
| | | | | | | | | | |
| | | | | | | | | | |
| | | | | | | | | | |
| | | | | | | | | | |
| | | | | | | | | | |
| | | | | | | | | | |
| | | | | | | | | | |
| | | | | | | | | | |
| | | | | | | | | | |
| | | | | | | | | | |
| | | | | | | | | | |
| | | | | | | | | | |
| | | | | | | | | | |
| | | | | | | | | | |
| | | | | | | | | | |
| | | | | | | | | | |
| Outpatient Medical | | (7,011) | | | (12,101) | | | (12,761) | | | (13,181) | | | (13,426) | |
| Lab | | (21,127) | | | (12,988) | | | (16,647) | | | (12,550) | | | (14,557) | |
| CCRC | | 1 | | | (1) | | | — | | | — | | | — | |
| Other | | (56) | | | (18) | | | (71) | | | (94) | | | (7) | |
| Corporate Non-segment | | — | | | — | | | — | | | — | | | — | |
| | | | | | | | | | |
| | | | | | | | | | |
| Non-cash adjustments to real estate revenues | | $ | (28,193) | | | $ | (25,108) | | | $ | (29,479) | | | $ | (25,825) | | | $ | (27,990) | |
| Outpatient Medical | | 225,124 | | | 317,976 | | | 302,229 | | | 301,759 | | | 304,408 | |
| Lab | | 207,332 | | | 205,546 | | | 214,187 | | | 210,612 | | | 205,836 | |
| CCRC | | 138,777 | | | 140,890 | | | 142,845 | | | 145,963 | | | 148,927 | |
| Other | | 21,477 | | | 21,360 | | | 21,815 | | | 21,751 | | | 22,452 | |
| Corporate Non-segment | | — | | | — | | | — | | | — | | | — | |
| | | | | | | | | | |
| | | | | | | | | | |
Portfolio Cash Real Estate Revenues(1) | | $ | 592,710 | | | $ | 685,772 | | | $ | 681,076 | | | $ | 680,085 | | | $ | 681,623 | |
Continued
In thousands
| | | | | | | | | | | | | | | | | | | | | | | | | | | | | | | | |
| | Three Months Ended |
| | March 31,
2024 | | June 30,
2024 | | September 30,
2024 | | December 31,
2024 | | March 31,
2025 |
| | | | | | | | | | |
| | | | | | | | | | |
| | | | | | | | | | |
| | | | | | | | | | |
| | | | | | | | | | |
| | | | | | | | | | |
| | | | | | | | | | |
| | | | | | | | | | |
| | | | | | | | | | |
| | | | | | | | | | |
| | | | | | | | | | |
| | | | | | | | | | |
| | | | | | | | | | |
| | | | | | | | | | |
| | | | | | | | | | |
| | | | | | | | | | |
| | | | | | | | | | |
| | | | | | | | | | |
| | | | | | | | | | |
| | | | | | | | | | |
| | | | | | | | | | |
| | | | | | | | | | |
| | | | | | | | | | |
| | | | | | | | | | |
| | | | | | | | | | |
| | | | | | | | | | |
| | | | | | | | | | |
| | | | | | | | | | |
| | | | | | | | | | |
| | | | | | | | | | |
| | | | | | | | | | |
| | | | | | | | | | |
| Outpatient Medical | | $ | 90,529 | | | $ | — | | | $ | — | | | $ | — | | | $ | — | |
| Lab | | — | | | — | | | — | | | — | | | — | |
| CCRC | | — | | | — | | | — | | | — | | | — | |
| Other | | — | | | — | | | — | | | — | | | — | |
| Corporate Non-segment | | — | | | — | | | — | | | — | | | — | |
| | | | | | | | | | |
| | | | | | | | | | |
| Pre-Merger legacy Physicians Realty Trust Cash Real Estate Revenue | | $ | 90,529 | | | $ | — | | | $ | — | | | $ | — | | | $ | — | |
| Outpatient Medical | | (32,107) | | | (31,648) | | | (12,733) | | | (9,767) | | | (9,100) | |
| Lab | | (44,462) | | | (36,570) | | | (38,710) | | | (36,818) | | | (32,881) | |
| CCRC | | (1) | | | — | | | 1 | | | — | | | — | |
| Other | | (21,477) | | | (21,360) | | | (21,815) | | | (21,751) | | | (22,452) | |
| Corporate Non-segment | | — | | | — | | | — | | | — | | | — | |
| | | | | | | | | | |
| | | | | | | | | | |
| Merger-Combined non-SS Cash Real Estate Revenues | | $ | (98,047) | | | $ | (89,578) | | | $ | (73,257) | | | $ | (68,336) | | | $ | (64,433) | |
| Outpatient Medical | | 283,546 | | | 286,328 | | | 289,496 | | | 291,992 | | | 295,308 | |
| Lab | | 162,870 | | | 168,976 | | | 175,477 | | | 173,794 | | | 172,955 | |
| CCRC | | 138,776 | | | 140,890 | | | 142,846 | | | 145,963 | | | 148,927 | |
| Other | | — | | | — | | | — | | | — | | | — | |
| Corporate Non-segment | | — | | | — | | | — | | | — | | | — | |
| | | | | | | | | | |
| | | | | | | | | | |
Merger-Combined SS Cash Real Estate Revenues(3) | | $ | 585,192 | | | $ | 596,194 | | | $ | 607,819 | | | $ | 611,749 | | | $ | 617,190 | |
In thousands
| | | | | | | | | | | | | | | | | | | | | | | | | | | | | | | | |
| | Three Months Ended |
| | March 31,
2024 | | June 30,
2024 | | September 30,
2024 | | December 31,
2024 | | March 31,
2025 |
| Outpatient Medical | | $ | 81,268 | | | $ | 111,702 | | | $ | 106,484 | | | $ | 106,539 | | | $ | 105,226 | |
| Lab | | 56,840 | | | 56,656 | | | 64,075 | | | 62,049 | | | 57,658 | |
| CCRC | | 105,621 | | | 105,469 | | | 109,720 | | | 108,438 | | | 110,259 | |
| Other | | — | | | — | | | — | | | — | | | — | |
| Corporate Non-segment | | — | | | — | | | — | | | — | | | — | |
| | | | | | | | | | |
| | | | | | | | | | |
| Operating expenses | | $ | 243,729 | | | $ | 273,827 | | | $ | 280,279 | | | $ | 277,026 | | | $ | 273,143 | |
| Outpatient Medical | | 1,083 | | | 2,464 | | | 2,832 | | | 2,655 | | | 2,994 | |
| Lab | | 1,324 | | | 1,528 | | | 1,811 | | | 1,703 | | | 1,666 | |
| CCRC | | — | | | — | | | — | | | — | | | — | |
| Other | | 16,099 | | | 15,790 | | | 16,226 | | | 16,224 | | | 16,324 | |
| Corporate Non-segment | | — | | | — | | | — | | | — | | | — | |
| | | | | | | | | | |
| | | | | | | | | | |
| Healthpeak's share of unconsolidated joint venture operating expenses | | $ | 18,506 | | | $ | 19,782 | | | $ | 20,869 | | | $ | 20,582 | | | $ | 20,984 | |
| Outpatient Medical | | (2,430) | | | (2,609) | | | (2,851) | | | (2,692) | | | (2,778) | |
| Lab | | (43) | | | (9) | | | — | | | — | | | — | |
| CCRC | | — | | | — | | | — | | | — | | | — | |
| Other | | — | | | — | | | — | | | — | | | — | |
| Corporate Non-segment | | — | | | — | | | — | | | — | | | — | |
| | | | | | | | | | |
| | | | | | | | | | |
| Noncontrolling interests' share of consolidated joint venture operating expenses | | $ | (2,473) | | | $ | (2,618) | | | $ | (2,851) | | | $ | (2,692) | | | $ | (2,778) | |
| | | | | | | | | | |
| | | | | | | | | | |
| | | | | | | | | | |
| | | | | | | | | | |
| | | | | | | | | | |
| | | | | | | | | | |
| | | | | | | | | | |
| | | | | | | | | | |
| | | | | | | | | | |
| | | | | | | | | | |
| | | | | | | | | | |
| | | | | | | | | | |
| | | | | | | | | | |
| | | | | | | | | | |
| | | | | | | | | | |
| | | | | | | | | | |
| Outpatient Medical | | (884) | | | (1,671) | | | (1,741) | | | (1,791) | | | (1,344) | |
| Lab | | 308 | | | 301 | | | 253 | | | 275 | | | 279 | |
| CCRC | | 1 | | | 1,738 | | | (95) | | | 1,479 | | | — | |
| Other | | (9) | | | (244) | | | 3 | | | (88) | | | (11) | |
| Corporate Non-segment | | — | | | — | | | — | | | — | | | — | |
| | | | | | | | | | |
| | | | | | | | | | |
| Non-cash adjustments to operating expenses | | $ | (584) | | | $ | 124 | | | $ | (1,580) | | | $ | (125) | | | $ | (1,076) | |
| Outpatient Medical | | 79,037 | | | 109,886 | | | 104,724 | | | 104,711 | | | 104,097 | |
| Lab | | 58,429 | | | 58,476 | | | 66,139 | | | 64,027 | | | 59,603 | |
| CCRC | | 105,622 | | | 107,207 | | | 109,625 | | | 109,917 | | | 110,260 | |
| Other | | 16,090 | | | 15,546 | | | 16,229 | | | 16,136 | | | 16,313 | |
| Corporate Non-segment | | — | | | — | | | — | | | — | | | — | |
| | | | | | | | | | |
| | | | | | | | | | |
Portfolio Cash Operating Expenses(2) | | $ | 259,178 | | | $ | 291,115 | | | $ | 296,717 | | | $ | 294,791 | | | $ | 290,273 | |
| Outpatient Medical | | 29,131 | | | — | | | — | | | — | | | — | |
| Lab | | — | | | — | | | — | | | — | | | — | |
| CCRC | | — | | | — | | | — | | | — | | | — | |
| Other | | — | | | — | | | — | | | — | | | — | |
| Corporate Non-segment | | — | | | — | | | — | | | — | | | — | |
| | | | | | | | | | |
| | | | | | | | | | |
| Pre-Merger legacy Physicians Realty Trust Cash Operating Expenses | | $ | 29,131 | | | $ | — | | | $ | — | | | $ | — | | | $ | — | |
Continued
In thousands
| | | | | | | | | | | | | | | | | | | | | | | | | | | | | | | | |
| | Three Months Ended |
| | March 31,
2024 | | June 30,
2024 | | September 30,
2024 | | December 31,
2024 | | March 31,
2025 |
| | | | | | | | | | |
| | | | | | | | | | |
| | | | | | | | | | |
| | | | | | | | | | |
| | | | | | | | | | |
| | | | | | | | | | |
| | | | | | | | | | |
| | | | | | | | | | |
| | | | | | | | | | |
| | | | | | | | | | |
| | | | | | | | | | |
| | | | | | | | | | |
| | | | | | | | | | |
| | | | | | | | | | |
| | | | | | | | | | |
| | | | | | | | | | |
| | | | | | | | | | |
| | | | | | | | | | |
| | | | | | | | | | |
| | | | | | | | | | |
| | | | | | | | | | |
| | | | | | | | | | |
| | | | | | | | | | |
| | | | | | | | | | |
| | | | | | | | | | |
| | | | | | | | | | |
| | | | | | | | | | |
| | | | | | | | | | |
| | | | | | | | | | |
| | | | | | | | | | |
| | | | | | | | | | |
| | | | | | | | | | |
| Outpatient Medical | | $ | (11,764) | | | $ | (12,738) | | | $ | (7,062) | | | $ | (4,700) | | | $ | (5,322) | |
| Lab | | (11,638) | | | (11,320) | | | (12,746) | | | (13,808) | | | (11,686) | |
| CCRC | | (551) | | | (356) | | | (556) | | | (546) | | | (396) | |
| Other | | (16,090) | | | (15,546) | | | (16,229) | | | (16,136) | | | (16,313) | |
| Corporate Non-segment | | — | | | — | | | — | | | — | | | — | |
| | | | | | | | | | |
| | | | | | | | | | |
| Merger-Combined non-SS Cash Operating Expenses | | $ | (40,043) | | | $ | (39,960) | | | $ | (36,593) | | | $ | (35,190) | | | $ | (33,717) | |
| Outpatient Medical | | 96,404 | | | 97,148 | | | 97,662 | | | 100,011 | | | 98,775 | |
| Lab | | 46,791 | | | 47,156 | | | 53,393 | | | 50,219 | | | 47,917 | |
| CCRC | | 105,071 | | | 106,851 | | | 109,069 | | | 109,371 | | | 109,864 | |
| Other | | — | | | — | | | — | | | — | | | — | |
| Corporate Non-segment | | — | | | — | | | — | | | — | | | — | |
| | | | | | | | | | |
| | | | | | | | | | |
Merger-Combined SS Cash Operating Expenses(3) | | $ | 248,266 | | | $ | 251,155 | | | $ | 260,124 | | | $ | 259,601 | | | $ | 256,556 | |
______________________________________
(1)Portfolio Cash Real Estate Revenues eliminates the effects of straight-line rents, amortization of market lease intangibles, lease termination fees, and the impact of deferred community fee income.
(2)Portfolio Cash Operating Expenses eliminates the effects of straight-line rents, lease termination fees, actuarial reserves for insurance claims that have been incurred but not reported, and the impact of deferred community fees expense.
(3)Merger-Combined Same-Store Cash Real Estate Revenues and Merger-Combined Same-Store Cash Operating Expenses include the results from operations of the legacy Physicians Realty Trust properties that met the same-store definition as if they were owned by the Company for the entirety of the periods presented.
| | |
| Segment Portfolio NOI and Cash (Adjusted) NOI, Portfolio Income, and SS |
In thousands
| | | | | | | | | | | | | | | | | | | | | | | | | | | | | | | | |
| Total Portfolio | | Three Months Ended |
| | | March 31,
2024 | | June 30,
2024 | | September 30,
2024 | | December 31,
2024 | | March 31,
2025 |
| Net income (loss) | | $ | 11,177 | | | $ | 152,716 | | | $ | 92,738 | | | $ | 10,672 | | | $ | 50,064 | |
| | | | | | | | | | |
| | | | | | | | | | |
| Interest income and other | | (5,751) | | | (7,832) | | | (14,301) | | | (16,894) | | | (15,821) | |
| Interest expense | | 60,907 | | | 74,910 | | | 74,105 | | | 70,508 | | | 72,693 | |
| Depreciation and amortization | | 219,219 | | | 283,498 | | | 280,019 | | | 274,469 | | | 268,546 | |
| General and administrative | | 23,299 | | | 26,718 | | | 23,216 | | | 23,929 | | | 26,118 | |
| Transaction and merger-related costs | | 107,220 | | | 7,759 | | | 7,134 | | | 10,572 | | | 5,534 | |
| Impairments and loan loss reserves, net | | 11,458 | | | (553) | | | 441 | | | 11,632 | | | (3,562) | |
| (Gain) loss on sales of real estate, net | | (3,255) | | | (122,044) | | | (62,325) | | | 8,929 | | | — | |
| | | | | | | | | | |
| Other (income) expense, net | | (78,516) | | | (4,004) | | | (982) | | | 24,157 | | | 6,126 | |
| | | | | | | | | | |
| Income tax (benefit) expense | | 13,698 | | | 2,728 | | | 1,938 | | | (14,014) | | | 2,080 | |
| Equity (income) loss from unconsolidated joint ventures | | (2,376) | | | (51) | | | 3,834 | | | 108 | | | 2,147 | |
| Healthpeak's share of unconsolidated joint venture NOI | | 10,627 | | | 12,800 | | | 13,324 | | | 13,926 | | | 11,534 | |
| Noncontrolling interests' share of consolidated joint venture NOI | | (6,566) | | | (6,756) | | | (6,883) | | | (7,000) | | | (7,195) | |
| | | | | | | | | | |
| | | | | | | | | | |
Adjustments to NOI(1) | | (27,609) | | | (25,232) | | | (27,899) | | | (25,700) | | | (26,914) | |
| Portfolio Adjusted NOI | | $ | 333,532 | | | $ | 394,657 | | | $ | 384,359 | | | $ | 385,294 | | | $ | 391,350 | |
| | | | | | | | | | |
| | | | | | | | | | |
| | | | | | | | | | |
| | | | | | | | | | |
| | | | | | | | | | |
| | | | | | | | | | |
| | | | | | | | | | |
| | | | | | | | | | |
| | | | | | | | | | |
| Pre-Merger legacy Physicians Realty Trust Adjusted NOI | | 61,398 | | | — | | | — | | | — | | | — | |
| Merger-Combined non-SS Adjusted NOI | | (58,004) | | | (49,618) | | | (36,664) | | | (33,146) | | | (30,716) | |
Merger-Combined SS Adjusted NOI(2) | | $ | 336,926 | | | $ | 345,039 | | | $ | 347,695 | | | $ | 352,148 | | | $ | 360,634 | |
| | | | | | | | | | | | | | | | | | | | | | | | | | | | | | | | |
Outpatient Medical | | Three Months Ended |
| | | March 31,
2024 | | June 30,
2024 | | September 30,
2024 | | December 31,
2024 | | March 31,
2025 |
| Net income (loss) | | $ | 49,684 | | | $ | 108,586 | | | $ | 94,960 | | | $ | 32,066 | | | $ | 51,216 | |
| | | | | | | | | | |
| | | | | | | | | | |
| | | | | | | | | | |
| Interest expense | | 3,131 | | | 4,070 | | | 4,268 | | | 3,686 | | | 3,573 | |
| Depreciation and amortization | | 106,292 | | | 173,408 | | | 168,120 | | | 162,592 | | | 157,131 | |
| | | | | | | | | | |
| Transaction and merger-related costs | | 113 | | | 41 | | | 889 | | | 1,137 | | | 248 | |
| Impairments and loan loss reserves, net | | — | | | — | | | — | | | 13,118 | | | — | |
| (Gain) loss on sales of real estate, net | | (3,255) | | | (66,831) | | | (62,325) | | | (5,832) | | | — | |
| Other (income) expense, net | | (71) | | | (1,383) | | | 78 | | | 1,122 | | | (49) | |
| | | | | | | | | | |
| | | | | | | | | | |
| Equity (income) loss from unconsolidated joint ventures | | 1,110 | | | 2,922 | | | 5,185 | | | 2,870 | | | 3,204 | |
| Healthpeak's share of unconsolidated joint venture NOI | | 1,656 | | | 4,439 | | | 4,233 | | | 4,679 | | | 4,265 | |
| Noncontrolling interests' share of consolidated joint venture NOI | | (6,446) | | | (6,732) | | | (6,883) | | | (7,000) | | | (7,195) | |
| | | | | | | | | | |
Adjustments to NOI(1) | | (6,127) | | | (10,430) | | | (11,020) | | | (11,390) | | | (12,082) | |
| Portfolio Adjusted NOI | | $ | 146,087 | | | $ | 208,090 | | | $ | 197,505 | | | $ | 197,048 | | | $ | 200,311 | |
| | | | | | | | | | |
| | | | | | | | | | |
| | | | | | | | | | |
| | | | | | | | | | |
| | | | | | | | | | |
| | | | | | | | | | |
| | | | | | | | | | |
| | | | | | | | | | |
| | | | | | | | | | |
| Pre-Merger legacy Physicians Realty Trust Adjusted NOI | | 61,398 | | | — | | | — | | | — | | | — | |
| Merger-Combined non-SS Adjusted NOI | | (20,343) | | | (18,910) | | | (5,671) | | | (5,067) | | | (3,778) | |
Merger-Combined SS Adjusted NOI(2) | | $ | 187,142 | | | $ | 189,180 | | | $ | 191,834 | | | $ | 191,981 | | | $ | 196,533 | |
Continued
| | |
| Segment Portfolio NOI and Cash (Adjusted) NOI, Portfolio Income, and SS |
In thousands
| | | | | | | | | | | | | | | | | | | | | | | | | | | | | | | | |
| Lab | Three Months Ended |
| | | March 31,
2024 | | June 30,
2024 | | September 30,
2024 | | December 31,
2024 | | March 31,
2025 |
| Net income (loss) | | $ | 169,798 | | | $ | 138,830 | | | $ | 85,240 | | | $ | 83,305 | | | $ | 80,403 | |
| | | | | | | | | | |
| | | | | | | | | | |
| | | | | | | | | | |
| | | | | | | | | | |
| Depreciation and amortization | | 78,908 | | | 75,947 | | | 77,625 | | | 77,127 | | | 78,616 | |
| | | | | | | | | | |
| Transaction and merger-related costs | | 9 | | | 478 | | | 4 | | | 12 | | | 337 | |
| | | | | | | | | | |
| (Gain) loss on sales of real estate, net | | — | | | (55,213) | | | — | | | (298) | | | — | |
| Other (income) expense, net | | (78,983) | | | (185) | | | 402 | | | (2,496) | | | (13) | |
| | | | | | | | | | |
| | | | | | | | | | |
| Equity (income) loss from unconsolidated joint ventures | | (2,811) | | | (2,247) | | | (1,754) | | | (1,866) | | | 592 | |
| Healthpeak's share of unconsolidated joint venture NOI | | 3,537 | | | 2,773 | | | 3,431 | | | 3,626 | | | 1,134 | |
| Noncontrolling interests' share of consolidated joint venture NOI | | (120) | | | (24) | | | — | | | — | | | — | |
| | | | | | | | | | |
Adjustments to NOI(1) | | (21,435) | | | (13,289) | | | (16,900) | | | (12,825) | | | (14,836) | |
| Portfolio Adjusted NOI | | $ | 148,903 | | | $ | 147,070 | | | $ | 148,048 | | | $ | 146,585 | | | $ | 146,233 | |
| | | | | | | | | | |
| | | | | | | | | | |
| | | | | | | | | | |
| | | | | | | | | | |
| | | | | | | | | | |
| | | | | | | | | | |
| | | | | | | | | | |
| | | | | | | | | | |
| | | | | | | | | | |
| | | | | | | | | | |
| Merger-Combined non-SS Adjusted NOI | | (32,824) | | | (25,250) | | | (25,964) | | | (23,010) | | | (21,195) | |
Merger-Combined SS Adjusted NOI(2) | | $ | 116,079 | | | $ | 121,820 | | | $ | 122,084 | | | $ | 123,575 | | | $ | 125,038 | |
| | | | | | | | | | | | | | | | | | | | | | | | | | | | | | | | |
| CCRC | | Three Months Ended |
| | | March 31,
2024 | | June 30,
2024 | | September 30,
2024 | | December 31,
2024 | | March 31,
2025 |
| Net income (loss) | | $ | (2,172) | | | $ | (160) | | | $ | (2,827) | | | $ | (25,978) | | | $ | (1,679) | |
| | | | | | | | | | |
| | | | | | | | | | |
| | | | | | | | | | |
| Interest expense | | 996 | | | 984 | | | 984 | | | 978 | | | 948 | |
| Depreciation and amortization | | 34,019 | | | 34,143 | | | 34,274 | | | 34,750 | | | 32,799 | |
| | | | | | | | | | |
| Transaction and merger-related costs | | 73 | | | (24) | | | — | | | 11 | | | 14 | |
| | | | | | | | | | |
| Other (income) expense, net | | 239 | | | 479 | | | 694 | | | 27,764 | | | 6,585 | |
| | | | | | | | | | |
| | | | | | | | | | |
| | | | | | | | | | |
| | | | | | | | | | |
| | | | | | | | | | |
| | | | | | | | | | |
Adjustments to NOI(1) | | — | | | (1,739) | | | 95 | | | (1,479) | | | — | |
| Portfolio Adjusted NOI | | $ | 33,155 | | | $ | 33,683 | | | $ | 33,220 | | | $ | 36,046 | | | $ | 38,667 | |
| | | | | | | | | | |
| | | | | | | | | | |
| | | | | | | | | | |
| | | | | | | | | | |
| | | | | | | | | | |
| | | | | | | | | | |
| | | | | | | | | | |
| | | | | | | | | | |
| | | | | | | | | | |
| | | | | | | | | | |
| Merger-Combined non-SS Adjusted NOI | | 550 | | | 356 | | | 557 | | | 546 | | | 396 | |
Merger-Combined SS Adjusted NOI(2) | | $ | 33,705 | | | $ | 34,039 | | | $ | 33,777 | | | $ | 36,592 | | | $ | 39,063 | |
| | | | | | | | | | | | | | | | | | | | | | | | | | | | | | | | |
| Other | | Three Months Ended |
| | | March 31,
2024 | | June 30,
2024 | | September 30,
2024 | | December 31,
2024 | | March 31,
2025 |
| Net income (loss) | | $ | (5,724) | | | $ | 8,195 | | | $ | 12,282 | | | $ | 2,522 | | | $ | 19,004 | |
| | | | | | | | | | |
| | | | | | | | | | |
| Interest income and other | | (5,059) | | | (6,878) | | | (13,126) | | | (15,199) | | | (14,332) | |
| | | | | | | | | | |
| | | | | | | | | | |
| | | | | | | | | | |
| Transaction and merger-related costs | | — | | | — | | | — | | | — | | | 433 | |
| Impairments and loan loss reserves, net | | 11,458 | | | (553) | | | 441 | | | (1,486) | | | (3,562) | |
| (Gain) loss on sales of real estate, net | | — | | | — | | | — | | | 15,059 | | | — | |
| Other (income) expense, net | | — | | | (38) | | | — | | | — | | | 106 | |
| | | | | | | | | | |
| | | | | | | | | | |
| Equity (income) loss from unconsolidated joint ventures | | (675) | | | (726) | | | 403 | | | (896) | | | (1,649) | |
| Healthpeak's share of unconsolidated joint venture NOI | | 5,434 | | | 5,588 | | | 5,660 | | | 5,621 | | | 6,135 | |
| | | | | | | | | | |
| | | | | | | | | | |
Adjustments to NOI(1) | | (47) | | | 226 | | | (74) | | | (6) | | | 4 | |
| Portfolio Adjusted NOI | | $ | 5,387 | | | $ | 5,814 | | | $ | 5,586 | | | $ | 5,615 | | | $ | 6,139 | |
| | | | | | | | | | |
| | | | | | | | | | |
| | | | | | | | | | |
| | | | | | | | | | |
| | | | | | | | | | |
| | | | | | | | | | |
| | | | | | | | | | |
| | | | | | | | | | |
| | | | | | | | | | |
| | | | | | | | | | |
| Merger-Combined non-SS Adjusted NOI | | (5,387) | | | (5,814) | | | (5,586) | | | (5,615) | | | (6,139) | |
Merger-Combined SS Adjusted NOI(2) | | $ | — | | | $ | — | | | $ | — | | | $ | — | | | $ | — | |
Continued
| | |
| Segment Portfolio NOI and Cash (Adjusted) NOI, Portfolio Income, and SS |
In thousands
| | | | | | | | | | | | | | | | | | | | | | | | | | | | | | | | |
Corporate Non-Segment | Three Months Ended |
| | | March 31,
2024 | | June 30,
2024 | | September 30,
2024 | | December 31,
2024 | | March 31,
2025 |
| Net income (loss) | | $ | (200,409) | | | $ | (102,735) | | | $ | (96,917) | | | $ | (81,243) | | | $ | (98,880) | |
| | | | | | | | | | |
| | | | | | | | | | |
| Interest income and other | | (692) | | | (954) | | | (1,175) | | | (1,695) | | | (1,489) | |
| Interest expense | | 56,780 | | | 69,856 | | | 68,853 | | | 65,844 | | | 68,172 | |
| | | | | | | | | | |
| General and administrative | | 23,299 | | | 26,718 | | | 23,216 | | | 23,929 | | | 26,118 | |
| Transaction and merger-related costs | | 107,025 | | | 7,264 | | | 6,241 | | | 9,412 | | | 4,502 | |
| | | | | | | | | | |
| Other (income) expense, net | | 299 | | | (2,877) | | | (2,156) | | | (2,233) | | | (503) | |
| Income tax (benefit) expense | | 13,698 | | | 2,728 | | | 1,938 | | | (14,014) | | | 2,080 | |
| | | | | | | | | | |
| | | | | | | | | | |
| | | | | | | | | | |
| | | | | | | | | | |
| | | | | | | | | | |
| | | | | | | | | | |
| | | | | | | | | | |
| | | | | | | | | | |
| | | | | | | | | | |
| | | | | | | | | | |
| | | | | | | | | | |
| | | | | | | | | | |
| | | | | | | | | | |
| | | | | | | | | | |
| | | | | | | | | | |
Merger-Combined SS Adjusted NOI(2) | | $ | — | | | $ | — | | | $ | — | | | $ | — | | | $ | — | |
______________________________________
(1)Adjustments to NOI eliminates the effects of straight-line rents, amortization of market lease intangibles, lease termination fees, the impact of deferred community fee income, actuarial reserves for insurance claims that have been incurred but not reported, and the impact of deferred community fees expense.
(2)Merger-Combined Same-Store Adjusted NOI include the results from operations of the legacy Physicians Realty Trust properties that met the same-store definition as if they were owned by the Company for the entirety of the periods presented.
| | |
| Property Count Reconciliations |
| | | | | | | | | | | | | | | | | | | | | | | | | | | | | |
| As of March 31, 2025 | | |
| Property Count Reconciliation |
| Outpatient
Medical | | Lab | | CCRC | | Other | | Total |
| Prior Quarter Total Property Count | 524 | | 139 | | 15 | | 19 | | 697 |
| Acquisitions | 3 | | — | | — | | — | | 3 |
| | | | | | | | | |
| | | | | | | | | |
| | | | | | | | | |
| | | | | | | | | |
| | | | | | | | | |
| | | | | | | | | |
| | | | | | | | | |
| Current Quarter Total Property Count | 527 | | 139 | | 15 | | 19 | | 700 |
| Recent acquisitions | (3) | | — | | — | | — | | (3) |
| Assets in Development | (5) | | (4) | | — | | — | | (9) |
| Recently completed Developments | (3) | | — | | — | | — | | (3) |
| | | | | | | | | |
| Assets in Redevelopment | (1) | | (26) | | — | | — | | (27) |
| Recently completed Redevelopments | — | | (2) | | — | | — | | (2) |
| Assets held for sale | (1) | | — | | — | | — | | (1) |
| | | | | | | | | |
| Segment exclusions | — | | — | | — | | (19) | | (19) |
| | | | | | | | | |
| Significant tenant relocation | — | | (1) | | — | | — | | (1) |
| | | | | | | | | |
| | | | | | | | | |
| Three-Month SS Property Count | 514 | | 106 | | 15 | | — | | 635 |
| | | | | | | | | |
| | | | | | | | | |
| | | | | | | | | |
| | | | | | | | | |
| | | | | | | | | |
| | | | | | | | | |
| | | | | | | | | |
| | | | | | | | | |
| | | | | | | | | |
| | | | | | | | | |
| | | | | | | | | | | | | | | | | | | | | | | | | | | | | |
| Sequential SS |
| Outpatient
Medical | | Lab | | CCRC | | Other | | Total |
| Prior Quarter Three-Month SS Property Count | 512 | | 107 | | 15 | | — | | 634 |
| | | | | | | | | |
| Acquisitions | 2 | | — | | — | | — | | 2 |
| | | | | | | | | |
| Assets in Redevelopment | (1) | | (2) | | — | | — | | (3) |
| Prior Development/Redevelopment | 1 | | 1 | | — | | — | | 2 |
| | | | | | | | | |
| | | | | | | | | |
| | | | | | | | | |
| | | | | | | | | |
| | | | | | | | | |
| | | | | | | | | |
| | | | | | | | | |
| | | | | | | | | |
| | | | | | | | | |
| Current Quarter Three-Month SS Property Count | 514 | | 106 | | 15 | | — | | 635 |
| | |
| Common Stock and Equivalents |
In thousands | | | | | | | | | | | | | | | | | | | | | | | | | | | | | | | | | | | | | |
| | | Weighted Average Shares | | |
| | | Three Months Ended
March 31, 2025 | | |
| Shares Outstanding
March 31, 2025 | | Diluted EPS | | Diluted Nareit FFO | | Diluted FFO as Adjusted | | Diluted AFFO | | | | | | | | |
| Common stock | 698,612 | | | 699,067 | | | 699,067 | | | 699,067 | | | 699,067 | | | | | | | | | |
Common stock equivalent securities(1): | | | | | | | | | | | | | | | | | |
| Restricted stock units | 620 | | | 51 | | | 51 | | | 51 | | | 51 | | | | | | | | | |
| | | | | | | | | | | | | | | | | |
| | | | | | | | | | | | | | | | | |
| OP units | 4,770 | | | — | | | 1,561 | | | 1,561 | | | 1,561 | | | | | | | | | |
| Convertible partnership units | 13,475 | | | — | | | 13,495 | | | 13,495 | | | 13,495 | | | | | | | | | |
| Total common stock and equivalents | 717,477 | | | 699,118 | | | 714,174 | | | 714,174 | | | 714,174 | | | | | | | | | |
______________________________________
(1)The weighted average shares for the three months ended March 31, 2025 represent the current dilutive impact, using the treasury stock method, of approximately 1 million restricted stock units, 4.8 million OP Units, and 13.5 million DownREIT units.
| | |
| Net Income to Adjusted EBITDAre |
In thousands
| | | | | | | | |
| Three Months Ended
March 31, 2025 | | | |
| Net income (loss) | $ | 50,064 | | | | |
| Interest expense | 72,693 | | | | |
| Income tax expense (benefit) | 2,080 | | | | |
| Depreciation and amortization | 268,546 | | | | |
| Other depreciation and amortization | 983 | | | | |
| | | | |
| | | | |
| | | | |
| Share of unconsolidated JV: | | | | |
| Interest expense | 3,879 | | | | |
| Income tax expense (benefit) | 306 | | | | |
| Depreciation and amortization | 12,200 | | | | |
| | | | |
| | | | |
| EBITDAre | $ | 410,751 | | | | |
| Transaction and merger-related items | 5,534 | | | | |
| Other impairments (recoveries) and other losses (gains) | (3,320) | | | | |
| | | | |
| | | | |
| | | | |
| Casualty-related charges (recoveries) | 5,850 | | | | |
| CCRC entrance fees | 4,696 | | | | |
| Stock-based compensation amortization expense | 4,627 | | | | |
Impact of transactions closed during the period(1) | 182 | | | | |
| Adjusted EBITDAre | $ | 428,320 | | | | |
Impact of transactions closed during the period(1) | (182) | | | | |
Fixed Charge Coverage Adjusted EBITDAre(2) | $ | 428,138 | | | | |
| | |
| Adjusted Fixed Charge Coverage |
In thousands
| | | | | | | |
| Three Months Ended
March 31, 2025 | | |
| Interest expense, including unconsolidated JV interest expense at share | $ | 76,572 | | | |
| Capitalized interest, including unconsolidated JV capitalized interest at share | 20,031 | | | |
| Fixed Charges | $ | 96,603 | | | |
| | | |
Adjusted Fixed Charge Coverage(2) | 4.4x | | |
______________________________________
(1)Adjustment reflects the impact of transactions that occurred during the period as if the transactions occurred at the beginning of the period.
(2)Fixed Charge Coverage Adjusted EBITDAre is utilized in the calculation of Adjusted Fixed Charge Coverage and excludes the impact of transactions that occurred during the period for consistency with the calculation of Fixed Charges.
| | |
| Enterprise Debt and Net Debt |
In thousands
| | | | | |
| March 31, 2025 |
| Bank line of credit and commercial paper | $ | 164,000 | |
| Term loans | 1,646,335 | |
| Senior unsecured notes | 6,714,279 | |
| Mortgage debt | 352,051 | |
| Consolidated Debt | $ | 8,876,665 | |
| Share of unconsolidated JV mortgage debt | 185,429 | |
| Enterprise Debt | $ | 9,062,094 | |
| Cash and cash equivalents | (70,625) | |
| Share of unconsolidated JV cash and cash equivalents | (21,871) | |
| Restricted cash | (67,981) | |
| Share of unconsolidated JV restricted cash | (4,416) | |
| |
| Net Debt | $ | 8,897,201 | |
In thousands
| | | | | |
| March 31, 2025 |
| Enterprise Debt | $ | 9,062,094 | |
| Enterprise Gross Assets | 25,220,216 | |
| Financial Leverage | 35.9% |
In thousands
| | | | | |
| March 31, 2025 |
| Mortgage debt | $ | 352,051 | |
| Share of unconsolidated JV mortgage debt | 185,429 | |
| Enterprise Secured Debt | $ | 537,480 | |
| Enterprise Gross Assets | $ | 25,220,216 | |
| Secured Debt Ratio | 2.1% |
| | |
| Net Debt to Adjusted EBITDAre |
In thousands
| | | | | | | |
| Three Months Ended
March 31, 2025 | | |
| Net Debt | $ | 8,897,201 | | | |
Annualized Adjusted EBITDAre(1) | 1,713,280 | | | |
| Net Debt to Adjusted EBITDAre | 5.2x | | |
______________________________________
(1)Represents the current quarter Adjusted EBITDAre multiplied by a factor of four.
| | | | |
| Healthpeak's Share of Unconsolidated Joint Venture NOI | | |
In thousands
| | | | | | | | | | | | | | | | | | | | | | | | | | | | | |
| Total Portfolio | Three Months Ended |
| March 31,
2024 | | June 30,
2024 | | September 30,
2024 | | December 31,
2024 | | March 31,
2025 |
| Equity income (loss) from unconsolidated joint ventures | $ | 2,376 | | | $ | 51 | | | $ | (3,834) | | | $ | (108) | | | $ | (2,147) | |
| Depreciation and amortization | 8,772 | | | 11,621 | | | 12,127 | | | 12,441 | | | 12,200 | |
| General and administrative | 337 | | | 79 | | | 353 | | | 348 | | | 350 | |
| | | | | | | | | |
| Other (income) expense, net | (1,005) | | | 883 | | | 4,670 | | | 1,039 | | | 861 | |
| Income tax (benefit) expense | 147 | | | 166 | | | 8 | | | 206 | | | 270 | |
| Healthpeak's share of unconsolidated joint venture NOI | $ | 10,627 | | | $ | 12,800 | | | $ | 13,324 | | | $ | 13,926 | | | $ | 11,534 | |
| | | | | | | | | | | | | | | | | | | | | | | | | | | | | |
| Outpatient Medical | Three Months Ended |
| March 31,
2024 | | June 30,
2024 | | September 30,
2024 | | December 31,
2024 | | March 31,
2025 |
| Equity income (loss) from unconsolidated joint ventures | $ | (1,110) | | | $ | (2,922) | | | $ | (5,185) | | | $ | (2,870) | | | $ | (3,204) | |
| Depreciation and amortization | 1,615 | | | 4,270 | | | 4,253 | | | 4,388 | | | 4,128 | |
| General and administrative | 44 | | | 133 | | | 91 | | | 95 | | | 159 | |
| | | | | | | | | |
| Other (income) expense, net | 1,099 | | | 2,965 | | | 5,082 | | | 3,074 | | | 3,193 | |
| Income tax (benefit) expense | 8 | | | (7) | | | (8) | | | (8) | | | (11) | |
| Healthpeak's share of unconsolidated joint venture NOI | $ | 1,656 | | | $ | 4,439 | | | $ | 4,233 | | | $ | 4,679 | | | $ | 4,265 | |
| | | | | | | | | | | | | | | | | | | | | | | | | | | | | |
| Lab | Three Months Ended |
| March 31,
2024 | | June 30,
2024 | | September 30,
2024 | | December 31,
2024 | | March 31,
2025 |
| Equity income (loss) from unconsolidated joint ventures | $ | 2,811 | | | $ | 2,247 | | | $ | 1,754 | | | $ | 1,865 | | | $ | (592) | |
| Depreciation and amortization | 2,573 | | | 2,693 | | | 3,194 | | | 3,380 | | | 3,346 | |
| General and administrative | 217 | | | (53) | | | 242 | | | 258 | | | 151 | |
| | | | | | | | | |
| Other (income) expense, net | (2,064) | | | (2,114) | | | (1,759) | | | (1,877) | | | (1,771) | |
| | | | | | | | | |
| Healthpeak's share of unconsolidated joint venture NOI | $ | 3,537 | | | $ | 2,773 | | | $ | 3,431 | | | $ | 3,626 | | | $ | 1,134 | |
| | | | | | | | | | | | | | | | | | | | | | | | | | | | | |
| Other | Three Months Ended |
| March 31,
2024 | | June 30,
2024 | | September 30,
2024 | | December 31,
2024 | | March 31,
2025 |
| Equity income (loss) from unconsolidated joint ventures | $ | 675 | | | $ | 726 | | | $ | (403) | | | $ | 897 | | | $ | 1,649 | |
| Depreciation and amortization | 4,584 | | | 4,658 | | | 4,680 | | | 4,673 | | | 4,726 | |
| General and administrative | 76 | | | (1) | | | 20 | | | (5) | | | 40 | |
| | | | | | | | | |
| Other (income) expense, net | (40) | | | 32 | | | 1,347 | | | (158) | | | (561) | |
| Income tax (benefit) expense | 139 | | | 173 | | | 16 | | | 214 | | | 281 | |
| Healthpeak's share of unconsolidated joint venture NOI | $ | 5,434 | | | $ | 5,588 | | | $ | 5,660 | | | $ | 5,621 | | | $ | 6,135 | |
| | |
| Noncontrolling Interests' Share of Consolidated Joint Venture NOI |
In thousands
| | | | | | | | | | | | | | | | | | | | | | | | | | | | | |
| Total Portfolio | Three Months Ended |
| March 31,
2024 | | June 30,
2024 | | September 30,
2024 | | December 31,
2024 | | March 31,
2025 |
| Income (loss) from continuing operations attributable to noncontrolling interest | $ | 4,501 | | | $ | 6,669 | | | $ | 6,866 | | | $ | 6,125 | | | $ | 7,236 | |
| | | | | | | | | |
| Depreciation and amortization | 4,452 | | | 4,614 | | | 4,415 | | | 4,520 | | | 4,353 | |
| Other (income) expense, net | 124 | | | 84 | | | 207 | | | 923 | | | 422 | |
| Dividends attributable to noncontrolling interest | (2,511) | | | (4,611) | | | (4,605) | | | (4,568) | | | (4,816) | |
| Noncontrolling interests' share of consolidated joint venture NOI | $ | 6,566 | | | $ | 6,756 | | | $ | 6,883 | | | $ | 7,000 | | | $ | 7,195 | |
| | | | | | | | | | | | | | | | | | | | | | | | | | | | | |
| Outpatient Medical | Three Months Ended |
| March 31,
2024 | | June 30,
2024 | | September 30,
2024 | | December 31,
2024 | | March 31,
2025 |
| Income (loss) from continuing operations attributable to noncontrolling interest | $ | 3,266 | | | $ | 5,398 | | | $ | 5,661 | | | $ | 4,890 | | | $ | 5,792 | |
| | | | | | | | | |
| Depreciation and amortization | 4,402 | | | 4,603 | | | 4,415 | | | 4,520 | | | 4,353 | |
| Other (income) expense, net | 215 | | | 107 | | | 177 | | | 923 | | | 422 | |
| Dividends attributable to noncontrolling interest | (1,437) | | | (3,376) | | | (3,370) | | | (3,333) | | | (3,372) | |
| Noncontrolling interests' share of consolidated joint venture NOI | $ | 6,446 | | | $ | 6,732 | | | $ | 6,883 | | | $ | 7,000 | | | $ | 7,195 | |
| | | | | | | | | | | | | | | | | | | | | | | | | | | | | |
| Lab | Three Months Ended |
| March 31,
2024 | | June 30,
2024 | | September 30,
2024 | | December 31,
2024 | | March 31,
2025 |
| Income (loss) from continuing operations attributable to noncontrolling interest | $ | 1,044 | | | $ | 949 | | | $ | 883 | | | $ | 913 | | | $ | 898 | |
| | | | | | | | | |
| Depreciation and amortization | 50 | | | 11 | | | — | | | — | | | — | |
| Other (income) expense, net | (91) | | | (23) | | | 30 | | | — | | | — | |
| Dividends attributable to noncontrolling interest | (883) | | | (913) | | | (913) | | | (913) | | | (898) | |
| Noncontrolling interests' share of consolidated joint venture NOI | $ | 120 | | | $ | 24 | | | $ | — | | | $ | — | | | $ | — | |
| | | | | | | | | | | | | | | | | | | | | | | | | | | | | |
| Corporate Non-segment | Three Months Ended |
| March 31,
2024 | | June 30,
2024 | | September 30,
2024 | | December 31,
2024 | | March 31,
2025 |
| Income (loss) from continuing operations attributable to noncontrolling interest | $ | 191 | | | $ | 322 | | | $ | 322 | | | $ | 322 | | | $ | 546 | |
| | | | | | | | | |
| | | | | | | | | |
| | | | | | | | | |
| Dividends attributable to noncontrolling interest | (191) | | | (322) | | | (322) | | | (322) | | | (546) | |
| Noncontrolling interests' share of consolidated joint venture NOI | $ | — | | | $ | — | | | $ | — | | | $ | — | | | $ | — | |
In thousands, except per month data
| | | | | | | | | | | | | | | | | | | | | | | | | | | | | |
| Three Months Ended |
| REVPOR CCRC | March 31,
2024 | | June 30,
2024 | | September 30,
2024 | | December 31,
2024 | | March 31,
2025 |
Portfolio Cash Real Estate Revenues(2) | $ | 138,777 | | | $ | 140,890 | | | $ | 142,845 | | | $ | 145,963 | | | $ | 148,927 | |
| | | | | | | | | |
| REVPOR CCRC revenues | $ | 138,777 | | | $ | 140,890 | | | $ | 142,845 | | | $ | 145,963 | | | $ | 148,927 | |
| | | | | | | | | |
| Average occupied units/month | 6,043 | | | 6,049 | | | 6,013 | | | 6,060 | | | 6,085 | |
REVPOR CCRC per month(3) | $ | 7,655 | | | $ | 7,764 | | | $ | 7,919 | | | $ | 8,028 | | | $ | 8,158 | |
| | | | | | | | | | | | | | | | | | | | | | | | | | | | | |
| Three Months Ended |
| REVPOR CCRC excluding NREF Amortization | March 31,
2024 | | June 30,
2024 | | September 30,
2024 | | December 31,
2024 | | March 31,
2025 |
| REVPOR CCRC revenues | $ | 138,777 | | | $ | 140,890 | | | $ | 142,845 | | | $ | 145,963 | | | $ | 148,927 | |
| NREF Amortization | (21,577) | | | (21,401) | | | (22,622) | | | (23,394) | | | (24,006) | |
| | | | | | | | | |
| REVPOR CCRC revenues excluding NREF Amortization | $ | 117,200 | | | $ | 119,489 | | | $ | 120,223 | | | $ | 122,569 | | | $ | 124,921 | |
| | | | | | | | | |
| Average occupied units/month | 6,043 | | | 6,049 | | | 6,013 | | | 6,060 | | | 6,085 | |
REVPOR CCRC excluding NREF Amortization per month(3) | $ | 6,465 | | | $ | 6,585 | | | $ | 6,665 | | | $ | 6,742 | | | $ | 6,843 | |
_____________________________________
(1)May not foot due to rounding.
(2)See pages 12 and 13 of this document for a reconciliation of Portfolio Cash Real Estate Revenues.
(3)Represents the quarter REVPOR CCRC divided by a factor of three.
In thousands, except per month data
| | | | | | | | | | | | | | | | | | | | | | | | | | | | | |
| Three Months Ended |
| REVPOR Other | March 31,
2024 | | June 30,
2024 | | September 30,
2024 | | December 31,
2024 | | March 31,
2025 |
Portfolio Cash Real Estate Revenues(2) | $ | 21,477 | | | $ | 21,360 | | | $ | 21,815 | | | $ | 21,751 | | | $ | 22,452 | |
| | | | | | | | | |
| REVPOR revenues | $ | 21,477 | | | $ | 21,360 | | | $ | 21,815 | | | $ | 21,751 | | | $ | 22,452 | |
| | | | | | | | | |
| Average occupied units/month | 1,401 | | | 1,415 | | | 1,450 | | | 1,461 | | | 1,450 | |
REVPOR per month(3) | $ | 5,109 | | | $ | 5,032 | | | $ | 5,016 | | | $ | 4,963 | | | $ | 5,162 | |
______________________________________
(1)May not foot due to rounding.
(2)See pages 12 and 13 of this document for a reconciliation of Portfolio Cash Real Estate Revenues.
(3)Represents the quarter REVPOR divided by a factor of three.
FORWARD-LOOKING STATEMENTS
This Discussion and Reconciliation of Non-GAAP Financial Measures may include “forward-looking statements” within the meaning of the Private Securities Litigation Reform Act. All statements other than statements of historical fact are “forward-looking statements” for purposes of federal and state securities laws. These forward-looking statements, which are based on current expectations, estimates and projections about the industry and markets in which we operate and beliefs of and assumptions made by our management, involve uncertainties that could significantly affect our financial or operating results. Words such as “expects,” “anticipates,” “intends,” “plans,” “believes,” “seeks,” “estimates,” “predicts,” “projects,” “forecasts,” “will,” “may,” “potential,” “can,” “could,” “should,” “pro forma,” and variations of such words and similar expressions are intended to identify such forward-looking statements. Such forward-looking statements include, but are not limited to, statements about our business outlook, 2025 guidance, future acquisitions, dispositions, developments, financing activity, leasing activity, financial and operating results, plans, objectives, expectations, and intentions. All statements that address operating performance, events, or developments that Healthpeak expects or anticipates will occur in the future—including statements relating to creating value for stockholders, and the expected benefits of integration of operations relating to the merger with Physicians Realty Trust and property management internalization—are forward-looking statements. These statements are not guarantees of future performance and involve certain risks, uncertainties and assumptions that are difficult to predict. Although we believe the expectations reflected in any forward-looking statements are based on reasonable assumptions, we can give no assurance that our expectations will be attained and, therefore, actual outcomes and results may differ materially from what is expressed or forecasted in such forward-looking statements. For example, these forward-looking statements could be affected by factors including, without limitation, risks associated with: macroeconomic trends that may increase construction, labor and other operating costs; changes within the life science industry; significant regulation, funding requirements, and uncertainty faced by our lab tenants; factors adversely affecting our tenants’, operators’, or borrowers’ ability to meet their financial and other contractual obligations to us; the insolvency or bankruptcy of one or more of our major tenants, operators, or borrowers; our concentration of real estate investments in the healthcare property sector, which makes us more vulnerable to a downturn in that specific sector than if we invested across multiple sectors; the illiquidity of real estate investments; our ability to identify and secure new or replacement tenants and operators; our property development, redevelopment, and tenant improvement risks, which can render a project less profitable or unprofitable and delay or prevent its undertaking or completion; the ability of the hospitals on whose campuses our outpatient medical buildings are located and their affiliated healthcare systems to remain competitive or financially viable; our ability to develop, maintain, or expand hospital and health system client relationships; operational risks associated with our senior housing properties managed by third parties, including our properties operated through structures permitted by the Housing and Economic Recovery Act of 2008, which includes most of the provisions previously proposed in the REIT Investment Diversification and Empowerment Act of 2007 (commonly referred to as “RIDEA”); economic conditions, natural disasters, weather, and other conditions that negatively affect geographic areas where we have concentrated investments; uninsured or underinsured losses, which could result in a significant loss of capital invested in a property, lower than expected future revenues, and unanticipated expenses; our use of joint ventures may limit our returns on and our flexibility with jointly owned investments; our use of rent escalators or contingent rent provisions in our leases; competition for suitable healthcare properties to grow our investment portfolio; our ability to exercise rights on collateral securing our real estate-related loans; any requirement that we recognize reserves, allowances, credit losses, or impairment charges; investment of substantial resources and time in transactions that are not consummated; our ability to successfully integrate or operate acquisitions or internalize property management; the potential impact of unfavorable resolution of litigation or disputes and resulting rising liability and insurance costs; environmental compliance costs and liabilities associated with our real estate investments; environmental, social and governance and sustainability commitments and requirements, as well as stakeholder expectations; epidemics, pandemics, or other infectious diseases, including the coronavirus disease (Covid), and health and safety measures intended to reduce their spread; human capital risks, including the loss or limited availability of our key personnel; our reliance on information technology and any material failure, inadequacy, interruption, or security failure of that technology; the use of, or inability to use, artificial intelligence by us, our tenants, our vendors, and our investors; volatility, disruption, or uncertainty in the financial markets; increased borrowing costs, which could impact our ability to refinance existing debt, sell properties, and conduct investment activities; cash available for distribution to stockholders and our ability to make dividend distributions at expected levels; the availability of external capital on acceptable terms or at all; an increase in our level of indebtedness; covenants in our debt instruments, which may limit our operational flexibility, and breaches of these covenants; volatility in the market price and trading volume of our common stock; adverse changes in our credit ratings; the failure of our tenants, operators, and borrowers to comply with federal, state, and local laws and regulations, including resident health and safety requirements, as well as licensure, certification, and inspection requirements; required regulatory approvals to transfer our senior housing properties; compliance with the Americans with Disabilities Act and fire, safety, and other regulations; laws or regulations prohibiting eviction of our tenants; the requirements of, or changes to, governmental reimbursement programs such as Medicare or Medicaid; legislation to address federal government operations and administrative decisions affecting the Centers for Medicare and Medicaid Services; our participation in the Coronavirus, Aid, Relief and Economic Security Act Provider Relief Fund and other Covid-related stimulus and relief programs; changes in federal, state, or local laws or regulations that may limit our opportunities to participate in the ownership of, or investment in, healthcare real estate; our ability to successfully integrate our operations with Physicians Realty Trust and realize the anticipated synergies of our merger with Physicians Realty Trust and benefits of property management internalization; our ability to maintain our qualification as a real estate investment trust (“REIT”); our taxable REIT subsidiaries being subject to corporate level tax; tax imposed on any net income from “prohibited transactions”; changes to U.S. federal income tax laws, and potential deferred and contingent tax liabilities from corporate acquisitions; calculating non-REIT tax earnings and profits distributions; tax protection agreements that may limit our ability to dispose of certain properties and may require us to maintain certain debt levels; ownership limits in our charter that restrict ownership in our stock; provisions of Maryland law and our charter that could prevent a transaction that may otherwise be in the interest of our stockholders; conflicts of interest between the interests of our stockholders and the interests of holders of Healthpeak OP, LLC (“Healthpeak OP”) common units; provisions in the operating agreement of Healthpeak OP and other agreements that may delay or prevent unsolicited acquisitions and other transactions; our status as a holding company of Healthpeak OP; and other risks and uncertainties described from time to time in our Securities and Exchange Commission filings.
Moreover, other risks and uncertainties of which we are not currently aware may also affect our forward-looking statements and may cause actual results and the timing of events to differ materially from those anticipated. The forward-looking statements made in this communication are made only as of the date hereof or as of the dates indicated in the forward-looking statements, even if they are subsequently made available by us on our website or otherwise. We do not undertake any obligation to update or supplement any forward-looking statements to reflect actual results, new information, future events, changes in its expectations or other circumstances that exist after the date as of which the forward-looking statements were made.