doug-20230309
0001878897false00018788972022-11-032022-11-03

UNITED STATES
SECURITIES AND EXCHANGE COMMISSION
Washington, D.C. 20549
FORM 8-K
CURRENT REPORT
Pursuant to Section 13 or 15(d) of the
Securities Exchange Act of 1934
Date of Report (Date of earliest event reported): March 9, 2023
DOUGLAS ELLIMAN INC.
(Exact Name of Registrant as Specified in Its Charter)
Delaware
(State or Other Jurisdiction of Incorporation)
001-41054 87-2176850
(Commission File Number) (I.R.S. Employer Identification No.)
   
4400 Biscayne BoulevardMiamiFlorida 33137
(Address of Principal Executive Offices) (Zip Code)

(305) 579-8000
(Registrant’s Telephone Number, Including Area Code)
Check the appropriate box below if the Form 8-K filing is intended to simultaneously satisfy the filing obligation of the registrant under any of the following provisions (see General Instruction A.2. below):
 Written communications pursuant to Rule 425 under the Securities Act (17 CFR 230.425)
Soliciting material pursuant to Rule 14a-12 under the Exchange Act (17 CFR 240.14a-12)
Pre-commencement communications pursuant to Rule 14d-2(b) under the Exchange Act (17 CFR 240.14d-2(b))
Pre-commencement communications pursuant to Rule 13e-4(c) under the Exchange Act (17 CFR 240.13e-4(c))
Securities Registered Pursuant to 12(b) of the Act:
Title of each class:TradingName of each exchange
Symbol(s)on which registered:
Common stock, par value $0.01 per shareDOUGNew York Stock Exchange
Indicate by check mark whether the registrant is an emerging growth company as defined in Rule 405 of the Securities Act of 1933 (§230.405 of this chapter) or Rule 12b-2 of the Securities Exchange Act of 1934 (§240.12b-2 of this chapter).

Emerging growth company
If an emerging growth company, indicate by check mark if the registrant has elected not to use the extended transition period for complying with any new or revised financial accounting standards provided pursuant to Section 13(a) of the Exchange Act.


Item 2.02. Results of Operations and Financial Condition
On March 9, 2023, Douglas Elliman Inc. (NYSE:DOUG) (the “Company” or “Douglas Elliman”) announced its financial results for the fourth quarter and full year ended December 31, 2022. The full text of the press release issued in connection with the announcement is attached as Exhibit 99.1 to this Current Report on Form 8-K.
The information in this Item 2.02 of this Current Report on Form 8-K and the related Exhibit attached hereto are being furnished and shall not be deemed “filed” for purposes of Section 18 of the Securities Exchange Act of 1934 (the “Exchange Act”) or otherwise subject to the liabilities of that section, nor shall it be deemed incorporated by reference in any filing under the Securities Act of 1933 or the Exchange Act, except as expressly set forth by specific reference in such a filing.
Item 7.01. Regulation FD Disclosure
The Company has prepared materials for presentation to investors. The materials are furnished (not filed) as Exhibit 99.2 to this Current Report on Form 8-K pursuant to Regulation FD.

Non-GAAP Financial Measures

Exhibit 99.2 contains the Non-GAAP Financial Measures discussed below.

Please refer to Current Reports on Form 8-K dated August 5, 2022, May 10, 2022 and March 1, 2022 for reconciliations of financial measures prepared in accordance with GAAP to Non-GAAP Financial Measures.

Adjusted EBITDA attributed to Douglas Elliman and Adjusted Operating Expenses (“the Non-GAAP Financial Measures”) are financial measures not prepared in accordance with generally accepted accounting principles (“GAAP”). The Company believes that the Non-GAAP Financial Measures are important measures that supplement discussion and analysis of its results of operations and enhance an understanding of its operating performance. The Company believes the Non-GAAP Financial Measures provide investors and analysts with a useful measure of operating results unaffected by differences in capital structures and ages of related assets among otherwise comparable companies.

Management uses the Non-GAAP Financial Measures as measures to review and assess operating performance of the Company's business, and management does and investors should review both the overall performance (GAAP net income) and the operating performance (the Non-GAAP Financial Measures) of the Company's business. While management considers the Non-GAAP Financial Measures to be important, they should be considered in addition to, but not as substitutes for or superior to, other measures of financial performance prepared in accordance with GAAP, such as operating income, net income and cash flows from operations. In addition, the Non-GAAP Financial Measures are susceptible to varying calculations and the Company's measurement of the Non-GAAP Financial Measures may not be comparable to those of other companies.

EBITDA is defined as net income before, interest, taxes, non-controlling interest, depreciation and amortization. Non-GAAP Financial Measures include change in fair value of contingent liability. For purposes of Adjusted EBITDA only, adjustments include equity in earnings from equity-method investments, stock-based compensation expense, and other, net. For purposes of Adjusted Operating Expenses only, adjustments include real estate agent commissions, variable expenses related to ancillary services, depreciation and amortization, loss on disposal of assets, non-cash stock compensation - real estate brokerage segment, and operating expenses - corporate and other segment.
Forward-Looking Statements

This Current Report on Form 8-K contains forward-looking statements, which involve risk and uncertainties. The words “anticipate,” “believe,” “estimate,” “expect,” “intend,” “may be,” “continue’” “could,” “potential,” “objective,” “plan,” “seek,” “predict,” “project” and “will be” and similar expressions are intended to identify forward-looking statements. The Company’s actual results could differ significantly from the results discussed in such forward-looking statements. Factors that could cause or contribute to such differences in results and outcomes include, without limitation, those discussed under the heading “Risk Factors” in the Company’s Annual Report Report on Form 10-K for the year ended ended December 31, 2021 and, when filed, in the Company’s Annual Report on Form 10-K for the year ended December 31, 2022. Readers are urged not to place undue reliance on these forward-looking statements, which speak only as of the date of this Current Report on Form 8-K. The Company undertakes no obligation to (and expressly disclaims any obligation to) revise or update any forward-looking statement, whether as a result of new information, subsequent events, or otherwise (except as may be required by law), in order to reflect any event or circumstance which may arise after the date of this Current Report on Form 8-K.


Item 9.01. Financial Statements and Exhibit

(d) Exhibits.
Exhibit No. Exhibit
 Press Release issued on March 9, 2023, regarding financial results for the fourth quarter and year ended December 31, 2022.
Investor presentation of Douglas Elliman Inc. dated March 2023 (furnished pursuant to Regulation FD).
104Cover Page Interactive Data File (embedded within the Inline XBRL document).


SIGNATURE
Pursuant to the requirements of the Securities Exchange Act of 1934, as amended, the registrant has duly caused this report to be signed on its behalf by the undersigned hereunto duly authorized.
 DOUGLAS ELLIMAN INC.
 
By:/s/ J. Bryant Kirkland III  
 Name:J. Bryant Kirkland III 
 Title:Senior Vice President, Treasurer and Chief Financial Officer 
Date: March 10, 2023


imagea.jpg
FOR IMMEDIATE RELEASE
Contact: Stephen Larkin, Douglas Elliman Inc.
917-902-2503
Emily Claffey/Benjamin Spicehandler/Columbia Clancy, FGS Global,
  212-687-8080 (U.S.)
44(0)2031788914(Europe)
J. Bryant Kirkland III, Douglas Elliman Inc.
305-579-8000
DOUGLAS ELLIMAN INC. REPORTS FOURTH QUARTER AND FULL YEAR 2022 FINANCIAL RESULTS
Fourth Quarter 2022 Highlights:
Consolidated revenues of $207.3 million compared to $334.2 million in the prior year quarter
Douglas Elliman’s real estate brokerage segment achieved gross transaction value of approximately $7.5 billion, compared to approximately $12.6 billion in the prior year quarter.
Douglas Elliman’s real estate brokerage segment reported an average price per transaction of $1.573 million.
Consolidated operating loss of $21.9 million and real estate brokerage segment operating loss of $15.6 million compared to operating income of $19.2 million and $19.2 million, respectively, in the prior year quarter
Net loss attributed to Douglas Elliman of $18.4 million, or $0.24 per diluted common share, compared to net income of $20.2 million, or $0.26 per diluted common share, in the prior year quarter
Adjusted EBITDA attributed to Douglas Elliman of a loss of $17.1 million compared to income of $21.3 million in the prior year quarter, reflecting the impact of lower revenues and stand-alone public company expenses
Adjusted EBITDA attributed to Douglas Elliman’s real estate brokerage segment of a loss of $12.6 million compared to income of $21.3 million in the prior year quarter
Full Year 2022 Highlights:
Consolidated revenues of $1.15 billion, compared to $1.35 billion in the prior year
Douglas Elliman’s real estate brokerage segment achieved gross transaction value of approximately $42.9 billion, compared to approximately $51.2 billion in 2021.
Douglas Elliman’s real estate brokerage segment reported an average price per transaction of $1.616 million.


Consolidated operating loss of $4.5 million and real estate brokerage segment operating income of $22.0 million compared to operating income of $102.1 million and $102.1 million, respectively, in the prior year
Net loss attributed to Douglas Elliman of $5.6 million, or $0.08 per diluted common share, compared to net income of $98.8 million, or $1.27 per diluted common share, in the prior year
Adjusted EBITDA attributed to Douglas Elliman of $15.0 million compared to $110.7 million in the prior year, reflecting the impact of lower revenues and stand-alone public company expenses
Adjusted EBITDA attributed to Douglas Elliman’s real estate brokerage segment of $34.5 million compared to $110.7 million in the prior year
MIAMI, FL, March 9, 2023 - Douglas Elliman Inc. (NYSE:DOUG) today announced financial results for the three months and year ended December 31, 2022.
“Douglas Elliman’s team of world class agents met the challenges of the fourth quarter, which was marked by limited listing inventory and significantly increased mortgage rates,” said Howard M. Lorber, Chairman and Chief Executive Officer of Douglas Elliman. “The strength of Douglas Elliman's balance sheet, global network of leading agents and luxury brand positions us to take advantage of opportunities as real estate markets stabilize. We remain confident that the Company’s differentiated platform and approach will enable us to deliver continued growth over the long term."
GAAP Financial Results
Three months ended December 31, 2022. Fourth quarter 2022 revenues were $207.3 million, compared to revenues of $334.2 million in the fourth quarter of 2021. The Company recorded an operating loss of $21.9 million in the fourth quarter of 2022, compared to operating income of $19.2 million in the fourth quarter of 2021. Net loss attributed to Douglas Elliman for the fourth quarter of 2022 was $18.4 million, or $0.24 per diluted common share, compared to net income of $20.2 million, or $0.26 per diluted common share, in the fourth quarter of 2021.
Year ended December 31, 2022. For the year ended December 31, 2022, revenues were $1.15 billion, compared to revenues of $1.35 billion for the year ended December 31, 2021. The Company recorded operating loss of $4.5 million for the year ended December 31, 2022, compared to operating income of $102.1 million for the year ended December 31, 2021. Net loss attributed to Douglas Elliman for the year ended December 31, 2022 was $5.6 million, or $0.08 per diluted common share, compared to net income of $98.8 million, or $1.27 per diluted common share, for the year ended December 31, 2021.
Non-GAAP Financial Measures
Non-GAAP financial measures include an adjustment for change in fair value of contingent liability (for purposes of Adjusted EBITDA and Adjusted Net Income) and income related to Tax Disaffiliation indemnification (for purposes of Adjusted Net Income, which is included in other, net for Adjusted EBITDA). For purposes of Adjusted EBITDA only, adjustments also include stock-based compensation, equity in earnings (losses) from equity method investments and other, net. Reconciliations of non-GAAP financial measures to the comparable GAAP financial results for the three months and full years ended December 31, 2022 and 2021 are included in Tables 2, 3 and 4.
Three months ended December 31, 2022 compared to the three months ended December 31, 2021
Adjusted EBITDA attributed to Douglas Elliman (as described in Table 2 attached hereto) were a loss of $17.1 million for the fourth quarter of 2022, compared to income of $21.3 million for the fourth quarter of 2021.
Adjusted EBITDA attributed to Douglas Elliman’s real estate brokerage segment (as described in Table 2 attached hereto) were a loss of $12.6 million for the fourth quarter of 2022, compared to income of $21.3 million for the fourth quarter of 2021.
Adjusted Net Loss attributed to Douglas Elliman (as described in Table 3 attached hereto) was $18.4 million, or $0.24 per diluted share, for the fourth quarter of 2022, compared to Adjusted Net Income attributed to Douglas Elliman of $18.6 million, or $0.24 per diluted share, for the fourth quarter of 2021.
Year ended December 31, 2022 compared to the year ended December 31, 2021
Adjusted EBITDA attributed to Douglas Elliman (as described in Table 2 attached hereto) were $15.0 million for the year ended December 31, 2022, compared to $110.7 million for the year ended December 31, 2021.
Adjusted EBITDA attributed to Douglas Elliman’s real estate brokerage segment (as described in Table 2 attached hereto) were $34.5 million for the year ended December 31, 2022, compared to $110.7 million for the year ended December 31, 2021.


Adjusted Net Loss attributed to Douglas Elliman (as described in Table 3 attached hereto) was $6.2 million, or $0.09 per diluted share, for the year ended December 31, 2022, compared to Adjusted Net Income attributed to Douglas Elliman of $100.5 million, or $1.29 per diluted share, for the year ended December 31, 2021.
Gross Transaction Value
For the three months ended December 31, 2022, Douglas Elliman’s subsidiary, Douglas Elliman Realty, LLC, achieved gross transaction value of approximately $7.5 billion, compared to approximately $12.6 billion for the three months ended December 31, 2021. For the three months ended December 31, 2022, Douglas Elliman’s real estate brokerage segment reported an average price per transaction of $1.573 million.
For the year ended December 31, 2022, Douglas Elliman’s subsidiary, Douglas Elliman Realty, LLC, achieved gross transaction value of approximately $42.9 billion compared to approximately $51.2 billion for the year ended December 31, 2021. For the year ended December 31, 2022, Douglas Elliman’s real estate brokerage segment reported an average price per transaction of $1.616 million.
Consolidated Balance Sheet
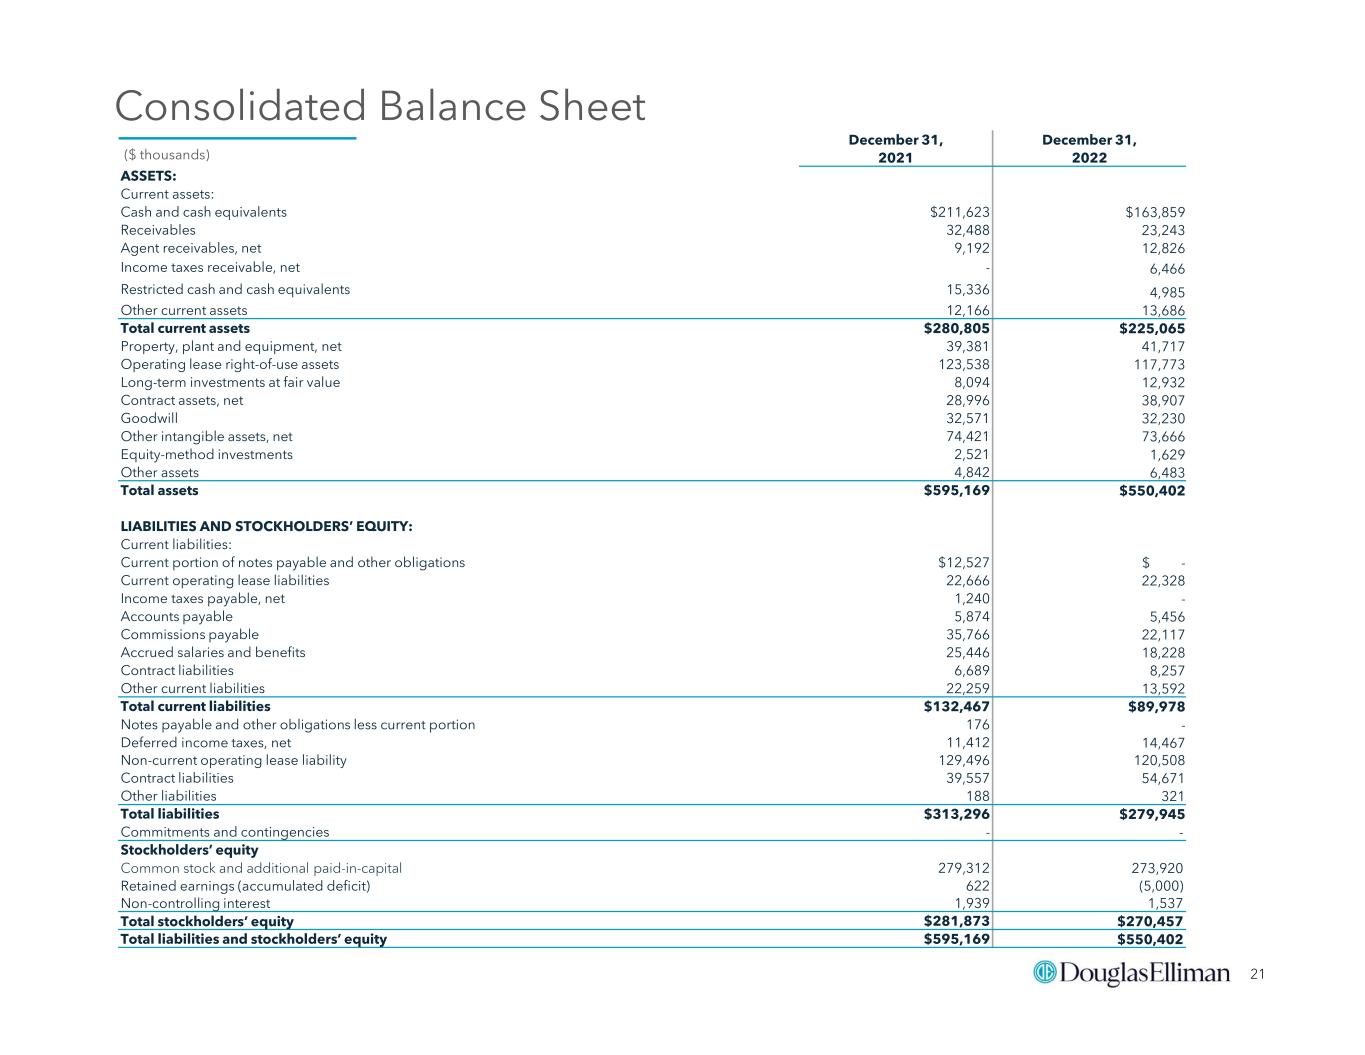
Douglas Elliman maintained a strong balance sheet with cash and cash equivalents of $163.9 million at December 31, 2022. This significant liquidity places the Company in a position of strength in the market.
Conference Call to Discuss Fourth Quarter and Full Year 2022 Results
As previously announced, the Company will host a conference call and webcast on Friday March 10, 2023 at 8:00 AM (ET) to discuss its fourth quarter and full year 2022 results. Participants should pre-register for the call using the following link: https://conferencingportals.com/event/WkZPJZxS. Registered participants will receive an email with a calendar reminder, dial-in number and conference ID that allows immediate access to the call. The call will be available via live webcast at https://events.q4inc.com/attendee/696097083. Webcast participants should join the webcast at least 10 minutes prior to start time.
An archived replay of the call will be available shortly after the call ends on March 10, 2023 through March 24, 2023 at https://events.q4inc.com/attendee/696097083.
Non-GAAP Financial Measures
Adjusted EBITDA attributed to Douglas Elliman and Adjusted Net Income attributed to Douglas Elliman (referred to as the “Non-GAAP Financial Measures”) are financial measures not prepared in accordance with generally accepted accounting principles (“GAAP”). The Company believes that the Non-GAAP Financial Measures are important measures that supplement discussion and analysis of its results of operations and enhance an understanding of its operating performance.
The Company believes the Non-GAAP Financial Measures provide investors and analysts with a useful measure of operating results unaffected by differences in capital structures and ages of related assets among otherwise comparable companies.
Management uses the Non-GAAP Financial Measures as measures to review and assess operating performance of the Company’s business, and management does and investors should review both the overall performance (GAAP net income) and the operating performance (the Non-GAAP Financial Measures) of the Company’s business. While management considers the Non-GAAP Financial Measures to be important, they should be considered in addition to, but not as substitutes for or superior to, other measures of financial performance prepared in accordance with GAAP, such as operating income, net income and cash flows from operations. In addition, the Non-GAAP Financial Measures are susceptible to varying calculations and the Company’s measurement of the Non-GAAP Financial Measures may not be comparable to those of other companies. Attached hereto as Tables 2, 3 and 4 is information relating to the Company’s Non-GAAP Financial Measures for the three months and full years ended December 31, 2022 and 2021.
About Douglas Elliman Inc.
Douglas Elliman Inc. (NYSE: DOUG, “Douglas Elliman”) owns Douglas Elliman Realty, LLC, which is one of the largest residential brokerage companies in the United States with operations in New York City, Long Island, Westchester, Connecticut, New Jersey, the Hamptons, Massachusetts, Florida, California, Texas, Colorado, and Nevada. In addition, Douglas Elliman sources, uses and invests in early-stage, disruptive property technology (“PropTech”) solutions and companies and provides other real estate services, including development marketing, property management and settlement and escrow services in select markets. Additional information concerning Douglas Elliman is available on its website, investors.elliman.com.
Investors and others should note that we may post information about Douglas Elliman on our website at investors.elliman.com or, if applicable, on our accounts on Facebook, Instagram, LinkedIn, TikTok, Twitter, YouTube or other social media platforms. It is possible that the postings or releases could include information deemed to be material information. Therefore,


we encourage investors, the media and others interested in Douglas Elliman to review the information we post on our website at investors.elliman.com and on our social media accounts.
Forward-Looking and Cautionary Statements
This press release includes forward-looking statements within the meaning of the federal securities law. All statements other than statements of historical or current facts made in this document are forward-looking. We identify forward-looking statements in this document by using words or phrases such as “anticipate,” “believe,” “estimate,” “expect,” “intend,” “may be,” “continue” “could,” “potential,” “objective,” “plan,” “seek,” “predict,” “project” and “will be” and similar words or phrases or their negatives. Forward-looking statements reflect our current expectations and are inherently uncertain. Actual results could differ materially for a variety of reasons.
Risks and uncertainties that could cause our actual results to differ significantly from our current expectations are described in our Annual Report on Form 10-K for the year ended December 31, 2021 and, when filed, our Annual Report on Form 10-K for the year ended December 31, 2022. We undertake no responsibility to publicly update or revise any forward-looking statement except as required by applicable law.

[Financial Tables Follow]


TABLE 1
DOUGLAS ELLIMAN INC. AND SUBSIDIARIES
CONDENSED COMBINED CONSOLIDATED STATEMENTS OF OPERATIONS
(Dollars in Thousands, Except Per Share Amounts)

For comparability purposes, Douglas Elliman Inc. (NYSE: DOUG) began operating as a standalone public company on December 30, 2021 and did not incur any material public company expenses until the first quarter of 2022. Douglas Elliman Inc. also became a full taxpayer after it became a standalone public company on December 30, 2021.

Three Months EndedYear Ended
December 31,December 31,
2022202120222021
(Unaudited)(Unaudited)
Revenues:
Commissions and other brokerage income$195,968 $318,368 $1,099,885 $1,292,416 
Property management8,236 9,056 36,022 37,345 
Other ancillary services3,126 6,802 17,270 23,377 
       Total revenues207,330 334,226 1,153,177 1,353,138 
Expenses:
Real estate agent commissions150,363 247,756 836,803 985,523 
Sales and marketing21,618 17,843 85,763 77,174 
Operations and support17,074 14,944 72,946 71,641 
General and administrative32,194 28,317 131,421 92,798 
Technology5,964 4,041 22,773 15,343 
Depreciation and amortization1,979 2,152 8,012 8,561 
Operating (loss) income(21,862)19,173 (4,541)102,098 
Other income (expenses):
Interest income1,215 18 1,779 83 
Equity in losses from equity-method investments(86)(160)(563)(278)
Change in fair value of contingent liability— 1,605 — (1,647)
Investment and other income (loss)403 (37)3,429 529 
(Loss) income before provision for income taxes(20,330)20,599 104 100,785 
Income tax (benefit) expense(1,670)477 6,503 2,133 
Net (loss) income(18,660)20,122 (6,399)98,652 
Net loss attributed to non-controlling interest245 66 777 186 
Net (loss) income attributed to Douglas Elliman Inc.$(18,415)$20,188 $(5,622)$98,838 
Per basic common share:
Net (loss) income applicable to common shares attributed to Douglas Elliman Inc.$(0.24)$0.26 $(0.08)$1.27 
Per diluted common share:
Net (loss) income applicable to common shares attributed to Douglas Elliman Inc.$(0.24)$0.26 $(0.08)$1.27 


TABLE 2
DOUGLAS ELLIMAN INC. AND SUBSIDIARIES
RECONCILIATION OF ADJUSTED EBITDA
(Unaudited)
(Dollars in Thousands)

Table 2 provides a reconciliation of GAAP to Non-GAAP financial measures. For comparability purposes, Douglas Elliman Inc. (NYSE: DOUG) began operating as a standalone public company on December 30, 2021 and did not incur any material public company expenses until the first quarter of 2022. Its expenses incurred in its public company operations are reported in the Corporate and Other Segment and the operations of its brokerage businesses are reported in the Real Estate Brokerage Segment.

Three Months EndedYear Ended
December 31,December 31,
2022202120222021
Net (loss) income attributed to Douglas Elliman Inc.$(18,415)$20,188 $(5,622)$98,838 
Interest (income) expense(1,215)(18)(1,779)(83)
Income tax (benefit) expense(1,670)477 6,503 2,133 
Net loss attributed to non-controlling interest(245)(66)(777)(186)
Depreciation and amortization1,979 2,152 8,012 8,561 
EBITDA$(19,566)$22,733 $6,337 $109,263 
Equity in losses from equity-method investments (a)86 160 563 278 
Change in fair value of contingent liability— (1,605)— 1,647 
Stock-based compensation expense (b)2,662 — 11,138 — 
Other, net(403)37 (3,429)(529)
Adjusted EBITDA(17,221)21,325 14,609 110,659 
Adjusted EBITDA attributed to non-controlling interest119 (17)342 40 
Adjusted EBITDA attributed to Douglas Elliman Inc.$(17,102)$21,308 $14,951 $110,699 
Operating (loss) income by Segment:
Real estate brokerage $(15,626)$19,173 $21,993 $102,098 
Corporate and other(6,236)— (26,534)— 
Total $(21,862)$19,173 $(4,541)$102,098 
Real estate brokerage segment
Operating (loss) income$(15,626)$19,173 $21,993 $102,098 
Depreciation and amortization1,979 2,152 8,012 8,561 
Stock-based compensation917 — 4,195 — 
Adjusted EBITDA(12,730)21,325 34,200 110,659 
Adjusted EBITDA attributed to non-controlling interest119 (17)342 40 
Adjusted EBITDA attributed to Douglas Elliman Inc.$(12,611)$21,308 $34,542 $110,699 
Corporate and other segment
Operating loss$(6,236)$— $(26,534)$— 
Stock-based compensation1,745 — 6,943 — 
Adjusted EBITDA attributed to Douglas Elliman Inc.$(4,491)$— $(19,591)$— 
                                      

a.Represents equity in earnings recognized from the Company’s investment in certain real estate businesses that are accounted for under the equity method and are not consolidated in the Company’s financial results.
b.Represents amortization of stock-based compensation of $917 and $4,195, which is attributable to the Real estate brokerage segment for the three months and year ended December 31, 2022, and $1,745 and $6,943, which is attributable to the Corporate and other segment for the three months and year ended December 31, 2022.


TABLE 3
DOUGLAS ELLIMAN INC. AND SUBSIDIARIES
RECONCILIATION OF ADJUSTED NET (LOSS) INCOME
(Unaudited)
(Dollars in Thousands, Except Per Share Amounts)

Table 3 provides a reconciliation of GAAP to Non-GAAP financial measures. For comparability purposes, Douglas Elliman Inc. (NYSE: DOUG) began operating as a standalone public company on December 30, 2021 and did not incur any material public company expenses until the first quarter of 2022. Douglas Elliman Inc. also became a full taxpayer after it became a standalone public company on December 30, 2021.

Three Months EndedYear Ended
December 31,December 31,
2022202120222021
Net (loss) income attributed to Douglas Elliman Inc.$(18,415)$20,188 $(5,622)$98,838 
Change in fair value of contingent liability— (1,605)— 1,647 
Income related to Tax Disaffiliation indemnification(8)— (589)— 
Total adjustments(8)(1,605)(589)1,647 
Adjusted net (loss) income attributed to Douglas Elliman Inc.$(18,423)$18,583 $(6,211)$100,485 
Per diluted common share:
Adjusted net (loss) income applicable to common shares attributed to Douglas Elliman Inc.$(0.24)$0.24 $(0.09)$1.29 


TABLE 4
DOUGLAS ELLIMAN INC. AND SUBSIDIARIES
RECONCILIATION OF REVENUES
(Unaudited)
(Dollars in Thousands)

Three Months EndedYear Ended
December 31,December 31,
2022202120222021
Revenues:
Commissions and other brokerage income$195,968 $318,368 $1,099,885 $1,292,416 
Property management8,236 9,056 36,022 37,345 
Other ancillary services3,126 6,802 17,270 23,377 
Total revenues$207,330 $334,226 $1,153,177 $1,353,138 
Gross transaction value (in billions)$7.5 $12.6 $42.9 $51.2 
Total transactions4,776 8,307 26,573 32,400 


June 2021 / Confidential Investor Presentation March 2023


2 Disclaimer This document and any related oral presentation does not constitute an offer or invitation to subscribe for, purchase or otherwise acquire any securities or other instruments of Douglas Elliman Inc. (“Douglas Elliman Inc.”, “DOUG” or “the Company”) or its subsidiaries and nothing contained herein or its presentation shall form the basis of any offer, contract or commitment whatsoever. The distribution of this document and any related oral presentation in certain jurisdictions may be restricted by law and persons into whose possession this document or any related oral presentation comes should inform themselves about, and observe, any such restriction. Any failure to comply with these restrictions may constitute a violation of the laws of any such other jurisdiction. The information contained herein does not constitute investment, legal, accounting, regulatory, taxation or other advice and the information does not take into account your investment objectives or legal, accounting, regulatory, taxation or financial situation or particular needs. You are solely responsible for forming your own opinions and conclusions on such matters and the market and for making your own independent assessment of the information. You are solely responsible for seeking independent professional advice in relation to the information and any action taken on the basis of the information. The following presentation may contain "forward-looking statements,” including any statements that may be contained in the presentation that reflect the Company’s expectations or beliefs with respect to future events and financial performance. These forward-looking statements are subject to certain risks and uncertainties that could cause actual results to differ materially from those contained in any forward-looking statement made by or on behalf of the Company, including the risk that changes in Douglas Elliman Inc.’s capital expenditures impact its expected free cash flow and the other risk factors described in Douglas Elliman Inc.’s annual report on Form 10-K for the year ended December 31, 2021 and, when filed with the SEC, Form 10-K for the year ended year ended December 31, 2022. Please also refer to Douglas Elliman Inc.'s Current Reports on Form 8-K, filed on March 10, 2023 (Commission File Number 1-41054) as filed with the SEC for information, including cautionary and explanatory language, relating to Non-GAAP Financial Measures in this Presentation labeled "Adjusted". Results actually achieved may differ materially from expected results included in these forward-looking statements as a result of these or other factors. Due to such uncertainties and risks, potential investors are cautioned not to place undue reliance on such forward-looking statements, which speak only as of the date on which such statements are made. The Company disclaims any obligation to, and does not undertake to, update or revise any forward- looking statements in this presentation.


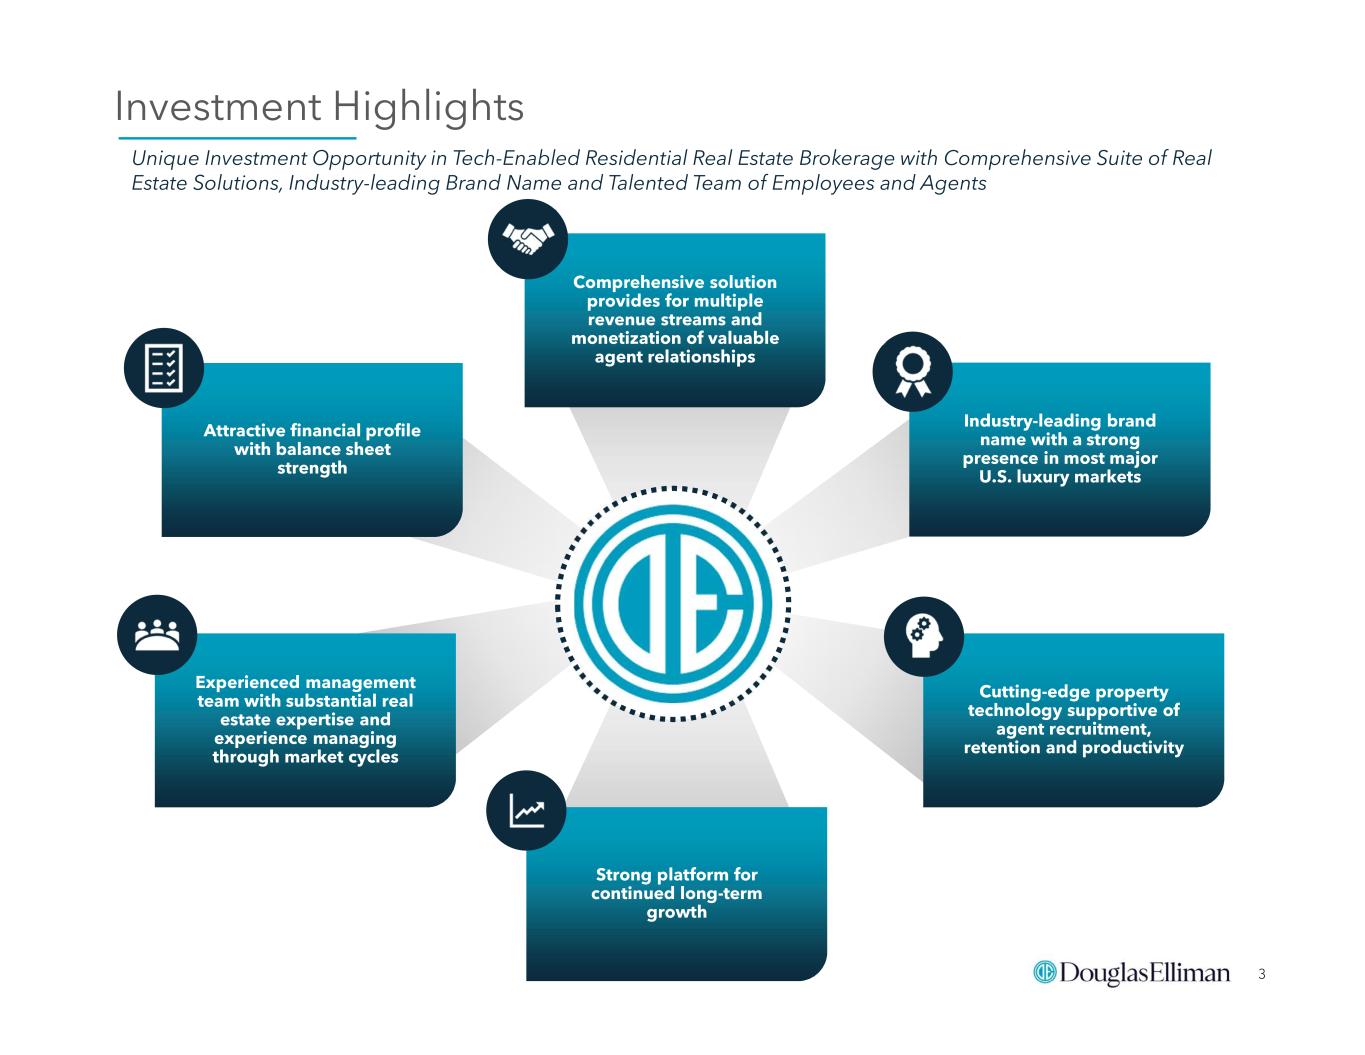
3 Investment Highlights Unique Investment Opportunity in Tech-Enabled Residential Real Estate Brokerage with Comprehensive Suite of Real Estate Solutions, Industry-leading Brand Name and Talented Team of Employees and Agents Cutting-edge property technology supportive of agent recruitment, retention and productivity Strong platform for continued long-term growth Comprehensive solution provides for multiple revenue streams and monetization of valuable agent relationships Experienced management team with substantial real estate expertise and experience managing through market cycles Industry-leading brand name with a strong presence in most major U.S. luxury markets Attractive financial profile with balance sheet strength


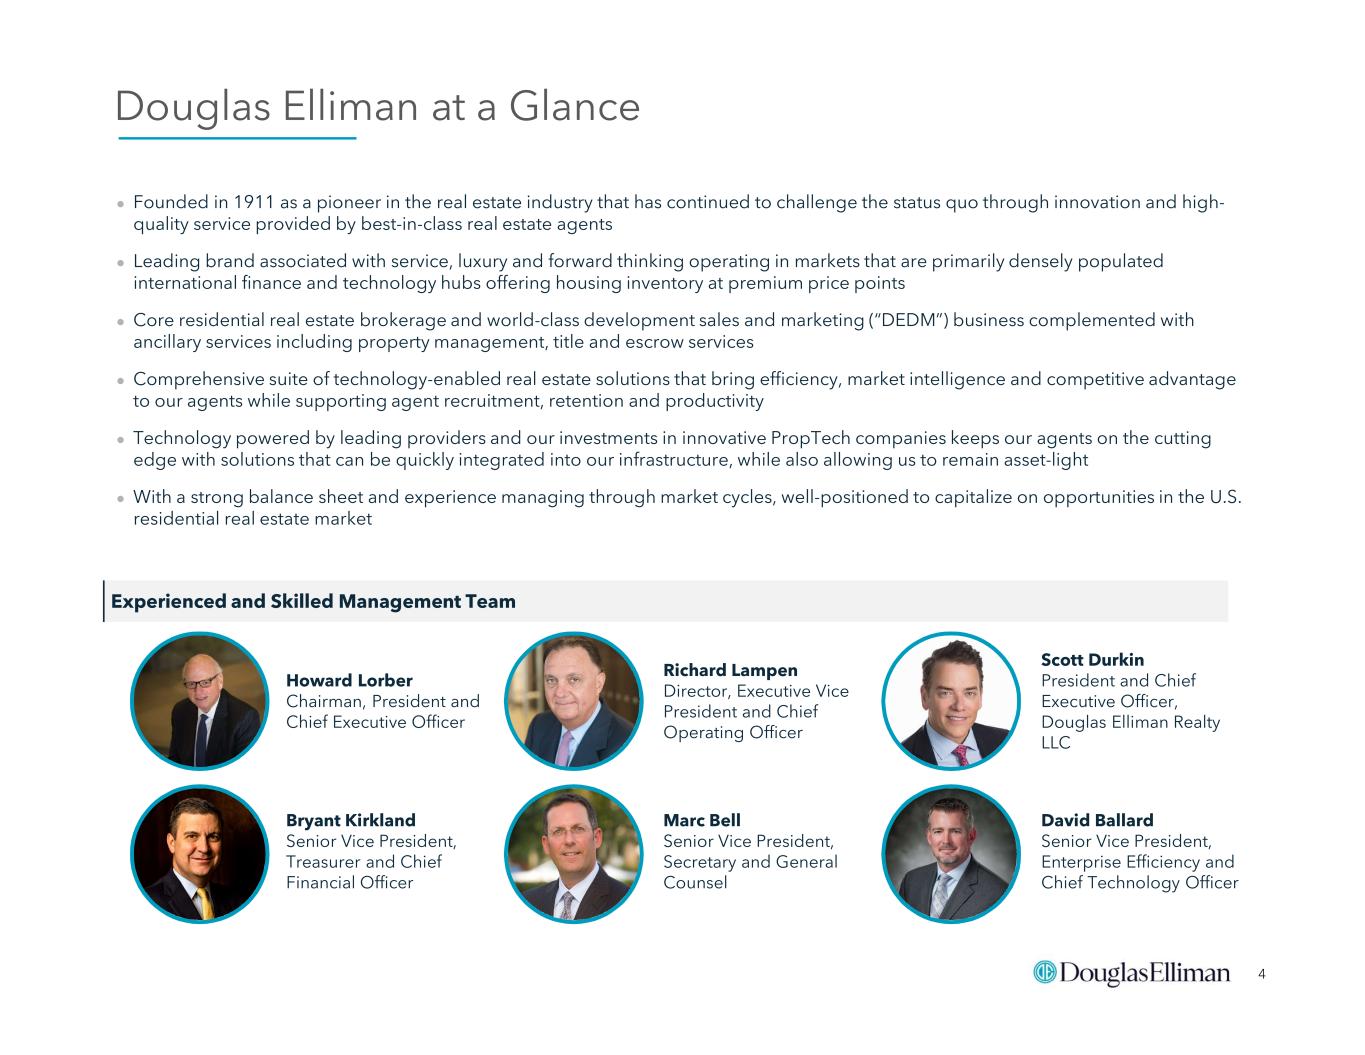
4  Founded in 1911 as a pioneer in the real estate industry that has continued to challenge the status quo through innovation and high- quality service provided by best-in-class real estate agents  Leading brand associated with service, luxury and forward thinking operating in markets that are primarily densely populated international finance and technology hubs offering housing inventory at premium price points  Core residential real estate brokerage and world-class development sales and marketing (“DEDM”) business complemented with ancillary services including property management, title and escrow services  Comprehensive suite of technology-enabled real estate solutions that bring efficiency, market intelligence and competitive advantage to our agents while supporting agent recruitment, retention and productivity  Technology powered by leading providers and our investments in innovative PropTech companies keeps our agents on the cutting edge with solutions that can be quickly integrated into our infrastructure, while also allowing us to remain asset-light  With a strong balance sheet and experience managing through market cycles, well-positioned to capitalize on opportunities in the U.S. residential real estate market Douglas Elliman at a Glance Bryant Kirkland Senior Vice President, Treasurer and Chief Financial Officer Marc Bell Senior Vice President, Secretary and General Counsel David Ballard Senior Vice President, Enterprise Efficiency and Chief Technology Officer Howard Lorber Chairman, President and Chief Executive Officer Richard Lampen Director, Executive Vice President and Chief Operating Officer Scott Durkin President and Chief Executive Officer, Douglas Elliman Realty LLC Experienced and Skilled Management Team


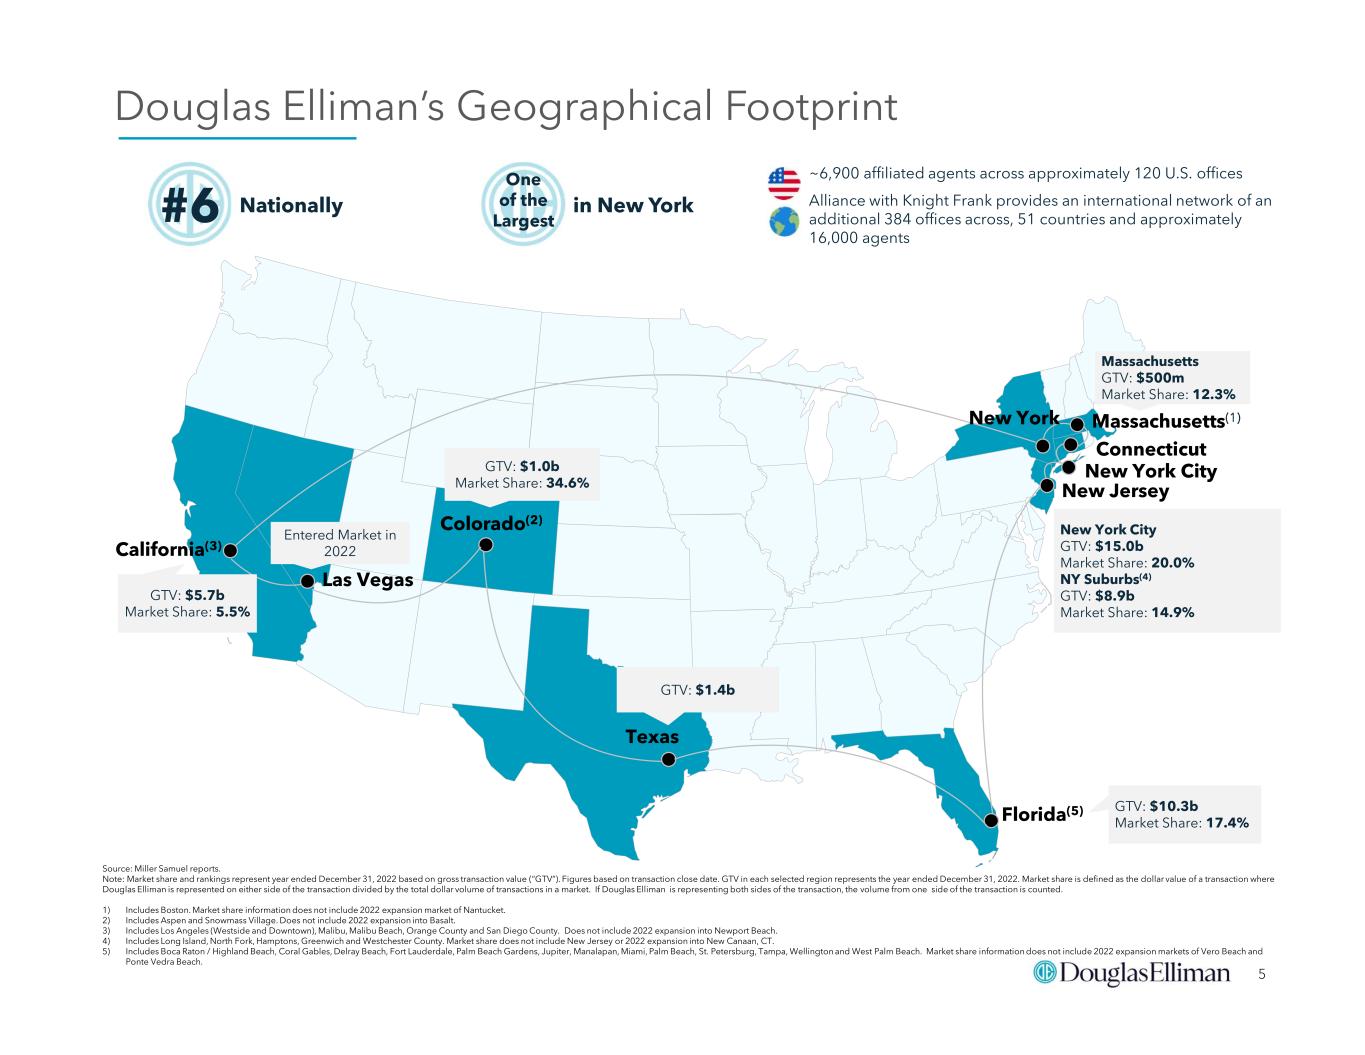
5 Douglas Elliman’s Geographical Footprint ~6,900 affiliated agents across approximately 120 U.S. offices Alliance with Knight Frank provides an international network of an additional 384 offices across, 51 countries and approximately 16,000 agents #6 Nationally One of the Largest in New York California(3) Colorado(2) Texas Florida(5) New York City New York New Jersey Massachusetts(1) Connecticut GTV: $5.7b Market Share: 5.5% GTV: $1.0b Market Share: 34.6% GTV: $1.4b GTV: $10.3b Market Share: 17.4% New York City GTV: $15.0b Market Share: 20.0% NY Suburbs(4) GTV: $8.9b Market Share: 14.9% Massachusetts GTV: $500m Market Share: 12.3% Source: Miller Samuel reports. Note: Market share and rankings represent year ended December 31, 2022 based on gross transaction value (“GTV”). Figures based on transaction close date. GTV in each selected region represents the year ended December 31, 2022. Market share is defined as the dollar value of a transaction where Douglas Elliman is represented on either side of the transaction divided by the total dollar volume of transactions in a market. If Douglas Elliman is representing both sides of the transaction, the volume from one side of the transaction is counted. 1) Includes Boston. Market share information does not include 2022 expansion market of Nantucket. 2) Includes Aspen and Snowmass Village. Does not include 2022 expansion into Basalt. 3) Includes Los Angeles (Westside and Downtown), Malibu, Malibu Beach, Orange County and San Diego County. Does not include 2022 expansion into Newport Beach. 4) Includes Long Island, North Fork, Hamptons, Greenwich and Westchester County. Market share does not include New Jersey or 2022 expansion into New Canaan, CT. 5) Includes Boca Raton / Highland Beach, Coral Gables, Delray Beach, Fort Lauderdale, Palm Beach Gardens, Jupiter, Manalapan, Miami, Palm Beach, St. Petersburg, Tampa, Wellington and West Palm Beach. Market share information does not include 2022 expansion markets of Vero Beach and Ponte Vedra Beach. Entered Market in 2022 Las Vegas


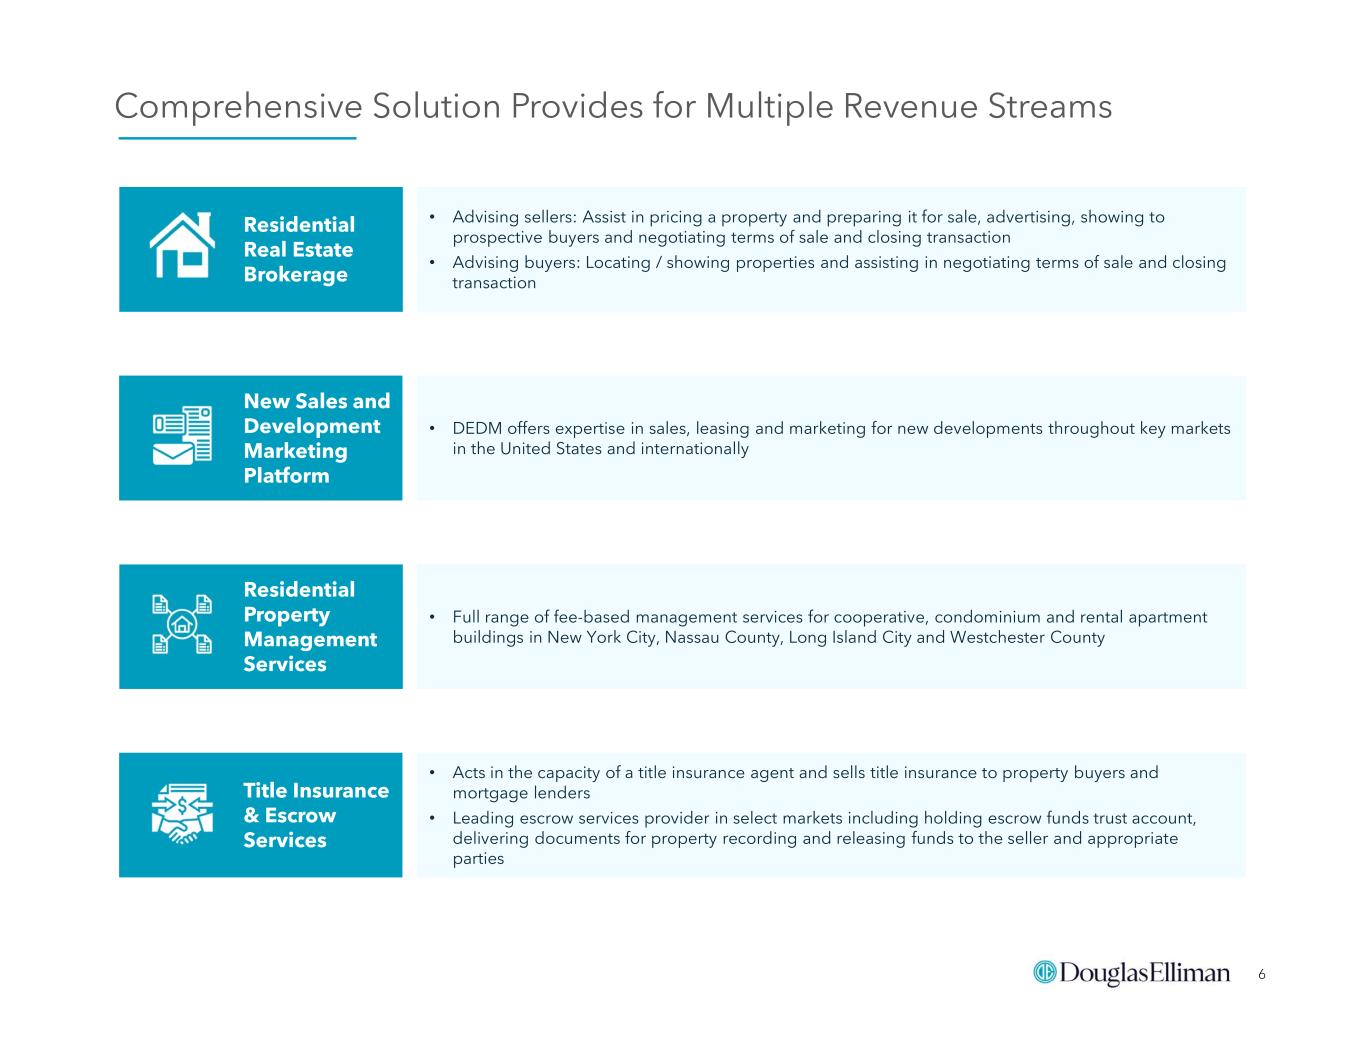
6 Comprehensive Solution Provides for Multiple Revenue Streams • DEDM offers expertise in sales, leasing and marketing for new developments throughout key markets in the United States and internationally New Sales and Development Marketing Platform • Advising sellers: Assist in pricing a property and preparing it for sale, advertising, showing to prospective buyers and negotiating terms of sale and closing transaction • Advising buyers: Locating / showing properties and assisting in negotiating terms of sale and closing transaction Residential Real Estate Brokerage • Acts in the capacity of a title insurance agent and sells title insurance to property buyers and mortgage lenders • Leading escrow services provider in select markets including holding escrow funds trust account, delivering documents for property recording and releasing funds to the seller and appropriate parties Title Insurance & Escrow Services • Full range of fee-based management services for cooperative, condominium and rental apartment buildings in New York City, Nassau County, Long Island City and Westchester County Residential Property Management Services


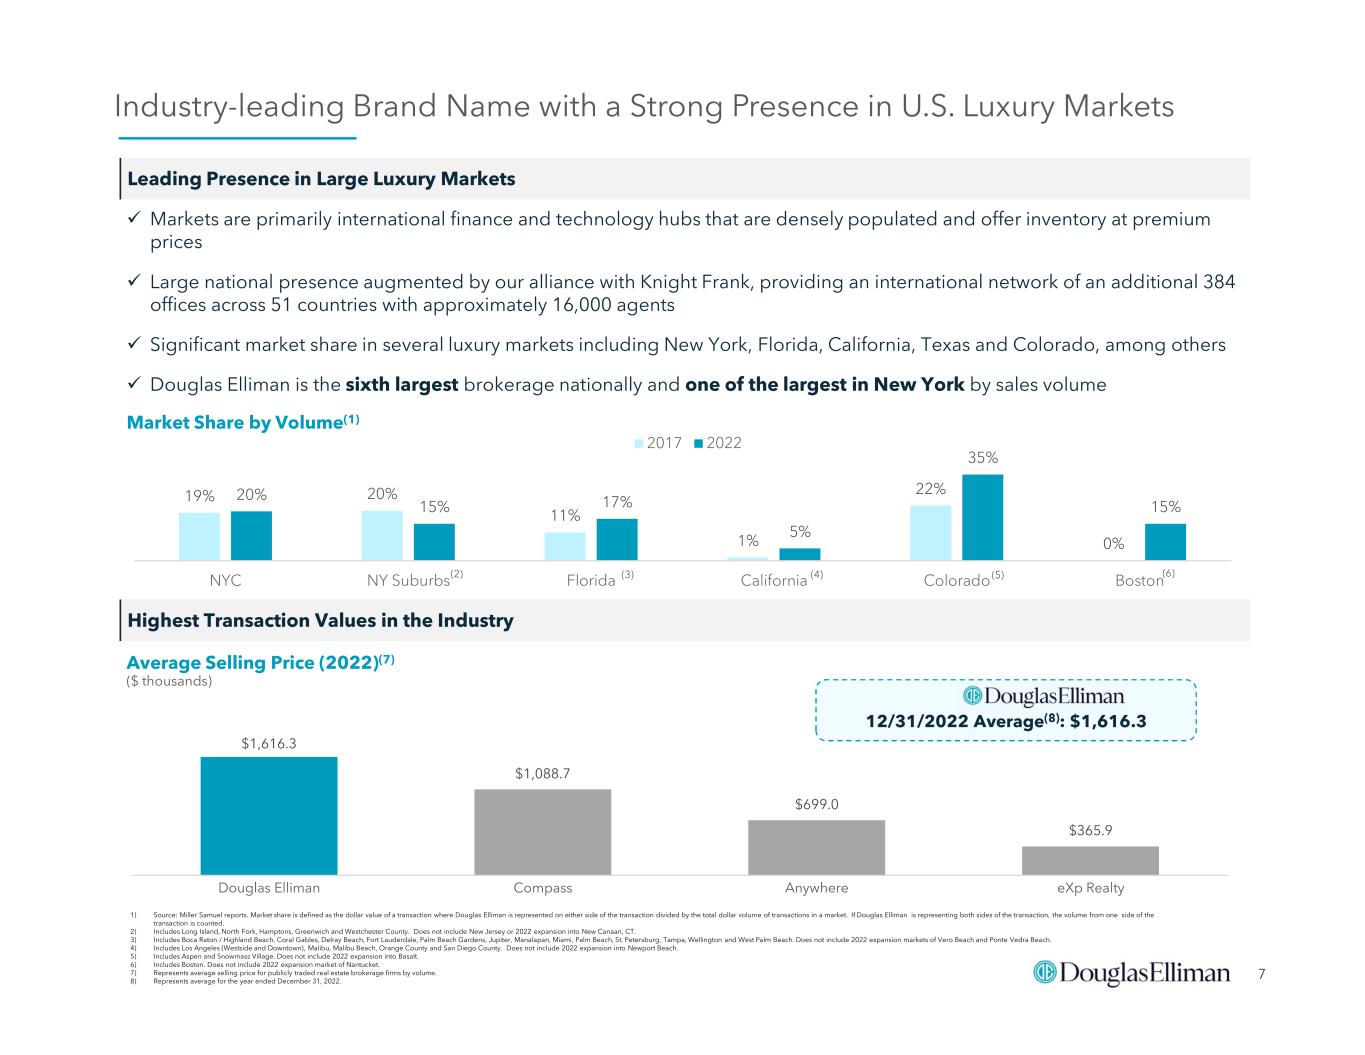
7 12/31/2022 Average(8): $1,616.3 Industry-leading Brand Name with a Strong Presence in U.S. Luxury Markets $1,616.3 $1,088.7 $699.0 $365.9 Douglas Elliman Compass Anywhere eXp Realty Highest Transaction Values in the Industry Average Selling Price (2022)(7) ($ thousands) Leading Presence in Large Luxury Markets  Markets are primarily international finance and technology hubs that are densely populated and offer inventory at premium prices  Large national presence augmented by our alliance with Knight Frank, providing an international network of an additional 384 offices across 51 countries with approximately 16,000 agents  Significant market share in several luxury markets including New York, Florida, California, Texas and Colorado, among others  Douglas Elliman is the sixth largest brokerage nationally and one of the largest in New York by sales volume 19% 20% 11% 1% 22% 0% 20% 15% 17% 5% 35% 15% NYC NY Suburbs Florida California Colorado Boston 2017 2022 Market Share by Volume(1) (2) 1) Source: Miller Samuel reports. Market share is defined as the dollar value of a transaction where Douglas Elliman is represented on either side of the transaction divided by the total dollar volume of transactions in a market. If Douglas Elliman is representing both sides of the transaction, the volume from one side of the transaction is counted. 2) Includes Long Island, North Fork, Hamptons, Greenwich and Westchester County. Does not include New Jersey or 2022 expansion into New Canaan, CT. 3) Includes Boca Raton / Highland Beach, Coral Gables, Delray Beach, Fort Lauderdale, Palm Beach Gardens, Jupiter, Manalapan, Miami, Palm Beach, St. Petersburg, Tampa, Wellington and West Palm Beach. Does not include 2022 expansion markets of Vero Beach and Ponte Vedra Beach. 4) Includes Los Angeles (Westside and Downtown), Malibu, Malibu Beach, Orange County and San Diego County. Does not include 2022 expansion into Newport Beach. 5) Includes Aspen and Snowmass Village. Does not include 2022 expansion into Basalt. 6) Includes Boston. Does not include 2022 expansion market of Nantucket. 7) Represents average selling price for publicly traded real estate brokerage firms by volume. 8) Represents average for the year ended December 31, 2022. (3) (4) (5) (6)


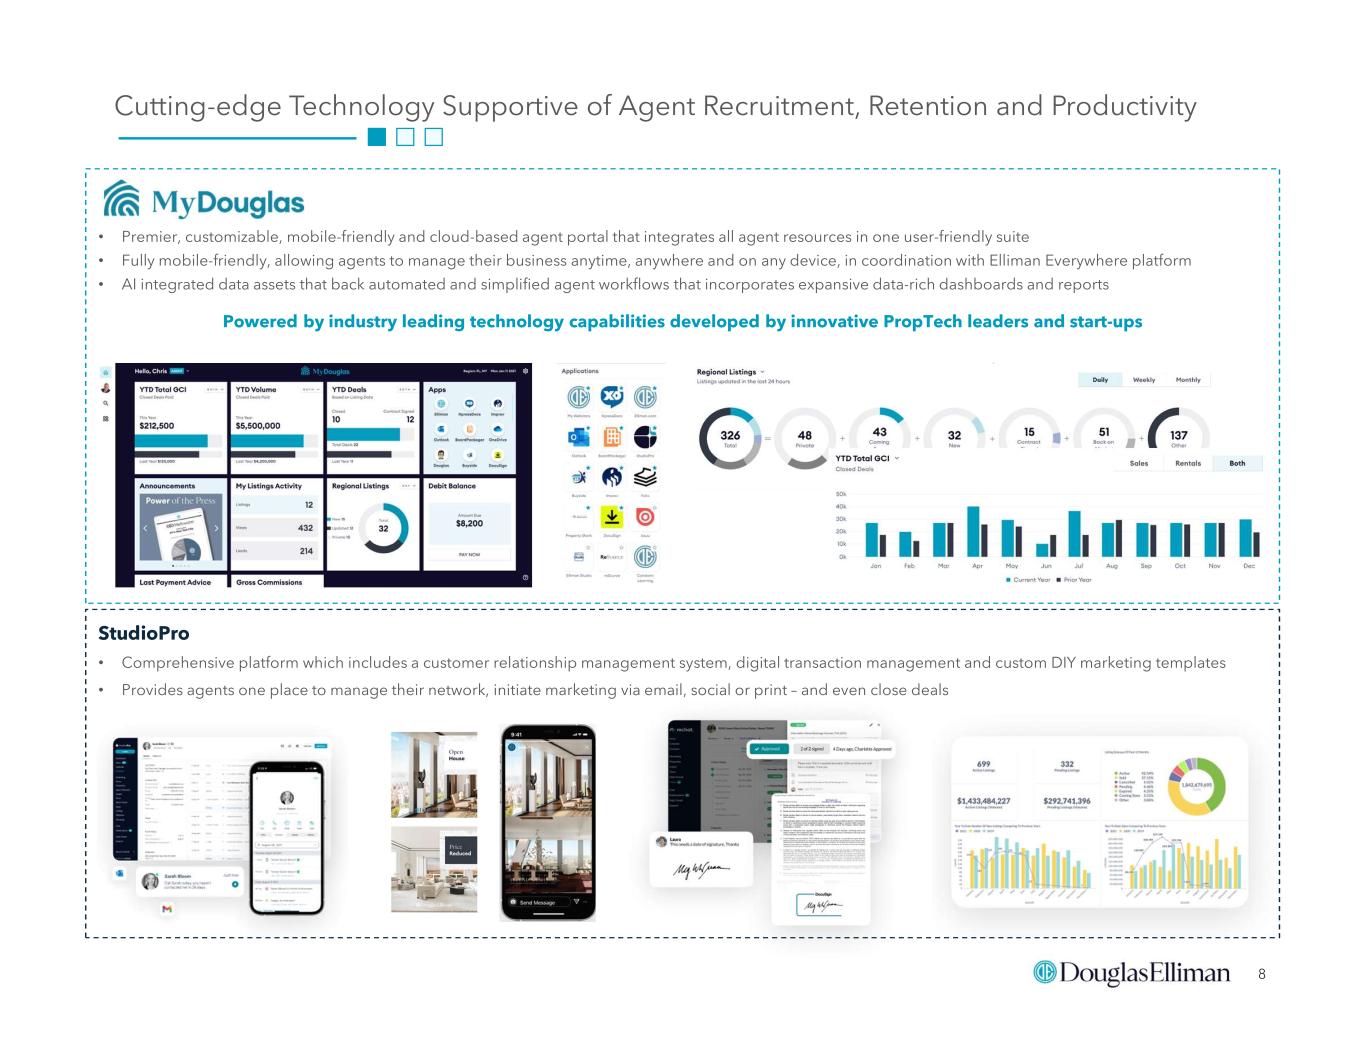
8 Cutting-edge Technology Supportive of Agent Recruitment, Retention and Productivity Powered by industry leading technology capabilities developed by innovative PropTech leaders and start-ups • Premier, customizable, mobile-friendly and cloud-based agent portal that integrates all agent resources in one user-friendly suite • Fully mobile-friendly, allowing agents to manage their business anytime, anywhere and on any device, in coordination with Elliman Everywhere platform • AI integrated data assets that back automated and simplified agent workflows that incorporates expansive data-rich dashboards and reports StudioPro • Comprehensive platform which includes a customer relationship management system, digital transaction management and custom DIY marketing templates • Provides agents one place to manage their network, initiate marketing via email, social or print – and even close deals


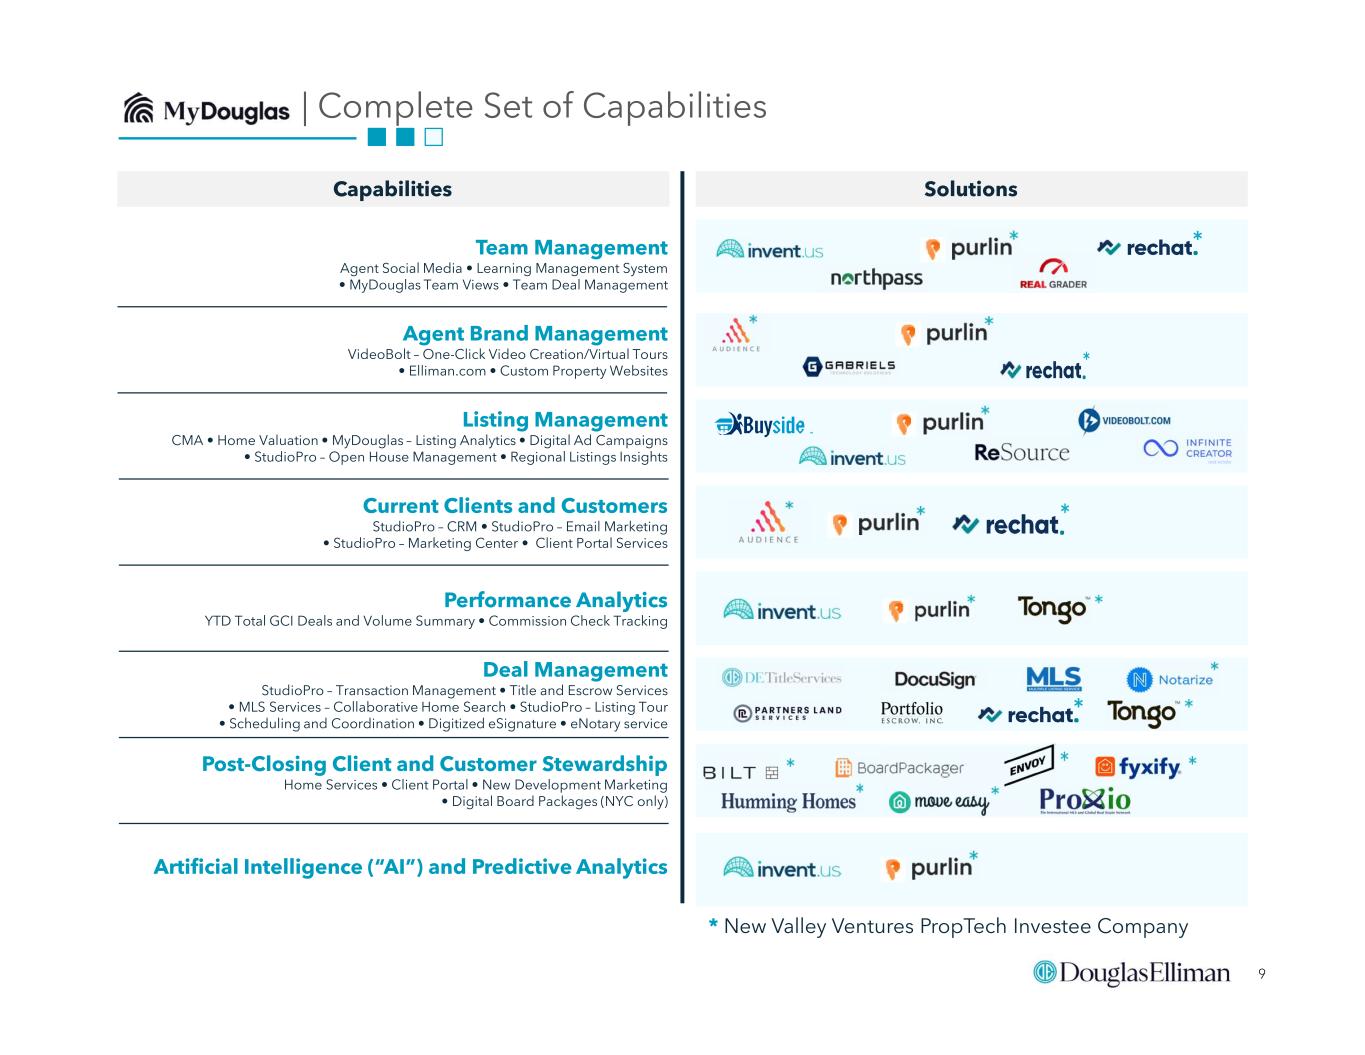
9 * New Valley Ventures PropTech Investee Company MyDouglas | Complete Set of Capabilities Capabilities Solutions Artificial Intelligence (“AI”) and Predictive Analytics Team Management Agent Social Media • Learning Management System • MyDouglas Team Views • Team Deal Management Agent Brand Management VideoBolt – One-Click Video Creation/Virtual Tours • Elliman.com • Custom Property Websites Listing Management CMA • Home Valuation • MyDouglas – Listing Analytics • Digital Ad Campaigns • StudioPro – Open House Management • Regional Listings Insights Current Clients and Customers StudioPro – CRM • StudioPro – Email Marketing • StudioPro – Marketing Center • Client Portal Services Performance Analytics YTD Total GCI Deals and Volume Summary • Commission Check Tracking Deal Management StudioPro – Transaction Management • Title and Escrow Services • MLS Services – Collaborative Home Search • StudioPro – Listing Tour • Scheduling and Coordination • Digitized eSignature • eNotary service Post-Closing Client and Customer Stewardship Home Services • Client Portal • New Development Marketing • Digital Board Packages (NYC only)


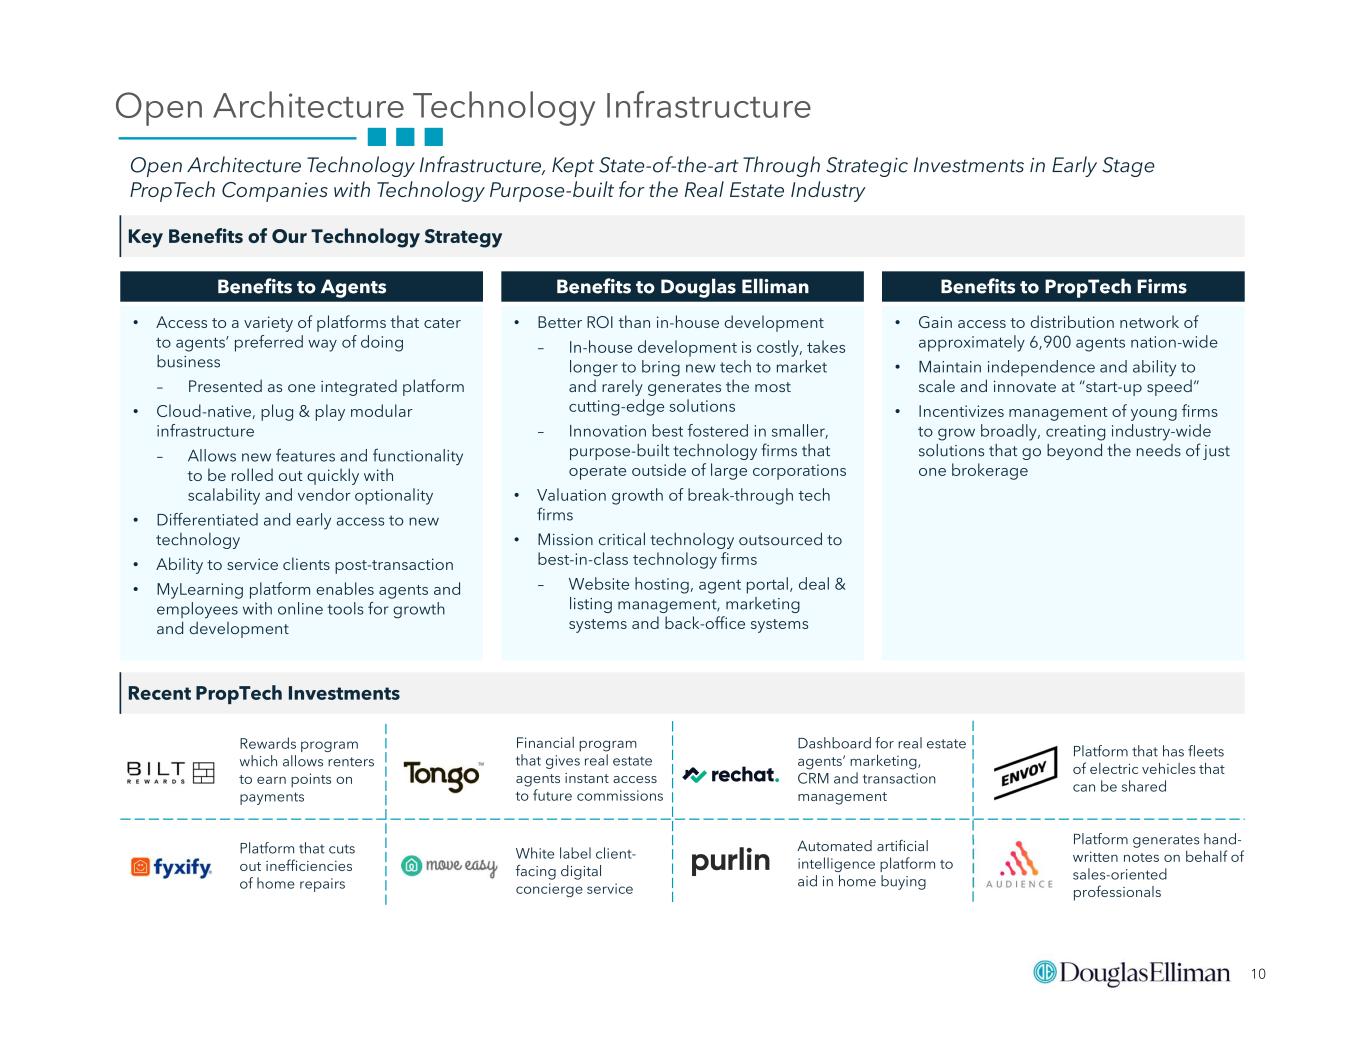
10 Open Architecture Technology Infrastructure Open Architecture Technology Infrastructure, Kept State-of-the-art Through Strategic Investments in Early Stage PropTech Companies with Technology Purpose-built for the Real Estate Industry Key Benefits of Our Technology Strategy Recent PropTech Investments Financial program that gives real estate agents instant access to future commissions Rewards program which allows renters to earn points on payments Dashboard for real estate agents’ marketing, CRM and transaction management Platform that cuts out inefficiencies of home repairs White label client- facing digital concierge service Automated artificial intelligence platform to aid in home buying Benefits to Agents Benefits to Douglas Elliman • Access to a variety of platforms that cater to agents’ preferred way of doing business – Presented as one integrated platform • Cloud-native, plug & play modular infrastructure – Allows new features and functionality to be rolled out quickly with scalability and vendor optionality • Differentiated and early access to new technology • Ability to service clients post-transaction • MyLearning platform enables agents and employees with online tools for growth and development • Better ROI than in-house development – In-house development is costly, takes longer to bring new tech to market and rarely generates the most cutting-edge solutions – Innovation best fostered in smaller, purpose-built technology firms that operate outside of large corporations • Valuation growth of break-through tech firms • Mission critical technology outsourced to best-in-class technology firms – Website hosting, agent portal, deal & listing management, marketing systems and back-office systems • Gain access to distribution network of approximately 6,900 agents nation-wide • Maintain independence and ability to scale and innovate at “start-up speed” • Incentivizes management of young firms to grow broadly, creating industry-wide solutions that go beyond the needs of just one brokerage Benefits to PropTech Firms Platform that has fleets of electric vehicles that can be shared Platform generates hand- written notes on behalf of sales-oriented professionals


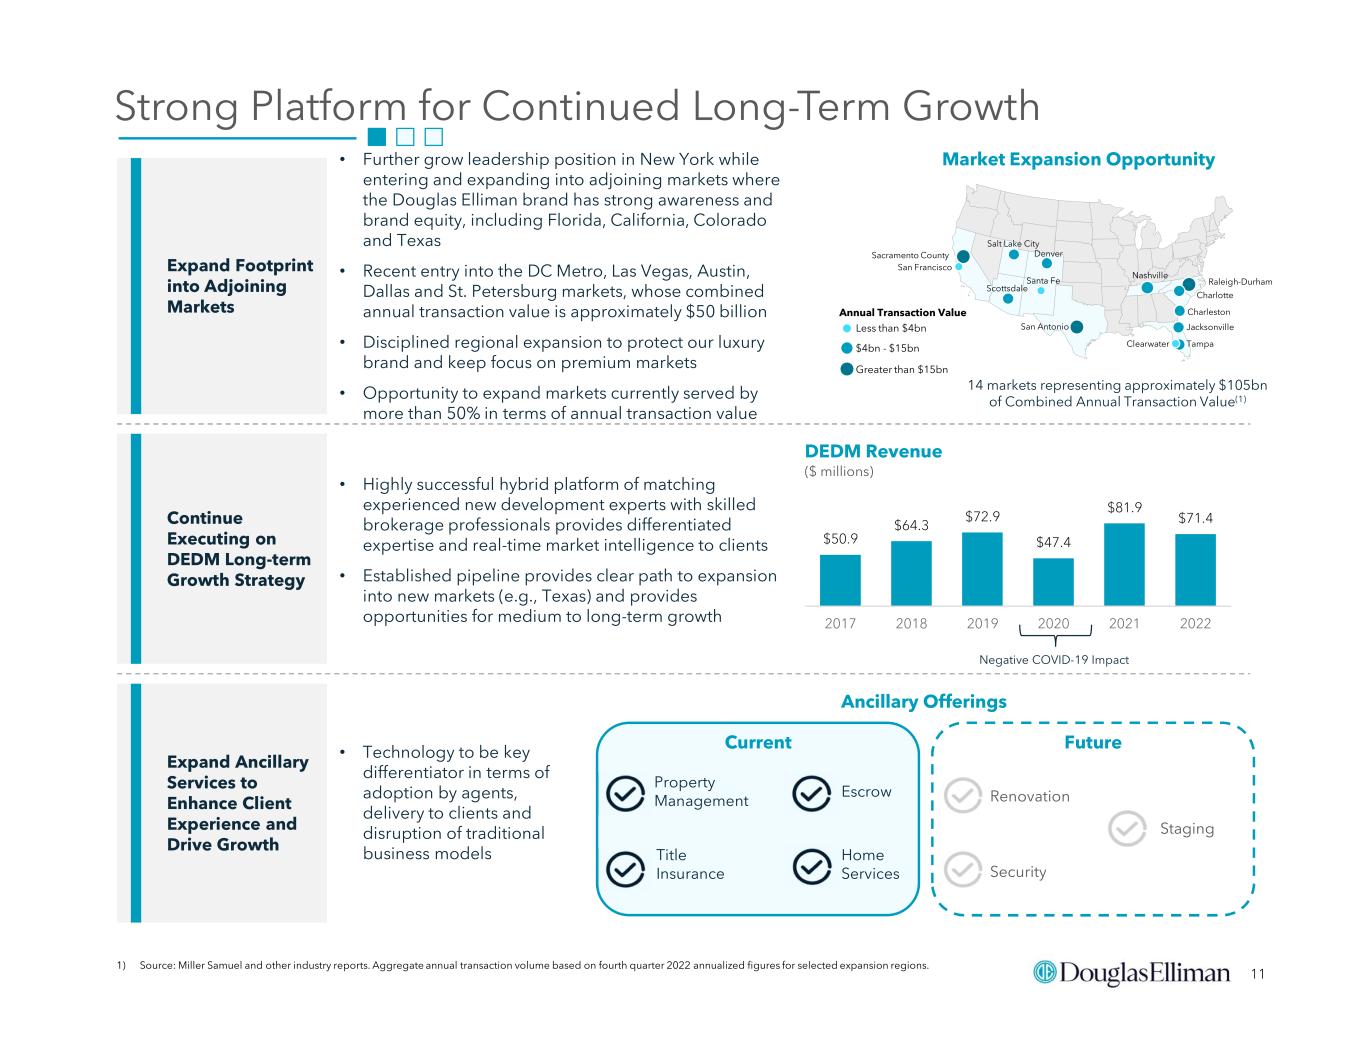
11 • Further grow leadership position in New York while entering and expanding into adjoining markets where the Douglas Elliman brand has strong awareness and brand equity, including Florida, California, Colorado and Texas • Recent entry into the DC Metro, Las Vegas, Austin, Dallas and St. Petersburg markets, whose combined annual transaction value is approximately $50 billion • Disciplined regional expansion to protect our luxury brand and keep focus on premium markets • Opportunity to expand markets currently served by more than 50% in terms of annual transaction value Strong Platform for Continued Long-Term Growth Continue Executing on DEDM Long-term Growth Strategy Expand Footprint into Adjoining Markets Expand Ancillary Services to Enhance Client Experience and Drive Growth • Highly successful hybrid platform of matching experienced new development experts with skilled brokerage professionals provides differentiated expertise and real-time market intelligence to clients • Established pipeline provides clear path to expansion into new markets (e.g., Texas) and provides opportunities for medium to long-term growth • Technology to be key differentiator in terms of adoption by agents, delivery to clients and disruption of traditional business models $50.9 $64.3 $72.9 $47.4 $81.9 $71.4 2017 2018 2019 2020 2021 2022 DEDM Revenue ($ millions) Negative COVID-19 Impact Ancillary Offerings Current Future Renovation Staging Security Market Expansion Opportunity Less than $4bn $4bn - $15bn Greater than $15bn Charleston Clearwater Denver Jacksonville Nashville Raleigh-Durham Charlotte Sacramento County Salt Lake City San Antonio San Francisco Santa Fe Scottsdale Tampa Annual Transaction Value 14 markets representing approximately $105bn of Combined Annual Transaction Value(1) 1) Source: Miller Samuel and other industry reports. Aggregate annual transaction volume based on fourth quarter 2022 annualized figures for selected expansion regions. Property Management Title Insurance Escrow Home Services


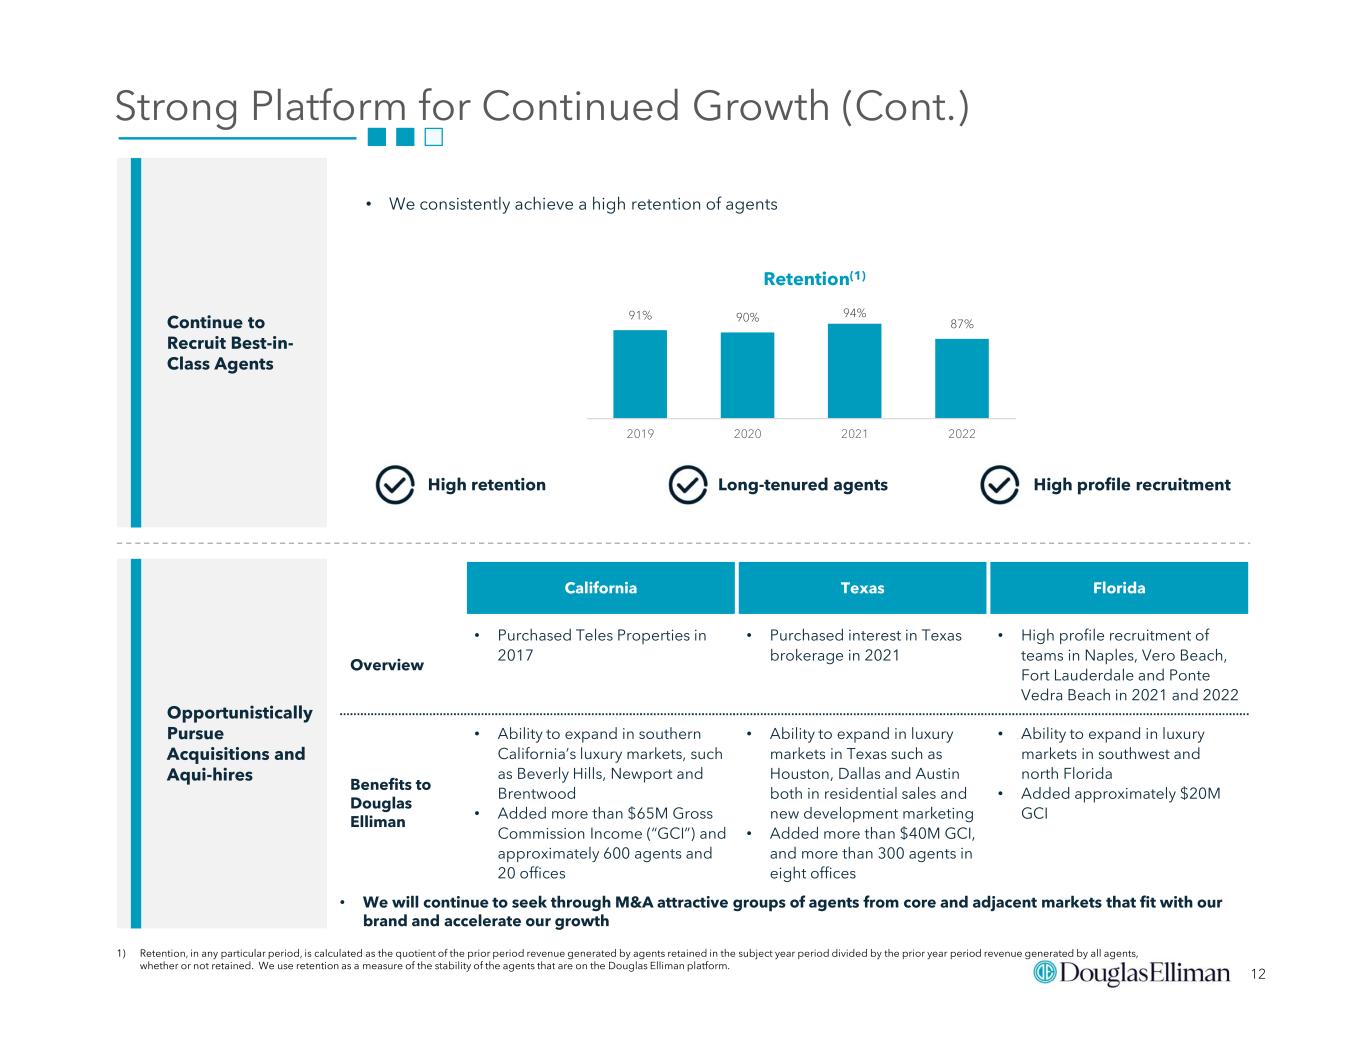
12 FloridaTexasCalifornia • High profile recruitment of teams in Naples, Vero Beach, Fort Lauderdale and Ponte Vedra Beach in 2021 and 2022 • Purchased interest in Texas brokerage in 2021 • Purchased Teles Properties in 2017 Overview • Ability to expand in luxury markets in southwest and north Florida • Added approximately $20M GCI • Ability to expand in luxury markets in Texas such as Houston, Dallas and Austin both in residential sales and new development marketing • Added more than $40M GCI, and more than 300 agents in eight offices • Ability to expand in southern California’s luxury markets, such as Beverly Hills, Newport and Brentwood • Added more than $65M Gross Commission Income (“GCI”) and approximately 600 agents and 20 offices Benefits to Douglas Elliman Strong Platform for Continued Growth (Cont.) Continue to Recruit Best-in- Class Agents Opportunistically Pursue Acquisitions and Aqui-hires 91% 90% 94% 87% 2019 2020 2021 2022 1) Retention, in any particular period, is calculated as the quotient of the prior period revenue generated by agents retained in the subject year period divided by the prior year period revenue generated by all agents, whether or not retained. We use retention as a measure of the stability of the agents that are on the Douglas Elliman platform. • We will continue to seek through M&A attractive groups of agents from core and adjacent markets that fit with our brand and accelerate our growth Retention(1) High profile recruitmentHigh retention Long-tenured agents • We consistently achieve a high retention of agents


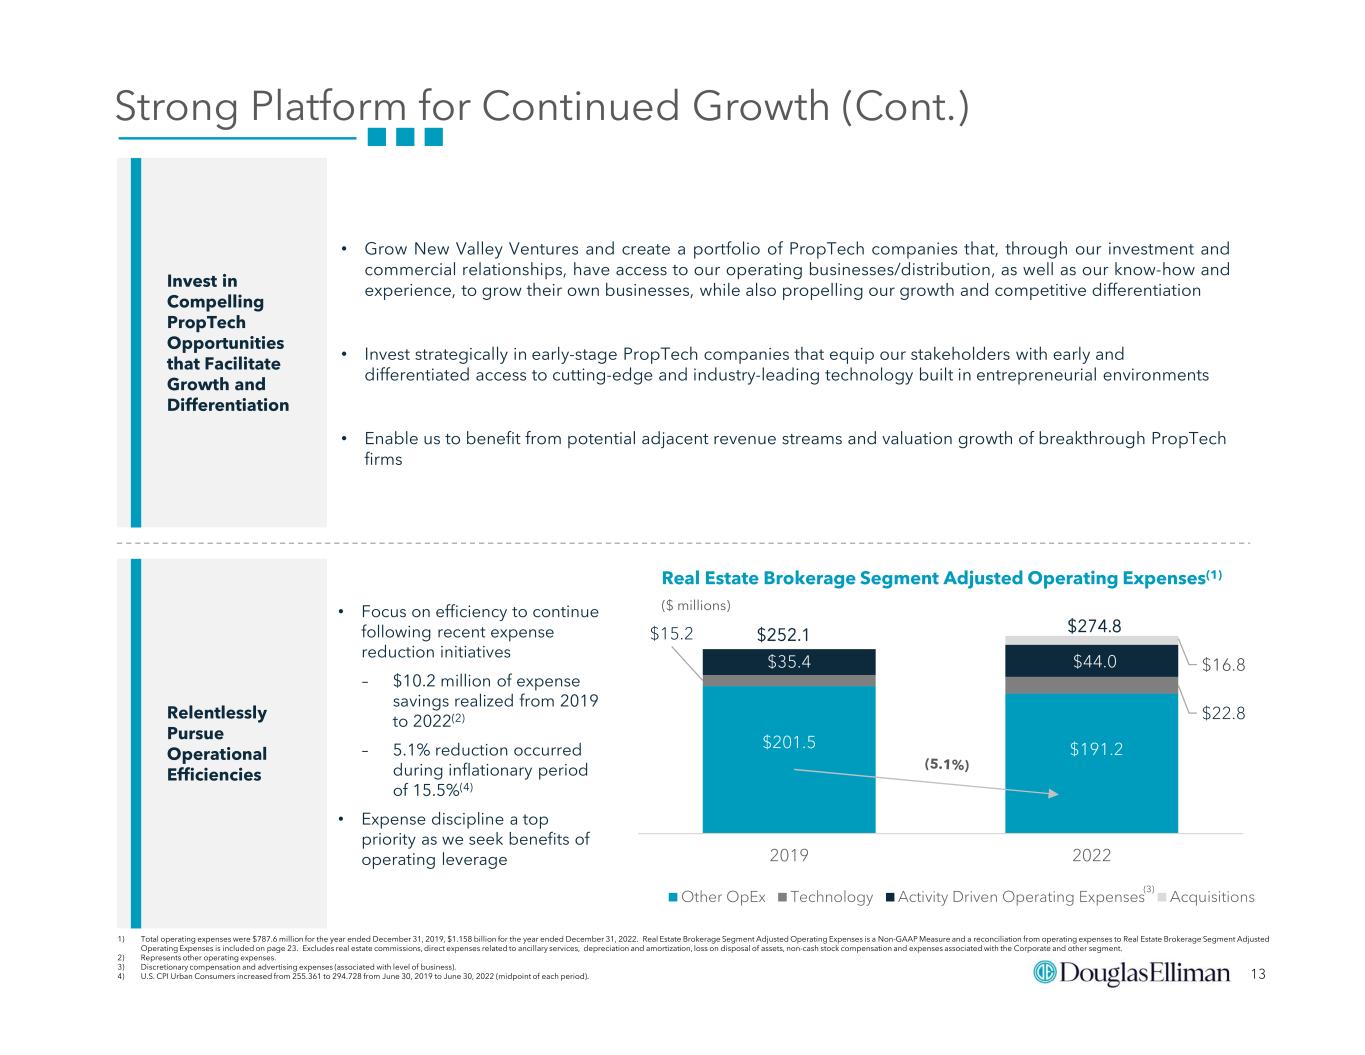
13 $201.5 $191.2 $15.2 $22.8 $35.4 $44.0 $16.8 2019 2022 Other OpEx Technology Activity Driven Operating Expenses Acquisitions Strong Platform for Continued Growth (Cont.) Invest in Compelling PropTech Opportunities that Facilitate Growth and Differentiation Relentlessly Pursue Operational Efficiencies • Grow New Valley Ventures and create a portfolio of PropTech companies that, through our investment and commercial relationships, have access to our operating businesses/distribution, as well as our know-how and experience, to grow their own businesses, while also propelling our growth and competitive differentiation • Invest strategically in early-stage PropTech companies that equip our stakeholders with early and differentiated access to cutting-edge and industry-leading technology built in entrepreneurial environments • Enable us to benefit from potential adjacent revenue streams and valuation growth of breakthrough PropTech firms • Focus on efficiency to continue following recent expense reduction initiatives – $10.2 million of expense savings realized from 2019 to 2022(2) – 5.1% reduction occurred during inflationary period of 15.5%(4) • Expense discipline a top priority as we seek benefits of operating leverage Real Estate Brokerage Segment Adjusted Operating Expenses(1) ($ millions) 1) Total operating expenses were $787.6 million for the year ended December 31, 2019, $1.158 billion for the year ended December 31, 2022. Real Estate Brokerage Segment Adjusted Operating Expenses is a Non-GAAP Measure and a reconciliation from operating expenses to Real Estate Brokerage Segment Adjusted Operating Expenses is included on page 23. Excludes real estate commissions, direct expenses related to ancillary services, depreciation and amortization, loss on disposal of assets, non-cash stock compensation and expenses associated with the Corporate and other segment. 2) Represents other operating expenses. 3) Discretionary compensation and advertising expenses (associated with level of business). 4) U.S. CPI Urban Consumers increased from 255.361 to 294.728 from June 30, 2019 to June 30, 2022 (midpoint of each period). (3) $274.8$252.1


DOUGLAS ELLIMAN FINANCIAL OVERVIEW


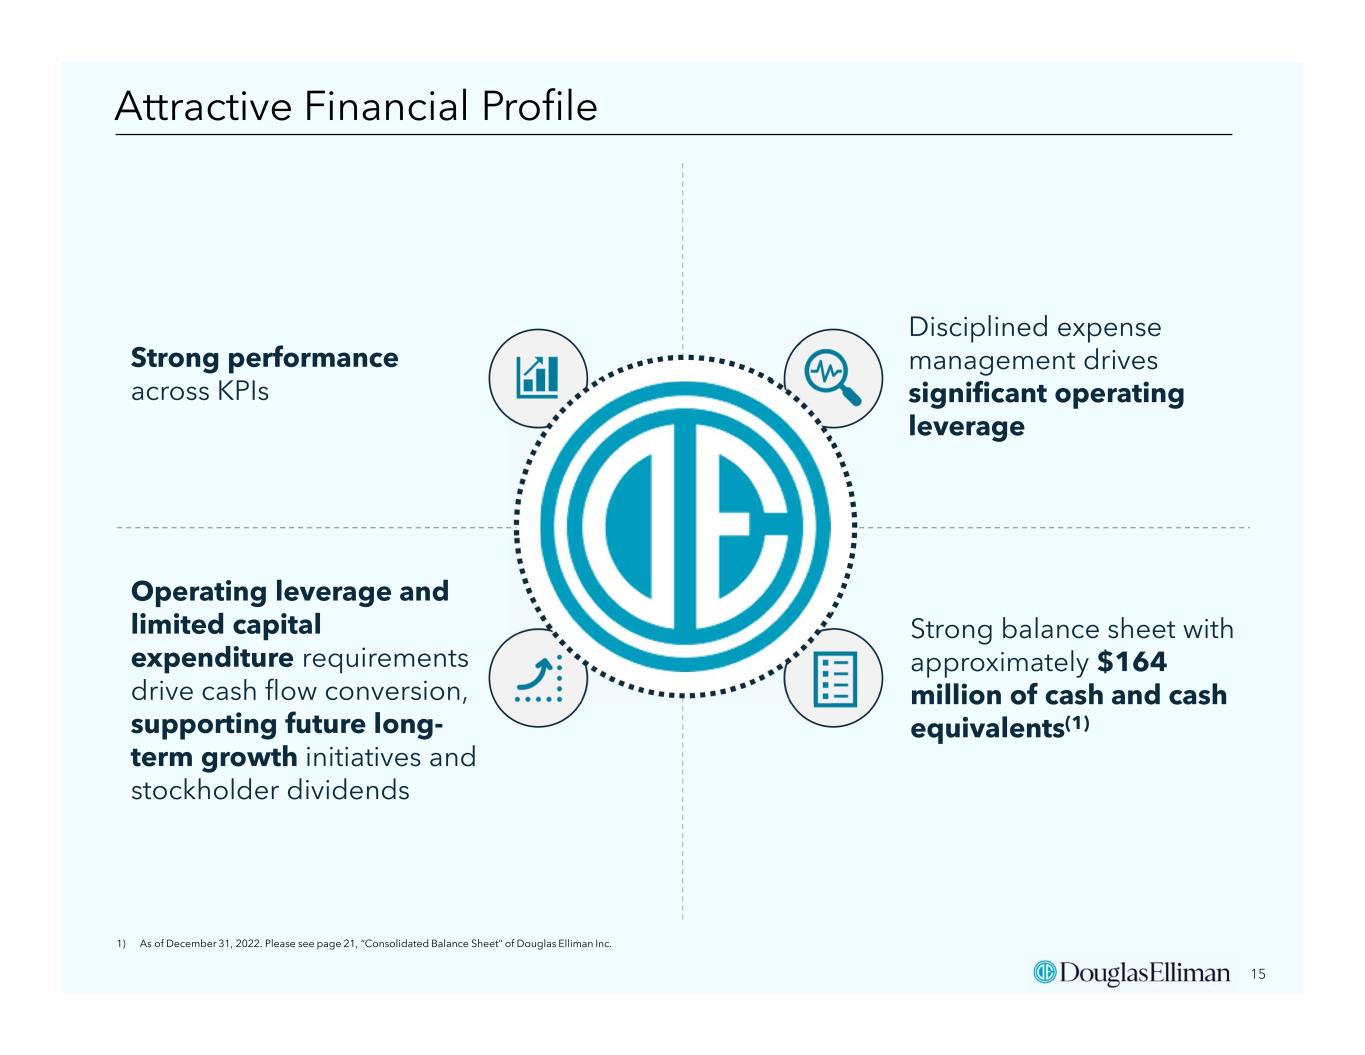
15 Attractive Financial Profile 1) As of December 31, 2022. Please see page 21, “Consolidated Balance Sheet" of Douglas Elliman Inc. Disciplined expense management drives significant operating leverage Strong performance across KPIs Operating leverage and limited capital expenditure requirements drive cash flow conversion, supporting future long- term growth initiatives and stockholder dividends Strong balance sheet with approximately $164 million of cash and cash equivalents(1)


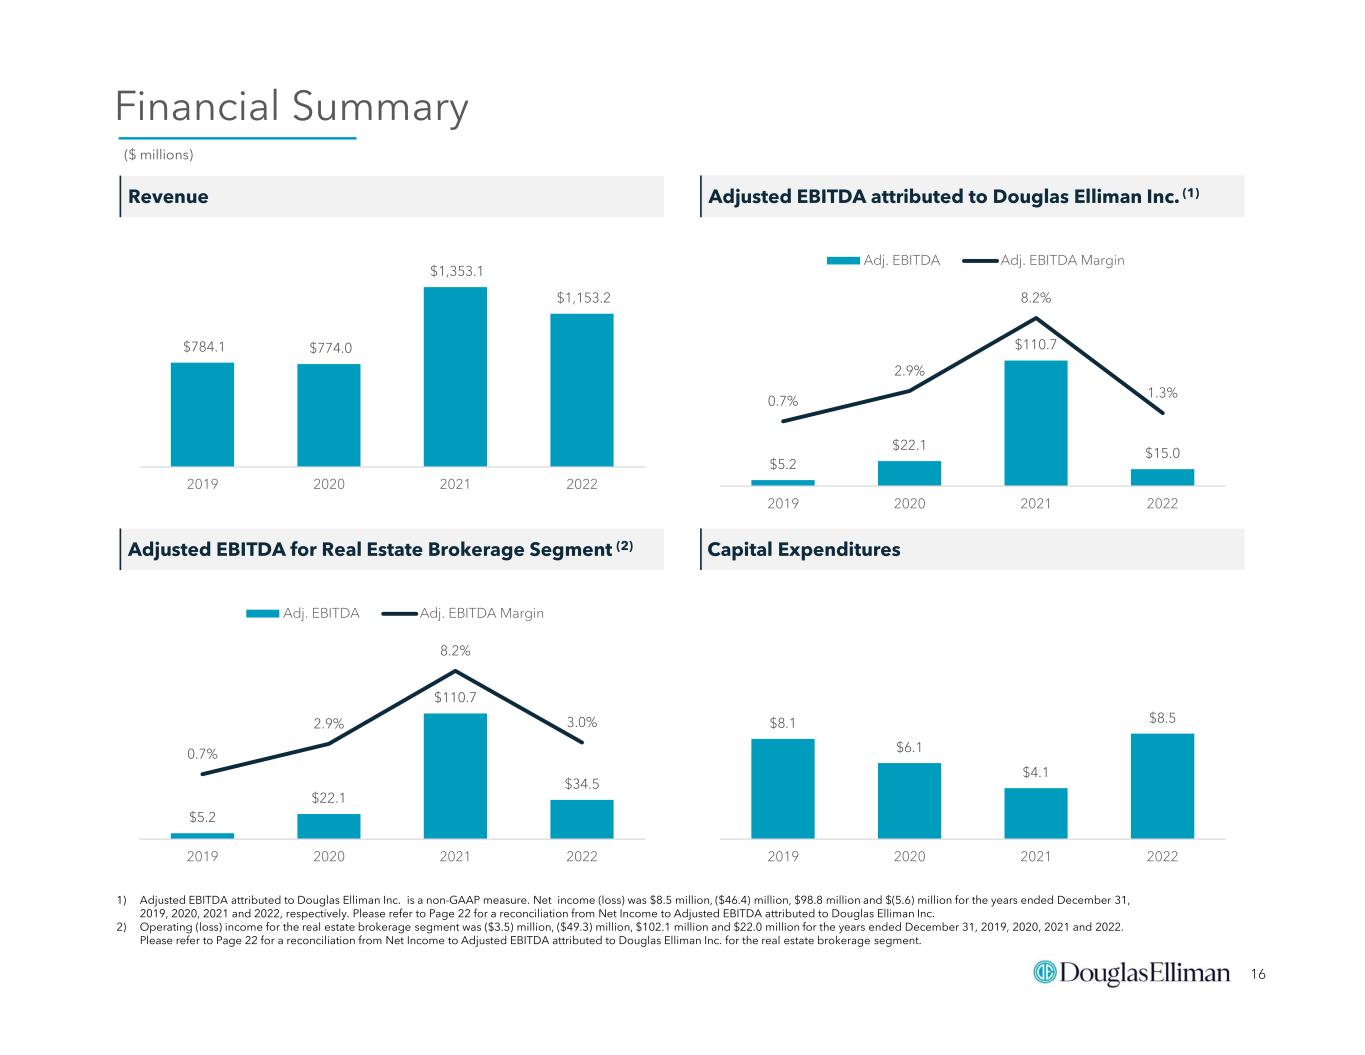
16 Financial Summary 1) Adjusted EBITDA attributed to Douglas Elliman Inc. is a non-GAAP measure. Net income (loss) was $8.5 million, ($46.4) million, $98.8 million and $(5.6) million for the years ended December 31, 2019, 2020, 2021 and 2022, respectively. Please refer to Page 22 for a reconciliation from Net Income to Adjusted EBITDA attributed to Douglas Elliman Inc. 2) Operating (loss) income for the real estate brokerage segment was ($3.5) million, ($49.3) million, $102.1 million and $22.0 million for the years ended December 31, 2019, 2020, 2021 and 2022. Please refer to Page 22 for a reconciliation from Net Income to Adjusted EBITDA attributed to Douglas Elliman Inc. for the real estate brokerage segment. Revenue Capital Expenditures ($ millions) $8.1 $6.1 $4.1 $8.5 2019 2020 2021 2022 $784.1 $774.0 $1,353.1 $1,153.2 2019 2020 2021 2022 Adjusted EBITDA attributed to Douglas Elliman Inc. (1) $5.2 $22.1 $110.7 $15.0 0.7% 2.9% 8.2% 1.3% 2019 2020 2021 2022 Adj. EBITDA Adj. EBITDA Margin Adjusted EBITDA for Real Estate Brokerage Segment (2) $5.2 $22.1 $110.7 $34.5 0.7% 2.9% 8.2% 3.0% 2019 2020 2021 2022 Adj. EBITDA Adj. EBITDA Margin


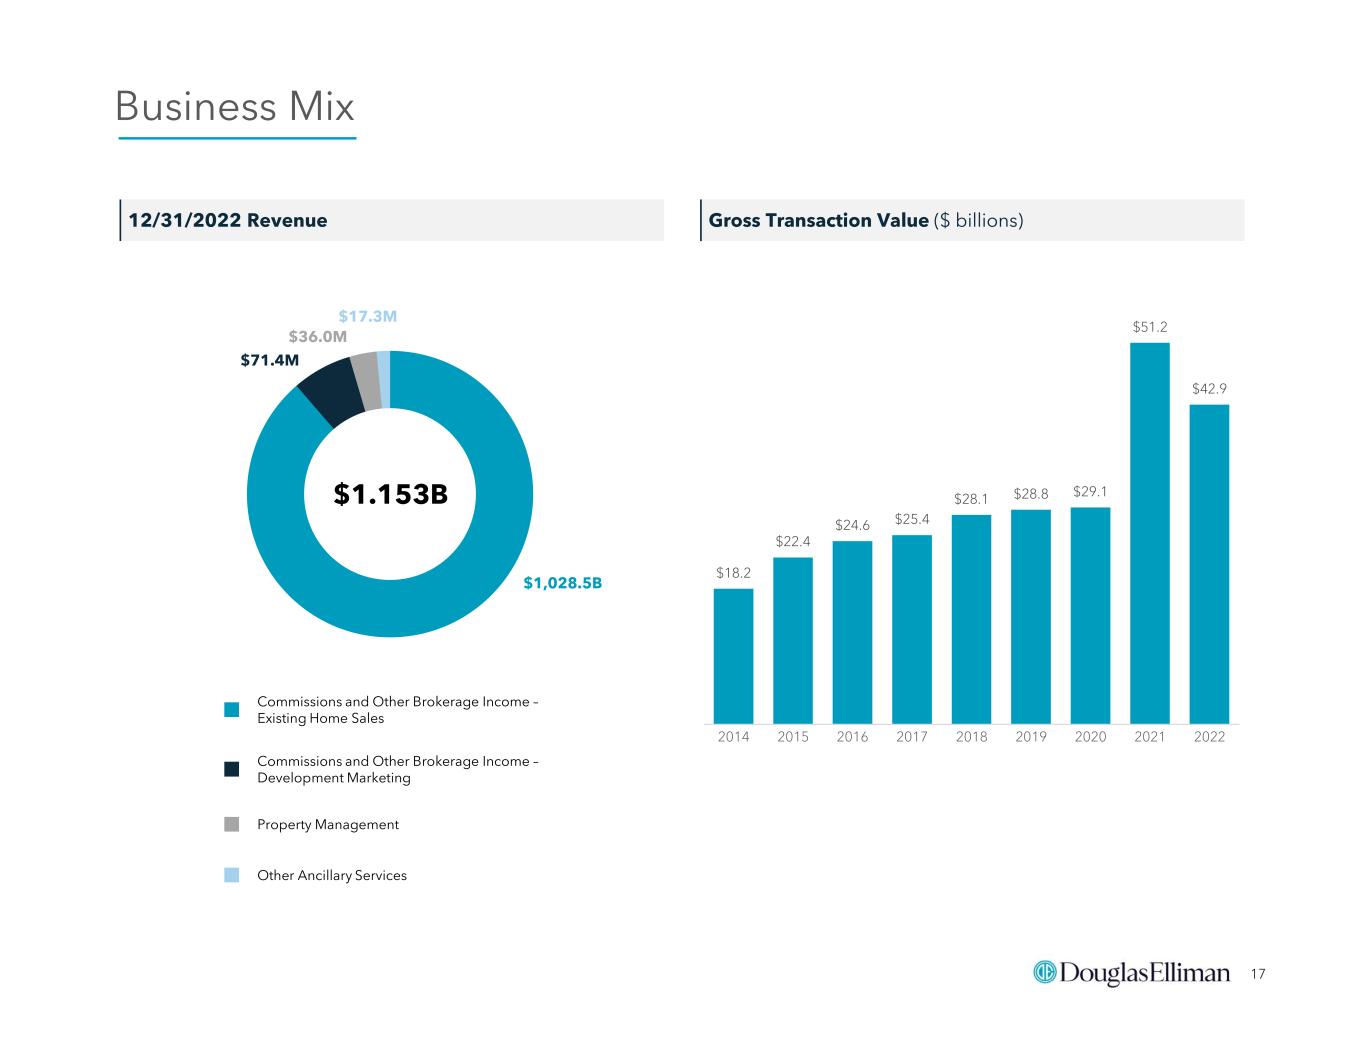
17 Business Mix $18.2 $22.4 $24.6 $25.4 $28.1 $28.8 $29.1 $51.2 $42.9 2014 2015 2016 2017 2018 2019 2020 2021 2022 12/31/2022 Revenue Gross Transaction Value ($ billions) $1,028.5B $71.4M $36.0M $17.3M $1.153B Commissions and Other Brokerage Income – Existing Home Sales Commissions and Other Brokerage Income – Development Marketing Property Management Other Ancillary Services


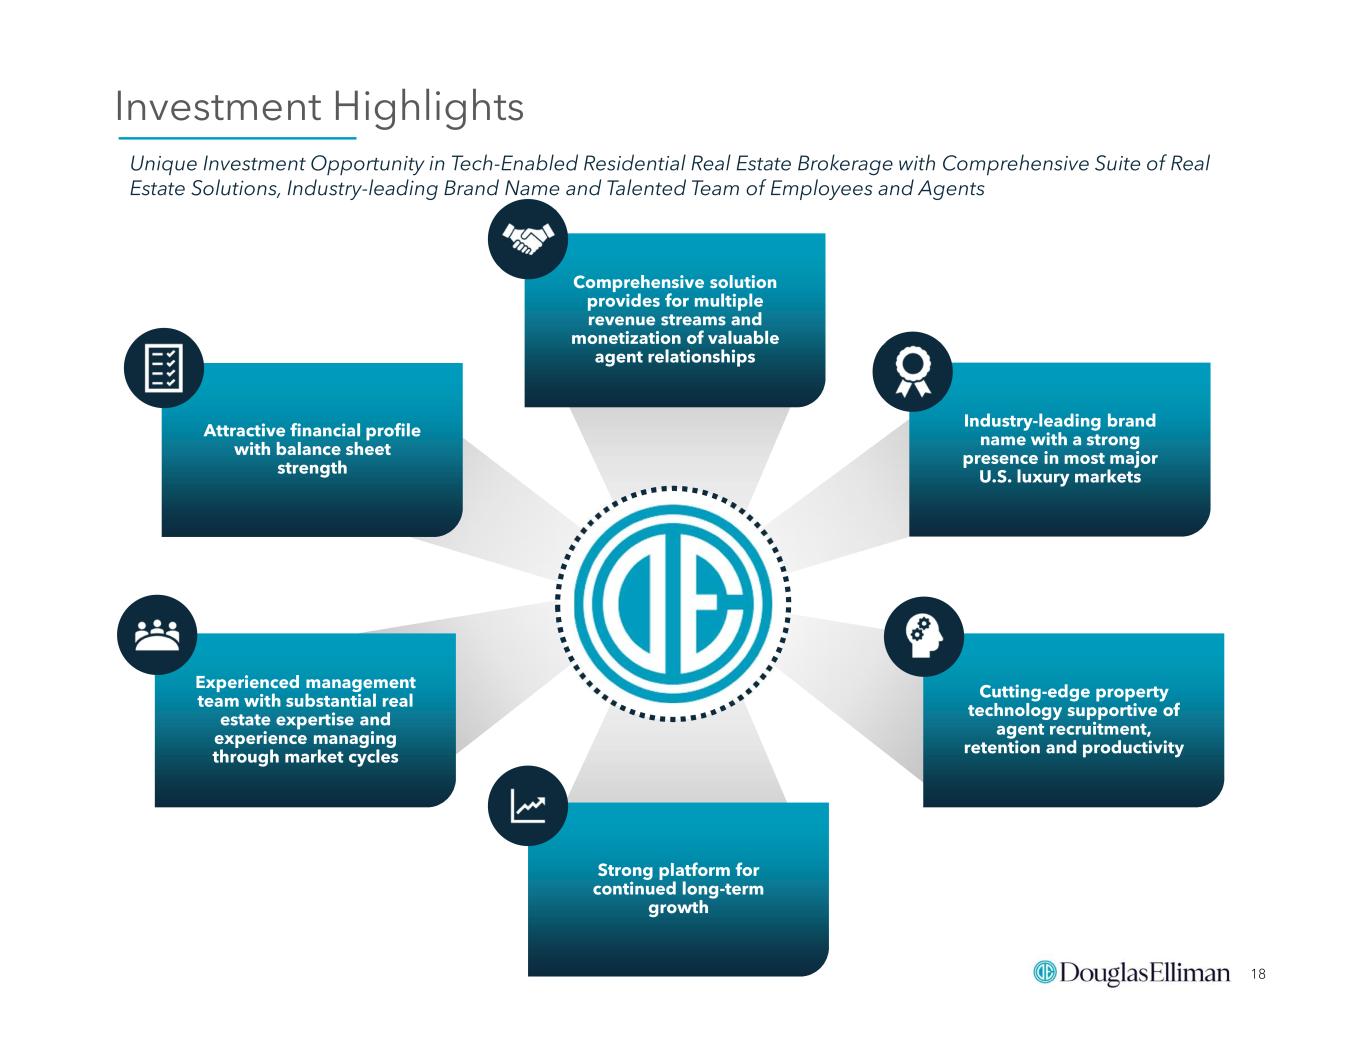
18 Investment Highlights Unique Investment Opportunity in Tech-Enabled Residential Real Estate Brokerage with Comprehensive Suite of Real Estate Solutions, Industry-leading Brand Name and Talented Team of Employees and Agents Cutting-edge property technology supportive of agent recruitment, retention and productivity Strong platform for continued long-term growth Comprehensive solution provides for multiple revenue streams and monetization of valuable agent relationships Experienced management team with substantial real estate expertise and experience managing through market cycles Industry-leading brand name with a strong presence in most major U.S. luxury markets Attractive financial profile with balance sheet strength


APPENDIX


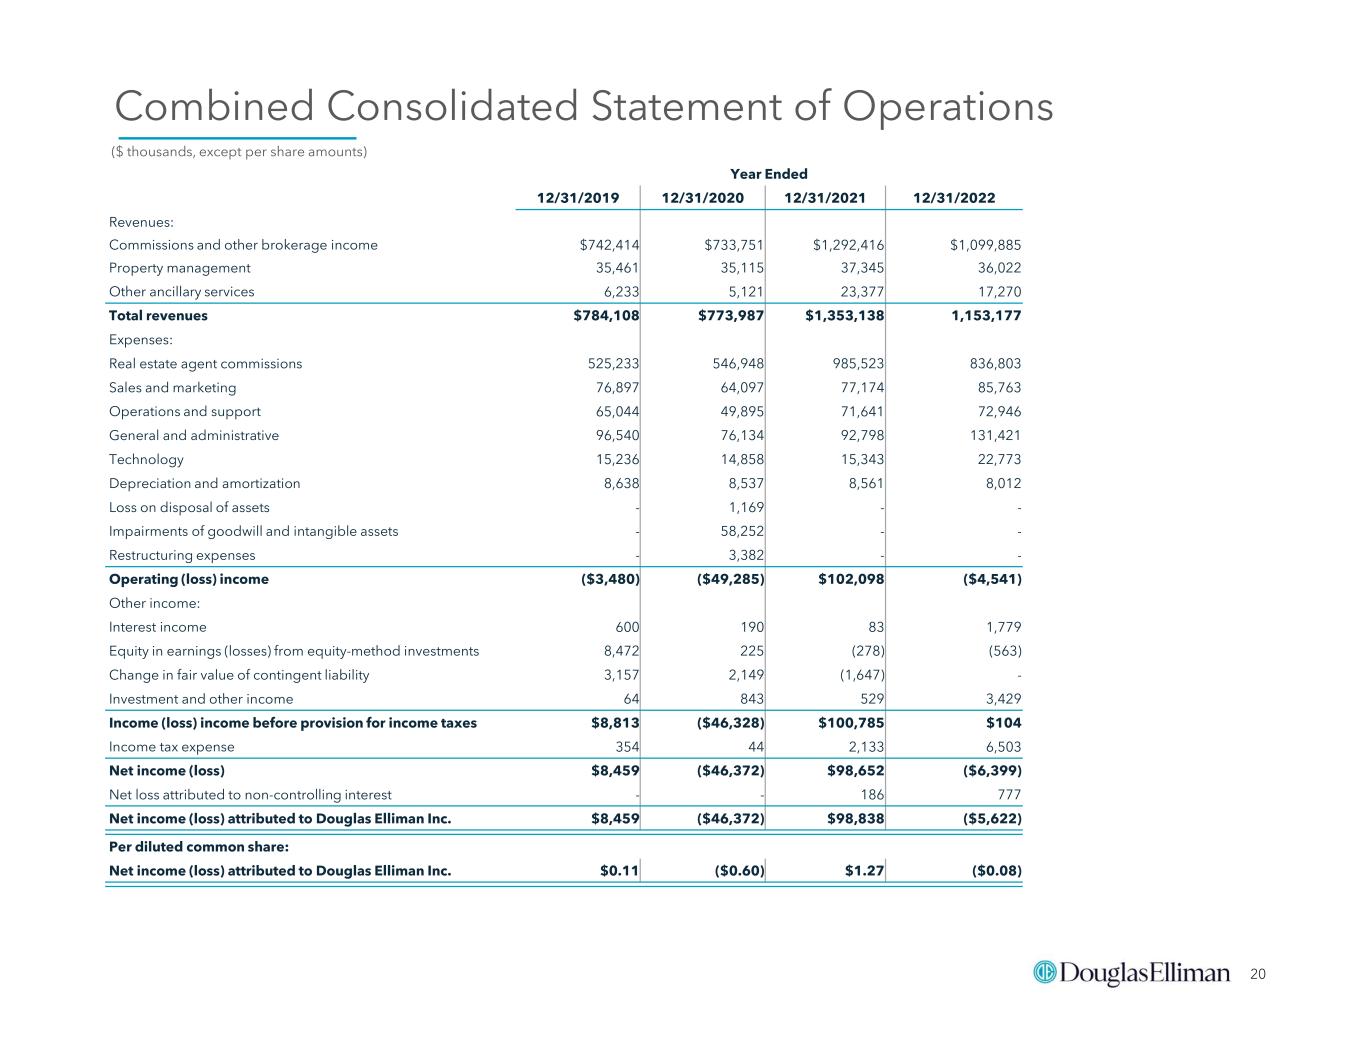
20 Combined Consolidated Statement of Operations Year Ended 12/31/202212/31/202112/31/202012/31/2019 Revenues: $1,099,885$1,292,416$733,751 $742,414 Commissions and other brokerage income 36,022 37,345 35,115 35,461 Property management 17,27023,377 5,121 6,233 Other ancillary services 1,153,177$1,353,138 $773,987 $784,108 Total revenues Expenses: 836,803985,523 546,948 525,233 Real estate agent commissions 85,763 77,174 64,097 76,897 Sales and marketing 72,94671,641 49,895 65,044 Operations and support 131,42192,798 76,134 96,540 General and administrative 22,77315,343 14,858 15,236 Technology 8,012 8,561 8,537 8,638 Depreciation and amortization --1,169 -Loss on disposal of assets --58,252 -Impairments of goodwill and intangible assets --3,382 -Restructuring expenses ($4,541) $102,098($49,285)($3,480) Operating (loss) income Other income: 1,77983 190 600 Interest income (563)(278) 2258,472 Equity in earnings (losses) from equity-method investments -(1,647) 2,149 3,157 Change in fair value of contingent liability 3,429 529 843 64 Investment and other income $104$100,785($46,328)$8,813 Income (loss) income before provision for income taxes 6,503 2,133 44 354 Income tax expense ($6,399)$98,652($46,372) $8,459 Net income (loss) 777 186 --Net loss attributed to non-controlling interest ($5,622)$98,838($46,372)$8,459 Net income (loss) attributed to Douglas Elliman Inc. Per diluted common share: ($0.08)$1.27($0.60)$0.11Net income (loss) attributed to Douglas Elliman Inc. ($ thousands, except per share amounts)


21 Consolidated Balance Sheet December 31,December 31, 20222021 ASSETS: Current assets: $163,859 $211,623 Cash and cash equivalents 23,243 32,488 Receivables 12,8269,192 Agent receivables, net 6,466-Income taxes receivable, net 4,98515,336 Restricted cash and cash equivalents 13,68612,166Other current assets $225,065 $280,805 Total current assets 41,71739,381 Property, plant and equipment, net 117,773123,538 Operating lease right-of-use assets 12,9328,094 Long-term investments at fair value 38,907 28,996 Contract assets, net 32,230 32,571 Goodwill 73,66674,421 Other intangible assets, net 1,6292,521 Equity-method investments 6,4834,842 Other assets $550,402$595,169 Total assets LIABILITIES AND STOCKHOLDERS’ EQUITY: Current liabilities: $ -$12,527 Current portion of notes payable and other obligations 22,32822,666 Current operating lease liabilities -1,240 Income taxes payable, net 5,456 5,874 Accounts payable 22,11735,766 Commissions payable 18,22825,446 Accrued salaries and benefits 8,257 6,689 Contract liabilities 13,59222,259 Other current liabilities $89,978$132,467 Total current liabilities -176 Notes payable and other obligations less current portion 14,46711,412 Deferred income taxes, net 120,508 129,496 Non-current operating lease liability 54,67139,557Contract liabilities 321188Other liabilities $279,945$313,296 Total liabilities --Commitments and contingencies Stockholders’ equity 273,920279,312 Common stock and additional paid-in-capital (5,000)622Retained earnings (accumulated deficit) 1,5371,939Non-controlling interest $270,457$281,873Total stockholders’ equity $550,402$595,169 Total liabilities and stockholders’ equity ($ thousands)


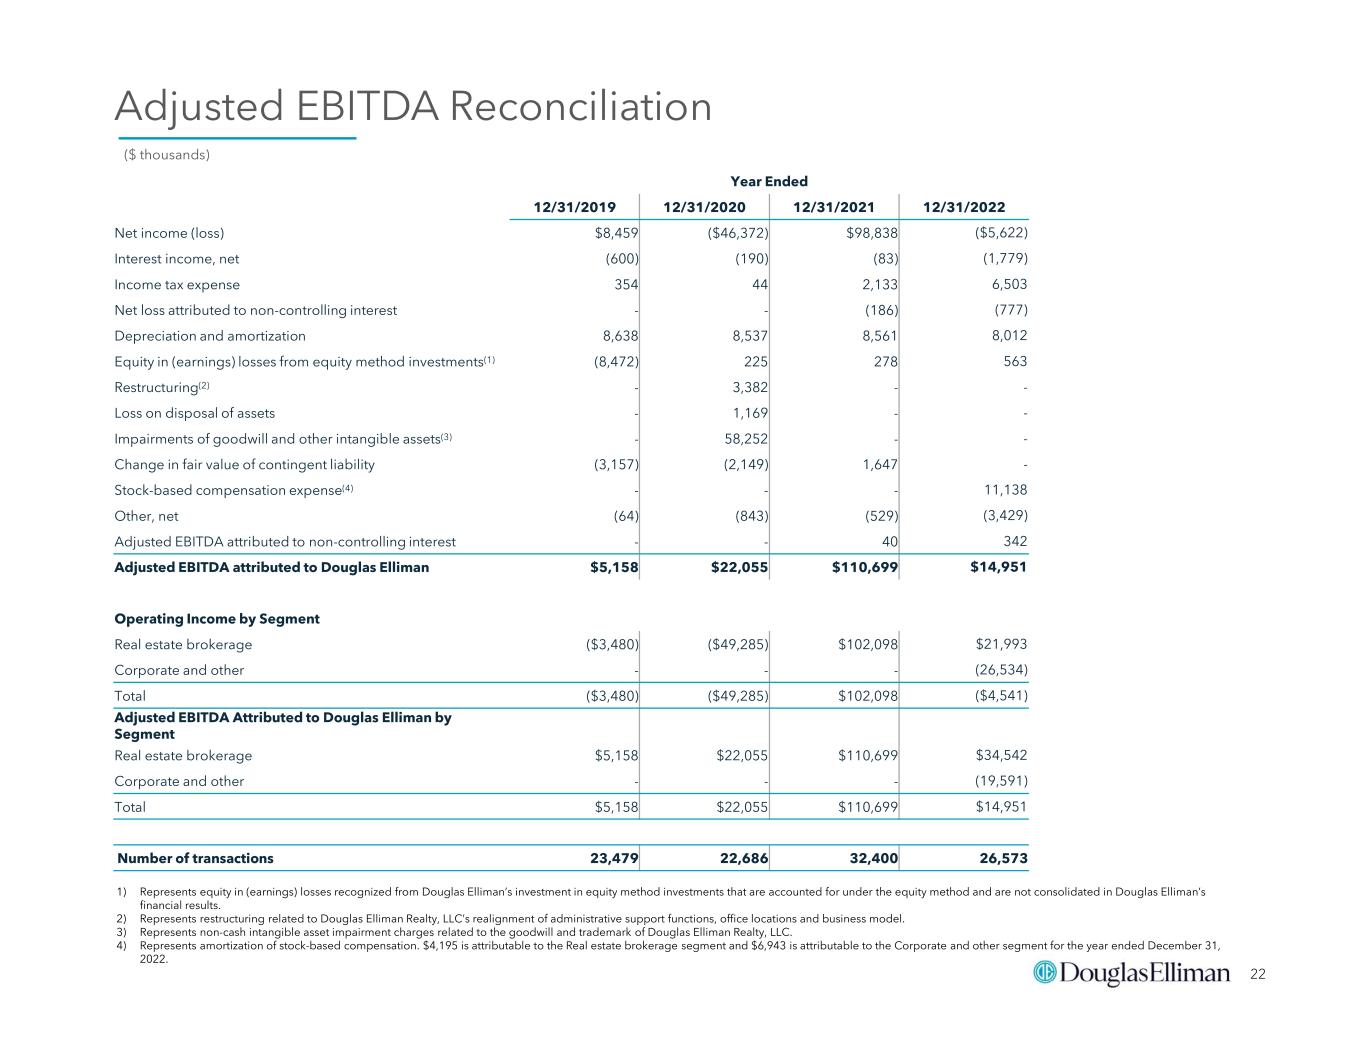
22 1) Represents equity in (earnings) losses recognized from Douglas Elliman’s investment in equity method investments that are accounted for under the equity method and are not consolidated in Douglas Elliman’s financial results. 2) Represents restructuring related to Douglas Elliman Realty, LLC’s realignment of administrative support functions, office locations and business model. 3) Represents non-cash intangible asset impairment charges related to the goodwill and trademark of Douglas Elliman Realty, LLC. 4) Represents amortization of stock-based compensation. $4,195 is attributable to the Real estate brokerage segment and $6,943 is attributable to the Corporate and other segment for the year ended December 31, 2022. Adjusted EBITDA Reconciliation Year Ended 12/31/202212/31/202112/31/202012/31/2019 ($5,622)$98,838($46,372) $8,459 Net income (loss) (1,779)(83)(190)(600)Interest income, net 6,5032,133 44 354 Income tax expense (777)(186)--Net loss attributed to non-controlling interest 8,0128,561 8,537 8,638 Depreciation and amortization 563278 225(8,472)Equity in (earnings) losses from equity method investments(1) --3,382 -Restructuring(2) --1,169 -Loss on disposal of assets --58,252 -Impairments of goodwill and other intangible assets(3) -1,647(2,149)(3,157)Change in fair value of contingent liability 11,138---Stock-based compensation expense(4) (3,429) (529)(843)(64) Other, net 34240--Adjusted EBITDA attributed to non-controlling interest $14,951$110,699$22,055$5,158Adjusted EBITDA attributed to Douglas Elliman Operating Income by Segment $21,993$102,098($49,285)($3,480)Real estate brokerage (26,534)---Corporate and other ($4,541)$102,098($49,285)($3,480)Total Adjusted EBITDA Attributed to Douglas Elliman by Segment $34,542$110,699$22,055$5,158Real estate brokerage (19,591)---Corporate and other $14,951$110,699$22,055$5,158Total 26,57332,40022,68623,479Number of transactions ($ thousands)


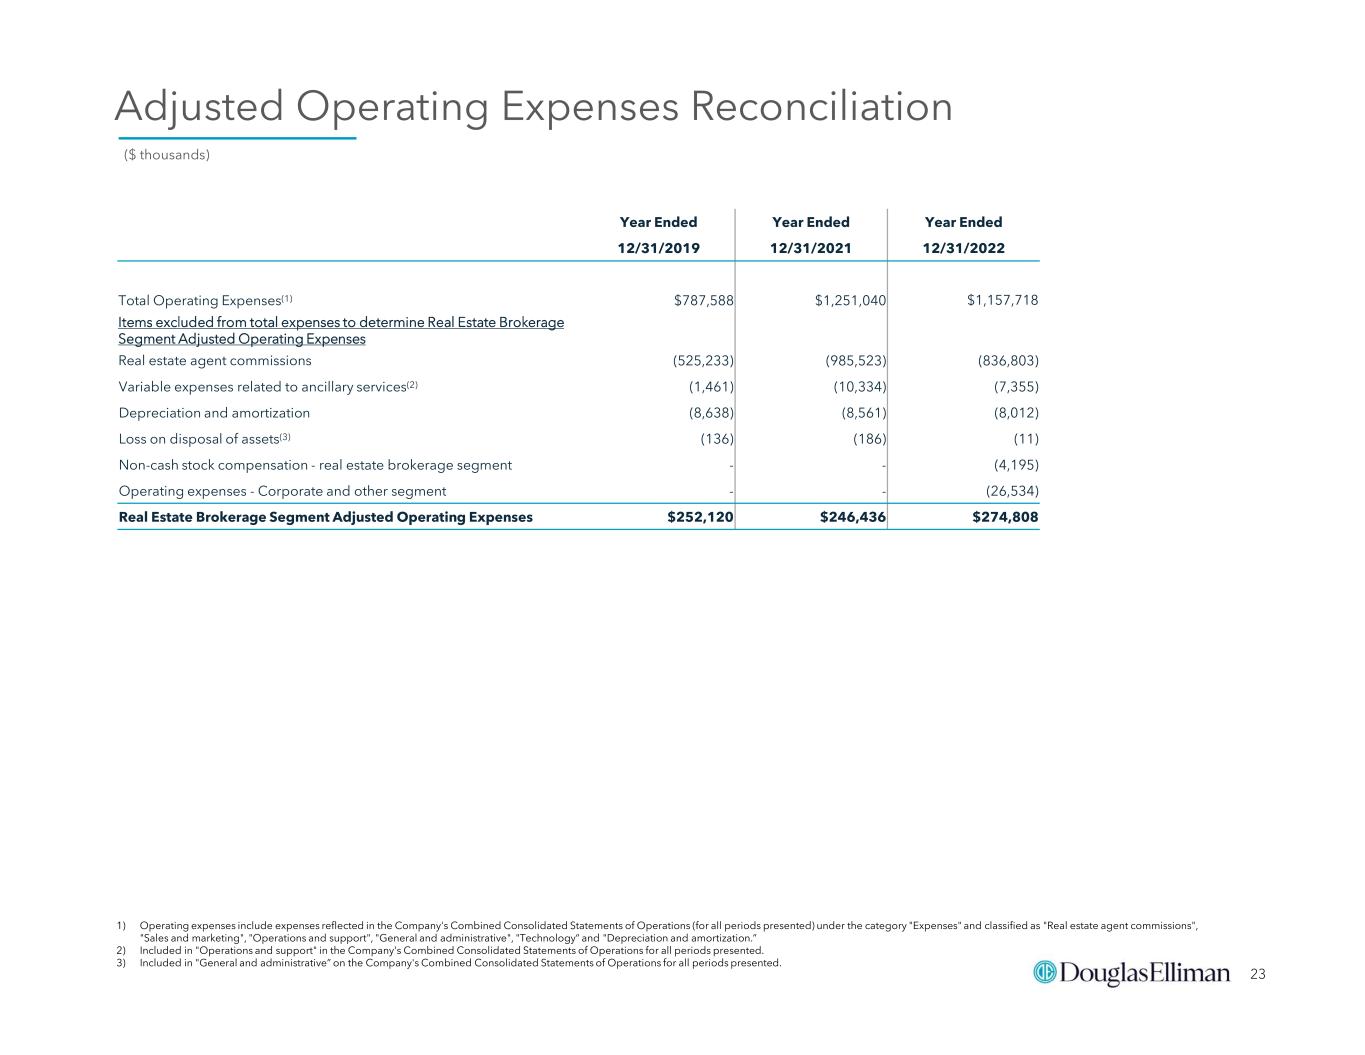
23 Adjusted Operating Expenses Reconciliation Year EndedYear EndedYear Ended 12/31/202212/31/202112/31/2019 $1,157,718$1,251,040$787,588Total Operating Expenses(1) Items excluded from total expenses to determine Real Estate Brokerage Segment Adjusted Operating Expenses (836,803)(985,523)(525,233)Real estate agent commissions (7,355)(10,334)(1,461)Variable expenses related to ancillary services(2) (8,012)(8,561)(8,638)Depreciation and amortization (11)(186)(136)Loss on disposal of assets(3) (4,195)--Non-cash stock compensation - real estate brokerage segment (26,534)--Operating expenses - Corporate and other segment $274,808 $246,436 $252,120 Real Estate Brokerage Segment Adjusted Operating Expenses ($ thousands) 1) Operating expenses include expenses reflected in the Company's Combined Consolidated Statements of Operations (for all periods presented) under the category "Expenses" and classified as "Real estate agent commissions", "Sales and marketing", "Operations and support", "General and administrative", "Technology“ and "Depreciation and amortization.” 2) Included in "Operations and support" in the Company's Combined Consolidated Statements of Operations for all periods presented. 3) Included in "General and administrative” on the Company's Combined Consolidated Statements of Operations for all periods presented.