drd-20260630
0001023512202630/630/6/2026FYT3FALSEP3YP5Yxbrli:sharesiso4217:ZARiso4217:ZARxbrli:sharesxbrli:pureutr:Rateutr:Ydrd:legalProceedingdrd:respondentdrd:summonsiso4217:ZARutr:kgdrd:claimdrd:incident00010235122025-07-012026-06-300001023512dei:BusinessContactMember2025-07-012026-06-300001023512drd:AmericanDepositarySharesMember2025-07-012026-06-300001023512ifrs-full:OrdinarySharesMember2025-07-012026-06-3000010235122026-06-300001023512ifrs-full:OrdinarySharesMember2026-06-3000010235122024-07-012025-06-3000010235122023-07-012024-06-300001023512ifrs-full:RetainedEarningsMember2024-07-012025-06-300001023512ifrs-full:RetainedEarningsMember2023-07-012024-06-300001023512drd:StellarEnergySolutionsSPVMemberifrs-full:DisposalGroupsClassifiedAsHeldForSaleMember2024-07-012025-06-300001023512drd:StellarEnergySolutionsSPVMemberifrs-full:DisposalGroupsClassifiedAsHeldForSaleMember2025-04-012025-06-3000010235122025-06-300001023512ifrs-full:IssuedCapitalMember2023-06-300001023512ifrs-full:RetainedEarningsMember2023-06-3000010235122023-06-300001023512ifrs-full:IssuedCapitalMember2023-07-012024-06-300001023512ifrs-full:IssuedCapitalMember2024-06-300001023512ifrs-full:RetainedEarningsMember2024-06-3000010235122024-06-300001023512ifrs-full:IssuedCapitalMember2024-07-012025-06-300001023512ifrs-full:IssuedCapitalMember2025-06-300001023512ifrs-full:RetainedEarningsMember2025-06-300001023512ifrs-full:RetainedEarningsMember2025-07-012026-06-300001023512ifrs-full:IssuedCapitalMember2025-07-012026-06-300001023512ifrs-full:IssuedCapitalMember2026-06-300001023512ifrs-full:RetainedEarningsMember2026-06-300001023512drd:DSPGrantMember2025-08-272025-08-270001023512drd:ELTIGrantMember2025-10-202025-10-200001023512ifrs-full:CommodityPriceRiskMember2024-06-300001023512ifrs-full:CommodityPriceRiskMember2025-06-300001023512ifrs-full:CommodityPriceRiskMember2026-06-300001023512ifrs-full:CommodityPriceRiskMemberifrs-full:TopOfRangeMember2025-07-012026-06-300001023512ifrs-full:CommodityPriceRiskMemberifrs-full:TopOfRangeMember2024-07-012025-06-300001023512ifrs-full:CommodityPriceRiskMemberifrs-full:TopOfRangeMember2023-07-012024-06-300001023512ifrs-full:CommodityPriceRiskMemberifrs-full:BottomOfRangeMember2025-07-012026-06-300001023512ifrs-full:CommodityPriceRiskMemberifrs-full:BottomOfRangeMember2024-07-012025-06-300001023512ifrs-full:CommodityPriceRiskMemberifrs-full:BottomOfRangeMember2023-07-012024-06-300001023512ifrs-full:CurrencyRiskMember2026-06-300001023512ifrs-full:CurrencyRiskMemberifrs-full:TopOfRangeMember2025-07-012026-06-300001023512ifrs-full:CurrencyRiskMemberifrs-full:TopOfRangeMember2024-07-012025-06-300001023512ifrs-full:CurrencyRiskMemberifrs-full:TopOfRangeMember2023-07-012024-06-300001023512ifrs-full:CurrencyRiskMemberifrs-full:BottomOfRangeMember2025-07-012026-06-300001023512ifrs-full:CurrencyRiskMemberifrs-full:BottomOfRangeMember2024-07-012025-06-300001023512ifrs-full:CurrencyRiskMemberifrs-full:BottomOfRangeMember2023-07-012024-06-300001023512drd:RandRefineryProprietaryLimitedMemberdrd:SibanyeStillwaterMember2026-06-300001023512drd:SupplyOfWaterAndElectricityMemberdrd:SibanyeStillwaterMember2025-07-012026-06-300001023512drd:SupplyOfWaterAndElectricityMemberdrd:SibanyeStillwaterMember2024-07-012025-06-300001023512drd:SupplyOfWaterAndElectricityMemberdrd:SibanyeStillwaterMember2023-07-012024-06-300001023512drd:GoldSmeltingAndRelatedChargesMemberdrd:SibanyeStillwaterMember2025-07-012026-06-300001023512drd:GoldSmeltingAndRelatedChargesMemberdrd:SibanyeStillwaterMember2024-07-012025-06-300001023512drd:GoldSmeltingAndRelatedChargesMemberdrd:SibanyeStillwaterMember2023-07-012024-06-300001023512drd:OtherChargesRelatedPartiesMemberdrd:SibanyeStillwaterMember2025-07-012026-06-300001023512drd:OtherChargesRelatedPartiesMemberdrd:SibanyeStillwaterMember2024-07-012025-06-300001023512drd:OtherChargesRelatedPartiesMemberdrd:SibanyeStillwaterMember2023-07-012024-06-300001023512drd:GoldRefiningAndRelatedChargesMemberdrd:RandRefineryProprietaryLimitedRandRefineryMember2025-07-012026-06-300001023512drd:GoldRefiningAndRelatedChargesMemberdrd:RandRefineryProprietaryLimitedRandRefineryMember2024-07-012025-06-300001023512drd:GoldRefiningAndRelatedChargesMemberdrd:RandRefineryProprietaryLimitedRandRefineryMember2023-07-012024-06-300001023512drd:AdministrationExpensesAndOtherCostsMember2025-07-012026-06-300001023512drd:AdministrationExpensesAndOtherCostsMember2024-07-012025-06-300001023512drd:AdministrationExpensesAndOtherCostsMember2023-07-012024-06-300001023512drd:SolarPowerPlantAndBESSMemberdrd:A60MWSolarPhotovoltaicPlantMember2025-07-012026-06-300001023512drd:SolarPowerPlantAndBESSMemberdrd:A160mWhBatteryEnergyStorageSystemMember2025-07-012026-06-300001023512ifrs-full:MiningAssetsMemberdrd:ErgoOperationsMemberifrs-full:BottomOfRangeMember2024-07-012025-06-300001023512ifrs-full:MiningAssetsMemberdrd:ErgoOperationsMemberifrs-full:BottomOfRangeMember2023-07-012024-06-300001023512ifrs-full:MiningAssetsMemberdrd:ErgoOperationsMemberifrs-full:BottomOfRangeMember2025-07-012026-06-300001023512ifrs-full:MiningAssetsMemberdrd:ErgoOperationsMemberifrs-full:TopOfRangeMember2025-07-012026-06-300001023512ifrs-full:MiningAssetsMemberdrd:ErgoOperationsMemberifrs-full:TopOfRangeMember2024-07-012025-06-300001023512ifrs-full:MiningAssetsMemberdrd:ErgoOperationsMemberifrs-full:TopOfRangeMember2023-07-012024-06-300001023512ifrs-full:MiningAssetsMemberdrd:FarWestGoldRecoveriesProprietaryLimitedMiningAssetsMemberifrs-full:BottomOfRangeMember2025-07-012026-06-300001023512ifrs-full:MiningAssetsMemberdrd:FarWestGoldRecoveriesProprietaryLimitedMiningAssetsMemberifrs-full:BottomOfRangeMember2024-07-012025-06-300001023512ifrs-full:MiningAssetsMemberdrd:FarWestGoldRecoveriesProprietaryLimitedMiningAssetsMemberifrs-full:TopOfRangeMember2025-07-012026-06-300001023512ifrs-full:MiningAssetsMemberdrd:FarWestGoldRecoveriesProprietaryLimitedMiningAssetsMemberifrs-full:TopOfRangeMember2024-07-012025-06-300001023512ifrs-full:MiningAssetsMemberdrd:FarWestGoldRecoveriesProprietaryLimitedMiningAssetsMemberifrs-full:TopOfRangeMember2023-07-012024-06-300001023512ifrs-full:GrossCarryingAmountMemberifrs-full:MiningAssetsMember2026-06-300001023512ifrs-full:GrossCarryingAmountMemberdrd:MinePropertyAndDevelopmentMember2026-06-300001023512ifrs-full:GrossCarryingAmountMemberdrd:SolarPowerPlantAndBESSMember2026-06-300001023512ifrs-full:GrossCarryingAmountMemberifrs-full:ExplorationAndEvaluationAssetsMember2026-06-300001023512ifrs-full:GrossCarryingAmountMemberdrd:CapitalWorkInProgressMember2026-06-300001023512ifrs-full:GrossCarryingAmountMember2026-06-300001023512ifrs-full:GrossCarryingAmountMemberifrs-full:MiningAssetsMember2025-06-300001023512ifrs-full:GrossCarryingAmountMemberdrd:MinePropertyAndDevelopmentMember2025-06-300001023512ifrs-full:GrossCarryingAmountMemberdrd:SolarPowerPlantAndBESSMember2025-06-300001023512ifrs-full:GrossCarryingAmountMemberifrs-full:ExplorationAndEvaluationAssetsMember2025-06-300001023512ifrs-full:GrossCarryingAmountMemberdrd:CapitalWorkInProgressMember2025-06-300001023512ifrs-full:GrossCarryingAmountMember2025-06-300001023512ifrs-full:GrossCarryingAmountMemberifrs-full:MiningAssetsMemberifrs-full:PropertyPlantAndEquipmentMember2025-07-012026-06-300001023512ifrs-full:GrossCarryingAmountMemberdrd:MinePropertyAndDevelopmentMemberifrs-full:PropertyPlantAndEquipmentMember2025-07-012026-06-300001023512ifrs-full:GrossCarryingAmountMemberdrd:SolarPowerPlantAndBESSMemberifrs-full:PropertyPlantAndEquipmentMember2025-07-012026-06-300001023512ifrs-full:GrossCarryingAmountMemberifrs-full:ExplorationAndEvaluationAssetsMemberifrs-full:PropertyPlantAndEquipmentMember2025-07-012026-06-300001023512ifrs-full:GrossCarryingAmountMemberdrd:CapitalWorkInProgressMemberifrs-full:PropertyPlantAndEquipmentMember2025-07-012026-06-300001023512ifrs-full:GrossCarryingAmountMemberifrs-full:PropertyPlantAndEquipmentMember2025-07-012026-06-300001023512ifrs-full:GrossCarryingAmountMemberifrs-full:MiningAssetsMemberifrs-full:RightofuseAssetsMember2025-07-012026-06-300001023512ifrs-full:GrossCarryingAmountMemberdrd:MinePropertyAndDevelopmentMemberifrs-full:RightofuseAssetsMember2025-07-012026-06-300001023512ifrs-full:GrossCarryingAmountMemberdrd:SolarPowerPlantAndBESSMemberifrs-full:RightofuseAssetsMember2025-07-012026-06-300001023512ifrs-full:GrossCarryingAmountMemberifrs-full:ExplorationAndEvaluationAssetsMemberifrs-full:RightofuseAssetsMember2025-07-012026-06-300001023512ifrs-full:GrossCarryingAmountMemberdrd:CapitalWorkInProgressMemberifrs-full:RightofuseAssetsMember2025-07-012026-06-300001023512ifrs-full:GrossCarryingAmountMemberifrs-full:RightofuseAssetsMember2025-07-012026-06-300001023512ifrs-full:GrossCarryingAmountMemberifrs-full:MiningAssetsMember2025-07-012026-06-300001023512ifrs-full:GrossCarryingAmountMemberdrd:MinePropertyAndDevelopmentMember2025-07-012026-06-300001023512ifrs-full:GrossCarryingAmountMemberdrd:SolarPowerPlantAndBESSMember2025-07-012026-06-300001023512ifrs-full:GrossCarryingAmountMemberifrs-full:ExplorationAndEvaluationAssetsMember2025-07-012026-06-300001023512ifrs-full:GrossCarryingAmountMemberdrd:CapitalWorkInProgressMember2025-07-012026-06-300001023512ifrs-full:GrossCarryingAmountMember2025-07-012026-06-300001023512ifrs-full:AccumulatedDepreciationAmortisationAndImpairmentMemberifrs-full:MiningAssetsMember2026-06-300001023512ifrs-full:AccumulatedDepreciationAmortisationAndImpairmentMemberdrd:MinePropertyAndDevelopmentMember2026-06-300001023512ifrs-full:AccumulatedDepreciationAmortisationAndImpairmentMemberdrd:SolarPowerPlantAndBESSMember2026-06-300001023512ifrs-full:AccumulatedDepreciationAmortisationAndImpairmentMemberifrs-full:ExplorationAndEvaluationAssetsMember2026-06-300001023512ifrs-full:AccumulatedDepreciationAmortisationAndImpairmentMemberdrd:CapitalWorkInProgressMember2026-06-300001023512ifrs-full:AccumulatedDepreciationAmortisationAndImpairmentMember2026-06-300001023512ifrs-full:AccumulatedDepreciationAmortisationAndImpairmentMemberifrs-full:MiningAssetsMember2025-06-300001023512ifrs-full:AccumulatedDepreciationAmortisationAndImpairmentMemberdrd:MinePropertyAndDevelopmentMember2025-06-300001023512ifrs-full:AccumulatedDepreciationAmortisationAndImpairmentMemberdrd:SolarPowerPlantAndBESSMember2025-06-300001023512ifrs-full:AccumulatedDepreciationAmortisationAndImpairmentMemberifrs-full:ExplorationAndEvaluationAssetsMember2025-06-300001023512ifrs-full:AccumulatedDepreciationAmortisationAndImpairmentMemberdrd:CapitalWorkInProgressMember2025-06-300001023512ifrs-full:AccumulatedDepreciationAmortisationAndImpairmentMember2025-06-300001023512ifrs-full:AccumulatedDepreciationAmortisationAndImpairmentMemberifrs-full:MiningAssetsMember2025-07-012026-06-300001023512ifrs-full:AccumulatedDepreciationAmortisationAndImpairmentMemberdrd:MinePropertyAndDevelopmentMember2025-07-012026-06-300001023512ifrs-full:AccumulatedDepreciationAmortisationAndImpairmentMemberdrd:SolarPowerPlantAndBESSMember2025-07-012026-06-300001023512ifrs-full:AccumulatedDepreciationAmortisationAndImpairmentMemberifrs-full:ExplorationAndEvaluationAssetsMember2025-07-012026-06-300001023512ifrs-full:AccumulatedDepreciationAmortisationAndImpairmentMemberdrd:CapitalWorkInProgressMember2025-07-012026-06-300001023512ifrs-full:AccumulatedDepreciationAmortisationAndImpairmentMember2025-07-012026-06-300001023512ifrs-full:MiningAssetsMember2026-06-300001023512drd:MinePropertyAndDevelopmentMember2026-06-300001023512drd:SolarPowerPlantAndBESSMember2026-06-300001023512ifrs-full:ExplorationAndEvaluationAssetsMember2026-06-300001023512drd:CapitalWorkInProgressMember2026-06-300001023512ifrs-full:MiningAssetsMemberifrs-full:PropertyPlantAndEquipmentMember2026-06-300001023512drd:MinePropertyAndDevelopmentMemberifrs-full:PropertyPlantAndEquipmentMember2026-06-300001023512drd:SolarPowerPlantAndBESSMemberifrs-full:PropertyPlantAndEquipmentMember2026-06-300001023512ifrs-full:ExplorationAndEvaluationAssetsMemberifrs-full:PropertyPlantAndEquipmentMember2026-06-300001023512drd:CapitalWorkInProgressMemberifrs-full:PropertyPlantAndEquipmentMember2026-06-300001023512ifrs-full:PropertyPlantAndEquipmentMember2026-06-300001023512ifrs-full:MiningAssetsMemberifrs-full:RightofuseAssetsMember2026-06-300001023512drd:MinePropertyAndDevelopmentMemberifrs-full:RightofuseAssetsMember2026-06-300001023512drd:SolarPowerPlantAndBESSMemberifrs-full:RightofuseAssetsMember2026-06-300001023512ifrs-full:ExplorationAndEvaluationAssetsMemberifrs-full:RightofuseAssetsMember2026-06-300001023512drd:CapitalWorkInProgressMemberifrs-full:RightofuseAssetsMember2026-06-300001023512ifrs-full:RightofuseAssetsMember2026-06-300001023512ifrs-full:GrossCarryingAmountMemberifrs-full:MiningAssetsMember2024-06-300001023512ifrs-full:GrossCarryingAmountMemberdrd:MinePropertyAndDevelopmentMember2024-06-300001023512ifrs-full:GrossCarryingAmountMemberdrd:SolarPowerPlantAndBESSMember2024-06-300001023512ifrs-full:GrossCarryingAmountMemberifrs-full:ExplorationAndEvaluationAssetsMember2024-06-300001023512ifrs-full:GrossCarryingAmountMemberdrd:CapitalWorkInProgressMember2024-06-300001023512ifrs-full:GrossCarryingAmountMember2024-06-300001023512ifrs-full:GrossCarryingAmountMemberifrs-full:MiningAssetsMemberifrs-full:PropertyPlantAndEquipmentMember2024-07-012025-06-300001023512ifrs-full:GrossCarryingAmountMemberdrd:MinePropertyAndDevelopmentMemberifrs-full:PropertyPlantAndEquipmentMember2024-07-012025-06-300001023512ifrs-full:GrossCarryingAmountMemberdrd:SolarPowerPlantAndBESSMemberifrs-full:PropertyPlantAndEquipmentMember2024-07-012025-06-300001023512ifrs-full:GrossCarryingAmountMemberifrs-full:ExplorationAndEvaluationAssetsMemberifrs-full:PropertyPlantAndEquipmentMember2024-07-012025-06-300001023512ifrs-full:GrossCarryingAmountMemberdrd:CapitalWorkInProgressMemberifrs-full:PropertyPlantAndEquipmentMember2024-07-012025-06-300001023512ifrs-full:GrossCarryingAmountMemberifrs-full:PropertyPlantAndEquipmentMember2024-07-012025-06-300001023512ifrs-full:GrossCarryingAmountMemberifrs-full:MiningAssetsMemberifrs-full:RightofuseAssetsMember2024-07-012025-06-300001023512ifrs-full:GrossCarryingAmountMemberdrd:MinePropertyAndDevelopmentMemberifrs-full:RightofuseAssetsMember2024-07-012025-06-300001023512ifrs-full:GrossCarryingAmountMemberdrd:SolarPowerPlantAndBESSMemberifrs-full:RightofuseAssetsMember2024-07-012025-06-300001023512ifrs-full:GrossCarryingAmountMemberifrs-full:ExplorationAndEvaluationAssetsMemberifrs-full:RightofuseAssetsMember2024-07-012025-06-300001023512ifrs-full:GrossCarryingAmountMemberdrd:CapitalWorkInProgressMemberifrs-full:RightofuseAssetsMember2024-07-012025-06-300001023512ifrs-full:GrossCarryingAmountMemberifrs-full:RightofuseAssetsMember2024-07-012025-06-300001023512ifrs-full:GrossCarryingAmountMemberifrs-full:MiningAssetsMember2024-07-012025-06-300001023512ifrs-full:GrossCarryingAmountMemberdrd:MinePropertyAndDevelopmentMember2024-07-012025-06-300001023512ifrs-full:GrossCarryingAmountMemberdrd:SolarPowerPlantAndBESSMember2024-07-012025-06-300001023512ifrs-full:GrossCarryingAmountMemberifrs-full:ExplorationAndEvaluationAssetsMember2024-07-012025-06-300001023512ifrs-full:GrossCarryingAmountMemberdrd:CapitalWorkInProgressMember2024-07-012025-06-300001023512ifrs-full:GrossCarryingAmountMember2024-07-012025-06-300001023512ifrs-full:AccumulatedDepreciationAmortisationAndImpairmentMemberifrs-full:MiningAssetsMember2024-06-300001023512ifrs-full:AccumulatedDepreciationAmortisationAndImpairmentMemberdrd:MinePropertyAndDevelopmentMember2024-06-300001023512ifrs-full:AccumulatedDepreciationAmortisationAndImpairmentMemberdrd:SolarPowerPlantAndBESSMember2024-06-300001023512ifrs-full:AccumulatedDepreciationAmortisationAndImpairmentMemberifrs-full:ExplorationAndEvaluationAssetsMember2024-06-300001023512ifrs-full:AccumulatedDepreciationAmortisationAndImpairmentMemberdrd:CapitalWorkInProgressMember2024-06-300001023512ifrs-full:AccumulatedDepreciationAmortisationAndImpairmentMember2024-06-300001023512ifrs-full:AccumulatedDepreciationAmortisationAndImpairmentMemberifrs-full:MiningAssetsMember2024-07-012025-06-300001023512ifrs-full:AccumulatedDepreciationAmortisationAndImpairmentMemberdrd:MinePropertyAndDevelopmentMember2024-07-012025-06-300001023512ifrs-full:AccumulatedDepreciationAmortisationAndImpairmentMemberdrd:SolarPowerPlantAndBESSMember2024-07-012025-06-300001023512ifrs-full:AccumulatedDepreciationAmortisationAndImpairmentMemberifrs-full:ExplorationAndEvaluationAssetsMember2024-07-012025-06-300001023512ifrs-full:AccumulatedDepreciationAmortisationAndImpairmentMemberdrd:CapitalWorkInProgressMember2024-07-012025-06-300001023512ifrs-full:AccumulatedDepreciationAmortisationAndImpairmentMember2024-07-012025-06-300001023512ifrs-full:MiningAssetsMember2025-06-300001023512drd:MinePropertyAndDevelopmentMember2025-06-300001023512drd:SolarPowerPlantAndBESSMember2025-06-300001023512ifrs-full:ExplorationAndEvaluationAssetsMember2025-06-300001023512drd:CapitalWorkInProgressMember2025-06-300001023512ifrs-full:MiningAssetsMemberifrs-full:PropertyPlantAndEquipmentMember2025-06-300001023512drd:MinePropertyAndDevelopmentMemberifrs-full:PropertyPlantAndEquipmentMember2025-06-300001023512drd:SolarPowerPlantAndBESSMemberifrs-full:PropertyPlantAndEquipmentMember2025-06-300001023512ifrs-full:ExplorationAndEvaluationAssetsMemberifrs-full:PropertyPlantAndEquipmentMember2025-06-300001023512drd:CapitalWorkInProgressMemberifrs-full:PropertyPlantAndEquipmentMember2025-06-300001023512ifrs-full:PropertyPlantAndEquipmentMember2025-06-300001023512ifrs-full:MiningAssetsMemberifrs-full:RightofuseAssetsMember2025-06-300001023512drd:MinePropertyAndDevelopmentMemberifrs-full:RightofuseAssetsMember2025-06-300001023512drd:SolarPowerPlantAndBESSMemberifrs-full:RightofuseAssetsMember2025-06-300001023512ifrs-full:ExplorationAndEvaluationAssetsMemberifrs-full:RightofuseAssetsMember2025-06-300001023512drd:CapitalWorkInProgressMemberifrs-full:RightofuseAssetsMember2025-06-300001023512ifrs-full:RightofuseAssetsMember2025-06-300001023512drd:FWGRRTSFAndDP2ConstructionMember2026-06-300001023512drd:ErgoDaggafonteinMember2026-06-300001023512drd:FWGRRTSFAndDP2ConstructionMember2025-06-300001023512ifrs-full:PropertyPlantAndEquipmentMember2025-07-012026-06-300001023512ifrs-full:PropertyPlantAndEquipmentMember2024-07-012025-06-300001023512drd:ProvisionForDecommissioningCostsMember2025-07-012026-06-300001023512drd:ProvisionForDecommissioningCostsMember2024-07-012025-06-300001023512drd:ProvisionForRestorationCostsMember2025-07-012026-06-300001023512drd:ProvisionForRestorationCostsMember2024-07-012025-06-300001023512drd:ErgoOperationsMemberifrs-full:LaterThanOneYearAndNotLaterThanTwoYearsMember2026-06-300001023512drd:FwgrMemberifrs-full:LaterThanOneYearAndNotLaterThanTwoYearsMember2026-06-300001023512ifrs-full:AllOtherSegmentsMemberifrs-full:LaterThanOneYearAndNotLaterThanTwoYearsMember2026-06-300001023512ifrs-full:LaterThanOneYearAndNotLaterThanTwoYearsMember2026-06-300001023512drd:ErgoOperationsMemberifrs-full:LaterThanThreeYearsAndNotLaterThanFiveYearsMember2026-06-300001023512drd:FwgrMemberifrs-full:LaterThanThreeYearsAndNotLaterThanFiveYearsMember2026-06-300001023512ifrs-full:AllOtherSegmentsMemberifrs-full:LaterThanThreeYearsAndNotLaterThanFiveYearsMember2026-06-300001023512ifrs-full:LaterThanThreeYearsAndNotLaterThanFiveYearsMember2026-06-300001023512drd:ErgoOperationsMemberdrd:LaterThanSixYearsAndNotLaterThanTenYearsMember2026-06-300001023512drd:FwgrMemberdrd:LaterThanSixYearsAndNotLaterThanTenYearsMember2026-06-300001023512ifrs-full:AllOtherSegmentsMemberdrd:LaterThanSixYearsAndNotLaterThanTenYearsMember2026-06-300001023512drd:LaterThanSixYearsAndNotLaterThanTenYearsMember2026-06-300001023512drd:ErgoOperationsMemberdrd:LaterThanElevenYearsAndNotLaterThanTwentyYearsMember2026-06-300001023512drd:FwgrMemberdrd:LaterThanElevenYearsAndNotLaterThanTwentyYearsMember2026-06-300001023512ifrs-full:AllOtherSegmentsMemberdrd:LaterThanElevenYearsAndNotLaterThanTwentyYearsMember2026-06-300001023512drd:LaterThanElevenYearsAndNotLaterThanTwentyYearsMember2026-06-300001023512drd:ErgoOperationsMemberdrd:LaterThanTwentyYearsMember2026-06-300001023512drd:FwgrMemberdrd:LaterThanTwentyYearsMember2026-06-300001023512ifrs-full:AllOtherSegmentsMemberdrd:LaterThanTwentyYearsMember2026-06-300001023512drd:LaterThanTwentyYearsMember2026-06-300001023512drd:ErgoOperationsMember2026-06-300001023512drd:FwgrMember2026-06-300001023512ifrs-full:AllOtherSegmentsMember2026-06-300001023512ifrs-full:GuaranteesMember2026-06-300001023512ifrs-full:GuaranteesMember2025-06-300001023512drd:EnvironmentalRehabilitationMember2026-06-300001023512drd:EnvironmentalRehabilitationMember2025-06-300001023512drd:DirectorsAndOfficersInsuranceMember2026-06-300001023512drd:DirectorsAndOfficersInsuranceMember2025-06-300001023512drd:OtherFundsMember2026-06-300001023512drd:OtherFundsMember2025-06-300001023512ifrs-full:InterestRateRiskMember2025-07-012026-06-300001023512drd:InvestmentsInObligationFundMemberifrs-full:InterestRateRiskMember2025-07-012026-06-300001023512drd:InvestmentsInObligationFundMemberifrs-full:InterestRateRiskMember2024-07-012025-06-300001023512ifrs-full:EquityPriceRiskMember2025-07-012026-06-300001023512drd:InvestmentsInObligationFundMemberifrs-full:EquityPriceRiskMember2025-07-012026-06-300001023512drd:InvestmentsInObligationFundMemberifrs-full:EquityPriceRiskMember2024-07-012025-06-300001023512ifrs-full:BottomOfRangeMember2025-07-012026-06-300001023512ifrs-full:TopOfRangeMember2025-07-012026-06-300001023512ifrs-full:BottomOfRangeMember2024-07-012025-06-300001023512ifrs-full:TopOfRangeMember2024-07-012025-06-300001023512ifrs-full:ContingentLiabilityForDecommissioningRestorationAndRehabilitationCostsMember2026-06-300001023512ifrs-full:ContingentLiabilityForDecommissioningRestorationAndRehabilitationCostsMember2025-06-300001023512ifrs-full:OtherContingentLiabilitiesMember2026-06-300001023512ifrs-full:OtherContingentLiabilitiesMember2025-06-300001023512drd:CashAndCashEquivalents1Memberifrs-full:InterestRateRiskMember2025-07-012026-06-300001023512drd:CashAndCashEquivalents1Memberifrs-full:InterestRateRiskMember2024-07-012025-06-300001023512ifrs-full:AccumulatedImpairmentMember2026-06-300001023512ifrs-full:AccumulatedImpairmentMember2025-06-300001023512drd:SibanyeStillwaterMember2026-06-300001023512drd:FWGRRTSFConstructionMember2026-06-300001023512drd:SolarPowerAndRegionalTailingsStorageFacilityRTSFMember2025-06-300001023512ifrs-full:FinancialInstrumentsNotCreditimpairedMember2026-06-300001023512ifrs-full:FinancialInstrumentsCreditimpairedMember2026-06-300001023512ifrs-full:FinancialInstrumentsNotCreditimpairedMember2025-06-300001023512ifrs-full:FinancialInstrumentsCreditimpairedMember2025-06-300001023512ifrs-full:AccumulatedImpairmentMemberifrs-full:FinancialInstrumentsNotCreditimpairedMember2026-06-300001023512ifrs-full:AccumulatedImpairmentMemberifrs-full:FinancialInstrumentsNotCreditimpairedMember2025-06-300001023512ifrs-full:AccumulatedImpairmentMember2024-06-300001023512ifrs-full:AccumulatedImpairmentMember2025-07-012026-06-300001023512ifrs-full:AccumulatedImpairmentMember2024-07-012025-06-300001023512drd:SibanyeStillwaterMember2026-06-300001023512drd:SibanyeStillwaterMember2025-06-300001023512drd:RandRefineryProprietaryLimitedRandRefineryMember2026-06-300001023512drd:RandRefineryProprietaryLimitedRandRefineryMember2025-06-300001023512drd:ErgoOperationsMember2025-07-012026-06-300001023512drd:ErgoOperationsMember2024-07-012025-06-300001023512drd:FwgrMember2025-07-012026-06-300001023512drd:FwgrMember2024-07-012025-06-300001023512drd:ErgoOperationsMember2023-07-012024-06-300001023512drd:FwgrMember2023-07-012024-06-300001023512drd:DeferredTaxLiabilityGrossMemberifrs-full:PropertyPlantAndEquipmentMember2026-06-300001023512drd:DeferredTaxLiabilityGrossMemberifrs-full:PropertyPlantAndEquipmentMember2025-06-300001023512drd:DeferredTaxLiabilityGrossMemberifrs-full:ProvisionForDecommissioningRestorationAndRehabilitationCostsMember2026-06-300001023512drd:DeferredTaxLiabilityGrossMemberifrs-full:ProvisionForDecommissioningRestorationAndRehabilitationCostsMember2025-06-300001023512drd:DeferredTaxLiabilityGrossMemberdrd:InvestmentsTemporaryDifferenceMember2026-06-300001023512drd:DeferredTaxLiabilityGrossMemberdrd:InvestmentsTemporaryDifferenceMember2025-06-300001023512drd:DeferredTaxLiabilityGrossMember2026-06-300001023512drd:DeferredTaxLiabilityGrossMember2025-06-300001023512drd:DeferredTaxAssetsGrossMemberifrs-full:ProvisionForDecommissioningRestorationAndRehabilitationCostsMember2026-06-300001023512drd:DeferredTaxAssetsGrossMemberifrs-full:ProvisionForDecommissioningRestorationAndRehabilitationCostsMember2025-06-300001023512drd:DeferredTaxAssetsGrossMemberifrs-full:MiscellaneousOtherProvisionsMember2026-06-300001023512drd:DeferredTaxAssetsGrossMemberifrs-full:MiscellaneousOtherProvisionsMember2025-06-300001023512drd:DeferredTaxAssetsGrossMemberifrs-full:LeaseLiabilitiesMember2026-06-300001023512drd:DeferredTaxAssetsGrossMemberifrs-full:LeaseLiabilitiesMember2025-06-300001023512drd:DeferredTaxAssetsGrossMemberdrd:EstimatedTaxLossesMember2026-06-300001023512drd:DeferredTaxAssetsGrossMemberdrd:EstimatedTaxLossesMember2025-06-300001023512drd:DeferredTaxAssetsGrossMemberdrd:EstimatedUnredeemedCapitalAllowancesMember2026-06-300001023512drd:DeferredTaxAssetsGrossMemberdrd:EstimatedUnredeemedCapitalAllowancesMember2025-06-300001023512drd:DeferredTaxAssetsGrossMember2026-06-300001023512drd:DeferredTaxAssetsGrossMember2025-06-300001023512ifrs-full:EquitySettlementMember2026-06-300001023512ifrs-full:EquitySettlementMember2025-06-300001023512drd:EstimatedTaxLossesMember2026-06-300001023512drd:EstimatedTaxLossesMember2025-06-300001023512drd:EstimatedTaxLossesCapitalNatureMember2026-06-300001023512drd:EstimatedTaxLossesCapitalNatureMember2025-06-300001023512drd:UnredeemedCapitalExpenditureMember2026-06-300001023512drd:UnredeemedCapitalExpenditureMember2025-06-300001023512drd:EquitySettledLongTermIncentiveELTISchemeMember2025-07-012026-06-300001023512drd:EquitySettledLongTermIncentiveELTISchemeMember2024-07-012025-06-300001023512drd:EquitySettledLongTermIncentiveELTISchemeMember2023-07-012024-06-300001023512drd:DeferredSharePlanDSPSchemeMember2025-07-012026-06-300001023512drd:DeferredSharePlanDSPSchemeMember2024-07-012025-06-300001023512drd:DeferredSharePlanDSPSchemeMember2023-07-012024-06-300001023512drd:ConditionalSharesMember2025-07-012026-06-300001023512drd:EquitySettledLongTermIncentiveELTISchemeMember2025-06-300001023512drd:EquitySettledLongTermIncentiveELTISchemeMember2024-06-300001023512drd:EquitySettledLongTermIncentiveELTISchemeMember2026-06-300001023512drd:EquitySettledLongTermIncentiveELTISchemeMemberdrd:October192025Member2026-06-300001023512drd:EquitySettledLongTermIncentiveELTISchemeMemberdrd:October192025Member2025-06-300001023512drd:EquitySettledLongTermIncentiveELTISchemeMemberdrd:October252026Member2026-06-300001023512drd:EquitySettledLongTermIncentiveELTISchemeMemberdrd:October252026Member2025-06-300001023512drd:EquitySettledLongTermIncentiveELTISchemeMemberdrd:October222027Member2026-06-300001023512drd:EquitySettledLongTermIncentiveELTISchemeMemberdrd:October222027Member2025-06-300001023512ifrs-full:TreasurySharesMember2025-06-300001023512ifrs-full:OrdinarySharesMemberdrd:EquitySettledLongTermIncentiveELTISchemeMember2025-08-272025-08-270001023512srt:ScenarioForecastMember2027-10-222027-10-220001023512srt:ScenarioForecastMember2026-10-252026-10-250001023512ifrs-full:OrdinarySharesMemberdrd:DeferredSharePlanDSPMember2025-08-272025-08-270001023512drd:DeferredSharePlanDSPMember2025-07-012026-06-300001023512drd:DeferredSharePlanDSPMember2026-06-300001023512drd:DeferredSharePlanDSPMemberdrd:A13August2026Member2026-06-300001023512drd:DeferredSharePlanDSPMemberdrd:A13August2027Member2026-06-300001023512drd:DeferredSharePlanDSPMemberdrd:A13August2028Member2026-06-300001023512drd:DeferredSharePlanDSPMemberdrd:A13August2029Member2026-06-300001023512drd:DeferredSharePlanDSPMemberdrd:A13August2030Member2026-06-300001023512drd:NedbankRevolvingCreditFacilityWithAccordionOptionMember2024-06-280001023512drd:NedbankGBFGuaranteesFacilityMember2025-07-012026-06-300001023512drd:NedbankGBFGuaranteesFacilityMember2024-07-012025-06-300001023512drd:NedbankGBFGuaranteesFacilityMember2026-06-300001023512drd:NedbankGBFGuaranteesFacilityMember2025-06-300001023512drd:NedbankRevolvingCreditFacilityWithAccordionOptionMember2026-06-300001023512ifrs-full:OrdinarySharesMember2025-06-300001023512ifrs-full:OrdinarySharesMember2024-06-300001023512ifrs-full:PreferenceSharesMember2026-06-300001023512ifrs-full:PreferenceSharesMember2025-06-300001023512ifrs-full:PreferenceSharesMember2024-06-300001023512ifrs-full:OrdinarySharesMember2023-06-300001023512ifrs-full:TreasurySharesMember2026-06-300001023512ifrs-full:TreasurySharesMember2024-06-300001023512drd:DeferredSharePlanDSPMemberifrs-full:MajorOrdinaryShareTransactionsMember2026-09-022026-09-020001023512ifrs-full:TreasurySharesMemberdrd:EquitySettledLongTermIncentiveELTISchemeMember2025-07-012026-06-300001023512ifrs-full:RetainedEarningsMemberdrd:ErgoMiningOperationsProprietaryLimitedMember2025-07-012026-06-300001023512ifrs-full:RetainedEarningsMemberdrd:ErgoMiningOperationsProprietaryLimitedMember2024-07-012025-06-300001023512ifrs-full:RetainedEarningsMemberdrd:ErgoMiningOperationsProprietaryLimitedMember2023-07-012024-06-300001023512ifrs-full:MajorOrdinaryShareTransactionsMember2026-08-192026-08-190001023512drd:StellarEnergySolutionsSPVMemberifrs-full:DisposalGroupsClassifiedAsHeldForSaleMember2025-08-180001023512drd:StellarEnergySolutionsSPVMemberifrs-full:DisposalGroupsClassifiedAsHeldForSaleMember2025-11-170001023512drd:StellarEnergySolutionsSPVMemberifrs-full:DisposalGroupsClassifiedAsHeldForSaleMember2025-06-300001023512drd:StellarEnergySolutionsSPVMemberifrs-full:DisposalGroupsClassifiedAsHeldForSaleMember2025-07-012026-06-300001023512drd:StellarEnergySolutionsSPVMemberifrs-full:DisposalGroupsClassifiedAsHeldForSaleMember2026-06-300001023512ifrs-full:DisposalGroupsClassifiedAsHeldForSaleMember2025-07-012026-06-300001023512ifrs-full:OperatingSegmentsMemberdrd:ErgoOperationsMember2025-07-012026-06-300001023512ifrs-full:OperatingSegmentsMemberdrd:FwgrMember2025-07-012026-06-300001023512ifrs-full:MaterialReconcilingItemsMember2025-07-012026-06-300001023512ifrs-full:OperatingSegmentsMemberdrd:ErgoOperationsMember2024-07-012025-06-300001023512ifrs-full:OperatingSegmentsMemberdrd:FwgrMember2024-07-012025-06-300001023512ifrs-full:MaterialReconcilingItemsMember2024-07-012025-06-300001023512ifrs-full:OperatingSegmentsMemberdrd:ErgoOperationsMember2023-07-012024-06-300001023512ifrs-full:OperatingSegmentsMemberdrd:FwgrMember2023-07-012024-06-300001023512ifrs-full:MaterialReconcilingItemsMember2023-07-012024-06-300001023512drd:SummonFirstMember2026-06-300001023512drd:SummonSecondMember2026-06-300001023512drd:WestWitsMiningLimitedWWMMemberifrs-full:Level1OfFairValueHierarchyMember2026-06-300001023512drd:WestWitsMiningLimitedWWMMemberifrs-full:Level1OfFairValueHierarchyMemberifrs-full:BottomOfRangeMember2026-06-300001023512drd:WestWitsMiningLimitedWWMMemberifrs-full:Level1OfFairValueHierarchyMember2025-06-300001023512drd:RandRefineryProprietaryLimitedRandRefineryMemberifrs-full:Level3OfFairValueHierarchyMember2026-06-300001023512drd:RandRefineryProprietaryLimitedRandRefineryMemberifrs-full:Level3OfFairValueHierarchyMember2025-06-300001023512drd:RandmutualassurancecompanylimitedMemberifrs-full:Level3OfFairValueHierarchyMember2026-06-300001023512drd:RandmutualassurancecompanylimitedMemberifrs-full:Level3OfFairValueHierarchyMember2025-06-300001023512drd:Guardriskinsurancecompanylimitedcellcaptivea170Memberifrs-full:Level3OfFairValueHierarchyMember2026-06-300001023512drd:Guardriskinsurancecompanylimitedcellcaptivea170Memberifrs-full:Level3OfFairValueHierarchyMember2025-06-300001023512drd:ChamberOfMinesBuildingCompanyProprietaryLimitedMemberifrs-full:Level3OfFairValueHierarchyMember2026-06-300001023512drd:ChamberOfMinesBuildingCompanyProprietaryLimitedMemberifrs-full:Level3OfFairValueHierarchyMember2025-06-300001023512ifrs-full:Level3OfFairValueHierarchyMember2026-06-300001023512ifrs-full:Level3OfFairValueHierarchyMember2025-06-300001023512drd:WestWitsMiningLimitedWWMMember2025-07-012026-06-300001023512drd:WestWitsMiningLimitedWWMMember2024-07-012025-06-300001023512ifrs-full:AtFairValueMemberdrd:RandRefineryProprietaryLimitedRandRefineryMember2025-07-012026-06-300001023512ifrs-full:AtFairValueMemberdrd:RandRefineryProprietaryLimitedRandRefineryMember2024-07-012025-06-300001023512drd:RandmutualassurancecompanylimitedMember2025-07-012026-06-300001023512drd:RandmutualassurancecompanylimitedMember2024-07-012025-06-300001023512drd:RandRefineryProprietaryLimitedRandRefineryMember2025-07-012026-06-300001023512drd:RandRefineryProprietaryLimitedRandRefineryMember2024-07-012025-06-300001023512drd:WestWitsMiningLimitedWWMMemberifrs-full:Level1OfFairValueHierarchyMemberifrs-full:TopOfRangeMember2025-06-300001023512drd:Guardriskinsurancecompanylimitedcellcaptivea170Member2026-06-300001023512ifrs-full:AtFairValueMemberdrd:RandRefineryProprietaryLimitedRandRefineryMember2025-06-300001023512ifrs-full:AtFairValueMemberdrd:RandRefineryProprietaryLimitedRandRefineryMember2024-06-300001023512drd:RandRefineryProprietaryLimitedRandRefineryMember2025-07-012026-06-300001023512drd:RandRefineryProprietaryLimitedRandRefineryMember2024-07-012025-06-300001023512drd:TerminalGrowthRateMemberdrd:RandRefineryProprietaryLimitedRandRefineryMember2026-06-300001023512drd:TerminalGrowthRateMemberdrd:RandRefineryProprietaryLimitedRandRefineryMember2025-06-300001023512ifrs-full:WeightedAverageCostOfCapitalMeasurementInputMemberdrd:RandRefineryProprietaryLimitedRandRefineryMember2026-06-300001023512ifrs-full:WeightedAverageCostOfCapitalMeasurementInputMemberdrd:RandRefineryProprietaryLimitedRandRefineryMember2025-06-300001023512drd:OperatingCostsMemberdrd:RandRefineryProprietaryLimitedRandRefineryMember2026-06-300001023512drd:OperatingCostsMemberdrd:RandRefineryProprietaryLimitedRandRefineryMember2025-06-300001023512drd:MinorityDiscountMemberdrd:RandRefineryProprietaryLimitedRandRefineryMember2026-06-300001023512drd:MinorityDiscountMemberdrd:RandRefineryProprietaryLimitedRandRefineryMember2025-06-300001023512drd:MarketabilityDiscountMemberdrd:RandRefineryProprietaryLimitedRandRefineryMember2026-06-300001023512drd:MarketabilityDiscountMemberdrd:RandRefineryProprietaryLimitedRandRefineryMember2025-06-300001023512drd:EkurhuleniMetropolitanMunicipalityElectricityTariffDisputeMember2025-07-012026-06-300001023512drd:EkurhuleniMetropolitanMunicipalityElectricityTariffDisputeMember2026-06-300001023512drd:BenoniGoldMiningCompanyMember2024-05-180001023512drd:BenoniGoldMiningCompanyFirstClaimMember2024-05-180001023512drd:BenoniGoldMiningCompanySecondClaimMember2024-05-180001023512ifrs-full:MajorOrdinaryShareTransactionsMember2026-09-022026-09-020001023512drd:DeferredSharePlanDSPMemberifrs-full:MajorOrdinaryShareTransactionsMemberdrd:DJPretoriusMember2025-08-122025-08-120001023512drd:DeferredSharePlanDSPMemberifrs-full:MajorOrdinaryShareTransactionsMemberdrd:HHooijerMember2025-08-122025-08-120001023512drd:DeferredSharePlanDSPMemberifrs-full:MajorOrdinaryShareTransactionsMemberdrd:WJSchoemanMember2025-08-122025-08-120001023512drd:DeferredSharePlanDSPMemberifrs-full:MajorOrdinaryShareTransactionsMemberdrd:DirectorsAndPrescribedOfficersMember2025-08-122025-08-12
UNITED STATES SECURITIES AND EXCHANGE COMMISSION
WASHINGTON, D.C. 20549
FORM 20-F
☐
REGISTRATION STATEMENT PURSUANT TO SECTION 12(b) OR (g) OF THE SECURITIES EXCHANGE ACT OF
1934
OR
☑
ANNUAL REPORT PURSUANT TO SECTION 13 OR 15(d) OF THE SECURITIES EXCHANGE ACT OF 1934
For the fiscal year ended June 30, 2026
OR
☐
TRANSITION REPORT PURSUANT TO SECTION 13 OR 15(d) OF THE SECURITIES EXCHANGE ACT OF 1934
OR
☐
SHELL COMPANY REPORT PURSUANT TO SECTION 13 OR 15(d) OF THE SECURITIES EXCHANGE ACT OF 1934
Commission file number 0-28800
DRDGOLD LIMITED
(Exact name of Registrant as specified in its charter and translation of Registrant's name into English)
REPUBLIC OF SOUTH AFRICA
(Jurisdiction of incorporation or organization)
Constantia Office Park Cnr 14th Avenue and Hendrik Potgieter Road, Cycad House, Building 17, Ground Floor,
Weltevreden Park, 1709, South Africa
(Address of principal executive offices)
Henriette Hooijer, Chief Financial Officer, Tel. no. +27 11 470 2600, Email [email protected]
Mpho Mashatola, Senior Executive: Finance, Tel. no. +27 11 470 2600, Email [email protected]
(Name, Telephone, Email and/or Facsimile number and Address of Company Contact Person)
Securities registered or to be registered pursuant to Section 12(b) of the Act
Title of each class:
Trading symbol
Name of each exchange on which registered:
American Depositary Shares, each representing 10
ordinary shares
DRD
New York Stock Exchange
Ordinary shares
New York Stock Exchange*
*Not for trading, but only in connection with the registration of the American Depositary Shares pursuant to the requirements of the Securities and
Exchange Commission.
Securities registered or to be registered pursuant to Section 12(g) of the Act None
Securities for which there is a reporting obligation pursuant to Section 15(d) of the Act None
Indicate the number of outstanding shares of each of the issuer's classes of capital or common stock as of the close of the period
covered by the annual report. 867,397,699 ordinary shares of no par value outstanding as of June 30, 2026.
Indicate by check mark if the registrant is a well-known seasoned issuer, as defined in Rule 405 of the Securities Act. Yes ☑  No ☐
If this report is an annual or transition report, indicate by check mark if the registrant is not required to file reports pursuant to
Section 13 or 15(d) of the Securities Exchange Act of 1934.  Yes ☐  No ☑
Note – Checking the box above will not relieve any registrant required to file reports pursuant to Section 13 or 15(d) of the
Securities Exchange Act of 1934 from their obligations under those Sections.
Indicate by check mark whether the registrant (1) has filed all reports required to be filed by Section 13 or 15(d) of the Securities
Exchange Act of 1934 during the preceding 12 months (or for such shorter period that the registrant was required to file such
reports), and (2) has been subject to such filing requirements for the past 90 days.  Yes ☑  No ☐
Indicate by check mark whether the registrant has submitted electronically every Interactive Data File required to be submitted
pursuant to Rule 405 of Regulation S-T (§232.405 of this chapter) during the preceding 12 months (or for such shorter period that
the registrant was required to submit such files). Yes ☑  No ☐
Indicate by check mark whether the registrant is a large accelerated filer, an accelerated filer, a non-accelerated filer, or an
emerging growth company. See definition of “large accelerated filer,” “accelerated filer,” and “emerging growth company” in Rule
12b-2 of the Exchange Act.
Large accelerated filer ☑  Accelerated filer ☐  Non-accelerated filer ☐ Emerging growth company ☐
If an emerging growth company that prepares its financial statements in accordance with U.S. GAAP, indicate by check mark if the
registrant has elected not to use the extended transition period for complying with any new or revised financial accounting
standards† provided pursuant to Section 13(a) of the Exchange Act.
† The term “new or revised financial accounting standard” refers to any update issued by the Financial Accounting Standards
Board to its Accounting Standards Codification after April 5, 2012.
Indicate by check mark whether the registrant has filed a report on and attestation to its management’s assessment of the
effectiveness of its internal control over financial reporting under Section 404(b) of the Sarbanes-Oxley Act (15 U.S.C. 7262(b)) by
the registered public accounting firm that prepared or issued its audit report. ☑
If securities are registered pursuant to Section 12(b) of the Act, indicate by check mark whether the financial statements of the
registrant included in the filing reflect the correction of an error to previously issued financial statements.☐
Indicate by check mark whether any of those error corrections are restatements that required a recovery analysis of incentive-
based compensation received by any of the registrant’s executive officers during the relevant recovery period pursuant to
§240.10D-1(b). ☐
Indicate by check mark which basis of accounting the registrant has used to prepare the financial statements included in this filing.
U.S. GAAP ☐  International Financial Reporting Standards as issued by the International Accounting Standards Board ☑  Other ☐
If “Other” has been checked in response to the previous question, indicate by check mark which financial statement item the
registrant has elected to follow.  Item 17 ☐  Item 18 ☐
If this is an annual report, indicate by check mark whether the registrant is a shell company (as defined in Rule 12b-2 of the
Exchange Act).
Yes ☐  No ☑
(APPLICABLE ONLY TO ISSUERS INVOLVED IN BANKRUPTCY PROCEEDINGS DURING THE PAST FIVE YEARS)
Indicate by check mark whether the registrant has filed all documents and reports required to be filed by Sections 12, 13 or  15(d)
of the Securities Exchange Act of 1934 subsequent to the distribution of securities under a plan confirmed by a court.
Yes ☐  No ☐

DRDGold_Breadcrumbs_Logo_RGB.jpg
DRDGOLD Limited Form 20-F 2026
TABLE OF CONTENTS
Page
PART I
DRDGold_Breadcrumbs_Logo_RGB.jpg
DRDGOLD Limited Form 20-F 2026
TABLE OF CONTENTS
PART II
PART III
ITEM 17.
FINANCIAL STATEMENTS
83
ITEM 18.
FINANCIAL STATEMENTS
83
ITEM 19.
EXHIBITS
85
SIGNATURES
87
DRDGold_Breadcrumbs_Logo_RGB.jpg
DRDGOLD Limited Form 20-F 2026
1
Preparation of Financial Information
We are a South African company and currently all our operations are located in South Africa. Accordingly, our books of account
are maintained in South African Rand. Our financial statements included in our corporate filings are prepared in accordance with
International Financial Reporting Standards Accounting Standards (“IFRS Accounting Standards”), as issued by the International
Accounting Standards Board (“IASB”).
Our consolidated financial statements included in this Annual Report are prepared in accordance with IFRS Accounting Standards
as issued by the IASB. All financial information in this Annual Report, except as otherwise noted is prepared in accordance with
IFRS Accounting Standards as issued by the IASB.
We present our financial information in rand, which is our presentation and reporting currency. All references to “Dollars” or “$”
herein are to United States Dollars and references to “Rand” or “R” are to South African Rand. Solely for your convenience, this
Annual Report contains translations of certain Rand amounts into Dollars at specified rates. These Rand amounts do not represent
actual Dollar amounts, nor could they necessarily have been converted into Dollars at the rates indicated. Unless otherwise
indicated, Rand amounts have been translated into Dollars at the rate of R16.39 per $1.00, the year end exchange rate on
June 30, 2026.
In this Annual Report, we present certain non-IFRS financial measures including “Adjusted EBITDA”, “cash operating costs”, “cash
operating costs per kilogram”, “all-in sustaining costs”, “all-in sustaining costs per kilogram”, “all-in costs”, “all-in costs per
kilogram”, “growth capital expenditure” and “sustaining capital expenditure”.  The non-IFRS measures “cash operating costs”,
“cash operating costs per kilogram”, “all-in sustaining costs”, “all-in sustaining costs per kilogram”, “all-in costs”, “all-in costs per
kilogram”, “growth capital expenditure” and “sustaining capital expenditure” have been determined using industry guidelines
promulgated by the World Gold Council, and are used to determine costs associated with producing gold, cash generating
capacities of the mines and to monitor the performance of our mining operations. An investor should not consider these items in
isolation or as alternatives to, operating costs, cash generated from operating activities, profit/(loss) for the year or any other
measure of financial performance presented in accordance with IFRS Accounting Standards or as an indicator of our performance.
While the World Gold Council has provided guidance for the calculation of cash operating costs, cash operating costs per
kilogram, all-in sustaining costs and all-in costs per kilogram as well as classification of capital expenditure between sustaining
capital expenditure and growth capital expenditure, such measurements may vary significantly among gold mining companies,
and these definitions by themselves do not necessarily provide a basis for comparison with other gold mining companies. See
Glossary of Terms and Explanations and Item 5A. Operating Results – “Cash operating costs, cash operating costs per kilogram,
sustaining capital expenditure, all-in sustaining costs, growth capital expenditure and all-in costs per kilogram”, “Reconciliation of
cash operating costs, cash operating costs per kilogram, all-in sustaining costs, all-in sustaining costs per kilogram, all-in costs
and all-in costs per kilogram” and "Reconciliation of sustaining capital expenditure and growth capital expenditure".
DRDGOLD Limited
When used in this Annual Report, the term the “Company” refers to DRDGOLD Limited and the terms “we,” “our,” “us” or “the
Group” refer to the Company and its subsidiaries as appropriate in the context.
Special Note Regarding Forward-Looking Statements
This Annual Report contains certain “forward-looking” statements within the meaning of Section 21E of the U.S. Securities
Exchange Act of 1934, regarding expected future events, circumstances, trends and expected future financial performance and
information relating to us that are based on the beliefs of our management, as well as assumptions made by and information
currently available to our management. Some of these forward-looking statements include phrases such as “anticipates,”
“believes,” “could,” “estimates,” “expects,” “intends,” “may,” “should,” or “will continue,” or similar expressions or the negatives
thereof or other variations on these expressions, or similar terminology, or discussions of strategy, plans or intentions, including
statements in connection with, or relating to, among other things:
•our reserve calculations and underlying assumptions;
•the trend information discussed in "Item 5D. Trend Information", including target gold production and cash operating costs;
•life-of-mine and potential increase in life-of-mine;
•statements made in or with respect to the Technical Report Summaries (“TRS” or “TRSs”) including statements with respect to
Mineral Reserves and Resources and assumptions, gold prices, projected revenue and cash flows and capital expenditures and
other forward looking statements in the TRSs;
•estimated future throughput capacity and production;
•expected trends in our gold production as well as the demand for and the price of gold;
•our anticipated labor, electricity, water, crude oil and steel costs;
•our expectation that existing cash will be sufficient to fund our operations in the next 12 months including our anticipated
commitments;
•estimated production costs, cash operating costs per ounce, all-in sustaining costs per ounce and all-in costs per ounce;
•expectations on future gold price, supply and pricing trends, including long-term trends, expected impact of the global
environment on gold prices;
•expected gold production and cash operating costs expected in fiscal year 2027;
•statements with respect to agreements with unions;
•our prospects in litigation and disputes;
•statements with respect to the legal review for recommissioning the Withok Tailings Storage Facility (“Withok TSF”) to increase
Ergo Mining Proprietary Limited’s (“Ergo”) deposition capacity and the construction of the Regional Tailings Storage Facility
(“RTSF”), and expected potential increase in capacity and life-of-mine;
•statements with respect to the Solar Power Project (“Solar Plant”) developed by Ergo and the AZTEC Upflow Reactor (“UFR”);
•expected deposition capacity from improvements in our dams and new tailings storage facility construction; and
•expected effective gold mining tax rate.
DRDGold_Breadcrumbs_Logo_RGB.jpg
DRDGOLD Limited Form 20-F 2026
2
Such statements reflect our current views with respect to future events and are subject to risks, uncertainties and assumptions.
Many factors could cause our actual results, performance or achievements to be materially different from any future results,
performance or achievements that may be expressed or implied by such forward-looking statements, including, among others:
•regulatory and construction delays in commissioning replacement tailings storage facilities as existing facilities approach
capacity;
•adverse changes or uncertainties in general economic conditions in South Africa;
•the future of power security from South Africa's power utility and intensity of load shedding;
•regulatory developments adverse to us or difficulties in maintaining necessary licenses or other governmental approvals;
•future performance relating to the Far West Gold Recoveries (“FWGR”) Phase 2 assets and the reclamation sites on the east of
Ergo’s plant;
•damage to tailings storage facilities and excessive maintenance and rehabilitation costs;
•a disruption in information technology systems, including incidents related to cybersecurity;
•changes in the demand for and the price of gold;
•changes in, or that affect, our business strategy;
•that assumptions underlying our Mineral Reserves and Mineral Resources as set forth in this report and our TRSs prove to be
incorrect;
•challenges in replenishing mineral reserves;
•our ability to achieve anticipated efficiencies and other cost savings in connection with past and future acquisitions;
•the success of our business strategy, development activities and other initiatives;
•changes in technical and economic assumptions underlying our Mineral Reserve estimates;
•any major disruption in production at our key facilities;
•adverse changes in foreign exchange rates;
•adverse environmental or environmental regulatory changes;
•adverse changes in ore grades and recoveries, and to the quality or quantity of reserves;
•unforeseen technical production issues, industrial accidents and theft;
•anticipated or unanticipated capital expenditure on property, plant and equipment; and
•various other factors, including those set forth in "Item 3D. Risk Factors".
For a discussion of such risks, see "Item 3D. Risk Factors". The risk factors described above and in Item 3D. could affect our future
results, causing these results to differ materially from those expressed in any forward-looking statements. These factors are not
necessarily all of the important factors that could cause our results to differ materially from those expressed in any forward-looking
statements. Other unknown or unpredictable factors could also have material adverse effects on future results.
Investors are cautioned not to place undue reliance on these forward-looking statements, which speak only as of the date thereof.
We do not undertake any obligation to update publicly or release any revisions to these forward-looking statements to reflect
events or circumstances after the date of this Annual Report or to reflect the occurrence of unanticipated events.
Special Note Regarding Websites
References in this document to information on websites (and/or social media sites) are included as an aid to their location and
such information is not incorporated in, and does not form part of, this annual report. Any links to external, or third-party websites,
are provided solely for convenience. We take no responsibility whatsoever for any third-party information contained in such third-
party websites, and we specifically disclaim adoption or incorporation by reference of such information into this report and no
websites are incorporated by reference into this report.
Imperial units of measure and metric equivalents
The table below sets forth units stated in this document, which are measured in Imperial and Metric.
Metric
Imperial
Imperial
Metric
1 metric tonne
1.10229 short tons
1 short ton
0.9072 metric tonnes
1 kilogram
2.20458 pounds
1 pound
0.4536 kilograms
1 gram
0.03215 troy ounces
1 troy ounce
31.10353 grams
1 kilometer
0.62150 miles
1 mile
1.609 kilometers
1 meter
3.28084 feet
1 foot
0.3048 meters
1 liter
0.26420 gallons
1 gallon
3.785 liters
1 hectare
2.47097 acres
1 acre
0.4047 hectares
1 centimeter
0.39370 inches
1 inch
2.54 centimeters
1 gram/tonne
0.0292 ounces/ton
1 ounce/ton
34.28 grams/tonnes
0 degree Celsius
32 degrees Fahrenheit
0 degrees Fahrenheit
- 18 degrees Celsius
DRDGold_Breadcrumbs_Logo_RGB.jpg
DRDGOLD Limited Form 20-F 2026
3
Glossary of Terms and Explanations
The table below sets forth a glossary of terms used in this Annual Report:
Adjusted EBITDA
Adjusted EBITDA means earnings before interest, tax, depreciation, amortization, share-based
payment (benefit)/expense, change in estimate of environmental rehabilitation recognized in profit
or loss, gain/(loss) on disposal of property, plant and equipment, gain/(loss) on financial
instruments, exploration expenses and transaction costs, and retrenchment costs, after IFRS 16
lease payments. This is a non-IFRS financial measure and should not be considered a substitute
measure of profit for the year reported by us in accordance with IFRS Accounting Standards.
Administration expenses
and other costs excluding
non-recurring items
Administration expenses and other costs excluding gain/loss on disposal of property, plant and
equipment and transaction costs.
All-in sustaining costs
All-in sustaining costs is a measure on which guidance is provided by the World Gold Council
and includes cash operating costs of production, plus movement in gold in process on a sales
basis, corporate administration expenses and other (costs)/income, the accretion of rehabilitation
costs and sustaining capital expenditure. Costs other than those listed above are excluded. All-in
sustaining costs per kilogram are calculated by dividing total all-in sustaining costs by kilograms
of gold sold. This is a non‑IFRS financial measure and should not be considered a substitute
measure of costs and expenses reported by us in accordance with IFRS Accounting Standards.
All-in costs
All-in costs is a measure on which guidance is provided by the World Gold Council and includes
all-in sustaining costs, retrenchment costs, care and maintenance costs, ongoing rehabilitation
expenditure, growth capital expenditure and capital recoupments. Costs other than those listed
above are excluded. All-in costs per kilogram are calculated by dividing total all-in costs by
kilograms of gold sold. This is a non‑IFRS financial measure and should not be considered a
substitute measure of costs and expenses reported by us in accordance with IFRS Accounting
Standards.
Assaying
The chemical testing process of ore samples to determine mineral content.
Recommissioning of the
Withok TSF
The recommissioning of the Withok Tailings Storage Facility is the engineering design that
ultimately brings the tailings storage facility to its finality in terms of extent, operation, rehabilitation
and management. The implemented final design would result in alignments with the principles
that underscore the outcomes pursued under with the Global Industry Standard on Tailings
Management (“GISTM”) and regulatory bodies, increase deposition capacity, improve operation/
management and bring about the sustainable closure of the facility.
$/oz
US Dollar per ounce.
Called gold content
The theoretical gold content of material processed.
Care and maintenance
costs
Costs to ensure that the Ore Reserves are open, serviceable and legally compliant after active
mining activity at a shaft has ceased.
Cash operating costs
Cash operating costs are operating costs incurred directly in the production of gold and include
labor costs, contractor and other related costs, machine hire, reagents, consumable stores,
electricity and water costs and the movement in gold in process and finished inventories - gold
bullion. It excludes ongoing rehabilitation expenses, care and maintenance costs and net other
operating costs/(income). Cash operating costs per kilogram are calculated by dividing cash
operating costs by kilograms of gold sold. This is a non‑IFRS financial measure and should not be
considered a substitute measure of costs and expenses reported by us in accordance with IFRS
Accounting Standards.
Cut‑off grade
The grade (i.e., the concentration of metal or mineral in rock) that distinguishes material deemed
to have no economic value from material deemed to have economic value.
CIL Circuit
Carbon-in-leach circuit.
Definitive Feasibility Study
(“DFS”)
A definitive engineering estimate of all costs, revenues, equipment requirements and production
at a -5% to +10% level of accuracy. The study is used to define the economic viability of a project
and to support the search for project financing.
Depletion
The decrease in the quantity of ore in a deposit or property resulting from extraction or
production.
Deposition
Deposition is the geological process by which material is added to a landform or land mass.
Fluids such as wind and water, as well as sediment flowing via gravity, transport previously
eroded sediment, which, at the loss of enough kinetic energy in the fluid, is deposited, building up
layers of sediment. Deposition occurs when the forces responsible for sediment transportation are
no longer sufficient to overcome the forces of particle weight and friction, creating a resistance to
motion.
Dilution
Waste or material below the cut-off grade that contaminates the ore during the course of mining
operations and thereby reduces the average grade mined.
Doré
Unrefined gold and silver bullion bars consisting of approximately 90% precious metals which will
be further refined to almost pure metal.
Footwall
The underlying side of a stope or ore body.
DRDGold_Breadcrumbs_Logo_RGB.jpg
DRDGOLD Limited Form 20-F 2026
4
Glossary of Terms and Explanations
Grade
The amount of gold contained within auriferous material generally expressed in ounces per ton or
grams per tonne of ore.
Growth capital expenditure
Capital additions that are not sustaining capital expenditure. This is a non‑IFRS financial measure
and should not be considered a substitute measure of costs and expenses reported by us in
accordance with IFRS Accounting Standards.
g/t
Grams per tonne.
Indicated Mineral Resources
That part of a Mineral Resource for which quantity and grade or quality are estimated on the basis
of adequate geological evidence and sampling. The level of geological certainty associated with
an indicated Mineral Resource is sufficient to allow a qualified person to apply modifying factors
in sufficient detail to support mine planning and evaluation of the economic viability of the deposit.
Because an indicated Mineral Resource has a lower level of confidence than the level of
confidence of a measured Mineral Resource, an indicated Mineral Resource may only be
converted to a probable Mineral Reserve.
Inferred Mineral Resources
That part of a Mineral Resource for which quantity and grade or quality are estimated on the basis
of limited geological evidence and sampling. The level of geological uncertainty associated with
an inferred Mineral Resource is too high to apply relevant technical and economic factors likely to
influence the prospects of economic extraction in a manner useful for evaluation of economic
viability. Because an inferred Mineral Resource has the lowest level of geological confidence of all
Mineral Resources, which prevents the application of the modifying factors in a manner useful for
evaluation of economic viability, an inferred Mineral Resource may not be considered when
assessing the economic viability of a mining project and may not be converted to a Mineral
Reserve.
Measured Mineral
Resources
That part of a Mineral Resource for which quantity and grade or quality are estimated on the basis
of conclusive geological evidence and sampling. The level of geological certainty associated with
a measured Mineral Resource is sufficient to allow a qualified person to apply modifying factors,
in sufficient detail to support detailed mine planning and final evaluation of the economic viability
of the deposit. Because a measured Mineral Resource has a higher level of confidence than the
level of confidence of either an indicated Mineral Resource or an inferred Mineral Resource, a
measured Mineral Resource may be converted to a proven Mineral Reserve or to a probable
Mineral Reserve.
Metallurgical plant
A processing plant (mill) erected to treat ore and extract the contained gold.
Mineral Reserves
An estimate of tonnage and grade or quality of indicated and measured Mineral Resources that,
in the opinion of the qualified person, can be the basis of an economically viable project. More
specifically, the economically mineable part of a measured or indicated Mineral Resource, which
includes diluting materials and allowances for losses that may occur when the material is mined
or extracted.
Mineral Resources
A concentration or occurrence of material of economic interest in or on the Earth's crust in such
form, grade or quality, and quantity that there are reasonable prospects for economic extraction.
A Mineral Resource is a reasonable estimate of mineralization, taking into account relevant factors
such as cut-off grade, likely mining dimensions, location or continuity, that, with the assumed and
justifiable technical and economic conditions, is likely to, in whole or in part, become
economically extractable. It is not merely an inventory of all mineralization drilled or sampled.
Mine call factor
The gold content recovered expressed as a percentage of the called gold content.
Modifying factors
The factors that a qualified person must apply to indicated and measured Mineral Resources and
then evaluate in order to establish the economic viability of Mineral Reserves. A qualified person
must apply and evaluate modifying factors to convert measured and indicated Mineral Resources
to proven and probable Mineral Reserves. These factors include, but are not restricted to: Mining;
processing; metallurgical; infrastructure; economic; marketing; legal; environmental compliance;
plans, negotiations, or agreements with local individuals or groups; and governmental factors.
The number, type and specific characteristics of the modifying factors applied will necessarily be
a function of and depend upon the mineral, mine, property, or project.
Mt
Million tonnes.
Ore
A mixture of valuable and worthless materials from which the extraction of at least one mineral is
technically and economically viable.
Other operating costs /
(income)
Expenses incurred, and income generated in the course of operating activities, which are not
directly attributable to production activities.
Operating costs
Operating costs are cost of sales less depreciation, change in estimate of rehabilitation provision,
movement in gold in process and finished inventory – gold bullion, ongoing rehabilitation
expenditure, care and maintenance, other operating costs/income and retrenchment costs.
oz/t
Ounces per ton.
DRDGold_Breadcrumbs_Logo_RGB.jpg
DRDGOLD Limited Form 20-F 2026
5
Glossary of Terms and Explanations
Prefeasibility study (“PFS”)
A comprehensive study of a range of options for the technical and economic viability of a mineral
project that has advanced to a stage where a preferred mining method, in the case of
underground mining, the pit configuration, in the case of an open pit or surface tailings, is
established and an effective method of mineral processing is determined. It includes a financial
analysis based on reasonable assumptions on the modifying factors and the evaluation of any
other relevant factors which are sufficient for a qualified person, acting reasonably, to determine if
all or part of the Mineral Resource may be converted to a Mineral Reserve at the time of reporting.
A prefeasibility study is at a lower confidence level than a feasibility study.
Proven Mineral Reserves
The economically mineable part of a measured Mineral Resource and can only result from
conversion of a measured Mineral Resource.
Probable Mineral Reserves
The economically mineable part of an indicated and in some cases, a measured Mineral
Resource.
Qualified Person
An individual who is a mineral industry professional with at least 5 years of relevant experience in
the type of mineralization and type of deposit under consideration and in the specific type of
activity that person is undertaking on behalf of the registrant, and an eligible member or licensee
in a good standing of a recognized professional organization at the time the technical report is
prepared.
Refining
The final purification process of a metal or mineral.
Rehabilitation
The process of restoring mined land to a condition approximating its original state.
Reserves
That part of a mineral deposit which could be economically and legally extracted or produced at
the time of the reserve determination.
Sand dump
A historical surface deposit consisting primarily of coarse material generated from the processing
of ore and deposited by earlier mining operations. Sand dumps may contain residual
mineralization that can be economically recovered through retreatment and may constitute a
Mineral Resource where reasonable prospects for eventual economic extraction have been
demonstrated.
Sediment
The deposition of solid fragmental material that originated from weathering of rocks and was
transported from a source to a site of deposition.
Slimes
The tailings discharged from a processing plant after the valuable minerals have been recovered.
Sustaining capital
expenditure
Sustaining capital expenditure are those capital additions that are necessary to maintain current
gold production. This is a non‑IFRS financial measure and should not be considered a substitute
measure of costs and expenses reported by us in accordance with IFRS Accounting Standards.
T’000
Tonnes in thousands.
Tailings
Finely ground rock from which valuable minerals have been extracted by milling, or any waste
rock, slimes or residue derived from any mining operation or processing of any minerals.
Tailings storage facility
A dam created from waste material of processed ore after the economically recoverable gold has
been extracted.
Tonnage/Tonne
Quantities where the metric tonne is an appropriate unit of measure. Typically used to measure
reserves of gold‑bearing material in‑situ or quantities of ore and waste material mined,
transported or milled.
Tpm
Tonne per month.
Yield
The amount of recovered gold from production generally expressed in ounces or grams per ton
or tonne of ore.
DRDGold_Breadcrumbs_Logo_RGB.jpg
DRDGOLD Limited Form 20-F 2026
6
PART I
ITEM 1. IDENTITY OF DIRECTORS, SENIOR MANAGEMENT AND ADVISERS
Not applicable.
ITEM 2. OFFER STATISTICS AND EXPECTED TIMETABLE
Not applicable.
ITEM 3. KEY INFORMATION
3A. [Reserved]
3B. CAPITALIZATION AND INDEBTEDNESS
Not applicable.
3C. REASONS FOR THE OFFER AND USE OF PROCEEDS
Not applicable.
3D. RISK FACTORS
In conducting our business, we face many risks that may interfere with our business objectives. Some of these risks relate to our
operational processes, while others relate to our business environment. It is important to understand the nature of these risks and
the impact they may have on our business, financial condition and operating results. Some of these risks are summarized below
and have been organized into the following categories:
•Risks related to our business and operations;
•Risks related to the gold mining industry;
•Risks related to doing business in South Africa;
•Risks related to Environmental, Social and Governance (“ESG”) performance including climate change;
•Risks related to government regulation as well as other legal and regulatory requirements; and
•Risks related to ownership in our ordinary shares or American Depositary Shares (“ADSs”).
Risks related to our business and operations
Regulatory and construction delays in commissioning replacement tailings storage facilities as existing facilities approach
capacity could result in reduced or suspended deposition and adversely affect our production and results of operations.
Our primary Tailings Storage Facilities (“TSFs”) are subject to a Dam Safety Evaluation (“DSE”) every five years, conducted by an
independent Approved Professional Person (“APP”). Following each evaluation, the APP is required to submit its findings and
recommendations to the regulator, the Department of Water and Sanitation (“DWS”). Such recommendations may include
adjustments to deposition rates, or other operational or structural measures that could result in changes, limitations or restrictions
on the use of the TSF, which may in turn adversely affect our throughput rate and production.
Each operation monitors the geo-technical integrity of its TSFs carefully in accordance with a prescribed set of parameters.
A deterioration in any of these parameters may result in a reduction in or suspension of throughput, which may in turn affect
production.
At the Ergo operation, the Brakpan TSF is a mature facility and is approaching its final phase as a mega-volume tailings storage
facility. To support the long-term sustainability of deposition capacity, Ergo is advancing regulatory applications associated with
the potential recommissioning of the adjacent Withok TSF, which, if approved and successfully commissioned, could provide
approximately 310 million tonnes of additional deposition capacity. The public participation process has been completed and the
project is currently progressing through the required regulatory approval processes, including environmental authorisation, a waste
management licence and a water use licence. Subject to the receipt of all required approvals and successful construction,
commissioning is currently targeted for the end of calendar year 2029. Delays in obtaining approvals, changes to regulatory
requirements or construction challenges could affect the timing of commissioning and adversely impact future deposition capacity,
throughput and production.
The regulatory process to recommission the Withok TSF is complex, though, and the regulator may not approve all aspects of the
envisaged design. The footprint and location of the facility make construction challenging, which may result in missed target dates
and failure to achieve planned throughput rates. While the commissioning of the Daggafontein deposition facility is expected to
reduce deposition volumes to the Brakpan TSF and assist in managing available deposition capacity in the medium term,
Daggafontein alone is not expected to provide a long-term solution to Ergo's deposition requirements. Consequently, regulatory
and construction delays in commissioning replacement tailings storage facilities, including Withok, as existing facilities approach
capacity, could result in reduced deposition flexibility, constrained throughput and, ultimately, adversely affect production and
results of operations.
At the FWGR operation, key projects to increase deposition capacity include the development of the RTSF as part of the Phase 2
FWGR project and is intended to provide replacement deposition capacity required to support the continued operation and
expansion of FWGR. Timely commissioning of the new facilities is critical, as any delay may result in reduced deposition rates or a
suspension of deposition which, in the absence of interim alternative deposition facilities, would have an adverse financial impact
on the business.
DRDGold_Breadcrumbs_Logo_RGB.jpg
DRDGOLD Limited Form 20-F 2026
7
Our large projects are subject to scheduling delays and cost overruns, and we may face constraints in financing our current
operations or any future projects, which could render our projects unviable or less profitable than planned.
Our large projects, most notably the development of FWGR Phase 2, which includes the construction of the RTSF, the Driefontein
Plant 2 (“DP2”) plant upgrade and construction of pipelines linking DP2 and RTSF, to expand our operations to the western side of
Johannesburg. Projects related to Ergo include the pipeline linking Ergo Plant to the Daggafontein TSF to resume deposition on the
Daggafontein TSF and the recommissioning of Withok TSF to enable mining on the west of the Ergo plant. These projects are
subject to numerous risks and challenges such as strict quality standards and specifications, delays, cost overruns, regulatory
approvals and requirements, social and environmental risks as well as technical risks including, inter alia:
•unforeseen increases in the cost of equipment, labor and raw materials;
•delays or disruptions in the supply of equipment and raw materials;
•unforeseen design and engineering problems;
•unforeseen ground conditions/geotechnical risks requiring extensive test work and ground monitoring which may impact
timeliness and  costs;
•changes in construction plans that may require new or amended planning permissions;
•delays in obtaining the necessary regulatory approvals;
•unforeseen construction problems;
•unforeseen delays commissioning sections of the project;
•inadequate phasing of activities;
•labor disputes and social challenges;
•security issues;
•health and safety risks;
•inadequate workforce planning or productivity of workforce;
•inadequate management practices;
•loss of, or inability to retain, key personnel whose experience and know-how are critical to project execution and operational
continuity;
•natural disasters and adverse weather conditions;
•poor contractor performance/failure or delay of third-party service providers; and
•changes to regulations, such as environmental regulations.
The development of our projects involve capital intensive processes carried out over long durations, which requires us to commit
significant capital expenditure and allocate considerable management resources in utilizing our existing experience and know-
how. For example, the DP2 plant expansion project involves the construction of the plant’s own elution circuit and smelt house, and
a doubling of current throughput capacity to 1.2 Mtpm. Completion is expected in the first quarter of FY2027. Initial feed to the
expanded plant will be from the Driefontein 3 tailings and eventually the Libanon tailings (commissioning planned from the last
quarter of FY2027), 600,000tpm from each, reaching a steady state of 1.2 million tonnes per month in FY2028.
Construction of the RTSF, done in two phases, is progressing well; however, severe rainfall events during FY2025 and FY2026
affected construction activities and placed pressure on the planned beneficial occupation timeline. With an ultimate deposition
capacity of 800 Mt and designed to ultimately receive tailings at a deposition rate of up to 2.4 Mt per month, phase 1 of the RTSF is
expected to be completed during the second quarter of FY2027, with construction of the remaining sections continuing
concurrently with the commencement of deposition at an initial planned rate of 1.2 Mt per month.
A key consideration for beneficial occupation (which originally was planned for the first quarter of FY2027), remains the uncertainty
regarding the Department of Water and Sanitation's requirements and the timeline for obtaining the necessary approvals for early
deposition. Although the beneficial occupation date has been deferred to the last quarter of FY2027 due to the above and weather
dependency, which aligns with the commissioning of the Libanon Pump Station, any further delay in obtaining regulatory approvals
could defer the planned increase in throughput capacity. This may result in lower production and ultimately returns and over time
also may require reducing deposition throughput at Driefontein 4 TSF as it is set to reach capacity during the last quarter of
FY2027, subject to the outcomes of the annual performance review.
Management continues to closely monitor the critical path activities, regulatory requirements and construction progress to support
the timely delivery of the RTSF capacity.
At Ergo, the recommissioning of the Withok TSF remains subject to regulatory approvals, the process of which is currently
underway. Once recommissioned, Withok TSF is planned to have a design deposition capacity of approximately 310 million tonnes
with a life of about 20 years and an eventual deposition rate of 1.3 million tonnes per month. Delays in obtaining these
authorizations could delay the planned increase in tonnages at Ergo from 1.65 million tonnes per month to 1.8 million tonnes per
month and also result in lower production, and ultimately returns, as Brakpan TSF nears its end of life. Commissioning is expected
during FY2030.
We face the risk that the expected benefits of our projects, such as those described above, are not achieved, or that we fail to
account for potential challenges during the transition from construction to fully operational status, as well as the integration of
constructed works into existing processes and systems. In particular, the phase 2 FWGR project, resumption of deposition on the
Daggafontein TSF and recommissioning of the Withok TSF are material to us, and significant cost overruns or adverse changes in
assumptions affecting the viability of these projects could have a material adverse effect on our business, cash flows, financial
condition and prospects. Any such failure may negatively impact production output.
In addition, if the assumptions we make in assessing the viability of our projects, including those relating to commodity prices,
exchange rates, interest rates, inflation rates and discount rates, prove to be incorrect or need to be significantly revised, this may
adversely affect profitability or even the viability of our projects. The uncertainty and volatility in the gold market makes it more
difficult to accurately evaluate the project economics and increases the risk that the assumptions underlying our assessment of the
viability of the project may prove incorrect.
DRDGold_Breadcrumbs_Logo_RGB.jpg
DRDGOLD Limited Form 20-F 2026
8
Our operating cash flow, available banking facilities and ability to raise funds from banks or the capital markets may be insufficient
to meet our capital expenditure plans and requirements, depending on the timing and cost of development of our existing projects
and any further projects we may pursue. As a result, new sources of capital may be needed to meet the funding requirements of
these projects and to fund ongoing business activities. Our ability to raise and service new sources of capital will depend on, inter
alia, macroeconomic conditions, cost of debt, our credit rating, our gearing and other risk metrics, financial market conditions,
future gold prices, the prospects for our industry, our operational performance and our operating cash flow and debt position. Any
inability to raise such funds may place a burden on our cash reserves and affect our ability to finance our key projects.
In the event of operating or financial challenges, any dislocation in financial markets or new funding limitations, our ability to pursue
new business opportunities, invest in existing and new projects, fund our ongoing business activities and pay dividends, could be
constrained, any of which could have a material adverse effect on our business, operating results, cash flows and financial
condition.
Supply shortages and price volatility for key operating materials could adversely affect production and increase operating
costs.
Global inflationary pressures, geopolitical volatility, and the increasing frequency and severity of natural disasters, including severe
weather, floods and earthquakes, present risks to the availability and cost of critical materials and equipment, and require ongoing
proactive management of key supplier dependencies. A sustained shortage or elevated cost of critical inputs, such as reagents,
fuel, electricity and natural gas, may require us to source alternative suppliers, implement operational workarounds or incur higher
procurement costs, potentially reducing production and increasing operating costs.
As tailings retreatment operations process high volumes of material, they require significant quantities of cyanide, creating a
dependency on a limited number of suppliers and presenting a concentration risk. During fiscal year 2026, Sasol, a key supplier of
sodium cyanide, declared force majeure following supply disruptions. However, DRDGOLD had proactively implemented
mitigation measures, including the commissioning of a briquette plant which solubilises cyanide briquettes to liquid cyanide, which
significantly reduced the potential operational impact of the disruption. While these initiatives enhanced supply resilience, any
prolonged interruption in cyanide availability, continued supplier capacity constraints, or the need to import material from
alternative sources could result in increased costs and, in severe cases, reduced production.
South Africa’s reliance on imported natural gas exposes the country to increasing gas-supply challenges over the next three years
underpinned by geopolitical developments, infrastructure constraints, supply-chain disruptions and increasing demand. Reduced
availability and higher gas prices may progressively increase operational and cost risk. This risk is further amplified by gas being a
key feedstock in the manufacture of sodium cyanide, adding to the risk of cyanide supply challenges as mentioned above.
Geopolitical factors also present material vulnerabilities to supply reliability and logistics, particularly with respect to access to oil.
In early 2026, conflict between the United States and Iran resulted in the closure of the Strait of Hormuz, a critical global oil transit
route, causing a significant spike in global energy prices that directly impacted our costs. Although conditions have subsequently
improved, geopolitical tensions in the region remain and there can be no assurance that further escalation, disruption to shipping
routes or constraints on global energy supply will not occur. Any such developments could cause further significant disruption to
global oil and energy markets and our operating costs.
Additionally, the Group’s ability to source certain machinery and products may be impacted by the imposition of protectionist trade
measures, including tariffs. From 2025, the United States imposed significant tariffs on a broad range of imported goods, including
a 30% tariff on South African exports, raising concerns regarding job losses, rising export costs, and slower economic growth in
South Africa. Although those tariffs have since been reduced following legal challenges in the United States, the tariff landscape
continues to evolve and remains highly uncertain. There can be no assurance that additional tariffs introduced by the United States
or other jurisdictions will not further disrupt global supply chains or increase the cost of equipment and materials used in our
operations.
Any unforeseen shortages or increases in supply costs could negatively impact our profitability and adversely affect our ability to
meet project deadlines, due to issues with the availability of supplies, elevated freight costs and above-inflationary increases for
capital equipment. Such disruptions could affect operations and production and could ultimately result in a failure to deliver on our
business plans.
Underperformance of solar and energy storage infrastructure could increase electricity costs and adversely affect operational
performance.
Our mining operations are currently dependent on electricity supplied by Eskom, South Africa’s state-owned utility company, which
has historically been unable to meet the energy requirements of the South African economy and has implemented a system of
power rationing or load shedding to prevent a complete collapse of the national electricity grid. See “—Power stoppages or
shortages or increases in the cost of power could negatively affect our results and financial condition”. To reduce its reliance on
Eskom and reduce its future cost of electricity, Ergo has completed the construction and commissioning of the Solar Power Project
(“Solar Plant”), which comprises a 60 MW solar photovoltaic plant together with an associated 160 MWh battery energy storage
system (“BESS”), supplying power to Ergo’s operations and offsetting consumption across multiple Eskom accounts.
Although the Solar Plant and BESS have reduced Ergo's reliance on Eskom and contributed to lower Eskom electricity
consumption and costs since commissioning, there is a risk that these facilities will not operate as expected or that they will not
achieve their intended performance or efficiency levels as they have been designed to meet certain key performance indicator
targets. Any failure of the Solar Plant or BESS to deliver in accordance with such targets, whether due to technical malfunctions,
adverse weather conditions, degradation of equipment or other operational factors, may expose Ergo to increased Eskom tariffs
and increase its reliance on Eskom's electricity. Any such increase in electricity costs could adversely affect Ergo’s cash position.
DRDGold_Breadcrumbs_Logo_RGB.jpg
DRDGOLD Limited Form 20-F 2026
9
Damage to tailings storage facilities and excessive maintenance and rehabilitation costs could result in lower production and
health, safety and environmental liabilities.
Our tailings storage facilities are exposed to numerous risks and events, the occurrence of which may result in the failure, breach
or damage of such a facility. These may include sabotage, piping or seepage failures, failure by our employees to adhere to the
codes of practice and natural disasters such as excessive rainfall and seismic events, any of which could force us to stop or limit
operations. The likelihood and severity of these risks are expected to increase as the effects of climate change intensify. In
addition, these tailings storage facilities could overflow or a side wall could collapse jeopardizing the health and safety of our
employees and communities living around these facilities and potentially resulting in extensive property and environmental
damage.
In the event of damage to, or any failure of, our tailings facilities, we could face legal proceedings (including criminal proceedings
and public civil actions) and investigations involving significant damage claims. These actions would likely result in substantial
costs and could require significant expenditure to support the recovery of affected regions, communities, people and
environmental remediation. The occurrence of any of these risks could adversely affect our operations and this in turn could have a
material adverse effect on our business, operating results and financial condition.
Changes in laws and regulations that impose more stringent standards, may also lead to increased capital expenditure to update
our tailings storage facilities, expand them in the future or continue to meet existing or more stringent legal (including permit)
requirements.
Due to the nature of our business, our operations face extensive health and safety risks and regulation of those risks.
Gold mining is exposed to numerous risks and events, the occurrence of which may result in the death of, or personal injury, to
employees or others. These risks and events include amongst other, severe weather exposures such as heat, rain, flooding, wind
and hail storms, ground or slope failures, sink holes, fires, seismic events, dust, silica and other airborne exposures, discharges of
toxic gases and other substances including exposure due to the storage and handling of chemical / reagent and other hazardous
material as well as radioactivity, exposures due to mobile and heavy mining equipment interactions, noise, vibration and other
occupational hygiene exposures, electrical and mechanical hazards and working at heights.
According to section 54 of the Mine, Health and Safety Act of 1996, if an inspector believes that any occurrence, practice or
condition at a mine endangers or may endanger the health or safety of any person at the mine, the inspector may give any
instruction necessary to protect the health or safety of persons at the mine. These instructions could include the suspension of
operations at the whole or part of the mine. Health and safety incidents could lead to mine operations being halted and that will
affect production and increase our unit production costs, which could have a material adverse effect on our business, operating
results and financial condition.
As with environmental incidents, the occurrence of health and safety risks result in increased regulator and stakeholder scrutiny.
Such scrutiny could increase compliance costs, and lead to enforcement actions or litigation by regulators, affected stakeholders
and others which may result in significant fines or liabilities. These risks could adversely affect our operations through revocation of
permits and approvals, the imposition of new conditions, and reputational impacts. The occurrence of such risks could have a
material adverse effect on our business, operating results and financial condition.
After five years of operating without a fatality, we very sadly lost a colleague at Ergo due to fatal injuries sustained on April 13, 2024
when a side-wall slip at the 5L27 dump impacted the loader he was operating. Subsequent to the fatality, the Group operated
fatality-free during FY2025 and FY2026, with several safety metrics improving across both reporting periods. The Group continues
to prioritize safety, has strengthened oversight and leadership at all operations, and continues with safety programs and
monitoring, although there can be no assurance that these measures will be sufficient to prevent further safety incidents.
The construction and execution of current large projects has also resulted in an increased number of contractors and construction
vehicles within existing operating areas. This has elevated the likelihood of safety-related incidents. Notwithstanding intensified
scrutiny to promote adherence by operational and project teams to safety protocols and procedures, a safety-related incident
could result in stoppage of operations or project works, which could adversely impact production.
Potable water scarcity and increased reliance on secondary water sources may adversely affect our operations and
increase costs.
Our operations require substantial volumes of water to transport material from reclamation sites to processing plants, for gold
recovery processes within the plants, transferring residual material to the TSF, and for rehabilitation and other activities. Water is
therefore a strategic resource that underpins DRDGOLD's ability to sustain production, optimize metallurgical recovery and
support future growth. South Africa is one of the world's most water-stressed countries, increasing pressure on national water
resources, driven by climate change, aging infrastructure, population growth and challenges in municipal water management
which continue to heighten the risk of securing reliable and affordable water supplies. During FY2025, there was an increase in
disruptions in water supply by Rand Water (South Africa's largest bulk water utility) to Gauteng residents. While, through our water
reticular process, we have progressively diversified our water sources to reduce dependence on potable water, our operations still
remain dependent on supplementing water requirements from alternative water sources, including treated acid mine drainage
(“AMD”), which requires ongoing treatment that comes at a cost. At our Far West operations, water supply is supplemented by
underground dewatering activities. Changes in future dewatering requirements, water availability and future growth may require
increased pumping capacity and associated energy costs, placing additional pressure on operating expenditure over the life of the
operation.  The use of secondary water sources including non-potable or contaminated water may expose us to additional
regulatory, environmental, operational and health-related risks, and may require costly treatment and monitoring. In addition, the
DWS has indicated its intention to introduce a waste discharge charge system applicable to all waste-related activities with the
potential to impact water resources. In June 2024, the DWS published a revised Pricing Strategy for Raw Water Use Charges, with
a stated effective date of April 2026. The implementation timeline for this charge system has not yet been confirmed and remains
subject to review, with the DWS planning a phased implementation approach with full roll-out targeted by 2030. Once fully
implemented, the water discharge charge system may have significant cost implications for our operations.
DRDGold_Breadcrumbs_Logo_RGB.jpg
DRDGOLD Limited Form 20-F 2026
10
Although we continue to research and implement measures to optimize water use and recycling, including in relation to water
reticulation systems as well as the re-use of grey or treated water, there can be no assurance that these efforts will be sufficient to
secure the quality and quantity of water required for our operations. As part of life-of-mine planning, we continuously assess our water
requirements and are developing strategies to secure the appropriate quality and quantity of water over the short- to longer-term.
However, implementing these strategies may be onerous and could significantly increase our operational costs. Any inability to secure
a reliable and adequate water supply could disrupt production and adversely affect our business, operating results and financial
condition.
A disruption in our information technology systems, including incidents related to cybersecurity, could adversely affect our
business operations.
We rely on the accuracy, availability and security of our information technology systems. Despite the measures that we have
implemented, including those related to cybersecurity, our systems could be breached or damaged by computer viruses and
systems attacks, natural or man-made incidents, disasters or unauthorized physical or electronic access.
Any system failure, accident or security breach could result in business disruption, theft of our intellectual property, trade secrets
(including our proprietary technology), unauthorized access to, or disclosure of, personnel or supplier information, corruption of our
data or of our systems, reputational damage or litigation. We may also be required to incur significant cost to protect against or repair
the damage caused by these disruptions or security breaches in the future, including, for example, rebuilding internal systems,
implementing additional threat protection measures, defending against litigation, responding to regulatory inquiries or actions, paying
damages, or taking other remedial steps with respect to third parties.  Refer to "Item 16K. Cybersecurity".
These threats are constantly evolving, including through the use of new technologies such as artificial intelligence and machine
learning by threat actors, thereby increasing the difficulty of successfully defending against them or implementing adequate
preventative measures and we remain subject to additional known or unknown threats. In some instances, we may be unaware of an
incident or its magnitude and effects. We may be susceptible to cyber-attacks, including phishing and ransomware attacks, in the
evolving landscape of cybersecurity threats. Cybersecurity attacks have recently become more prevalent in the mining industry,
which has increased the likelihood of DRDGOLD being targeted for cybersecurity attacks in the future. An extended failure of critical
system components, caused by accidental, or malicious actions, including those resulting from a cybersecurity attack, could result in
a significant environmental incident, compromise of employee safety, commercial loss or interruption to operations as well as loss or
misappropriation of confidential information, including personal data relating to our current or former employees. Such information
could also be made public in a manner that harms DRDGOLD’s reputation and financial results and, particularly in the case of
personal data, could lead to regulators imposing significant fines on DRDGOLD.
In addition, from time to time, we implement updates to our information technology systems and software, which can disrupt or shut
down our information technology systems. We may also adopt artificial intelligence and other emerging technologies into our
information technology systems or mining operations. Such tools may additionally be utilized by our contractors and third parties that
we conduct business with. The use of artificial intelligence may not meet the existing and rapidly evolving regulatory standards and
could introduce security risks that may expose confidential data, lead to the loss of competitive information and result in operational
failures. Although we seek to comply with applicable cybersecurity legislation and regulation, including the South African Cybercrimes
Act and the SEC’s final rules on cybersecurity risk management, strategy, governance, and incident disclosure, there can be no
guarantee that these efforts will be sufficient to meet evolving privacy, data protection and cybersecurity requirements. Information
technology system disruptions or security breaches, if not appropriately addressed or mitigated, could have a material adverse effect
on our operations.
Any interruption in gold production at either of our two mining operations generating cash flows could adversely affect our
business operations.
We have two mining operations generating cash flows, namely Ergo and FWGR. Ergo’s reclamation sites, processing plants, pump
stations and the Brakpan TSF are linked through pipeline infrastructure. The Ergo plant is currently our major processing plant.
FWGR’s reclamation sites, DP2 processing plant, pump stations and the Driefontein 4 Tailings Storage Facility are linked through
pipeline infrastructure.
Our reclamation sites, plants, pipeline infrastructure and the tailings storage facilities are exposed to numerous risks, including
operational down time due to planned or unplanned maintenance and possible load shedding or power dips, adverse weather,
destruction of infrastructure, spillages, higher than expected operating costs, or lower than expected production as a result of
decreases in extraction efficiencies due to imbalances in the metallurgical process as well as inconsistent volume throughput or other
factors. For additional information, see “—Supply shortages and price volatility for key operating materials could adversely affect
production and increase operating costs,” “—Power stoppages or shortages or increases in the cost of power could negatively affect
our results and financial condition,” and “—Damage to tailings storage facilities and excessive maintenance and rehabilitation costs
could result in lower production and health, safety and environmental liabilities.”
FWGR's operations are reliant on access to and use of Sibanye Stillwater Limited’s (“Sibanye-Stillwater”) mining infrastructure,
property and related services, including water and electricity supply. FWGR also relies on various rights, permits and licenses held by
Sibanye Gold Proprietary Limited, a wholly owned subsidiary of Sibanye-Stillwater, pursuant to which FWGR operates, pending the
transfer to FWGR of such rights, permits and licenses that are transferable. Any disruption in the supply of, or our ability to use and
access Sibanye-Stillwater's mining infrastructure, property, related services, rights, permits and licenses, could have an adverse
impact on our operations.
Any of the risks above or other interruptions could adversely impact our operations which could have a material adverse effect on our
business, operating results and financial condition.
DRDGold_Breadcrumbs_Logo_RGB.jpg
DRDGOLD Limited Form 20-F 2026
11
Changes in the market price for gold and exchange rate fluctuations, both of which have fluctuated widely in the past, affect
the profitability of our operations and the cash flows generated by those operations.
Gold produced is sold at a Dollar gold price and spot exchange rate specified in a contract with the South African bullion banks to
deliver the gold at a specified settlement date. As we are an unhedged gold producer, our results are fully exposed to fluctuations in
the Dollar gold price and spot exchange rate. Most of our production costs are incurred in Rands, while gold is sold in US Dollars and
subsequently converted to Rands. Accordingly, our financial and operational results have been, and could in the future be, materially
affected by movements in the value of the Rand and the US Dollar gold price. Any sustained decline in the Dollar gold price from
current levels and/or any sustained appreciation in the value of the Rand to levels below the cost of production could result in
decreased profitability, impairment losses and closure of operations. This could lead to significant costs including the cost of
retrenchments and closure costs. We generally do not enter into forward contracts to limit our exposure to fluctuations in the US Dollar
gold price or movements in the Rand exchange rate. In circumstances where medium-term debt is raised to fund growth projects, the
Group may enter into price protection arrangements to mitigate consequential liquidity risk. While hedging can provide short-term
protection against adverse movements in the gold price or Rand/Dollar exchange rate, it carries the risk of opportunity costs if the
gold price rises significantly above the hedged level.
Historically, the price of gold has fluctuated widely and is affected by numerous industry factors over which we have no control
including:
•a significant amount of above-ground gold in the world that is used for trading by investors;
•the physical supply of gold from world-wide production and scrap sales, and the purchase, sale or divestment by central banks of
their gold holdings;
•the demand for gold for investment purposes, industrial and commercial use, and in the manufacturing of jewelry;
•speculative trading activities in gold;
•the overall level of forward sales by other gold producers;
•the overall level and cost of production of other gold producers;
•international or regional political and economic events or trends;
•actual or threatened protectionist trade policies and tariffs, which may affect global economic conditions, currency values and
investor demand for gold;
•actual or threatened tariffs on gold, which could have an adverse effect on the global gold market and gold prices and could
increase the cost of selling gold in global markets;
•the strength of the Dollar (the currency in which gold prices generally are quoted) and of other currencies;
•changes in interest rates and financial market expectations regarding the rate of inflation;
•gold hedging and de-hedging by gold producers; and
•actual or expected gold sales by central banks and the International Monetary Fund.
During fiscal year 2026, the gold price traded between a low of approximately US$3,275 per ounce and a high of approximately
US$5,399 per ounce. Investor demand for gold as a safe-haven asset rose markedly during the period, with a number of market
dynamics and factors that may have contributed to it, such as the geopolitical conflict in the Middle East, and the associated
disruption to global energy markets; escalating trade tensions arising from US tariff policies, which fueled broader economic
uncertainty and contributed to a weaker US Dollar; and record levels of accumulation by several central banks. We benefited from the
resulting elevated gold prices, which supported our revenue and profitability throughout fiscal year 2026.
The gold price has traded at or near record levels during fiscal year 2026; however, there can be no assurance that such price levels
will be sustained. Moreover, while elevated gold prices support our operating performance, they may also give rise to additional risks.
For example, a sustained period of elevated gold prices may increase asset acquisition costs, and investments or acquisitions made
on the basis of elevated gold price assumptions may prove unviable if gold prices subsequently decline. In addition, elevated gold
price assumptions may give rise to inflated Mineral Reserve and Mineral Resource estimates and life-of-mine plans; if gold prices
were subsequently to decline, certain reserves could become uneconomic, potentially resulting in downward revisions to those
estimates, reductions in mine life, and impairments of mining assets.
The gold price remained strong and volatile throughout fiscal year 2026, driven by global and domestic factors. At June 30, 2026, the
average spot gold price received was approximately US$4,238 per ounce, representing an increase of 50% compared to June 30,
2025 (when the average spot gold price received was approximately US$2,818 per ounce) and an increase of 36% at June 30, 2025
compared to June 30, 2024. Notwithstanding this year-on-year increase, the gold price experienced significant intra-year volatility in
response to changing investor sentiment, developments in global trade relations, geopolitical events, and expectations regarding the
timing and extent of future US Federal Reserve interest rate adjustments. Additional contributing factors to gold price volatility
throughout the period included fluctuations in the US Dollar, inflation expectations, and broader global economic uncertainty.
The Rand/Dollar exchange rate remained volatile throughout fiscal year 2026, driven by global and domestic factors. At June 30,
2026, the Rand traded at R16.39 = US$1.00, strengthening by 8% against the Dollar compared to June 30, 2025 (when the Rand
traded at R17.75 = US$1.00) and a 2% strengthening at June 30, 2025 compared to June 30, 2024. This year-on-year appreciation
reflected a broadly weaker US Dollar, driven in part by global investor concerns regarding the fiscal and trade impact of US tariff
policies, together with improved investor sentiment toward South Africa supported by the narrowing of South Africa’s current account
deficit and the continued stability of South Africa’s electricity supply, with Eskom providing stable electricity to the grid throughout
fiscal year 2026 (load shedding has been suspended since March 2024, though it may be reinstated at any time).  Notwithstanding
this year-on-year appreciation, the Rand experienced significant intra-year volatility, strengthening to approximately R15.73 against
the Dollar earlier in the fiscal year before retracing as geopolitical tensions, including disruptions to shipping through the Strait of
Hormuz, contributed to higher energy prices and a partial shift away from emerging market currencies. The Rand subsequently
recovered as global risk appetite improved. Additional contributing factors to exchange rate volatility throughout the period included
uncertainty around the timing and extent of US Federal Reserve interest rate reductions, US tariff policies and associated trade
tensions between the US and China, perceived political and economic instability, and the structurally weak growth of the South African
economy.
DRDGold_Breadcrumbs_Logo_RGB.jpg
DRDGOLD Limited Form 20-F 2026
12
Any sustained adverse movement in the US dollar gold price, the Rand/Dollar exchange rate, or any of the other factors described
above could reduce our revenue, compress our margins and adversely affect our profitability and cash flows, which could have a
material adverse effect on our business, operating results and financial condition.
Depletion of profitable reserves and/or failure to acquire new Mineral Reserves could negatively affect our future cash flows,
operating results and financial condition.
New or ongoing exploration programs may be delayed or may not result in new mineral producing operations that will sustain or
increase our Mineral Reserves. A failure to acquire new quality Mineral Reserves with reasonable prospects for economic extraction to
maintain or grow the current levels will negatively affect our future cash flow, operating results and financial condition and may have a
material adverse effect on the future viability of our operations. This is particularly relevant to the RTSF, which has been designed to
hold more than current reserve levels at FWGR. See “—We may be unable to make desirable acquisitions or to integrate successfully
any businesses we acquire, including the development of Phase 2 of the FWGR assets acquired from Sibanye-Stillwater.”
At the same time Mineral Reserves that are depleted without replacement will result in a gradual decline in our life-of-mine (“LoM”)
and long-term sustainability. If we are unable to identify Mineral Reserves while maintaining sufficient controls on production and other
costs, this will have a material effect on the future viability of our operations.
We may be unable to make desirable acquisitions or to integrate successfully any businesses we acquire, including the
development of Phase 2 of the FWGR assets acquired from Sibanye-Stillwater.
Our future success may depend in part on the acquisition of businesses or technologies intended to complement, enhance or expand
our current business or products or that might otherwise offer us growth opportunities. Our ability to complete such transactions may
be hindered by a number of factors, including difficulties in identifying suitable acquisition targets, obtaining necessary financing and
potential difficulties in obtaining required government approvals. Any acquisitions we make could fail to achieve our financial or
strategic objectives or disrupt our ongoing business, which could adversely impact our results of operations.
Any acquisition we make could also pose risks related to the integration of the new business or technology with our business and
organization. For example, the integration of the FWGR assets, acquired from Sibanye-Stillwater in 2018, remains ongoing. The
development of Phase 2 of the FWGR assets, which comprises a number of significant capital projects, forms a key component of that
integration, and failure to execute Phase 2 successfully would adversely affect our ability to realize the full anticipated benefits of this
acquisition. See “—Our large projects are subject to scheduling delays and cost overruns, and we may face constraints in financing
our current operations or any future projects, which could render our projects unviable or less profitable than planned.” We cannot be
certain that we will be able to achieve the benefits we expect from a particular acquisition or investment. Acquisitions may also strain
our managerial and operational resources, as the challenge of managing new operations may divert our management from day-to-
day operations of our existing business. Furthermore, we may have difficulty integrating employees, business systems, and
technology. The controls, processes and procedures of acquired businesses may also not adequately ensure compliance with laws
and regulations, and we may fail to identify compliance issues or liabilities. Our business, financial condition and results of operations
may be materially and adversely affected if we fail to coordinate our resources effectively to manage both our existing operations and
any businesses we acquire.  Acquisitions can also result in unforeseen liabilities.
Moreover, our resources are limited and our decision to pursue a transaction has opportunity costs; accordingly, if we pursue a
particular transaction, we may need to forgo the prospect of entering into other transactions that could help us achieve our financial or
strategic objectives.
We may not be able to meet our cash requirements because of a number of factors, many of which are beyond our control.
Management’s estimates on future cash flows are subject to risks and uncertainties, such as the Rand gold price, production
volumes, recovered grades and costs. See “—Changes in the market price for gold and exchange rate fluctuations, both of which
have fluctuated widely in the past, affect the profitability of our operations and the cash flows generated by those operations,” “—An
increase in production costs could have an adverse effect on our results of operation,” and “—Our large projects are subject to
scheduling delays and cost overruns, and we may face constraints in financing our current operations or any future projects, which
could render our projects unviable or less profitable than planned.” The Group is currently investing significant capital in the execution
of several major projects. If we are unable to meet our cash requirements out of cash flows generated from our operations, we would
need to fund our cash requirements from financing sources and any such financing may not be permitted under the terms of our
financing arrangements or may not be possible on attractive terms or at all due to rising interest rates, or may not be available on
acceptable terms, or at all. If we do not generate sufficient cash flows or have access to adequate financing, our ability to respond to
changing business and economic conditions, make future acquisitions, react to adverse operating results, meet our debt service
obligations and fund required capital expenditures or meet our working capital requirements may be adversely affected.
DRDGold_Breadcrumbs_Logo_RGB.jpg
DRDGOLD Limited Form 20-F 2026
13
An increase in production costs could have an adverse effect on our results of operations.
An increase in our production costs could adversely affect our results of operations. Production costs are affected by, inter alia:
•rising global and national inflation;
•labor stability, productivity and increases in labor costs;
•increases in reagents and nature of material reclaimed;
•increases in electricity and water prices;
•increases in crude oil and steel prices;
•increases in security measures to protect our employees and infrastructure;
•changes in law and regulation;
•unforeseen changes in ore grades and recoveries;
•unexpected changes in the quality or quantity of reserves;
•technical production issues;
•availability and cost of smelting and refining arrangements;
•environmental and industrial accidents;
•gold theft;
•shortages or availability of materials used in production;
•environmental factors; and
•pollution.
Our production costs consist mainly of materials including reagents and steel, labor, electricity, specialized service providers,
machine hire, security, water, fuels, lubricants and other oil and petroleum-based products. Production costs have in the past, and
could in the future, increase at rates in excess of the South African annual inflation rate and impact our results of operations and, in
certain cases, result in the restructuring of these operations at substantial cost. The availability and cost of certain of these inputs may
also be subject to supply chain disruptions, geopolitical developments, or other external factors beyond our control. See “—Supply
shortages and price volatility for key operating materials could adversely affect production and increase operating costs.”
Labor costs represent a significant component of our production costs, and labor-related developments, including wage negotiations
and workforce disputes, could adversely affect our cost base and operations. A four-year wage agreement was reached with
organized labor at FWGR in November 2024, and a five-year wage agreement was reached with organized labor at Ergo beginning
February 2026. There can be no assurance that wage-related disputes will not arise or escalate into industrial action, including
potential labor strikes. Such developments could significantly disrupt operations and pose safety risks to employees. See “—Labor
disputes and changes in South African labor legislation could adversely affect our operations, operating results and financial
condition.”
Increases in production costs, if material, could adversely impact our results of operations.  In addition, any initiatives that we pursue
to reduce costs, such as reducing our reliance on Eskom’s grid through self-generation of power, for example through the Solar Plant
at Ergo, reducing our labor force, a reduction of the corporate overhead, negotiating lower price increases for consumables and cost
controls may not be successful or sufficient to offset the increases affecting our operations, which could adversely affect our business,
operating results and financial condition.
Our operations are subject to extensive environmental regulations which could impose significant costs and liabilities.
Our operations are subject to increasingly extensive national, provincial and local laws and regulations governing environmental
protection, which regulate, among other things, air and water quality, hazardous waste management and environmental rehabilitation
and reclamation. See “—Government policies in South Africa may adversely impact our operations and profits related to financial
provisioning for rehabilitation” and “Item 4.D. Business overview—Governmental regulations and their effects on our business—
Environmental Regulation.” Our mining and related activities have the potential to impact the environment, including land, water
resources, habitats, and areas surrounding our operations, including through dust generation, water use and the management of
tailings facilities. More complex and stringent environmental regulations could increase our compliance costs and capital expenditure
requirements, and may subject us to heightened regulatory and stakeholder scrutiny. Failure to comply with environmental laws or
delays in obtaining, or failures to obtain government permits and approvals, or the imposition of additional conditions on permits or
approvals may adversely impact our operations and may open us to enforcement actions and potential litigation. In addition, the
regulatory environment in which we operate could change in ways that could substantially increase costs of compliance, resulting in a
material adverse effect on our profitability.
Regulators may intensify their enforcement of applicable environmental laws and permitting requirements. Enforcement activities may
cause our operations to cease or to be suspended and may require us to undertake corrective measures that require additional
capital expenditure. We have also been, and may in the future be, subject to litigation and other costs as well, as actions by
authorities, affected stakeholders, non-governmental organizations and public bodies relating to environmental matters. These claims
and actions can result in significant liabilities, penalties and fines which can adversely affect our business, operating results, and
financial condition.
We have incurred, and expect to incur in the future, expenditures to comply with these environmental laws and regulations. We have
estimated our aggregate group Provision for Environmental Rehabilitation at a net present value of R721.4 million which is included in
our statement of financial position as at June 30, 2026. For further detail, see “Item 18. Financial Statements—Note 10—Provision for
environmental rehabilitation.” However, the ultimate amount of rehabilitation costs may in the future exceed the current estimates due
to factors beyond our control, such as changing legislation, higher than expected cost increases, or unidentified rehabilitation costs.
The Group provides for future obligations to rehabilitate by using funds held in insurance products. If any of our operations are
prematurely closed, the rehabilitation funds may be insufficient to meet all the rehabilitation obligations of those operations. The
closure of mining operations, without sufficient financial provision for the funding of rehabilitation liabilities, or unacceptable damage to
the environment, including pollution or environmental degradation, may expose us and our directors to prosecution, litigation and
potentially significant liabilities.
DRDGold_Breadcrumbs_Logo_RGB.jpg
DRDGOLD Limited Form 20-F 2026
14
Beyond compliance with local laws and regulations, our operations are also increasingly subject to stakeholder expectations
concerning the application of international environmental, and health and safety, and social standards. These include the International
Performance Corporation ("IPC") Performance Standards, World Gold Council guidelines, World Bank guidelines, and other
applicable voluntary frameworks. The application of these standards may similarly increase the cost of compliance, while the failure to
adhere to such standards could result in reputational damage and adversely affect our operations.
We may be subject to losses for which we are uninsured or underinsured, which could adversely affect our cash flows and
profitability.
The nature of our operations exposes us to liability for pollution, environmental damage and other operational hazards against which
adequate insurance coverage may not be available in the market or may not otherwise be maintained, including in respect of past
mining activities. Our existing property, business interruption and other insurance is subject to exclusions and limitations that may
leave certain losses not fully covered. The insured value for property and loss of profits due to business interruption is R27.8 billion,
with a total loss limit of R3.5 billion for Ergo and R1.25 billion for FWGR for fiscal year 2026. Business interruption coverage
commences from the time the loss occurs with a maximum indemnity period of 12 months and is subject to time and amount
deductibles that vary between coverage categories. To cover legal liability to third parties for damage, injury, illness or death, a total of
R1 billion insurance cover is in place for the 2026 fiscal year, subject to certain exclusions and limitations on coverage. There can be
no assurance that upon renewal of our insurance policies, equivalent coverage will be available in future periods on commercially
acceptable terms, or at all.
Our insurance coverage may be insufficient to cover the full extent of claims brought against us. These include claims arising from
environmental, industrial or pollution-related accidents or damage, the failure, breach, overflow or other incident involving our tailings
storage facilities, or business interruption resulting from electricity supply failures or interruptions, for which coverage is not available.
Such events could result in significant remediation costs, property damage, operational disruptions, regulatory penalties and third-
party claims for injury, loss of life or environmental harm. Our insurance policies also contain exclusions for losses arising from
infectious diseases or pandemics, meaning that any business interruption caused by such an event may not be covered and could
result in loss of revenue. If we are required to meet the costs of claims or losses that exceed our insurance coverage, this could have
a material adverse effect on our business, operating results and financial condition.
If we are unable to attract and retain key personnel, our business could be adversely affected.
The success of our business will depend, in large part, upon the skills and efforts of a small group of management and technical
personnel including the positions of Chief Executive Officer and Chief Financial Officer. The loss of any of our key personnel could
delay the execution of our business plans, which could result in decreased production, increased costs and decreased profitability.
For example, the former Chief Financial Officer vacated his position during fiscal year 2026, and while there was sufficient succession
planning in place, there is no guarantee that future departures will not disrupt the business. In addition, we do not maintain “key man”
life insurance policies on any members of our executive team.
The ability to retain and attract key personnel is further challenged by competition for skilled personnel. We compete with mining and
other companies on a global basis to attract and retain key human resources at all levels with appropriate technical skills and
operating and managerial experience necessary to operate the business. Our ability to retain and attract such personnel depends in
part on our ability to offer competitive compensation arrangements and other benefits. Any failure to attract or retain key personnel
could have a material adverse effect on our business, operating results and financial condition. 
Failure of technologies designed to improve extraction efficiencies and operational performance.
The low-grade nature of our resource requires economies of scale, mechanized mining and high levels of plant extraction efficiency,
supported by accurate analysis and disciplined capital investment. Our operations are also reliant on scarce environmental resources,
including energy and water. We therefore continue to assess and deploy technologies that can improve gold recoveries and
profitability by increasing extraction efficiency, reducing potable water consumption, increasing the use of renewable energy and
improving the efficient use of machinery and equipment across our operations.
This often requires capital investment. For example, we have previously invested in the central water facility, Rondebult waste water
plant, and the solar power plant and battery energy storage system at Ergo. Although extensive care, feasibility studies and test work
are performed to assess the suitability of technologies before implementation, there is no guarantee that these technologies will
perform as intended. They may also become less effective or redundant over time as new technological advances emerge.
In the current year, capital was approved for the construction of an up-flow reactor ("UFR") at the DP2 plant, following promising test
work that indicated the potential to improve gold recovery efficiency. Although extensive test work has been performed, there remains
a risk that the UFR may not perform as expected once implemented.
Risks related to the gold mining industry
A change in the Dollar price of gold, which in the past has fluctuated widely, is beyond our control.
For a discussion of the combined impact of gold price fluctuations and Rand/Dollar exchange rate movements on the gold mining
industry and our business, operating results and financial condition, see “—Changes in the market price for gold and exchange rate
fluctuations, both of which have fluctuated widely in the past, affect the profitability of our operations and the cash flows generated by
those operations.”
The exploration of mineral properties is highly speculative in nature, involves substantial expenditures, and is frequently
unproductive.
Exploration is highly speculative in nature and requires substantial expenditure for drilling, sampling and analysis of ore bodies to
quantify the extent of gold reserves. There can be no assurance that our gold exploration programs will result in the discovery of
commercially viable mineralization, or that any mineralization discovered will be of sufficient quantity or quality to be mined profitably. If
we discover a viable deposit, it usually takes several years from the initial phases of exploration until production is possible. During this
time, the economic feasibility of production may change.
DRDGold_Breadcrumbs_Logo_RGB.jpg
DRDGOLD Limited Form 20-F 2026
15
Moreover, we rely on the evaluations of professional geologists, geophysicists, and engineers for estimates in determining whether to
commence or continue mining. These estimates generally rely on scientific and economic assumptions, which in some instances may
not be correct, and could result in the expenditure of substantial amounts of money on a deposit before it can be determined with any
degree of accuracy whether the deposit contains economically recoverable mineralization. In addition, uncertainties as to
metallurgical recovery rates may mean that processing a deposit is not economically warranted on the basis of available technology.
Our business focuses mainly on the extraction of gold from tailings, which is a volume-driven process. Accordingly, our future growth
and profitability will depend, in part, on our ability to identify and acquire additional mineral rights and gold reserves, and on the costs
and results of our continued exploration and development programs. Only deposits of significant size within proximity of services and
infrastructure that contain adequate gold content to justify the significant capital investment associated with plant, reclamation and
deposition infrastructure are suitable for exploitation within our business model. There is a limited supply of these deposits, which may
constrain our exploration and development, especially in a declining gold price environment that may occur in future.
Because of these uncertainties, we may not successfully acquire additional mineral rights or identify new Proven and Probable Mineral
Reserves in sufficient quantities to justify commercial production at any given operations. The costs incurred on exploration activities
that do not identify commercially exploitable reserves of gold are unlikely to be recovered and are therefore likely to be impaired.
There is inherent uncertainty in Mineral Reserves and Mineral Resources estimates.
Our Mineral Reserve and Mineral Resources figures described in this document are the best estimates of our current management as
of the dates stated and are reported in accordance with the requirements of the SEC’s Regulation S-K (Subpart 1300). These
estimates may not reflect actual Mineral Reserves and Mineral Resources or future production.
Estimates of Mineral Reserves and Mineral Resources are based on various estimates including drilling results and because
unforeseen conditions may occur in these historical mine tailings that may not have been identified by the drilling results and other
information, the actual results may vary from the initial estimates. Should we encounter mineralization or formations different from those
predicted by past drilling, sampling and similar examinations, reserve estimates may have to be adjusted and mining plans may have
to be altered in a way that might ultimately cause our reserve estimates to decline. Moreover, if the Rand price of gold declines, or
stabilizes at a price that is lower than our cost of production, or those assumed in our mining plans, or if our labor, specialized services
providers, water, steel, electricity and other production costs increase or recovery rates decrease, it may become uneconomical to
recover Mineral Reserves and Mineral Resources, particularly those containing relatively lower grades of mineralization. See “—A
change in the Dollar price of gold, which in the past has fluctuated widely, is beyond our control,” and “—An increase in production
costs could have an adverse effect on our results of operations.” Under these circumstances, we would be required to re-evaluate our
Mineral Reserves and Mineral Resources. Short-term operating factors relating to the ability to reclaim our Mineral Reserves, at the
required rate, such as an interruption or reduction in the supply of electricity, limited deposition capacity or a shortage of water may
have the effect that we are unable to achieve critical mass, which may render the recovery of Mineral Reserve, or parts of the Mineral
Reserve no longer feasible, which could negatively affect production rate and costs and decrease our profitability during any given
period. These factors have in the past and could in the future result in reductions in our Mineral Reserves and Mineral Resources
estimates and as a result, our production, which could in turn adversely impact the total value of our mining asset base and our
business, operating results and financial condition.
Our gold mining operations are subject to numerous operational risks and hazards that could have an adverse effect on our
business.
The business of gold mining is exposed to numerous risks and events, the occurrence of which may result in the death of or personal
injury to employees, the loss of mining and reclamation equipment, damage to or destruction of mineral properties or production
facilities, monetary losses, delays in production, environmental damage, loss of the license to mine and potential legal claims. The
risks and events associated with the business of gold mining include:
•environmental hazards and pollution, including dust generation, toxic chemicals, discharge of metals, pollutants, radioactive
materials and other hazardous material into the air and water;
•flooding, landslides, sinkhole formation, ground subsidence, ground and surface water pollution and waterway contamination;
•decreased labor productivity due to labor disruptions, work stoppages, slowdowns, strikes or disease;
•unexpected decline of ore grade;
•metallurgical conditions or lower than expected gold recovery;
•failure of unproven or evolving technologies;
•mechanical failure or breakdowns and aging infrastructure;
•energy and electrical power supply interruptions;
•limited availability of, or disruptions to water supply;
•injuries to employees or fatalities arising from occupational accidents and safety incidents, including falls from heights, accidents
involving mobile machinery, electrocution, and other workplace hazards;
•activities of illegal or artisanal miners;
•material and equipment availability;
•legal and regulatory restrictions and changes to such restrictions;
•social or community disputes or interventions;
•accidents caused by the collapse of tailings storage facilities;
•pipeline failures and spillages;
•safety-related stoppages; and
•corruption, fraud and theft including gold bullion theft.
The occurrence of any of these risks or hazards could delay production, increase production costs, reduce earnings or result in
losses, and may result in significant legal claims, which could adversely impact our business, operating results and financial
condition.
DRDGold_Breadcrumbs_Logo_RGB.jpg
DRDGOLD Limited Form 20-F 2026
16
Risks related to doing business in South Africa
Political or economic instability in South Africa may reduce our production and profitability.
We are incorporated in South Africa, where all of our operations are located. Large parts of our operations are situated in urban areas
where most of the communities that live near our facilities face significant poverty and socio-economic challenges. Political and
economic risks relating to South Africa which have escalated in recent years and could have a significant effect on our production and
profitability. Large parts of the South African population are unemployed and do not have access to adequate education, health care,
housing and other services, including water and electricity. Government policies aimed at alleviating and redressing historical
inequalities, including transformation and empowerment policies, may increase our costs and reduce our profitability. Elevated crime
levels expose us to an increased frequency and severity of security issues that may disrupt business operations. These factors may
impede foreign direct investment into South Africa and increase emigration of skilled workers; as a result, we may have difficulties
retaining qualified employees.
The sustained high unemployment rate, rising inequality and elevated crime levels have increased the risk of social unrest, such as
protests and conflict, in our surrounding communities. There is also a growing hostile sentiment toward foreign nationals with anti-
immigrations movements increasing staging demonstrations and protests at major urban hubs which intensified in the third quarter of
the calendar year. Persistent failures of service delivery, political instability, and insufficient progress in addressing unemployment,
particularly among the youth, have deepened community frustration and heightened the potential for violent protests and strikes that
could cause damage to property, harm to employees and disrupt our operations. A prolonged economic downturn could result in an
extended period of high unemployment, further exacerbating anti-mining sentiments in South Africa. Poor service delivery by local
government has caused communities to direct expectations toward the private sector for the provision of essential services and
broader social support and assistance. Poverty and high levels of unemployment have led to demands to participate in, and benefit
from, the economic activities of our business. Failure to adequately respond to those expectations could result in miscommunication,
misaligned expectations and loss of trust that in turn could threaten our social license to operate.
Notwithstanding recent positive developments in South Africa following the formation of the Government of National Unity (“GNU”)
after the 2024 elections, including a sustained reduction in power outages, an improvement in South Africa’s credit outlook, and the
removal of South Africa from the Financial Action Task Force grey list in October 2025, operating within the South African context
remains challenging. Recent sovereign rating updates have affirmed a stable to positive outlook, but indicated that any further upward
revisions will depend on sustained economic growth and fiscal discipline. Ongoing tensions within the GNU coalition contribute to
unpredictable policy and regulatory changes, and sustained challenges relating to corruption, systemic failures, public infrastructure
deterioration and poor service delivery continue to erode public trust and heighten social tensions.
The overall state of South African municipalities has deteriorated significantly with many municipalities, including those of our
operations, unable to provide reliable basic services, maintain financial stability, pay amounts due to Eskom or maintain and develop
critical infrastructure. This has led to increasing water outages, electricity substation failures, and deteriorating roads and other
infrastructure, political disruption and delays in obtaining permits required to do business such as zoning and land use approval,
business licenses, wayleaves and permits. Municipal permits are particularly important for our business given our extensive footprint
and need to integrate our assets through pipeline routes, which are at times subject to municipal approval.
South Africa is expected to hold municipal elections in 2026, which may result in changes to local government leadership, policy
priorities and administrative processes. Election periods may create uncertainty regarding municipal governance, service delivery and
infrastructure planning, particularly in municipalities that are already experiencing operational and financial challenges. Changes in
municipal administrations or priorities, together with potential election-related protests, disputes or disruptions, could delay approvals,
permits, zoning and land-use decisions, and other municipal processes on which we depend. Any deterioration in municipal
governance or service delivery following the elections could adversely affect our operations, increase costs and delay the execution of
strategic projects.
Uncertainty within South Africa's political and economic context may adversely affect business and investor confidence. In addition,
heightened scrutiny of government performance and state accountability, including through ongoing governance and anti-corruption
inquiries and processes, has contributed to policy uncertainty, regulatory shifts, and unpredictable community responses.
These factors, individually and collectively, contribute to sustained uncertainty within the South African political and economic
environment and may negatively impact our ability to operate efficiently or otherwise increase our costs of compliance and execution,
which could adversely impact our business, operating results and financial condition.
High inflation may have a material adverse effect on our business, operating results and financial condition.
The inflation rate in South Africa is relatively high compared to developed, industrialized countries, although many countries around
the world are currently facing inflation challenges. As of June 30, 2026, the annual Consumer Price Inflation Index (“CPI”), stood at
5.0% compared to 3.5% in June 30, 2025 and 5.1% in June 30, 2024. Inflation in South Africa generally results in an increase in our
Rand operational costs. Higher and sustained inflation in the future, with a consequent increase in operational costs could have a
material adverse effect on our results of operations and our financial condition and could result in operations being discontinued or
reduced or rationalized, which could reduce our profitability.
Inflation in the gold mining sector tends to exceed general inflation, primarily due to increases in electricity, reagent, labor costs and
most recently diesel cost. The impact of these cost pressures is reflected in DRDGOLD's cash cost, which increased by 7.8% in fiscal
year 2026 (fiscal year 2025: 4.3% and fiscal year 2024: 13.7%), although this was also influenced by the volume of tonnages
processed, nature of material processed and increased trucking activities at Ergo. Higher and sustained inflation in the future, with a
consequent increase in operational costs could have a material adverse effect on our results of operations and our financial condition
and could result in operations being discontinued or reduced or rationalized, which could reduce our profitability.
DRDGold_Breadcrumbs_Logo_RGB.jpg
DRDGOLD Limited Form 20-F 2026
17
The treatment of occupational health diseases and the potential liabilities related to occupational health diseases may have
an adverse effect on our operating results and financial condition.
We may be subject to claims relating to occupational health diseases and we are currently subject to legal action described below.
In January 2013, DRDGOLD, East Rand Proprietary Mines Limited (“DRDGOLD Respondents”) and 23 other mining companies
(“Other Respondents”) (collectively referred to as “Respondents”) were served with a court application issued in the High Court of
South Africa for a class certification on behalf of former mineworkers and dependents of deceased mineworkers (“Applicants”). In
the application the Applicants allege that the Respondents conducted underground mining operations in a negligent and complicit
manner causing the former mineworkers to contract occupational lung diseases. The Applicants have as yet not quantified the
amounts which they are demanding from the Respondents in damages.
On May 3, 2018, the Applicants and Anglo American South Africa Limited, AngloGold Ashanti Limited, Sibanye Gold Proprietary
Limited a wholly owned subsidiary of Sibanye Stillwater Limited, Harmony Gold Mining Company Limited, Gold Fields Limited, African
Rainbow Minerals Limited and certain of their affiliates (“Settling Companies”) settled the class certification application in which the
Applicants in each sought to certify class actions against gold mining houses cited therein on behalf of mineworkers who had worked
for any of the particular respondents and who suffer from any occupational lung disease, including silicosis or tuberculosis.
The DRDGOLD Respondents, are not a party to the settlement between the Applicants and Settling Companies. The dispute, insofar
as the class certification application and appeal thereof is concerned, still stands and has not terminated in light of the settlement
agreement. For further detail, see "Item 18. Financial Statements - Note 26 – Contingencies”.
An adverse judgment in the claim described above or any other claim could have an adverse impact on our financial condition and
operating results and could result in increased regulatory and stakeholder scrutiny which could lead to increased compliance costs.
We have experienced an increase in theft targeting our facilities, which may expose our employees to harm and our
operations to disruption and financial loss.
Theft across South Africa’s mining sector continues to escalate, driven by socio-economic pressures. See “—Political or economic
instability in South Africa may reduce our production and profitability.” Rising commodity prices, particularly for gold, copper and
steel, have made copper cables, pipelines and gold-bearing material increasingly attractive targets for criminal activity. Criminal
methods have grown increasingly organized and sophisticated, posing an escalating and evolving threat to our operations and
employees.
Our operations have been subject to incidents of theft involving gold-bearing material, copper cables, pipelines and other
infrastructure. These incidents have, from time to time, affected operational activities and resulted in losses of material, damage to
property or additional costs associated with repairs, replacement and security measures. While we have implemented and continue to
enhance security measures to mitigate these risks, there can be no assurance that theft and related incidents will not occur in the
future. Any such incidents could result in operational disruptions, increased costs and reduced production.
In addition to the risk to personal safety, cable theft and theft of bolts used for our pipelines have caused power interruptions that
result in production losses and additional operational costs. Such incidents have in the past resulted, and may continue to result, in
losses of gold or other damage to property or infrastructure, which could have a material adverse effect on our business, operating
results and financial condition. We have implemented enhanced security measures in response to these threats, resulting in increased
security expenditure; however, there can be no assurance that such incidents will not occur in the future, or that security measures
implemented will be effective in preventing theft or mitigating the associated risks to our employees and operations.
Power stoppages or shortages or increases in the cost of power could negatively affect our results and financial condition.
Our mining operations are currently primarily dependent on electrical power supplied by Eskom, South Africa’s state-owned utility
company. Electricity makes up approximately 11% of our operating costs. Eskom has in the past been unable to satisfy the energy
requirements of the South African economy and implemented a system of power rationing or load shedding to prevent a complete
collapse of the national electricity grid. While Eskom’s financial position has shown some improvement in recent periods, significant
operational and financial risks remain. It is owed billions of Rands by local municipalities and has also been subject to damage to its
supply grid through persistent cable theft. Historically, load shedding posed a threat to our ability to maintain the requisite volume
throughput to deliver our business plan, and the steps we were required to take to curtail load, such as intermittently switching off our
mills, also impacted recovery efficiencies. The private sector has responded by accelerating private production of renewable power.
Government measures have been slow to advance the liberalization of power generation on a larger scale. Although load shedding
remained suspended as of June 30, 2026, South Africa is still exposed to load reduction for the foreseeable future if the required
maintenance and renewal of the Eskom power generation fleet does not take place, which will come at a significant cost to end users
of Eskom’s electricity. Eskom and the government have introduced a number of initiatives over recent years aimed at improving
electricity supply reliability and reducing load shedding, including:
•The implementation of the Energy Action Plan by the President of South Africa;
•The launch of Eskom’s Generation Operational Recovery Plan to improve plant performance and electricity availability;
•Changes in the leadership and governance structures of Eskom;
•National Treasury's debt-relief measures to improve Eskom’s financial sustainability;
•Reduced demand for Eskom-supplied electricity as residential, commercial and industrial consumers increasingly adopt alternative
and renewable energy sources;
•The establishment and operationalization of the National Transmission Company South Africa (“NTCSA”) as part of Eskom’s
ongoing unbundling process, with responsibility for the national transmission system and electricity market operations;
•Regulatory reforms and incentives that facilitate greater private sector participation in electricity generation; and
•Tax incentives for companies to develop renewable energy projects and reduce reliance on Eskom-generated electricity.
DRDGold_Breadcrumbs_Logo_RGB.jpg
DRDGOLD Limited Form 20-F 2026
18
In 2019, the President of South Africa announced the vertical unbundling of Eskom to improve efficiency, establish an independent
transmission system operator and facilitate greater competition in electricity generation. While full state ownership of Eskom will be
maintained, the unbundling process is expected to result in the separation of Eskom’s generation, transmission and distribution
functions into distinct entities and may require further legislative and policy reforms. The unbundling process remains ongoing with
significant progress made through the operationalization of NTCSA. In March 2024, the National Energy Regulator of South Africa
(“NERSA”) approved Eskom’s request to transfer responsibility for independent power producer ("IPP") agreements to NTCSA. The
reforms are intended to support increased participation by IPPs, improve competition within the electricity market and enhance long-
term electricity security. However, the transition remains complex and there can be no assurance that the anticipated benefits of the
unbundling process will be realized or that electricity prices will remain stable.
Eskom’s coal-fired power stations experienced significant operational challenges for several years, resulting in national rotational
power cuts (load shedding) being implemented across South Africa. However, following substantial improvements in plant
performance, increased generation availability, reduced unplanned outages and the addition of generation capacity, load shedding
has remained suspended since March 2024. While the stability of electricity supply has improved significantly, there can be no
assurance that load shedding will not resume in the future should operational, infrastructure, fuel supply, maintenance or demand-
related challenges arise. In addition, Eskom continues to seek tariff increases to strengthen its financial position. Any deterioration in
electricity supply reliability or further above-inflation electricity tariff increases could adversely affect our business, operating results
and financial condition.
Eskom reported a pre-tax profit for the year ended March 31, 2025, its first pre-tax profit in eight years, driven by reduced load
shedding, improvements in its Energy Availability Factor, lower diesel consumption and the addition of new generating capacity.
These operational improvements continued through fiscal year 2026 and contributed to a more stable electricity supply environment.
Nevertheless, Eskom remains exposed to significant operational, financial, regulatory and infrastructure-related risks, and there can
be no assurance that recent improvements will be sustained. Any deterioration in Eskom’s financial condition or operating
performance may negatively affect electricity supply reliability, increase electricity tariffs and adversely impact our operations.
NERSA approved Eskom annual tariff increases of 12.74% effective April 1, 2025, significantly above the South African CPI. NERSA
has approved further annual increases of 8.76% from April 1, 2026 and 8.83% from April 1, 2027. Eskom tariff increases may increase
our operating costs and have an adverse effect on profitability.
The security of future power supply and the cost of that supply remains a risk and may have major implications for our operations,
which may result in significant production losses.
Ergo has completed the construction and commissioning of a Solar Power plant and BESS, with the aim of reducing its reliance on
Eskom and lowering its future cost of electricity. Although dependence on Eskom has decreased, it is not eliminated as Eskom power
is still used during off-peak periods to power the operations and charge the BESS. See “—Underperformance of Ergo’s solar and
energy storage infrastructure could increase electricity costs and adversely affect Ergo’s operational performance”.
Ergo is also currently disputing the electricity tariff charged by Ekurhuleni Metropolitan Municipality. Over the past several years, the
municipality has charged Ergo for the electricity it drew from the Ergo Central Substation, prior to commissioning of the Solar plant and
BESS. However, Ergo contends that only Eskom may legitimately charge for the electricity drawn and consumed. Ergo has instituted
legal proceedings by way of an application and since then, the municipality has issued two summonses. Ergo has made payments
under protest and without prejudice or admission of liability. The outcome of Ergo's application remains uncertain and could have a
material adverse effect on our business, operating results and financial condition. For further information, see “Item 18. Financial
Statements—Note 24— Payments Made Under Protest.”
Risks related to ESG performance including climate change
We may not be able to meet increasing environmental, social and corporate governance expectations.
Increased scrutiny and expectations from stakeholders, including governments, non-governmental organizations (“NGOs”),
shareholders, investors, communities and other interested parties, regarding our Environmental, Social, and Governance (“ESG”)
performance and practices, together with growing reporting requirements, may expose us to additional costs and potential penalties
for non-compliance with applicable ESG reporting and regulatory standards.
ESG-related risks to which we are exposed include: physical and transition risks related to climate change; non-compliance with
environmental legislation and applicable industry practices; soil and water contamination; radiation; noise; water availability and
efficient use of water; energy efficiency and decarbonization; pollution and inappropriate waste management; occupational health and
safety risks; compromised employee health and mental health; diversity and inclusion; heightened community expectations and
concerns; complexity of legal and regulatory compliance obligations; supply chain risks; and tailings management risks, among
others. These risks are compounded by new national and international laws and regulations, increased public concern and pressure
from advocacy groups, regulators and investors for companies to address and report on the impact of climate change. The need to
adapt or transition in response to climate change, including complying with new regulations and responding to increased stakeholder
expectations, could result in higher compliance and operating costs and could have further effects on production costs and capacity.
Furthermore, there can be no assurance that measures we implement to adapt to, or transition in response to, climate change will be
sufficient to mitigate the associated risks to our operations. Failure to manage these ESG risks, achieve our ESG performance targets,
or adopt adequate transition measures could reduce investor confidence, harm our reputation, and have a material adverse effect on
our business, operating results and financial condition.
DRDGold_Breadcrumbs_Logo_RGB.jpg
DRDGOLD Limited Form 20-F 2026
19
Climate change may present physical risks to our operations, including extreme weather events and flooding.
As a result of climate change, our operations are exposed to severe weather events that have in the past and could in the future
interrupt production and our supply chain. Loss of human life, and major property, infrastructure or environmental damage, could be
caused by extreme weather events such as droughts, heatwaves, extreme rainfall and strong winds, the frequency, duration and
intensity of which are increasing. Specifically, we have experienced an increase in intensity of climate events, such as thunderstorms
on the Highveld, where our operations are situated. The long-term upward trend in global temperature is associated with an increase
in the magnitude and frequency of severe weather events globally. During fiscal year 2025 and 2026, unprecedented heavy and
persistent rainfall caused delays in the construction of the RTSF. Tonnages were also lower at Ergo due to restricted access to certain
sites which affected the desired blend of reclamation material and ultimately impacted gold production.
Severe thunderstorms and high winds, especially during the summer rainy season, may also cause damage to operational
infrastructure, which could, in turn, interrupt gold production. Strong wind in particular may also increase dust exceedances
(exceedances of applicable dust emission limits) throughout our operations, causing air pollution. Such incidents and other weather
events may damage our facilities and infrastructure or disrupt water management systems, resulting in water shortages which can
impact our operations and cause the interruption of deposition and gold production until such infrastructure is repaired or alternative
deposition capacity is made available.
The occurrence of these risks and events may result in adverse impacts on our workforce, production interruptions, increased
operational costs associated with mitigation measures, power and supply chain disruptions, project delays and higher production
costs. These factors could have a material adverse effect on our business, operating results and financial condition.
Water scarcity, which may be exacerbated by climate change, and could adversely affect our operations.
South Africa is a relatively dry and water-stressed country, and these conditions may deteriorate as a result of climate change. South
Africa faces water shortages, which may lead to rationing or increased water costs across several sectors of the South African
economy. Such changes could adversely impact our surface retreatment operations, which use water to transport slimes or sand from
reclaimed areas to the processing plant and to our tailings facilities. Additionally, in Johannesburg and surrounding areas, water
supply infrastructure is poorly maintained, leading to interruptions in water supply that could further disrupt our operations.
Water is a critical resource in our operations and the Group continues to invest in infrastructure and operational initiatives aimed at
maximizing water reuse and reducing reliance on external water sources. DRDGOLD operates largely within a closed water circuit,
whereby water recovered during processing and deposition activities is recycled and reused throughout the production process. This
approach reduces freshwater demand, supports environmental stewardship and enhances operational resilience in water-
constrained environments. Notwithstanding these initiatives, the availability and quality of water resources remain subject to
regulatory, environmental and infrastructure-related challenges, and any significant disruption to water supply or recycling systems
could adversely affect production, operating costs and results of operations.
Furthermore, our surface retreatment operations rely on third-party service providers for the supply and treatment of water required for
production. FWGR relies on Sibanye-Stillwater to pump and supply underground mine water for its operations. Ergo relies on the
Trans-Caledon Tunnel Authority ("TCTA") for the supply of AMD water. Any interruption in these services could materially disrupt our
operations and affect production. In addition, AMD water requires significant treatment to meet operational standards, resulting in
additional treatment costs.
Any reduction in the volume or quality of water available to our operations may adversely impact production output, which could, in
turn, have a material adverse effect on our business, operating results and financial condition.
Risks related to government regulation
Changes in government policies or the regulatory environment in South Africa may adversely impact our operations and
profitability.
The mining industry in South Africa is extensively regulated through legislation and regulations promulgated by government
departments and regulatory bodies. These regulatory requirements govern areas including health and safety, water usage, the
exploration and mining of minerals, and environmental management. A variety of permits, regulatory approvals and authorizations are
required to mine lawfully, and the Government enforces its regulations through the various government departments. A lack of
communication between government departments and regulatory bodies, together with under-resourced regulators, continues to
present challenges that may increase compliance costs and the time required to obtain permits. The formulation or implementation of
government policies may be discretionary and unpredictable on certain issues, including changes in conditions for the issuance of
licenses relating to labor plans, workplace transformation and Black Economic Empowerment ("BEE") requirements,  laws relating to
mineral rights, ownership of mining assets and the rights to prospect and mine, additional taxes on the mining industry and in extreme
cases, nationalization. Changes in regulatory or government policies could adversely affect our business and may result in increased
project costs and potential delays. Complexity, uncertainty and regulatory changes continue to characterize the South African
regulatory environment, and changes that are adverse to business and growth may result in increased project costs and potential
delays.
On May 20, 2025, the draft MPRD Bill (“MPRD Bill”) was gazetted for public comment. Amongst the many concerning changes that
are proposed, two are of particular concern, namely the proposed re-classification of mine residue stockpiles as minerals, and the
introduction of a requirement of a mining right to reclaim minerals from such stockpiles, as well as changes to the Broad-Based Black
Economic Empowerment (“B-BBBEE”) and transformation regime. The other notable concern with respect to the MPRD Bill relates to
suggested ‘Beneficiation’.
DRDGold_Breadcrumbs_Logo_RGB.jpg
DRDGOLD Limited Form 20-F 2026
20
Requirement of a mining right
DRDGOLD’s operations involve the reclamation and retreatment of privately owned, movable historic mine residue stockpiles —
principally tailings and slimes dams created before the commencement of the MPRDA — rather than the extraction of naturally
occurring in situ mineral deposits.  Currently, and as a general proposition in the mining industry, the processing of historic mine
residue stockpiles does not constitute “mining” for the purposes of the MPRDA. Movable tailings dumps created before May 1, 2004,
when the MPRDA became effective, and which are classified as ‘historic mine residue stockpiles’, are not subject to the MPRDA and
can be processed without a mining right. If the MPRD Bill is enacted in its proposed format and these stockpiles are reclassified as
minerals, it may significantly affect the economics of reclaiming them depending on the conditions imposed by the State for the
issuance of a mining license to process these movable tailings dumps. It may similarly also impact our provision for rehabilitation and
mine closure, inasmuch as the removal of such residue stockpiles form part of an Environmental Management Program.
BEE and transformation regime
Currently, compliance with BEE requirements when applying for a Prospecting Right takes the form of the Minister having a discretion
to require such compliance under section 17(4) of the MPRD Act. The MPRD Bill proposes changes to the BEE and transformation
imperatives to those which currently apply to the Mining Industry. The MPRD Bill amends the definition of “this Act” to include “the
Codes of Good Practice for the South African Minerals Industry and Housing and Living Conditions Standards for the Minerals
Industry”, gazetted on April 29, 2009 (“Codes”), which are currently unenforceable. The MPRD Bill however makes these Codes
enforceable legislation. The current version of the Codes conflict with the transformation imperatives in the remainder of the MPRD Bill
and it is logical to assume that a new version of the Codes will have to be released when the MPRD Bill becomes effective.
Beneficiation
"Beneficiation” is defined as “value addition to a higher value over baselines determined by the Minister” (the Minister of Mineral and
Petroleum Resources). Therefore, the State has control over what comprises beneficiation. The Minister can prescribe “conditions
required to ensure security of supply for local beneficiation”. The MPRD Bill provides that “Every producer of minerals must make
available minerals or mineral products for local beneficiation”. In summary, the Minister can determine what comprises “beneficiation”,
can make regulations with respect to promotion of “beneficiation” and mining companies will be compelled to ensure supply of
minerals for “beneficiation” in South Africa.
We have submitted representations to the office of the Department of Mineral and Petroleum Resources (“DMPR”) (previously the
Department of Mineral Resources and Energy (the “DMRE”) expressing our concerns regarding these proposed amendments. The
Minerals Council of South Africa, which advocates on behalf of mining companies such as DRDGOLD, has also submitted its own
representations to the office of the DMPR. However, there can be no assurance that such advocacy efforts will be successful. In
addition, although we may challenge any attempts by the State to expropriate or otherwise restrict our ownership or use of movable
tailings dumps, there can be no assurance that such challenges would be effective. If the MPRD Bill, or similar amendments, is
promulgated into law, it could result in increased regulatory requirements, additional costs and taxes, restrictions on our ability to
process tailings or other mineral resources, or potential risks relating to the ownership and use of movable tailings dumps. Any such
developments could adversely affect our operations, results and financial condition.
Furthermore, certain regulators are significantly understaffed and under-resourced and not always able to process administrative
filings in accordance with prescribed timelines, which could result in delays to our project planning and execution. In 2023 and 2024,
this risk materialized when the commissioning of several new reclamation sites was delayed due to backlogs in the Department of
Water and Sanitation's processing of Water Use License applications, leading to shortfalls in planned production. Delays in securing
the required regulatory approvals for reclamation sites 4L39 and 5L23 during FY2026 also have resulted in the need for additional
material trucking, which, combined with rising fuel prices, had significant impact on operating costs.
Both Ergo and FWGR currently have license and other permit applications pending relating to the commissioning of reclamation sites
and TSFs. If these are not processed in time, the projects may experience delays in commissioning, which could result in lower than
targeted production.
Mining royalties and other tax reform could have an adverse effect on our business, operating results and financial condition.
The Mineral and Petroleum Resources Royalty Act, No.28 of 2008 and the Mineral and Petroleum Resources Royalty Act
(Administration), No.29 of 2008 govern royalty rates for gold mining in South Africa. These acts provide for the payment of a royalty,
calculated through a royalty rate formula (using rates of between 0.5% and 5.0%) applied against gross revenue per year, payable
half yearly with a third and final payment thereafter. The royalty is tax deductible and the cost after tax amounts to a rate of between
0.35% and 3.65% at the prevailing marginal tax rates applicable to the taxed entity. The royalty is payable on old unconverted mining
rights and new converted mining rights. Based on a legal opinion DRDGOLD obtained, mine dumps created before the enactment of
the MPRDA fall outside the ambit of this royalty, and consequently we do not pay any royalty on any dumps created prior to the
MPRDA. If the changes proposed in the Draft Bill are enacted, this dispensation could change and revenue-based royalties could be
levied on minerals produced from historic residue stockpiles. This as well as any other adverse future tax reforms could have an
adverse effect on our business, operating results and financial condition.
Failure to comply with the requirements of the Broad-Based Socio-Economic Empowerment Charter 2018 could have an
adverse effect on our business, operating results and financial condition.
On September 27, 2018, the Broad-Based Socio-Economic Empowerment Charter for the Mining and Minerals Industry, 2018
(“Mining Charter 2018”) was published in Government Gazette No. 41934 of Government Notice No. 639 on September 27, 2018.
Mining Charter 2018 requires, inter alia, an enduring 30% BEE interest in respect of new mining rights. It also has extensive provisions
in respect of Historically Disadvantaged Persons (“HDP”) representation at Board and management, as well as provisions relating to
local procurement of goods and services. The procurement target of the total spend on services from South African companies has
been pegged at 80% (up from 70% in Mining Charter III) and 60% of the aggregate spend thereof must be apportioned to BEE
entrepreneurs.
In March 2019, the Mineral Council of South Africa brought an application in the High Court, Pretoria for a judicial review and setting
aside of certain provisions in Mining Charter 2018.
DRDGold_Breadcrumbs_Logo_RGB.jpg
DRDGOLD Limited Form 20-F 2026
21
On September 21, 2021, the High Court of South Africa ruled that the Mining Charter 2018 is not binding subordinate legislation but an
instrument of policy. This ruling affirmed that the Minister of Mineral Resources and Energy (“MRE Minister”) was not entitled to make
law through the Mining Charter 2018 to require 30% HDP ownership for the renewal of existing mining rights. The MRE Minister
confirmed that they will not appeal the ruling.
DRDGOLD cannot guarantee that it will meet all the targets set out by the Mining Charter 2018. For example, if the Mining Charter
2018 were to remain in its current form, there is no assurance that the goods, services and supplies in South Africa would be sufficient
to allow us to meet the targets.  More specifically, DRDGOLD may not be able to meet the requirement that 80% of total mining goods
and services procurement spend be on South African-manufactured goods due to an insufficient number of suppliers in South Africa
with heavy equipment. DRDGOLD may be required to increase participation by HDP in senior positions and allocate additional
resources for the development of the mine community, human resources, sustainability, procurement and enterprise. DRDGOLD may
also be required to make further adjustment to the ownership structure of its South African mining assets, including increasing the
ownership of HDP, in order to meet the Mining Charter 2018 requirements. Any such additional measures could have a material
adverse effect on our business, operating results and/or financial condition.
In addition, if we are unable to obtain sufficient representation of HDP at the Board level and in management positions or if there are
not sufficient succession plans in place, this could have a material adverse effect on our business (including resulting in the imposition
of fines and having a negative effect on production levels), operating results and financial position. In relation to this, the mining
industry, including DRDGOLD, continues to experience a global shortage of qualified senior management and technically skilled
employees. We may be unable to hire or retain appropriate senior management, technically skilled employees or other management
personnel, or may have to pay higher levels of remuneration than we currently intend in order to do so. See “—If we are unable to
attract and retain key personnel, our business could be adversely affected.”
Also, there is no guarantee that any steps DRDGOLD has already taken or might take in the future will ensure the retention of its
existing mining rights, the successful renewal of its existing mining rights, the granting of applications for new mining rights or that the
terms of renewals of its mining rights would not be significantly less favorable than the terms of its current mining rights in terms of the
current legal dispensation, or any changes that are made to it. Any further adjustment to the ownership structure of DRDGOLD’s South
African mining assets in order to meet the above mentioned requirements could have a material adverse effect on the value of
DRDGOLD’s securities. For further detail, see "Item 4B. Business Overview – Governmental regulations and their effect on our
business – The Broad Based Socio-Economic Empowerment Charter."
Government policies in South Africa may adversely impact our operations and profits related to financial provisioning for
rehabilitation.
Revised Financial Provisioning Regulations (“FPR”) were published on November 20, 2015, under the National Environmental
Management Act, 107 of 1998 (“NEMA”) and became effective from the date of publication thereof. Proposed amendments to the
FPRs were published for public comment GNR 1228 GG 41236 of November 10, 2017 (“Draft Regulations”), which seek to address
some challenges relating to the implementation thereof. Under these FRPs to be implemented by the DMPR, existing environmental
rehabilitation trust funds may only be used for post closure activities and may no longer be utilized for their intended purpose of
concurrent and final rehabilitation and closure.
Several further proposed amendments to the FPRs, (“Proposed Amendments”) were subsequently published. On February 1, 2024,
the Minister of Forestry, Fisheries and the Environment again amended the transitional period contained in regulation 17B of the FPRs,
2015. The transitional arrangements in regulation 17B of the FPRs allows the holder of a right or permit granted or issued, as the case
may be, in accordance with the MPRDA, who applied for such right or permit before November 20, 2015, to continue making financial
provision in accordance with regulations 53 and 54 of the regulations published under the MPRDA. Stated differently, a person who
applied for a right or permit prior to November 20, 2015, is not yet required to comply with the FPRs. In the previous amendments to
regulation 17B of the FPRs, the Minister always specified a date by when the transitional period would expire and when all holders
would be required to comply with the FPR. However, the Minister has amended regulation 17B to provide that the transitional period
will continue to apply until the Minister publishes a date by when all holders are required to comply with the FPRs.
The Proposed Amendments, in their current form and which are still subject to the approval of the DMPR and Treasury, allow under
certain circumstances for the withdrawal against financial provision (which is currently not contemplated in the FPR). It is therefore
uncertain whether these provisions relating to withdrawal will remain in their current form, or at all. For further detail, see “Item 4.B.
Business Overview—Governmental regulations and their effect on our business—Financial Provision for Rehabilitation.”
South Africa’s carbon tax regime and ongoing increases in the applicable carbon tax rate could have a direct or indirect
material adverse effect on our business, operating results and financial condition.
The Carbon Tax Act (No 15 of 2019) has been in effect in South Africa since June 1, 2019. The Act is based on the polluter-pays
principle and is being implemented in phases. The initial plan scheduled the first phase to run from June 1, 2019 to December 31,
2022; however, this period was extended to December 31, 2025. The first phase does not have a material financial impact on the
Group; however, the carbon tax rate has increased by 58% since 2019. For the 2026 tax period, the carbon tax rate will increase from
R236/tCO2e to R308/tCO2e.
The maximum allowances that companies in the gold mining and refining industry can claim are 85%, which includes the 60% basic
tax-free allowance, 10% for the trade exposure allowance, 5% for the voluntary carbon budget allowance, and 10% for the carbon
offset allowance. During this first phase, the Group has been eligible to claim 60% for the basic tax-free allowance and 10% for the
trade exposure allowance, bringing the total claimed tax-free allowances to 70%.
Phase 2 of the carbon tax began January 2026, with key changes made to the carbon tax regime. For instance, the voluntary carbon
budget allowance of 5% fell away, and mandatory carbon budgets, once the regulations are finalized, will be allocated to companies
that exceed 30,000tCO2e per annum for listed activities. The carbon tax rate for emissions exceeding the carbon budget has been set
at R640/tCO2e. However, this change will not affect the Group, since the Group does not currently emit emissions above the
30,000tCO2e threshold for mandatory carbon budgets.
DRDGold_Breadcrumbs_Logo_RGB.jpg
DRDGOLD Limited Form 20-F 2026
22
Another key change for Phase 2 is the increase of the carbon offset allowance from 5% to 10% for most fugitive and process
emissions, and an increase to 15% for fuel combustion emissions.  As it stands, Phase 2 continues to focus on scope 1 emissions,
with the National Treasury continuing its commitment to electricity price neutrality until December 31, 2030, to shield consumers from
higher electricity costs. However, it remains unclear whether scope 2 emissions will be included in the future, beyond 2030.
While Phase 2 carbon tax changes are not expected to significantly affect the Group, ongoing increases in the carbon tax rate could
materially impact our business and financial results, particularly if supplier costs rise due to their own carbon tax obligations.
Ring-fencing of unredeemed capital expenditure for South African mining tax purposes could have an adverse effect on the
business, operating results and financial condition.
The Income Tax Act No 58 of 1962, or the ITA, contains certain ring-fencing provisions in section 36 specifically relating to different
mines regarding the deduction of certain capital expenditure and the carry over to subsequent years. After the restructuring of the
surface operations, effective July 1, 2012, Ergo is treated as one taxpaying operation pursuant to the relevant ring-fencing legislation.
FWGR is also treated as one taxpaying operation pursuant to the relevant ring-fencing legislation. In the event that we are
unsuccessful in confirming our position or should the South African Revenue Service have a different interpretation of section 36 of the
ITA, it could have an adverse effect on our business, operating results and financial condition.
Assessment of unredeemed capital expenditure by the South African Revenue Service could have an adverse effect on the
business, operating results and financial condition.
The South African Revenue Service (“SARS”) assesses capital expenditure when it is redeemed against taxable mining income
rather than when it is incurred. A different interpretation by SARS could have an adverse effect on our business, operating results and
financial condition.
Regulatory uncertainty regarding the tax treatment of Ergo's capital expenditure on the battery energy storage system could
have an adverse effect on the taxation liability of Ergo.
In the 2023 budget review, the National Treasury announced a tax incentive to accelerate private investment in renewable energy to
alleviate load shedding. The allowance is available for assets used in the generation of power. The Ergo BESS system has been
designed to store excess energy from the solar PV plant as opposed to actual power generation. However, regulatory uncertainty
exists regarding whether storage assets constitute “generation” assets for purposes of these incentives. There is no formal judicial or
administrative guidance confirming that BESS qualify for the accelerated tax incentive. While SARS has issued some rulings
concerning BESS that indicate a potentially favorable direction, these rulings do not directly address the same factual circumstances
as Ergo BESS. SARS has advised that their policy is to regard any assets forming part of an “integrated system” to generate power
from renewable sources as power generation assets. Ergo’s BESS is fully integrated into the solar PV plant as it is charged by the
solar PV plant and discharges this stored power to the Ergo operation. Consistent with external tax advice received, Ergo has treated
the PV assets and the integrated BESS as qualifying electricity‑generation assets for purposes of the available allowances. However,
there remains a risk that SARS could challenge this position and issue an adverse determination, which could result in the
disallowance of claimed tax benefits and potential penalties and interest charges and therefore have an adverse effect on the taxation
liability of Ergo.
Labor disputes and changes in South African labor legislation could adversely affect our operations, operating results and
financial condition.
Labor costs are significant for Ergo, constituting 16% of Ergo’s production costs for fiscal year 2026 (2025: 17%). As of June 30, 2026,
our Ergo operations provided full-time employment for 635 employees while our main service providers deployed an additional 2,230
employees to our operations, of whom approximately 87% are members of trade unions or employee associations.
Labor costs are significant for FWGR, constituting 17% of FWGR’s production costs for fiscal year 2026 (2025: 18%). As of June 30,
2026, our FWGR operations provided full-time employment for 189 employees while our main service providers deployed an
additional 877 employees to our operations, of whom approximately 83% are members of trade unions or employee associations.
We have entered into various agreements regulating wages and working conditions at our operations. A four-year wage agreement
was reached with organized labor at FWGR in November 2024, and a five-year wage agreement was reached with organized labor at
Ergo in February 2026.  Unreasonable wage demands could increase production costs to levels where our operations are no longer
profitable. This could lead to earlier than planned closure of operations and labor disruptions. We are also susceptible to strikes by
workers from time to time, which may result in disruptions to our operations. See “—Labor unrest at or adjacent to our operations, or
involving third-party service providers, could disrupt our operations and adversely affect our business.”
In recent years, labor laws in South Africa have changed in ways that significantly affect our operations. In particular, laws that provide
for mandatory compensation in the event of termination of employment for operational reasons. In addition, laws imposing large
monetary penalties for non-compliance with the administrative and reporting requirements of employment equity and affirmative action
policies may result in further material costs. Future South African legislation and regulations relating to labor may further increase our
costs or alter the terms and conditions of employment of our workforce. Labor cost increases could have an adverse effect on our
business, operating results and financial condition.
Labor unrest at or adjacent to our operations, or involving third-party service providers, could disrupt our operations and
adversely affect our business.
Strike action at our operations could disrupt production, affect the execution of operational and growth projects, and increase costs.
For example, during wage negotiations at Ergo in late 2025, the National Union of Mineworkers ("NUM") and the Association of
Mineworkers and Construction Union ("AMCU") issued notice of intended protected strike action relating to unresolved wage and
profit-sharing negotiations. Although the planned strike action was subsequently suspended and operations continued uninterrupted,
the matter illustrates the potential for labor disputes to arise during collective bargaining processes. Any future labor unrest or
industrial action at our operations could result in operational disruptions, reduced productivity, project delays and increased costs,
which may adversely affect our business, operating results and financial condition.
DRDGold_Breadcrumbs_Logo_RGB.jpg
DRDGOLD Limited Form 20-F 2026
23
We may also be adversely affected by labor disputes or other significant disruptions involving third-party service providers, which
could impact the operation of our facilities. For example, we use a third party service provider for the management of our reclamation
sites as well as on our Brakpan TSF and Driefontein 4 TSF. Any labor unrest or other significant issue at this third-party service
provider may impact the operation of these facilities. Furthermore, there has been an increase in employees and third-party service
providers at FWGR as a result of the Phase 2 expansion project, which is currently fully underway. Any labor unrest or other significant
issue involving employees or third-party service providers may delay or disrupt execution of the project in a timely manner and within
budget, which could adversely affect our business, operating results and financial condition.
Our financial flexibility could be materially constrained by South African currency restrictions.
South African law provides for exchange control regulations, which, among other things, restrict the export of capital from South
Africa, the Republic of Namibia, and the Kingdoms of Lesotho and Eswatini, known collectively as the Common Monetary Area
(the “CMA”). The Financial Surveillance Department of the South African Reserve Bank ("SARB"), is responsible for the
administration of exchange control regulations. In particular, South African resident companies (from an exchange control
perspective, being companies incorporated or formed in South Africa or alternatively being listed on a South African exchange):
•are generally not permitted to export capital from South Africa or to hold foreign currency without the approval of the SARB or in
certain cases approval by a recognized Authorised Dealer (being certain commercial banks in South Africa to whom authority has
been granted under the Currency and Exchanges Manual for Authorised Dealer);
•are generally required to repatriate, to South Africa, profits of foreign operations; and
•are limited in their ability to utilize profits of one foreign business to finance operations of a different foreign business, unless in
exceptional circumstances prior approval from the SARB or where relevant the Authorised Dealer is obtained.
While the South African Government has relaxed exchange controls in recent years, South African companies remain subject to
restrictions on their ability to deploy capital outside of the CMA and it is difficult to predict whether such relaxation of controls will
continue in the future. Exchange control requirements however are dependent on the specific transaction and are not unique to
DRDGOLD, as they apply to all South African residents of the CMA.  As a result, DRDGOLD’s ability to raise and deploy capital
outside the CMA is restricted. These restrictions could hinder DRDGOLD’s financial and strategic flexibility, particularly its ability to
fund acquisitions, capital expenditures and exploration projects outside South Africa. For further information see "Item 10D. Exchange
Controls".
We could be adversely affected by violations of the U.S. Foreign Corrupt Practices Act and similar anti-bribery laws outside of
the United States.
The U.S. Foreign Corrupt Practices Act ("FCPA"), and similar anti-bribery laws in other jurisdictions generally prohibit companies and
their intermediaries from making improper payments to government officials or other persons for the purpose of obtaining or retaining
business. This includes aggressive investigations and enforcement proceedings by both the U.S. Department of Justice and the SEC,
increased enforcement activity by non- U.S. regulators, and increases in criminal and civil proceedings brought against companies
and individuals. Our policies mandate compliance with the FCPA and other applicable anti-bribery laws. Our internal control policies
and procedures may not protect us from reckless or criminal acts committed by our employees, the employees of any of our
businesses, or third party intermediaries. In the event that we believe or have reason to believe that our employees or agents have or
may have violated applicable anti-corruption laws, including the FCPA, we would investigate or have outside counsel investigate the
relevant facts and circumstances, which can be expensive and require significant time and attention from senior management.
Violations of these laws may result in criminal or civil sanctions, inability to do business with existing or future business partners (either
as a result of express prohibitions or to avoid the appearance of impropriety), injunctions against future conduct, profit disgorgements,
disqualifications from directly or indirectly engaging in certain types of businesses, the loss of business permits, reputational harm or
other restrictions which could disrupt our business and have a material adverse effect on our business, financial condition, operating
results or liquidity.
We face risks with respect to compliance with the FCPA and similar anti-bribery laws through our acquisition of new companies and
the due diligence we perform in connection with an acquisition may not be sufficient to enable us fully to assess an acquired
company’s historic compliance with applicable regulations. Furthermore, as we make acquisitions our post-acquisition integration
efforts may not be adequate to ensure our system of internal controls and procedures are fully adopted and adhered to by acquired
entities, resulting in increased risks of non-compliance with applicable anti-bribery laws.
Risks related to ownership of our ordinary shares or ADSs
It may not be possible for you to effect service of legal process, enforce judgments of courts outside of South Africa or bring
actions based on securities laws of jurisdictions other than South Africa against us or against members of our Board.
Our Company, certain members of our Board of directors and executive officers are residents of South Africa. All our assets are
located outside the United States and a major portion with respect to the assets of members of our Board of directors and executive
officers are either wholly or substantially located outside the United States. As a result, it may not be possible for you to effect service
of legal process, within the United States or elsewhere including in South Africa, upon most of our directors or officers, including
matters arising under United States federal securities laws or applicable United States state securities laws.
Moreover, it may not be possible for you to enforce against us or the members of our Board of directors and executive officers’
judgments obtained in courts outside South Africa, including the United States, based on the civil liability provisions of the securities
laws of those countries, including those of the United States. A foreign judgment is not directly enforceable in South Africa, but
constitutes a cause of action which will be enforced by South African courts provided that:
•the court which pronounced the judgment had jurisdiction to entertain the case according to the principles recognized by South
African law with reference to the jurisdiction of foreign courts;
•the judgment is final and conclusive (that is, it cannot be altered by the court which pronounced it);
•the judgment has not lapsed;
•the recognition and enforcement of the judgment by South African courts would not be contrary to public policy, including
observance of the rules of natural justice which require that no award is enforceable unless the defendant was duly served with
documents initiating proceedings, that he was given a fair opportunity to be heard and that he enjoyed the right to be legally
represented in a free and fair trial before an impartial tribunal;
DRDGold_Breadcrumbs_Logo_RGB.jpg
DRDGOLD Limited Form 20-F 2026
24
•the judgment was not obtained by fraudulent means;
•the judgment does not involve the enforcement of a penal or revenue law; and
•the enforcement of the judgment is not otherwise precluded by the provisions of the Protection of Business Act, 1978 (as amended),
of South Africa.
It is the policy of South African courts to award compensation for the loss or damage sustained by the person to whom the
compensation is awarded. Although the award of punitive damages is generally unknown to the South African legal system that does
not mean that such awards are necessarily contrary to public policy. Whether a judgment was contrary to public policy depends on
the facts of each case. Exorbitant, unconscionable, or excessive awards will generally be contrary to public policy. South African
courts cannot enter into the merits of a foreign judgment and cannot act as a court of appeal or review over the foreign court. South
African courts will usually implement their own procedural laws and, where an action based on an international contract is brought
before a South African court, the capacity of the parties to the contract will usually be determined in accordance with South African
law.
It is doubtful whether an original action based on United States federal securities laws may be brought before South African courts. A
plaintiff who is not resident in South Africa may be required to provide security for costs in the event of proceedings being initiated in
South Africa. Furthermore, the Rules of the High Court of South Africa require that documents executed outside South Africa must be
authenticated for use in South African courts. It may not be possible therefore for an investor to seek to impose liability on us in a South
African court arising from a violation of United States federal securities laws.
Dividend withholding tax will reduce the amount of dividends received by beneficial owners.
The current dividend withholding tax rate is 20% effective from February 22, 2017. The withholding tax reduces the amount of
dividends or other distributions received by our shareholders. Any further increases in such tax will further reduce net dividends
received by our shareholders.
Your rights as a shareholder are governed by South African law, which differs in material respects from the rights of
shareholders under the laws of other jurisdictions.
Our Company is a public limited liability company incorporated under the laws of the Republic of South Africa. The rights of holders of
our ordinary shares, and therefore many of the rights of our ADS holders, are governed by our memorandum of incorporation and by
South African law. These rights differ in material respects from the rights of shareholders in companies incorporated elsewhere, such
as in the United States. In particular, South African law significantly limits the circumstances under which shareholders of South
African companies may institute litigation on behalf of a company. 
Control by principal shareholders could adversely affect our other shareholders.
Sibanye-Stillwater beneficially owns 50.1% of our outstanding ordinary shares and voting power and has the ability to control, our
Board of directors. Sibanye-Stillwater will continue to have control over our affairs for the foreseeable future, including with respect to
the election of directors, the consummation of significant corporate transactions, such as a merger or other sale of our company or our
assets, and all matters requiring shareholder approval. In certain circumstances, Sibanye-Stillwater’s interests as a principal
shareholder may conflict with the interests of our other shareholders and Sibanye-Stillwater’s ability to exercise control, or exert
significant influence, over us may have the effect of causing, delaying, or preventing changes or transactions that our other
shareholders may or may not deem to be in their best interests. In addition, any sale or expectation of sale of some or all the shares
held by Sibanye-Stillwater could have an adverse impact on our share price.
Sales of large volumes of our ordinary shares or ADSs or the perception that these sales may occur, could adversely affect
the prevailing market price of such securities.
The market price of our ordinary shares or ADSs could fall if substantial amounts of ordinary shares or ADSs are sold by our
stockholders, or there is the perception in the marketplace that such sales could occur. Current holders of our ordinary shares or
ADSs may decide to sell them at any time. Sales of our ordinary shares or ADSs, if substantial, or the perception that any such
substantial sales may occur, could exert downward pressure on the prevailing market prices for our ordinary shares or ADSs, causing
their market prices to decline. Trading activity of hedge funds and the ability to borrow script in the marketplace will increase trading
volumes and may place our share price under pressure.
DRDGold_Breadcrumbs_Logo_RGB.jpg
DRDGOLD Limited Form 20-F 2026
25
ITEM 4. INFORMATION ON THE COMPANY
4A. HISTORY AND DEVELOPMENT OF THE COMPANY
Introduction
DRDGOLD, is a South African domiciled company that holds assets engaged in surface gold tailings retreatment in South Africa,
including exploration, extraction, processing and smelting.
We are a public limited liability company, incorporated in South Africa on February 16, 1895, as Durban Roodepoort Deep, Limited.
On December 3, 2004, the company changed its name from Durban Roodepoort Deep Limited, to DRDGOLD Limited.
Our operations focus on South Africa's Witwatersrand Basin, which has been a gold producing region for over 135 years.
Our shares and/or related instruments trade on the Johannesburg Stock Exchange (“JSE”), the New York Stock Exchange and the
A2X.
Our registered office and business address is Constantia Office Park, Cnr 14th Avenue and Hendrik Potgieter Road, Cycad House,
Building 17, Ground Floor, Weltevreden Park, 1709, South Africa. The postal address is P.O. Box 390, Maraisburg, 1700, South Africa.
Our telephone number is (+27 11) 470-2600 and our facsimile number is (+27 86) 524-3061. We are registered under the South
African Companies Act 71, 2008 under registration number 1895/000926/06. For our ADSs, JP Morgan Chase Bank, at 383 Madison
Avenue, Floor 11, New York , NY 10179, United States, has been appointed as agent.
The SEC maintains an internet site that contains reports, proxy and information statements and other information regarding issuers that
file electronically with the SEC, which can be found at http://www.sec.gov. Our internet address is http://www.drdgold.com. The
information contained on our website is not incorporated by reference and does not form part of this annual report.
All of our operations are conducted in South Africa. Our operations primarily consist of Ergo and FWGR.
Please refer "Item 5A. Operating Results - Capital expenditure" for an understanding on capital expenditure incurred by the Group.
Ergo
Ergo was formed in June 2007. Ergo is the surface tailings retreatment operation which consists of what was historically the Crown
Gold Recoveries Proprietary Limited (“Crown”), East Rand Proprietary Mines Proprietary Limited's ("ERPM") Cason Dump and the
Ergo Gold business unit. On July 1, 2012, Ergo acquired the mining assets and certain liabilities of Crown and all the surface assets
and liabilities of ERPM as part of the restructuring of our surface operations.
Capital expenditure for the Ergo projects is mainly financed through operational cash flows while financing for significant growth
projects may be obtained through specific financing arrangements, if required. Due to the maturing Brakpan TSF, two projects
commenced to increase deposition capacity and reduce deposition load from Brakpan TSF.
Resuming deposition on the Daggafontein TSF
The Daggafontein TSF was removed from our Mineral Resources and Mineral Reserves statement in FY2025 to facilitate its
recommissioning as a deposition facility. Following the completion of the required engineering works, water was first introduced to the
facility on June 25, 2026, with the first tailings deposition commencing on July 6, 2026. The TSF has a deposition capacity of 120Mt
and a life of 20 years, at a deposition rate of 750,000tpm for the first three years, thereafter at 500,000tpm. The availability of
Daggafontein is expected to alleviate deposition pressures on the Brakpan TSF, thereby extending the useful life of existing deposition
infrastructure while supporting continued operational throughput. The recommissioning of Daggafontein also forms an important
component of the Group's broader tailings management strategy as it progresses the regulatory approvals and development of future
deposition facilities, including the proposed recommissioning of the Withok TSF.
Recommissioning of the Withok TSF
The recommissioning of the Withok TSF is the engineering design that ultimately brings the tailings storage facility to its finality in terms
of extent, operation, rehabilitation and management. The implemented final design would result in alignments with the principles that
underscore the outcomes pursued under the Global Industry Standard on Tailings Management (“GISTM”) and regulatory bodies,
increase deposition capacity, improve operation/management and bring about the sustainable closure of the facility.
The Withok TSF public participation process was completed in FY2025 and the project is in the authorization phase. Timelines were
revised for the TSF following test drilling on the proposed site that revealed geological features requiring measures in addition to the
now-standard liner, to prevent seepage and pollution of underground water. These designs are complex and are closely scrutinized
by DWS before approving the design and issuing the requisite licenses and approvals. It also adds approximately six months to
construction. We have therefore moved the target date for completion of Withok TSF to the end of 2029, assuming all approvals are
obtained by December 2026.
The TSF will have a deposition capacity of 310Mt and a life of 20 years at an eventual deposition rate of 1.3Mtpm. The increase in
deposition capacity for Ergo enables the processing of the Crown Complex (three tailings dams to the southeast of Johannesburg's
CBD). The Crown complex has been classified from an Indicated Mineral Resource to a Probable Mineral Reserve in FY2025. Ergo's
estimated life-of-mine at FY2026 was 21 years (FY2025: 22 years).
Sale of Stellar
Following a strategic review in FY2025, the Board decided to sell Ergo's stake in Stellar, a renewable energy company with a solar
plant development project, to focus on the Group's core mining activities. The sale was completed in FY2026. For further information,
see "Item 18. Financial Statements – Note 22 – Asset Held For Sale."
For further information on other capital investments, divestitures, capital expenditure and capital commitments, see "Item 4D. Property,
Plant and Equipment", and "Item 5B. Liquidity and Capital Resources".
DRDGold_Breadcrumbs_Logo_RGB.jpg
DRDGOLD Limited Form 20-F 2026
26
FWGR
On July 31, 2018, we acquired certain gold surface processing assets and tailing storage facilities that included Driefontein 3 and 5,
Kloof 1, Venterspost North and South, Libanon, Driefontein 4, Driefontein 2 plant, Driefontein 3 plant, WRTRP pilot plant, and the land
owned by Sibanye-Stillwater that was earmarked for the future development of a central processing plant, regional tailings storage
facility and return water dam (together, the “WRTRP Assets”) associated with Sibanye-Stillwater’s West Rand Tailings Retreatment
Project (“WRTRP”), subsequently renamed FWGR. This acquisition represented a significant increase in our assets. In connection
with the acquisition, we issued to Sibanye-Stillwater new shares equal to 38.05% of outstanding shares and granted Sibanye-Stillwater
an option to acquire up to a total of 50.1% of our shares within a period of 2 years from the effective date of the acquisition at a 10%
discount to the prevailing market value. On January 8, 2020, Sibanye-Stillwater exercised the option and on January 22, 2020
subscribed for 168,158,944 DRDGOLD shares at an aggregate subscription price of R1,086 million (R6.46 per DRDGOLD share).
The assets acquired were to be developed in two phases – Phase 1 and Phase 2.
FWGR Phase 1
Phase 1 involved the reclamation of the Driefontein 5 TSF through a reconfigured Driefontein 2 plant and deposition onto the
Driefontein 4 tailings storage facility. The Driefontein 4 TSF was an upstream day-wall dam with a capacity of approximately 200,000
tonnes per month. In order to increase the deposition capacity to 500 000 tonnes per month, the conversion of this dam to cyclone
deposition commenced in fiscal year 2019.
FWGR Phase 2 expansion
The Phase 2 project is a key project for FWGR intended to mine current reserves and to extend potential resources in the West Rand.
RTSF construction
The RTSF is designed to be capable of receiving 2.4 million tonnes per month with a maximum designed capacity of approximately
800 million tonnes. An amended design of the RTSF was submitted to the Department of Water and Sanitation during fiscal year 2023.
The amended design included the build of a synthetic barrier system in place for ground water protection and a combined center line/
downstream dam wall in the early stages of the facility.
The breaking of ground at this complex, on June 5, 2024, followed the appointment of a leading contractor to construct the RTSF and
the receipt of the requisite permits. Construction of the RTSF is progressing well, notwithstanding some delays caused by rainy
weather. RTSF construction was around 67% complete as at the end of fiscal year 2026, and on track to attain 1.2 million tonnes per
month depositioning rate capacity by the first quarter of fiscal year 2028. An important project milestone toward this, is permission by
the DWS for beneficial occupation which is contingent upon completion of phase 1, out of two phases of the construction of the RTSF.
Beneficial occupation means FWGR can start commissioning the RTSF while construction of phase 2 continues. 
DP2 expansion
The expansion of DP2 (which involves the construction of the plant's own elution circuit, smelt house and doubling current throughput
capacity), involves doubling plant capacity to 1.2 million tonnes per month. The project commenced during the first quarter of  fiscal
year 2025. The elution circuit and smelt house were commissioned on July 14, 2026, with the remainder of the plant expected to be
completed in the first quarter of fiscal year 2027. During fiscal year 2026, the construction of an up-flow reactor was approved and is
currently being constructed at FWGR, after very promising test work. The up-flow reactor is expected to increase gold recoveries.
The pipeline infrastructure project (including Libanon pipeline)
This project is 135km of slurry and return water lines between DP2, the RTSF and the Libanon TSF. The pipeline project is
approximately 95% complete at June 30, 2026.
The construction of a reclamation pump station at Libanon TSF, to add 600,000 tonnes per month to FWGR’s throughput, in addition
to the current 600,000 tonnes per month capacity from Driefontein 3 TSF, is set to provide the Driefontein 2 plant the planned 1.2
million tonnes per month. Permitting for construction of the Libanon pump station was received in July 2026 and construction is
planned to be completed during the last quarter of fiscal year 2027.
The Group's Mineral Reserves have been updated in fiscal year 2026, following the transfer of Kloof 2 TSF to FWGR in December
2025, pursuant to the exchange agreement concluded between DRDGOLD and Sibanye Gold. The TSF has added 67 million tonnes
to the Group’s Mineral Reserves and extended FWGR’s estimated life-of-mine by four years to 20 years (FY2025: 16 years).
Significant capital is required for the Phase 2 expansion which is expected to be financed through a combination of cash resources,
operational cash flows and a five-year Bank facility as may be determined. (Refer to "Item 18. Financial Statements – Note 19 – Capital
management"). Capital expenditure for other projects is mainly financed through operational cash flows and cash resources.
For further information on other capital investments, divestitures, capital expenditure and capital commitments, see "Item 4D. Property,
Plant and Equipment", and "Item 5B. Liquidity and Capital Resources".
DRDGold_Breadcrumbs_Logo_RGB.jpg
DRDGOLD Limited Form 20-F 2026
27
4B. BUSINESS OVERVIEW
We are a South African company that holds assets engaged in surface gold tailings retreatment including exploration, extraction,
processing and smelting. Our surface tailings retreatment operations are located in South Africa. Our operating footprint is unique in
that it involves some of the largest concentration of gold tailings deposits in the world, situated within the city boundaries of
Johannesburg and its suburbs and the Far West Rand of the province of Gauteng.
Gold is recovered from these deposits using specialised technologies and processes that have been refined through more than two
decades of surface retreatment. Our operating model incorporates concurrent rehabilitation, whereby tailings are removed and
processed while affected areas are progressively rehabilitated throughout the life of the operation. Process water is recycled through
a closed-circuit system and returned to reclamation sites, reducing water consumption and supporting sustainable operations. Our
processing facilities are primarily powered by electricity supplied by Eskom, supplemented by energy generated from our solar plant
and BESS.
As a tailings deposit is reclaimed and cleared, the land beneath it becomes available for rehabilitation. We re-contour,
re-vegetate and re-establish the ground. Over time, what was a tailings deposit becomes rehabilitated land available for
redevelopment.
DRDGOLD has arranged its operations into two wholly owned entities covering our East Rand (east of Johannesburg) and far West
Rand (far west of Johannesburg) businesses. The East Rand operations are run by Ergo and the West Rand operations by FWGR. A
detailed overview of the operations is provided under "Item 4D. Property, Plant and Equipment" and in the Technical Report Summary
attached as exhibits in this annual report.
During the fiscal years presented in this Annual Report, all of our operations took place in one geographic region, namely South Africa.
For a breakdown of revenue by operation, please see "Item 18. Financial Statements – Note 23 – Operating segments."
Description of Our Mining Business
Surface tailings retreatment
Surface tailings retreatment involves the extraction of gold from historical tailings dams and sand dumps, comprising the waste
material from earlier underground gold mining activities. This is done by reprocessing historical tailings dams and sand dumps. Sand
dumps are the result of the less efficient stamp-milling process employed in earlier times. They consist of coarse-grained particles
which generally contain higher quantities of gold. Sand dumps are reclaimed mechanically using front end loaders that load sand
onto conveyor belts. The sand is fed onto a screen where water is added to wash the sand into a sump, from where it is pumped to
the treatment plant. Most sand dumps have already been retreated using more efficient milling methods. Lower grade slimes dams
were the product of the “tube and ball mill” recovery process. The economic viability of processing this material has improved due to
improved treatment methods such as the treatment of large volumes of this material. The material from the historical tailings dams is
broken down using monitor guns that spray jets of high pressure water at the target area. The resulting slurry is then pumped to a
treatment plant for processing. The processed material is then deposited onto distinct tailings storage facilities.
Exploration
Exploration activities are focused on the extension of existing ore reserves and identification of new ore reserves both at existing sites
and at undeveloped sites. Once a potential site has been identified, exploration is extended and intensified in order to enable clearer
definition of the site and the portions with the potential to be mined. Geological techniques are constantly refined to improve the
economic viability of exploration and exploitation.
Our Metallurgical Plants and Processes
A detailed review of the metallurgical plants and processes is provided under "Item 4D. Property, Plant and Equipment".
Gold Market
The gold market is relatively liquid compared to other commodity markets, and the price of gold is quoted in US Dollars. Physical
demand for gold is primarily for manufacturing purposes, and gold is traded on a world-wide basis. Refined gold has a variety of
uses, including jewelry, electronics, dentistry, decorations, medals and official coins. In addition, central banks, financial institutions
and private individuals buy, sell and hold gold bullion as an investment and as a store of value.
The use of gold as a store of value and the large quantities of gold held for this purpose in relation to annual mine production have
meant that historically the potential total supply of gold has been far greater than demand. Thus, while current supply and demand
play some part in determining the price of gold, this does not occur to the same extent as in the case of other commodities. Instead,
the gold price has from time to time been significantly affected by macro-economic factors such as expectations of inflation, interest
rates, exchange rates, changes in reserve policy by central banks and global or regional political and economic crises. In times of
inflation and currency devaluation or economic uncertainty gold is often seen as a safe haven, leading to increased purchases of gold
and support for its price.
The average gold price for fiscal year 2026 reached record highs due to policies instituted by the US government, including the
imposition of significant tariffs on various countries including South Africa, changes in foreign policy and global economic uncertainty.
Furthermore, the conflict in Ukraine and conflict between Israel and Gaza have contributed to prolonged geopolitical instability,
leading investors to seek gold as a safe haven asset. In addition, we were impacted by movements in the exchange rate of the Rand
against the Dollar as described below.
We generally take full exposure to the US Dollar spot price of gold and Rand/Dollar exchange rate. The higher the gold price, the
higher our profit margin and vice versa, subject to exchange rate fluctuations.
DRDGold_Breadcrumbs_Logo_RGB.jpg
DRDGOLD Limited Form 20-F 2026
28
The average gold spot price increased by 50% from $2,818 per ounce to $4,238 per ounce during fiscal year 2026 after having
increased by 36% from $2,078 per ounce to $2,818 per ounce during the fiscal year 2025 and having increased by 13% from $1,831
per ounce to $2,078 per ounce during the fiscal year 2024. As a result, the average gold price received by us in Rands for fiscal year
2026 increased by 40% to R2,289,250 per kg compared to the previous year at R1,632,275 per kg and for fiscal year 2025 increased
by 31% to R1,632,275 per kg compared to the previous year at R1,248,679 per kg. The increase in the gold price received
contributed to a 42% increase in our total revenue for fiscal year 2026 amounting to R11,159.0 million (2025: R7,878.2 million and
2024: R6,240 million). All our revenue is generated from our operations in South Africa.
Looking ahead we believe that the global economic environment, escalating geopolitical tensions, the evolving changes in local and
foreign policy in the US and the major uncertainties on the future of global trade, a relatively weaker US Dollar, interest rate policies
(particularly in the US), escalating sovereign and personal levels of debt, economic volatility and the oversupply of foreign currency,
will continue to make gold attractive to investors. The supply of gold in South Africa has shrunk in recent years and is likely to shrink
even more due to the significantly reduced capital expenditure and development occurring in the sector.
Gold-bearing material produced by our operations is smelted into doré bars, which are delivered to Rand Refinery Proprietary Limited
("Rand Refinery") for assaying and refining. The doré bars typically contain gold, silver and small quantities of other metals and are
refined by Rand Refinery to bullion-grade purity. Rand Refinery charges refining and administration fees for these services. The
refined gold is then sold directly to South African bullion banks at agreed gold prices and exchange rates. Revenue is recognized
when control of the refined gold is transferred to the customer. We own 11.3% (fiscal year 2025 and 2024: 11.3%) of Rand Refinery. 
Governmental regulations and their effects on our business
Common Law Mineral Rights and Statutory Mining Rights
Prior to the introduction of the Minerals and Petroleum Resources Development Act 28 of 2002 ("MPRDA"), ownership in mineral rights
in South Africa could be acquired through the common law or by statute. With effect from May 1, 2004, all minerals have been placed
under the custodianship of the South African government under the provisions of the MPRDA and old order proprietary rights were
required to be converted to new order rights of use within certain prescribed periods, as dealt with in more detail below. Historical
tailings dams created before the MPRDA became lawful outside of the MPRDA and do not require a mining license to be processed
nor do they require the extensive rehabilitation and closure guarantees that are a feature of the MPRDA. Many of the activities to re-
process a historical tailings dam do fall under the provisions of the National Environmental Management Act 107 of 1998 ("NEMA"),
which requires at its most basic the compilation and submission of an Environmental Impact Assessment.
Conversion and renewal of Rights under the Mineral and Petroleum Resources Development Act 28 of 2002
Existing old order rights were required to be converted into new order rights in order to ensure exclusive access to the mineral for
which rights existed at the time of the enactment of the MPRDA. In respect of used old order mining rights, the Department of Mineral
and Petroleum Resources (“DMPR”), previously the Department of Mineral Resources and Energy ("DMRE"), is obliged to convert
the rights if the applicant complies with certain statutory criteria. These include the submission of a mining works program,
demonstrable technical and financial capability to give effect to the program, provision for environmental management and
rehabilitation, and compliance with certain black economic empowerment criteria and an adequate social and labor plan. These
applications had to be submitted within five years after the promulgation of the MPRDA on May 1, 2004. Similar procedures apply
where we hold prospecting rights and a prospecting permit and conduct prospecting operations. Under the MPRDA mining rights are
not perpetual. Upon being granted by the Minister of Mineral Resources and Energy, through the ambit of the DMPR, they remain
valid for a fixed period, namely a maximum period of thirty years, after which they may be renewed for a further period of thirty years.
Prospecting rights are limited to a maximum period of five years, with one further period of renewal of three years. Applications for
conversion of our old order rights were submitted to the DMPR within the requisite time periods. As at June 30, 2026, all of our Ergo
operation’s old order mining rights have been converted into new order rights in terms of the MPRDA and applications to renew the
converted new order mining rights have been lodged timeously.
The Broad-Based Socio-Economic Empowerment Charter
In order to promote broad based participation in mining revenue, the MPRDA provides for a Mining Charter to be developed by the
Minister of the DMPR within six months of commencement of the MPRDA beginning May 1, 2004 and was subsequently amended in
September 2010. It is used as an instrument to achieve mutually symbiotic sustainable growth, broad based and meaningful
transformation of the mining and mineral industry. 
The Mining Charter sets certain goals on equity participation (amount of equity participation and time frames) by historically
disadvantaged South Africans of South African mining assets. It recommends that these are achieved by, among other methods,
disposal of assets by mining companies to historically disadvantaged persons on a willing seller, willing buyer basis at fair market
value. The goals set by the Mining Charter require each mining company to achieve 15 percent ownership by historically
disadvantaged South Africans of its South African mining assets within five years and 26 percent ownership by May 1, 2014. It also
sets out guidelines and goals in respect of employment equity at management level with a view to achieving 40 percent participation
by historically disadvantaged persons in management and ten percent participation by women in the mining industry, each within five
years from May 1, 2004. Compliance with these objectives is measured on the weighted average “scorecard” approach in
accordance with a scorecard which was first published around August 2010. In April 2018, judgment was handed down by the
Gauteng Division of the High Court in Pretoria against a provision in the 2010 Mining Charter regarding the “once empowered always
empowered” principle.” This principle refers to whether a mining company, after the exit of a Black partner that held a stake in the
company consequent to a result of a Broad-based Black Economic Empowerment ("BEE") transaction, continues to be BEE
compliant.  The judgment was appealed by the DMPR. The DMPR in August 2020, withdrew their notice to appeal to the Supreme
Court of Appeal in respect of the judgment issued in April 2018 by the Gauteng Division of the High Court in Pretoria High Court.
The Mining Charter and the related scorecard are not legally binding and, instead, simply state public policy. However, the DMPR
places significant emphasis on the compliance therewith. The Mining Charter and scorecard have a decisive effect on administrative
action taken under the MPRDA.
DRDGold_Breadcrumbs_Logo_RGB.jpg
DRDGOLD Limited Form 20-F 2026
29
In recognition of the Mining Charter’s objectives of transforming the mining industry by increasing the number of black people in the
industry to reflect the country’s population demographics, to empower and enable them to meaningfully participate in and sustain the
growth of the economy, thereby advancing equal opportunity and equitable income distribution, we have achieved our commitment to
ownership compliance with the MPRDA through our historic black economic empowerment structures which have subsequently
unwound.
The mining industry in South Africa is extensively regulated through legislation and regulations issued by government’s administrative
bodies. These involve directives and mandatory codes of procedures with respect to health and safety, mining and exploration of
minerals, and managing the impact of mining operations on the environment. A change in regulatory or government policies could
adversely affect our business.
On June 15, 2017, the Reviewed Broad-Based Black Economic Empowerment Charter for the South African Mining and Minerals
Industry, 2017 (“2017 Mining Charter”) was published in the Government Gazette No. 40923 of Government Notice No. 581. The
publication of the 2017 Mining Charter was met with widespread criticism and on June 26, 2017 the Minerals Council of South Africa
(previously Chamber of Mines of South Africa), applied to the Gauteng Local Division of the High Court of South Africa, Johannesburg
for an urgent interdict to prevent the charter from implementation.
Key provisions included:
•50% Black ownership for new prospecting rights;
•30% Black ownership for mining rights (up to 11% offset for local beneficiation)
•For new mining rights to be issued, the provision for 1% of Earnings Before Interest, Taxes, Depreciation and Amortisation
(“EBITDA”) is paid to communities and employees as a trickle dividend from the sixth year of a mining right until dividends are
declared or at any point in a 12-month period where dividends are not declared
On February 2016, The President of South Africa announced that a new mining charter would be developed and will follow a process
which includes all stakeholders. The Minerals Council of South Africa subsequently postponed its court application in respect of the
2017 Mining Charter.
On September 27, 2018 the Broad-Based Socio-Economic Empowerment Charter for the Mining and Minerals Industry, 2018
(“Mining Charter 2018”) was published in Government Gazette No. 41934 of Government Notice No. 639 on September 27, 2018
superseding and replacing all previous charters, including Mining Charter III.
Mining Charter 2018 requires an enduring 30% BEE interest in respect of new mining rights. It also has extensive provisions in respect
of Historically Disadvantaged Persons ("HDP") representation at Board and management, as well provisions relating to local
procurement of goods and services. The procurement target of the total spend on services from South African companies has been
set at 80% (up from 70% in Mining Charter III) and 60% of the aggregate spend thereof must be apportioned to BEE entrepreneurs.
Key provisions of Mining Charter 2018 are:
•the conditional acceptance of the continued consequences of previous compliance of the BEE ownership threshold of 26% in
respect of existing mining rights;
•of the 30% HDP ownership component, qualifying employees and communities are each to hold a 5% carried interest (as opposed
to a free carry interest as per Mining Charter III) the cost of which may be recovered by the mining right holder from the
development of the asset. the community interest in turn may be offset by way of an equity equivalent;
•removal of the so-called 1% of EBITDA trickle dividend provided for in the 2017 Mining Charter;
•the removal of provisions requiring community and employee representation at Board level;
•that the continuing consequences of HDP ownership are not recognized for transfers of mining rights; and
•that a top up of HDP ownership back to 30% is required for the renewal of existing rights. 
Subsequently, several notable developments have occurred:
In March 2019, the Mineral Council of South Africa brought an application in the Gauteng Division of the High Court for judicial review
and setting aside of certain provisions in Mining Charter 2018.
In June 2020, the same court ordered the Minerals Council of South Africa to join parties representing communities, trade unions and
BEE entrepreneurs as a prerequisite to the continuation of the lawsuit, as they have a direct and substantial interest in the outcome of
the litigation.
On September 21, 2021, the Gauteng Division of the High Court ruled that Mining Charter 2018 is not binding subordinate legislation
but an instrument of policy. This ruling affirmed that the Minister of the DMPR was not entitled to make law through the Mining Charter
2018 to require 30% HDP ownership for the renewal of existing mining rights.
On November 23, 2021, the Minister of the DMPR confirmed that the DMPR Ministry will not appeal the ruling made by the Gauteng
Division of the High Court of South Africa.
The recently proposed Draft Mineral Resources Development Bill, 2025 (“MPRD Bill”) has contributed to increased regulatory
uncertainty for mining companies in South Africa, including DRDGOLD’s. The potential impact of the MPRD Bill on our business is
significant due to the following provisions:
•The proposed requirement to apply for a mining right to process movable ‘historical tailings’ pursuant to the draft MPRD Bill; and
•The intended amendments to the MPRDA that would allow the relevant Minister to set beneficiation targets for the mining industry
and exercise greater control over the beneficiation of minerals in South Africa.
DRDGOLD has submitted representations to the office of the Minister of the DMPR expressing its concerns regarding these proposed
amendments. The Minerals Council of South Africa, which advocates on behalf of mining companies such as DRDGOLD, has
submitted its own representations to the office of the Minister of the DMPR.
DRDGold_Breadcrumbs_Logo_RGB.jpg
DRDGOLD Limited Form 20-F 2026
30
Mining royalties and other tax reform
The Mineral and Petroleum Resources Royalty Act, No.28 of 2008 and the Mineral and Petroleum Resources Royalty Act
(Administration), No.29 of 2008 govern royalty rates for gold mining in South Africa. These acts provide for the payment of a royalty,
calculated through a royalty rate formula (using rates of between 0.5% and 5.0%) applied against gross revenue per year, payable
half yearly with a third and final payment thereafter. The royalty is tax deductible and the cost after tax amounts to a rate of between
0.35% and 3.65% at the prevailing marginal tax rates applicable to the taxed entity. The royalty is payable on old unconverted mining
rights and new converted mining rights. Based on a legal opinion the Company obtained, mine dumps created before the enactment
of the MPRDA fall outside the ambit of this royalty, and consequently the Company does not pay any royalty on any dumps created
prior to the MPRDA. Proposed amendments contained in the MPRD Bill may affect the regulatory treatment of historical residue
deposits and tailings facilities. In addition, the introduction of further revenue-based royalties or any adverse future tax reforms could
have an adverse effect on our business, operating results and financial condition.
Mine Health and Safety Regulation
The South African Mine Health and Safety Act 29 of 1996 (as amended), or the Mine Health and Safety Act (“MHSA”), came into
effect in January 1997. The principal objective of the MHSA is to improve health and safety at South African mines by inter alia,
providing for effective monitoring of health and safety conditions and the enforcement of health and safety measures at our mines. To
this end, the MHSA imposes various duties on us at our mines and grants the authorities broad powers to, among other things, close
unsafe mines and order corrective action relating to health and safety matters. In the event of any future accidents at any of our mines,
regulatory authorities could take steps which could increase our costs and/or reduce our production capacity. The Act was amended
in 2009 and the amendments to the Act dealt with inter alia the stoppage of production and increased punitive measures including
increased financial fines and legal liability of mine management. Some of the more important provisions in the 2009 amendment bill
are the insertion of section 50(7A) that places an obligation on an inspector to impose a prohibition on the further functioning of a site
where a person’s death, serious injury, illness to a person or a health threatening occurrence has occurred; a new section 86A(1)
creating a new offense for any person who contravenes or fails to comply with the provisions of the MHSA thereby causing a person’s
death, serious injury or illness to a person. Subsection (3) further provides that (a) the “fact that the person issued instructions
prohibiting the performance or an omission is not in itself sufficient proof that all reasonable steps were taken to prevent the
performance or omission”; and that (b) “the defense of ignorance or mistake by any person accused cannot be permitted”; or that (c)
“the defense that the death of a person, injury, illness or endangerment was caused by the performance or an omission of any
individual within the employ of the employer may not be admitted”; section 86A(2) creating an offense of vicarious liability for the
employer where a Chief Executive Officer, manager, agent or employee of the employer committed an offense and the employer
either connived at or permitted the performance or an omission by the Chief Executive Officer, manager, agent or employee
concerned; or did not take all reasonable steps to prevent the performance or an omission. The maximum fines were also increased.
Any owner convicted in terms of section 86 or 86A may be sentenced to “withdrawal or suspension of the permit” or to a fine of R3
million or a period of imprisonment not exceeding five years or to both such fine and imprisonment, while the maximum fines for other
offenses and for administrative fines have all been increased, with the highest being R1 million. In October 2024, the Minister of
Mineral and Petroleum Resources published an explanatory summary of the proposed Mine Health and Safety Amendment Bill, 2024.
The proposed amendments are intended to strengthen health and safety governance, managerial accountability, training
requirements and enforcement powers under the MHSA. As at the date of this annual report, the proposed amendments have not
been enacted and it remains uncertain whether they will be adopted in their current form or when they may become effective. If
enacted, the amendments may increase our compliance obligations and regulatory exposure.
Under the South African Compensation for Occupational Injuries and Diseases Act, 1993 (as amended), or COID Act, employers are
required to contribute to a fund specifically created for the purpose of compensating employees or their dependents for disability or
death arising in the course of their work. Employees who are incapacitated in the course of their work have no claim for compensation
directly from the employer and must claim compensation from the COID Act fund. Employees are entitled to compensation without
having to prove that the injury or disease was caused by negligence on the part of the employer, although if negligence is involved,
increased compensation may be payable by this fund. The COID Act relieves employers of the prospect of costly damages but does
not relieve employers from liability for negligent acts caused to third parties outside their scope of employment.
Under the Occupational Diseases in Mines and Works Act, 1973 (as amended), or the Occupational Diseases Act, the multi-employer
fund pays compensation to employees of mines performing “risk work,” usually in circumstances where the employee is exposed to
dust, gases, vapors, chemical substances or other working conditions which are potentially harmful, or if the employee contracts a
“compensable disease,” which includes pneumoconiosis, tuberculosis, or a permanent obstruction of the airways. No employee is
entitled to benefits under the Occupational Diseases Act for any disease for which compensation has been received or is still to be
received under the COID Act. These payment requirements are based on a combination of the employee costs and claims made
during the fiscal year.
Uranium and radon are often encountered during the ordinary course of gold mining operations in South Africa, and present potential
risks for radiation exposure of workers at those operations and the public to radiation in the nearby vicinity. We monitor our uranium
and radon emissions for compliance with all local laws and regulations pertaining to uranium and radon management and under the
current legislative exposure limits prescribed for workers and the public, under the Nuclear Energy Act,1999 (as amended) and
Regulations from the National Nuclear Regulator.
Environmental Regulation
Managing the impact of mining on the environment is extensively regulated by statute in South Africa. Compliance obligations arise
under a range of environmental legislation, including the NEMA, the Air Quality Act, 2004, the National Water Act, 1998, the National
Nuclear Regulator Act, 1999 and other applicable environmental legislation and regulations. Liability for environmental damage may,
in certain circumstances, extend beyond the company to directors, officer and other responsible persons who are found to have
contravened applicable laws.
DRDGold_Breadcrumbs_Logo_RGB.jpg
DRDGOLD Limited Form 20-F 2026
31
The environmental impacts of mining operations are also regulated through the MPRDA, which contains provisions relating to
environmental management, rehabilitation and mine closure, including potential personal liability for directors and responsible persons
in respect of environmental non-compliance.
Mining companies are required to obtain and maintain environmental authorizations and approved environmental management
programs in accordance with NEMA and the MPRDA, and must demonstrate both the technical and financial ability to undertake
ongoing environmental management, rehabilitation, closure and the management of latent or residual environmental impacts
associated with their operations. Environmental authorizations and related environmental management commitments form part of the
regulatory framework applicable to mining rights and are subject to ongoing monitoring and compliance requirements.
The MPRDA and related environmental legislation impose ongoing environmental monitoring, reporting, rehabilitation and financial
assurance obligations on holders of mining rights. Various financial mechanisms may be utilized to provide for environmental
rehabilitation and closure obligations in accordance with applicable legislation and regulatory requirements.
We maintain environmental authorizations and environmental management programs approved by the relevant authorities and
continue to monitor and manage environmental risks through ongoing compliance programs, rehabilitation activities and
environmental management systems. Key environmental matters are prioritized through active management oversight, with progress
monitored against defined objectives, action plans and implementation schedules.
Our existing reporting and controls framework is designed to support compliance with the environmental monitoring, reporting,
assessment and rehabilitation obligations imposed by the MPRDA, NEMA and related regulations.
In addition, the National Nuclear Regulator Amendment Act 26 of 2024, which came into effect during FY2025, introduced enhanced
requirements relating to financial provision for the rehabilitation and decommissioning of regulated facilities. These requirements may
affect entities managing radioactive materials or residues associated with mining activities, including those containing uranium or
other naturally occurring radioactive material. We continue to monitor developments in the applicable regulatory framework and
maintains programs to monitor uranium and radon exposures, assess rehabilitation and closure obligations, and evaluate the
adequacy of financial provision and other compliance measures required under applicable nuclear and environmental legislation.
Financial Provision for Rehabilitation
We are required to make financial provision for the cost of mine closure, rehabilitation, remediation of environmental impacts and post-
closing monitoring associated with our operations. Financial provision may be maintained through various approved financial
mechanisms, including rehabilitation trusts and financial guarantees, in accordance with applicable environmental legislation.
The Group currently provides financial provision primarily through financial guarantees issued to the DMPR and underwritten through
approved insurance products from Guardrisk Insurance Company Limited (“GICL”).  All required regulatory approvals relating to the
Group's financial provisioning arrangements have been obtained and the associated legal, tax and regulatory implications have been
considered as part of the implementation of these arrangements.
As of June 30, 2026, we held a total of R841.5 million (2025: R765.0 million) in funds. Guarantees amounting to R943.1 million (2025:
R941.3 million) were issued to the DMPR. The provision for environmental rehabilitation for the Group amounted to R721.4 million at
June 30, 2026, compared to R558.7 million at June 30, 2025.
The FRPs were promulgated under the NEMA by the Department of Forestry, Fisheries and the Environment (“DFFE”). Under the
FPRs, existing environmental rehabilitation trust funds, of which DRDGOLD has Rnil, may generally be utilized only for post-closure
obligations and may no longer be used to fund concurrent and final closure activities. As a result, mining companies may be required
to utilize alternative financial provisioning mechanisms to satisfy rehabilitation and closure obligations.
On February 1, 2024, the Minister of Forestry, Fisheries and the Environment amended the transitional arrangements contained in
regulation 17B of the FPRs. The transitional arrangements allow the holders of rights or permits applied for before November 20, 2015,
to continue making financial provision in accordance with regulations previously published under the MPRDA. Unlike previous
amendments, no fixed expiry date for the transitional period was prescribed and the transitional arrangements will continue to apply
until the Minister determines a future date for compliance with the FPRs.
Several proposed amendments to the FPRs have also been published and remain under consideration. The proposed amendments
include requirements relating to the determination, annual review and reassessment of financial provision by independent specialists,
together with additional assurance requirements. The final form, implementation date and practical application of any revised financial
provisioning regime remain uncertain and may affect the manner in which financial provision for rehabilitation, mine closure and post-
closure obligations is determined, maintained and administered.
DRDGold_Breadcrumbs_Logo_RGB.jpg
DRDGOLD Limited Form 20-F 2026
32
4C. ORGANIZATIONAL STRUCTURE
The following chart shows our principal subsidiaries as of June 30, 2026. All of our subsidiaries which are duly registered private
companies with independent legal personality, incorporated in South Africa. Our voting interest in each of our subsidiaries are equal to
our ownership interests. We hold the majority of our subsidiaries directly or indirectly as indicated below. Refer to "Exhibit 8.1" for a list
of our significant subsidiaries.
As at June 30, 2026:
Shareholding_infographic.jpg
Public ownership
49.76%
Sibanye Gold1
50.10%
Non-public
ownership2
0.14%
ERGO
100%
FWGR
100%
1DRDGOLD is 50.1% held by Sibanye Gold Proprietary Limited, which in turn is a wholly owned subsidiary of Sibanye Stillwater Limited (“Sibanye-
Stillwater”). During August 2025, Sibanye-Stillwater purchased additional shares in the market due to the new share issuances made by the
Company to settle its employee share plan, as described in Item 6E. Sibanye-Stillwater's shareholding as at June 30, 2026 was 50.10%.
2Relates to shareholding by directors and prescribed officers of the Company of 0.14%. Such shareholding is classified as non-public.
Ergo was previously owned by Ergo Mining Operations (Proprietary) Limited ("EMO"). EMO was 74% owned by DRDGOLD Limited
and 26% by our broad-based black economic empowerment ("BBBEE") partners – Khumo Gold SPV Proprietary Limited ("Khumo")
and the DRDSA Empowerment Trust. In FY2015, an agreement with our BBBEE partners entailing a roll-up of shareholding included
the substitution of their 26% shareholding in EMO for 8.1% and 2.4% shareholding in DRDGOLD Limited respectively. At June 30,
2026, Khumo and the DRDSA Empowerment Trust held nil shares in DRDGOLD. In terms of the “once empowered, always
empowered” principle, the transaction is deemed to still provide compliance with the ownership element of the Mining Charter.
DRDGold_Breadcrumbs_Logo_RGB.jpg
DRDGOLD Limited Form 20-F 2026
33
4D. PROPERTY, PLANT AND EQUIPMENT
The following information is detailed for material properties of the Group:
•Summary of operations
•Properties and location
•Geology
•Mining method
•Mineral Processing and Recovery Methods
•Infrastructure
•Exploration
•Water usage and reduction in use of potable water
•Water pollution
•Environmental and Closure Aspects
•Environmental rehabilitation closure providing and funding
•Legal aspects and permitting
•Production
•Mineral Reserves and Mineral Resources Estimation
•Capital Expenditure
Summary of operations
DRDGOLD owns 100% of the issued share-capital in both Ergo and FWGR. Both are managed surface tailings retreatment operations
producing gold. Ergo operates across central and east Johannesburg, within the Gauteng Province and FWGR in Carletonville on the
far West Rand of the Gauteng Province. In order to improve synergies, effect cost savings and establish a simpler group structure,
DRDGOLD restructured the Group’s surface operations (Crown, ERPM’s Cason Dump surface operation and ErgoGold) into Ergo with
effect from July 1, 2012. On July 31, 2018, DRDGOLD acquired WRTRP Assets, which are surface gold processing assets and tailing
storage facilities associated with Sibanye-Stillwater’s WRTRP, and subsequently renamed it FWGR.
The following table sets out aggregate production for Ergo and FWGR for the last two fiscal years:
Total aggregate gold production
2026
2025
Gold produced (ounces)
155,577
155,288
At June 30, 2026, Ergo employed 635 full-time employees. In addition, specialist service providers deployed a further
2,230 employees to our operations bringing the total number of in-house and outsourced employees to 2,865 at June 30, 2026 (at
June 30, 2025: 2 638).
At June 30, 2026, FWGR employed 189 full-time employees. In addition, specialist service providers deployed a further
877 employees to our operations bringing the total number of in-house and outsourced employees to 1,066 at June 30, 2026 (at
June 30, 2025: 740). The increase in FWGR specialist service providers is as a result of the capital projects in progress, namely RTSF
and DP2 plant expansion.
DRDGOLD has numerous surface, mining and prospecting rights and has strong security in title to its reserves and resources, vested
in various subsidiaries. Our operations have been issued all the rights and authorizations for those sites that are currently being mined
and they are in good standing with the regulators. All required operating permits and licenses have been obtained and are in good
standing with the regulators. More detailed information on the various properties' mineral title can be found under the “Legal aspects
and permitting” here below.
DRDGold_Breadcrumbs_Logo_RGB.jpg
DRDGOLD Limited Form 20-F 2026
34
Properties and location
Below is a geographical representation of the location on Ergo and FWGR within South Africa:
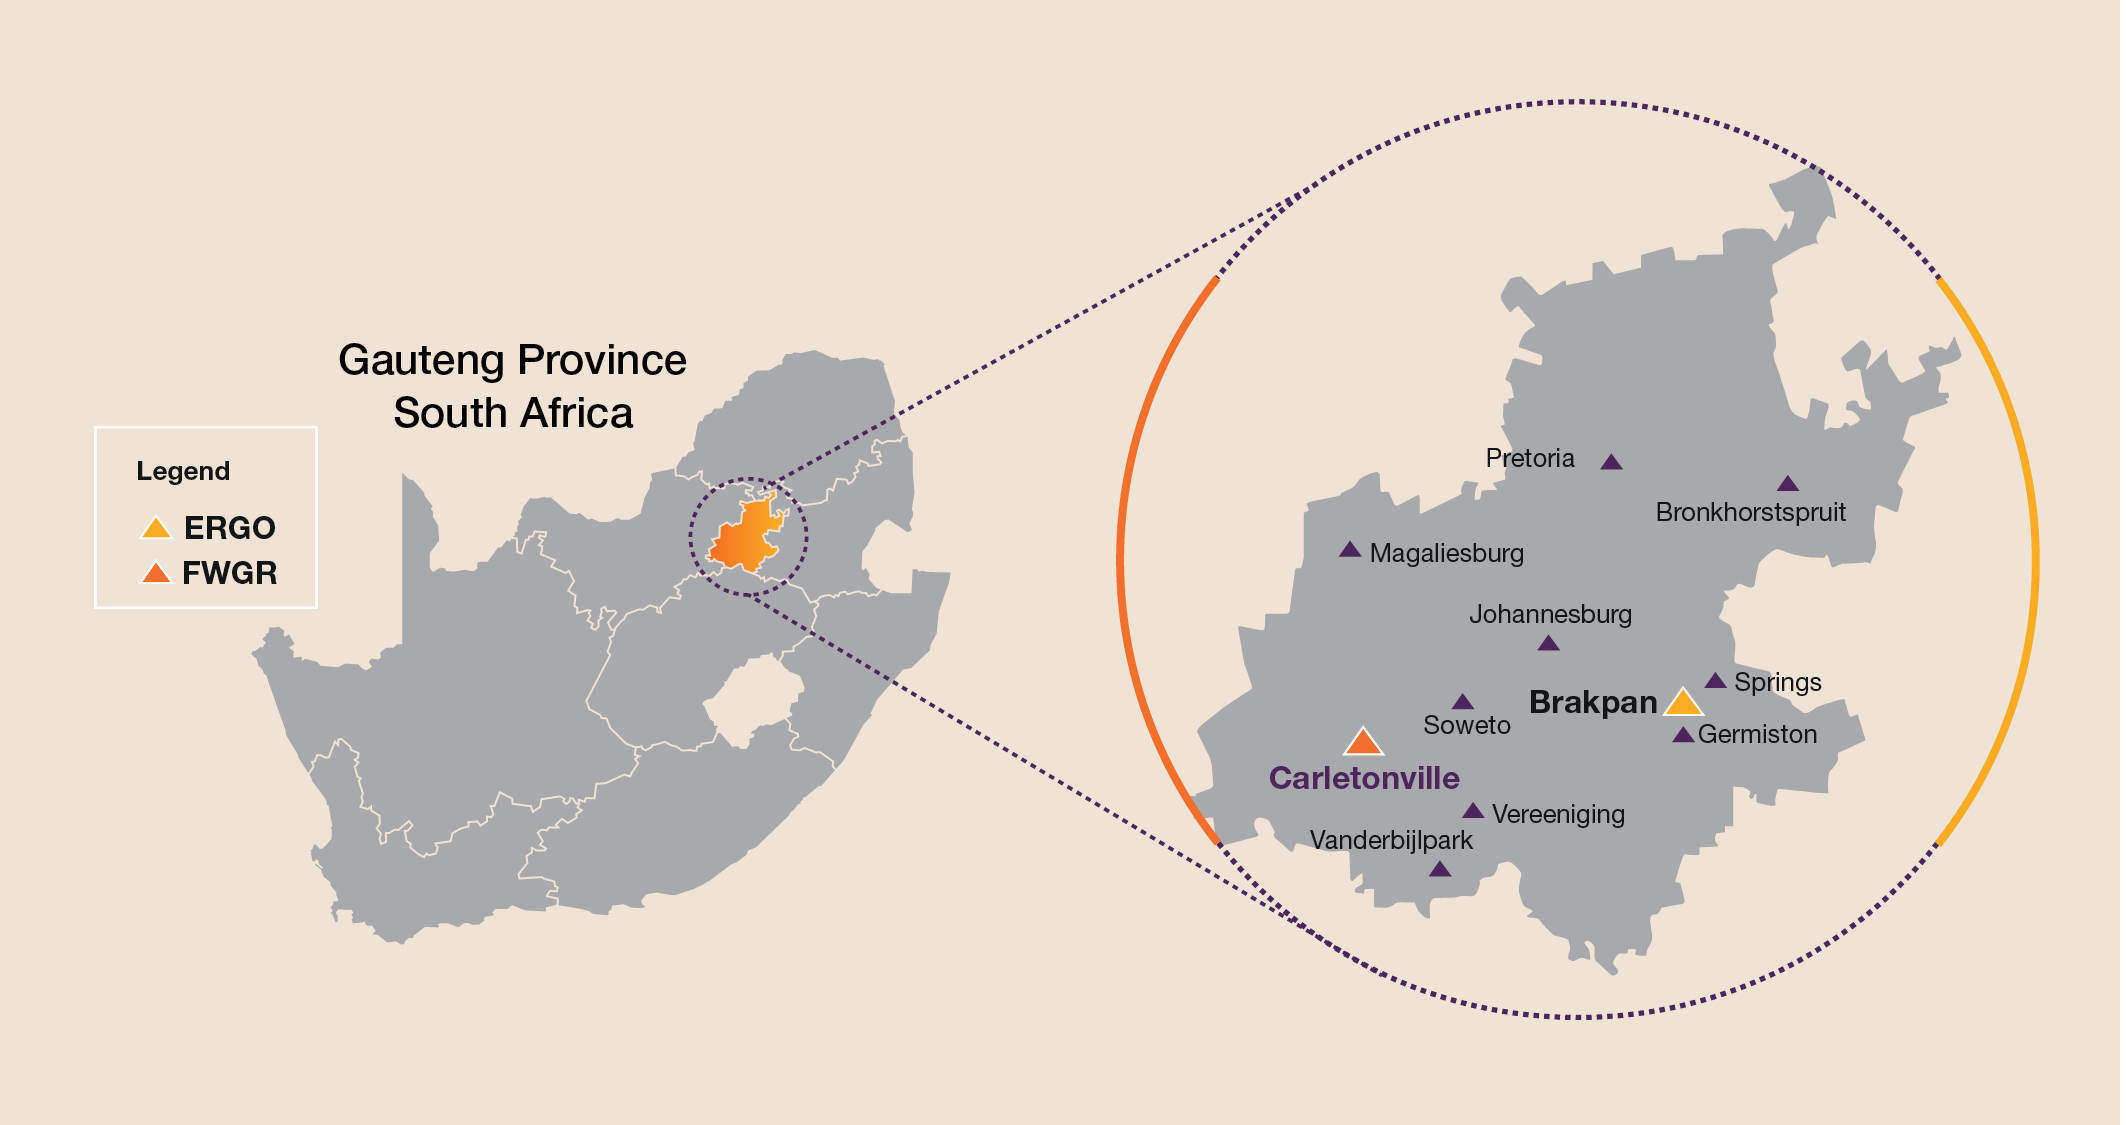
Ergo and FWGR within South Africa_map.jpg
The Ergo plant is located approximately 25 miles (40 kilometers) east of the Johannesburg’s central business district in the province of
Gauteng on land owned by Ergo. Access to the Ergo plant is via the Ergo Road on the N17 Johannesburg-Springs motorway.
Following the restructuring of the Crown operations, which consisted of three separate locations, City Deep, Crown Mines and
Knights, into a single surface retreatment operation in Ergo, these mining rights were transferred to Ergo in March 2014. The Crown
plant was closed down in March 2017 and rehabilitated.
The City Deep operation is located on the West Wits line within the Central Goldfields of the Witwatersrand Basin, approximately
3 miles (5 kilometers) south-east of the Johannesburg central business district in the province of Gauteng. Access is via the
Heidelberg Road on the M2 Johannesburg-Germiston motorway. The City Deep plant continues to operate as a pump station feeding
the Ergo plant.
The Knights operation is located at Stanley and Knights Road Germiston off the R29 Main Reef Road. The Knights plant was
reconfigured from an operating metallurgical plant to operate as a pump/milling station from April 1, 2023.
As of June 30, 2026, no material encumbrances exist on Ergo's property.
As of June 30, 2026, the net book value of Ergo’s mining assets was R5,690.3 million (2025: R4,932.9 million).
FWGR’s assets consists of the operational DP2 plant, Driefontein 4 TSF which is a current active tailings deposition facility, Driefontein
3 and 5 TSFs as reclamation sites and RTSF under development and various TSFs and related infrastructure. FWGR currently owns
seven tailings storage facilities on the West Rand between Roodepoort and Carletonville, approximately 43 miles (70km) South West
of Johannesburg (Figure A), following the transfer of Kloof 2 TSF during fiscal year 2026.
There are an additional three TSFs which will be transferred from Sibanye-Stillwater to FWGR once no longer required by the existing
operations ("Available TSFs"). These are Driefontein 1, Driefontein 2, and Leeudoorn. Numerous other TSFs, owned by independent
third parties, are potentially available in the area for future reclamation.
As of June 30, 2026, no material encumbrances exist on FWGR's property.
At June 30, 2026, the net book value of FWGR’s mining assets was R6,201.7 million (2025: R3,581.1 million).
DRDGold_Breadcrumbs_Logo_RGB.jpg
DRDGOLD Limited Form 20-F 2026
35
Below is a geographical representation of the location of individual material properties of Ergo and FWGR: (Figure A):
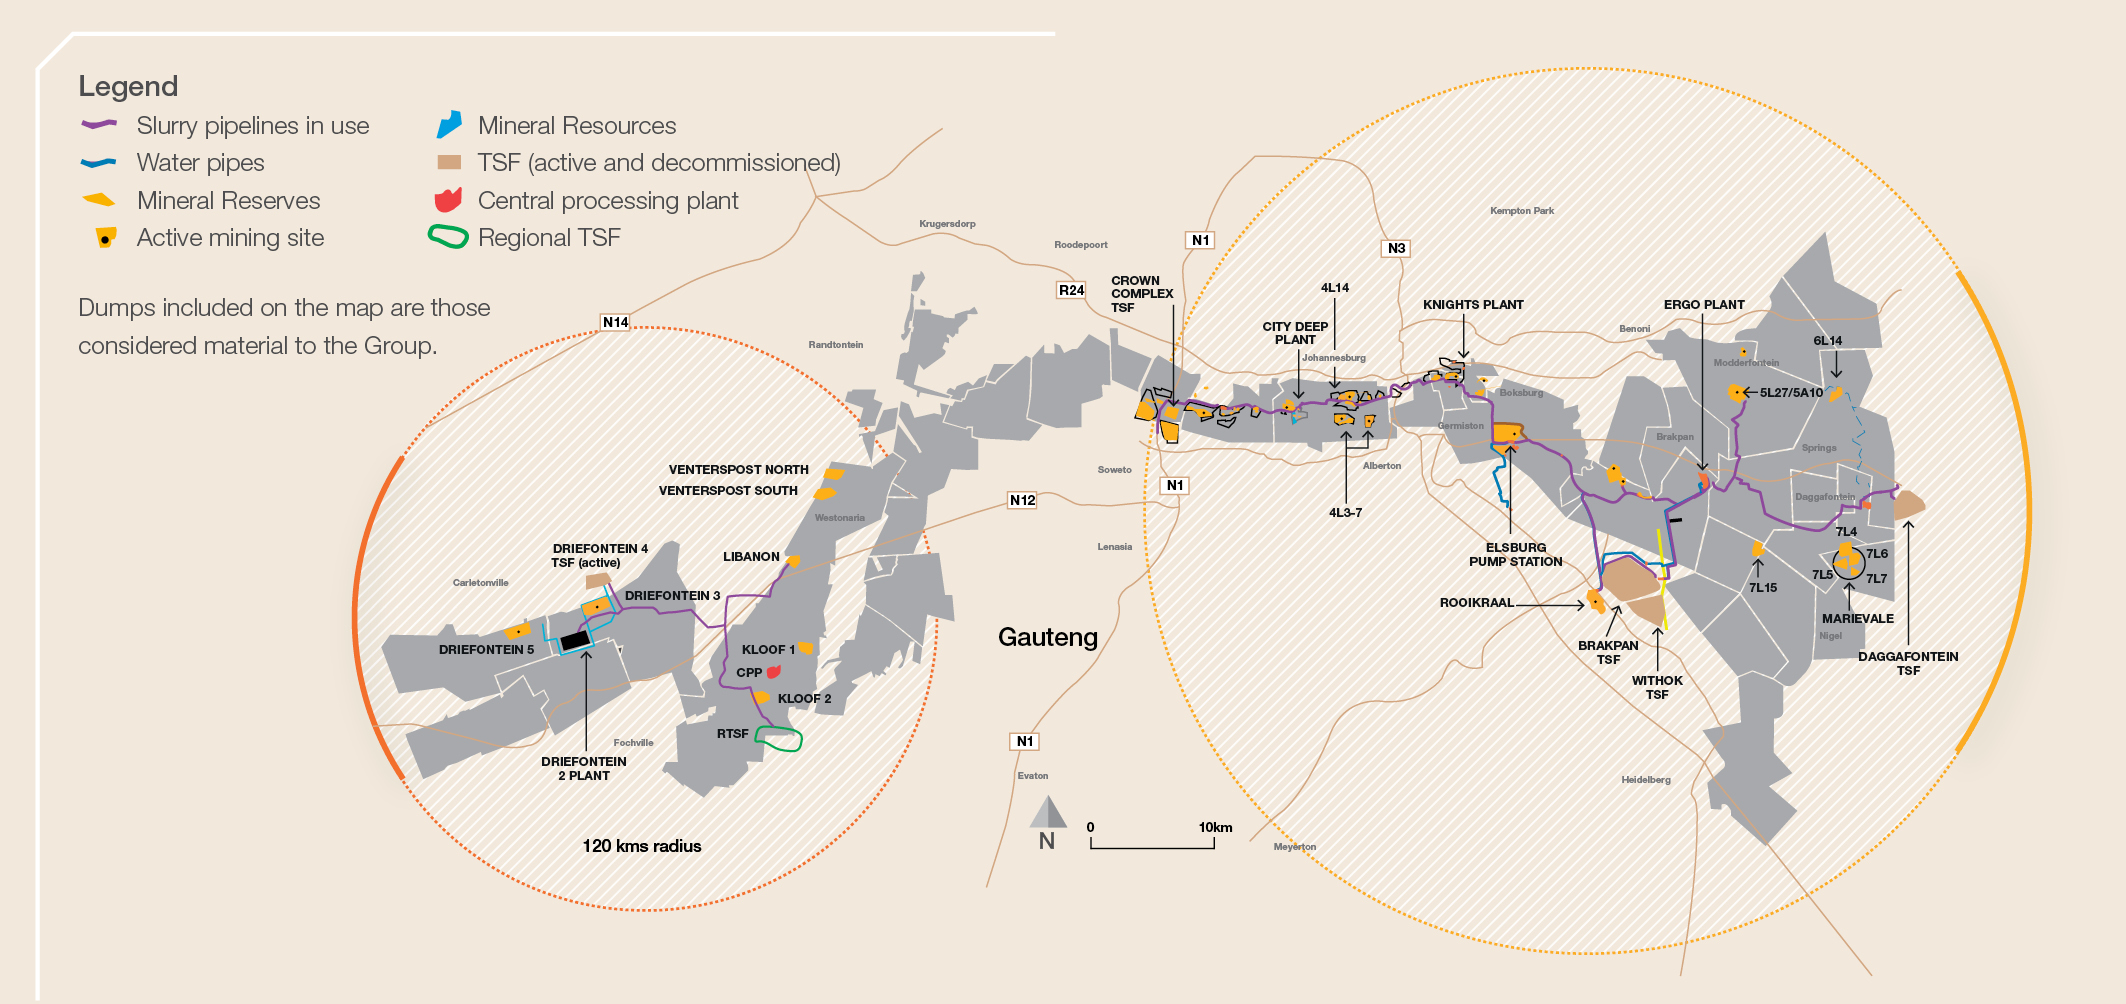
Our_footprint map_30 Sep_2026.jpg
Geology
DRDGOLD’s surface deposits are the residue (“tailings”) of the mining and metallurgical process for the recovery of gold ores of the
gold bearing late Archaean (2.7Ga to 3.2Ga) Witwatersrand sedimentary basin. The Witwatersrand Basin is the largest gold bearing
metallogenic province globally and is unconformably overlain by units of the Ventersdorp Supergroup (~2.7Ga), the Transvaal
Supergroup (~2.6Ga), and the Karoo Supergroup (~280Ma).
The deposits consist of gold, uranium and sulfur-bearing sand dumps and tailings/slimes dams, and the composition reflects the
major constituents of the Witwatersrand Basin: quartz (70%-80%), mica (10%), chlorite and chloritoid (9%-18%) and pyrite (1%-2%).
Gold, uranium, zirconium and chromium may be minor constituents averaging <100ppm each. Deposits possess characteristics,
determined by the geometry, material source and processing plants in which the original ores were processed.
Mining method
Material processed by Ergo is sourced from surface deposits comprising both sand and slime tailings, which are reclaimed
separately. FWGR sources its material exclusively from slime tailings.
TSFs are mined using hydraulic mining (hydro-mining) whereby high-pressure water jets are used to dislodge tailings material and
transport it as a slurry to processing plants. Tailings are reclaimed progressively from the surface of the TSF down to natural ground
level in layers ranging from 15m to 20m. This method provides a continuous slurry feed to the processing plants. Ergo also uses
mechanical front-end loaders to recover certain sand and slime materials, which are subsequently re-pulped with water and pumped
to the processing plants.
Selective mining is not undertaken, and entire TSFs are processed. This approach is driven by the following factors:
•There are no suitable facilities or designated areas on site for the disposal of material below the economic cut-off grade.
•The hydraulic mining method is not conducive to selective extraction of higher-grade material.
•The operations serve both mining and environmental rehabilitation objectives. As all mineralized material must ultimately be
removed from the site, it is economically beneficial to process the entire deposit, including lower-grade material.
Mineral Processing and Recovery Methods
Our metallurgical plants utilize carbon-in-leach (“CIL”) metallurgical processes to recover gold from tailings slurry.
The tailings material processed by our operations has undergone a complex depositional history, resulting in variations in grade and
metallurgical characteristics. These variations are partly attributable to changes and improvements in historical gold recovery
technologies over the period during which the tailings were deposited.
Reclaimed tailings material is re-pulped and pumped to the processing plants, where it undergoes screening, cycloning, milling and
CIL processing to facilitate gold extraction.
At Ergo, we have an installed capacity to treat approximately 23.4 million tonnes of material per year. Over recent years, the
processing plants have undergone various upgrades and modifications to enhance operational efficiency and optimize recovery
performance. The City Deep plant currently operates as a pump station, while the Knights plant functions as a milling and pump
station, with both facilities supplying material to the Ergo plant for final gold extraction.
At FWGR, we have an installed capacity to treat approximately 7.2 million tonnes of material per year as at the end of fiscal year 2026.
DRDGold_Breadcrumbs_Logo_RGB.jpg
DRDGOLD Limited Form 20-F 2026
36
The principal processing facilities currently in operation are described below.
Ergo Plant: Commissioned by Anglo American Corporation in 1977, and became part of AngloGold Ashanti in 1998. DRDGOLD
acquired the plant in 2007 for R42.8 million. During fiscal year 2015, five CIL tanks were refurbished, increasing processing capacity
to approximately 23.4 million tonnes per year.
Knights Plant: Commissioned in 1988, the plant originally comprised screening, primary cycloning, milling in closed circuit with
hydrocyclones, thickening, oxygen preconditioning, CIL processing, elution, electro-winning and smelting to doré. Although
historically part of the Crown operation, during fiscal year 2023 the plant was reconfigured to operate as a milling and pump station
and currently supplies material to the Ergo plant for final gold extraction.
City Deep Plant: Commissioned in 1987, this plant originally comprised screening, primary, secondary and tertiary cycloning in closed
circuit milling, thickening, oxygen preconditioning, CIL processing, elution, zinc precipitation, calcining and smelting to doré.
Retreatment operations at the City Deep Plant continued until August 2013, when the plant was reconfigured to operate as a milling
and pump station. It currently supplies material to the Ergo plant for final gold extraction.
Driefontein 2 Plant: Recommissioned in fiscal year 2019, this plant was refurbished and modifications made to the milling and cyclone
circuit to increase its processing capacity to approximately 7.2 million tonnes per year, to enable the production of a finer grind for
gold liberation. As part of the Vision 2028 capital projects program and FWGR Phase 2, further upgrades to the DP2 plant and
associated infrastructure support the expansion of FWGR's operations to process 14.4 million tonnes per year.
Infrastructure
The hydro-mining, reprocessing and re-deposition of tailings material requires a network of pipes. Slurry pipelines will be needed from
the hydro-mining sites at the TSFs to the plants, and tailings pipelines from the plants to the respective deposition facilities. High
pressure water pipelines are necessary to supply the mining operations while separate low-pressure water pipes are needed for
returning water to the plants from return water dams at the various TSFs. These have all been adequately designed and included in
the LoM planning.
Ergo currently utilizes the Brakpan TSF as its primary deposition facility and has access to additional deposition capacity through the
Daggafontein TSF and planned Withok TSFs. These facilities form an integral part of Ergo's life-of-mine plan by providing sufficient
tailings storage capacity to support current and future reprocessing operations and the long-term sustainable management of tailings.
FWGR currently utilizes the Driefontein 4 TSF for tailings deposition and is developing the RTSF to provide long-term deposition
capacity for tailings generated by its operations. Upon completion, the RTSF is expected to provide sufficient storage capacity to
support the long-term requirements of the FWGR operation, including future production arising from ongoing and planned expansion
projects.
Up to May 2024, both operations obtained all their power ultimately from the Eskom grid and were therefore exposed to the risks
associated with power supply interruptions and above-inflation electricity tariff increases. Ergo operations receive power from several
substations, with mining and reclamation sites supplied through multiple independent feeds. The Ergo plant has a peak demand of
approximately 16MVA and the Brakpan TSF approximately 8MVA. Ergo operates continuously, 24 hours a day, seven days a week,
and receives power via 22kV overhead lines from its solar power plant and BESS, as well as from Eskom's 88kV Vlakfontein
distribution network. The 60MW solar photovoltaic ("PV") plant and 160MWh BESS, commissioned in November 2024, now largely
meet the daytime power requirements of the Ergo reclamation sites, processing plant and Brakpan TSF, significantly reducing the
operation's reliance on grid-supplied electricity. During FY2026, solar energy consumption at Ergo increased to 146,873MWh
(FY2025: 108,760MWh), reflecting the growing contribution of renewable energy to the operation.
At FWGR, power is supplied through Eskom's 132kV and 44kV networks directly from Eskom to the Driefontein 2 plant and via various
Sibanye-Stillwater mining operations in the vicinity of FWGR's remote facilities. FWGR's electricity requirements remain within the
available capacity of the Driefontein and Kloof mining complexes. In addition, electricity wheeling enabled through Ergo's solar plant
and BESS contributes to meeting a portion of FWGR's electricity demand and helps mitigate the impact of increasing energy
requirements associated with the operation's ongoing expansion projects.
Exploration
Exploration and development activity at Ergo and FWGR involves the drilling of historical tailings dams and evaluating the potential for
gold and other commodities bearing surface material in the determination of its Mineral Resources and Mineral Reserves. These
exploration programs comprise:
•surveying to determine physical dimensions and volumes;
•auger or reverse circulation drilling programs to permit sampling and analyzing for gold content and mapping of the gold
distribution;
•metallurgical and flow sheet development test work; and
•tailings toxicity tests and specific gravity determination.
During fiscal year 2025, additional drilling works on the Crown Complex were undertaken to convert the Crown Complex TSF to a
Mineral Reserve and include it in the Ergo life-of-mine.
An auger drilling campaign was originally undertaken across the Kloof 2 TSF on a 100m x 100m grid in support of the 2009 Mineral
Resource estimate. Material was subsequently deposited on top this TSF and consequently an air-core drilling campaign was
undertaken during fiscal year 2026, with drillholes spaced on a 150m grid. This was done to classify Kloof 2 TSF as a Mineral Reserve
and include it in the FWGR life-of-mine. In addition, an auger drilling campaign was completed on the Driefontein 3 TSF using 150m
grid to enhance confidence in the grade estimates.
DRDGold_Breadcrumbs_Logo_RGB.jpg
DRDGOLD Limited Form 20-F 2026
37
Water usage and reduction in use of potable water
Water is primarily used in DRDGOLD's processing plants and hydro-mining activities. At Ergo, a centrally integrated water reticulation
plant enables water to be distributed and recovered across the operation through a closed-loop system. The majority of process water
requirements are met through the recycling and reuse of return water recovered from the Brakpan TSF, supplemented by water drawn
from licensed regional water sources and treated AMD supplied by the Trans-Caledon Tunnel Authority ("TCTA"). DRDGOLD has the
right to use up to 30Ml of AMD water per day. Potable water use at Ergo is limited primarily to applications where water quality
specifications require it, as well as certain early-stage irrigation activities associated with vegetation establishment on rehabilitated
tailings facilities.
At FWGR, the majority of process water requirements are supplied through the recovery and reuse of water harvested from the
Driefontein 4 TSF. The balance is sourced from underground mine dewatering operations undertaken in accordance with applicable
water use licenses. Water abstraction from the Driefontein 10 Shaft systems remains within the authorized limits of the relevant
licenses. Potable water consumption at FWGR is restricted largely to domestic use, including drinking water and change house
facilities, as well as limited process applications such as flocculant preparation.
The extensive reuse and recycling of water at both operations reduces dependence on potable water and supports the Group's
objective of responsible and sustainable water management.
Water pollution
DRDGOLD's operations are designed to operate as integrated closed-loop water systems, minimizing the need for water treatment
and reducing discharges to the receiving environment. Nevertheless, water pollution risks may arise from overtopping of return water
dams, seepage, stormwater runoff, or failures in water-reticulation infrastructure. To mitigate these risks, Ergo and FWGR maintain
comprehensive water management and monitoring programs designed to ensure that water balances within operational water
systems, TSFs and return water dams remain within established operating parameters.
Water management infrastructure includes stormwater controls, containment paddocks, return-water systems and pumping
arrangements that recover excess water and return it to the process circuit where practicable. Potential losses from pipelines are
managed through continuous monitoring systems that detect pressure variations, routine inspections and maintenance programmes
aimed at identifying and replacing aging or compromised infrastructure before significant leakage occurs.
ERPM acid mine drainage
Water continues to enter the historic underground workings of ERPM within the Central Basin of the Witwatersrand Goldfields. To
address the associated AMD risk, the TCTA, acting on behalf of the South African government, constructed and operates a treatment
facility that commenced operations during 2014. Under agreements entered into between TCTA, Ergo, ERPM and EMO, sludge
generated by the treatment process is disposed of at the Brakpan TSF together with processed tailings material.
The arrangement provides DRDGOLD with the right to purchase up to 30Ml per day of partially treated AMD water at cost, which is
used to supplement process water requirements and reduce reliance on potable water supplies. The agreement also provides certain
protections relating to future funding obligations associated with the Central Basin AMD remediation project.
Refer to "Item 18. Financial Statements – Note 26.2 Contingent liability for environmental rehabilitation” for disclosures on potential
pollution impact on ground water through seepage.
Environmental and Closure Aspects
In accordance with South African mining legislation, mining companies are required to rehabilitate disturbed land to an agreed post-
mining land use standard and make adequate financial provision for closure-related obligations. DRDGOLD's operations are focused
on the reclamation of historic tailings deposits, many of which were created by mining companies that no longer exist. As a result, the
Group manages both the environmental impacts associated with its current operations and certain legacy environmental conditions
inherited from historical mining activities.
Prior to commencing new mining projects, we undertake the required environmental authorization processes, including environmental
impact assessments and the development of environmental management programs (“EMPs”), supported by independent specialist
studies. These processes include public participation and stakeholder engagement to identify, assess and mitigate potential
environmental and social impacts. The Group's environmental management systems and policies are aligned with the National
Environmental Management Act, 1998 (Act No. 107 of 1998) and related regulations. Compliance is monitored through internal and
external audits, while EMPs govern the management of environmental impacts throughout the life cycle of each operation and
incorporate closure planning and associated financial provisions.
At Ergo, environmental compliance is supported by a Compliance Management Tool, which integrates Environmental Impact
Assessments (“EIAs”), EMPs, water use licenses, Mining Right Conversions, Performance Assessments and Social and Labor Plans
(“SLPs”) associated with each mining right. The system incorporates spatial data pertaining to the mining right boundaries and
environmental monitoring information to provide a consolidated view of compliance obligations and performance across the operation.
The Group actively monitors and manages the consumption of key natural resources (including potable water and energy) through
regular operational review processes aimed at promoting efficient resource use and identifying opportunities for improvement. The
principal environmental risks associated with the operations include dust generation from reclamation sites, as well as the effective
management of relocated process material on certain tailings facilities. At Ergo, these risks are heightened by the increasing proximity
of municipal infrastructure and residential and commercial developments to certain operational areas.
DRDGold_Breadcrumbs_Logo_RGB.jpg
DRDGOLD Limited Form 20-F 2026
38
The impact of dust emissions on the surrounding communities and the environment is managed through a comprehensive monitoring
network and ongoing stakeholder engagement. Monitoring reports are provided to regulators, municipalities, and interested and
affected parties. For a residential zoned monitoring bucket, an exceedance is defined as above the dust limit of 600mg/m2/day. For a
non-residential zoned monitoring bucket, an exceedance is defined as above the dust limit of 1200mg/m2/day. Mitigation measures
include environmentally friendly dust suppressants applied to high impact areas, active wetting of access roads by water bowsers,
and a network of high velocity sprayers on our active TSFs. The rehabilitation programs include the establishment of vegetation cover,
together with the application of lime and fertilizer where required, to improve soil conditions, reduce dust generation and support long-
term environmental stability.
Environmental rehabilitation closure providing and funding
While the ultimate amount of rehabilitation costs to be incurred is uncertain, we have estimated that the total cost for Ergo, in current
monetary terms as at June 30, 2026 is approximately R501.0 million (2025: R411.4 million). As at June 30, 2026, a total of R189.2
million (2025: R171.9 million) is invested in liquid money market funds and hedge funds in the Guardrisk Cell Captive, as security for
financial guarantees issued for rehabilitation costs.
We have estimated that the total cost for FWGR, in current monetary terms as at June 30, 2026 is approximately R207.3 million (2025:
R142.3 million). As at June 30, 2026, a total of R634.0 million (2025: R576.2 million) is invested in liquid money market funds and
hedge funds in the Guardrisk Cell Captive, as security for financial guarantees issued for rehabilitation costs. In addition, on
December 2, 2025, DRDGOLD and Sibanye Gold Proprietary Limited entered into an agreement to transfer ownership of the Kloof 2
TSF, together with the associated environmental rehabilitation liability and rehabilitation trust fund monies, to FWGR. While the
rehabilitation liability and TSF ownership have transferred, the rehabilitation trust fund monies of R117.4 million remained subject to
regulatory approval at June 30, 2026 and have therefore been recognised as part of other receivables. Management expects these
funds to transfer to DRDGOLD during fiscal year 2027, at which point they will form part of the Group's environmental rehabilitation
funding available to support the rehabilitation obligations associated with the Kloof 2 asset.
Guardrisk has guarantees in issue amounting to R943.1 million (2025: R941.3 million) to the DMPR on behalf of the DRDGOLD Group
related to the Group's environmental obligations. The funds for environmental rehabilitation in the cell captive serve as collateral for
these guarantees.
Legal aspects and permitting
A distinguishing feature of DRDGOLD's business is that its primary mineral resources are contained in TSFs which, under South
African common law, are generally regarded as movable property capable of separate ownership from the land on which they are
situated. As a result, TSFs are legally distinguishable from underground mineral resources. Following the introduction of the MPRDA,
ownership of mineral resources in situ became vested in the State and is regulated through mining and prospecting rights granted by
the DMPR. However, because many TSFs constitute movable property capable of common-law ownership, certain TSFs and the
minerals contained within them fall outside the direct regulatory ambit of the MPRDA and may instead be exploited pursuant to
common-law ownership, applicable environmental authorizations and other regulatory approvals.
The MPRDA included transitional arrangements that enabled holders of historical mining rights to convert those rights into rights
issued under the current legislative framework. Ergo successfully converted its old-order mining rights and conducts its operations
under a combination of mining rights, prospecting rights, common-law ownership rights, environmental authorizations and water use
licenses.
The Mineral Resources and Mineral Reserves held by FWGR were acquired from Sibanye Gold Proprietary Limited, a subsidiary of
Sibanye Stillwater Limited, in a transaction in which common law ownership was established over the various TSFs containing the said
Mineral Resources and Mineral Reserves, and control was established by Sibanye-Stillwater over DRDGOLD. FWGR conducts its
operations pursuant to environmental authorizations, water use licenses and other applicable regulatory approvals. A Use and Access
Agreement with Sibanye Gold articulates the various rights, permits and licenses held by Sibanye Gold in terms of which FWGR
operates, pending the transfer to FWGR of those that are transferable.
Mineral Resources and Mineral Reserves held by Ergo include ownership through common law, verified contractual arrangements,
prospecting rights and various mining rights as well as the required environmental permitting. Ergo has submitted applications to
renew these mining rights. The intention is to consolidate the various mining rights into a single mining right once the renewals have
been granted. These applications are receiving attention from the Department of Mineral and Petroleum Resources (DMPR). Ergo has
applied to renew the mining rights for 30 years, which is the maximum allowable period as detailed in the MPRDA. These rights are
enforceable until such stage as the DMPR has accepted or rejected the mining renewal applications as per the MPRDA.
Water use licenses are obtained and maintained where required, and the Group monitors ongoing compliance with license conditions
and other regulatory obligations.
Our principal TSFs are subject to periodic Dam Safety Evaluations conducted by independent Approved Professional Persons and
submitted to the Department of Water and Sanitation. Recommendations arising from these evaluations may result in operational
changes, including restrictions on deposition activities, which could affect throughput and production. Accordingly, the Group
continuously monitors the geotechnical integrity of its TSFs through established monitoring and risk management programs.
The Brakpan TSF is approaching the latter stages of its operating life. To provide future deposition capacity, Ergo is progressing the
recommissioning of the adjacent Withok TSF. The public participation process has been completed and the project is currently
progressing through the regulatory approval process. Delays in obtaining approvals, completing construction or commissioning
replacement deposition facilities could adversely affect future production should sufficient deposition capacity not be available when
required.
DRDGold_Breadcrumbs_Logo_RGB.jpg
DRDGOLD Limited Form 20-F 2026
39
Below is a graphical representation of the permits and licenses held within the Group:
Group structure and associate licences.jpg
DRDGOLD GROUP STRUCTURE AND ASSOCIATE LICENSES
GP 158MR
GP 184MR
GP 185MR
GP 186MR
GP 187MR
Currently common law owners of Mineral
Resources and Mineral Reserves
Transferred surface assets from ERPM:
GP 151MR
Access Rights (FWGR)
The grant of access to DRDGOLD of the:
•Driefontein 10 shaft;
•Kloof 10 shaft located in Kloof mining area that is subject to the Kloof Mining Right, for the
purpose of pumping and supplying, at the cost of WRTRP, the required quantities of water, as
licensed, for the WRTRP Assets;
•rights, servitudes and agreements for installation, supply and distribution and maintenance of
power supply; existing and proposed pipeline routes; servitudes; wayleaves and surface right
permits; and
•Driefontein 1 Gold Plant for the purpose of accessing the elution circuit.
DRDGold_Breadcrumbs_Logo_RGB.jpg
DRDGOLD Limited Form 20-F 2026
40
Production
Ergo
For fiscal year 2026, production increased to 112,879 ounces from 111,657 ounces in fiscal year 2025 mainly due to an increase in
the average yield from 0.178g/t in fiscal year 2025 to 0.185g/t in fiscal year 2026. The higher yield resulted from the processing of
higher-grade material from clean-up sites, as the Company prioritized such material in response to delays in obtaining regulatory
approvals for new reclamation sites. These factors also constrained tonnage throughput, which decreased from 19.5Mt in fiscal year
2025 to 19.0Mt in fiscal year 2026.
Cash operating costs increased by R58,331 per kilogram, or 5.48%, from R1,064,447 per kilogram in fiscal year 2025 to R1,122,778
per kilogram in fiscal year 2026. The increase in cash operating cost was largely due to higher fuel costs incurred combined with
increased trucking activities associated with clean-up sites and other material. The continued shortage of sodium cyanide in South
Africa and higher diesel prices amid the Middle East conflict also had an impact on cash operating cost.
The following table details certain production and financial results of Ergo for the past two fiscal years.
2026
2025
Production (metric)
Ore milled ('000 tonnes)
18,973
19,487
Recovered grade (oz/ton)
0.006
0.006
Gold produced (ounces)
112,879
111,657
Results of Operations
Revenue (R million)
8,080.0
5,671.5
Cost of sales (R million)
(4,292.8)
(3,952.9)
Cash operating costs (R million)1
(3,968.8)
(3,699.2)
Cash operating costs (R/kilogram)1
1,122,778
1,064,447
All-in sustaining costs (R/kilogram) 1
1,221,500
1,149,134
All-in cost (R/kilogram) 1
1,449,560
1,251,985
1Cash operating cost, cash operating costs per kilogram, all-in sustaining costs per kilogram and all-in costs per kilogram are financial measures of
performance that we use to determine cash generating capacities of the mines and to monitor performance of our mining operations. These are all
non-IFRS measures. For a reconciliation of these measures to the nearest IFRS Accounting Standards measure see "Item 5A. Operating Results -
Reconciliation of cash cost per kilogram, all-in sustaining costs per kilogram and all-in costs per kilogram.”
FWGR
For fiscal year 2026, production decreased to 42,695 ounces from 43,628 ounces produced in fiscal year 2025 mainly due to a
decrease in the average yield from 0.222g/t in fiscal year 2025 to 0.218g/t in fiscal year 2026. Tonnage throughput decreased from
6.13Mt in fiscal year 2025 to 6.10Mt in fiscal year 2026.
Cash operating costs increased by R68,740 per kilogram, or 13.97%, from R492,049 per kilogram in fiscal year 2025 to R560,789 per
kilogram in fiscal year 2026. The increase in cash operating cost was largely due to electricity cost increases due to both higher tariffs
and a marginal increase in consumption. Higher reagent costs also impacted FWGR as reported under Ergo.
The following table details certain production and financial results of FWGR for the past two fiscal years.
2026
2025
Production (metric)
Ore milled ('000 tonnes)
6,097
6,126
Recovered grade (oz/ton)
0.007
0.008
Gold produced (ounces)
42,695
43,628
Results of Operations
Revenue (R million)
3,079.0
2,206.7
Cost of sales (R million)
(889.2)
(798.0)
Cash operating costs (R million)1
(743.6)
(673.5)
Cash operating costs (R/kilogram)1
560,789
492,049
All-in sustaining costs (R/kilogram) 1
639,211
549,187
All-in cost (R/kilogram) 1
2,639,435
1,706,470
1Cash operating cost, cash operating costs per kilogram, all-in sustaining costs per kilogram and all-in costs per kilogram are financial measures of
performance that we use to determine cash generating capacities of the mines and to monitor performance of our mining operations. These are all
non-IFRS measures. For a reconciliation of these measures to the nearest IFRS Accounting Standards measure see "Item 5A. Operating Results –
Reconciliation of cash cost per kilogram, all-in sustaining costs per kilogram and all-in costs per kilogram.”
DRDGold_Breadcrumbs_Logo_RGB.jpg
DRDGOLD Limited Form 20-F 2026
41
Mineral Reserves and Mineral Resources Estimation
The Mineral Resource and Mineral Reserve estimates presented below are effective as of June 30, 2026 and have been prepared in
accordance with Subpart 1300 of Regulation S-K. The estimates and the related technical and economic assumptions are supported
by the technical report summaries filed as exhibits to this Annual Report in accordance with Item 601(b)(96) of Regulation S-K. The
technical report summaries were prepared by the Qualified Persons identified below.
During fiscal year 2026, the Company submitted a new TRS for the FWGR operation. The updated TRS reflects changes in the
operation's Mineral Resources and Mineral Reserves, including the transfer of the Kloof 2 TSF to FWGR and the ongoing development
and expansion of the operation. No new TRS has been filed for Ergo, as management and the Qualified Persons concluded that there
have been no material changes to the underlying technical, economic or operational assumptions, Mineral Resources or Mineral
Reserves, or the life-of-mine plan that would require the preparation and filing of an updated TRS under Subpart 1300 of Regulation S-
K. Accordingly, the previously filed Ergo TRS remains current and continues to support the disclosure of Ergo's Mineral Resources
and Mineral Reserves as at June 30, 2026.
The Company also reports Mineral Resources and Mineral Reserves in South Africa in accordance with the South African Code for the
Reporting of Exploration Results, Mineral Resources and Mineral Reserves, 2016 edition. South Africa is represented on the
Committee for Mineral Reserves International Reporting Standards.
Mineral Resources
DRDGOLD's summary Mineral Resources (Exclusive of Mineral Reserves) are set forth in the table below:
Mineral Resources (Exclusive of Mineral Reserves) as of June 30, 2026
Measured Resources
Indicated Resources
Inferred Resources
Total
Tonnes
Grade
Gold Content
Tonnes
Grade
Gold Content
Tonnes
Grade
Gold Content
Tonnes
Grade
Gold Content
(Mt)
(g/tonne)
(Moz)
(tonnes)
(Mt)
(g/tonne)
(Moz)
(tonnes)
(Mt)
(g/tonne)
(Moz)
(tonnes)
(Mt)
(g/tonne)
(Moz)
(tonnes)
Ergo
—
—
—
—
36.18
0.30
0.35
10.85
—
—
—
—
36.18
0.30
0.35
10.85
FWGR 1
—
—
—
—
—
—
—
—
—
—
—
—
—
—
—
—
Total
—
—
—
—
36.18
0.30
0.35
10.85
—
—
—
—
36.18
0.30
0.35
10.85
1Mineral Resources when stated exclusive of Mineral Reserves amount to zero for FWGR, because all Mineral Resources included in the current mine
plan are reported within Mineral Reserves.
Compared to the year ended June 30, 2025, the Mineral Resources (exclusive of Mineral Reserves) at Ergo decreased by
approximately 14.6% from 0.41 million ounces to 0.35 million ounces as at June 30, 2026. The decrease was primarily attributable to
the conversion of Mineral Resources into Mineral Reserves following updated life-of-mine planning and reserve estimation activities.
Notes:
•Mineral Resources are reported exclusive of Mineral Reserves and in accordance with the classification criteria of Subpart 1300 of
Regulation S-K.
•The point of reference is the tailings storage facility, sand dump or other surface deposit in situ.
•The estimates are reported on a 100% ownership basis and are fully attributable to the Company.
•No geological losses have been applied because the deposits are surface tailings storage facilities or sand dumps, the material is
accessible and no geological structures affect extraction.
•Figures have been rounded and may therefore result in minor computational differences.
Mineral Resources are estimates of mineralization with reasonable prospects for economic extraction and are not Mineral Reserves.
The estimates are based on surveying, drilling, sampling, assaying, metallurgical test work and geological or geostatistical
interpretation. The confidence assigned to each Mineral Resource classification reflects the adequacy and reliability of these inputs
and the resulting grade and tonnage estimates.
The Company’s surface deposits comprise historical tailings storage facilities, sand dumps, and silted areas. Deposits are evaluated
through drilling and sampling programmes conducted on predetermined grids. The resulting information is used to estimate volume,
moisture content, grade distribution, expected extraction factors and metallurgical response. The data are incorporated into block
models and evaluated by the Qualified Persons for Mineral Resource classification and potential inclusion in the life-of-mine plan.
A deposit may be assessed individually or as part of an operational complex or cluster. Accordingly, an individual deposit with an
average grade below the applicable plant-feed cut-off grade may remain economically extractable when processed as part of a
blended complex that exceeds the applicable cut-off grade.
The principal assumptions used to determine reasonable prospects for economic extraction are as follows:
Ergo
FWGR
Gold price (R/kg)
2,155,461
2,155,461
Working cost (R/tonne)
155
127
Plant recovery (%)
40
54
Mine call factor (%)
100
100
Cut-off grade (g/t)
0.19
0.14
The Mineral Resource estimates are subject to the inherent uncertainties associated with drilling, sampling, assaying, geological
interpretation, metallurgical performance, operating costs, commodity prices and other technical and economic assumptions. See
"Item 3D, Risk Factors”, and the applicable technical report summaries for further information.
DRDGold_Breadcrumbs_Logo_RGB.jpg
DRDGOLD Limited Form 20-F 2026
42
Mineral Reserves
DRDGOLD's summary Mineral Reserves are set forth in the table below:
Mineral Reserves as of June 30, 2026
Proven Reserves
Probable Reserves
Total Reserves
Tonnes
Grade
Gold Content
Tonnes
Grade
Gold Content
Tonnes
Grade
Gold Content
(Mt)
(g/tonne)
(Moz)
(tonnes)
(Mt)
(g/tonne)
(Moz)
(tonnes)
(Mt)
(g/tonne)
(Moz)
(tonnes)
Ergo
136.10
0.300
1.31
40.83
288.00
0.250
2.34
72.00
424.10
0.266
3.65
112.83
FWGR
257.64
0.296
2.45
76.23
12.88
0.330
0.14
4.24
270.52
0.297
2.59
80.47
Total
393.74
0.297
3.76
117.06
300.88
0.253
2.48
76.24
694.62
0.278
6.24
193.30
Mineral Reserves changed in the past two fiscal years as follows:
•Mineral Reserves increased from 5.85 million ounces at June 30, 2025, to 6.24 million ounces (an increase of 7%) at June 30, 2026,
mainly as a result of the classification of Kloof 2 as a Mineral Reserve and inclusion in the FWGR life-of-mine plan.
•Mineral Reserves increased from 5.53 million ounces at June 30, 2024, to 5.85 million ounces (an increase of 6%) at June 30, 2025,
mainly due to the Crown Complex being included in the Ergo life-of-mine plan and the Complex was converted from an Indicated
Mineral Resource to a Probable Mineral Reserve.
Compared to the year ended June 30, 2025, the Mineral Reserves at Ergo decreased by approximately 1% from 3.68 million ounces
to 3.65 million ounces as at June 30, 2026. The change was not material. The life-of-mine for Ergo based on Proven and Probable
Mineral Reserves S-K 1300 as at June 30, 2026, was 21 years (June 30, 2025: 22 years).
Compared to the year ended June 30, 2025, the Mineral Reserves at FWGR increased by approximately 19% from 2.17 million
ounces to 2.59 million ounces as at June 30, 2026. Changes were mainly due to the classification of Kloof 2 as a Mineral Reserve. The
life-of-mine for FWGR based on Proven and Probable Mineral Reserves under S-K 1300 as at June 30, 2026 was 20 years (June 30,
2025: 16 years).
Notes:
•Mineral Reserves are reported in accordance with Subpart 1300 of Regulation S-K.
•Mineral Reserves are based on studies completed to at least a prefeasibility-study level.
•Mineral Reserves comprise the estimated plant feed and are reported as run-of-mine tonnes and grade delivered to the processing
plants.
•The estimates use a gold price of R2,155,461 per kilogram.
•No mining losses, dilution or mine call factor have been applied in the conversion of Mineral Resources to Mineral Reserves
because the relevant tailings facilities are reclaimed and processed in their entirety.
•Other applicable modifying factors, including mining, processing, metallurgical, infrastructure, economic, legal, environmental and
governmental factors, have been considered in the mine design, life-of-mine plan and the related capital and operating cost
estimates.
•Figures have been rounded and may therefore result in minor computational differences.
•Mineral Reserve estimates are subject to legal, regulatory, environmental, technical, economic and other risks that may affect their
recovery or economic viability.
The assumptions used in determining the Mineral Reserve cut-off grades are consistent with those applied to the Mineral Resource
estimates:
Ergo
FWGR
Gold price (R/kg)
2,155,461
2,155,461
Working cost (R/tonne)
155
127
Plant recovery (%)
40
54
Mine call factor (%)
100
100
Cut-off grade (g/t)
0.19
0.14
Mineral Reserves are depleted as material is reclaimed and processed. The Company monitors depletion through monthly surveys,
plant-feed sampling and comparison of actual feed grades and tonnages with the estimates included in the applicable block models
and life-of-mine plans. Changes identified through these procedures are reflected in the annual Mineral Resource and Mineral
Reserve estimation process.
The year on year Mineral Reserve reconciliation is shown below:
Tonnes
(Mt)
Grade Au
(g/t)
Au Ounces
(Moz)
Mineral Reserves as at June 30, 2025
642.88
0.28
5.85
Depletion of Mineral Reserves – Ergo
(16.49)
0.32
(0.17)
Survey and other adjustments
7.22
0.56
0.15
Addition of Kloof 2 TSF
67.36
0.24
0.52
Depletion of Mineral Reserves – FWGR
(6.35)
0.55
(0.11)
Mineral Reserves at June 30, 2026
694.62
0.28
6.24
The reconciliation is based on block-model surveys. Figures have been rounded and may therefore result in minor computational
differences.
DRDGold_Breadcrumbs_Logo_RGB.jpg
DRDGOLD Limited Form 20-F 2026
43
Gold Price Assumptions
The estimation of Mineral Reserves and Mineral Resources requires the economic assessment to demonstrate reasonable prospects
for economic extraction. Assumptions in the economic assessment includes a gold price. The Company has estimated the gold price
based on consensus forecasts obtained from various sources which provided a range as of June 30, 2026. The lowest range of these
forecasts was selected to take into account the volatility experienced in the current global economic conditions.
Estimates as of
June 30, 2026
Estimates as of
June 30, 2025
Rand gold price per kilogram
2,155,461
1,689,997
Dollar gold price per ounce
4,114
2,982
ZAR/USD rate
16.30
17.63
Qualified Persons
The information contained in Item 4D related to Mineral Reserves and Mineral Resources is based on information compiled by the
Qualified Persons as defined in S-K 1300. The Qualified Persons are not employed by the Company. The Company has evaluated the
qualification and experience of the Qualified Persons and is satisfied that they meet the requirements in accordance with the SAMREC
Code and S-K 1300. DRDGOLD obtained written consents from the Qualified Persons prior to publication of this report. The Qualified
Person responsible for the compilation and reporting of Ergo’s Mineral Resources is Mr Mpfariseni Mudau and for FWGR is Mr
Nicholas Weeks. The Qualified Person responsible for the compilation and reporting of Ergo’s Mineral Reserves is Professor Steven
Rupprecht and for FWGR is Mr Vaughn Duke.
Qualified Persons
Title
Address
Qualifications
Relevant years
experience
Mpfariseni Mudau
Pr.Sci.Nat. 400305/12
Director of The RVN
Group Proprietary
Limited
Willowbrook Villas,
21 Van Hoof St, Roodepoort,
1724
BSc (Hons) –
Geology,
MSc (Mining
Engineering)
20
Professor Steven Rupprecht
HFSAIMM 701013
Associate Principal
Mining Engineer of the
RVN Group
Willowbrook Villas,
21 Van Hoof St, Roodepoort,
1724
BSc. Mining
Engineering PhD.
Mechanical
Engineering
39
Nicholas Weeks
Pr.Sci.Nat. 155508
Director at Sound
Mining International SA
Proprietary Limited
Sound Mining House,
2A Fifth Avenue,
Rivonia,
2128
BSc (Hons) –
Geology, MGSSA
7
Vaughn Duke
Pr. Eng 940314 FSAIMM
37179
Partner of Sound
Mining Solution
Proprietary Limited
Sound Mining House,
2A Fifth Avenue,
Rivonia,
2128
BSc Mining
Engineering (Hons),
MBA
41
Mineral Reserves and Mineral Resources internal controls disclosure
The Company maintains internal controls over the data used to estimate and disclose its Mineral Resources and Mineral Reserves.
These controls are designed to provide reasonable assurance regarding the reliability of exploration, sampling, assaying, surveying,
modelling, estimation and reconciliation information. The principal controls include:
•documented drilling, sampling and survey procedures;
•supervision of drilling and sampling by appropriately experienced technical personnel;
•technical site visits and review by the relevant Qualified Persons;
•sample identification, security and chain-of-custody procedures;
•assaying by reputable commercial laboratories with quality-assurance and quality-control procedures acceptable to the Qualified
Persons;
•review of results by operational and senior management to identify anomalies and confirm compliance with prescribed procedures;
•monthly comparison of actual plant-feed grades and tonnages with the relevant Mineral Resource and Mineral Reserve models;
•monthly surveys and annual reconciliation of estimated and actual depletion; and
•annual review and approval of the life-of-mine plans, operating costs, capital costs and other material assumptions used to support
the Mineral Reserve estimates.
Mineral Reserve estimates are developed through the annual life-of-mine and budget-planning process and are supported by studies
completed to at least a prefeasibility-study level. Adjustments arising from surveys, plant reconciliation, changes in assumptions or
other relevant information are evaluated by management and the Qualified Persons and reflected in the following annual Mineral
Resource and Mineral Reserve statement, where appropriate.
DRDGold_Breadcrumbs_Logo_RGB.jpg
DRDGOLD Limited Form 20-F 2026
44
Risks inherent in estimates
Uncertainties associated with the operations, and therefore the Mineral Resource and Mineral Reserve estimates, can be mitigated.
The risks inherent in these estimates are:
•Mining – while the mining method and practices are well established and conducted by experienced hydro-miners, throughput
could be affected by a variety of issues, including, but not limited to availability of electricity and water. 
•Quality of the Mineral Assets - the Mineral Resources and Mineral Reserves have all been adequately drilled, their likely content
adequately assessed and recovery test work satisfactorily completed. The actual recoveries will be influenced by the actual Run-on-
Mine grade entering the processing plants and the amount of carbon (elemental and/or organic) in the Run-on-Mine. This risk could
be managed by blending material from different TSFs, where possible.
•Plant Performance – the management of the risk of a lower-than-expected overall throughput recovery can be mitigated by ensuring
optimal processing takes place at the processing plants. 
•Tailings Capacity – depending on when the construction of the new or expanded TSF's are completed, deposition rates can be
impacted which impacts the volumes the operations can process. Should regulatory approvals further delay the recommissioning of
the Withok TSF, production may be impacted.
•Delayed Commissioning of Key Infrastructure – delays to the scheduled commissioning of key assets for Ergo and FWGR will
impact on the proposed production forecast and anticipated revenues. 
•TSF Design Risk – the main design risk of the Withok TSF recommissioning and the RTSF is the process of installing the synthetic
liner. Should creases occur during installation, this could lead to a perforation in the liner, thus compromising the liners'
effectiveness.
•Water Supply – South Africa is a relatively dry area and predictions are that dry conditions will escalate. Mining is heavily reliant on
water to transport material over large distances and for processing.
•Power Supply – power is provided by the national power supplier, Eskom. The national power supply and distribution infrastructure
is severely distressed and this results in frequent disruptions to the power delivered to the South African mining industry.
•Long-term Sustainability – Continued production beyond the current LoM plan and Mineral Reserve estimate relies on available
TSFs that can be brought on line in the future. There is ample time for additional sampling and resource modelling to confirm their
extent and content prior to production.
•Climate Change – extreme weather events such as droughts, extreme rainfall and high wind volumes are on the increase.
Specifically, the increase in intensity of events, such as thunderstorms on the Highveld, where the operations are situated, will
impact operations. Major property, infrastructure and/or environmental damage as well as loss of human life could also be caused
by extreme weather events.
•Rising Costs – The global economic environment, geopolitical tensions and inflationary pressures world-wide have led to above
inflationary increases in production costs as well as an unavailability of critical material such as reagents and critical equipment
which affects production and operating costs.
•Country Risk and Security – increasing inflation, corruption and poor service delivery are the primary drivers of social pressures,
particularly in poorer communities. The consequences of these pressures are mostly seen in operational disruptions and increased
security measures due to protest action and more crime. Protest action also results in damage to existing infrastructure.
•Gold Price – Ergo and FWGR takes full exposure to the gold price, and therefore a reduction in the price of gold may erode margins
or lead to the operations making a loss.
•Uncertainties regarding supply chain – A sustained unavailability and increased cost of critical material such as reagents and
critical equipment may require Ergo and FWGR to find acceptable substitute suppliers and may also require it to pay higher prices
for such materials, potentially affect production and increase operating costs resulting in loss of revenue.
For additional information regarding the Company’s risks, see "Item 3D. Risk Factors".
DRDGold_Breadcrumbs_Logo_RGB.jpg
DRDGOLD Limited Form 20-F 2026
45
Capital Expenditure
For a discussion of capital expenditures in fiscal years 2025 and 2026, see "Item 5A. Operating Results – Capital expenditure".
Capital expenditure related to material growth projects are financed on a project-by-project basis which may include bank facilities
and existing cash resources. Sustaining capital expenditure is financed from cash generated from operations and existing cash
resources.
Ergo
Ergo's capital expenditure is primarily focused on increasing long-term deposition capacity, improving operational flexibility and
reducing operating costs through renewable energy initiatives. During fiscal year 2026, the Daggafontein TSF was successfully
commissioned, with first water pumped to the facility on June 25, 2026 and first tailings deposited on July 6, 2026. The project adds
approximately 120 million tonnes of deposition capacity and enables Ergo's deposition profile to be split between the Daggafontein
and Brakpan TSFs.
The solar power and battery energy storage project was completed and commissioned during fiscal year 2025. The facility supplies
approximately 47% of Ergo's electricity requirements and forms part of the Company's strategy to reduce reliance on the national
electricity grid and lower operating costs.
Advance planning continues for the recommissioning and construction of the Withok TSF, which is expected to provide approximately
310 million tonnes of additional deposition capacity and support the long-term processing of Ergo's reserve base, including the Crown
Complex reserve area. Public participation has been completed, applications for the required environmental, waste management and
water-use authorizations have been submitted, and regulatory approvals are targeted by the end of calendar year 2026. Construction
is expected to commence once all required approvals have been obtained and is anticipated to be completed during 2029. Until the
Withok TSF is commissioned, Ergo is expected to be able to maintain its current throughput rate of approximately 1.65 million tonnes
per month.
FWGR
FWGR's Phase 2 expansion forms part of the Company's Vision 2028 strategy and is intended to increase throughput from
approximately 500 000 tonnes per month to 1.2 million tonnes per month while extending the operation's life-of-mine. The project
comprises the expansion of the DP2 plant, construction of a RTSF, and development of associated pipeline infrastructure.
Construction of the DP2 expansion commenced during fiscal year 2025. The project will increase processing capacity to
approximately 1.2 million tonnes per month and includes the installation of an additional elution circuit and smelt house. The new smelt
house and elution circuit were commissioned in July 2026, with the remainder of the plant scheduled for commissioning by the end of
the first quarter of fiscal year 2027. Once fully ramped up, the expansion is expected to increase FWGR's throughput to approximately
1.2 million tonnes per month.
The RTSF is an approximately 800-hectare, fully lined regional tailings storage facility designed to receive an initial deposition rate of
1.2 million tonnes per month and ultimately provide storage capacity for up to 800 million tonnes of tailings. Construction commenced
in June 2024 and, as at June 30, 2026, the project was approximately 67% complete. The Company expects the RTSF to achieve its
initial 1.2 million tonnes per month deposition capacity during the first quarter of fiscal year 2028, subject to regulatory approvals and
commissioning requirements.
The associated pipeline project consists of approximately 135 kilometers of slurry, residue and return-water pipelines linking DP2, the
RTSF and the Libanon TSF reclamation area. The water use license required for the construction of the Libanon reclamation pump
station was approved in July 2026 and construction of the pump station is expected to support the planned increase in FWGR
throughput through the reclamation of the approximately 74.3 million tonne Libanon TSF.
ITEM 4A. UNRESOLVED STAFF COMMENTS
None.
DRDGold_Breadcrumbs_Logo_RGB.jpg
DRDGOLD Limited Form 20-F 2026
46
ITEM 5. OPERATING AND FINANCIAL REVIEW AND PROSPECTS
This section should be read in conjunction with, our audited financial statements and the other financial information contained
elsewhere in this Annual Report. Our financial statements have been prepared in accordance with IFRS Accounting Standards as
issued by the IASB. Our discussion contains forward looking information based on current expectations that involve risks and
uncertainties, such as our plans, objectives and intentions. Our actual results may differ from those indicated in such forward looking
statements.
Comparison of financial performance for the fiscal year ended June 30, 2025 with fiscal year ended June 30, 2024
This comparison analysis can be found in Item 5 of the Company’s annual report on Form 20-F for the fiscal year ended June 30, 2025
filed with the United States Securities and Exchange Commission on October 30, 2025 (SEC File no. 0-28800).
5A. OPERATING RESULTS
Business overview
We are a South African gold mining company engaged in surface gold tailings retreatment, including exploration, extraction,
processing and smelting. All our surface tailings retreatment operations, including the requisite infrastructure and metallurgical
processing plants, are located in South Africa.
The success of DRDGOLD’s long-term goal to extract as much gold from its assets as possible, depends to a large extent, on how
effectively it continues to manage its resources.
Recovery of gold from gold tailings deposits is done with precision, using technology and processes refined over more than two
decades of surface retreatment. Part of our strategy is that we perform concurrent rehabilitation so that there is only limited
rehabilitation required once a site has been depleted of gold-bearing material. Sites are mined until all mine waste is removed, and
process water returned by way of a closed circuit to the reclamation sites. Our processing facilities are primarily powered by electricity
supplied by Eskom, supplemented by energy generated from our solar plant and BESS.
As a tailings deposit is reclaimed and cleared, the land beneath it becomes available for rehabilitation. We re-contour, re-vegetate and
re-establish the ground. Over time, what was a tailings storage facility becomes rehabilitated land available for redevelopment.
Our profit for fiscal year 2026 increased compared to fiscal year 2025, mainly due to, inter alia, the following:
•the average Rand gold price received increased by 40%; and
•the increase in average yield by 2% to 0.193g/t.
Key drivers of our operating results and principal factors affecting our operating results
•the price of gold, which fluctuates both in terms of Dollars and Rands;
•our production tonnages and gold content thereof, impacting on the amount of gold we produce at our operations;
•our cost of producing gold, including the effects of mining efficiencies;
•general economic factors, such as exchange rate fluctuations and inflation, and factors affecting mining operations in South Africa;
•obtaining the relevant regulatory permits timeously to mine sites and build assets such as our TSFs; and
•government policies that could materially impact our operations.
Gold price
Our revenues are derived primarily from the sale of gold produced at our surface tailings retreatment operations. We generally take full
exposure to the US Dollar spot price of gold and Rand/Dollar exchange rate. The higher the gold price, the higher our profit margin
and vice versa, subject to exchange rate fluctuations. As a result, our operating results are directly impacted by the price of gold,
which can fluctuate widely and is affected by numerous factors beyond our control. The average gold price for fiscal year 2026
reached record highs due to policies instituted by the US government, including the imposition of significant tariffs on various
countries including South Africa changes in foreign policy and global economic uncertainty. Refer to "Item 4B. “Business Overview –
Gold Market” for a description of the factors influencing the gold price.
The following table indicates data relating to the Dollar gold spot prices for the 2026 and 2025 fiscal years:
2026 fiscal year
2025 fiscal year
Change
$ per ounce
$ per ounce
%
Closing gold spot price
4,007
3,303
21
Lowest gold spot price during the fiscal year
3,275
2,329
41
Highest gold spot price during the fiscal year
5,399
3,432
57
Average gold spot price for the fiscal year
4,238
2,818
50
All our operations and gold production are based in South Africa, and as a result, the impact of movements in relevant exchange rates
is significant to our operating results. The average gold price in Rand (based on average spot prices for the year) increased from
R51,147 per ounce in 2025, by 39% to R71,537 per ounce in 2026.
An increase/(decrease) of 20% in the US Dollar gold price throughout fiscal year 2026 would have increased/(decreased) revenue by
approximately R2,227.4 million (2025: R1,575.6 million).
An increase/(decrease) of 10% in the Rand to US Dollar exchange rate throughout fiscal year 2026 would have increased/
(decreased) revenue by approximately R1,113.7 million (2025: R787.8 million).
DRDGold_Breadcrumbs_Logo_RGB.jpg
DRDGOLD Limited Form 20-F 2026
47
Gold production
In fiscal year 2026, gold production increased to 155,577 ounces (produced from 25.1 million tonnes milled at an average yield
0.193g/t) from 155,288 ounces in fiscal year 2025 (produced from 25.6 million tonnes milled at an average yield of 0.189g/t). This was
mainly due to Ergo’s gold production which increased to 112,879 ounces in fiscal year 2026 (produced from 19.0 million tonnes milled
at an average yield of 0.185g/t) from 111,657 ounces in fiscal year 2025 (produced from 19.5 million tonnes milled at an average yield
of 0.178g/t). The increase in gold production, at Ergo, is mainly due to the increase in average yield despite a decrease in tonnage
throughput. The higher yield resulted from the processing of higher-grade material, as Ergo prioritized such material in response to
deposition constraints and delays in obtaining regulatory approvals for new reclamation sites. FWGR's production decreased to
42,695 ounces in fiscal year 2026 (produced from 6.10 million tonnes milled at an average yield of 0.218g/t) from 43,628 ounces in
fiscal year 2025 (produced from 6.13 million tonnes milled at an average yield of 0.222g/t), due to lower grade material being mined at
Driefontein 3 and depletion of higher grade material from Driefontein 5.
Cash operating costs
Cash operating costs is a non-IFRS financial measure of performance that is reported to the group’s chief operating decision maker
("CODM") and is used to monitor performance – refer to "Item 18. Financial Statements – Note 23 – Operating segments”. For a
reconciliation of this measure see "Item 5A. Reconciliation of cash operating costs, cash operating costs per kilogram, all-in sustaining
costs, all-in sustaining costs per kilogram, all-in costs and all-in costs per kilogram”.
Cash operating costs include consumables, labor, specialized service providers, electricity and other related costs incurred in the
production of gold. Consumables, water and electricity, labor, specialized service providers and other costs are the largest
components of cash operating costs. A breakdown of cash operating costs into these costs is described in "Item 5A. Comparison of
financial performance for the fiscal year ended June 30, 2026 with fiscal year ended June 30, 2025”.
General economic factors
We are exposed to a number of factors, which could affect our profitability, such as exchange rate fluctuations, inflation and other risks
relating to South Africa. In conducting mining operations, we are subject to the inherent risks and uncertainties of the industry.
Effect of exchange rate fluctuations
For the fiscal years 2026 and 2025, all of our revenues were generated from South African operations, all of our operating costs were
denominated in Rand and we derived all of our revenues in dollars before being translated to Rands. As the price of gold is
denominated in Dollars which is then translated into Rands, the appreciation of the Dollar against the Rand increases our profitability,
whereas the depreciation of the Dollar against the Rand reduces our profitability.
In fiscal year 2026 the average Rand gold price received increased by 40% compared to fiscal year 2025. This was a result of the
combined impact of the average Dollar gold price which increased by 50% and the average exchange rate of the Rand against the
Dollar that strengthened by 7%.
In line with our long-term strategy of being an unhedged gold producer, we generally do not enter into forward gold sales contracts to
reduce our exposure to market fluctuations in the Dollar gold price or the exchange rate movements. If revenue from gold sales falls
for a substantial period below our cost of production at our operations, we could determine that it is not economically feasible to
continue commercial production at any or all of our plants or to continue the development of some or all of our projects. However,
during periods when medium-term debt is incurred to fund growth projects and hence introduce liquidity risk to the Group, we may
mitigate this liquidity risk by entering into hedging instruments to achieve price protection. Refer to "Item 11. Quantitative and
Qualitative Disclosures About Market Risk – General".
Effect of inflation and exchange rates
In the past, our operations have been materially adversely affected by inflation. If there is a significant increase in inflation in South
Africa, our costs will increase and if such a cost increase is not offset by an increase in the Rand price of gold, this will negatively
affect our operating results.
The movements in the Rand/Dollar exchange rate, based upon average rates during the periods presented, and the local annual
inflation rate for the periods presented, as measured by the South African Consumer Price Index ("CPI"), are set out in the table
below:
2026
2025
Fiscal year
(%)
(%)
The average rand/dollar exchange rate weakened/(strengthened) by:
(7)
(3)
CPI (inflation rate)
5.0
3.5
Obtaining the relevant regulatory permits timeously to mine sites and construct assets such as our TSFs
Before commissioning a reclamation site for re-mining, certain regulatory permits must be obtained. These typically include an
environmental authorization (“EA”) which is issued by the DMPR and a water use license (“WUL”) issued by the Department of Water
and Sanitation (“DWS”). Delays in obtaining these licenses may affect production. For example, in the current year, more material had
to be trucked at Ergo to replace material from reclamation sites where regulatory permits were delayed. Trucking of material is
significantly more expensive than the hydraulic mining of material.
Furthermore, tailings storage facilities are highly regulated in South Africa. Regulatory permits to construct a tailings storage facility
require an extensive process of engagement with various stakeholders, and relevant government departments. Typical permits
required are EAs, waste management license (“WML”) and WULs. We are currently in the process of obtaining permits for the
construction of Withok TSF at Ergo and obtaining licenses to early deposit on RTSF whilst construction is in progress. If we experience
delays in obtaining these permits, production could be impacted.
DRDGold_Breadcrumbs_Logo_RGB.jpg
DRDGOLD Limited Form 20-F 2026
48
Government policies that could materially impact operations
The South African mining industry is extensively regulated through legislation and regulations administered by various government
authorities. Regulatory uncertainty remains a concern for the industry and has been identified by the Fraser Institute as a factor
affecting South Africa's investment attractiveness. Although the industry’s successful challenge, of Mining Charter III, in the High
Court, that set aside certain provisions of the charter on the basis that it was purported legislation (as opposed to policy) provided
greater clarity on aspects of the regulatory framework, delays in obtaining permits, licenses and regulatory approvals continue to
affect the timely execution of capital projects.
The draft MPRD Bill, gazetted for public comment on May 20, 2025, could materially affect DRDGOLD’s operations by reclassifying
historic mine residue stockpiles as minerals and requiring mining rights for their reclamation, making B-BBEE and transformation
codes enforceable, and introducing ministerial powers over local beneficiation. The proposed changes could restrict access to these
resources and delay project approvals and commissioning. DRDGOLD and the Minerals Council South Africa have submitted
representations to the DMPR on these proposals.
In addition, increasing stakeholder expectations regarding ESG matters continue to raise the standards of transparency, sustainability
and corporate accountability expected of mining companies. Enhanced regulatory scrutiny and growing expectations from investors,
lenders, communities and other stakeholders may result in additional compliance requirements and increased operating costs. For a
more detailed discussion of government policies that may impact our operations, please refer to "Item 4B. Business Overview –
Governmental regulations and their effects on our business."
Key financial and operating indicators
The table below presents the key performance measurement data for the past two fiscal years. The financial results for the fiscal years
below are stated in accordance with IFRS Accounting Standards as issued by the IASB. The table includes the key performance
measures for our business and its profitability, which are revenue, gold production, gold prices, operating costs, cash operating costs
per kilogram, all-in sustaining costs per kilogram and all-in costs per kilogram, capital expenditure (additions to property, plant and
equipment).
Fiscal year
2026
2025
Revenue (R'm)
11,159.0
7,878.2
Gold production (ounces)
155,577
155,288
Gold production (kilograms)
4,839
4,830
Gold sold (ounces)
156,413
154,902
Gold sold (kilograms)
4,865
4,818
Average spot gold price (R/kilogram)
2,299,929
1,644,366
Average gold price received (R/kilogram)
2,289,250
1,632,275
Cost of sales (R'm)
5,193.9
4,747.7
Operating costs (R'm)
4,735.2
4,404.6
Cash operating costs (R'm) (1)
4,712.4
4,372.7
Cash operating costs (R/kilogram) (1)
967,523
903,824
All-in sustaining costs (R/kilogram) (1)
1,078,068
1,001,214
All-in costs (R/kilogram) (1)
1,795,930
1,399,869
Additions to property, plant and equipment (R'm)
3,736.9
2,200.0
(1)Cash operating costs, cash operating costs per kilogram, all-in sustaining costs, all-in sustaining costs per kilogram and all-in costs and all-in costs
per kilogram are non-IFRS financial measures of performance that we use to monitor performance. A reconciliation of these measures to the
nearest IFRS Accounting Standards measure is included in "Item 5A. Operating Results – Reconciliation of cash operating costs, cash operating
costs per kilogram, all-in sustaining costs, all-in sustaining costs per kilogram, all-in costs and all-in costs per kilogram”.
Revenue
Revenue increased by 42% to R11,159.0 million in fiscal year 2026 from R7,878.2 million in fiscal year 2025 mainly due to the average
Rand gold price received that increased by 40% to R2,289,250 per kilogram and a 47kg increase in gold sold from 4,818 kilograms in
fiscal 2025 to 4,865 kilograms in fiscal 2026.
Refer to "Item 5A. Operating results – Key drivers of our operating results and principal factors affecting our operating results” for a
discussion regarding the gold price received and sales volumes.
Additions to property, plant and equipment
During fiscal year 2026 capital expenditure increased by R1,536.9 million to R3,736.9 million from R2,200.0 million in fiscal year 2025.
Ergo’s capital expenditure during fiscal year 2026 increased by R393.9 million to R999.6 million from R605.7 million in fiscal year 2025.
This was mainly due to expenditure relating to the Daggafontein TSF infrastructure and pipelines being incurred in the current year.
FWGR’s capital expenditure during fiscal year 2026 increased by R1,142.7 million to R2,735.8 million from R1,593.1 million in fiscal
year 2025. This was mainly due to the construction of the RTSF (and its related infrastructure) and DP2 plant expansion.
DRDGold_Breadcrumbs_Logo_RGB.jpg
DRDGOLD Limited Form 20-F 2026
49
Comparison of financial performance for the fiscal year ended June 30, 2026 with fiscal year ended June 30, 2025
Gold revenue
The following table illustrates the year-on-year change in gold revenue (excluding silver revenue) for fiscal year 2026 in comparison to
fiscal year 2025:
R million
Total
Impact of change
in amount of gold
sold
Impact of change
in gold price
Net change
Total
gold revenue
gold revenue
2025
2026
Ergo
5,659.9
90.4
2,309.6
2,400.0
8,059.9
FWGR
2,204.4
(13.2)
886.1
872.9
3,077.3
Total
7,864.3
77.2
3,195.7
3,272.9
11,137.2
Gold revenue increased by R3,272.9 million, or 42%, to R11,137.2 million during fiscal year 2026. This was mainly due to the average
Rand gold price received which increased by 40% to R2,289,250 per kilogram and an increase in gold sold from 154,902 ounces to
156,413 ounces.
Cost of sales
Cost of sales amounted to R5,193.9 million in fiscal year 2026, consisting mainly of operating costs of R4,735.2 million, depreciation of
R477.2 million, a positive movement in gold in process of R5.4 million and a positive movement in the change in estimate of
environmental rehabilitation of R13.1 million. These are discussed as follows:
Operating costs
Operating costs increased by 8% to R4,735.2 million for fiscal year 2026 compared to R4,404.6 million for fiscal year 2025.
The increase in operating cost at Ergo is driven by fuel costs incurred by the trucking of higher-grade material from various "clean-up"
sites and a higher reagent cost as a result of the continuing sodium cyanide shortage in South Africa. At FWGR the increase was
driven by electricity cost increases due to both higher tariffs and a marginal increase in consumption. Higher reagent costs also
impacted FWGR.
Depreciation
Depreciation charges were R477.2 million for fiscal year 2026 compared to R459.2 million for fiscal year 2025. Depreciation charges
increased as a result of the inclusion of a full year of depreciation for the Solar plant and BESS at Ergo compared to fiscal year 2025
as well as new reclamation sites which have come on line at Ergo.
Movements in gold in process
Movement in gold in process in fiscal year 2026 amounted to a credit of R5.4 million recognized in profit or loss mainly due to an
increase in the lock up of gold in process at the plants and finished inventories – Gold Bullion.
Change in estimate of environmental rehabilitation
As of June 30, 2026, we estimate our total environmental rehabilitation provision, being the discounted estimate of future costs, to be
R721.4 million as compared to R558.7 million at June 30, 2025. The increase was as a result of a R34.7 million increase in the
provision due to the addition of the Kloof 2 TSF and a R114.9 million increase in the provision recognized to property, plant and
equipment, due to inflationary increases in rehabilitation costs, higher demolition rates for plant infrastructure and the expansion of
FWGR infrastructure. Additionally, the environmental rehabilitation unwound by R51.0 million for the fiscal year. The increase was
offset by a change in estimate of environmental rehabilitation, resulting in a R13.1 million decrease in the provision being recognized
in profit or loss, primarily due to the rescheduling of non-viable TSFs at Ergo.
A total of R841.5 million (2025: R765.0 million) is invested in fixed income and hedge investment funds to secure financial guarantees
provided to the DMPR through an insurance cell captive company, the Guardrisk Cell Captive. The increase is attributable to growth
of R76.5 million on these funds during fiscal year 2026. As at June 30, 2026, guarantees amounting to R943.1 million were in issue to
the DMPR (2025: R941.3 million). Any shortfall between the invested funds and the estimated provisions is expected to be financed by
contributions to the Guardrisk Cell Captive from time to time as required over the remaining production life of the respective mining
operations and, at the time of mine closure, the proceeds on the disposal of remaining assets and gold from plant clean-up.
Administration expenses and general costs
Administration expenses and general costs increased by R18.9 million from R213.8 million in fiscal year 2025 to R232.7 million in fiscal
year 2026, mainly as a result of inflationary increases, increase in cash portion of single incentive scheme and an increase in the
share-based payment expense.
Finance income
Finance income increased from R223.8 million in fiscal year 2025 to R245.5 million in fiscal year 2026, mainly due to higher cash and
cash equivalents balances throughout the year.
Finance expense
Finance expenses increased from R73.4 million in fiscal year 2025 to R100.0 million in fiscal year 2026, mainly attributable to change
in estimate of the payments made under protest resulting in a discount of R37.8 million compared to R3.3 million in fiscal year 2025.
Income tax
Income tax amounted to a charge of R1,627.0 million for fiscal year 2026 (2025: charge of R824.4 million) and consists of a current tax
charge of R496.2 million (2025: nil) and a deferred tax charge of R1,130.8 million (2025: deferred tax charge of R824.4 million).
The current tax increased to R496.2 in fiscal year 2026 from nil in fiscal year 2025, driven by the increase in the gold price and Ergo
having utilized all of its capital allowances and therefore moving into a tax paying position.
DRDGold_Breadcrumbs_Logo_RGB.jpg
DRDGOLD Limited Form 20-F 2026
50
The forecast weighted average deferred tax rate of Ergo increased to 27% for fiscal year 2026 compared to 25% for fiscal year 2025.
The forecast weighted average deferred tax rate of FWGR increased to 30% for fiscal year 2026 compared to 29% for fiscal year
2025. Refer to "Item 10E. Taxation – Income Tax and Withholding Tax on Dividends” for a detailed explanation on changes in taxation
laws and regulations.
Non-IFRS Measures
Set forth below is a discussion of non-IFRS measures presented in this report, including a reconciliation of such measures from the
nearest measure under IFRS Accounting Standards, as well as an explanation as to why we believe that presentation of such
information provides useful information to investors and additional purposes, if any, for which we use such measures.
Adjusted earnings before interest, tax, depreciation and amortization (“Adjusted EBITDA”)
Set forth below is a presentation of our Adjusted EBITDA, which is a non-IFRS measure, including the items included in this measure
and a reconciliation from profit for the year. Our calculation of Adjusted EBITDA is based on the calculation of this measure as
included in our Nedbank RCF agreement, which was put in place during July 2024. The Group considers the presentation of Adjusted
EBITDA as relevant to our investors as our holding company, Sibanye-Stillwater, who consolidates our results, discloses a similar non-
IFRS measure to its investors.  Adjusted EBITDA may not be comparable to similarly titled measures of other companies. Adjusted
EBITDA is not a measure of performance under IFRS Accounting Standards and should be considered in addition to, and not as a
substitute for, other measures of financial performance and liquidity.
Year ended
Reconciliation of adjusted EBITDA
2026
2025
Profit for the year
4,255.5
2,242.7
Income tax
1,627.0
824.4
Profit before tax
5,882.5
3,067.1
Finance expense
100.0
73.4
Finance income
(245.5)
(223.8)
Results from operating activities
5,737.0
2,916.7
Depreciation
477.2
459.2
Loss on disposal of subsidiary
4.8
—
Retrenchment costs
—
16.2
Adjusted EBITDA per RCF Agreement
6,219.0
3,392.1
Share-based payment expense
41.7
30.1
Change in estimate of environmental rehabilitation recognized in profit or loss
(13.1)
(98.0)
Gain on disposal of property, plant and equipment
(0.3)
(3.7)
IFRS 16 Lease payments
(8.1)
(12.1)
Exploration and project related costs
5.5
9.2
Adjusted earnings before interest, tax depreciation and amortization ("Adjusted
EBITDA") 1
6,244.7
3,317.6
1See Glossary of Terms for definitions.
Cash operating costs, cash operating costs per kilogram, sustaining capital expenditure, all-in sustaining costs, growth
capital expenditure and all-in costs per kilogram
Cash operating costs, cash operating costs per kilogram, sustaining capital expenditure, all-in sustaining costs, growth capital
expenditure and all-in costs per kilogram are non-IFRS financial measures that should not be considered by investors in isolation or as
alternatives to operating costs, cash generated from operating activities, profit/(loss) for the year and other items or any other measure
of financial performance presented in accordance with IFRS Accounting Standards or as an indicator of our performance. While the
World Gold Council has provided guidance for the calculation of cash operating costs, cash operating costs per kilogram, all-in
sustaining costs and all-in costs per kilogram as well as classification of capital expenditure between sustaining capital expenditure
and growth capital expenditure, such measurements may vary significantly among gold mining companies, and these definitions by
themselves do not necessarily provide a basis for comparison with other gold mining companies. However, we believe that these
measures are useful indicators to investors and our management of an individual mine's performance and of the performance of our
operations as a whole as they provide:
•an indication of a mine’s profitability and efficiency;
•the trend in costs;
•a measure of margin per kilogram, by comparison of the cash operating costs per kilogram to the price of gold; and
•a benchmark of performance to allow for comparison against other mines and mining companies.
For fiscal year 2026, consolidated cash operating costs per kilogram increased by 7% to R967,523 per kilogram from R903,824 per
kilogram in fiscal year 2025. Consolidated all-in sustaining costs per kilogram increased by 8% to R1,078,068 per kilogram in fiscal
year 2026 from R1,001,214 per kilogram in fiscal year 2025. Consolidated all-in costs per kilogram increased by 28% to R1,795,930
per kilogram of gold in fiscal year 2026 from R1,399,869 per kilogram of gold in fiscal year 2025.
DRDGold_Breadcrumbs_Logo_RGB.jpg
DRDGOLD Limited Form 20-F 2026
51
The increase in consolidated cash operating costs per kilogram was mainly due to higher fuel costs incurred combined with
increased trucking activities associated with the processing of higher-grade material at Ergo. At FWGR the increase was driven by
electricity cost increases due to both higher tariffs and a marginal increase in consumption. The continued shortage of sodium
cyanide in South Africa and higher diesel prices amid the Middle East conflict also had an impact on cash operating cost for both
operations.
The increase in all-in sustaining costs per kilogram was mainly due to the increase in cash operating costs detailed above as well as a
reduction in gold produced. The increase was moderated by a decrease in sustaining capex in fiscal year 2026 to R279.5 million from
R300.6 million in fiscal year 2025. The increase in all-in costs per kilogram was due to the increase in cash operating costs detailed
above as well as a significant increase in growth capital expenditure from R1,899.4 million in fiscal year 2025 to R3,457.4 million in
fiscal year 2026. Growth capital expenditure related to the Daggafontein TSF pipeline at Ergo and the RTSF construction (and related
infrastructure) and DP 2 expansion at FWGR.
Reconciliation of cash operating costs, cash operating costs per kilogram, all-in sustaining costs, all-in sustaining costs per
kilogram, all-in costs and all-in costs per kilogram
R millions
2026
2025
Cost of sales
5,193.9
4,747.7
Depreciation
(477.2)
(459.2)
Change in estimate of environmental rehabilitation recognized to profit or loss
13.1
98.0
Movement in gold in process and finished inventories – Gold Bullion
5.4
18.1
Operating costs
4,735.2
4,404.6
Ongoing rehabilitation expenditure
(19.7)
(19.2)
Care and maintenance costs
(0.2)
0.8
Other operating costs
(2.9)
(13.5)
Cash operating costs 1
4,712.4
4,372.7
Movement in gold in process
(5.4)
(18.1)
Administration expenses and other costs excluding non-recurring items 1
216.8
208.1
Other operating costs
3.6
(2.0)
Change in estimate of environmental rehabilitation
(13.1)
(98.0)
Unwinding of rehabilitation provision
51.0
58.6
Sustaining capital expenditure 1
279.5
300.6
All-in sustaining costs 1
5,244.8
4,821.9
Care and maintenance costs
0.2
(0.8)
Ongoing rehabilitation expenditure
19.7
19.2
Exploration expenses and transaction costs
15.1
2.7
Growth capital expenditure 1
3,457.4
1,899.5
All-in costs 1
8,737.2
6,742.5
Gold produced (kilograms)
4,839
4,830
Cash operating costs per kilogram (R per kilogram)
967,523
903,824
All-in sustaining costs per kilogram (R per kilogram)
1,078,068
1,001,214
All-in costs per kilogram (R per kilogram)
1,795,930
1,399,869
Reconciliation of sustaining capital expenditure and growth capital expenditure
Additions – property, plant and equipment owned
3,736.9
2,200.0
Less: Growth capital expenditure 1
3,457.4
1,899.4
Sustaining capital expenditure 1
279.5
300.6
1See Glossary of Terms for definitions.
DRDGold_Breadcrumbs_Logo_RGB.jpg
DRDGOLD Limited Form 20-F 2026
52
Cash operating costs
Cash operating costs are linked directly to the level of throughput of a specific fiscal year.
The following table illustrates the year-on-year change in cash operating costs for fiscal year 2026 in comparison with fiscal year 2025.
R million
Cash operating
costs
Impact of change
in
throughput
Impact of change
in costs
Net change
Cash operating
costs
2025
2026
Ergo
3,699.2
(97.6)
367.2
269.6
3,968.8
FWGR
673.5
(3.2)
73.3
70.1
743.6
Total
4,372.7
(100.8)
440.5
339.7
4,712.4
Cash operating costs in fiscal year 2026 increased by R339.7 million to R4,712.4 million compared to cash operating costs of
R4,372.7 million in fiscal year 2025. The increase in Ergo's cash operating costs was mainly due to higher fuel costs incurred
combined with increased trucking activities associated with the processing of higher-grade material at Ergo. This was in response to
deposition constraints and delays in obtaining regulatory approvals for new reclamation sites, both of which constrained tonnage
throughput. At FWGR, the increase in cash operating cost was largely due to electricity cost increases due to both higher tariffs and a
marginal increase in consumption.
The following table lists the major components of cash operating costs for the Group for each operation and fiscal year set forth below
respectively:
Ergo
FWGR
Year ended
Year ended
Costs
2026
2025
Costs
2026
2025
Consumables
32%
31%
Consumables
33%
33%
Labor
16%
17%
Labor
17%
18%
Electricity, water and gas
11%
13%
Electricity, water and gas
19%
19%
Specialized service providers
25%
23%
Specialized service providers
6%
6%
Machine hire
4%
4%
Machine hire
3%
3%
Security expenses
4%
4%
Security expenses
5%
5%
Other costs
8%
8%
Other costs
16%
15%
5B. LIQUIDITY AND CAPITAL RESOURCES
Cash flows from operating activities
Net cash inflow from operating activities amounted to R5,675.3 million for fiscal year 2026 (fiscal year 2025: R3,511.1 million).
Cash generated from operating activities increased during fiscal year 2026 mostly due to a 40% increase in the average Rand gold
price received to R2,289,250 per kilogram and offset by a 7% increase in cash operating costs to R967,523 per kilogram. Net
movement in working capital (changes in trade and other receivables, consumable stores and stockpiles and trade and other
payables) amounted to a cash outflow of R219.8 million in fiscal year 2026 compared to R79.0 million cash inflow in fiscal year 2025.
The increase in cash inflows from cash generated from operations was offset by current tax paid. In fiscal year 2025, a tax refund of
R25.7 million was received compared to tax paid of R489.1 million during fiscal year 2026.
Cash flows from investing activities
Net cash utilized by investing activities amounted to R3,408.9 million in fiscal year 2026 compared to R2,283.3 million in fiscal year
2025.
In fiscal year 2026, net cash utilized by investing activities consisted mainly of R3,531.6 million cash spent on additions to property,
plant and equipment, R147.5 million cash proceeds from the sale of Stellar and R24.8 million cash spent on environmental
rehabilitation payments to reduce environmental liabilities with a related asset.
In fiscal year 2025, net cash utilized by investing activities consisted mainly of R2,254.9 million cash spent on additions to property,
plant and equipment, and R26.1 million cash spent on environmental rehabilitation payments to reduce environmental liabilities with a
related asset.
Cash flows from financing activities
Net cash outflow from financing activities was R802.6 million in fiscal year 2026 compared to net cash outflows of R443.1 million in
fiscal year 2025.
During fiscal year 2026, the net cash outflow consisted mostly of dividends paid on ordinary shares amounting to R779.3 million.
During fiscal year 2025, the net cash outflow consisted mostly of dividends paid on ordinary shares amounting to R431.0 million.
DRDGold_Breadcrumbs_Logo_RGB.jpg
DRDGOLD Limited Form 20-F 2026
53
Cash and cash equivalents
Cash and cash equivalents as at June 30, 2026 amounted to R2,770.0 million compared to R1,306.2 million at the end of fiscal year
2025. Substantially all of our cash and cash equivalents balances were denominated in South African rand.
Cash and cash equivalents as at June 30, 2026 includes restricted cash related to guarantees of R14.1 million compared to
R13.2 million at the end of fiscal year 2025.
Borrowings and funding
At June 30, 2026, we had no drawn external borrowings. To fund the significant capital expansion program at both operations, on
June 28, 2024, DRDGOLD secured a R500 million General Bank Facility ("GBF") with Nedbank Limited. The GBF was increased to
include guarantees facility of R181 million (R120 million in FY2025 and further increased by R61 million in FY2026), bringing the total
GBF facility to R681 million (FY2025: R 620 million). The revolving credit facility ("RCF") of R1 billion, with an accordion facility of R500
million, is secured with Nedbank. Other than the guarantees facility that has been fully utilized, both the GBF and RCF remain undrawn
as at June 30, 2026 and June 30, 2025.
Anticipated funding requirements and sources
Our cash and cash equivalents are set out above under “Cash and cash equivalents”. Management believes that existing cash
resources, existing bank facilities, net cash generated from operations and long-term finance options available for long-term capital
projects will be sufficient to meet the anticipated commitments of our existing operations for fiscal year 2027 of R3 billion, which are
mainly for growth capital expenditure. Approximately R5.3 billion of the R10 billion planned total capital growth investment forecast,
pertaining mainly to the FWGR Phase 2 project, the Daggafontein TSF pipeline construction and recommissioning of the Withok TSF
was spent at June 30, 2026.
5C. RESEARCH AND DEVELOPMENT, PATENTS AND LICENSES, ETC.
DRDGOLD has a dedicated team that looks at ways and means of improving recoveries. While the team remains active with an
ongoing focus on improving extraction efficiencies, the projects undertaken during the year ended June 30, 2026 were focused on
optimizing the existing facilities rather than implementing new technologies to improve extraction efficiencies. We have no registered
patents or licenses.
5D. TREND INFORMATION
Any sustained decline in the market price of gold from the current elevated gold price levels would adversely affect us, and any
decline in the price of gold below the cost of production could result in the closure of some or all of our operations which would result
in significant costs and expenditure, such as, incurring retrenchment costs earlier than expected which could lead to a decline in
profits, or losses. In addition, as most of our production costs are in Rands, while gold is sold in Dollars and then converted to Rands,
our results of operation and financial condition have been and could be in the future materially affected by an appreciation in the value
of the rand. Accordingly, any sustained decline in the Dollar price of gold and/or the strengthening of the South African Rand against
the Dollar would negatively and adversely affect our business, operating results and financial condition.
For the fiscal year 2027, we are planning Group gold production of between 160,000 (4,976kg) to 170,000 (5,288kg) ounces at a cash
operating unit cost of approximately R1,099,000 per kilogram and expected planned total capital growth investment forecast is
around R3 billion with an all-in sustaining cost of approximately R1,230,000/kg.
Reconciliation of budgeted cost of sales to budgeted cash operating costs
R'million
Cost of sales
6,248.2
Reconciling items1
(615.9)
Cash operating costs2
5,632.3
1Includes expected depreciation of R596.4 million and ongoing environmental expenses of R18.9 million.
2See glossary of terms for definition.
Rounding of figures may result in computational discrepancies
Our ability to meet the full year’s production target could be impacted in a number of ways, including stoppages in production due to
power interruptions and other risks (refer to "Item 3D. Risk Factors—Risks related to our business and operations and – Forward
Looking Statements"). We are also subject to cost pressures in the event of above inflation increases in labor, key consumables,
diesel, steel and cyanide. Unforeseen changes in ore grades and recoveries, unexpected changes in the quality or quantity of
reserves and resources, technical production issues, environmental and industrial accidents, gold theft, environmental factors and
pollution, and delays in obtaining permits for beneficial occupation for the RTSF at FWGR could adversely impact the production,
sales and cash operating costs for fiscal year 2027 and cause us to fail to meet our targets for the year.
Refer to "Item 5A. Key drivers of our operating results and principal factors affecting our operating results” for a discussion of the
trends in the US Dollar gold price as well as exchange rates impacting our business.
5E. CRITICAL ACCOUNTING ESTIMATES
For more information on environmental rehabilitation obligations, refer to Note 2 – “Use of accounting assumptions, estimates and
judgements” under "Item 18. Financial Statements".
DRDGold_Breadcrumbs_Logo_RGB.jpg
DRDGOLD Limited Form 20-F 2026
54
ITEM 6. DIRECTORS, SENIOR MANAGEMENT AND EMPLOYEES
6A. DIRECTORS AND SENIOR MANAGEMENT
Directors and Executive Officers
Our Board of directors may consist of not less than four and not more than twenty directors. As at June 30, 2026, our Board consisted
of nine directors. Riaan Davel resigned as Executive Director and Chief Financial Officer on January 31, 2026 and Henriette Hooijer
was appointed as the Chief Financial Officer on February 1, 2026. As at September 30, 2026, our Board consisted of ten directors as
Mark Hoffman was appointed on August 1, 2026.
In accordance with the JSE listing requirements and our Memorandum of Incorporation ("MOI"), one third of the directors comprising
the Board of directors, on a rotating basis, are subject to re-election at each annual general shareholders’ meeting. Additionally, all
directors are subject to election at the first annual general meeting following their appointment. Retiring directors normally make
themselves available for re-election. 
The address of each of our executive directors and non-executive directors is the address of our principal executive offices. Refer to
"Item 4A. Information on the Company – Introduction" for the company’s address.
There are no family relationships between any of our non-executive directors, executive directors or members of the group executive
and senior management. There are no arrangements or understandings between any of our directors or executive officers and any
other person by which any of our directors or executive officers has been so elected or appointed. Furthermore, none of the non-
executive directors, executive directors, group executive and senior management members or other key management personnel are
elected or appointed under any undertaking by, arrangement or understanding with any major shareholder, customer, supplier or
otherwise.
Executive Directors
Niël Pretorius (59) (BProc, LLB, LLM)
Chief Executive Officer
•Member: Risk Committee
Niël Pretorius has more than 27 years of experience in the mining industry. He was appointed Chief Executive Officer of DRDGOLD on
1 January 2009, having served as CEO Designate since 21 August 2008.
Since joining DRDGOLD in May 2003 as Legal Advisor, Niël has held several senior leadership positions within the Group. He was
promoted to Group Legal Counsel in September 2004, General Manager: Corporate Services in April 2005, and Chief Executive
Officer of Ergo Mining Operations (formerly DRDGOLD SA) in July 2006. In April 2008, he was appointed Managing Director of Ergo
Mining Operations.
Under his leadership, DRDGOLD has strengthened its position as a leading surface gold retreatment company, focusing on
operational excellence, responsible mining practices and sustainable value creation for stakeholders. Niël also serves as an elected
board member of the Minerals Council South Africa and the World Gold Council, contributing to the advancement and sustainability of
the mining industry both locally and globally.
Henriette Hooijer (46) (BCom (Hons), CA(SA))
Chief Financial Officer
•Member: Social and Ethics Committee
Henriette Hooijer was appointed as the Chief Financial Officer Designate and Executive Director on 1 July 2025 and assumed the role
of Chief Financial Officer on 1 February 2026, succeeding Riaan Davel. She joined DRDGOLD in May 2016 as Group Financial SOX
and Compliance Manager and was appointed Financial Director of Far West Gold Recoveries Proprietary Limited (FWGR) in August
2018. In March 2024, she was appointed General Manager: Group Finance.
Prior to joining DRDGOLD, Henriette spent 11 years with KPMG, where she led and participated in audits of listed companies,
including mining companies and SEC registrants. With more than 20 years of experience in the mining industry, she brings extensive
expertise in financial management, reporting, governance, assurance and regulatory compliance. Henriette has played a key role in
strengthening the group's financial leadership and supporting the implementation of DRDGOLD's Vision 2028 growth strategy.
Non-executive Directors
Timothy Cumming (69) (BSc (Hons) (Civil Engineering), MA (Philosophy, Politics and Economics))
Non-executive Chairman
•Chairman: Board
•Chairman: Nominations Committee
•Member: Risk Committee and Remuneration Committee
Timothy (Tim) Cumming joined the DRDGOLD Board on 1 August 2020 and was appointed non-executive Chairman and Chairman of
the Nominations Committee on 1 December 2021. He is an independent non-executive director of Nedgroup Investments Limited and
Riscura Holdings Limited and previously served on the boards of Sibanye Stillwater Limited and Sasol Limited. His career spans
mining, financial services and consulting. He is the founder of Scatterlinks Proprietary Limited, a South African based company
providing leadership development and advisory services to senior business executives.
His career started at Anglo American Corporation of South Africa as an engineer, where he was also involved in the geotechnical
design of the Ergo tailings facility. Thereafter he held senior leadership roles at Allan Gray, HSBC Securities (SA) and Old Mutual.
Other involvements include Chairmanship of the Mandela Rhodes Foundation’s Investment Committee and the Woodside Endowment
Trust.
DRDGold_Breadcrumbs_Logo_RGB.jpg
DRDGOLD Limited Form 20-F 2026
55
Edmund Jeneker (64) (Chartered Director (SA), B Hons, IEDP, M.Inst.D., SAIPA)
Lead Independent Non-executive Director
•Chairman: Remuneration Committee and Social and Ethics Committee
•Member: Nominations Committee
Edmund Jeneker was appointed as a non-executive director in November 2007 and lead independent non-executive director in
August 2017. He has more than 32 years’ experience as an executive in banking, business strategy, advisory and management at
Grant Thornton South Africa Proprietary Limited, Swiss Re Corporate Solutions Advisors South Africa Proprietary Limited, the World
Bank Competitiveness Fund and Deloitte South Africa. He completed almost 15 years at Absa Bank and Barclays Africa Group,
where he was managing executive and served as director on the boards of several subsidiaries in the Absa and Barclays Africa
Group.
Edmund is active in community social upliftment and served as a member of the Provincial Development Commission of the Western
Cape Provincial Government. He currently serves as Chairman of IZI Africa Group, member of the Social and Ethics Forum of the
Institute of Directors Southern Africa, Chairman of the Badisa NPC Investment Committee and serves on the Board of The Cape
Philharmonic Orchestra. He is a Fellow Member of the Institute of Directors SA, a Certified ESG and Climate Change Competent
Director and Chartered Director (SA).
Johan Holtzhausen (80) (BSc (Geology and Chemistry), BCompt (Hons), CA(SA))
Independent Non-executive Director
•Chairman: Audit Committee
•Member: Remuneration Committee and Nominations Committee
Johan Holtzhausen was appointed as an independent non-executive director on 25 April 2014. With more than 43 years’ experience
in the accounting profession, he served as a senior partner at KPMG Services Proprietary Limited. His clients included major
corporations listed in South Africa, Canada, the UK as well as Australia and the United States.
As announced on the Stock Exchange News Service on 24 October 2025, Johan will be stepping down from the board of directors of
DRDGOLD with effect from the conclusion of the 2026 AGM.
Andrew Brady (51) (BCom, Post Graduate Diploma in Business Administration)
Non-executive Director
•Member: Remuneration Committee, Risk Committee and Social and Ethics Committee
Andrew Brady was appointed an independent non-executive director on 1 December 2024 and became a non-executive director on
19 August 2025. He has more than 25 years’ experience in resource-sector corporate finance and business development.
Andrew is an executive director of Clean World Capital. He was previously Senior Vice President: Business Development at Sibanye
Stillwater and a founding shareholder and Managing Director of Qinisele Resources. Qinisele Resources, an independent boutique
resources advisory business played a leading role in the restructuring and consolidation of South Africa’s gold and platinum group
metals industries. He has advised international and South African mining companies on investment and expansion strategies and has
an extensive resources and banking network.
As announced on SENS on 13 August 2026, Andrew was appointed to the Remuneration Committee and the Social and Ethics
Committee with effect from 1 September 2026.
Thoko Mnyango (61) (Dip Juris, BJuris)
Independent Non-executive Director
•Member: Social and Ethics Committee; Nominations Committee and Risk Committee.
Thoko Mnyango was appointed as an independent non-executive director on 1 December 2016. Thoko’s career took off as a
prosecutor for the KaNgwane homeland, before becoming a legal advisor for the Eastern Cape Development Corporation. Her
experience in the corporate world is vast and spans over 30 years. Thoko has been in executive positions at Gijima Technologies
since its inception until 2011. She has held directorships on various company boards including Gijima, EOH Mthombo Proprietary
Limited, AllPay Eastern Cape Proprietary Limited, a subsidiary of Absa Limited, and the Ryk Neethling Foundation. Thoko is known as
a specialist in business development and bridging the gap between the public and private sectors. Currently she holds the position of
CEO of Vitom Holdings Proprietary Limited and Vitom Brands Communication Proprietary Limited, since 2010. Thoko is known in both
the private and public sectors as a staunch advocate for transformation. Her passion for transformation began in the late 80s when
she worked for a Johannesburg based Non-Governmental Organization which focused on community development.
Prudence Lebina (45) (BCom, Higher Diploma (Accounting), Certificate in Business Leadership, CA(SA))
Independent Non-executive Director
•Chairperson: Risk Committee
•Member: Audit Committee, Nominations Committee and Remuneration Committee
Prudence Lebina was appointed as an independent non-executive director on 3 May 2019. She's a chartered accountant with over 20
years' working experience in corporate finance, business development, financial reporting and stakeholder management in the mining
and financial services sectors.
Prudence is CEO of TriAlpha Investment Management Proprietary Limited, a specialist fixed income investment house managing local
and international fixed income portfolios for institutional clients. She was previously CEO and Interim Finance Director of Mahube
Infrastructure Limited (previously GAIA Infrastructure Capital Limited) listed on the Main Board of JSE Limited. Prudence is also an
independent non-executive of Telkom SA SOC Limited.
DRDGold_Breadcrumbs_Logo_RGB.jpg
DRDGOLD Limited Form 20-F 2026
56
Charmel Flemming (43) (BAcc (Hons), CA(SA))
Independent Non-executive Director
•Member: Audit Committee; Risk Committee and Social and Ethics Committee
Charmel Flemming was appointed as an independent non-executive director on 1 August 2020. Ms Flemming is the Founder and
CEO of FTwelve, a boutique cloud-based accounting firm. She currently serves as a non-executive director of ATKV MSW and
previously served as a non-executive director of Acorn Agri & Food Limited and MixTelematics Limited. Earlier in her career, she was
employed by KPMG and De Beers, where she also served as a trustee on the boards of the De Beers Benefit Society Medical Aid and
the De Beers Pension Fund. Charmel is a Chartered Accountant and an advocate for diversity in the financial industry and inclusivity
in the boardroom.
As announced on SENS on 1 September 2026, Charmel was appointed as Chair of the Audit Committee, replacing Johan, with effect
from the conclusion of the 2026 AGM.
Mark Hoffman (57) (BCom, BAcc, CA(SA))
Independent Non-executive Director
•Member: Audit Committee; Remuneration Committee and Social and Ethics Committee
Mark Hoffman was appointed as an independent non-executive director on 1 August 2026. He is a Chartered Accountant and has
worked in the professional services space for over 35 years. Mark previously served as a partner at Deloitte and KPMG in advisory
and audit across multiple sectors in financial, sustainability, investor and integrated reporting. Mark is currently an independent
consultant with extensive experience in dealing with corporate reporting, strategy, risk and opportunity, business performance
management, internal controls, governance and integrated thinking solutions.
As announced on SENS on 13 August 2026, Mark was appointed to the Audit Committee, Remuneration Committee and Social and
Ethics Committee with effect from 1 September 2026.
Senior Management and Prescribed Officers
Jaco Schoeman (52) (National Diploma (Analytical Chemistry), BTech (Analytical Chemistry))
Chief Operating Officer
Jaco Schoeman joined DRDGOLD in 2011 as Executive Officer: Business Development, with responsibility for expanding the Group's
surface retreatment business and maximising value from its existing resources. He was appointed as an Executive Director of Ergo
Mining Operations Proprietary Limited in July 2014 and subsequently assumed the role of Chief Operating Officer of the Group.
Jaco brings extensive operational and business development experience, having played a key role in advancing DRDGOLD's surface
retreatment strategy and supporting the sustainable growth of the Group's operations.
Henry Gouws (57) (National Higher Diploma (Extraction Metallurgy), MDP, EDP)
Head of Operations
Henry Gouws has more than 37 years of experience in the mining industry, having held various managerial positions at Crown and
Ergo. He obtained a National Diploma in Extraction Metallurgy from Technikon Witwatersrand in 1990, followed by a National Higher
Diploma in Extraction Metallurgy in 1991. He further completed a Management Development Programme through the UNISA School
of Business Leadership in 2003 and an Executive Development Programme through the University of Stellenbosch Business School in
2012.
Henry was appointed Head of Operations for DRDGOLD on 1 January 2024, with responsibility for overseeing the Group's production
performance. Henry serves as a director of Ergo Mining Proprietary Limited, Far West Gold Recoveries Proprietary Limited and other
DRDGOLD subsidiaries and brings extensive operational, technical and leadership expertise to the Group.
Kevin Kruger (58) (BSc Eng, MDP, PMD, Government Certificate of Competency (Mines))
Head of Technical Services
Kevin Kruger has 36 years of experience in the mining industry across Africa. He graduated from the University of the Witwatersrand
with a Bachelor of Science in Mechanical Engineering in 1989 and obtained his Government Certificate of Competency (Mines) in
1993. He further completed a Management Development Programme (MDP) and a Programme for Management Development
(PMD), strengthening his leadership and management capabilities.
Kevin was appointed Head of Technical Services at DRDGOLD on 1 June 2024 and is responsible for the execution of the Group's
major projects. Previously, he served as the Managing Director of Far West Gold Recoveries Proprietary Limited, Technical Director of
Ergo Mining Operations Proprietary Limited and held several engineering management roles. He currently serves as a director of
FWGR and brings extensive technical, operational and project execution expertise to the Group.
DRDGold_Breadcrumbs_Logo_RGB.jpg
DRDGOLD Limited Form 20-F 2026
57
Refiloe Vengeni (37) (Admitted Attorney of the High Court of South Africa, LLB, BCom)
Legal Counsel
Refiloe Vengeni was appointed Legal Counsel of DRDGOLD in November 2022. She is an admitted attorney of the High Court of
South Africa with 12 years of legal experience, including 10 years specialising in the mining sector. Prior to joining DRDGOLD, she
practised law at various multidisciplinary law firms, with a specialisation on mining law and related legal advisory services.
Refiloe brings extensive expertise in legal, mining regulatory and compliance matters, supporting the organisation in navigating the
complex legal and compliance landscape of the mining industry.
Mpho Mashatola (36) (BAccSc, CA(SA) , ACMA, CGMA, Post Graduate Certificate in Mining Tax)
Senior Executive: Finance
Mpho Mashatola joined DRDGOLD in 2018 and was appointed Senior Executive: Finance in August 2025. Her portfolio combines
finance, investor relations and business development, with responsibility for corporate finance, treasury, taxation, technical
accounting, Sarbanes-Oxley compliance, and financial and integrated reporting. Through this portfolio, she supports investor-facing
reporting, capital allocation discipline, governance and strategic growth initiatives.
Mpho serves as a Non-executive Director of Rand Refinery Proprietary Limited, is a member of its Audit and Risk Committee, and
attends DRDGOLD's Executive Committee meetings as a standing invitee.
Kgomotso Mbanyele (45) (ACG)
Company Secretary
Kgomotso Mbanyele was appointed Company Secretary of DRDGOLD on 25 October 2023. She has more than 17 years of company
secretarial experience, including over 12 years in the mining industry. Prior to joining DRDGOLD, she served as Assistant Group
Company Secretary of Sibanye Stillwater Limited.
Kgomotso is a qualified Associate Company Secretary and a member of the Chartered Governance Institute of Southern Africa. She
brings extensive expertise in corporate governance, board administration, regulatory compliance and supporting the Board and its
committees in the effective discharge of their governance responsibilities.
6B. COMPENSATION
Our MOI provides that the directors' fees should be determined from time to time in a general meeting or by a quorum of Non-
Executive Directors. The total amount of directors' remuneration paid and/or accrued for the year ended June 30, 2026 was
R86.5 million.
Non-Executive Directors received the following annual fees for fiscal year 2026:
Fee for calendar
year 2026
Fee for calendar
year 2025
R
R
Chairman of the Board1
1,867,002
1,769,670
Lead Independent Director1
1,057,968
1,002,813
NEDs
535,207
507,305
Audit Committee chairman2
224,040
212,360
Committee chairman2,3
174,254
165,169
Audit Committee member
149,360
141,574
Risk Committee and Remuneration Committee member
124,467
117,978
Nominations Committee and Social and Ethics Committee member
112,020
106,180
Investment Committee Chair – ad hoc fee per meeting
43,860
28,090
Investment Committee member – ad hoc fee per meeting
29,635
41,573
Ad hoc fee applicable for additional special meetings4
29,635
28,090
1Fees per annum for the Chair of the Board and the Lead Independent Director are all-inclusive fees i.e. they will not receive Committee membership
fees nor will they receive ad hoc fees in the event of additional special meetings required or as members of the Investment Committee.
2This per annum fee is inclusive of both the NED's role as Chair of the Committee and as a member.
3Per annum fees applicable for the Chairs of all Committees except the Audit Committee.
4Ad hoc fees for additional work by a NED is only payable in out of the ordinary circumstances.
DRDGold_Breadcrumbs_Logo_RGB.jpg
DRDGOLD Limited Form 20-F 2026
58
The following table sets forth the compensation for our directors and prescribed officers for the year ended June 30, 2026.
The disclosure detailed in this table is consistent with the disclosure requirements of the Companies Act, 2008 (Act 71 of 2008) and
the JSE Listings Requirements.
Directors/Prescribed Officers
Total
remuneration
recognized
during the year
Short-Term
Incentives
recognized
related to this
cycle
Long-term
Incentives
settled during
this cycle
Total
remuneration
related to this
cycle
R'000
R'000
R'000
R'000
Executive directors
DJ Pretorius
9,334
12,002
25,498
46,834
H Hooijer
4,926
5,433
4,786
15,145
AJ Davel
3,377
—
13,574
16,951
17,637
17,435
43,858
78,930
Non-executive directors
TJ Cumming
1,867
—
—
1,867
EA Jeneker
1,082
—
—
1,082
JA Holtzhausen
970
—
—
970
TBVN Mnyango
902
—
—
902
KP Lebina
1,120
—
—
1,120
CD Flemming
943
—
—
943
RA Brady
700
—
—
700
M Hoffman (2)
—
—
—
—
7,584
—
—
7,584
Prescribed officers(1)
WJ Schoeman
5,894
6,500
13,574
25,968
5,894
6,500
13,574
25,968
Total
31,115
23,935
57,432
112,482
(1)The Companies Act, 2008 (Act 71 of 2008), under section 30, requires the remuneration of prescribed officers, as defined in regulation 38 of
Company Regulations 2008, to be disclosed with that of directors of the company. A person is a prescribed officer if they have general executive
authority over the company, general responsibility for the financial management or management of legal affairs, general managerial authority over
the operations of the company or directly or indirectly exercise or significantly influence the exercise of control over the general management and
administration of the whole or a significant portion of the business and activities of the company.
(2)M Hoffman was appointed as independent non-executive director with effect from August 1, 2026. He did not receive any compensation for the year
ended June 30, 2026.
Also see "Item 6E. Share Ownership" for details of share options held by directors.
Compensation of key management
Refer to "Item 18. Financial Statements – Note 18.2 – Transactions with key management personnel" for the total compensation paid to
key management (including executive and non-executive directors as well as prescribed officers).
Service Agreements
Service contracts negotiated with each executive and non-executive director incorporate their terms and conditions of employment
and are approved by our Remuneration Committee.
The Company’s current executive directors, Mr. DJ Pretorius and Ms. H Hooijer, entered into agreements of employment with us, on
January 1, 2009 and July 1,2025, respectively. These agreements regulated the employment relationship with Mr. DJ Pretorius and
Ms. H Hooijer during the year ended June 30, 2026.
DJ Pretorius received from us a guaranteed remuneration package of R9.3 million per annum. Mr. DJ Pretorius is eligible under his
employment agreement and in terms of the new SIP which incorporates the DSP, for an incentive bonus per annum over the duration
of his appointment, on the condition that DRDGOLD achieves certain key performance indicators, along with any discretionary bonus
awarded by the Remuneration Committee. Per the SIP, 67% of the incentive bonus is paid in cash and 33% received in terms of a
Deferred Share Award which vests each year evenly over a five-year period. Mr. DJ Pretorius was awarded 177,688 deferred shares
in August 2025.
After providing three months written notice, Mr. AJ Davel, the previous Chief Financial Officer, resigned from the company effective
from January 31, 2026.
DRDGold_Breadcrumbs_Logo_RGB.jpg
DRDGOLD Limited Form 20-F 2026
59
On February 1, 2026, Ms. H Hooijer was appointed as the new Chief Financial Officer and entered into a new employment agreement
indefinitely until terminated by either party on not less than three months’ prior written notice. Ms. H Hooijer receives from us a
guaranteed remuneration package of R5.1 million per annum. H Hooijer is eligible under her employment agreement and in terms of
the new SIP which incorporates the DSP, for an incentive bonus per annum over the duration of her appointment, on the condition that
DRDGOLD achieves certain key performance indicators, along with any discretionary bonus awarded by the Remuneration
Committee. Per the SIP, 67% of the incentive bonus is paid in cash and 33% received in terms a Deferred Share Award which vests
each year evenly over a 5 year period. Ms. H Hooijer was awarded 55,418 deferred shares in August 2025.
Mr. TJ Cumming, Mr. EA Jeneker, Mr. JA Holtzhausen, Mrs. TBVN Mnyango, Ms. KP Lebina, Ms. CD Flemming, Mr. RA Brady and Mr.
MCA Hoffman,  entered into a service agreement which continues indefinitely until terminated by the director not less than one
months’ prior written notice, the director is not recommended for re-appointment by the Board, the director is not reappointed at any
AGM, or where grounds exist for termination. Mr. MCA Hoffman was appointed on August 1, 2026.
The Company does not administer any pension, retirement or other similar scheme in which the directors receive a benefit.
6C. Board PRACTICES
Board of Directors
As at June 30, 2026, the Board of directors comprises two Executive Directors (Mr. DJ Pretorius and Ms. H Hooijer). Mr. A J Davel
resigned as the Executive Director and Chief Financial Officer on January 31, 2026 and Ms. H Hooijer appointed as Chief Financial
Officer on February 1, 2026.  As at June 30, 2026 the Board comprised of seven Non-Executive Directors (Mr. TJ Cumming, Mr. EA
Jeneker, Mr. JA Holtzhausen, Mrs. TBVN Mnyango, Ms. KP Lebina, Ms. CD Flemming, and Mr. RA Brady). The Non-Executive
Directors are independent under the New York Stock Exchange ("NYSE") requirements (as affirmatively determined by the Board of
Directors) and the South African King IV Report except Mr. RA Brady who serves as a consultant for Sibanye Stillwater Limited,
DRDGOLD’s controlling shareholder, from July 1, 2025 and Mr. TJ Cumming who previously served as an independent non-executive
director of Sibanye Stillwater Limited, but resigned in May 2026. Mr. MCA Hoffman was appointed as an independent non-executive
director on August 1, 2026.
In accordance with the King IV Report on corporate governance, as encompassed in the JSE Listings Requirements, and in
accordance with the United Kingdom Combined Code, the responsibilities of Chairman and Chief Executive Officer are separate. Mr.
TJ Cumming is the Non-Executive Chairman, Mr. DJ Pretorius is the Chief Executive Officer and Ms. H Hooijer is the Chief Financial
Officer. The Board has established a Nominations Committee, and it is our policy for details of a prospective candidate to be
distributed to all directors for formal consideration at a full meeting of the Board. A prospective candidate would be invited to attend a
meeting and be interviewed before any decision is taken. In compliance with the NYSE rules a majority of independent directors will
select or recommend director nominees.
The Board’s main roles are to create value for shareholders, to provide leadership of the Company, to approve the Company’s
strategic objectives and to ensure that the necessary financial and other resources are made available to management to enable
them to meet those objectives. The Board retains full and effective control over the Company, meeting on a quarterly basis with
additional ad hoc meetings being arranged when necessary, to review strategy and planning and operational and financial
performance. The Board further authorizes acquisitions and disposals, major capital expenditure, stakeholder communication and
other material matters reserved for its consideration and decision under its terms of reference. The Board also approves the annual
budgets for the various operational units.
The Board is responsible for monitoring the activities of executive management within the company and ensuring that decisions on
material matters are referred to the Board. The Board approves all the terms of reference for the various subcommittees of the Board,
including special committees tasked to deal with specific issues. Only the executive directors are involved with the day-to-day
management of the Company.
To assist new directors, an induction program has been established by the Company, which includes background materials,
meetings with senior management, presentations by the Company’s advisors and site visits. The directors are assessed annually,
both individually and as a Board, as part of an evaluation process, which is driven by an independent consultant, at least every two
years. In addition, the Remuneration Committees formally evaluate the executive directors on an annual basis, based on objective
criteria.
All directors, in accordance with the Company’s MOI, are subject to retirement by rotation and re-election by shareholders. In addition,
all directors are subject to election by shareholders at the first annual general meeting following their appointment by directors. The
appointment of new directors is approved by the Board as a whole. The names of the directors submitted for re-election are
accompanied by sufficient biographical details in the notice of the forthcoming annual general meeting to enable shareholders to
make an informed decision in respect of their re-election.
All directors have access to the advice and services of the Company Secretary, who is responsible to the Board for ensuring
compliance with procedures and regulations of a statutory nature. Directors are entitled to seek independent professional advice
concerning the affairs of the Company at the Company’s expense, should they believe that course of action would be in the best
interest of the Company.
Board meetings are held quarterly in South Africa. The structure and timing of the Company’s Board meetings, which are scheduled
over two days, allows adequate time for the Non-Executive Directors to interact without the presence of the Executive Directors. The
Board meetings include the meeting of the Audit Committee, Risk Committee, Remuneration Committee and Nominations Committee
as well as the Social and Ethics Committee which act as subcommittees to the Board. Each subcommittee is chaired by one of the
Independent Non-Executive Directors, except for the Nominations Committee, each of whom provides a formal report back to the
Board. Each subcommittee is afforded adequate time to thoroughly consider and address all relevant matters. Certain senior
personnel of the Company attend the subcommittee meetings as invitees.
DRDGold_Breadcrumbs_Logo_RGB.jpg
DRDGOLD Limited Form 20-F 2026
60
The Board sets the standards and values of the Company and much of this has been embodied in the Company’s Code of Business
Conduct and Ethics (“the Code”), which is available on our website at www.drdgold.com. The Code applies to all directors, officers
and employees, including the principal executive, financial and accounting officers, in accordance with Section 406 of the US
Sarbanes-Oxley Act of 2002, the related US securities laws and the NYSE rules. The Code contains provisions for employees to report
violations of Company policy or any applicable law, rule or regulation, including US securities laws. A description of the significant
ways in which our corporate governance practices differ from practices followed by U.S. companies listed on the NYSE can be found
in "Item 16G. Corporate Governance".
Directors' Terms of Service
The table below sets out the date of appointment of each director and the period remaining in the director’s current term of office
following the Company’s most recent AGM held on (November 26, 2025) of each of the directors as at June 30, 2026:
Director
Title
Year first
appointed
Term of current
office
since latest AGM1
DJ Pretorius
Chief Executive Officer
2008
3 years
AJ Davel
Chief Financial Officer
2015
Resigned
H Hooijer
Chief Financial Officer
2025
7 months
TJ Cumming
Non-Executive Director
2020
1 year
EA Jeneker
Non-Executive Director
2007
2 year
JA Holtzhausen
Non-Executive Director
2014
3 years
TBVN Mnyango
Non-Executive Director
2016
3 years
KP Lebina
Non-Executive Director
2019
2 years
CD Flemming
Non-Executive Director
2020
1 year
RA Brady
Non-Executive Director
2024
1 year
1In terms of clause 25 of the MOI, one third of the directors (executive and non-executive) for the time being shall retire from office by rotation at each
AGM. The directors, eligible and available for re-election, will renew their term of service with effect from the end of the AGM, if re-elected.
Executive Committee
As at June 30, 2026, Executive Committee ("EXCO") comprise of the Chief Executive Officer, Chief Financial Officer and Chief
Operating Officer. After a review was performed to confirm the makeup of the DRDGOLD EXCO, it was decided that the Company
Secretary will no longer form part of the EXCO. The Executive Committee consisted of  Mr. DJ Pretorius (Chairman), Ms H Hooijer and
Mr. WJ Schoeman.
The EXCO meets monthly to review current operations, develop strategy and policy proposals for consideration by the Board of
directors. Members of the EXCO, who are unable to attend the meetings in person, are able to participate via teleconference facilities,
to allow participation in the discussion and conclusions reached. The subsidiary companies’ executives are permanent participants
on the EXCO.
Board Committees
The Board has established a number of standing committees to enable it to properly discharge its duties and responsibilities and to
effectively fulfill its decision-making process. Each committee acts within written terms of reference which have been approved by the
Board and under which specific functions of the Board are delegated. The terms of reference for all committees can be obtained by
application to the Company Secretary at the Company’s registered office. Each committee has defined purposes, membership
requirements, duties and reporting procedures. Minutes of the meetings of these committees are circulated to the members of the
committees and made available to the Board. Remuneration of Non-Executive Directors for their services on the committees
concerned is determined by the Board and approved by the shareholders at each AGM. The committees are subject to annual
evaluation by the Board with respect to their performance and effectiveness. The following information reflects the composition and
activities of these committees.
Committees of the Board of Directors
Nominations Committee
As at June 30, 2026 the Nominations Committee consisted of TJ Cumming (Chairman), EA Jeneker, JA Holtzhausen, TBVN Mnyango
and KP Lebina.
The Nominations Committee meets on a quarterly basis. All members of this committee are independent non-executive directors who
are independent according to the definition set out in the NYSE Rules. It is chaired by the Board chairman who is a non-executive
director (“NED”).
The key responsibilities of the Nominations Committee include the following:
•establishment of a formal process for the appointment of a director and make recommendations to the Board on the appointment of
new directors;
•make recommendations on the composition of the Board and the balance between executive and non-executive directors
appointed to the Board;
•drive an annual process to evaluate the Board, Board committees and individual directors;
•ensure that succession plans for the Board, chief executive officer and senior management appointments are developed and
implemented;
•review Board structure, size, tenure and composition on a regular basis;
•make recommendations on directors eligible to retire by rotation; and
•apply the principles of good corporate governance and best practice in respect of nominations matters.
DRDGold_Breadcrumbs_Logo_RGB.jpg
DRDGOLD Limited Form 20-F 2026
61
Remuneration Committee
As at June 30, 2026 the Remuneration Committee consisted of EA Jeneker (Chairman), JA Holtzhausen, KP Lebina and TJ Cumming.
The Remuneration Committee meets on a quarterly basis. All members of this committee are independent non-executive directors
who are independent according to the definition set out in the NYSE Rules, except for TJ Cumming. It is chaired by an independent
non-executive director.
The Remuneration Committee ensures the Company remunerates directors and executive management fairly and responsibly and
that the disclosure of director and executive remuneration is accurate, complete and transparent. The committee evaluates
performance in relation to reward. Its terms of reference provide the scope of responsibility, as delegated by the Board, to review and
make decisions on the remuneration policy and its implementation. All members were elected by the Board and suitably qualified and
have the necessary expertise required to discharge their responsibilities.
The key responsibilities of the Remuneration Committee include the following:
•Evaluate the remuneration structure for Executive Directors and Senior Management and ensured that they are fairly rewarded, in
the context of overall employee remuneration and taking into account the Company’s performance and remuneration philosophy;
•Conduct annual monitoring and review of the terms and conditions of Executive Directors’ service agreements;
•Determine grants to the Executive Directors and Senior Management made in terms of the SIP incorporating the DSP;
•Review and monitor the effectiveness of the Company scorecard performance;
•Maintains the Compensation Clawback Policy in accordance with the requirements of Section 303A.14 of the New York Stock
Exchange Listed company manual; and
•Considered and approved the Remuneration Policy in terms of Section 30A and 30B of the Companies Act amendments.
Audit Committee
As at June 30, 2026 the Audit Committee consisted of JA Holtzhausen (Chairman), KP Lebina and CD Flemming.
All members of the Audit Committee are independent according to the definition set out in the NYSE Rules. The committee’s charter
deals with all the aspects relating to its functioning.
The Audit Committee charter sets out the committee’s terms of reference which include responsibility for:
•appointment and oversight of external auditors, audit process and financial reporting;
•oversight of internal audit; and
•overseeing the integrated reporting and assurance model.
The Audit Committee meets each quarter with the external auditors, the company’s manager: risk and internal audit, and the CFO. The
committee reviews the audit plans of the internal auditors to ascertain the extent to which the scope of the audits can be relied upon to
detect weaknesses in internal controls. It also reviews the annual and interim financial statements prior to their approval by the Board.
The committee is responsible for making recommendations to appoint, reappoint or remove the external auditors, and the designated
external audit partner as well as determining their remuneration and terms of engagement. In accordance with its policy, the
committee preapproves all audit and non-audit services provided by the external auditors. BDO South Africa Inc. was reappointed by
shareholders at the last AGM on November 26, 2025 to perform DRDGOLD’s external audit function, such appointment was made by
the shareholders in accordance with the laws of South Africa and upon recommendation of the Board following the Audit Committee.
BDO South Africa Inc. has been the appointed auditors since 2023.
The internal audit function is performed in-house, with the assistance of Pro-Optima Audit Services Proprietary Limited. Internal audits
are performed at all DRDGOLD operating units and are aimed at reviewing, evaluating and improving the effectiveness of risk
management, internal controls and corporate governance processes.
Significant deficiencies, material weaknesses, instances of non-compliance and exposure to high risk and development needs are
brought to the attention of operational management for resolution and reported to the Audit Committee. The committee members have
access to all the records of the internal audit team.
DRDGOLD’s internal and external auditors have unrestricted access to the chairman of the Audit Committee and, where necessary, to
the chairman of the Board and the CEO. All significant findings arising from audit procedures are brought to the attention of the
committee and, if necessary, to the Board.
Section 404(a) of the Sarbanes-Oxley Act of 2002 stipulates that management is required to assess the effectiveness of the internal
controls surrounding the financial reporting process. The results of this assessment are reported in the form of a management
attestation report that is filed with the SEC as part of the Form 20-F. Additionally, DRDGOLD’s external auditors are required to express
an opinion on the effectiveness of internal controls over financial reporting, which is also contained in the Company’s Form 20-F.
DRDGold_Breadcrumbs_Logo_RGB.jpg
DRDGOLD Limited Form 20-F 2026
62
Risk Committee
As at June 30, 2026 the Risk Committee consisted of KP Lebina (Chairwoman), RA Brady, DJ Pretorius, TBVN Mnyango, CD
Flemming and TJ Cumming.
Roles and responsibilities:
•Oversee the development and annual review of a policy and plan for risk management to recommend for approval to the Board;
•Ensure that risk management assessments are performed on a continuous basis;
•Ensure that reporting on risk management is complete, timely, accurate and accessible;
•Oversee that the risk management plan is widely disseminated throughout the company and integrated in the day-to-day activities
of the company;
•Ensure that frameworks and methodologies are implemented to increase the possibility of anticipating unpredictable risks;
•Ensure that management considers and implements appropriate risk responses; and
•Ensure co-ordination with the audit committee who will be responsible for the risk management process as far as internal controls,
financial reporting and IT risks are concerned.
All members of the Risk Committee are independent according to the definition set out in the NYSE Rules, except for RA Brady and TJ
Cumming. It is chaired by an independent NED.
An important aspect of risk management is the transfer of risk to third parties to protect the company from disaster. DRDGOLD’s major
assets and potential business interruption and liability claims are therefore covered by the group insurance policy, which
encompasses all the operations. Most of these policies are held through insurance companies operating in the United Kingdom,
Europe and South Africa. The various risk-management initiatives undertaken within the group as well as the strategy to reduce costs
without compromising cover have been successful and resulted in substantial insurance cost savings for the Group.
Social and Ethics Committee
As at June 30, 2026, the Social and Ethics Committee consisted of EA Jeneker (Chairman), H Hooijer, TBVN Mnyango and CD
Flemming.
The Social and Ethics Committee is a statutory body established in terms of section 72 of the Companies Act, 2008; the objectives of
which are to facilitate transformation and sustainable development by, inter alia, promoting transformation within the Company and
economic empowerment of previously disadvantaged communities particularly within the areas where the Company conducts
business; striving towards achieving the goal of equality as the South African Constitution and other legislation require within the
context of the demographics of the country at all levels of the Company and its subsidiaries; and conducting business in a manner
which is conducive to internationally acceptable environmental and sustainability standards.
The following terms of reference were approved by the Board to enable the committee to function effectively. These are to be
responsible for and make recommendations to the Board with respect to the following matters:
•monitor the Company’s activities regarding the 10 principles set out in the United Nations Global Compact Principles and the
Organisation for Economic Co-operation and Development recommendations regarding Corruption, the Global Industry Standards
on Tailings Management, the United Nations SDGs. the Employment Equity Act and the Broad Based Black Economic
Empowerment Act;
•maintaining records of sponsorship, donations and charitable giving;
•reviewing matters relating to the environment, health and public safety, including the impact of the company’s activities and of its
products or services;
•reviewing matters relating to labor and employment;
•reviewing and recommending the company’s code of ethics;
•reviewing and recommending any corporate citizenship policies; and
•reviewing significant cases of employee conflicts of interests, misconduct or fraud, or any other unethical activity by employees or
the Company.
Investment Committee
As at June 30, 2026, the Investment Committee consisted of KP Lebina (Chairwoman),  TJ Cumming,  JA Holtzhausen, EA Jeneker
and RA Brady.
The Investment Committee assist the Board to oversee the allocation of capital and investment activities in line with the Company's
strategy.
Roles and responsibilities:
•Assess capital projects and investment opportunities;
•Seek to ensure that project and investment guidelines and other procedures for the allocation of capital are consistently and
properly applied;
•Consider and recommend to the Board potential projects, acquisitions and disposals in line with strategy;
•Ensures due diligence procedures are followed; and
•Monitors progress throughout the project lifecycle and periodically reports any findings to the Board.
With effect from September 1, 2026, the Board resolved to dissolve the Investment Committee. Matters previously falling within the
scope of the Investment Committee's mandate are considered and dealt with directly by the Board, which retains oversight of the
Company's investment, capital allocation and strategic transaction decisions.
DRDGold_Breadcrumbs_Logo_RGB.jpg
DRDGOLD Limited Form 20-F 2026
63
6D. EMPLOYEES
Employees
The total number of employees at June 30, 2026, of 3,975 comprises 3,107 specialized service providers and 868 employees who are
directly employed by us and our subsidiary companies. Of the 868 employees directly employed by us and our subsidiary
companies, 11 employees are on a fixed term employment contract.
The total number of employees at June 30, 2025, of 3,410 comprises 2,517 specialized service providers and 893 employees who are
directly employed by us and our subsidiary companies. Of the 893 employees directly employed by us and our subsidiary
companies, 47 employees are on a fixed term employment contract.
The total number of employees at June 30, 2024, of 2,956 comprises 2,053 specialized service providers and 903 employees who are
directly employed by us and our subsidiary companies. Of the 903 employees directly employed by us and our subsidiary
companies, 27 employees are on a fixed term employment contract.
All of our employees are based at our operations that operate exclusively in South Africa.
Labor Relations
As at June 30, 2026, approximately 86% of our Ergo employees and 61% of our FWGR employees are members of trade unions or
employee associations. South Africa's labor relations environment remains a platform for social reform. The National Union of
Mineworkers, (“NUM”), one of the main South African mining industry unions, is influential in the tripartite alliance between the ruling
African National Congress, the Congress of South African Trade Unions, (“COSATU”), and the South African Communist Party as it is
the biggest affiliate of COSATU. The relationship between management and labor unions remains cordial. The organized labor
coordinating forum meets regularly to discuss matters pertinent to both parties.
A four-year wage agreement was reached with organized labor at FWGR in November 2024. A five-year wage agreement was
reached with organized labor at Ergo in February 2026 providing the operation with labor stability for a reasonable period of time.
We recognize the need for transformation and have put systems and structures in place to address this at both management and
Board level. We aim to recruit in line with our transformational objectives. The composition of the Board of Directors specifically,
changed significantly over the past three fiscal years and is more diverse and reflective of transformation and South Africa’s
demographics.
Safety statistics
Due to the importance of our labor force, we continuously strive to create a safe and healthy working environment. The following are
our fiscal 2026 overall safety statistics for our operations:
(Per million man hours)
Ergo
FWGR
Consolidated
Year ended
Year ended
Year ended
2026
2025
2026
2025
2026
2025
Lost time injury frequency rate (LTIFR)1
1.59
1.72
0.86
1.23
1.25
1.63
Reportable incidence frequency rate
(RIFR)1
0.43
0.72
—
1.23
0.27
0.81
Fatalities
—
—
—
—
—
—
1Calculated as follows: actual number of instances divided by the total number of man hours worked multiplied by one million.
6E. SHARE OWNERSHIP
To the best of our knowledge, we believe that our ordinary shares held by directors and prescribed officers, in aggregate, do not
exceed one percent of the Company’s issued ordinary share capital. For details of share ownership of directors and prescribed
officers see "Item 7A. Major Shareholders".
As of June 30, 2026, directors and prescribed officers do not hold any options to purchase ordinary shares.
Closed periods apply to share trading by directors, prescribed officers and other employees, whenever persons become or could
potentially become aware of material price sensitive information, such as information relating to an acquisition, bi-annual results etc.,
which is not in the public domain. When these persons have access to this information an embargo is placed on share trading for
those individuals concerned. The embargo need not involve the entire Company in the case of an acquisition and may only apply to
the Board of directors, executive committee, and the financial and new business teams, but in the case of interim and year-end results
the closed-period is group-wide.
Below we describe the equity settled long term incentive schemes for the Group:
Equity-Settled Long-Term Incentive Scheme (“ELTI”)
On December 2, 2019 shareholders approved the Equity-Settled Long-Term Incentive Scheme (“ELTI”) to replace the Cash-Settled
Long-Term Incentive Scheme.
Equity settlement
The ELTI is an equity-settled scheme. Settlement may be affected through market purchases of DRDGOLD ordinary shares, the issue
of authorized but unissued shares, or treasury shares.
Participants
Eligible participants are permanent employees of the Company and its subsidiaries in Category 19 and above, including executive
directors but excluding non-executive directors.
DRDGold_Breadcrumbs_Logo_RGB.jpg
DRDGOLD Limited Form 20-F 2026
64
Award of Conditional Shares
The Remuneration Committee may annually award Conditional Shares comprising:
•Performance shares; and
•Retention shares.
Participants are not required to pay for awards or shares delivered upon vesting.
Awards are granted as follows:
•80% Performance Shares; and
•20% Retention Shares.
The target award value will be referenced to market-related award quanta, and will be adjusted based upon individual performance
as follows:
Individual Rating
% of Target Value Awarded
< 2.75
0%
2.75 to < 3.00
50%
3.0 to < 3.75
100%
3.75 to < 4.5
133.33%
4.5 to < 5.0
166.67%
5.0
200%
Dividend and voting rights
The Conditional Share Awards carry no dividend or voting rights, until vesting and settlement.
Vesting conditions
The first ELTI award was granted on December 2, 2019. Awards vest in two tranches:
•50% on the second anniversary of grant; and
•50% on the third anniversary of grant,
subject to the participant remaining employed by the Group until the applicable vesting date.
Retention shares
100% of the retention shares will vest if the employee remains in the employ of the Company at vesting date and individual
performance criteria are met.
Performance shares
Total shareholder’s return (“TSR”) measured against a hurdle rate of 15% referencing DRDGOLD’s Weighted Average Cost of Capital
“WACC”:
•50% of the performance shares are linked to this condition; and
•all of these performance shares will vest if DRDGOLD’s TSR exceeds the hurdle rate over the vesting period.
TSR measured against a peer group of 3 peers (Sibanye-Stillwater, Harmony Gold Mining Company Limited and Pan-African
Resources Limited):
•50% of the performance shares are linked to this condition; and
•The number of performance shares which vest is based on DRDGOLD’s actual TSR performance in relation to percentiles of peer
group’s performance as follows:
Percentile of Peers
% of Conditional Shares Vesting
< 25th percentile
0%
25th to < 50th percentile
25%
50th to < 75th percentile
75%
≥ 75th percentile
100%
Awarded Conditional Shares which do not Vest to the Participant, as a result of forfeiture or which lapse, revert back to the Scheme.
Share Limits
Overall Company Limit
The aggregate number of Shares at any one time which may be awarded for Settlements under the Scheme shall not exceed
34,500,000 (thirty four million, five hundred thousand) Shares (representing approximately 4.95% of the total issued share capital of
the Company at the date of this Notice).
Individual Limit
Subject to certain dilution adjustments, the aggregate number of Shares at any one time which may be awarded under the Scheme to
any one Participant shall not exceed 14,500,000 Shares.
The last grant in terms of the ELTI scheme was made on October 22, 2024. The ELTI scheme is replaced by the Single Incentive Plan
("SIP"), incorporating the Deferred Share Plan ("DSP").
DRDGold_Breadcrumbs_Logo_RGB.jpg
DRDGOLD Limited Form 20-F 2026
65
Single incentive plan
To remain aligned with the latest developments in remuneration policy and to stay current with the demands of governance as well as
remain competitive within the industry, the Remuneration Committee conducted a review of the current short-term and long-term
incentive schemes, with the assistance of external independent advisors. The outcome of the review informed the introduction of a
new simplified, Single Incentive Plan incorporating a deferred share plan, which replaced the previous scheme in fiscal year 2025.
The new plan was approved by the shareholders at the 2023 Annual General Meeting ("AGM") and implemented in the 2025 fiscal
year.
The Single Incentive Plan recognises the difficulties in setting stretching but realistic performance targets in a volatile economic
environment. Its aim is to move beyond measurement criteria which are focused on inflexible financial performance, much of which is
driven by two factors totally beyond management control namely, the gold price and exchange rates, and give balanced weightings
to financial and non-financial measures to ensure executives and senior management are held to appropriate pay-for-performance
standards without being penalised or rewarded unduly for factors outside their control.
The Single Incentive Plan ("SIP") consists of a Single Incentive Policy (“Policy”) incorporating the Deferred Share Plan (“DSP”).
Salient features of the DRDGOLD single incentive policy
Single incentive plan
Components and
determination:
Single Incentive = Incentive Free Cash Flow Portion + Scorecard Portion
whereby:
Incentive Free Cash Flow Portion = incentive free cash flow ("IFCF") for the relevant financial year1 x
10% x personal share percentage2.
Scorecard Portion = personal Cost-to-company x scorecard on-target percentage x performance
multiplier.
1IFCF is defined with reference to cash generated from operating activities, less sustaining capex. In the
budgeting process, if the Group believes that any capex, investment or other items should be excluded or
amortised or treated in any different way for determining IFCF at the end of the year, they may make
representations to the committee on the treatment of such item/s for the purposes of calculating IFCF for
the IFCF Pool.
2The individual’s incentive free cashflow portion is capped at a percentage of their Cost to Company
(CTC) based on the applicable Paterson band in which they are employed. The personal share
percentage is determined jointly by the Chief Executive Officer and the Chief Financial Officer and
approved by the Remuneration Committee.
Participants
Active employees from category 19 to 26 excluding non-executive directors. (Paterson band D Upper to F
Upper).
Pay-out form
Cash payment (short-term component)
Cash payment = Single Incentive x 67%
DRDGOLD Shares (long-term component)
Deferred DRDGOLD shares =
Single Incentive x 33% + any approved retention
award
Pay-out period
Settled annually for all employees
Vesting in tranches over five years for Category 25
and 26 (F-band) and over three years for Category
19 to 24 (D Upper - E Upper) participants, without
further performance conditions and subject to
continued employment.
Basis of award
Group and individual scorecards for initial award.
Safeguards
The quantum and award of the Single Incentive will be tested against certain safeguards including a
specified percentage of profit before tax and a 1% limitation on the total number of DRDGOLD shares in
issue during that year.
Scorecard On-target
percentages and
weightings
Strategic Level
Typical title
Paterson
grade
Scorecard
On-target
Percentage
Performance Multiplier
Weighting
Company
Personal
Top Management,
Strategic Intent
CEO
F Upper
90%
90%
10%
CFO
F Lower
75%
90%
10%
General Management,
Strategic Execution
General
Managers
E Upper
60%
90%
10%
Senior and Middle
Management
Heads of
Department
E Lower
45%
90%
10%
Middle management,
qualified and experienced
professionals
D Upper
45%
90%
10%
DRDGold_Breadcrumbs_Logo_RGB.jpg
DRDGOLD Limited Form 20-F 2026
66
Group scorecard
Area
Measure
Weight
Threshold
Target
Stretch
Measures
0%
100%
200%
Shareholders (20%)
Relative total
shareholder return
10.0%
Median
Halfway
between
median / upper
quartile
Upper
quartile
Relative to that of
comparators
Return on equity
10.0%
Cost of equity
Cost of equity
plus 3%
Cost of
equity plus
6%
Return higher than weighted
average cost of capital
Financial (30%)
Cash operating
cost (R/ton)
10.0%
115%x Budget
110%x Budget
Budget
Based on the achievement
vs budget, noting that
budget is already a stretch
target since it is based on
“nameplate” capacity without
de-risking for probable
downtime.
Cash operating
cost (R/kg)
10.0%
All-in sustaining
cost (R/kg)
10.0%
Operations (25%)
Production (kgs)
15.0%
85%x Budget
90%x Budget
Budget
Based on the achievement
vs budget, noting that
budget is already a stretch
target since it is based on
“nameplate” capacity without
de-risking for probable
downtime.
Throughput (tons)
10.0%
Current scorecard
modifier evaluation
(ESG factors) (10%)
Environmental
2.0%
Under-
performance
Meets
expectations
Exceptional
Based on current scorecard
modifier evaluation, a
portfolio of evidence
compiled.
Health & safety
2.0%
Local economic
development
2.0%
Human resources
development
2.0%
Transformation
2.0%
Strategic Capital
Spend Vision 2028
(15%)
Schedule
10.5%
85%x Schedule
90%x Schedule
Schedule
Based on achieving critical
milestones as per the project
schedule.
Budget
4.5%
115%x Budget
110%x Budget
Budget
Based on budgeted growth
capex.
Performance will be assessed based on the following:
•For "threshold performance", 0% will be scored for that performance area.
•For "on-target performance", 100% will be scored for that performance area.
•For "stretch performance", 200% will be scored for that performance area.
•Linear vesting will be applied between threshold, on-target and stretch.
Notes
1.In addition to the financial conditions in the scorecard, free cash flow is reflected in the separate free cash flow portion of the incentive and in the
determination of the cash vs deferred portion of the Single Incentive
2.Retention award means a discretionary award of deferred shares
3.In addition to the modifier scorecard evaluation, failures in governance and environmental compliance are considered in the malus and clawback
provisions of the Single Incentive
4.In addition to the safety condition measured in terms of LTIFR, fatalities are considered in the malus and clawback provisions for the Single Incentive
DRDGold_Breadcrumbs_Logo_RGB.jpg
DRDGOLD Limited Form 20-F 2026
67
Termination and adjustment rules
Active employees
Participation is only for active employees within the category 19-26 band, unless
determined by the Remuneration Committee. “Active” excludes employees serving
their notice period.
Temporary occupation
Any person temporarily occupying a position is not eligible to participate in the SI
scheme based on this temporary position.
Determination period
Annually.
Eligibility and value
Subject to the Remunerations Committee's discretion.
Service period
Employee must be rendering services in the year the SI relates to.
New appointment
Pro-rated based on the number of months served during the applicable period.
No-fault termination
Awards and vesting in line with the SIP rules.
Pending disciplinary/poor work
performance
Award or settlement suspended until proceedings concluded. Grant or settlement
at the Remunerations Committee's discretion.
6F. ACTION TO RECOVER ERRONEOUSLY AWARDED COMPENSATION
Not applicable.
ITEM 7. MAJOR SHAREHOLDERS AND RELATED PARTY TRANSACTIONS
7A. MAJOR SHAREHOLDERS
On August 27, 2025, 1,726,955 new ordinary shares were issued in terms of the employee SIP incorporating the DSP. A further
1,082,033 new ordinary shares were issued in terms of the ELTI scheme on October 20, 2025, for the purposes of settling the
conditional shares vesting on October 19, 2025.
As of June 30, 2026, our issued capital consisted of:
•867,397,699 ordinary shares of no par value; and
•5,000,000 cumulative preference shares.
To our knowledge, as of June 30, 2026, we were not directly or indirectly owned or controlled by another corporation or any person or
foreign government, other than the controlling interest held by Sibanye-Stillwater.
On July 31, 2018, 265 million ordinary shares were issued to Sibanye-Stillwater as settlement of the purchase consideration for the
acquisition of the WRTRP Assets. On January 8, 2020, Sibanye-Stillwater exercised the option granted to it to subscribe for such
number of new ordinary shares in the share capital of DRDGOLD for cash resulting in Sibanye-Stillwater holding in aggregate 50.1%
of all DRDGOLD shares in issue (including treasury shares). Sibanye-Stillwater subscribed for 168,158,944 Subscription Shares at an
aggregate subscription price of R1,086 million, on January 22, 2020. The Subscription Shares were allotted and issued at a price of
R6.46 per share, being a 10% discount to the 30-day volume weighted average traded price. During August 2025, Sibanye-Stillwater
purchased 1.4 million additional shares in the market due to the new share issuances made by the Company to settle its employee
share plan, as described in "Item 6E. Share Ownership". Accordingly, Sibanye-Stillwater's shareholding as at June 30, 2026 remained
at 50.1%.
Subsequent to year end, 1,358,826 new ordinary shares were issued in terms of the employee SIP incorporating the DSP on
September 2, 2026, increasing the total issued ordinary shares to 868,756,525.
Other than the above, there are no arrangements, the operation of which may at a subsequent date result in a change in control of us.
Based on information available to us, as of June 30, 2026:
•there were 15,596 record holders of our ordinary shares, including those shares held as part of our ADR program;
•there were 476 registered holders of our ADRs in the United States, who held approximately 174,442,067 shares (17,444,207 ADRs)
or approximately 20.11% of our ordinary shares; and
•there was one record holder of our cumulative preference shares in South Africa, who held 5,000,000 cumulative preference shares
or 100% of our cumulative preference shares.
The following table sets forth information regarding the beneficial ownership of our ordinary shares as of June 30, 2026 by:
•each of our directors and prescribed officers; and
•any person whom the directors are aware of as at June 30, 2026 who is interested directly or indirectly in 1% or more of our ordinary
shares.
DRDGold_Breadcrumbs_Logo_RGB.jpg
DRDGOLD Limited Form 20-F 2026
68
Shares Beneficially owned
Holder
Number
Percent of outstanding
ordinary shares
Directors/prescribed officers
D.J. Pretorius
999,816
*
H Hooijer
161,940
*
W.J. Schoeman
25,000
*
Other
SIBANYE GOLD PROPRIETARY LIMITED
434,558,944
50.10%
JP MORGAN CHASE BANK
174,442,067
20.11%
GOVERNMENT EMPLOYEES PENSION FUND
69,967,412
8.07%
CITICLIENT NOMINEES NO 8
17,066,659
1.97%
ALLAN GRAY
13,426,553
1.55%
VANGUARD TOTAL INTERNATIONAL STOCK
13,270,512
1.53%
*Indicates share ownership of less than 1% of our outstanding ordinary shares.
No ordinary shareholder has voting rights which differ from the voting rights of any other ordinary shareholder.
Cumulative Preference Shares
Randgold and Exploration Company Limited, or Randgold, owns 5,000,000 (100%) of our cumulative preference shares. Randgold's
registered address is Suite 25, Katherine & West Building, Corner of Katherine and West Streets, Sandown, Sandton, 2196.
The holders of cumulative preference shares do not have voting rights unless any preference dividend is in arrears for more than six
months. The terms of issue of the cumulative preference shares are that they carry the right, in priority to the Company's ordinary
shares, to receive a dividend equal to 3% of the gross future revenue generated by the exploitation or the disposal of the Argonaut
mineral rights acquired from Randgold in September 1997. Additionally, holders of cumulative preference shares may vote on
resolutions which adversely affect their interests and on the disposal of all, or substantially all, of our assets or mineral rights. There is
currently no active trading market for our cumulative preference shares. Holders of cumulative preference shares will only obtain their
potential voting rights once the Argonaut Project becomes an operational gold mine, and dividends accrue to them. The prospecting
rights have since expired and the Argonaut Project terminated. The development of the project is not expected to materialize and
therefore no dividend is expected to be paid.
7B. RELATED PARTY TRANSACTIONS
Transactions with related parties are disclosed in "Item 18. Financial Statements - Note 5.1 – Cost of sales"
Balances owing to related parties are disclosed in "Item 18. Financial Statements - Note 15 - Trade and other payables"
Remuneration paid to key management is disclosed in "Item 18. Financial Statements - Note 18.2 – Transactions with key
management personnel."
Interest in subsidiaries is disclosed in "Item 18. Financial Statements - Note 21 - Interest in subsidiaries."
Subsidiary held for sale is disclosed in "Item 18. Financial Statements - Note 22 - Asset held for sale."
Refer to "Item 18. Financial Statements - Note 28 - Related parties."
7C. INTERESTS OF EXPERTS AND COUNSEL
Not applicable.
ITEM 8. FINANCIAL INFORMATION
8A. CONSOLIDATED STATEMENTS AND OTHER FINANCIAL INFORMATION
1.Please refer to "Item 18. Financial Statements".
2.Please refer to "Item 18. Financial Statements".
3.Please refer to "Item 18. Financial Statements".
4.The last year of audited financial statements is not older than 15 months.
5.Not applicable.
6.Not applicable.
7.Please refer to "Item 4D. Property, plant and equipment—Legal aspects and permitting".
8.DRDGOLD’s dividend policy is to return excess cash over and above the predetermined cash buffer and cash that has
been reserved for specific capital projects to its shareholders. Dividends are proposed by the Audit Committee and
approved by the Board based on the quarterly management accounts presented to the Board. Please refer to "Item 10B.
Memorandum and articles of association".
DRDGold_Breadcrumbs_Logo_RGB.jpg
DRDGOLD Limited Form 20-F 2026
69
8B. SIGNIFICANT CHANGES
Significant changes that have occurred since June 30, 2026, the date of the last audited financial statements included in this Annual
Report, are discussed in the relevant notes to the financial statements under "Item 18. Financial Statements".
ITEM 9. THE OFFER AND LISTING
9A. OFFER AND LISTING DETAILS
The principal trading market for our equity securities is the Johannesburg Stock Exchange (“JSE”) (symbol: DRD). In addition, our
ordinary shares have a secondary listing on A2X, where trading commenced on September 5, 2023, and our ADRs trade on the New
York Stock Exchange (symbol: DRD).
The ADRs are issued by JPMorgan Chase Bank, N.A, as depositary and managed by transfer secretary, Computershare Shareowner
Services. Each ADR represents one ADS and each ADS represents ten of our ordinary shares. Until July 23, 2007, each ADS
represented one of our ordinary shares.
The cumulative preference shares are not traded on any exchange.
There have been no trading suspensions with respect to our ordinary shares on the JSE during the past three years ended June 30,
2026, nor have there been any trading suspensions with respect to our ADRs on the New York Stock Exchange since our listing on
that market.
9B. PLAN OF DISTRIBUTION
Not applicable.
9C. MARKETS
See “Offer and Listing Details” above.
9D. SELLING SHAREHOLDERS
Not applicable.
9E. DILUTION
Not applicable.
9F. EXPENSES OF THE ISSUE
Not applicable.
ITEM 10. ADDITIONAL INFORMATION
10A. SHARE CAPITAL
Not applicable.
10B. MEMORANDUM AND ARTICLES OF ASSOCIATION
As of June 30, 2026, we had authorized for issuance 1,500,000,000 ordinary shares of no par value, and 5,000,000 cumulative
preference shares of R0.10 par value. On this date, we had issued 867,397,699 ordinary shares. On September 2, 2026, 1,358,826
new ordinary shares were issued in terms of the SIP incorporating the DSP, increasing the issued ordinary shares as of September 30,
2026 to 868,756,525.
Set out below are brief summaries of certain provisions of our Memorandum of Incorporation ("MOI"), the Companies Act of South
Africa and the JSE Listings Requirements, all as in effect on June 30, 2026. The summary does not purport to be complete and is
subject to and qualified in its entirety by reference to the full text of the MOI, the Companies Act, and the JSE Listings Requirements.
We are registered under the Companies Act of South Africa under registration number 1895/000926/06. As set forth in our MOI, the
main object and business of our company is mining and exploration for gold and other minerals.
Borrowing Powers
Our directors may from time to time borrow for the purposes of the Company, such sums as they think fit, and secure the payment or
repayment of any such sums, or any other sum, as they think fit, whether by the creation and issue of securities, mortgage or charge
upon all or any of the property or assets of the Company. The directors shall procure that the aggregate principal amount at any one
time outstanding in respect of monies so borrowed or raised by the Company and all the subsidiaries for the time being of the
Company shall not exceed the aggregate amount at that time authorized to be borrowed or secured by the Company or the
subsidiaries for the time being of the Company (as the case may be).
Share Ownership Requirements
Our directors are not required to hold any shares to qualify or be appointed as a director.
DRDGold_Breadcrumbs_Logo_RGB.jpg
DRDGOLD Limited Form 20-F 2026
70
Voting by Directors
A director may authorize any other director to vote for him at any meeting at which neither he nor his alternate director appointed by
him is present. Any director so authorized shall, in addition to his own vote, have a vote for each director by whom he is authorized.
The quorum necessary for the transaction of the business of the directors is a majority of the directors present at a meeting before a
vote may be called at any meeting of directors.
Directors are required to notify our Board of directors of interests in companies and contracts. If a director has a personal financial
interest in respect of a matter to be considered at a meeting of the Board he or she must disclose the interest and its nature, any
material information relating to the matter and thereafter leave the meeting immediately after making the disclosure. Such director
must not take part in consideration of the matter. He is not to be regarded as being present for the purpose of determining whether a
resolution has sufficient support to be adopted.
The King V Report on Corporate Governance for South Africa, 2025 (King V) was released on October 31, 2025, superseding King IV,
and is effective for financial years commencing on or after January 1, 2026, with early adoption encouraged. The Company did not
elect to early adopt King V and has therefore continued to apply and report against the principles of King IV during the current
reporting period. Like its predecessor, King V follows an "apply and explain" application regime, requiring organizations to
meaningfully demonstrate how the governance principles have been applied in practice. The JSE Limited continues to require listed
companies to apply the King corporate governance principles as incorporated into the JSE Listings Requirements.
The remuneration of non-executive directors is typically determined by the Board, but subject to approval by the shareholders at the
AGM of the Company. In terms of section 65(11)(h) of the Companies Act, 2008 read with sections 66(8) and 66(9) thereof,
remuneration may only be paid to directors for their services as directors in accordance with a special resolution approved by the
shareholders within the previous 2 (two) years.
Under South African common law, directors are required to comply with certain fiduciary duties to the company and to exercise
proper care and skill in discharging their responsibilities. These common law duties have now been codified by the Companies Act.
Age Restrictions
There is no age limit for directors.
Election of Directors
Each director shall be appointed by election by way of an ordinary resolution of shareholders at a general or annual meeting of the
company (“elected director (s)”) and no appointment of a director by way of a written circulated shareholders resolution in terms of
section 60 of the Companies Act shall be competent.
One third of our directors, on a rotating basis, are subject to re-election at each annual general shareholder’s meeting. Retiring
directors usually make themselves available for re-election. An amendment to the MOI which also subjects executive directors to re-
election by rotation was approved by shareholders at the 2014 annual general meeting.
General Meetings
On the request of any shareholder or shareholders holding not less than 10 percent of our share capital which carries the right of
voting at general meetings, we shall issue a notice to shareholders convening a general meeting for a date not less than 15 days from
the date of the notice. Directors may convene general meetings at any time.
Our annual general meeting and a meeting of our shareholders for the purpose of passing a special resolution may be called by
giving 15 days advance written notice of that meeting. For any other general meeting of our shareholders, 15 days advance written
notice is required.
Our MOI provides that if at a meeting convened upon request by our shareholders, a quorum is not present within fifteen minutes after
the time selected for the meeting, such meeting shall be postponed for one week. However the chairman has the discretion to extend
the fifteen minutes for a reasonable period on certain grounds. The necessary quorum is three members present with sufficient voting
powers in person or by proxy to exercise in aggregate 25% of the voting rights.
Voting Rights
The holders of our ordinary shares are generally entitled to vote at general meetings and on a show of hands have one vote per
person and on a poll have one vote for every share held. The holders of our cumulative preference shares are not entitled to vote at a
general meeting unless any preference dividend is in arrears for more than six months at the date on which the notice convening the
general meeting is posted to the shareholders. Additionally, holders of cumulative preference shares may vote on resolutions which
adversely affect their interests and on resolutions regarding the disposal of all or substantially all of our assets or mineral rights. When
entitled to vote, holders of our cumulative preference shares are entitled to one vote per person on a show of hands and that portion of
the total votes which the aggregate amount of the nominal value of the shares held by the relevant shareholder bears to the aggregate
amount of the nominal value of all shares issued by us.
Dividends
We may, in certain circumstances in a general meeting, or our directors may, from time to time, declare a dividend to be paid to the
shareholders in proportion to the number of shares they each hold. No dividend shall be declared except out of our profits. Dividends
may be declared either free or subject to the deduction of income tax or duty in respect of which we may be charged. Holders of
ordinary shares are entitled to receive dividends as and when declared by the directors.
Ownership Limitations
There are no limitations imposed by our MOI or South African law on the rights of shareholders to hold or vote on our ordinary shares
or securities convertible into our ordinary shares.
DRDGold_Breadcrumbs_Logo_RGB.jpg
DRDGOLD Limited Form 20-F 2026
71
Winding-up
If we are wound-up, then the assets remaining after payment of all of our debts and liabilities, including the costs of liquidation, shall
be applied to repay to the shareholders the amount paid up on our issued capital and thereafter the balance shall be distributed to the
shareholders in proportion to their respective shareholdings. On a winding up, our cumulative preference shares rank, in regard to all
arrears of preference dividends, prior to the holders of ordinary shares. As of June 30, 2026, no such dividends have been declared.
Except for the preference dividend and as described in this Item our cumulative preference shares are not entitled to any other
participation in the distribution of our surplus assets on winding-up.
Reduction of Capital
We may, by special resolution, reduce the share capital authorized by our MOI, or reduce our issued share capital including, without
limitation, any stated capital, capital redemption reserve fund and share premium account by making distributions and buying back
our shares.
Amendment of the MOI
Our MOI may be altered by the passing of a special resolution or in compliance with a court order. The Company may also amend the
MOI by increasing or decreasing the number of authorized shares, classifying or reclassifying shares, or determining the terms of
shares in a class. A special resolution is passed when the shareholders holding at least 25% of the total votes of all the members
entitled to vote are present or represented by proxy at a meeting and, if the resolution was passed on a show of hands, at least 75% of
those shareholders voted in favor of the resolution and, if a poll was demanded, at least 75% of the total votes to which those
shareholders are entitled were cast in favor of the resolution. An amendment to the MOI to increase the number of authorized shares
was approved by shareholders at the 2018 general meeting on March 28, 2018.
Consent of the Holders of Cumulative Preference Shares
The rights and conditions attaching to the cumulative preference shares may not be cancelled, varied or added, nor may we issue
shares ranking, regarding rights to dividends or on winding up, in priority to or equal with our cumulative preference shares, or
dispose of all or part of the Argonaut mineral rights without the consent in writing of the registered holders of our cumulative
preference shares or the prior sanction of a resolution passed at a separate class meeting of the holders of our cumulative preference
shares.
Distributions
We are authorized to make payments in cash or in specie to our shareholders in accordance with the provisions of the Companies Act
and other consents required by law from time to time. We may, for example, in a general meeting, upon recommendation of our
directors, resolve that any surplus funds representing capital profits arising from the sale of any capital assets and not required for the
payment of any fixed preferential dividend, be distributed among our ordinary shareholders. However, no such profit shall be
distributed unless we have sufficient other assets to satisfy our liabilities and to cover our paid up share capital. We also need to
consider the solvency and liquidity requirements stated in the Companies Act of South Africa.
Directors’ power to vote compensation to themselves
The remuneration of non-executive directors may not exceed in any financial year the amount fixed by the Company in a general
meeting. The Companies Act requires that remuneration to non-executive directors may be paid only in accordance with a special
resolution approved by shareholders within the previous two years.
Time limit for dividend entitlement
All unclaimed monies that are due to any shareholder/s shall be held by the company in trust for an indefinite period until lawfully
claimed by such shareholder/s, subject to the Prescription Act,1969 as amended or any other law which governs the law of
prescription.
Staggered director elections & cumulative voting
At each annual general meeting of the Company one-third of the directors shall retire and be eligible for re-election. No provision is
made for cumulative voting.
Sinking fund provisions and liability to further capital calls
There are no sinking fund provisions in the MOI attaching to any class of the company shares, and the company does not subject
shareholders to liability to further capital calls.
Provision that would delay/prevent change of control
The Companies Act provides that companies which propose to merge or amalgamate must enter into a written agreement setting out
the terms thereof. They must prove that upon implementation of the amalgamation or merger each will satisfy the solvency and
liquidity test. Companies involved in disposals, amalgamations or mergers, or schemes of arrangement must obtain a compliance
certificate from the Takeover Regulation Panel, pass special resolutions and in some instances they must obtain an independent
expert report.
DRDGold_Breadcrumbs_Logo_RGB.jpg
DRDGOLD Limited Form 20-F 2026
72
10C. MATERIAL CONTRACTS
R500 million General Banking Facility and R1,500 million Revolving Credit Facility
DRDGOLD secured a R500 million general bank facility (“GBF”) with Nedbank Limited (acting through its Corporate and Investment
banking division) (“Nedbank”) on June 28, 2024, as we embark on our expanded capital program for repositioning in 2028. In
addition to the GBF, on July 31, 2024, DRDGOLD entered into a five-year R1 billion Revolving Credit facility (“RCF”) with a
R500 million accordion option with Nedbank.
The GBF bears interest at the South African Prime Interest Rate less 250 basis points nominal annual compounded monthly.
DRDGOLD is required to pay a 20 basis points (excluding VAT) per annum unutilized facility fee calculated on the average monthly
unutilized portion of the GBF. There are no financial covenants related to the GBF. Pursuant to the conclusion of the RCF described
below, an amended and restated facility letter was entered into on August 8, 2024 in order to incorporate the terms of the RCF.
DRDGOLD may elect an interest period of one or three months for a loan drawn down against the RCF facility. Loans with a one
month interest period bear interest at JIBAR plus a margin of 1.5779% and loans with a three month interest period bear interest at
JIBAR plus 1.58%. A commitment fee of 30% of the margin that applies to loans with an interest period of 3 months per annum applies
on the available commitment for the availability period. A utilization fee of 0.1% per annum applies on each loan for each day that the
aggregate of the loans is more than 33.33% but less than 66.67% of the commitment and 0.2% per annum on each loan for each day
that the aggregate of the loans is equal to or more than 66.67% of the commitment. A debt origination fee of 0.25% of the committed
R1 billion was applicable.
Relevant financial covenants pertaining to the RCF include that at each measurement date and for the measurement period(1) to which
such measurement date relates(i) the interest cover ratio(2) shall not be less than 4 times and (ii) the leverage ratio shall not exceed 2
times net debt(3) to adjusted EBITDA Ratio shall not exceed 2 times.
(1)"Interest Cover" means the ratio of EBITDA to Net Finance Charges in respect of any Relevant Period.
(2)"Total Net Debt" means, at any time, the aggregate amount of all obligations of members of the Group for or in respect of Borrowings.
During financial year 2025, the GBF was amended to include a R120 million guarantees facility. During fiscal year 2026 this was
increased by an additional R61 million, increasing the guarantee facility to R181 million, which has been fully utilized.
The description of the GBF and the RCF is qualified by reference to the GBF and the RCF agreements filed herewith as Exhibits.
Agreement to construct the RTSF
FWGR is currently constructing the RTSF to complete phase 2 of its life-of-mine plan and to generate sufficient tailings capacity for
further expansion to the western side of Johannesburg by acquiring more resources. In June 2024, FWGR entered into an agreement
with Stefanutti Stocks Inland, a division of Stefanutti Stocks Proprietary Limited (“Stefanutti Stocks”), pursuant to which Stefanutti
Stocks will construct the RTSF.
The contract price for the construction amounts to R1.3 billion and will be settled based on certain specified payment milestones.
Each payment milestone will be determined based on percentage of  work completed and a bill of quantities and is expected to be
settled in full by fiscal year 2027.
10D. EXCHANGE CONTROLS
The following is a summary of the material South African exchange control measures, which has been derived from publicly available
documents. The following summary is not a comprehensive description of all the exchange control regulations. The discussion in this
section is based on the current law and positions of the South African Government. Changes in the law may alter the exchange control
provisions that apply, possibly on a retroactive basis.
Introduction
Dealings in foreign currency, the export of capital and revenue, payments by residents to non-residents and various other exchange
control matters in South Africa are regulated by the South African Exchange Control Regulations, or the "Regulations". The Regulations
form part of the general monetary policy of South Africa. The Regulations are issued under Section 9 of the Currency and Exchanges
Act, 1933 (as amended). In terms of the Regulations, the control over South African capital and revenue reserves, as well as the
accruals and spending thereof, is vested in the Treasury (Ministry of Finance), or the Treasury.
The Treasury has delegated the administration of exchange controls to the Financial Surveillance Department of the South African
Reserve Bank, or "SARB", which is responsible for the day to day administration and functioning of exchange controls. SARB has a
wide discretion. Certain banks authorized by the Treasury to co-administer certain of the exchange controls, are authorized by the
Treasury to deal in foreign exchange. Such dealings in foreign exchange by authorized dealers are undertaken in accordance with
the provisions and requirements of the Currency and Exchanges Manual for Authorised Dealers, or the Authorised Dealer Manual,
and contain certain administrative measures, as well as conditions and limits applicable to transactions in foreign exchange, which
may be undertaken by authorized dealers. Non-residents have been granted general approval, in terms of the Authorised Dealer
Manual, to deal in South African assets, to invest and disinvest in South Africa.
The Regulations provide for restrictions on exporting capital from the Common Monetary Area consisting of South Africa, Namibia,
and the Kingdoms of Lesotho and eSwatini. Transactions between residents of the Common Monetary Area are not subject to these
exchange control regulations.
There are many inherent disadvantages to exchange controls, including distortion of the price mechanism, problems encountered in
the application of monetary policy, detrimental effects on inward foreign investment and administrative costs associated therewith. The
South African Finance Minister has indicated that all remaining exchange controls are likely to be dismantled as soon as
circumstances permit. Since 1998, there has been a gradual relaxation of exchange controls. The gradual approach to the abolition of
exchange controls adopted by the Government of South Africa is designed to allow the economy to adjust more smoothly to the
removal of controls that have been in place for a considerable period of time. The stated objective of the authorities is equality of
treatment between residents and non-residents with respect to inflows and outflows of capital. The focus of regulation, subsequent to
the abolition of exchange controls, is expected to favor the positive aspects of prudential financial supervision.
DRDGold_Breadcrumbs_Logo_RGB.jpg
DRDGOLD Limited Form 20-F 2026
73
The present exchange control system in South Africa is used principally to control capital movements. South African companies are
not permitted to maintain foreign bank accounts without SARB approval and, without the approval of SARB, are generally not
permitted to export capital from South Africa or hold foreign currency. In addition, South African companies are required to obtain the
approval of the SARB prior to raising foreign funding on the strength of their South African statements of financial position, which
would permit recourse to South Africa in the event of defaults. Where 75% or more of a South African company's capital, voting power,
power of control or earnings is directly or indirectly controlled by non-residents, such a corporation is designated an “affected person”
by the SARB, and certain restrictions are placed on its ability to obtain local financial assistance. We are not, and have never been,
designated an “affected person” by the SARB.
Foreign investment and outward loans by South African companies are also restricted. In addition, without the approval of the SARB,
South African companies are generally required to repatriate to South Africa profits of foreign operations and are limited in their ability
to utilize profits of one foreign business to finance operations of a different foreign business. South African companies establishing
subsidiaries, branches, offices or joint ventures abroad are generally required to submit financial statements on these operations as
well as progress reports to the SARB on an annual basis. As a result, a South African company's ability to raise and deploy capital
outside the Common Monetary Area is restricted.
Although exchange controls have been gradually relaxed since 1998, unlimited outward transfers of capital are not permitted at this
stage. Some of the more salient changes to the South African exchange control provisions over the past few years have been as
follows:
•corporations wishing to invest in countries outside the Common Monetary Area, in addition to what is set out below, apply for
permission to enter into corporate asset/share swap and share placement transactions to acquire foreign investments. The latter
mechanism entails the placement of the locally quoted corporation's shares with long-term overseas holders who, in payment for
the shares, provide the foreign currency abroad which the corporation then uses to acquire the target investment;
•corporations wishing to establish new overseas ventures are permitted to transfer offshore up to R5 billion to finance approved
investments abroad and up to R5 billion to finance approved new investments in African countries per calendar year. Investments in
excess of R5 billion require the approval of the Financial Surveillance Department. On application to the SARB, corporations are
also allowed to use part of their local cash holdings to finance up to 10% of approved new foreign investments where the cost of
these investments exceeds the current limits;
•as a general rule, the SARB requires that more than 10% of equity of the acquired off-shore venture is acquired within a
predetermined period of time, as a prerequisite to allowing the expatriation of funds. If these requirements are not met, the SARB
may instruct that the equity be disposed of. In our experience the SARB has taken a commercial view on this, and has on occasion
extended the period of time for compliance; and
•remittance of directors' fees payable to persons permanently resident outside the Common Monetary Area may be approved by
authorized dealers, in terms of the Authorised Dealer Manual.
Authorized dealers in foreign exchange may, against the production of suitable documentary evidence, provide forward cover to
South African residents in respect of fixed and ascertained foreign exchange commitments covering the movement of goods.
Private individuals who cease to be residents for tax purposes are entitled to transfer their assets abroad subject to obtaining a Tax
Compliance Status letter from SARS. The balance of such individuals’ funds will be held under the control of an authorized dealer.
These funds may only be invested in:
•blocked current, savings, interest bearing deposit accounts in the books of an authorized dealer in the banking sector;
•securities quoted on the JSE and financial instruments listed on a South African exchange which are deposited with an authorized
dealer and not released except temporarily for switching purposes, without the approval of the Financial Surveillance Department.
Authorized dealers must at all times be able to demonstrate that listed or quoted securities or financial instruments which are
dematerialized or immobilized in a central securities depository are being held subject to the control of the authorized dealer
concerned; or
•mutual funds.
Aside from the investments referred to above, blocked Rands may only be utilized for very limited purposes. Dividends declared out
of capital gains or out of income earned prior to ceasing tax residency remain subject to the blocking procedure. It is not possible to
predict when existing exchange controls will be abolished or whether they will be continued or modified by the South African
Government in the future.
In April 2026, Draft Capital Flow Management Regulations were published to replace the Regulations. The deadline for public
comment on the draft regulations was June 30, 2026. The draft regulations also incorporate crypto assets within the capital flow
management framework. This development signals a potential fundamental shift in the regulatory framework from exchange controls
to capital flow management. However until these Regulations become effective, the current Exchange Control dispensation as set out
above is still applicable.
Sale of Shares
Under present exchange control regulations in South Africa, our ordinary shares and ADRs are freely transferable outside the
Common Monetary Area between non-residents of the Common Monetary Area. In addition, the proceeds from the sale of ordinary
shares on the JSE on behalf of shareholders who are not residents of the Common Monetary Area are freely remittable to such
shareholders. Share certificates held by non-residents will be endorsed with the words “non-resident,” unless dematerialized.
DRDGold_Breadcrumbs_Logo_RGB.jpg
DRDGOLD Limited Form 20-F 2026
74
Dividends
Dividends declared in respect of shares held by a non-resident in a company whose shares are listed on the JSE are freely remittable.
Any cash dividends paid by us are paid in Rands. Holders of ADRs on the relevant record date will be entitled to receive any
dividends payable in respect of the shares underlying the ADRs, subject to the terms of the deposit agreement entered on August 12,
1996, and as amended and restated, between the Company and JP Morgan Chase Bank, as the depositary. Subject to exceptions
provided in the deposit agreement, cash dividends paid in Rand will be converted by the depositary to Dollars and paid by the
depositary to holders of ADRs, net of conversion expenses of the depositary, in accordance with the deposit agreement. The
depositary will charge holders of ADRs, to the extent applicable, taxes and other governmental charges and specified fees and other
expenses.
Voting rights
There are no limitations imposed by South African law or by our MOI on the right of non-South African shareholders to hold or vote our
ordinary shares.
10E. TAXATION
Material South African Income Tax Consequences
The following is a summary of material income tax considerations under South African income tax law. No representation with respect
to the consequences to any particular purchaser of our securities is made hereby. Prospective purchasers are urged to consult their
tax advisers with respect to their particular circumstances and the effect of South African or other tax laws to which they may be
subject.
South Africa imposes tax on worldwide income of South African residents. Generally, individuals not resident in South Africa do not
pay tax in South Africa except in the following circumstances:
Income Tax and Withholding Tax on Dividends and Interest
Non-residents will pay income tax on any amounts received by or accrued to them from a source within (or deemed to be within)
South Africa.
Section 64F of the Income Tax Act, 1962 or the “Income Tax Act” sets out beneficial owners who are exempt from the dividend tax
which includes resident companies receiving a dividend after the effective date, being April 1, 2012. For dividends paid to non-
residents the rate of dividend tax is 20%, unless an applicable Double Tax Agreement grants a reduction in the dividends tax rate.
Interest earned by a non-resident natural person on a debt instrument issued by a South African company will be regarded as being
derived from a South African source but is generally exempt from South African normal income tax in terms of Section 10(1)(i) of the
South African Income Tax Act, 1962 (as amended), or the Income Tax Act. This exemption applies to so much of any interest and
dividends (which are not otherwise exempt) received from a South African source not exceeding (a) R34,500 if the taxpayer is 65
years of age or older or (b) R23,800 if the taxpayer is younger than 65 years of age at the end of the relevant tax year.
South Africa levies a withholding tax on interest at the rate of 15% on interest paid by any person to or for the benefit of a non-resident
from a South African source in terms of Part IVB of the Income Tax Act, unless an applicable Double Tax Agreement grants a
reduction in the interest withholding tax rate.
Corporate Income Tax Rates and other relevant provisions
In fiscal years 2026, the tax rates for taxable mining income for Ergo was 25.7% (2025: nil) and for FWGR was nil (2025: nil). The gold
mining tax formula for determining the South African gold mining tax rate for fiscal 2026 was Y = 33 - 165/X (fiscal year 2025: Y = 33 -
165/X) where Y is the percentage rate of tax payable and X is the ratio of taxable income, net of any qualifying capital expenditure that
bears to gold mining income derived, expressed as a percentage. The tax rate for non-mining taxable income was 27% for both fiscal
years 2026 and 2025 respectively.
On February 23, 2022, the Minister of Finance announced that the corporate income tax (“CIT”) rate will be lowered from 28% to 27%
for companies with years of assessment commencing on or after April 1, 2023. The mining operations of the Group accounts for
income tax using the gold mining tax formula as opposed to the CIT rate. The gold mining tax formula was changed to Y = 33 - 165/X
for years of assessment commencing on or after April 1, 2023.
U.S. Federal Income Tax Considerations
The following is a summary of the U.S. federal income tax considerations generally applicable to U.S. Holders on the ownership and
disposition of ordinary shares or ADRs. Unless otherwise indicated, this discussion addresses only U.S. Holders who hold ordinary
shares or ADRs as capital assets (generally, property held for investment) for U.S. federal income tax purposes. This discussion is
based upon the provisions of the U.S. Internal Revenue Code of 1986, as amended (the “Code”), U.S. Treasury regulations
promulgated thereunder, judicial decisions, published rulings of the Internal Revenue Service (the “IRS”), administrative
pronouncements and other relevant authorities, as well as on the income tax treaty between the United States and South Africa (the
“Treaty”), all as in effect on the date hereof and all of which are subject to differing interpretations and change, possibly on a
retroactive basis. There can be no assurance that the IRS would not assert, or that a court would not sustain, a position contrary to any
of the considerations discussed herein.
DRDGold_Breadcrumbs_Logo_RGB.jpg
DRDGOLD Limited Form 20-F 2026
75
This summary does not address U.S. federal estate, gift or other non-income tax considerations, the alternative minimum tax, the
Medicare tax on certain net investment income, or any state, local or non-U.S. tax considerations, relating to the ownership or
disposition of ordinary shares or ADRs, nor does it address all aspects of U.S. federal income taxation that may be relevant to U.S.
Holders in light of their particular circumstances or that may be relevant to certain types of U.S. Holders subject to special treatment
under U.S. federal income tax law (such as dealers in securities or currencies, partnerships or other pass-through entities, banks and
other financial institutions, traders in securities that elect mark-to-market treatment, insurance companies, tax-exempt organizations
(including private foundations), certain expatriates or former long-term residents of the United States, persons holding ordinary shares
or ADRs as part of a “hedge,” “conversion transaction,” “synthetic security,” “straddle,” “constructive sale” or other integrated
investment, persons who acquired the ordinary shares or ADRs upon the exercise of employee stock options or otherwise as
compensation, persons whose functional currency is not the US Dollar, or persons that actually or constructively own ten percent or
more of the voting power or value of our shares).
For purposes of this discussion, a “U.S. Holder” is a beneficial owner of ordinary shares or ADRs that is, for U.S. federal income tax
purposes:
•a citizen or individual resident of the United States;
•a corporation created or organized under the laws of the United States, any state thereof or the District of Columbia;
•an estate the income of which is subject to U.S. federal income tax without regard to its source; or
•a trust (i) if a court within the United States is able to exercise primary supervision over the administration of the trust and one or
more U.S. persons have the authority to control all substantial decisions of the trust, or (ii) if the trust has made a valid election to be
treated as a U.S. person.
If a partnership (or other entity or arrangement treated as a partnership for U.S. federal income tax purposes) owns any ordinary
shares or ADRs, the U.S. federal income tax treatment of a partner in the partnership will generally depend on the status of the partner
and the activities of the partnership. Partnerships (or other entities or arrangements treated as partnerships for U.S. federal income tax
purposes) holding any ordinary shares or ADRs and their partners should consult their tax advisors regarding an investment in
ordinary shares or ADRs.
U.S. Holders of ordinary shares or ADRs should consult their tax advisors regarding the U.S. federal income tax considerations
applicable to the ownership and disposition of ordinary shares or ADRs in light of their particular circumstances as well as any
considerations to them arising under the tax laws of any non-U.S., state or local taxing jurisdiction.
U.S. Holders of ADRs
For U.S. federal income tax purposes, a U.S. Holder of ADRs will be treated as the owner of the ordinary shares represented by such
ADRs. Exchanges of ordinary shares for ADRs and ADRs for ordinary shares will generally not be subject to U.S. federal income tax.
Distributions
Subject to the discussion below under the heading “Passive Foreign Investment Company”, the gross amount of any distributions
received by a U.S. Holder on ordinary shares or ADRs (including any amounts withheld in respect of South African withholding taxes)
will generally be subject to tax to the extent paid out of our current or accumulated earnings and profits, as determined under U.S.
federal income tax principles, and will be includible in the gross income of a U.S. Holder on the day actually or constructively
received. For U.S. federal income tax purposes, the gross amount of any distributions received by a U.S. Holder will generally equal
the U.S. Dollar value of the sum of the South African Rand payments made (including any amounts withheld in respect of South
African withholding taxes), determined at the “spot rate” on the date the dividend distribution is includable in such U.S. Holder's
income, regardless of whether the payment is in fact converted into U.S. Dollars. Generally, any gain or loss resulting from currency
exchange fluctuations during the period from the date a U.S. Holder includes the dividend payment in income to the date such holder
converts the payment into U.S. Dollars will be treated as ordinary income or loss.
Distributions, if any, in excess of our current or accumulated earnings and profits will constitute a non-taxable return of capital and will
be applied against and reduce the U.S. Holder's basis in the ordinary shares or ADRs. To the extent that distributions exceed the U.S.
Holder's tax basis in the ordinary shares or ADRs, as applicable, the excess generally will be treated as capital gain, subject to the
discussion below under the heading “Passive Foreign Investment Company”. We do not intend to calculate our earnings or profits for
U.S. federal income tax purposes. U.S. Holders should therefore assume that any distributions on our ordinary shares or ADRs will
constitute dividend income.
An individual or other non-corporate U.S. Holder may be subject to tax on any such dividends at the lower capital gain tax rate
applicable to “qualified dividend income,” provided that certain conditions are satisfied, including that (1) the ordinary shares or ADRs
are readily tradable on an established securities market in the United States, or we are eligible for the benefits of a qualifying income
tax treaty, (2) we are neither a PFIC nor treated as such with respect to a U.S. Holder (as discussed below) for the taxable year in
which the dividend is paid and the preceding taxable year, and (3) certain holding period requirements are met. Dividend income
derived with respect to the ordinary shares or ADRs will not be eligible for the dividends received deduction generally allowed to a
U.S. corporation. U.S. Holders should consult their tax advisors regarding the U.S. federal income tax rate that will be applicable to
their receipt of any dividends paid with respect to the ordinary shares and ADRs.
DRDGold_Breadcrumbs_Logo_RGB.jpg
DRDGOLD Limited Form 20-F 2026
76
For U.S. foreign tax credit purposes, dividends received on ordinary shares or ADRs will generally be treated as income from foreign
sources and will generally constitute passive category income. Subject to certain conditions and limitations, a U.S. Holder eligible for
the benefits of the Treaty may be eligible to claim a foreign tax credit in respect of any South African income taxes paid or withheld
with respect to dividends on ordinary shares or ADRs to the extent such taxes are nonrefundable under the Treaty. The rules
governing foreign tax credits are complex, and U.S. Treasury regulations (“Final FTC Regulations”) impose additional requirements
that must be met for a foreign tax to be creditable for U.S. Holders that do not elect to apply, or do not qualify for, the benefits of the
Treaty. However, the IRS has issued notices (the “Notices”) indicating that the U.S. Treasury and the IRS are considering proposing
amendments to the Final FTC Regulations and allow taxpayers, subject to certain conditions, to defer the application of many aspects
of the Final FTC Regulations until the date when a notice or other guidance withdrawing or modifying this temporary relief is issued (or
any later date specified in such notice or other guidance). Alternatively, a U.S. Holder may elect to deduct such taxes in computing its
taxable income for U.S. federal income tax purposes. A U.S. Holder’s election to deduct foreign taxes instead of claiming foreign tax
credits applies to all creditable foreign income taxes paid or accrued in the relevant taxable year. The rules regarding foreign tax
credits and the deductibility of foreign taxes are complex. All U.S. Holders should consult their tax advisors regarding the availability of
foreign tax credits and the deductibility of foreign taxes in light of their particular circumstances.
Passive Foreign Investment Company
A non-U.S. corporation, such as our company, will be classified as a passive foreign investment company (“PFIC”) for U.S. federal
income tax purposes for any taxable year if either (i) 75% or more of our gross income for such year, including our pro rata share of
the gross income of any company in which we are considered to own 25% or more of the shares by value, consists of certain types of
“passive income” or (ii) 50% or more of the value of our assets (determined on the basis of a quarterly average) during such year,
including our pro rata share of the assets of any company in which we are considered to own 25% or more of the shares by value, is
attributable to assets that produce or are held for the production of passive income. Passive income generally includes dividends,
interest, royalties, rents, annuities, net gains from the sale or exchange of property producing such income and net foreign currency
gains. Passive assets are those which give rise to passive income and include assets held for investment, as well as cash, assets
readily convertible into cash, and (subject to certain exceptions) working capital.
If we are a PFIC for any taxable year during which a U.S. Holder holds ordinary shares or ADRs, the U.S. Holder would be subject to
special rules with respect to any (i) gain recognized upon the disposition of the ordinary shares or ADRs and (ii) receipt of an excess
distribution (generally, any distribution to a U.S. Holder during a taxable year that is greater than 125% of the average amount of
distributions received by such U.S. Holder during the three preceding taxable years in respect of the ordinary shares or ADRs or, if
shorter, such U.S. Holder's holding period for the ordinary shares or ADRs). Under these rules:
•the gain or excess distribution will be allocated ratably over a U.S. Holder's holding period for the ordinary shares or ADRs, as
applicable;
•amounts allocated to the taxable year of the excess distribution or of the sale or other disposition and to any taxable years in the
U.S. Holder’s holding period prior to the first taxable year in which we are classified as a PFIC (each, a “pre-PFIC year”), will be
taxed as ordinary income;
•amounts allocated to each prior year (other than the current taxable year or a pre-PFIC year) will be taxed at the highest tax rate in
effect  that is applicable to the U.S. Holder for that year; and
•such amounts will be increased by an additional tax equal to interest on the resulting tax deemed deferred with respect to such
years (other than the current taxable year or a pre-PFIC year).
Although we generally will be treated as a PFIC as to any U.S. Holder if we are a PFIC for any year during a U.S. Holder's holding
period, if we cease to be a PFIC, the U.S. Holder may avoid PFIC classification for subsequent years if such holder elects to recognize
gain based on the unrealized appreciation in the ordinary shares or ADRs through the close of the tax year in which we cease to be a
PFIC.
A U.S. Holder of a PFIC is required to file an annual report with the IRS containing such information as the U.S. Secretary of Treasury
may require.
A U.S. Holder of ordinary shares or ADRs that are treated as “marketable stock” may be able to avoid the imposition of the special tax
and interest charge described above by making a mark-to-market election. Pursuant to this election, the U.S. Holder would include in
ordinary income or loss for each taxable year an amount equal to the difference between, as of the close of the taxable year, the fair
market value of the ordinary shares or ADRs and the U.S. Holder's adjusted tax basis in such ordinary shares or ADRs. Losses would
be allowed only to the extent of net mark-to-market gain previously included by the U.S. Holder under the election for prior taxable
years. If a U.S. Holder makes a mark-to-market election, then, in any taxable year for which we are classified as a PFIC, tax rules that
apply to distributions by corporations that are not PFICs would apply to distributions by us (except that the lower applicable capital
gains rate for qualified dividend income would not apply). If a U.S. Holder makes a valid mark-to-market election and we subsequently
cease to be classified as a PFIC, the U.S. Holder will not be required to take into account the mark-to-market income or loss described
above during any period that we are not classified as a PFIC. In addition, because, as a technical matter, a mark-to-market election
cannot be made for any lower-tier PFICs that we may own, a U.S. Holder may continue to be subject to the PFIC rules with respect to
such U.S. Holder’s indirect interest in any investments held by us that are treated as an equity interest in a PFIC for U.S. federal
income tax purposes. U.S. Holders should consult their tax advisors with respect to the application and effect of making the mark-to-
market election for their ordinary shares or ADRs.
In the case of a U.S. Holder who holds ordinary shares or ADRs and who does not make a mark-to-market election, the special tax
and interest charge described above will not apply if such holder makes an election to treat us as a “qualified electing fund” in the first
taxable year in which such holder owns the ordinary shares or ADRs and if we comply with certain reporting requirements. However,
we do not intend to provide the information necessary for U.S. Holders to make qualified electing fund elections.
DRDGold_Breadcrumbs_Logo_RGB.jpg
DRDGOLD Limited Form 20-F 2026
77
We believe that we were not a PFIC for the prior taxable year. There can be no assurance regarding our PFIC status for the current
taxable year or foreseeable future taxable years, however, because our PFIC status is a factual determination made annually that will
depend, in part, upon the composition of our income and assets. The value of our assets for purposes of the asset test, including the
value of our goodwill and unbooked intangibles, may be determined in part by reference to the market price of our ordinary shares or
ADRs from time to time (which may be volatile). Because we will generally take into account our current market capitalization in
estimating the value of our goodwill and other unbooked intangibles, our PFIC status for the current taxable year and foreseeable
future taxable years may be affected by our market capitalization.
The rules relating to PFICs are complex. U.S. Holders should consult their tax advisors regarding the application of the PFIC
rules to their investments in our ordinary shares or ADRs.
Disposition of Ordinary Shares or ADRs
A U.S. Holder will generally recognize gain or loss on the sale, exchange, or other taxable disposition of ordinary shares or ADRs in an
amount equal to the difference between the U.S. Dollar value of the amount realized on the disposition and such holder's adjusted tax
basis in the ordinary shares or ADRs. Subject to the discussion above under the heading “Passive Foreign Investment Company”,
such gain or loss will generally be long-term capital gain or loss if the U.S. Holder’s holding period in the ordinary shares or ADRs
exceeds one year. Long-term capital gains of individuals and certain other non-corporate U.S. Holders are generally eligible for a
reduced rate of taxation. The deductibility of capital losses is subject to limitations.
Gain or loss recognized by a U.S. Holder on the taxable disposition of ordinary shares or ADRs will generally be treated as U.S.
source gain or loss for U.S. foreign tax credit purposes. Subject to the Notices described above, under the Final FTC Regulations,
South African taxes (if any) imposed on disposition gains generally will not be creditable against a U.S. Holder’s U.S. federal income
tax liability. U.S. Holders should consult their own tax advisors as to their ability to obtain an exemption from any South African taxes
imposed on disposition gains, and the U.S. federal income tax implications of any South African taxes imposed on disposition gains in
their particular circumstances.
In the case of a cash basis U.S. Holder who receives Rand in connection with the taxable disposition of ordinary shares or ADRs, the
amount realized will be based on the spot rate as determined on the settlement date of such exchange. A U.S. Holder who receives
payment in Rand and converts Rand into U.S. Dollars at a conversion rate other than the rate in effect on the settlement date may
have a foreign currency exchange gain or loss that would be treated as ordinary income or loss.
An accrual basis U.S. Holder may elect the same treatment required of cash basis taxpayers with respect to a taxable disposition of
ordinary shares or ADRs, provided that the election is applied consistently from year to year. Such election may not be changed
without the consent of the IRS. In the event that an accrual basis U.S. Holder does not elect to be treated as a cash basis taxpayer,
such U.S. Holder may have a foreign currency gain or loss for U.S. federal income tax purposes because of the differences between
the U.S. Dollar value of the currency received prevailing on the trade date and the settlement date. Any such currency gain or loss will
be treated as ordinary income or loss and would be in addition to gain or loss, if any, recognized by such U.S. Holder on the
disposition of such ordinary shares or ADRs.
Backup Withholding and Information Reporting
Payments of dividends on, and proceeds from the sale or other taxable disposition of, ordinary shares or ADRs by a U.S. paying
agent or other U.S. intermediary will be reported to the IRS and to the U.S. Holder as may be required under applicable regulations.
Backup withholding may apply to these payments if the U.S. Holder fails to provide an accurate taxpayer identification number or
certification of exempt status or fails to comply with applicable certification requirements. Certain U.S. Holders are not subject to
backup withholding. U.S. Holders should consult their tax advisors as to their qualification for exemption from backup withholding and
the procedure for obtaining an exemption.
Information with respect to Foreign Financial Assets
Certain U.S. Holders may be required to report on IRS Form 8938 information relating to an interest in ordinary shares or ADRs,
subject to certain exceptions (including an exception for assets held in accounts maintained by certain financial institutions, although
the account itself may be reportable if held at a non-U.S. financial institution). U.S. Holders should consult their tax advisors regarding
the effect, if any, of this reporting requirement on their acquisition, ownership and disposition of ordinary shares or ADRs.
10F. DIVIDENDS AND PAYING AGENTS
Not applicable.
10G. STATEMENT BY EXPERTS
Not applicable.
10H. DOCUMENTS ON DISPLAY
DRDGOLD files annual reports on Form 20-F and reports on Form 6-K with the SEC. You may access this information at the SEC’s
home page (http://www.sec.gov). Copies of the documents referred to herein may be inspected at DRDGOLD Limited’s offices by
contacting DRDGOLD Limited, P.O. Box 390, Maraisburg, Johannesburg, South Africa 1700. Attn: Company Secretary. Tel No.
+27-11-470-2600.
10I. SUBSIDIARY INFORMATION
Not applicable.
DRDGold_Breadcrumbs_Logo_RGB.jpg
DRDGOLD Limited Form 20-F 2026
78
ITEM 11. QUANTITATIVE AND QUALITATIVE DISCLOSURES ABOUT MARKET RISK
General
We are exposed to market risks arising in the ordinary course of business, principally commodity price risk, foreign currency risk and
interest rate risk. Our objective is to manage these risks in a manner that supports our operational and strategic objectives while
preserving financial flexibility. Detailed quantitative and qualitative information regarding these risks, including sensitivity analyses, is
provided in "Item 18. Financial Statements - Note 27 - Financial instruments" to the consolidated financial statements.
Commodity price risk
Our revenues, cash flows and profitability are substantially dependent on the Rand gold price, which is influenced by both the
international U.S. Dollar gold price and the U.S. Dollar/Rand exchange rate. Fluctuations in the Rand gold price may materially affect
our financial position, results of operations, cash flows and the economic viability of our mineral reserves and resources.
Consistent with our long-term strategy, we generally remain unhedged and did not enter into material gold hedging arrangements
during fiscal year 2026.
Foreign currency risk
Although our functional and reporting currency is the South African Rand, gold sales are denominated in U.S. Dollars while
substantially all operating and capital costs are incurred in Rand. As a result, our operating results and cash flows are exposed to
fluctuations in the U.S. Dollar/Rand exchange rate.
We did not enter into material foreign currency hedging arrangements during fiscal year 2026.
Interest rate risk
Our exposure to interest rate risk arises primarily from cash and cash equivalents, investments and other interest-bearing financial
assets. Changes in market interest rates may affect the returns earned on these balances and, where applicable, the cost of
borrowings.
ITEM 12. DESCRIPTION OF SECURITIES OTHER THAN EQUITY SECURITIES
See "Item 9. The Offer and Listing Details".
12A. DEBT SECURITIES
Not applicable.
12B. WARRANTS AND RIGHTS
Not applicable.
12C. OTHER SECURITIES
Not applicable.
12D. AMERICAN DEPOSITARY SHARES
Depositary Fees and Charges
JP Morgan Chase Bank ("JP Morgan") was appointed as the depositary bank (“Depositary”) for DRDGOLD’s American Depositary
Receipt program, effective June 30, 2025. Prior to JP Morgan Chase Bank’s appointment, the Bank of New York Mellon served as
DRDGOLD’s Depositary.
DRDGOLD’s American Depositary Shares, or ADSs, each representing ten of DRDGOLD’s ordinary shares, are traded on the New
York Stock Exchange, or NYSE under the symbol “DRD” (until December 29, 2011 our ADSs were traded on the Nasdaq Capital
Market under the symbol “DROOY”). The ADSs are evidenced by American Depositary Receipts, or ADRs, issued by JP Morgan
Chase Bank, as Depositary under the Deposit Agreement dated as of May 29, 2025, among DRDGOLD Limited, JP Morgan Chase
Bank and owners and beneficial owners of ADRs from time to time.
ADR holders may have to pay the following service fees to the Depositary:
Service
Fees (USD)
Issuance of ADSs, including issuances resulting from a distribution of ordinary
shares or rights
$5.00 (or less) per 100 ADSs (or portion thereof)1
Cancellation of ADSs for the purpose of withdrawal, including if the Deposit
Agreement terminates
$5.00 (or less) per 100 ADSs (or portion thereof)1
Distribution of cash dividends or other cash distributions
5 cents (or less) per ADS (or portion thereof)
Distribution of securities distributed to holders of deposited securities which are
distributed by the Depositary to ADS registered holders
$5.00 (or less) per 100 ADSs (or portion thereof)
1These fees are typically paid to the Depositary by the brokers on behalf of their clients receiving the newly-issued ADSs from the Depositary or
delivering the ADSs to the Depositary for cancellation. The brokers in turn charge these transaction fees to their clients.
DRDGold_Breadcrumbs_Logo_RGB.jpg
DRDGOLD Limited Form 20-F 2026
79
In addition, ADR holders are responsible for certain fees and expenses incurred by the Depositary on their behalf including (1) taxes
and other governmental charges, (2) such registration fees as may from time to time be in effect for the registration of transfers of
ordinary shares generally on the share register and applicable to transfers of ordinary shares to the name of the Depositary or its
nominee or the Custodian or its nominee on the making of deposits or withdrawals, (3) such cable, telex and facsimile transmission
expenses as are expressly provided in the Deposit Agreement, and (4) such expenses as are incurred by the Depositary in the
conversion of foreign currency to U.S. Dollars.
The Depositary collects its fees described above at the time the relevant service is provided. Fees for cash distributions may be
deducted from amounts distributed or satisfied through the sale of distributable property. The Depositary may also collect annual
depositary service fees by deduction from cash distributions, direct billing of investors, or through participants acting on their behalf.
The Depositary may refuse to provide fee-attracting services until outstanding fees have been paid.
Depositary Payments
JP Morgan, as Depositary, agreed to reimburse DRDGOLD an amount mainly consisting of accumulated contributions towards the
Company’s investor relations activities (including investor meetings, conferences and fees of investor relations service vendors).
DRDGOLD is entitled to a 97% (June 30, 2025 and June 30, 2024: Bank of New York Mellon reimbursed 25%) share of the dividend
fees which amounts to approximately $904 807 for the year ended June 30, 2026 (June 30, 2025:  $68 010, June 30, 2024:  $90 988).
After the deduction of other fees, the annual reimbursement for the year ended June 30, 2026 amounts to approximately $785 965
(June 30, 2025: $35 135, June 30, 2024: $75 000).
PART II
ITEM 13. DEFAULTS, DIVIDEND ARREARAGES AND DELINQUENCIES
There have been no material defaults in the payment of principal, interest, a sinking or purchase fund installment, or any other material
defaults with respect to any indebtedness of ours.
ITEM 14. MATERIAL MODIFICATIONS TO THE RIGHTS OF SECURITY HOLDERS AND USE OF PROCEEDS
None
ITEM 15. CONTROLS AND PROCEDURES
15(a). Disclosure Controls and Procedures
As of June 30, 2026, our management, with the participation of our Chief Executive Officer and Chief Financial Officer has evaluated
the effectiveness of our disclosure controls and procedures (as this term is defined in Rules 13a-15(e) and 15d-15(e) of the Exchange
Act). Our management, including the Chief Executive Officer and Chief Financial Officer, concluded that our disclosure controls and
procedures were effective as of June 30, 2026.
Our disclosure controls and procedures are designed to provide reasonable assurance that information required to be disclosed by
us in the reports that we file or submit under the Securities Exchange Act of 1934 is recorded, processed, summarized and reported,
within the time periods specified in the applicable rules and forms and that such information required to be disclosed by us in the
reports we file or submit under the Securities Exchange Act of 1934 is accumulated and communicated to our management, including
our Chief Executive Officer and Chief Financial Officer, as appropriate to allow timely decisions regarding required disclosures.
There are inherent limitations in the effectiveness of any system of disclosure controls and procedures. These limitations include the
possibility of human error and the circumvention or overriding of the controls and procedures. Accordingly, any such system can only
provide reasonable assurance of achieving the desired control objectives.
15(b). Management’s Annual Report on Internal Control Over Financial Reporting
Our management is responsible for establishing and maintaining adequate internal control over financial reporting. Internal control
over financial reporting is defined in Rule 13a-15(f) or 15d-15(f) promulgated under the Securities Exchange Act of 1934 as a process
designed by, or under the supervision of, our Chief Executive Officer and Chief Financial Officer and effected by our Board,
management and other personnel to provide reasonable assurance regarding the reliability of financial reporting and the preparation
of financial statements for external purposes in accordance with IFRS Accounting Standards. Under Section 404(a) of the Sarbanes
Oxley Act of 2002, management is required to assess our internal controls surrounding the financial reporting process as at the end of
each fiscal year. Based on that assessment, management is to determine whether or not our internal controls over financial reporting
are effective.
Internal control over financial reporting includes those policies and procedures that:
•pertain to the maintenance of records that in reasonable detail accurately and fairly reflect the transactions and dispositions of our
assets;
•provide reasonable assurance that transactions are recorded as necessary to permit preparation of financial statements in
accordance with IFRS Accounting Standards, and that our receipts and expenditures are being made only in accordance with
authorizations of our management and Board; and
•provide reasonable assurance regarding prevention or timely detection of unauthorized acquisition, use or disposition of our assets
that could have a material effect on our financial statements.
Because of its inherent limitations, internal control over financial reporting may not prevent or detect misstatements. Instead, it must be
noted that even those systems that management deems to be effective can only provide reasonable assurance with respect to the
preparation and presentation of our financial statements. Also, projections of any evaluation of effectiveness to future periods are
subject to the risk that controls may become inadequate because of changes in conditions, or the degree of compliance with the
policies and procedures.
DRDGold_Breadcrumbs_Logo_RGB.jpg
DRDGOLD Limited Form 20-F 2026
80
Our management assessed the effectiveness of our internal control over financial reporting as of June 30, 2026. In making this
assessment, our management used the criteria set forth by the Internal Control-Integrated Framework (2013) issued by the Committee
of Sponsoring Organizations of the Treadway Commission (COSO). Based on our assessment and those criteria, our management
concluded that as of June 30, 2026 our internal control over financial reporting was effective.
15(c). Attestation Report of the independent registered public accounting firm
The effectiveness of internal control over financial reporting as of June 30, 2026 was audited by BDO South Africa Inc., independent
registered public accounting firm, as stated in their report included in "Item 18. Financial Statements".
15(d). Changes in Internal Control Over Financial Reporting
During the year ended June 30, 2026, there have not been any changes in our internal control over financial reporting that have
materially affected, or are reasonably likely to materially affect, our internal control over financial reporting.
ITEM 16. [RESERVED]
ITEM 16A. AUDIT COMMITTEE FINANCIAL EXPERT
Mr. J.A. Holtzhausen, Chairman of the Audit Committee, has been determined by our Board to be an audit committee financial expert
within the meaning of the Sarbanes-Oxley Act, in accordance with the Rules of the NYSE, and rules promulgated by the SEC and
independent both under the NYSE Rules and the South African Johannesburg Stock Exchange Rules. The Board is satisfied that the
skills, experience and attributes of the members of the Audit Committee are sufficient to enable those members to discharge the
responsibilities of the Audit Committee.
ITEM 16B. CODE OF ETHICS
We have adopted a Code of Business Conduct and Ethics that applies to all senior executives including our Non-Executive Chairman,
the Chief Executive Officer, Chief Financial Officer, Chief Operating Officer and Directors at our mining operations as well as all other
employees. In the 2025 fiscal year we updated the Code of Business Conduct and Ethics. The Code of Business Conduct and Ethics
can be accessed on the Company’s website at the following web address: www.drdgold.com/about-us/governance.
ITEM 16C. PRINCIPAL ACCOUNTANT FEES AND SERVICES
BDO South Africa Inc. has served as our independently registered public accountant for the fiscal years ended June 30, 2026 and
2025. The audited financial statements appear in this Annual Report. The Annual General Meeting elects the auditors annually.
The following table presents the aggregate fees for professional audit services and other services rendered by BDO South Africa Inc.
to us in fiscal year 2026 and 2025 respectively:
Audit Fees
Audit fees billed for the annual audit services engagement, which are those services that the external auditor reasonably can provide,
include the company audit; statutory audits; comfort letters and consents; attest services; and assistance with and review of
documents filed with the SEC.
Auditors' remuneration
Year ended
2026
2025
Rm
Rm
Audit fees
8.8
8.5
All other fees
0.8
0.7
Total
9.6
9.2
All Other Fees
The all other fees during fiscal year 2026 consist of the following:
•R0.8 million with respect to limited assurance provided by BDO Advisory Services (Pty) Ltd on specified items contained in our
Annual Integrated Report for fiscal year 2026;
The all other fees during fiscal year 2025 consist of the following:
•R0.7 million with respect to limited assurance provided by BDO Advisory Services (Pty) Ltd on specified items contained in our
Annual Integrated Report for fiscal year 2025.
The Audit Committee is directly responsible for recommending the appointment, re-appointment and removal of the external auditors
as well as the remuneration and terms of engagement of the external auditors. The committee pre-approves, and has pre-approved,
all non-audit services provided by the external auditors. The Audit Committee considered all of the fees mentioned above and
determined that such fees are compatible with maintaining BDO South Africa Inc's independence.
ITEM 16D. EXEMPTIONS FROM THE LISTING STANDARDS FOR AUDIT COMMITTEES
Not applicable.
ITEM 16E. PURCHASES OF EQUITY SECURITIES BY THE ISSUER AND AFFILIATED PURCHASERS
Not applicable
ITEM 16F. CHANGE IN REGISTRANT'S CERTIFYING ACCOUNTANT
Not applicable.
DRDGold_Breadcrumbs_Logo_RGB.jpg
DRDGOLD Limited Form 20-F 2026
81
ITEM 16G. CORPORATE GOVERNANCE
As a foreign private issuer with shares listed on the NYSE, we are subject to corporate governance requirements imposed by NYSE.
Under section 303A.11 of the NYSE Listing Standards, a foreign private issuer such as us may follow its home country corporate
governance practices in lieu of certain of the NYSE Listing Standards on corporate governance. DRDGOLD's home country corporate
governance practices are regulated by the Listings Requirements of the JSE (the “JSE Listings Requirements”). We are also
exempt from certain NYSE corporate governance requirements as a “controlled company”. The following paragraphs summarize the
significant ways in which DRDGOLD's home country corporate governance standards and its corporate governance practices differ
from those followed by domestic companies under the NYSE Listing Standards.
Shareholder meeting quorum requirements
•Section 310.00 of the NYSE Listing Standards provides that the quorum required for any meeting of holders of common stock
should be sufficiently high to insure a representative vote. Consistent with the practice of companies incorporated in South Africa,
our Memorandum of Incorporation requires a quorum of three members present with sufficient voting powers in person or by proxy
to exercise in aggregate 25% of the voting rights and we have elected to follow our home country rule.
•The NYSE Listing Standards require that the non-management directors of US-listed companies meet at regularly scheduled
executive sessions without management. The JSE Listings Requirements do not require such meetings of listed company non-
executive directors. The Board has unrestricted access to all company information, records, documents and property. Directors
may, if necessary, take independent professional advice at the Company’s expense and non-executive directors have access to
management and may meet separately with management, without the attendance of executive directors.
•The NYSE Listing Standards require U.S. listed companies to have a nominating/corporate governance committee composed
entirely of independent directors. The JSE Listings Requirements also require the appointment of such a committee, and stipulate
that all members of this committee must be non-executive directors, the majority of whom must be independent. DRDGOLD has a
Nominations Committee which currently comprises five non-executive directors, all of whom are independent under the NYSE
Listing Standards and the JSE Listings Requirements, except for T.J. Cumming. The Nominations Committee is chaired by the
Chairman of DRDGOLD.
•The NYSE Listing Standards require U.S. listed companies to have a compensation committee composed entirely of independent
directors. The JSE Listings Requirements merely require the appointment of such a committee but not that its members be
independent. DRDGOLD has appointed a Remuneration Committee, currently comprising six Board members, all of whom are
independent under both the JSE Listings Requirements and the NYSE Listing Standards, except for RA Brady and  TJ Cumming.
ITEM 16H. MINE SAFETY DISCLOSURES
Not applicable
ITEM 16I. DISCLOSURE REGARDING FOREIGN JURISDICTIONS THAT PREVENT INSPECTIONS
Not applicable
ITEM 16J. INSIDER TRADING POLICIES
DRDGOLD has adopted an insider trading policy that aims to ensure compliance with applicable trading laws, rules, regulations and
applicable listing requirements. The policy governs the purchase, sale and other dispositions of DRDGOLD's securities by directors,
senior management and employees. Refer to “Directors' and Employees' Dealing Policy and Procedures” as contained in Exhibit 11.1
for further details.
DRDGold_Breadcrumbs_Logo_RGB.jpg
DRDGOLD Limited Form 20-F 2026
82
ITEM 16K. CYBERSECURITY
Cybersecurity Risk Management and Strategy
Processes for identifying and assessing material cybersecurity risks
DRDGOLD's operations rely on digital systems and infrastructure to support mining, processing, renewable energy and corporate
activities. The Group has established processes to identify, assess and manage cybersecurity risks that could affect its operations,
assets, information systems or stakeholders. Cybersecurity risks are evaluated through periodic risk assessments performed by the
Information Technology and Risk & Assurance functions using tools and methodologies aligned with recognised cybersecurity
frameworks, including ISO/IEC 27001, the NIST Cybersecurity Framework and the CIS Critical Security Controls. These assessments
consider threats to information systems, operational technology, data confidentiality, system availability and third-party connectivity.
The Group's cybersecurity programme incorporates continuous monitoring activities, employee awareness training, vulnerability
identification, control self-assessments and independent assurance reviews. An external cybersecurity assurance provider is
engaged through the Combined Assurance Framework to evaluate the effectiveness of cybersecurity risk management processes
and key controls.
Integration into enterprise risk management
Cybersecurity risks are integrated into DRDGOLD's Enterprise Risk Management ("ERM") framework and are assessed using the
same risk identification, evaluation, mitigation and reporting processes applied to other strategic, operational, financial and
compliance risks. Cybersecurity risks are recorded, monitored and reported through the Group's risk management processes and are
considered when evaluating the Group's overall risk profile and risk appetite.
The Group also evaluates cybersecurity risks associated with third-party service providers and other external parties that have access
to its systems or data. Critical vendors are required to provide assurance regarding their cybersecurity controls through independent
assurance reports or cybersecurity assessments. The results of these assessments are incorporated into the Group's broader risk
management processes.
Governance
Management oversight of cybersecurity risks
Management is responsible for assessing and managing cybersecurity risks. Responsibility for cybersecurity governance is led by the
Head of Cybersecurity ("HCS"). The HCS oversees the Group's cybersecurity strategy, risk management activities and incident
response capabilities, and is responsible for the day-to-day management of cybersecurity risks, implementation of security controls
and remediation of identified vulnerabilities and control deficiencies.
Management receives information regarding cybersecurity risks and control effectiveness through ongoing monitoring activities, risk
assessments, assurance reviews and incident management processes. Cybersecurity matters are periodically reported to executive
management and considered as part of the Group's broader risk management and business resilience processes.
Board of directors oversight of cybersecurity risks
The Board oversees cybersecurity risk as part of its broader responsibility for risk governance. Oversight is delegated to the Risk
Committee, which receives periodic reports regarding cybersecurity risks, emerging threat trends, control effectiveness and
significant incidents, if any. The Risk Committee monitors management's processes for identifying, assessing and managing
cybersecurity risks and reports significant matters to the Board.
The Audit Committee receives updates relating to information technology controls and cybersecurity matters relevant to the integrity of
the Group's control environment and financial reporting processes. Through these governance structures, the Board maintains
oversight of material cybersecurity risks and management's response to such risks.
Cybersecurity incidents
During the financial year ended June 30, 2026, DRDGOLD did not identify any cybersecurity incidents that had a material impact, or
are reasonably likely to have a material impact, on the Group's business strategy, results of operations or financial condition.
DRDGold_Breadcrumbs_Logo_RGB.jpg
DRDGOLD Limited Consolidated Annual Financial Statements 2026
83
PART III
ITEM 17. FINANCIAL STATEMENTS
Not applicable.
ITEM 18. FINANCIAL STATEMENTS
The following annual financial statements and related auditor’s report are filed as part of this Annual Report
Page
Report of Independent Registered Public Accounting Firm
Firm ID:
F-1- to F-4
Reports for the years ended 30 June 2026, 2025 and 2024 - BDO South Africa Inc.
1368
Consolidated statement of profit or loss and other comprehensive income for the years ended
30 June 2026, 2025 and 2024
Consolidated statement of financial position at 30 June 2026 and 2025
Consolidated statement of changes in equity for the years ended 30 June 2026, 2025 and 2024
Consolidated statement of cash flows for the years ended 30 June 2026, 2025 and 2024
Notes to the consolidated financial statements
Note
About these consolidated financial statements
1
Use of accounting assumptions, estimates and judgements
2
New standards, amendments to standards and interpretations
3
Performance
Revenue
4
Results from operating activities
5
Cost of sales
5.1
Administration expenses and other costs
5.2
Finance income
6
Finance expense
7
Earnings per share
8
Resource assets and related liabilities
Property, plant and equipment
9
Provision for environmental rehabilitation
10
Investments in rehabilitation and other funds
11
Working capital
Cash and cash equivalents
12
Cash generated from operations
13
Trade and other receivables
14
Trade and other payables
15
Inventories
16
Tax
Income tax
17
Income tax expense
17.1
Deferred tax
17.2
Current tax receivable/liability
17.3
DRDGold_Breadcrumbs_Logo_RGB.jpg
DRDGOLD Limited Consolidated Annual Financial Statements 2026
84
ITEM 18. FINANCIAL STATEMENTS
Employee matters
Employee benefits
18
Equity-settled long-term incentive schemes
18.1
Transactions with key management personnel
18.2
Capital and equity
Capital management
19
Equity
20
Stated Share Capital
20.1
Dividends
20.2
Disclosure items
Interest in subsidiaries
21
Asset held for sale
22
Operating segments
23
Payments made under protest
24
Other investments
25
Rand Refinery
25.1
Contingencies
26
Contingent liability for occupational lung diseases
26.1
Contingent liability for environmental rehabilitation
26.2
Contingencies regarding Ekurhuleni Metropolitan Municipality electricity tariff dispute
26.3
Contingent liability for the summons received from Benoni Gold Mine
26.4
Financial instruments
27
Related parties
28
Subsequent events
29
DRDGold_Breadcrumbs_Logo_RGB.jpg
DRDGOLD Limited Consolidated Annual Financial Statements 2026
F-1
Report of Independent Registered Public Accounting Firm
Shareholders and Board of Directors
DRDGOLD Limited
Johannesburg, Republic of South Africa
Opinion on the Consolidated Financial Statements
We have audited the accompanying consolidated statement of financial position of DRDGOLD Limited (the “Company”) as of June
30, 2026 and 2025, and the related consolidated statements of profit or loss and other comprehensive income, changes in equity, and
cash flows for each of the three years in the period ended June 30, 2026, and the related notes (collectively referred to as the
“consolidated financial statements”). In our opinion, the consolidated financial statements present fairly, in all material respects, the
financial position of the Company at June 30, 2026 and 2025, and the results of its operations and its cash flows for each of the three
years in the period ended June 30, 2026, in conformity with IFRS Accounting Standards as issued by the International Accounting
Standards Board.
We also have audited, in accordance with the standards of the Public Company Accounting Oversight Board (United States)
(PCAOB), the Company's internal control over financial reporting as of June 30, 2026, based on criteria established in Internal Control
– Integrated Framework (2013) issued by the Committee of Sponsoring Organizations of the Treadway Commission (COSO) and our
report dated October 2, 2026 expressed an unqualified opinion thereon.
Basis for Opinion
These consolidated financial statements are the responsibility of the Company’s management. Our responsibility is to express an
opinion on the Company’s consolidated financial statements based on our audits. We are a public accounting firm registered with the
Public Company Accounting Oversight Board (United States) (PCAOB) and are required to be independent with respect to the
Company in accordance with the U.S. federal securities laws and the applicable rules and regulations of the Securities and Exchange
Commission and the PCAOB.
We conducted our audits in accordance with the standards of the PCAOB. Those standards require that we plan and perform the
audit to obtain reasonable assurance about whether the consolidated financial statements are free of material misstatement, whether
due to error or fraud.
Our audits included performing procedures to assess the risks of material misstatement of the consolidated financial statements,
whether due to error or fraud, and performing procedures that respond to those risks. Such procedures included examining, on a test
basis, evidence regarding the amounts and disclosures in the consolidated financial statements. Our audits also included evaluating
the accounting principles used and significant estimates made by management, as well as evaluating the overall presentation of the
consolidated financial statements. We believe that our audits provide a reasonable basis for our opinion.
Critical Audit Matters
The critical audit matters communicated below are matters arising from the current period audit of the consolidated financial
statements that were communicated or required to be communicated to the audit committee and that: (1) relate to accounts or
disclosures that are material to the consolidated financial statements and (2) involved our especially challenging, subjective, or
complex judgments. The communication of critical audit matters does not alter in any way our opinion on the consolidated financial
statements, taken as a whole, and we are not, by communicating the critical audit matters below, providing separate opinions on the
critical audit matters or on the accounts or disclosures to which they relate.
Evaluation of the provision for environmental rehabilitation
At June 30, 2026, the Company’s provision for environmental rehabilitation totaled to R 721.4 million. As discussed in note 10 to the
consolidated financial statements, the Company’s estimates of the future environmental rehabilitation costs are determined with the
assistance of an independent expert and are based on the Company’s environmental management plans which are developed in
accordance with regulatory requirements as well as the Company’s life-of-mine (“LOM”) and influences the estimated timing of the
rehabilitation cash outflows, and the planned method of rehabilitation of reclamation sites and deposition facilities.
We identified the evaluation of the provision for environmental rehabilitation as a critical audit matter. The computation of the net
present value of the estimated rehabilitation costs required significant auditor judgment, subjectivity and effort in evaluating (i)
management’s determination of the discount rate, inflation rate, discount periods and the projected timing of cash flows over the
expected life-of-mine used in the computation of the present value and (ii) gross rehabilitation costs, which required the use of
professionals with specialized skill and knowledge.
DRDGold_Breadcrumbs_Logo_RGB.jpg
DRDGOLD Limited Consolidated Annual Financial Statements 2026
F-2
Report of Independent Registered Public Accounting Firm
The primary procedures we performed to address this critical audit matter included:
•Utilizing environmental rehabilitation professionals with specialized skills and knowledge, who assisted in evaluating the results of
the Company’s undiscounted estimated environmental costs detailed in the independent environmental expert’s reports. This was
performed by:
–Evaluating the objectivity, knowledge, skills and ability of the Company’s independent expert by comparing their professional
qualifications, experience and affiliations against industry norms and obtained an understanding of their scope of work;
–Evaluating the undiscounted estimated environmental costs for a selection of sites by performing site inspections and
challenging the planned method of rehabilitation that was determined for each selected site. This was performed by comparing
the planned method of rehabilitation to the estimated quantities of economically recoverable gold in the approved LOM plan,
confirming that it is compliant with the environmental management plans as approved by the Department of Mineral and
Petroleum Resources, where applicable, aligned with current industry practices and regulatory requirements, comparing
selected inputs to the group’s mineral reserves and resources report, reviewed by the independent mineral reserves and
resources experts and evaluated the closure liability estimate focusing on key financial and operational items; and
–The auditor’s expert assessed the site layout and closure cost categories, methodologies, legislative framework, model
structure and infrastructure measurements.
•Evaluating the reasonableness of the estimated cost of rehabilitation. This was performed by:
–Testing a sample of projected closure costs and quantities that form the basis of the gross closure liability calculation to assess
completeness and accuracy. This involved agreeing the projected costs to supporting audit evidence, recalculating the
underlying quantities used in the gross closure cost calculation, and agreeing those quantities to relevant audit evidence;
–Testing a sample of year-on-year movements in the cost items and evaluating the changes against audit evidence relating to
changes in the method of rehabilitation, changes in the underlying quantities and changes in the third-party contractor rates;
and
–Assessing the timing of the cash flows, discount rates and inflation rates applied to calculate the present value of estimated
costs of rehabilitation by comparing the rates applied by management to the yields on government bonds with maturities
approximating  the timing  of cash flows also including reasonableness of inflation used by management.
Evaluation of deferred tax liabilities related to the Ergo and FWGR operations
At June 30, 2026, the Company’s net deferred tax liability totaled R 2,891 million. As discussed in note 17.2 to the consolidated
financial statements, the Company’s deferred tax liabilities related to the Ergo and FWGR operations are calculated by applying a
forecast weighted average tax rate to the temporary differences. The calculation of the forecasted weighted average tax rate requires
the use of assumptions and estimates and are inherently uncertain and could change materially over time, including the Company’s
life-of-mine (“LOM”) plan (as discussed in Note 9 to the consolidated financial statements) that is applied to calculate the expected
future profitability.
We identified the valuation of deferred tax liabilities related to the Ergo and FWGR operations as a critical audit matter. Subjective
auditor judgment and specialized skills and knowledge were required to evaluate the expected future profitability, that is based on the
LOM plan, which includes certain key assumptions about the estimated quantities of economically recoverable gold and the
estimated rand gold price.
The primary procedures we performed to address this critical audit matter included:
•Assessing the objectivity, knowledge, skills and ability of the Company’s independent mineral resources experts, who reviewed
management’s mineral reserves and resources estimates, by comparing their professional qualifications, experience and affiliations
against industry norms.
•Testing the company’s mineral resources experts’ reports by vouching a sample of reported reclamation sites to environmental
approvals or mining rights.  This was performed by:
–Evaluating the methodology and key assumptions used to measure quantities of economically recoverable gold against
industry norms.
–Using our technical mining advisory expertise to evaluate the key assumptions, including:
•Verification and validation of the technical data, estimation inputs, and methodologies applied;
•Utilizing mineral resource professionals with specialized skills and knowledge, who assisted in assessing the
reasonableness of the LOM assumptions;
•Evaluating the completeness, transparency, and technical robustness of the supporting documentation;
•Assessing the credibility and consistency of the Mineral Resource statements; and
•Evaluating the material risks, uncertainties, and key assumptions underpinning the Mineral Resource estimates and their
demonstrated economic viability.
–Assessed the reasonableness of the LOM plan and the key assumptions used in the LOM report, including forecast commodity
prices, exchange rates, operating costs, and capital expenditures. We involved our auditor's specialist to assist in evaluating
these assumptions due to the significant judgment and estimation uncertainty inherent in determining future economic
performance and recoverable amounts.
DRDGold_Breadcrumbs_Logo_RGB.jpg
DRDGOLD Limited Consolidated Annual Financial Statements 2026
F-3
Report of Independent Registered Public Accounting Firm
•Testing the LOM report.  This was performed by:
–Vouching a sample of reported reclamation sites to environmental approvals, mining rights, and other regulatory documentation
to assess whether the reported sites are valid and supported by appropriate approvals;
–Evaluating the methodology and key assumptions used to determine quantities of economically recoverable gold, including
comparing these assumptions to industry practices, internal technical guidance, and external benchmarks; and
–Engaging our own auditor’s expert to independently assess the reasonableness of the LOM reports, including verifying the
accuracy of the reported mineral resources and reserves, and assessing whether the quantities disclosed are consistent with
the underlying geological data and industry standards.
•Evaluating the reasonableness of the assumptions and estimates applied in calculating the expected future profitability. This was
performed by:
–Evaluating the reasonableness of total estimated quantities of economically recoverable gold in the LOM plan and agreeing a
selection of period-to-period movements to actual production and adjustments recorded in the experts’ reports;
–Comparing forecasted Rand gold prices to independent analyst reports;
–Obtained the operating and capital expenses used in the forecast and assessed the completeness and accuracy when
compared to prior period actuals and reasonability of forecasts; and
–Comparing historical projections of the Rand gold price and estimated recoverable quantities to actual results and
management’s forecasted weighted average tax rate calculation for reasonability.
•Performing a sensitivity analysis to assess the impact of the forecasted rand gold prices and estimated quantities of economically
recoverable gold, the expected future profitability and the resulting forecasted weighted average tax rate.
/s/ BDO South Africa Incorporated
We have served as the Company's auditor since 2023.
Johannesburg, Republic of South Africa
October 2, 2026
DRDGold_Breadcrumbs_Logo_RGB.jpg
DRDGOLD Limited Consolidated Annual Financial Statements 2026
F-4
Report of Independent Registered Public Accounting Firm
Shareholders and Board of Directors
DRDGOLD Limited
Johannesburg, Republic of South Africa
Opinion on Internal Control over Financial Reporting
We have audited DRDGOLD Limited (the “Company’s”) internal control over financial reporting as of June 30, 2026, based on criteria
established in Internal Control – Integrated Framework (2013) issued by the Committee of Sponsoring Organizations of the Treadway
Commission (the “COSO criteria”). In our opinion, the Company maintained, in all material respects, effective internal control over
financial reporting as of June 30, 2026, based on the COSO criteria.
We also have audited, in accordance with the standards of the Public Company Accounting Oversight Board (United States)
(PCAOB), the consolidated statement of financial position of the Company as of June 30, 2026 and 2025, the consolidated statement
of profit or loss and other comprehensive income, changes in equity, and cash flows for each of the three years in the period ended
June 30, 2026 and the related notes dated October 2, 2026, and expressed an unqualified opinion thereon.
Basis for Opinion
The Company’s management is responsible for maintaining effective internal control over financial reporting and for its assessment of
the effectiveness of internal control over financial reporting, included in the accompanying Item 15(b), Management’s Annual Report
on Internal Control Over Financial Reporting. Our responsibility is to express an opinion on the Company’s internal control over
financial reporting based on our audit. We are a public accounting firm registered with the PCAOB and are required to be
independent with respect to the Company in accordance with U.S. federal securities laws and the applicable rules and regulations of
the Securities and Exchange Commission and the PCAOB.
We conducted our audit of internal control over financial reporting in accordance with the standards of the PCAOB. Those standards
require that we plan and perform the audit to obtain reasonable assurance about whether effective internal control over financial
reporting was maintained in all material respects. Our audit included obtaining an understanding of internal control over financial
reporting, assessing the risk that a material weakness exists, and testing and evaluating the design and operating effectiveness of
internal control based on the assessed risk. Our audit also included performing such other procedures as we considered necessary in
the circumstances. We believe that our audit provides a reasonable basis for our opinion.
Definition and Limitations of Internal Control over Financial Reporting
A company’s internal control over financial reporting is a process designed to provide reasonable assurance regarding the reliability
of financial reporting and the preparation of financial statements for external purposes in accordance with generally accepted
accounting principles. A company’s internal control over financial reporting includes those policies and procedures that (1) pertain to
the maintenance of records that, in reasonable detail, accurately and fairly reflect the transactions and dispositions of the assets of the
company; (2) provide reasonable assurance that transactions are recorded as necessary to permit preparation of financial statements
in accordance with generally accepted accounting principles, and that receipts and expenditures of the company are being made
only in accordance with authorizations of management and directors of the company; and (3) provide reasonable assurance
regarding prevention or timely detection of unauthorized acquisition, use, or disposition of the company’s assets that could have a
material effect on the financial statements.
Because of its inherent limitations, internal control over financial reporting may not prevent or detect misstatements. Also, projections
of any evaluation of effectiveness to future periods are subject to the risk that controls may become inadequate because of changes
in conditions, or that the degree of compliance with the policies or procedures may deteriorate.
/s/ BDO South Africa Incorporated
We have served as the Company’s auditor since 2023.
Johannesburg, Republic of South Africa
October 2, 2026
DRDGold_Breadcrumbs_Logo_RGB.jpg
DRDGOLD Limited Consolidated Annual Financial Statements 2026
F-5
CONSOLIDATED STATEMENT OF PROFIT OR LOSS AND
OTHER COMPREHENSIVE INCOME
for the year ended 30 June 2026
Amounts in R million
Note
2026
2025
2024
Revenue
4
11,159.0
7,878.2
6,239.7
Cost of sales
5.1
(5,193.9)
(4,747.7)
(4,429.9)
Gross Profit from operating activities
5,965.1
3,130.5
1,809.8
Other income
9.4
—
2.0
Administration expenses and other costs
5.2
(232.7)
(213.8)
(199.3)
Loss on disposal of subsidiary
22
(4.8)
—
—
Results from operating activities
5,737.0
2,916.7
1,612.5
Finance income
6
245.5
223.8
280.8
Finance expense
7
(100.0)
(73.4)
(76.4)
Profit before tax
5,882.5
3,067.1
1,816.9
Income tax
17.1
(1,627.0)
(824.4)
(488.2)
Profit for the year1
4,255.5
2,242.7
1,328.7
Other comprehensive income
Items that will not be reclassified to profit or loss, net of tax
Net fair value adjustment on equity investments at fair value through
other comprehensive income
242.2
139.1
11.7
Fair value adjustment on equity investments at fair value through
other comprehensive income
25
244.4
139.8
11.8
Deferred tax thereon
17.2
(2.2)
(0.7)
(0.1)
Total other comprehensive income for the year
242.2
139.1
11.7
Total comprehensive income for the year
4,497.7
2,381.8
1,340.4
Earnings per share
Basic earnings per share (SA cents per share)
8
492.1
260.1
154.3
Diluted basic earnings per share (SA cents per share)
8
489.2
258.9
153.5
12025: Included in profit for the year and total comprehensive income for the year is a loss from subsidiary held for sale of R2.1 million. Of this loss,
R1.0 million is attributable to non-controlling interest (“NCI”).
The accompanying notes are an integral part of these consolidated financial statements.

DRDGold_Breadcrumbs_Logo_RGB.jpg
DRDGOLD Limited Consolidated Annual Financial Statements 2026
F-6
CONSOLIDATED STATEMENT OF FINANCIAL POSITION
at 30 June 2026
Amounts in R million
Note
2026
2025
ASSETS
Non-current assets
13,626.1
9,962.5
Property, plant and equipment
9
11,918.4
8,542.2
Investments in rehabilitation and other funds
11
1,100.6
1,002.8
Payments made under protest
24
31.0
56.7
Other investments
25
567.0
322.5
Deferred tax asset
17.2
9.1
38.3
Current Assets
3,815.9
2,283.5
Inventories
16
580.1
522.6
Current tax receivable
17.3
7.8
4.3
Trade and other receivables
14
458.0
329.6
Asset held for sale
22
—
120.8
Cash and cash equivalents
12
2,770.0
1,306.2
TOTAL ASSETS
17,442.0
12,246.0
EQUITY AND LIABILITIES
Equity
12,747.5
8,883.0
Stated share capital
20.1
6,310.5
6,197.3
Retained earnings
6,437.0
2,685.7
Non-current liabilities
3,639.4
2,361.8
Provision for environmental rehabilitation
10
721.4
558.7
Deferred tax liability
17.2
2,900.4
1,781.8
Liability for post-retirement medical benefits
11.3
11.3
Lease liabilities
6.3
10.0
Current liabilities
1,055.1
1,001.2
Trade and other payables
15
1,012.8
954.4
Lease liabilities
5.1
7.4
Current tax liability
17.3
37.2
29.5
Liabilities directly associated with the asset held for sale
22
—
9.9
Total Liabilities
4,694.5
3,363.0
TOTAL EQUITY AND LIABILITIES
17,442.0
12,246.0
The accompanying notes are an integral part of these consolidated financial statements.
DRDGold_Breadcrumbs_Logo_RGB.jpg
DRDGOLD Limited Consolidated Annual Financial Statements 2026
F-7
CONSOLIDATED STATEMENT OF CHANGES IN EQUITY
for the year ended 30 June 2026
Stated share
Retained
Total
Amounts in R million
Note
capital
earnings
equity
Balance at 30 June 2023
6,187.9
86.2
6,274.1
Total comprehensive income
Profit for the year
1,328.7
1,328.7
Other comprehensive income
11.7
11.7
Total comprehensive income
—
1,340.4
1,340.4
Transactions with the owners of the parent
Contributions and distributions
Treasury shares disposed1
20.1, 18.1
4.3
(4.3)
—
Dividend on ordinary shares
20.2
(731.7)
(731.7)
Equity-settled share-based payment expense
18.1
26.4
26.4
Equity-settled share-based payment income tax impact on
equity
18
(20.5)
(20.5)
Equity-settled share-based payment vesting impact on equity
0.7
0.7
Total contributions and distributions
4.3
(729.4)
(725.1)
Balance at 30 June 2024
20.1
6,192.2
697.2
6,889.4
Total comprehensive income
Profit for the year
2,242.7
2,242.7
Other comprehensive income
139.1
139.1
Total comprehensive income
—
2,381.8
2,381.8
Transactions with the owners of the parent
Contributions and distributions
Treasury shares disposed1
20.1, 18.1
5.1
(5.1)
—
Dividend on ordinary shares
20.2
(431.0)
(431.0)
Equity-settled share-based payment expense
18.1
30.1
30.1
Equity-settled share-based payment income tax impact on
equity
18
12.7
12.7
Equity-settled share-based payment vesting impact on equity
1.0
1.0
Total contributions and distributions
5.1
(392.3)
(387.2)
Transactions with non-controlling interest
Loss attributable to NCI
(1.0)
(1.0)
Balance at 30 June 2025
20.1
6,197.3
2,685.7
8,883.0
DRDGold_Breadcrumbs_Logo_RGB.jpg
DRDGOLD Limited Consolidated Annual Financial Statements 2026
F-8
CONSOLIDATED STATEMENT OF CHANGES IN EQUITY
continued
for the year ended 30 June 2026
Stated share
Retained
Total
Amounts in R million
Note
capital
earnings
equity
Total comprehensive income
Profit for the year
4,255.5
4,255.5
Other comprehensive income
242.2
242.2
Total comprehensive income
—
4,497.7
4,497.7
Transactions with the owners of the parent
Contributions and distributions
Treasury shares disposed1
20.1, 18.1
11.6
(11.6)
—
Shares issued for the grant/vesting of the equity-settled
share-based payment2
18.1
101.6
(101.6)
—
Dividend on ordinary shares
20.2
(779.3)
(779.3)
Equity-settled share-based payment expense
18.1
41.7
41.7
Equity-settled share-based payment income tax impact on
equity
17.2, 17.3
(11.9)
(11.9)
Equity-settled share-based payment vesting impact on equity
(1.1)
(1.1)
Shareholder contribution – Acquisition of Kloof 2 dump
10
117.4
117.4
Total contributions and distributions
113.2
(746.4)
(633.2)
Balance at 30 June 2026
20.1
6,310.5
6,437.0
12,747.5
1Treasury shares disposed of for the vesting of the equity-settled share-based payment.
2Share issue on 27 August 2025 relating to the DSP grant of R47.4 million and share issue on 20 October 2025 relating to the ELTI vesting of
R54.2 million.
The accompanying notes are an integral part of these consolidated financial statements.
DRDGold_Breadcrumbs_Logo_RGB.jpg
DRDGOLD Limited Consolidated Annual Financial Statements 2026
F-9
CONSOLIDATED STATEMENT OF CASH FLOWS
for the year ended 30 June 2026
Amounts in R million
Note
2026
2025
2024
CASH FLOWS FROM OPERATING ACTIVITIES
Cash generated from operations
13
6,036.5
3,376.9
1,738.3
Finance income received
6
138.9
63.7
154.6
Dividends received
6
—
56.3
29.3
Finance expense paid
7
(11.0)
(11.5)
(4.5)
Income tax (paid)/received
17.3
(489.1)
25.7
(72.5)
Net cash inflow from operating activities
5,675.3
3,511.1
1,845.2
CASH FLOWS FROM INVESTING ACTIVITIES
Acquisition of property, plant and equipment
9,  22
(3,531.6)
(2,254.9)
(2,985.7)
Proceeds on disposal of property, plant and equipment
—
—
0.3
Investment in rehabilitation and other funds
—
—
(33.8)
Proceeds from disposal of subsidiary
22
147.5
—
—
Contribution to other investments
25
—
(2.3)
—
Environmental rehabilitation payments to reduce liabilities
with a related asset
10
(24.8)
(26.1)
(23.4)
Net cash outflow from investing activities
(3,408.9)
(2,283.3)
(3,042.6)
CASH FLOWS FROM FINANCING ACTIVITIES
Dividends paid on ordinary shares
20.2
(779.3)
(431.0)
(731.7)
Acquisition of minority interest in Stellar
22
(15.2)
—
—
Repayment of lease liabilities
(8.1)
(12.1)
(19.0)
Net cash outflow from financing activities
(802.6)
(443.1)
(750.7)
NET INCREASE/(DECREASE) IN CASH AND CASH
EQUIVALENTS
1,463.8
784.7
(1,948.1)
Impact of fluctuations in exchange rate on cash held in foreign
currencies
—
—
(1.8)
Cash and cash equivalents at the beginning of the year
1,306.2
521.5
2,471.4
Cash and cash equivalents at the end of the year
12
2,770.0
1,306.2
521.5
The accompanying notes are an integral part of these consolidated financial statements.
DRDGold_Logo_RGB.gif
DRDGOLD Limited Consolidated Annual Financial Statements 2026
F-10
NOTES TO THE CONSOLIDATED FINANCIAL STATEMENTS 
for the year ended 30 June 2026
1ABOUT THESE CONSOLIDATED FINANCIAL STATEMENTS
Reporting entity
The DRDGOLD Group is primarily involved in the extraction of gold from the retreatment of surface mine tailings. The
consolidated financial statements comprise DRDGOLD Limited (“DRDGOLD” or the “Company”) and its subsidiaries who
are all wholly owned subsidiaries and solely operate in South Africa (collectively the “Group” and individually “Group
Companies”). The Company is domiciled in South Africa with a registration number of 1895/000926/06. The registered
address of the Company is Constantia Office Park, Cnr 14th Avenue and Hendrik Potgieter Road, Cycad House,
Building 17, Ground Floor, Weltevreden Park, 1709.
DRDGOLD is 50.1% held by Sibanye Gold Proprietary Limited, which in turn is a wholly owned subsidiary of Sibanye
Stillwater Limited (“Sibanye-Stillwater”).
Basis of accounting
The consolidated financial statements have been prepared in accordance with International Financial Reporting Standards
Accounting Standards (“IFRS Accounting Standards”) and its interpretations issued by the International Accounting
Standards Board (“IASB”). The consolidated financial statements were approved by the board of directors of the Company
(“Board”) for issuance on 30 September 2026.
The directors believe that the Group has adequate resources to continue as a going concern for the foreseeable future. The
consolidated financial statements have been prepared on a going concern basis.
Functional and presentation currency
The functional and presentation currency of DRDGOLD and its subsidiaries is South African Rand (“Rand”). The amounts
in these consolidated financial statements are rounded to the nearest million unless stated otherwise. Significant exchange
rates during the year are set out in the table below:
Rand / US dollar
2026
2025
2024
Spot rate at year end
16.39
17.75
18.19
Average prevailing rate for the financial year
16.88
18.15
18.70
Basis of measurement
The consolidated financial statements are prepared on the historical cost basis, unless otherwise stated.
Basis of consolidation
Subsidiaries
Subsidiaries are entities controlled by the Group. The Group controls an entity when it is exposed to, or has rights to,
variable returns from its involvement with the entity and has the ability to affect those returns through its power over the
entity. The financial statements of subsidiaries are included in the consolidated financial statements from the date that
control commences until the date that control ceases.
Loss of control
When the Group loses control over a subsidiary, it derecognises the assets and liabilities of the subsidiary, and any related
non-controlling interest and other components of equity. Any resulting gain or loss is recognised in profit or loss. Any
interest retained in the former subsidiary is measured at fair value when control is lost.
Transactions eliminated on consolidation
Intra-group balances, transactions and any unrealised gains and losses or income and expenses arising from intra-group
transactions, are eliminated in preparing the consolidated financial statements.
DRDGold_Breadcrumbs_Logo_RGB.jpg
DRDGOLD Limited Consolidated Annual Financial Statements 2026
F-11
NOTES TO THE CONSOLIDATED FINANCIAL STATEMENTS continued
for the year ended 30 June 2026
2USE OF ACCOUNTING ASSUMPTIONS, ESTIMATES AND JUDGEMENTS
The preparation of the consolidated financial statements requires management to make accounting assumptions, estimates
and judgements that affect the application of the Group’s accounting policies and reported amounts of assets and liabilities,
income and expenses.
Accounting assumptions, estimates and judgements are reviewed on an ongoing basis. Revisions to reported amounts are
recognised in the period in which the revision is made and in any future periods affected. Actual results may differ from
these estimates.
Information about assumptions and estimates in applying accounting policies that have the most significant effect on the
amounts recognised in the consolidated financial statements are included in the notes:
NOTE 9        PROPERTY, PLANT AND EQUIPMENT
NOTE 10      PROVISION FOR ENVIRONMENTAL REHABILITATION
NOTE 17      INCOME TAX
NOTE 24      PAYMENTS MADE UNDER PROTEST
NOTE 25      OTHER INVESTMENTS
Information about significant judgements in applying accounting policies that have the most significant effect on the
amounts recognised in the consolidated financial statements are included in the notes:
NOTE 24      PAYMENTS MADE UNDER PROTEST
NOTE 25      OTHER INVESTMENTS
NOTE 26      CONTINGENCIES
3NEW STANDARDS, AMENDMENTS TO STANDARDS AND INTERPRETATIONS
New standards, amendments to standards and interpretations effective for the year ended 30 June 2026
During the financial year, the following new and revised accounting standards, amendments to standards and new
interpretations were adopted by the Group.
Disclosures about Uncertainties in the Financial Statements - Illustrative Examples
Illustrative examples were issued illustrating how an entity applies the requirements in IFRS Accounting Standards to
disclose the effects of uncertainties in its financial statements. The examples do not add to or change requirements in IFRS
Accounting Standards and therefore there are no transition requirements.
The amendment did not have a significant impact on the Group.
New standards, amendments to standards and interpretations not yet effective for the year ended 30 June 2026
At the date of authorisation of these consolidated financial statements, the following relevant standards, amendments to
standards and interpretations that may be applicable to the business of the Group were in issue but not yet effective and
may therefore have an impact on future consolidated financial statements. These new standards, amendments to standards
and interpretations will be adopted at their effective dates.
Annual improvements to IFRS Accounting Standards (Effective 1 July 2026)
The IASB published annual improvements to IFRS Accounting Standards relating to various standards applied by the
Group in the consolidated financial statements. The amendments are primarily clarifications, internal referencing updates
and editorial changes to IFRS Accounting Standards.
The amendment is not expected to have a significant impact on the Group.
IFRS 9 Financial Instruments and IFRS 7 Financial Instruments: Disclosure (Amendment - Classification and
Measurement of Financial Instruments) (Effective 1 July 2026)
The amendments provide guidance on the classification of financial assets with contingent features. Under IFRS 9, it was
unclear whether the contractual cash flows of some financial assets with Environmental, Social and Governance (“ESG”) -
linked features represented the solely payments of principal and interest (“SPPI”) criterion, which is a condition for
measurement at amortised cost. The amendments apply to all contingent features, not just ESG-linked features and
introduce an additional SPPI test for financial assets with contingent features that are not related directly to a change in
basic lending risks or costs. The amendments also include additional disclosures for all financial assets and liabilities that
have certain contingent features that are not related directly to a change in basic lending risks or costs, and are not
measured at fair value through profit or loss. The amendments to IFRS 9 also clarify when a financial asset and financial
liability is recognised and derecognised and provides an exception for certain financial liabilities settled using an electronic
payment system. The exception allows for financial liabilities to be derecognised before the settlement date if certain criteria
are met.
The amendment is not expected to have a significant impact on the Group.
DRDGold_Logo_RGB.gif
DRDGOLD Limited Consolidated Annual Financial Statements 2026
F-12
NOTES TO THE CONSOLIDATED FINANCIAL STATEMENTS continued
for the year ended 30 June 2026
3NEW STANDARDS, AMENDMENTS TO STANDARDS AND INTERPRETATIONS continued
New standards, amendments to standards and interpretations not yet effective for the year ended 30 June 2026
continued
IFRS 9 Financial Instruments and IFRS 7 Financial Instruments: Disclosure (Contracts Referencing Nature-
dependent Electricity (previously Power Purchase Agreements)) (Effective 1 July 2026)
The amendments address challenges in contracts referencing nature-dependent electricity, referred to as renewable power
purchase agreements (“PPAs”). The amendments include the own-use exemption for purchasers in PPAs and hedge
accounting requirements for purchasers and sellers in PPAs. To apply the own-use exemption to a PPA, IFRS 9 currently
requires the contract to be for receipt of electricity in line with the entity’s expected purchase or usage requirements. The
amendments allow an entity to apply the own-use exemption to PPAs if the entity is, and expects to be, a net-purchaser of
electricity for the contract period.
The amendment is not expected to have a significant impact on the Group.
IFRS 18 Presentation and disclosure in financial statements (Effective 1 July 2027)
IFRS 18 was issued to address the need for more relevant information in financial statements. IFRS 18 will have no impact on
net profit, however it will change how the Group’s results are presented on the consolidated income statement and
information disclosed in the notes to the consolidated financial statements. This also includes disclosure of certain non-
GAAP measures, which will form part of the audited consolidated financial statements. IFRS 18 introduces a more structured
income statement such as a newly defined subtotal for operating profit and a requirement for entities to allocate all income
and expenses between three new distinct categories based on the entity’s main business activities (operating, investing,
and financing activities). IFRS 18 also requires entities to analyse their operating expenses directly on the income statement,
which is either by nature, by function or using a mixed presentation. IFRS 18 also requires entities to report some of their
non-GAAP measures in the financial statements. It introduces a narrow definition for management performance measures
(“MPM”) and requires MPMs to be a subtotal of income and expenses that is used in public communications outside of the
financial statements and reflective of management’s view of financial performance of an entity as a whole.
IFRS 18 is expected to have a significant impact on the presentation of the Consolidated Statement of Profit or Loss and
Other Comprehensive Income and the extent of the impact is currently being assessed and will be reported on in the
following reporting years.
4REVENUE
ACCOUNTING POLICIES
Revenue comprises the sale of gold and silver bullion (produced as a by-product).
Revenue is measured based on the consideration specified in a contract with the customer, being South African bullion
banks. The consideration is based on the gold price derived on the gold market on the day a contract is entered into with
the bullion bank. The Group recognises revenue at a point in time when the Group transfers the gold and silver bullion to the
bullion bank and the sale price is fixed, as evidenced by deal confirmations. It is at this point that the customer obtains
control of the gold and silver bullion, which is the settlement date specified in the contract.
On the settlement date, the revenue can be measured reliably and the recovery of the consideration is probable. The
customer is contractually obliged to make payment to the Group on the same day that the Group delivers/completes the
contract and therefore no significant financing component exists.
Amounts in R million
2026
2025
2024
Gold revenue
11,137.2
7,864.3
6,229.7
Silver revenue
21.8
13.9
10.0
Total revenue
11,159.0
7,878.2
6,239.7
A disaggregation of revenue by operating segment is presented in note 23 Operating Segments.
DRDGold_Breadcrumbs_Logo_RGB.jpg
DRDGOLD Limited Consolidated Annual Financial Statements 2026
F-13
NOTES TO THE CONSOLIDATED FINANCIAL STATEMENTS continued
for the year ended 30 June 2026
4REVENUE continued
MARKET RISK
Commodity price sensitivity
The Group’s profitability and the cash flows are significantly affected by changes in the market price of gold which is sold in
US Dollars. The Group did not enter into any hedging arrangements during the year.
The Group's policy is to remain an unhedged gold producer and, accordingly, it does not ordinarily enter into forward gold
sales contracts to hedge exposure to movements in the US dollar gold price or exchange rates. In circumstances where
medium-term debt is raised to fund growth projects, the Group may enter into price protection arrangements to mitigate
consequential liquidity risk. No such contracts were entered into during the current reporting period.
A change of 20% (2025 and 2024: 20%) in the average US Dollar gold price received during the financial year would have
increased/(decreased) equity and profit/(loss) by the amounts shown below. This analysis assumes that all other variables
remain constant and specifically excludes the impact on income tax.
Amounts in R million
2026
2025
2024
20% increase in the US Dollar gold price
(2025 and 2024: 20%)
2,227.4
1,575.6
1,247.9
20% decrease in the US Dollar gold price
(2025 and 2024: 20%)
(2,227.4)
(1,575.6)
(1,247.9)
Exchange rate sensitivity
The Group’s profitability and the cash flows are significantly affected by changes in the Rand to the US Dollar exchange rate.
The Group did not enter into any hedging arrangements during the year.
A change of 10% (2025: 10%; 2024 20%) in the average Rand to US Dollar exchange rate received during the financial year
would have increased/(decreased) equity and profit/(loss) by the amounts shown below. This analysis assumes that all other
variables remain constant and specifically excludes the impact on income tax.
Amounts in R million
2026
2025
2024
10% increase in the US Dollar exchange rate
(2025: 10%; 2024: 20%)
1,113.7
787.8
1,247.9
10% decrease in the US Dollar exchange rate
(2025: 10%; 2024: 20%)
(1,113.7)
(787.8)
(1,247.9)
Due to lower volatility in the Rand to US Dollar exchange rate the sensitivity was reduced in 2025 to 10% from 20%.
5RESULTS FROM OPERATING ACTIVITIES
5.1COST OF SALES
Amounts in R million
Note
2026
2025
2024
Cost of sales
(5,193.9)
(4,747.7)
(4,429.9)
Operating costs (a)
(4,735.2)
(4,404.6)
(4,206.0)
Movement in gold in process and finished inventories – Gold
Bullion
5.4
18.1
34.9
Change in estimate of environmental rehabilitation
10
13.1
98.0
11.6
Depreciation
9
(477.2)
(459.2)
(270.4)
(a)  The most significant components of operating
        costs include:
Consumable stores
(1,512.4)
(1,376.0)
(1,303.3)
Labour including short-term incentives
(767.8)
(747.2)
(734.9)
Electricity
(516.0)
(544.0)
(586.1)
Specialist service providers
(1,021.5)
(876.2)
(851.7)
Machine hire
(173.4)
(156.3)
(198.4)
Security expenses
(216.8)
(198.5)
(167.2)
Water
(42.7)
(45.1)
(32.5)
DRDGold_Breadcrumbs_Logo_RGB.jpg
DRDGOLD Limited Consolidated Annual Financial Statements 2026
F-14
NOTES TO THE CONSOLIDATED FINANCIAL STATEMENTS continued
for the year ended 30 June 2026
5RESULTS FROM OPERATING ACTIVITIES continued
5.1COST OF SALES continued
RELATED PARTY TRANSACTIONS
Far West Gold Recoveries Proprietary Limited (“FWGR”) entered into an agreement with Sibanye-Stillwater effective
31 July 2018 for the pumping and supply of water and electricity to the FWGR operations for which FWGR is invoiced based
on metered usage of water and electricity.
FWGR also entered into a smelting agreement with Sibanye-Stillwater effective 31 July 2018 to smelt and recover gold from
gold loaded carbon produced at FWGR, and deliver the gold to Rand Refinery for refinement. As consideration for this
service, Sibanye-Stillwater receives a fee based on the smelting costs plus 10% of the smelting costs.
Rand Refinery performs the final refinement and administration of the gold bars delivered and as consideration for this
service receives a variable refining fee and administration fee. Rand Refinery is a related party to the Group through the
Group's and Sibanye-Stillwater’s shareholding in Rand Refinery.
All transactions and outstanding balances with related parties are to be settled in cash within 30 days of the invoice date.
None of the balances are secured. No expense has been recognised in the current year as a credit loss allowance in respect
of amounts charged to related parties.
Amounts in R million
2026
2025
2024
Services rendered by related parties and included in
operating costs:
Supply of water and electricity1
(60.0)
(122.0)
(114.5)
Gold smelting and related charges1
(3.7)
(16.6)
(22.5)
Other charges1
(0.2)
(0.3)
(0.3)
Gold refining and related charges2
(10.8)
(8.4)
(7.6)
(74.7)
(147.3)
(144.9)
1Paid to Sibanye-Stillwater by FWGR.
2Paid to Rand Refinery by Ergo.
5.2ADMINISTRATION EXPENSES AND OTHER COSTS
Amounts in R million
Note
2026
2025
2024
Included in administration expenses and other costs are the
following:
Corporate salaries and short-term incentives
(100.5)
(90.1)
(89.3)
Share-based payment expense
18.1
(41.7)
(30.1)
(26.4)
Information technology costs
(24.5)
(21.9)
(14.8)
Exploration and project related costs
(5.5)
(9.2)
(6.8)
Other costs and administration expenses
(60.5)
(62.5)
(62.0)
(232.7)
(213.8)
(199.3)
DRDGold_Breadcrumbs_Logo_RGB.jpg
DRDGOLD Limited Consolidated Annual Financial Statements 2026
F-15
NOTES TO THE CONSOLIDATED FINANCIAL STATEMENTS continued
for the year ended 30 June 2026
6FINANCE INCOME
ACCOUNTING POLICY
Finance income includes interest received, growth in investment in Guardrisk, dividends received, the unwinding of the
payments made under protest and foreign exchange gains.
Amounts in R million
Note
2026
2025
2024
Interest earned on cash and cash equivalents#
12
136.5
68.3
148.5
Growth in investment in Guardrisk
11
97.8
90.3
84.5
Dividends received
25
—
56.3
29.3
Unwinding of payments made under protest
24
9.4
7.8
7.2
Realised/unrealised foreign exchange gain
0.9
0.2
10.4
Other finance income#
0.9
0.9
0.9
245.5
223.8
280.8
Cash interest received consists of items denoted above (#), including the movement in interest receivable noted in Note 14.
7FINANCE EXPENSE
ACCOUNTING POLICY
Finance expenses comprise interest payable on financial instruments measured at amortised cost calculated using the
effective interest method, unwinding of the provision for environmental rehabilitation, the discount recognised on payments
made under protest, interest on lease liabilities and foreign exchange losses.
Amounts in R million
Note
2026
2025
2024
Interest on financial liabilities measured at amortised cost#
(1.1)
(1.5)
(1.5)
Unwinding of provision for environmental rehabilitation
10
(51.0)
(58.6)
(56.3)
Discount recognised on payments made under protest
24
(37.8)
(3.3)
(14.0)
Interest on lease liabilities#
(1.7)
(2.3)
(3.0)
Realised foreign exchange loss
(0.2)
—
(1.6)
Other finance expenses#
(8.2)
(7.7)
—
(100.0)
(73.4)
(76.4)
Cash interest paid consists of items denoted above (#).
DRDGold_Breadcrumbs_Logo_RGB.jpg
DRDGOLD Limited Consolidated Annual Financial Statements 2026
F-16
NOTES TO THE CONSOLIDATED FINANCIAL STATEMENTS continued
for the year ended 30 June 2026
8EARNINGS PER SHARE
Amounts in R million
Note
2026
2025
2024
The calculations of basic and diluted earnings per
ordinary share are based on the following:
Profit attributable to equity holders
4,255.5
2,242.7
1,328.7
Reconciliation of weighted average number of ordinary
shares to diluted weighted average number of ordinary
shares
2026
2025
2024
Weighted average number of ordinary shares in issue
864,677,984
862,142,826
861,240,788
Effect of equity-settled share-based payment
5,166,433
4,210,349
4,306,645
Dilutive weighted average number of ordinary shares
869,844,417
866,353,175
865,547,433
SA cents per share
2026
2025
2024
Basic earnings per share
492.1
260.1
154.3
Diluted basic earnings per share
489.2
258.9
153.5
9PROPERTY, PLANT AND EQUIPMENT
SIGNIFICANT ACCOUNTING ASSUMPTIONS AND ESTIMATES
Mineral resources and mineral reserves estimates
The Group is required to determine and report mineral resources and mineral reserves in accordance with the
South African Code for the Reporting of Exploration Results, Mineral Resources and Mineral Reserves (“SAMREC Code”)
2016 edition and Subpart 1300 of Regulation S-K. In order to calculate mineral resources and mineral reserves, estimates
and assumptions are required about a range of geological, technical and economic factors, including but not limited to
quantities, grades, production techniques, recovery rates, production costs, transport costs, commodity demand,
commodity prices and exchange rates. Estimating the quantity and/or grade of mineral resources and mineral reserves
requires the size, shape and depth of reclamation sites to be determined by analysing geological data such as the logging
and assaying of drill samples. This process may require complex and difficult geological judgements and calculations to
interpret the data. Because the assumptions used to estimate mineral resources and mineral reserves change from period
to period and because additional geological data is generated during the course of operations, estimates of mineral
resources and mineral reserves may change from period to period. Mineral resources and mineral reserves estimates
prepared by management are reviewed by independent mineral resources and mineral reserves experts.
Changes in reported mineral resources and mineral reserves may affect the Group’s life-of-mine plan, financial results and
financial position in a number of ways including the following:
•asset carrying values may be affected due to changes in estimated future cash flows;
•depreciation charged to profit or loss may change where such charges are determined by the units-of-production
method, or where the useful lives of assets change;
•decommissioning, site restoration and environmental provisions may change where changes in estimated mineral
resources and mineral reserves affect expectations about the timing or cost of these activities; and
•the carrying value of deferred tax assets and liabilities may change due to changes in estimates of the likely recovery of
the tax benefits and charges.
Depreciation
The calculation of the units-of-production rate of depreciation could be affected if actual production in the future varies
significantly from current forecast production. This would generally arise when there are significant changes in any of the
factors or assumptions used in estimating mineral resources and mineral reserves. These factors could include:
•changes in mineral resources and mineral reserves;
•the grade of mineral resources and mineral reserves may vary from time to time;
•differences between actual commodity prices and commodity price assumptions;
•unforeseen operational issues at mine sites including planned extraction efficiencies; and
•changes in capital, operating, mining processing and reclamation costs, discount rates and foreign exchange rates.
DRDGold_Breadcrumbs_Logo_RGB.jpg
DRDGOLD Limited Consolidated Annual Financial Statements 2026
F-17
NOTES TO THE CONSOLIDATED FINANCIAL STATEMENTS continued
for the year ended 30 June 2026
9PROPERTY, PLANT AND EQUIPMENT continued
ACCOUNTING POLICIES
Recognition and measurement
Property, plant and equipment comprise mine plant facilities and equipment, mine property and development, solar power
plant and BESS and exploration assets. These assets (excluding exploration assets) are initially measured at cost, where
after they are measured at cost less accumulated depreciation and accumulated impairment losses. Exploration assets are
initially measured at cost, where after they are measured at cost less accumulated impairment losses.
Cost includes expenditure that is directly attributable to the acquisition or construction of the asset, borrowing costs
capitalised, as well as the costs of dismantling and removing an asset and restoring the site on which it is located.
Subsequent costs are included in the asset’s carrying amount or recognised as a separate asset, as appropriate, only
when it is probable that future economic benefits associated with the item will flow to the Group and the cost of the item can
be measured reliably. Exploration and evaluation costs are capitalised as exploration assets on a project-by-project basis,
pending determination of the technical feasibility and commercial viability of the project.
Exploration assets consists of costs of acquiring rights, activities associated with converting a mineral resource to a mineral
reserve – the process thereof includes drilling, sampling and other processes necessary to evaluate the technical feasibility
and commercial viability of a mineral resource to prove whether a mineral reserve exists. Exploration assets also include
geological, geochemical and geophysical studies associated with prospective projects and tangible assets which comprise
property, plant and equipment used for exploratory activities. Costs are capitalised to the extent that they are a directly
attributable exploration expenditure and classified as a separate class of assets on a project by project basis. Once a
mineral reserve is determined or the project ready for development, the asset attributable to the mineral reserve or project is
assessed for impairment and then reclassified to the appropriate class of assets. Depreciation commences when the
assets are available for use. Exploration and evaluation expenses prior to acquiring rights to explore is recognised in profit
or loss.
Depreciation
Depreciation of mine plant facilities and equipment, as well as mining property and development are calculated using the
units-of-production method which is based on the life-of-mine of each site. The life-of-mine is primarily based on proved and
probable mineral reserves. It reflects the estimated quantities of economically recoverable gold that can be recovered from
reclamation sites based on the estimated gold price. Changes in the life-of-mine will impact depreciation on a prospective
basis. The life-of-mine is prepared using a methodology that takes account of current information to assess the
economically recoverable gold from specific reclamation sites and includes the consideration of historical experience.
The solar power plant which includes the 60MW solar photovoltaic plant and 160mWh battery energy storage system is
depreciated on a straight-line basis over 25 and 20 years respectively.
The depreciation method, estimated useful lives and residual values are reassessed annually and adjusted if appropriate.
The current estimated useful lives are based on the life-of-mine of each site, currently between 1 year (2025 and
2024: 1 year) and 21 years (2025: 22 years; 2024: 18 years) for mining assets of Ergo and between 1 year (2025 and 2024:
1 year) and 20 years (2025: 16 years; 2024: 17 years) for FWGR mining assets. FWGR’s life-of-mine increased mainly due
to the addition of the Kloof 2 Dump, which will impact the depreciation in the next financial year.
Impairment
The carrying amounts of property, plant and equipment are reviewed at each reporting date to determine whether there is
any indication of impairment, or whenever events or changes in circumstances indicate that the carrying amount may not
be recoverable. If any such indication exists, the asset’s recoverable amount is estimated. For the purposes of assessing
impairment, assets are grouped at the lowest levels for which there are separately identifiable cash flows (“CGUs”). The
key assets of a surface retreatment operation which constitutes a CGU are a reclamation site, a metallurgical plant and a
tailings storage facility. These key assets operate interdependently to produce gold. The Ergo and FWGR operations each
have separately managed and monitored reclamation sites, metallurgical plants and tailings storage facilities and are
therefore separate CGUs. The Ergo solar power plant with integrated BESS form part of the Ergo CGU as there is currently
no active market for its cash flows which can be generated independently.
The recoverable amount of an asset or CGU is the greater of its value in use and its fair value less costs to sell. The
estimated future cash flows are discounted to their present value using a pre-tax discount rate that reflects current market
assessments of the time value of money and the risks specific to the asset. An impairment loss is recognised in profit or loss
if the carrying amount of an asset or CGU exceeds its recoverable amount.
DRDGold_Breadcrumbs_Logo_RGB.jpg
DRDGOLD Limited Consolidated Annual Financial Statements 2026
F-18
NOTES TO THE CONSOLIDATED FINANCIAL STATEMENTS continued
for the year ended 30 June 2026
9PROPERTY, PLANT AND EQUIPMENT continued
Amounts in R million
Note
Mine plant
facilities and
equipment
Mine property
and
development
Solar power
plant and BESS
Exploration
assets
Capital
work in
progress1
Total
30 June 2026
Cost
3,559.7
3,222.9
2,890.0
22.4
5,629.2
15,324.2
Balance at the beginning of the year
3,317.7
3,130.1
2,858.8
21.6
2,161.7
11,489.9
Additions – property, plant and equipment owned2
251.4
100.6
27.8
0.8
3,356.3
3,736.9
Additions - right of use assets
1.0
1.1
—
—
—
2.1
Lease derecognitions
(10.6)
—
—
—
—
(10.6)
Disposals and scrapping
(3.0)
(6.0)
—
—
—
(9.0)
Change in estimate of environmental rehabilitation provision with a
related asset
10
113.0
(1.5)
3.4
—
—
114.9
Transfers between classes of property, plant and equipment
(109.8)
(1.4)
—
—
111.2
—
Accumulated depreciation and impairment
(1,549.5)
(1,621.8)
(224.8)
(9.7)
—
(3,405.8)
Balance at the beginning of the year
(1,382.6)
(1,453.7)
(101.7)
(9.7)
—
(2,947.7)
Depreciation
5.1
(180.3)
(173.8)
(123.1)
—
—
(477.2)
Lease derecognitions
10.6
—
—
—
—
10.6
Disposals and scrapping
2.8
5.7
—
—
—
8.5
Carrying value at end of the year
2,010.2
1,601.1
2,665.2
12.7
5,629.2
11,918.4
Comprising:
Property, plant and equipment owned
2,007.1
1,588.8
2,665.2
12.7
5,629.2
11,903.0
Right of use assets
3.1
12.3
—
—
—
15.4
Carrying value at end of the year
2,010.2
1,601.1
2,665.2
12.7
5,629.2
11,918.4
DRDGold_Breadcrumbs_Logo_RGB.jpg
DRDGOLD Limited Consolidated Annual Financial Statements 2026
F-19
NOTES TO THE CONSOLIDATED FINANCIAL STATEMENTS continued
for the year ended 30 June 2026
9
PROPERTY, PLANT AND EQUIPMENT continued
Amounts in R million
Note
Mine plant
facilities and
equipment
Mine property
and
development
Solar power
plant and BESS
Exploration
assets
Capital
work in
progress1
Total
30 June 2025
Cost
3,317.7
3,130.1
2,858.8
21.6
2,161.7
11,489.9
Balance at the beginning of the year
3,106.6
2,944.0
—
19.2
3,219.6
9,289.4
Additions – property, plant and equipment owned2
177.2
175.5
90.1
3.0
1,754.2
2,200.0
Additions - right of use assets
0.3
2.5
—
—
—
2.8
Lease derecognitions
(1.2)
—
—
—
—
(1.2)
Disposals and scrapping
(1.5)
(5.1)
—
(1.9)
—
(8.5)
Change in estimate of environmental rehabilitation provision with a
related asset
10
5.6
1.8
—
—
—
7.4
Transfers between classes of property, plant and equipment
30.7
11.4
2,768.7
1.3
(2,812.1)
—
Accumulated depreciation and impairment
(1,382.6)
(1,453.7)
(101.7)
(9.7)
—
(2,947.7)
Balance at the beginning of the year
(1,206.6)
(1,278.2)
—
(9.7)
—
(2,494.5)
Depreciation
5.1
(178.7)
(178.8)
(101.7)
—
—
(459.2)
Lease derecognitions
1.2
—
—
—
—
1.2
Disposals and scrapping
1.5
3.3
—
—
—
4.8
Carrying value at end of the year
1,935.1
1,676.4
2,757.1
11.9
2,161.7
8,542.2
Comprising:
Property, plant and equipment owned
1,931.1
1,660.4
2,757.1
11.9
2,161.7
8,522.2
Right of use assets
4.0
16.0
—
—
—
20.0
Carrying value at end of the year
1,935.1
1,676.4
2,757.1
11.9
2,161.7
8,542.2
1Capital work in progress mainly relates to FWGR DP2 construction, RTSF and related pipeline of R4,812.9 million and Ergo Daggafontein TSF of R816.3 million (2025: FWGR DP2 construction, RTSF and related
pipeline of R2,161.7 million).
2This amount includes cash additions of R3,516.4 million (2025: R2,149.6 million).
CONTRACTUAL COMMITMENTS
Contractual commitments not provided for in the consolidated financial statements at 30 June 2026 amounted to R1,807.0 million (2025: R2,308.2 million).
Capital expenditure related to material growth projects are financed on a project-by-project basis which may include bank facilities and existing cash resources. Sustaining capital expenditure
is financed from cash generated from operations and existing cash resources.
DRDGold_Breadcrumbs_Logo_RGB.jpg
DRDGOLD Limited Consolidated Annual Financial Statements 2026
F-20
NOTES TO THE CONSOLIDATED FINANCIAL STATEMENTS continued
for the year ended 30 June 2026
10PROVISION FOR ENVIRONMENTAL REHABILITATION
SIGNIFICANT ACCOUNTING ASSUMPTIONS AND ESTIMATES
Estimates of future environmental rehabilitation costs are determined with the assistance of an independent expert and are
based on the Group’s environmental management plans which are developed in accordance with regulatory requirements
as well as the life-of-mine plan (as discussed in note 9) which influences the estimated timing of the rehabilitation cash
outflows and the planned method of rehabilitation of reclamation sites and deposition facilities.
The estimated future cash outflows associated with the liability are determined on a nominal basis reflecting current cost
estimates and expected inflation. These estimates are reviewed annually and are discounted using a pre-tax risk-free rate
that is adjusted to reflect the current market assessments of the time value of money and the risks specific to the obligation
to the extent that these risks are not already reflected in the estimated cash flows.
An average discount rate ranging between 8.5% and 9.4% (2025: between 9.5% and 9.9%), average inflation rate of 4.5%
(2025: 5.1%) and the discount periods as per the expected life-of-mine were used in the calculation of the estimated net
present value of the rehabilitation provision.
ACCOUNTING POLICIES
The net present value of the estimated rehabilitation cost as at reporting date is provided for in full. Annual changes in the
provision consist of financing expenses relating to the change in the present value of the provision and inflationary
increases in the provision, as well as changes in estimates.
The present value of environmental rehabilitation costs related to the construction, installation or acquisition of property,
plant and equipment are capitalised as part of the cost of the related asset against an increase in the environmental
rehabilitation provision. Subsequently, if a decrease in the liability exceeds the carrying amount of the asset, the excess is
recognised in profit or loss. If the asset value is increased and there is an indication that the revised carrying value is not
recoverable, an impairment test is performed in accordance with the accounting policy dealing with impairments of
property, plant and equipment. Over time, the liability is increased to reflect a finance expense, and the capitalised cost is
depreciated over the life of the related asset. Cash costs incurred to rehabilitate these disturbances are charged to the
provision and are presented as investing activities in the statement of cash flows.
The present value of environmental rehabilitation costs of disturbances where no related asset is recognised are
recognised in profit or loss and presented as operating costs against the increase in the environmental rehabilitation
provision. Subsequent remeasurements of these costs, including change in estimates, are also recognised in profit or loss.
Cash costs incurred to rehabilitate these disturbances are presented as operating activities in the statement of cash flows.
The cost of routine or ongoing rehabilitation is recognised in profit or loss as incurred.
Amounts in R million
Note
2026
2025
Balance at the beginning of the year
558.7
616.8
Unwinding of provision
7
51.0
58.6
Addition of environmental rehabilitation provision recognised to related asset (a)
34.7
—
Change in estimate of environmental rehabilitation provision recognised in
profit or loss (b)
5.1
(13.1)
(98.0)
Change in estimate of environmental rehabilitation provision recognised to
related asset (c)
9
114.9
7.4
Environmental rehabilitation payments (d)
(24.8)
(26.1)
To reduce liabilities with a related asset
(24.8)
(26.1)
To reduce liabilities without a related asset
13
—
—
Balance at the end of the year
721.4
558.7
Environmental rehabilitation payments to reduce the liability
(24.8)
(26.1)
Ongoing rehabilitation expenditure1
(19.7)
(19.3)
Total cash spent on environmental rehabilitation
(44.5)
(45.4)
1The Group also performs ongoing environmental rehabilitation arising from its current activities concurrently with production. These costs do
not represent a reduction of the above liability and are expensed as operating costs.
DRDGold_Breadcrumbs_Logo_RGB.jpg
DRDGOLD Limited Consolidated Annual Financial Statements 2026
F-21
NOTES TO THE CONSOLIDATED FINANCIAL STATEMENTS continued
for the year ended 30 June 2026
10PROVISION FOR ENVIRONMENTAL REHABILITATION continued
(a)Addition of environmental rehabilitation provision recognised to related asset
On 2 December 2025, DRDGOLD and Sibanye Gold Proprietary Limited (“Sibanye Gold”) signed an agreement to
transfer ownership of the Kloof 2 dump, associated rehabilitation provision and trust fund monies to FWGR. The transfer is
in accordance with the initial exchange agreement, concluded in 2018, for the acquisition of FWGR by the DRDGOLD
Group. The dump and associated environmental rehabilitation provision have been transferred. The rehabilitation trust fund
monies remain with Sibanye Gold until regulatory approvals have been obtained. A receivable of R117.4 million has been
recognised pending transfer of the monies (see note 14), with the corresponding credit recognised as a contribution from
shareholder.
(b)Change in estimate of environmental rehabilitation provision recognised in profit or loss
The decrease was as a result of the rescheduling of non-viable dumps at Ergo. (2025: Decrease is mainly as a result of
Crown Complex being classified as Mineral Reserve and now included in the life-of-mine, resulting in a change in its
rehabilitation methodology, from in situ to red earth footprint rehabilitation).
(c)Change in estimate of environmental rehabilitation provision recognised to related asset
The increase was primarily due to inflationary increases in rehabilitation costs, higher demolition rates for plant
infrastructure and the expansion of FWGR infrastructure.
(d)Environmental rehabilitation payments
36.8ha of the Brakpan TSF (2025: 40ha) and 6.0ha of the Driefontein 4 TSF (2025: 4.4ha) were vegetated/cladded during
the year.
Amounts in R million
Ergo
FWGR
Other
Total
Expected discounted cash flows:
Between one and two years
92.3
22.4
3.5
118.2
Between three and five years
98.8
17.4
—
116.2
Between six and ten years
50.6
49.8
—
100.4
Between eleven and twenty years
47.2
41.2
—
88.4
After twenty years
212.1
76.5
9.6
298.2
501.0
207.3
13.1
721.4
GROSS COST TO REHABILITATE
The Group estimates that, based on current environmental and regulatory requirements, the total undiscounted rehabilitation
cost is approximately R1,280.3 million (2025: R930.2 million).
11INVESTMENTS IN REHABILITATION AND OTHER FUNDS
ACCOUNTING POLICIES
Investments in Guardrisk Cell Captive
Funds invested in the Guardrisk Cell Captive, held within Guardrisk Insurance Company Limited (“GICL”) or (“Guardrisk”)
are non-derivative financial assets categorised as financial assets measured at fair value through profit and loss as the
funds are invested by Anchor Capital, through Guardrisk, in income and hedge funds. These assets are initially measured
at fair value and subsequent changes in fair value are recognised in profit or loss as they arise and included in finance
income. The investments in GICL are for the sole use of environmental financial guarantees, directors’ and officers’
insurance and other insurance requirements.
The investments in the Guardrisk Cell Captive are for the sole use as determined in the insurance policies and are therefore
included in non-current assets.
DRDGold_Breadcrumbs_Logo_RGB.jpg
DRDGOLD Limited Consolidated Annual Financial Statements 2026
F-22
NOTES TO THE CONSOLIDATED FINANCIAL STATEMENTS continued
for the year ended 30 June 2026
11INVESTMENTS IN REHABILITATION AND OTHER FUNDS continued
Investment in Guardrisk Cell Captive – Funding of environmental rehabilitation activities (refer note 10)
Funding for environmental rehabilitation activities is held in a ring-fenced policy within the Guardrisk Cell Captive, issued by
GICL, which has provided the rehabilitation financial guarantees. These funds are ring-fenced exclusively to meet current and
future environmental rehabilitation obligations throughout the life-of-mine and upon mine closure.
Environmental rehabilitation payments to reduce the environmental rehabilitation obligations and ongoing rehabilitation
expenditure are mostly funded by cash generated from operations.
GICL has guarantees in issue amounting to R943.1 million (2025: R941.3 million) to the Department of Mineral and Petroleum
Resources (“DMPR”) on behalf of DRDGOLD related to the environmental obligations. The funds for environmental
rehabilitation in the cell captive serve as collateral for these guarantees.
Investment in Guardrisk Cell Captive – Directors’ and officers’ insurance
During previous years, premiums were paid into the Guardrisk Cell Captive for the creation of self-insurance for the Group’s
directors and officers. The policy came to an end on 30 June 2024. The funds remain within the cell captive for self insurance.
Investment in Guardrisk Cell Captive – Other funds
These are existing funds within the cell captive which were previously part of the old environmental rehabilitation policy held for
purposes of obtaining environmental rehabilitation guarantees. The funds remain within the cell captive for self insurance.
Amounts in R million
Note
2026
2025
Investment in Guardrisk Cell Captive (a)
Balance at the beginning of the year
1,002.8
912.5
Growth
6
97.8
90.3
Investments in rehabilitation and other funds
1,100.6
1,002.8
(a) Investment in Guardrisk Cell Captive allocation
Environmental rehabilitation
841.5
765.0
Directors’ and officers’ insurance
128.4
118.4
Other funds
130.7
119.4
1,100.6
1,002.8
CREDIT RISK
The Group is exposed to credit risk on the carrying value of investments held in the Guardrisk Cell Captive. To manage this
exposure, the funds are invested by the Guardrisk Cell Captive in Anchor Capital in accordance with an approved investment
mandate. The portfolio comprises a diversified mix of low- to medium-risk investments. Environmental rehabilitation funds
invested in 70% low-risk, interest-bearing income funds and 30% invested in hedge funds (2025: 70% income funds and 30%
hedge funds). Other funds and Directors’ and officers’ insurance funds are invested fully in low risk income funds.
MARKET RISK
Interest rate risk
A change of 100 basis points (bp) in interest rates at the reporting date would have increased/(decreased) equity and profit/
(loss) by the amounts shown below. This analysis assumes that all other variables, in particular the balance of the funds,
remain constant. The analysis excludes income tax.
Amounts in R million
2026
2025
100bp increase
11.0
10.0
100bp (decrease)
(11.0)
(10.0)
DRDGold_Breadcrumbs_Logo_RGB.jpg
DRDGOLD Limited Consolidated Annual Financial Statements 2026
F-23
NOTES TO THE CONSOLIDATED FINANCIAL STATEMENTS continued
for the year ended 30 June 2026
11INVESTMENTS IN REHABILITATION AND OTHER FUNDS continued
MARKET RISK continued
Other market price risk
The Group is exposed to equity price risk through its investments in hedge funds. A 10% increase/(decrease) in market prices
at the reporting date would have resulted in a change in profit/(loss) by the amounts shown below. The sensitivity analysis
assumes that all other variables remain constant. The analysis excludes income tax.
Amounts in R million
2026
2025
10% increase
25.3
23.0
10% (decrease)
(25.3)
(23.0)
FAIR VALUE OF FINANCIAL INSTRUMENTS
The investment in the Guardrisk Cell Captive is classified as a Level 2 financial instrument. Fair value is determined using
valuation techniques based on observable market inputs, including the net asset value of the underlying investments held in
the fund.
The fair value of the investment approximates its carrying value due to the nature of the underlying investments and the
valuation methodology applied. Refer to note 25.
12CASH AND CASH EQUIVALENTS
ACCOUNTING POLICIES
Cash and cash equivalents are short term, highly liquid investments that are readily convertible to cash without significant
risk of changes in value and comprise cash at the bank, access deposits, income funds and highly liquid investments
which are readily convertible to known amounts of cash.
Cash and cash equivalents are non-derivative financial assets categorised as financial assets measured at amortised cost.
Cash and cash equivalents are initially measured at fair value. Subsequent to initial recognition, cash and cash equivalents
are measured at amortised cost, which is equivalent to their fair value.
Amounts in R million
Note
2026
2025
Cash at the bank
74.6
64.9
Access deposits and income funds1
2,681.3
1,228.1
Restricted cash2
14.1
13.2
2,770.0
1,306.2
Interest earned on cash and cash equivalents
6
136.5
68.3
1These consist of access deposit notes and conservatively managed income funds that are diversified across the major financial institutions
in South Africa.
At reporting date all of these instruments had same day or next day liquidity and effective annualised yields of between 7.6% and 8.3%
(2025: between 8.0% and 9.4%).
2This consists of cash held on call as collateral for guarantees issued by the Standard Bank of South Africa Limited on behalf of the Group for
environmental rehabilitation amounting to R7.8 million (2025: R5.2 million) and various utilities amounting to R5.1 million (2025: R5.1 million).
Guarantees
As part of the ordinary operations of the Group, the Group has issued guarantees by third party financial institutions to Eskom
Holdings SOC Limited of R183.1 million (2025: R115.1 million) and R117.2 million (2025: R117.2 million) to Ekurhuleni
Metropolitan Municipality. For guarantees relating to rehabilitation see note 11.
DRDGold_Breadcrumbs_Logo_RGB.jpg
DRDGOLD Limited Consolidated Annual Financial Statements 2026
F-24
NOTES TO THE CONSOLIDATED FINANCIAL STATEMENTS continued
for the year ended 30 June 2026
12CASH AND CASH EQUIVALENTS continued
CREDIT RISK
The Group is exposed to credit risk on the total carrying value of its cash and cash equivalents. The Group manages its
exposure to credit risk by investing cash and cash equivalents across several major financial institutions, considering the
credit ratings of the respective financial institutions, funds and underlying instruments.
Impairment on cash and cash equivalents, if any, are measured on a 12-month expected loss basis and reflects the short
maturities of the exposures. The Group considers that its cash and cash equivalents have low credit risk based on the external
credit ratings of the counterparties which are rated between AA- and AA+.
Included in cash and cash equivalents are investments in income funds comprising highly liquid, low-risk instruments. As the
funds are readily redeemable, carry insignificant credit and market risk, and are subject to an insignificant risk of changes in
value, they are classified as cash and cash equivalents.
MARKET RISK
Interest rate risk
A change of 100 basis points (bp) in the interest rates would have increased/(decreased) equity and profit/(loss) by the
amounts shown below. This analysis is performed on the average balance of cash and cash equivalents for the year and
assumes that all other variables remain constant. The analysis excludes income tax.
Amounts in R million
2026
2025
100bp increase
20.4
9.1
100bp (decrease)
(20.4)
(9.1)
FAIR VALUE OF FINANCIAL INSTRUMENTS
The fair value of cash and cash equivalents approximates their carrying value due to their short term maturities.
13CASH GENERATED FROM OPERATIONS
Amounts in R million
Note
2026
2025
2024
Profit for the year
4,255.5
2,242.7
1,328.7
Adjusted for:
Income tax
17.1
1,627.0
824.4
488.2
Depreciation
9
477.2
459.2
270.4
Movement in gold in process and finished
inventories – Gold Bullion
5.1
(5.4)
(18.1)
(34.9)
Change in estimate of environmental rehabilitation provision
recognised in profit or loss
10
(13.1)
(98.0)
(11.6)
Environmental rehabilitation payments to reduce liabilities
without a related asset
—
—
(1.3)
Share-based payment expense
5.2
41.7
30.1
26.4
(Gain)/loss on disposal of property, plant and equipment
(0.3)
3.7
(0.6)
Loss on disposal of subsidiary
22
4.8
—
—
Insurance claim
—
—
(1.2)
Finance income
6
(245.5)
(223.8)
(280.8)
Finance expense
7
100.0
73.4
76.4
Other non-cash items
14.4
4.3
2.4
Operating cash flows before other changes
6,256.3
3,297.9
1,862.1
Changes in:
(219.8)
79.0
(123.8)
Trade and other receivables
(53.8)
110.4
(296.2)
Consumable stores and stock piles
(53.7)
(48.3)
(12.9)
Payment made under protest
24
(2.7)
(6.6)
(12.8)
Trade and other payables
(109.6)
23.5
198.1
Cash generated from operations
6,036.5
3,376.9
1,738.3
DRDGold_Breadcrumbs_Logo_RGB.jpg
DRDGOLD Limited Consolidated Annual Financial Statements 2026
F-25
NOTES TO THE CONSOLIDATED FINANCIAL STATEMENTS continued
for the year ended 30 June 2026
14TRADE AND OTHER RECEIVABLES
ACCOUNTING POLICIES
Recognition and measurement
Trade and other receivables, excluding Value Added Tax (“VAT”) and prepayments, are non-derivative financial assets
categorised as financial assets at amortised cost.
These assets are initially measured at fair value plus directly attributable transaction costs. Subsequent to initial recognition,
they are measured at amortised cost using the effective interest method less any expected credit losses using the Group’s
business model for managing its financial assets.
The Group derecognises a financial asset when the contractual rights to the cash flows from the asset expire, or it transfers
the rights to receive the contractual cash flows in a transaction in which substantially all of the risks and rewards of
ownership of the financial asset are transferred, or it neither transfers nor retains substantially all of the risks and rewards of
ownership and does not retain control over the transferred asset. Any interest in such derecognised financial assets that is
created or retained by the Group is recognised as a separate asset or liability.
Impairment
The Group recognises loss allowances for trade and other receivables at an amount equal to expected credit losses
(“ECLs”). The Group uses the simplified ECL approach. When determining whether the credit risk of a financial asset has
increased since initial recognition and when estimating ECLs, the Group considers reasonable and supportable information
that is relevant and available without undue cost or effort. This includes both quantitative and qualitative information and
analysis, based on informed credit assessments and including forward-looking information. The maximum period
considered when estimating ECLs is the maximum contractual period over which the Group is exposed to credit risk.
ECLs are a probability weighted estimate of credit losses. Credit losses are measured as the present value of all cash
shortfalls (i.e. the difference between the cash flows due to the entity in accordance with the contract and the cash flows
that the Group expects to receive). The Group assesses whether the financial asset is credit impaired at each reporting
date. A financial asset is credit impaired when one or more events that have a detrimental impact on the estimated future
cash flows of the financial asset have occurred, including but not limited to financial difficulty or default of payment. The
Group will write off a financial asset when there is no reasonable expectation of recovering it after considering whether all
means to recover the asset have been exhausted, or the counterparty has been liquidated and the Group has assessed
that no recovery is possible.
Any impairment losses are recognised in the statement of profit or loss.
Trade receivables relate to gold sold to the bullion banks. Settlement is usually received on the gold sold date.
Amounts in R million
2026
2025
Value Added Tax
164.3
93.9
Other receivables1
184.3
52.4
Prepayments2
114.6
188.3
Allowance for impairment
(5.2)
(5.0)
458.0
329.6
1Other receivables includes interest receivable of R 6.1 million (2025: R7.6 million) and Kloof 2 Rehabilitation funds receivable from Sibanye-
Stillwater of R117.4 million (See note 10).
2Prepayments includes prepayments made towards capital projects of R11.5 million mainly relating to the RTSF and other asset acquisitions
(2025: R53.0 million mainly RTSF project and other asset acquisitions).
CREDIT RISK
The Group is exposed to credit risk on the total carrying value of its trade receivables and other receivables excluding Value
Added Tax and prepayments.
The Group manages its exposure to credit risk on trade receivables by selling gold on a cash on delivery basis. The Group
manages its exposure to credit risk on other receivables by establishing a maximum payment period of 30 days, and ensuring
that counterparties are of good credit standing and transacting on a secured or cash basis where considered necessary. The
majority of other receivables, comprises of balances with counterparties who have been transacting with the Group for over
5 years and in some of these cases, the counterparties are also suppliers of the Group. Receivables are regularly monitored
and assessed for recoverability.
DRDGold_Breadcrumbs_Logo_RGB.jpg
DRDGOLD Limited Consolidated Annual Financial Statements 2026
F-26
NOTES TO THE CONSOLIDATED FINANCIAL STATEMENTS continued
for the year ended 30 June 2026
14TRADE AND OTHER RECEIVABLES continued
The balances of counterparties who have been assessed as being credit impaired at reporting date are as follows:
2026
2025
Amounts in R million
Non-credit
impaired
Credit
impaired
Total
Non-credit
impaired
Credit
impaired
Total
Other receivables
179.1
5.2
184.3
47.4
5.0
52.4
Loss allowance
—
(5.2)
(5.2)
—
(5.0)
(5.0)
Movement in the allowance for impairment in respect of trade and other receivables during the year was as follows:
Amounts in R million
2026
2025
Balance at the beginning of the year
(5.0)
(5.6)
Credit loss allowance/impairments (recognised)/reversed included in operating costs
(0.2)
0.6
Balance at the end of the year
(5.2)
(5.0)
MARKET RISK
Interest rate risk
Trade and other receivables do not earn interest and are therefore not subject to interest rate risk.
Foreign currency risk
Gold is sold at spot rates and is denominated in US Dollars. Gold sales are therefore exposed to fluctuations in the US Dollar/
South African Rand exchange rate. All foreign currency transactions entered into during the year ended 30 June 2026 were at
spot rates and no foreign exchange rate hedges are entered into. The US Dollars to be received from bullion sales are sold on
the same date as the respective bullion sale to settle in South African Rand to the Group. As a result, trade receivables are not
exposed to fluctuations in the US Dollar/South African Rand exchange rate.
FAIR VALUE OF FINANCIAL INSTRUMENTS
The fair value of trade and other receivables approximate their carrying value due to their short term maturities.
15TRADE AND OTHER PAYABLES
ACCOUNTING POLICIES
Trade and other payables, excluding Value Added Tax, payroll accruals, accrued leave pay and accrual for performance-
based incentives, are non-derivative financial liabilities categorised as financial liabilities measured at amortised cost.
These liabilities are initially measured at fair value plus directly attributable transaction costs. Subsequent to initial
recognition, they are measured at amortised cost using the effective interest method. The Group derecognises a financial
liability when its contractual rights are discharged or cancelled or expire.
Short term employee benefits are expensed as the related service is provided. A liability is recognised for the amount
expected to be paid if the Group has a present legal or constructive obligation to pay this amount as a result of past service
provided by the employee and the obligation can be estimated reliably.
Amounts in R million
2026
2025
Trade payables and accruals1
797.7
753.9
Value Added Tax
0.6
2.9
Accrued leave pay
66.5
64.1
Accrual for short term performance based incentives
108.4
101.6
Payroll creditors
39.6
31.9
1,012.8
954.4
Interest relating to trade payables and accruals included in profit or loss
(1.1)
(1.5)
1  Included in trade payables and accruals is an amount of R263.1 million (2025: R119.3 million) related to capital projects.
DRDGold_Breadcrumbs_Logo_RGB.jpg
DRDGOLD Limited Consolidated Annual Financial Statements 2026
F-27
NOTES TO THE CONSOLIDATED FINANCIAL STATEMENTS continued
for the year ended 30 June 2026
15TRADE AND OTHER PAYABLES continued
Amounts in R million
2026
2025
RELATED PARTY BALANCES
Trade payables and accruals include the following amounts payable to related parties:
Sibanye-Stillwater
5.6
25.2
Rand Refinery
1.1
0.9
LIQUIDITY RISK
Trade payables and accruals are all expected to be settled within 12 months from reporting date.
FAIR VALUE OF FINANCIAL INSTRUMENTS
The fair value of trade payables and accruals approximate their carrying value due to their short term maturities.
16INVENTORIES
ACCOUNTING POLICIES
Gold in process is stated at the lower of cost and net realisable value. Costs are assigned to gold in process on a weighted
average cost basis. Costs comprise all costs incurred to the stage immediately prior to smelting, including costs of
extraction and processing as they are reliably measurable at that point. Gold Bullion and ore stock piles is stated at the
lower of cost and net realisable value. Selling and general administration costs are excluded from inventory valuation.
Consumable stores are stated at cost less allowances for obsolescence. Cost of consumable stores and stockpile material
is based on the weighted average cost principle and includes expenditure incurred in acquiring inventories and bringing
them to their existing location and condition.
Net realisable value is the estimated selling price in the ordinary course of business, less the estimated cost of completion
and selling expenses.
Amounts in R million
2026
2025
Consumable stores
327.8
285.1
Ore stockpiles
43.2
33.9
Gold in process
98.4
65.8
Finished inventories - Gold Bullion
110.7
137.8
Total inventories
580.1
522.6
17INCOME TAX
SIGNIFICANT ACCOUNTING ASSUMPTIONS AND ESTIMATES
Management periodically evaluates positions taken where tax regulations are subject to interpretation. This includes the
treatment of both Ergo and FWGR as single mining operations respectively, pursuant to the relevant ring-fencing legislation.
The deferred tax liability is calculated by applying a forecast weighted average tax rate that is based on a prescribed
formula. The calculation of the forecast weighted average tax rate requires the use of assumptions and estimates and are
inherently uncertain and could change materially over time. These assumptions and estimates include expected future
profitability and timing of the reversal of the temporary differences. Due to the forecast weighted average tax rate being
based on a prescribed formula that increases the effective tax rate with an increase in forecast future profitability, and vice
versa, the tax rate can vary significantly year on year and can move contrary to current period financial performance.
A 100 basis points increase in the effective tax rate will result in an increase in the net deferred tax liability at 30 June 2026
of approximately R101.5 million (2025: R45.3 million).
The assessment of the probability that future taxable profits will be available against which the tax losses and unredeemed
capital expenditure can be utilised requires the use of assumptions and estimates and are inherently uncertain and could
change materially over time.
Capital expenditure is assessed by South African Revenue Service (“SARS”) when it is redeemed against taxable mining
income rather than when it is incurred. A different interpretation by SARS regarding the deductibility of these capital
allowances may therefore become evident subsequent to the year of assessment when the capital expenditure is incurred.
DRDGold_Breadcrumbs_Logo_RGB.jpg
DRDGOLD Limited Consolidated Annual Financial Statements 2026
F-28
NOTES TO THE CONSOLIDATED FINANCIAL STATEMENTS continued
for the year ended 30 June 2026
17INCOME TAX continued
ACCOUNTING POLICIES
Income tax expense comprises current and deferred tax. Each company is taxed as a separate entity and tax is not set-off
between the companies.
Current tax
Current tax comprises the expected tax payable or receivable on the taxable income or loss for the year and any
adjustment on tax payable or receivable in respect of the previous year. Amounts are recognised in profit or loss except to
the extent that it relates to items recognised directly in equity or other comprehensive income. The current tax charge is
calculated on the basis of the tax laws enacted or substantively enacted at the reporting date.
Deferred tax
Deferred tax is recognised in respect of temporary differences between the carrying amounts and the tax bases of assets
and liabilities. Deferred tax is not recognised on the initial recognition of assets or liabilities in a transaction that is not a
business combination and that affects neither accounting nor taxable profit.
Deferred tax assets relating to unutilised tax losses and unutilised capital allowances are recognised to the extent that it is
probable that future taxable profits will be available against which the unutilised tax losses and unutilised capital allowances
can be utilised. The recoverability of these assets is reviewed at each reporting date and adjusted if recovery is no longer
probable.
Deferred tax related to gold mining income is measured at a forecast weighted average tax rate that is expected to be
applied to temporary differences when they reverse, using tax rates enacted or substantially enacted at the reporting date.
The calculation of the forecast weighted average tax rate requires the use of assumptions and estimates, including the
Group’s life-of-mine plan (as discussed in note 9 to the consolidated financial statements) that is applied to calculate the
expected future profitability.
Current tax on gold mining income for the periods presented was determined based on a formula: Y = 33 - 165/X where Y is
the percentage rate of tax payable and X is the ratio of taxable income, net of any qualifying capital expenditure that bears to
gold mining income derived, expressed as a percentage. Non-mining income, which consists primarily of interest accrued and
management fees, are taxed at a standard rate of 27% for the periods presented.
All mining capital expenditure is deducted in the year it is incurred to the extent that it does not result in an assessed loss.
Capital expenditure not deducted from mining income is carried forward as unutilised capital allowances to be deducted from
future mining income.
Deferred tax is recognised using the gold mining tax formula to calculate a forecast weighted average tax rate considering the
expected timing of the reversal of temporary differences. The formula is calculated as: Y = 33 – 165/X where Y is the
percentage rate of tax payable and X is the ratio of taxable income, net of any qualifying capital expenditure that bears to
mining income derived, expressed as a percentage.
Due to the forecast weighted average tax rate being based on the expected future profitability, the tax rate can vary
significantly year-on-year and can move contrary to current year financial performance.
The forecast weighted average deferred tax rate of Ergo has increased to 27% (2025: remained at 25%). The forecast
weighted average deferred tax rate of FWGR increased to 30% (2025: remained at 29%).
DRDGold_Breadcrumbs_Logo_RGB.jpg
DRDGOLD Limited Consolidated Annual Financial Statements 2026
F-29
NOTES TO THE CONSOLIDATED FINANCIAL STATEMENTS continued
for the year ended 30 June 2026
17INCOME TAX continued
17.1INCOME TAX EXPENSE
Amounts in R million
2026
2025
2024
Current tax
(496.2)
—
(99.7)
Mining tax
(485.3)
—
(92.4)
Mining tax prior year over provision
—
—
5.4
Non-Mining, company and capital gains tax
(10.9)
—
(12.7)
Deferred tax
(1,130.8)
(824.4)
(388.5)
Deferred tax charge - Mining tax
(965.6)
(832.4)
(327.5)
Deferred tax charge - Mining tax prior year over provision
—
—
6.1
Deferred tax charge - Non-mining, company and capital gains tax
(13.7)
8.0
0.2
Deferred tax rate adjustment
(151.5)
—
(67.3)
(1,627.0)
(824.4)
(488.2)
Tax reconciliation
Major items causing the Group’s income tax expense to differ from
the statutory rate were:
Tax on net profit before tax at the South African corporate tax rate
of 27%
(1,588.3)
(828.1)
(490.6)
Rate adjustment to reflect the actual realised company tax rates
applying the gold mining formula (a)
4.2
3.1
46.1
Deferred tax rate adjustment (b)
(151.5)
—
(67.3)
Depreciation of property, plant and equipment exempt from
deferred tax on initial recognition (c)
(15.5)
(15.1)
(16.8)
Non-deductible expenses (d)
(28.2)
(5.5)
(8.2)
Exempt income and other non-taxable income (e)
2.5
17.5
9.8
Prior year (under)/over provision
—
(1.5)
11.5
Current year losses for which no deferred tax asset was
recognised
0.8
1.9
1.4
Other
2.7
(2.4)
(1.6)
Tax incentives (f)
146.3
5.7
27.5
Income tax
(1,627.0)
(824.4)
(488.2)
(a)Rate adjustment to reflect the actual realised company tax rates applying the gold mining formula
Ergo’s current income tax rate, calculated using the gold mining tax formula, is 25.7% (2025 and 2024: nil).
FWGR’s current income tax rate, calculated using the gold mining tax formula, is nil (2025: nil and 2024: 25%).
(b)Deferred tax rate adjustment
Ergo’s forecast weighted average deferred tax rate increased to 27% (2025 and 2024: 25%).
FWGR’s forecast weighted average deferred tax rate increased to 30% (2025 and 2024: 29%).
(c)Depreciation of property, plant and equipment exempt from deferred tax on initial recognition
Depreciation of R57.4 million (2025: R55.9 million; 2024: R62.1 million) on the fair value of FWGR’s property, plant and
equipment that was exempt from deferred tax on initial recognition in terms of IAS 12 Income Taxes.
(d)Non-deductible expenditure
The most significant non-deductible expenditure incurred by the Group during the year includes:
•R37.8 million discount recognised on payments made under protest (2025: R3.3 million; 2024: R14.0 million); and
•R4.8 million loss on disposal of subsidiary not deductible for tax purposes (capital in nature) (2025 and 2024: Nil)
•R61.8 million of corporate and other expenditure not incurred in generation of taxable income or capital in nature (2025:
R17.0 million and 2024: R13.7 million)
(e)Exempt income and other non-taxable income
The most significant exempt income earned by the Group during the year includes:
•Rnil dividends received (2025: R56.3 million 2024: R29.3 million);
•R9.4 million unwinding recognised on payments made under protest (2025: R7.8 million; 2024: R7.2 million).
(f)Tax incentives
The most significant tax incentive the Group benefited from include:
•R532.1 million tax incentive relating to Ergo’s solar power plant (2025: Rnil due to the accelerated capital expenditure
deduction; 2024: R81.2 million relating to Ergo’s solar power plant).
•R9.6 million tax incentive relating to learnerships allowance (2025: R21.2 million; 2024: R21.9 million).
DRDGold_Breadcrumbs_Logo_RGB.jpg
DRDGOLD Limited Consolidated Annual Financial Statements 2026
F-30
NOTES TO THE CONSOLIDATED FINANCIAL STATEMENTS continued
for the year ended 30 June 2026
17INCOME TAX continued
17.2DEFERRED TAX
Amounts in R million
2026
2025
Included in the statement of financial position as follows:
Deferred tax assets
9.1
38.3
Deferred tax liabilities
(2,900.4)
(1,781.8)
Net deferred tax liabilities
(2,891.3)
(1,743.5)
Reconciliation of the deferred tax balance:
Balance at the beginning of the year
(1,743.5)
(934.6)
Recognised in profit or loss
(1,130.8)
(824.4)
Recognised in other comprehensive income
(2.2)
(0.7)
Recognised in equity
(14.8)
16.2
Balance at the end of the year
(2,891.3)
(1,743.5)
The detailed components of the net deferred tax liabilities which result from the differences between the amounts of assets
and liabilities recognised for financial reporting and tax purposes are:
Amounts in R million
2026
2025
Deferred tax liabilities
Property, plant and equipment (excluding unredeemed capital allowances)
(3,173.6)
(2,047.6)
Environmental rehabilitation obligation and other funds
(160.2)
(127.1)
Other investments
(6.7)
(3.5)
Gross deferred tax liabilities
(3,340.5)
(2,178.2)
Deferred tax assets
Environmental rehabilitation obligation
198.8
145.5
Other provisions1
83.5
92.5
Other temporary differences2
3.1
4.3
Estimated tax losses
8.0
16.1
Estimated unredeemed capital allowances
155.8
176.3
Gross deferred tax assets
449.2
434.7
Net deferred tax liabilities
(2,891.3)
(1,743.5)
1Includes the temporary differences on the equity settled share-based payment of R 24.1 million (2025: R 39.1 million).
2Includes the temporary differences on the lease liability of R 3.1 million (2025: R 4.3 million).
Deferred tax assets have not been recognised in respect of the following:
Amounts in R million
2026
2025
Estimated tax losses
21.1
21.2
Estimated tax losses – Capital nature
313.6
313.6
Unredeemed capital expenditure
244.4
244.4
Deferred tax assets for tax losses, unredeemed capital expenditure and capital losses have not been recognised where
future taxable profits against which these can be utilised are not anticipated. These do not have an expiry date. A maximum
of R1 million or 80% of assessed losses (whichever is greater) is permitted to be set-off per year against taxable income.
DRDGold_Breadcrumbs_Logo_RGB.jpg
DRDGOLD Limited Consolidated Annual Financial Statements 2026
F-31
NOTES TO THE CONSOLIDATED FINANCIAL STATEMENTS continued
for the year ended 30 June 2026
17INCOME TAX continued
17.3CURRENT TAX RECEIVABLE/LIABILITY
Amounts in R million
2026
2025
Current tax receivable
7.8
4.3
Current tax liability
(37.2)
(29.5)
Net current tax liability
(29.4)
(25.2)
Balance at the beginning of the year
(25.2)
3.9
Current tax charge recognised in profit or loss
(496.2)
—
Current tax charge recognised in equity
2.9
(3.4)
Tax paid/(received)
489.1
(25.7)
Balance at the end of the year
(29.4)
(25.2)
18EMPLOYEE BENEFITS
ACCOUNTING POLICIES
Equity settled share-based payments
The grant date fair value of equity settled share-based payment arrangements is recognised as an expense, with a
corresponding increase in equity, over the vesting period of the awards. The expense is adjusted to reflect the number of
awards for which the related service and non-market performance conditions are expected to be met, such that the amount
ultimately recognised is based on the number of awards that meet the related service and non-market performance
conditions at vesting date.
18.1EQUITY SETTLED LONG TERM INCENTIVE SCHEMES
Amounts in R million
Note
2026
2025
2024
Share-based payment expense – ELTI scheme
21.3
30.1
26.4
Share-based payment expense – DSP scheme
20.4
—
—
Total share-based payment expense
5.2
41.7
30.1
26.4
On 2 December 2019, the shareholders approved an equity settled long term incentive scheme. Under the Equity Long Term
Incentive (“ELTI”) scheme, qualifying employees are awarded conditional shares on an annual basis, comprising
performance shares (80% of the total conditional shares awarded) and retention shares (20% of the total conditional shares
awarded). Conditional shares will vest three years after grant date and will be settled in the form of DRDGOLD shares at a zero-
exercise price. The last grant in terms of the ELTI scheme was made on 22 October 2024.
The ELTI scheme was replaced by the Single Incentive Plan (“SIP”), incorporating the Deferred Share Plan (“DSP”), which
was approved by the shareholders on 29 November 2023. Under the DSP scheme, qualifying employees are awarded
deferred shares on an annual basis. The deferred shares are held in escrow by an escrow agent for the benefit of qualifying
employees from grant date. Dividends declared on shares granted per the DSP accrue and are paid to the employees over
the vesting period. Deferred shares will vest equally over a period of three and five years after grant date, depending on the
level of seniority of the participant, and will be settled in the form of DRDGOLD shares at a zero-exercise price. The first grant
under the DSP was made on 13 August 2025.
ELTI Scheme
The key conditions of the grants made under the ELTI scheme are:
Retention shares:
100% of the retention shares will vest if the employee remains in the active employ of the Company at vesting date, is not
under notice period and individual performance criteria are met.
Performance shares:
Total shareholder’s return (“TSR”) measured against a hurdle rate of 15% referencing DRDGOLD’s Weighted Average Cost of
Capital (“WACC”):
•50% of the performance shares are linked to this condition; and
•all of these performance shares will vest if DRDGOLD’s TSR exceeds the hurdle rate over the vesting period.
DRDGold_Breadcrumbs_Logo_RGB.jpg
DRDGOLD Limited Consolidated Annual Financial Statements 2026
F-32
NOTES TO THE CONSOLIDATED FINANCIAL STATEMENTS continued
for the year ended 30 June 2026
18EMPLOYEE BENEFITS continued
18.1EQUITY SETTLED LONG TERM INCENTIVE SCHEMES continued
TSR is measured against a peer group of three peers (Sibanye-Stillwater, Harmony Gold Mining Company Limited and Pan-
African Resources Limited):
•50% of the performance shares are linked to this condition; and
•the number of performance shares which vest is based on DRDGOLD’s actual TSR performance in relation to percentiles of
peer group’s performance as follows:
Percentile of peers
% of performance shares vesting
< 25th percentile
0%
25th to < 50th percentile
25%
50th to < 75th percentile
75%
≥ 75th percentile
100%
Reconciliation of the number of conditional
shares
2026
2025
Number of
Shares
Volume
weighted
average price
R per share
Number of
Shares
Volume
weighted
average price
R per share
Opening balance
10,132,081
10,506,564
Granted – 20 October 2024
—
2,816,040
Vested1
(3,235,335)
45.55
(936,779)
22.07
Forfeited
(646,624)
(67,931)
Expired1
(1,386,573)
(2,185,813)
Closing balance
4,863,549
10,132,081
—
Vesting on
4,863,549
10,132,081
19 October 2025
—
4,621,908
25 October 2026
2,358,286
2,694,133
22 October 2027
2,505,263
2,816,040
170% of the total grant vested as a result of performance conditions being met, with the balance having expired (2025: 30% vested). The
settlement of the vesting was made through a combination of 2,153,302 treasury shares and 1,082,033 new share issue on 20 October
2025.
Fair value
The weighted average fair value of the performance and retention shares at grant date were determined using the Monte Carlo
simulation pricing model applying the following key inputs:
Grant date
22 October 2024
25 October 2023
Vesting date
22 October 2027
25 October 2026
Weighted average fair value of 80% performance shares1
15.09
7.72
Weighted average fair value of 20% retention shares
21.18
16.24
Expected term (years)
3
3
Grant date share price of a DRDGOLD share
21.81
16.89
Expected dividend yield
0.98%
1.30%
Expected volatility2
42.12%
44.55%
Expected risk free rate
7.42%
8.27%
1The performance conditions are included in the measurement of the grant date fair value as they are classified as market-based
performance conditions.
2Expected volatility has been based on an evaluation of the historical volatility of DRDGOLD’s share price, commensurate with the expected
term of the options.
DRDGold_Breadcrumbs_Logo_RGB.jpg
DRDGOLD Limited Consolidated Annual Financial Statements 2026
F-33
NOTES TO THE CONSOLIDATED FINANCIAL STATEMENTS continued
for the year ended 30 June 2026
18EMPLOYEE BENEFITS continued
18.1EQUITY SETTLED LONG TERM INCENTIVE SCHEMES continued
DSP Scheme
The key conditions of the grants made under the DSP scheme are:
100% of the deferred shares will vest equally over a period of three or five years, if the employee remains in the active employ
of the Company at vesting date, is not under notice period and individual performance criteria are met.
Reconciliation of the number of deferred shares
2026
Number of Shares
Weighted average
price
R per share
Opening balance
—
Granted – 13 August 2025
1,726,955
27.42
Forfeited
(163,322)
Closing balance
1,563,633
Vesting on
1,563,633
13 August 2026
462,165
13 August 2027
462,165
13 August 2028
462,165
13 August 2029
88,569
13 August 2030
88,569
18.2TRANSACTIONS WITH KEY MANAGEMENT PERSONNEL
Interests in contracts
None of the directors, officers or major shareholders of DRDGOLD or, to the knowledge of DRDGOLD’s management, their
families, had any interest, direct or indirect, in any transaction entered into during the year ended 30 June 2026 or the
preceding financial years, or in any proposed transaction which has affected or will materially affect DRDGOLD or its
subsidiaries other than disclosed in these financial statements. None of the directors or officers of DRDGOLD or any associate
of such director or officer is currently or has been at any time during the past financial year materially indebted to DRDGOLD.
Key management personnel remuneration
Amounts in R million
Note
2026
2025
2024
Board fees paid
7.6
7.8
7.9
Salaries paid
124.5
104.9
93.2
Short term incentives relating to this cycle
110.3
98.2
94.0
Share-based payment expense
18.1
41.7
30.1
26.4
284.1
241.0
221.5
DRDGold_Breadcrumbs_Logo_RGB.jpg
DRDGOLD Limited Consolidated Annual Financial Statements 2026
F-34
NOTES TO THE CONSOLIDATED FINANCIAL STATEMENTS continued
for the year ended 30 June 2026
19CAPITAL MANAGEMENT
The primary objective of the Group’s capital management policy is to ensure that adequate capital is available to meet the
requirements of the Group from time to time, including capital expenditure. The Group considers the appropriate capital
management strategy for specific growth projects as and when required. Lease liabilities are not considered to be debt.
Liquidity management
The Group monitors available cash and cash equivalent balance and facilities to ensure there is sufficient capital for
forecasted expenditures including capital requirements. Cash and cash equivalents (excluding restricted cash) as at
30 June 2026 is R2,755.9 million (2025: R1,293.0 million). The Group remains debt free as at 30 June 2026 (2025: Nil).
To fund the significant capital expansion programme at both operations, on 28 June 2024, DRDGOLD secured a R500 million
GBF with Nedbank. The GBF was increased to include a guarantees facility of R181 million (increased to R120 million in 2025),
bringing the total GBF facility to R681 million (2025: R620 million). The revolving credit facility (“RCF”) of R1 billion, with an
accordion facility of R500.0 million, is secured with Nedbank.
Other than the guarantees facility that has been fully utilised, both the GBF and RCF remain undrawn as at 30 June 2026 and
30 June 2025. Details of other guarantees facilities are disclosed in note 12 of the consolidated annual financial statements.
The RCF permitted an interest cover ratio (adjusted EBITDA to net finance charges) of not less than 4:1 and a leverage ratio
(total net debt to adjusted EBITDA) not exceeding 2:1, calculated on a twelve-month rolling basis, respectively. Management
monitors the covenant ratio levels to ensure compliance with the covenants, as well as maintain sufficient facilities to ensure
satisfactory liquidity for the Group.
20EQUITY
ACCOUNTING POLICIES
Stated share capital
Ordinary shares and the cumulative preference shares are classified as equity. Incremental costs directly attributable to the
issue of ordinary shares are recognised as a deduction from equity, net of any tax effect.
Repurchase and reissue of share capital (treasury shares)
When shares recognised as equity are repurchased, the amount of the consideration paid, which includes directly
attributable costs is recognised as a deduction from equity. Repurchased shares are classified as treasury shares and are
presented as a deduction from stated share capital.
Dividends
Dividends are recognised as a liability on the date on which they are declared which is the date when the shareholders’
right to the dividends vests.
20.1STATED SHARE CAPITAL
All ordinary shares rank equally regarding the Company’s residual assets. Holders of ordinary shares are entitled to dividends
as declared from time to time and are entitled to one vote per share at general meetings of the Company. All rights attached to
the Company’s shares held by the Group are suspended until those shares are reissued.
Preference shareholders participate only to the extent of the face value of the shares. Holders of preference shares do not
have the right to participate in any additional dividends declared for ordinary shareholders. These shares do not have voting
rights.
2026
2025
2024
Number of shares
Authorised number of ordinary shares of no par value
1,500,000,000
1,500,000,000
1,500,000,000
Authorised and issued number of cumulative preference shares of 10
cents each1
5,000,000
5,000,000
5,000,000
Reconciliation of issued number of ordinary shares:
Ordinary shares issued at the beginning of the year
864,588,711
864,588,711
864,588,711
Issued in terms of employee share schemes2
2,808,988
—
—
Ordinary shares issued at the end of the year3
867,397,699
864,588,711
864,588,711
Number of treasury shares held within group (a)
—
2,153,302
3,090,081
1 Randgold and Exploration Company Limited owns 100% of the cumulative preference shares. The holders of cumulative preference shares
do not have voting rights unless any preference dividend is in arrears for more than six months.
2On 27 August 2025, 1,726,955 new ordinary shares were issued in terms of the DSP scheme grant. A further 1,082,033 new ordinary shares
were issued in terms of the ELTI scheme on 20 October 2025, for the purposes of settling the conditional shares vesting on
19 October 2025.
3Subsequent to year end, 1,358,826 new ordinary shares were issued in terms of the DSP scheme grant on 2 September 2026.
DRDGold_Breadcrumbs_Logo_RGB.jpg
DRDGOLD Limited Consolidated Annual Financial Statements 2026
F-35
NOTES TO THE CONSOLIDATED FINANCIAL STATEMENTS continued
for the year ended 30 June 2026
20EQUITY continued
20.1STATED SHARE CAPITAL continued
RELATED PARTY RELATIONSHIPS AND TRANSACTIONS
(a)Treasury shares
Shares in DRDGOLD Limited are held in treasury by Ergo Mining Operations Proprietary Limited (“EMO”). No shares were
acquired in the market during the year ended 30 June 2026, 30 June 2025 and 30 June 2024. During the year ended
30 June 2026, 2,153,302 (30 June 2025: 936,779; 30 June 2024: 806,582) shares were used to settle the equity settled
share-based payment, at Rnil cashflow to the Group. R11.6 million, representing the average cost of the treasury shares
used to settle the share-based payment, was transferred to retained earnings (30 June 2025: R5.1 million; 30 June 2024:
R4.3 million).
20.2DIVIDENDS
Amounts in R million
2026
2025
2024
Dividends paid during the year net of treasury shares:
Final dividend declared relating to prior year: 40 SA cents per share
(2025: 20 SA cents per share; 2024: 65 SA cents per share)
345.7
172.3
559.4
Interim dividend: 50 SA cents per share (2025: 30 SA cents per share;
2024: 20 SA cents per share)
433.6
258.7
172.3
Total
779.3
431.0
731.7
Subsequent to year end, on 19 August 2026 a dividend of 120 SA cents per qualifying share amounting to R1,042.5 million
was declared by the directors as a final dividend for the year ended 30 June 2026. The dividend has not been provided for
and does not have any tax impact on the Group.
21INTEREST IN SUBSIDIARIES
ACCOUNTING POLICIES
Significant subsidiaries of the Group are those subsidiaries with the most significant contribution to the Group’s profit or loss
or assets.
Ergo and FWGR are the only significant subsidiaries of the Group. They are both wholly owned subsidiaries and are
incorporated in South Africa, are primarily involved in the retreatment of surface gold and all their operations are based in
South Africa.
A complete list of the Group’s subsidiaries is included in the Company financial statements of DRDGOLD.
DRDGold_Breadcrumbs_Logo_RGB.jpg
DRDGOLD Limited Consolidated Annual Financial Statements 2026
F-36
NOTES TO THE CONSOLIDATED FINANCIAL STATEMENTS continued
for the year ended 30 June 2026
22ASSET HELD FOR SALE
ACCOUNTING POLICIES
Non-current assets, or disposal groups comprising of assets and liabilities, are classified as held-for-sale if it is highly
probable that they will be recovered primarily through sale rather than through continuing use.
Such assets, or disposal groups, are generally measured at the lower of their carrying amount and fair value less cost to
sell. Any impairment loss on a disposal group is allocated first to goodwill, and then to the remaining assets and liabilities on
a pro-rata basis, except that no loss is allocated to inventories, financial assets, deferred tax assets or employee benefit
assets, which continue to be measured in accordance with the Group’s other accounting policies. Impairment losses on
initial classification as held-for-sale and subsequent gains and losses on remeasurement are recognised in profit and loss.
Once classified as held-for-sale, property, plant and equipment are no longer amortised or depreciated.
A subsidiary is derecognised when the Group loses control of the subsidiary. Upon disposal, the Group derecognises the
assets, liabilities and non-controlling interests of the subsidiary and recognises the consideration received at fair value. Any
resulting gain or loss on disposal is recognised in profit or loss.
The gain or loss on disposal is measured as the difference between:
•the aggregate of the fair value of the consideration received and the carrying amount of any retained interest; and
•the carrying amount of the subsidiary’s assets (including goodwill), liabilities and non-controlling interests at the date
control is lost.
Any amounts previously recognised in other comprehensive income in relation to the subsidiary are accounted for as if the
Group had directly disposed of the related assets or liabilities.
Cash flows arising from the disposal of subsidiaries are presented as investing activities in the statement of cash flows.
Stellar Energy Solutions SPV Proprietary Limited (“Stellar”) is a renewable energy company with a project to develop a
150MW solar plant in Polokwane, Limpopo. On 18 August 2025 DRDGOLD’s shareholding was increased to 89.94% from
50.25%, through conversion of its short term credit facility into equity. On 17 November 2025, Ergo acquired the minority
shareholding, increasing the shareholding in Stellar to 100%.
Following a strategic review in the prior year, the Board decided to sell Ergo’s share in Stellar to focus on the Group’s core
mining activities. Therefore in the prior year Stellar was classified as a non-current asset held for sale in accordance with IFRS
5. At 30 June 2025, the asset was measured at its carrying amount of R110.9 million, being lower than fair value less costs to
sell.
In the current year, the sale was concluded on 23 December 2025 to NOA Group Assets Proprietary Limited (the
“NOA Group”), for a total cash consideration of R147.5 million. Concurrent with the disposal, an electricity supply agreement
was entered into with the NOA Group to procure 76GWh per annum of renewable energy, with supply expected to commence
in January 2028.
As at 23 December 2025 the carrying amount immediately before disposal was R137.1 million, resulting in a loss on disposal
of R4.8 million recognised in profit or loss during the year ended 30 June 2026.
Amounts in R million
2026
2025
Property, plant and equipment1
85.8
48.4
Capital prepayments
56.9
56.9
Trade and other receivables
2.5
15.4
Cash and cash equivalents
—
0.1
Total assets
145.2
120.8
Trade and other payables
(8.1)
(8.5)
Loan payable
—
(1.4)
Total liabilities
(8.1)
(9.9)
Net carrying amount
137.1
110.9
Sales proceeds
147.5
Less: Amount paid to minority shareholders
(15.2)
Carrying amount disposed
137.1
Loss on disposal recognised in profit or loss
(4.8)
1This amount includes cash additions of R15.2 million (2025: R105.3 million).
DRDGold_Breadcrumbs_Logo_RGB.jpg
DRDGOLD Limited Consolidated Annual Financial Statements 2026
F-37
NOTES TO THE CONSOLIDATED FINANCIAL STATEMENTS continued
for the year ended 30 June 2026
23OPERATING SEGMENTS
ACCOUNTING POLICIES
Operating segments are reported in a manner consistent with internal reports that the Group’s chief operating decision
maker (“CODM”) reviews regularly in allocating resources and assessing performance of operating segments. The CODM
has been identified as the Group’s Executive Committee. The Group has one material revenue stream, the sale of gold. To
identify operating segments, management reviewed various factors, including operational structure and mining
infrastructure. It was determined that an operating segment consists of a single or multiple metallurgical plants and
reclamation sites that, together with its tailings storage facility, is capable of operating independently.
When assessing profitability, the CODM considers, inter alia, the revenue and cash operating costs of each segment. The
net of these amounts is the segment operating profit or loss. Therefore, segment operating profit has been disclosed as the
primary measure of profit or loss. The CODM also considers the additions to property, plant and equipment.
The Group has one material revenue stream, the sale of gold to South African Bullion banks. The following summary describes
the operations in the Group’s reportable operating segments:
Ergo is a surface gold retreatment operation which treats old slime dams and sand dumps to the south of Johannesburg’s
central business district as well as the East and Central Rand goldfields. The operation comprises three plants and a solar
plant with a BESS. The Ergo plant operates as a metallurgical plant and the City Deep and Knights plants as pump/milling
stations feeding the Ergo plant.
FWGR is a surface gold retreatment operation which treats old slime dams in the West Rand goldfields. The operation
comprises the Driefontein 2 plant and relevant infrastructure to process tailings from the Driefontein 5 and 3 slimes dam and
deposit residues on the Driefontein 4 TSF.
Corporate office and other reconciling items (collectively referred to as “Other reconciling items”) represent the items to
reconcile to the consolidated financial statements. This does not represent a separate segment as it does not generate mining
revenue.
DRDGold_Breadcrumbs_Logo_RGB.jpg
DRDGOLD Limited Consolidated Annual Financial Statements 2026
F-38
NOTES TO THE CONSOLIDATED FINANCIAL STATEMENTS continued
for the year ended 30 June 2026
23OPERATING SEGMENTS continued
Ergo
FWGR
Other
reconciling
items
Total
2026
Amounts in R million
Revenue (External)
8,080.0
3,079.0
—
11,159.0
Cash operating costs
(3,968.8)
(743.6)
—
(4,712.4)
Movement in gold in process and finished inventories – Gold Bullion
15.5
(10.1)
—
5.4
Segment operating profit
4,126.7
2,325.3
—
6,452.0
Additions to property, plant and equipment
(999.6)
(2,735.8)
(1.5)
(3,736.9)
Reconciliation of segment operating profit to profit after tax
Segment operating profit
4,126.7
2,325.3
—
6,452.0
Depreciation
(341.0)
(133.0)
(3.2)
(477.2)
Change in estimate of environmental rehabilitation recognised in profit
or loss
20.8
—
(7.7)
13.1
Ongoing rehabilitation expenditure
(16.4)
(2.5)
(0.8)
(19.7)
Care and maintenance
—
—
(0.2)
(0.2)
Other operating costs
(2.9)
—
—
(2.9)
Other income
8.9
—
0.5
9.4
Loss on disposal of subsidiary
(4.8)
—
—
(4.8)
Administration expenses and other costs
(35.8)
(2.9)
(194.0)
(232.7)
Finance income
52.2
58.9
134.4
245.5
Finance expense
(75.0)
(15.0)
(10.0)
(100.0)
Current tax
(485.3)
—
(10.9)
(496.2)
Deferred tax
(418.7)
(697.6)
(14.5)
(1,130.8)
Profit after tax
2,828.7
1,533.2
(106.4)
4,255.5
Reconciliation of cost of sales to cash operating costs
Cost of sales1 (a)
(4,292.8)
(889.2)
(11.9)
(5,193.9)
Depreciation
341.0
133.0
3.2
477.2
Change in estimate of environmental rehabilitation recognised in profit
or loss
(20.8)
—
7.7
(13.1)
Movement in gold in process and finished inventories – Gold Bullion
(15.5)
10.1
—
(5.4)
Ongoing rehabilitation expenditure
16.4
2.5
0.8
19.7
Care and maintenance
—
—
0.2
0.2
Other operating costs
2.9
—
—
2.9
Cash operating costs
(3,968.8)
(743.6)
—
(4,712.4)
1  Included in cost of sales is R64.0 million (2025: R138.9 million; 2024: R144.9 million ) paid for services rendered by Sibanye-Stillwater.
(a)  Most significant components of other operating costs within cost of sales include:
Consumable stores
(1,265.8)
(246.6)
—
(1,512.4)
Labour including short term incentives
(638.9)
(128.9)
—
(767.8)
Electricity
(380.9)
(135.1)
—
(516.0)
Specialist service providers
(977.1)
(44.4)
—
(1,021.5)
Machine hire
(147.9)
(25.5)
—
(173.4)
Security expenses
(176.5)
(40.3)
—
(216.8)
Water
(39.8)
(2.9)
—
(42.7)
DRDGold_Breadcrumbs_Logo_RGB.jpg
DRDGOLD Limited Consolidated Annual Financial Statements 2026
F-39
NOTES TO THE CONSOLIDATED FINANCIAL STATEMENTS continued
for the year ended 30 June 2026
23OPERATING SEGMENTS continued
Ergo
FWGR
Other
reconciling
items
Total
2025
Amounts in R million
Revenue (External)
5,671.5
2,206.7
—
7,878.2
Cash operating costs
(3,699.2)
(673.5)
—
(4,372.7)
Movement in gold in process and finished inventories – Gold Bullion
9.8
8.3
—
18.1
Segment operating profit
1,982.1
1,541.5
—
3,523.6
Additions to property, plant and equipment
(605.7)
(1,593.1)
(1.2)
(2,200.0)
Reconciliation of segment operating profit to profit after tax
Segment operating profit
1,982.1
1,541.5
—
3,523.6
Depreciation
(326.5)
(130.2)
(2.5)
(459.2)
Change in estimate of environmental rehabilitation recognised in profit
or loss
92.8
—
5.2
98.0
Ongoing rehabilitation expenditure
(16.3)
(2.6)
(0.3)
(19.2)
Care and maintenance
—
—
0.8
0.8
Other operating costs
(13.5)
—
—
(13.5)
Administration expenses and other costs
(19.6)
(8.3)
(185.9)
(213.8)
Finance income
53.1
52.1
118.6
223.8
Finance expense
(51.6)
(11.7)
(10.1)
(73.4)
Deferred tax
(405.6)
(426.9)
8.1
(824.4)
Profit after tax
1,294.9
1,013.9
(66.1)
2,242.7
Reconciliation of cost of sales to cash operating costs
Cost of sales (a)
(3,952.9)
(798.0)
3.2
(4,747.7)
Depreciation
326.5
130.2
2.5
459.2
Change in estimate of environmental rehabilitation recognised in profit
or loss
(92.8)
—
(5.2)
(98.0)
Movement in gold in process and finished inventories – Gold Bullion
(9.8)
(8.3)
—
(18.1)
Ongoing rehabilitation expenditure
16.3
2.6
0.3
19.2
Care and maintenance
—
—
(0.8)
(0.8)
Other operating costs
13.5
—
—
13.5
Cash operating costs
(3,699.2)
(673.5)
—
(4,372.7)
(a)  Most significant components of other operating costs within cost of sales include:
Consumable stores
(1,151.4)
(224.6)
—
(1,376.0)
Labour including short term incentives
(625.9)
(121.3)
—
(747.2)
Electricity
(422.9)
(121.1)
—
(544.0)
Specialist service providers
(833.0)
(43.2)
—
(876.2)
Machine hire
(136.3)
(20.0)
—
(156.3)
Security expenses
(162.2)
(36.3)
—
(198.5)
Water
(41.3)
(3.8)
—
(45.1)
DRDGold_Breadcrumbs_Logo_RGB.jpg
DRDGOLD Limited Consolidated Annual Financial Statements 2026
F-40
NOTES TO THE CONSOLIDATED FINANCIAL STATEMENTS continued
for the year ended 30 June 2026
23OPERATING SEGMENTS continued
Ergo
FWGR
Other
reconciling
items
Total
2024
Amounts in R million
Revenue (External)
4,524.9
1,714.8
—
6,239.7
Cash operating costs
(3,571.0)
(622.3)
—
(4,193.3)
Movement in gold in process and finished inventories - Gold Bullion
37.5
(2.6)
—
34.9
Segment operating profit
991.4
1,089.9
—
2,081.3
Additions to property, plant and equipment
(2,354.6)
(756.6)
(2.7)
(3,113.9)
Reconciliation of segment operating profit to profit after tax
Segment operating profit
991.4
1,089.9
—
2,081.3
Depreciation
(138.7)
(129.5)
(2.2)
(270.4)
Change in estimate of environmental rehabilitation recognised in profit
or loss
11.1
0.2
0.3
11.6
Ongoing rehabilitation expenditure
(13.0)
(2.1)
(1.0)
(16.1)
Care and maintenance
—
—
2.5
2.5
Other operating costs
0.9
—
—
0.9
Other income
0.6
1.3
0.1
2.0
Administration expenses and other costs
(10.6)
(5.5)
(183.2)
(199.3)
Finance income
51.8
53.9
175.1
280.8
Finance expense
(60.9)
(11.7)
(3.8)
(76.4)
Current tax
5.4
(92.5)
(12.6)
(99.7)
Deferred tax
(205.1)
(183.7)
0.3
(388.5)
Profit after tax
632.9
720.3
(24.5)
1,328.7
Reconciliation of cost of sales to cash operating costs
Cost of sales
(3,673.2)
(756.3)
(0.4)
(4,429.9)
Depreciation
138.7
129.5
2.2
270.4
Change in estimate of environmental rehabilitation recognised in profit
or loss
(11.1)
(0.2)
(0.3)
(11.6)
Movement in gold in process and finished inventories - Gold Bullion
(37.5)
2.6
—
(34.9)
Ongoing rehabilitation expenditure
13.0
2.1
1.0
16.1
Care and maintenance
—
—
(2.5)
(2.5)
Other operating costs
(0.9)
—
—
(0.9)
Cash operating costs
(3,571.0)
(622.3)
—
(4,193.3)
(a) Most significant components of other operating costs within cost of sales include:
Consumable stores
(1,087.4)
(215.9)
—
(1,303.3)
Labour including short term incentives
(621.4)
(113.5)
—
(734.9)
Electricity
(472.7)
(113.4)
—
(586.1)
Specialist service providers
(812.1)
(39.6)
—
(851.7)
Machine hire
(173.2)
(25.2)
—
(198.4)
Security expenses
(137.8)
(29.4)
—
(167.2)
Water
(30.8)
(1.7)
—
(32.5)
DRDGold_Breadcrumbs_Logo_RGB.jpg
DRDGOLD Limited Consolidated Annual Financial Statements 2026
F-41
NOTES TO THE CONSOLIDATED FINANCIAL STATEMENTS continued
for the year ended 30 June 2026
24PAYMENTS MADE UNDER PROTEST
SIGNIFICANT ACCOUNTING JUDGEMENTS
Payments made under protest
The determination of whether the payments made under protest give rise to an asset or a contingent asset or neither,
required the use of significant judgement. The definition of an asset in the conceptual framework was applied as well as the
considerations in the outcome of the IFRS Interpretations Committee (“IFRIC”) agenda decision – Deposits relating to taxes
other than income tax (IAS 37 Provisions, Contingent Liabilities and Contingent Assets) (“IFRIC Agenda Decision”)
published in January 2019. The IFRIC Agenda Decision has a similar fact pattern to that of the payments made under
protest. With the consideration of the facts and circumstances surrounding the payments made under protest in applying
the definition of an asset and the IFRIC Agenda Decision management considered the following:
•payments were made under protest and without prejudice or admission of liability. Such payments were not made as a
settlement of debt or recognition of expenditure;
•the Group therefore retains a right to recover the payments from the City of Ekurhuleni Metropolitan Municipality
(“Municipality”) if the Group is successful in the Consolidated Application (as defined below);
•if the Group is not successful in the Consolidated Application, the payments will be used to settle the resultant liability to
the Municipality; and
•these two possible outcomes (i.e. success in the Main Application or not) therefore, will lead to economic benefits to the
Group.
Therefore, the right to recover the payments made under protest is not a contingent asset because it meets the definition
and recognition criteria of an asset.
The Consolidated Application consists of the Main Application of 2014 and the subsequent Action Proceedings of 2017 and
2019, which were consolidated by the office of the Deputy Judge President of the Gauteng Division of High Court. The
Consolidated Application proceeds through the Case Management Process of the Gauteng Division of High Court.
No specific guidance exists in developing an accounting policy for such asset. Therefore, management applied judgement
in developing an accounting policy that would lead to information that is relevant to the users of these financial statements
and information that can be relied upon.
Contingent liabilities
The assessment of whether an obligating event results in a liability or a contingent liability requires the exercise of significant
judgement of the outcome of future events that are not wholly within the control of the Group.
Litigation and other judicial proceedings inherently entail complex legal issues that are subject to uncertainties and
complexities and are subject to interpretation.
SIGNIFICANT ACCOUNTING ASSUMPTIONS AND ESTIMATES
The discounted amount of the payments made under protest is determined using assumptions about the future that are
inherently uncertain and can change materially over time and includes the discount rate and discount period.
These assumptions about the future include estimating the timing of concluding on the Consolidated Application, i.e. the
discount period, the ultimate settlement terms, the discount rate applied and the assessment of recoverability.
ACCOUNTING POLICIES
Payments made under protest
Recognition and measurement
The payment made under protest asset that arises from the Municipality Electricity Tariff Dispute is initially measured at a
discounted amount, and any difference between the face value of payments made under protest and the discounted
amount on initial recognition is recognised in profit or loss as a finance expense. Subsequent to initial recognition, the
payments made under protest is measured using the effective interest method to unwind the discounted amount to the
original face value less any write downs for recovery. Unwinding of the carrying value is recognised in finance income.
Changes in estimate is recognised in finance income or finance expense.
Assessment of recoverability
The discounted amount of the payments under protest is assessed at each reporting date to determine whether there is any
objective evidence that the amount is no longer expected to be recovered. The Group considers the reasonable and
supportable information related to the creditworthiness of the Municipality and events surrounding the outcome of the
Consolidated Application. Any write down is recognised in finance expense.
Contingent liabilities
A contingent liability is a possible obligation arising from past events and whose existence will be confirmed only by
occurrence or non-occurrence of one or more uncertain future events not wholly within the control of the Group. A
contingent liability may also be a present obligation arising from past events but is not recognised on the basis that an
outflow of economic resources to settle the obligation is not viewed as probable, or the amount of the obligation cannot be
reliably measured. When the Group has a present obligation, an outflow of economic resources is assessed as probable
and the Group can reliably measure the obligation, a provision is recognised.
DRDGold_Breadcrumbs_Logo_RGB.jpg
DRDGOLD Limited Consolidated Annual Financial Statements 2026
F-42
NOTES TO THE CONSOLIDATED FINANCIAL STATEMENTS continued
for the year ended 30 June 2026
24PAYMENTS MADE UNDER PROTEST continued
Amounts in R million
Note
2026
2025
Balance at the beginning of the year
56.7
45.6
Payments made under protest
2.7
6.6
Discount on initial payment made under protest and change in estimate
7
(37.8)
(3.3)
Unwinding
6
9.4
7.8
Balance at the end of the year
31.0
56.7
Ekurhuleni Metropolitan Municipality ("Municipality") Electricity Tariff Dispute
There are primarily 3 (three) legal proceedings for which relief has been sought in the appropriate legal fora and all of which
fall within the jurisdiction of the High Court of South Africa, Gauteng Local Division, Johannesburg. These comprise of an
application brought by Ergo and action proceedings brought under two summonses by the Municipality.
In order to operate the Ergo Plant and conduct its business operations, Ergo requires a reliable and steady feed of
electricity which it has drawn from the newly commissioned Brakpan Tailings 88kV Substation since June 2024. Prior to this
the Ergo Plant used to draw electricity from the Ergo Central Substation.
Over the past several years the Municipality has charged Ergo for such electricity, at the Megaflex tariff at which ESKOM
charges its large power users plus an additional surcharge, as it still does; and Ergo paid consequently.
Pursuant to its own investigations, and after having sought legal advice on the matter, Ergo determined that only ESKOM
may legitimately charge it for the electricity so drawn and consumed at the Ergo Plant, specifically from the Ergo Central
Substation. Despite this, ESKOM refused to either accept payment from Ergo in respect of such electricity consumption or
to conclude a consumer agreement with it.
In December 2014, Ergo instituted legal proceedings by way of an application (“Main Application”) against the
Municipality and ESKOM as well as the National Energy Regulator of South Africa (“NERSA”), the Minister of Energy, the
Minister of Co-operative Governance & Traditional Affairs and the South African Local Government Association ("SALGA"),
the latter 4 (four) respondents against whom Ergo does not seek any relief.
Ergo seeks the undermentioned relief from the High Court:
•declaring that the Municipality does not supply electricity to it at the Ergo Plant;
•declaring that the Municipality is in breach of its temporary Distribution License (issued by NERSA) by purporting to supply
electricity to Ergo at the Ergo Plant;
•declaring that neither the Municipality nor ESKOM may lawfully insist that only the Municipality may supply electricity to Ergo
at the Ergo Plant;
•declaring that ESKOM presently supplies electricity to Ergo at the Ergo Plant; and
•directing ESKOM to conclude a consumer agreement with Ergo for the supply of electricity at the Ergo Plant at its Megaflex
tariff.
The Municipality then issued two summonses (“Summonses”) for the recovery of arrears it alleges it is owed amounting to
R74.0 million and R31.6 million, respectively.
In the interest of the proper administration of justice, the Main Application was postponed by agreement between the
parties and efforts were made to establish a collaborative process to facilitate the effective and efficient court scheduling
and coordination of both the Main Application and the Summonses.
In order to secure uninterrupted supply of electricity, Ergo has made payment and continues to pay for consumption at the
amended and lower “J-Tariff”, albeit under protest and without prejudice and/or admission of liability. Whilst still deemed to
be disproportionate, the J-Tariff is significantly lower than the previously imposed “D-Tariff”. The Group recognised an asset
for these payments that are made “under protest”.
The Group has been advised that an application brought by the SALGA to challenge ESKOM’s ability to supply customers
with electricity must be heard, adjudicated and finalised prior to that of the Main Application. The SALGA matter appears to
have stalled, due to the interlocutory, joinder applications in the SALGA application. As the SALGA application is pivotal, it
is anticipated that any decision handed down will be appealed, finally ending up in the Constitutional Court.
DRDGold_Breadcrumbs_Logo_RGB.jpg
DRDGOLD Limited Consolidated Annual Financial Statements 2026
F-43
NOTES TO THE CONSOLIDATED FINANCIAL STATEMENTS continued
for the year ended 30 June 2026
24PAYMENTS MADE UNDER PROTEST continued
In an effort to progress these longstanding matters, in August 2024, the Group’s external legal team dispatched
correspondence to the Deputy Judge President of the Gauteng Division of the High Court, to request the consolidation of
the Main Application and Summonses (Action Proceedings of 2017 and 2019). After much deliberation between the various
legal representatives, it was agreed the matters would be consolidated and dealt with, by Judge Adams (appointed Case
Manager), through the Case Management process.
The Group supported by the external legal team is confident that there is a high probability that Ergo will be successful in
the consolidated proceedings and in defending its position. Therefore, there is no present obligation as a result of a past
event to pay the amounts claimed by the Municipality (refer note 26.3).
The balance at the end of the year was based on the following assumptions:
•discount rate: 16.01% (2025: 15.30%) representing the Municipality maximum cost of borrowing on bank loans as disclosed
in their 30 June 2026 annual report and an additional risk premium on uncertainties in timing of the SALGA case; and
•discount period: 30 June 2034 (2025: 30 June 2029) representing management’s best estimate of the date of conclusion of
the Consolidated Application and is supported by external legal counsel.
25OTHER INVESTMENTS
ACCOUNTING JUDGEMENTS
The Group has one (1) director representative on the Rand Refinery board. Therefore, judgement had to be applied to
ascertain whether significant influence exists, and if the investment should be accounted for as an associate under IAS 28
Investments in Associates and Joint Ventures. The director representation is not considered significant influence, as it does
not constitute meaningful representation. It represents 11.11% of the entire board and is proportional to the 11.3%
shareholding that the Group has in Rand Refinery.
SIGNIFICANT ACCOUNTING ASSUMPTIONS AND ESTIMATES
The fair value of the listed equity instrument is determined based on quoted prices on an active market. Equity instruments
which are not listed on an active market are measured using other applicable valuation techniques depending on the extent
to which the technique maximises the use of relevant observable inputs and minimises the use of unobservable inputs.
Where discounted cash flows are used, the estimated cash flows are based on management’s best estimate based on
readily available information at measurement date. The discounted cash flows contain assumptions about the future that are
inherently uncertain and can change materially over time.
ACCOUNTING POLICIES
On initial recognition of an equity investment that is not held for trading, the Group may make an irrevocable election to
present subsequent changes in the investment’s fair value in other comprehensive income. This election is made on an
investment-by-investment basis.
These assets are initially recognised at fair value plus any directly attributable transaction costs. Subsequent to initial
recognition they are measured at fair value and changes therein are recognised in other comprehensive income (“OCI”),
and are never reclassified to profit or loss, with dividends recognised in profit or loss unless the dividend clearly represents
a recovery of part of the cost of the investment.
The Group’s listed and unlisted investments in equity securities are classified as equity instruments at fair value through OCI
because the Company intends to hold these investments for the long term for strategic purposes.
DRDGold_Breadcrumbs_Logo_RGB.jpg
DRDGOLD Limited Consolidated Annual Financial Statements 2026
F-44
NOTES TO THE CONSOLIDATED FINANCIAL STATEMENTS continued
for the year ended 30 June 2026
25OTHER INVESTMENTS continued
Amounts in R million
Shares held 1
% held 1
2026
2025
Listed investments (Fair value hierarchy Level 1):
West Wits Mining Limited (“WWM”)
47,812,500
1.2%
22.0
11.2
Unlisted investments (Fair value hierarchy Level 3):
Rand Refinery Proprietary Limited (“Rand Refinery”)
44,438
11.3%
522.6
302.0
Rand Mutual Assurance Company Limited B Share Business
Fund (“RMA”)2
12,659
1.3%
19.9
6.8
Guardrisk Insurance Company Limited (Cell Captive A170)3
20
100.0%
2.4
2.4
Chamber of Mines Building Company Proprietary Limited
52,965
5.7%
0.1
0.1
Total unlisted investments
545.0
311.3
Balance at the end of the year
567.0
322.5
Fair value adjustment on equity instruments at fair value
through OCI
244.4
139.8
  WWM
10.8
3.6
  Rand Refinery
220.6
135.2
  RMA
13.0
1.0
Dividends received on equity instruments at fair value
through OCI
—
(56.3)
  Rand Refinery
—
(56.3)
1The number and percentage of shares held remained unchanged from the prior year with the exception of WWM that issued new shares
thereby diluting DRDGOLD’s effective shareholding from 1.5% to 1.2%.
2The “B Share Business Fund” shares relate to all the businesses of the RMA Group that do not relate to the Compensation for Occupational
Injuries and Diseases Act.
3The shares held entitle the holder to 100% of the residual net equity of Cell Captive A 170. Refer to note 11 of the consolidated financial
statements.
MARKET RISK
Other market price risk
Equity price risk arises from changes in quoted market prices of listed investments as well as changes in the fair value of
unlisted investments due to changes in the underlying net asset values.
FAIR VALUE OF FINANCIAL INSTRUMENTS
Listed investments
The fair values of listed investments are determined by reference to published price quotations from recognised securities
exchanges and constitute level 1 instruments in the fair value hierarchy.
Unlisted investments
The fair values of unlisted investments are determined through valuation techniques that include inputs that are not based on
observable market data and constitute level 3 instruments in the fair value hierarchy.
25.1RAND REFINERY
Amounts in R million
2026
2025
Balance at the beginning of the year
302.0
166.8
Fair value adjustment on equity investments at fair value through OCI
220.6
135.2
Balance at the end of the year
522.6
302.0
In accordance with IFRS 13 Fair Value Measurement, the income approach has been established to be the most appropriate
basis to estimate the fair value of the investment in Rand Refinery. This method relies on the future budgeted cash flows as
estimated by Rand Refinery. Management used a model developed by an external expert to perform the valuation.
Rand Refinery’s refining operations (excluding Prestige Bullion) were valued using the Free Cash Flow model, whereby an
enterprise value using a Gordon Growth formula for the terminal value was estimated.
DRDGold_Breadcrumbs_Logo_RGB.jpg
DRDGOLD Limited Consolidated Annual Financial Statements 2026
F-45
NOTES TO THE CONSOLIDATED FINANCIAL STATEMENTS continued
for the year ended 30 June 2026
25OTHER INVESTMENTS continued
25.1RAND REFINERY continued
FAIR VALUE OF FINANCIAL INSTRUMENTS
The fair value of Rand Refinery increased as a result of an increase in the enterprise value of the refining operations. The
enterprise value of the refining operations of Rand Refinery increased as a result of higher throughput and a significant
increase in forecast commodity prices.
The fair value measurement uses significant unobservable inputs and relates to a fair value hierarchy level 3 financial
instrument. Marketability and minority discounts (both unobservable inputs) of 15.4% and 15.6% (2025: 15.3% and 16.9%),
respectively, were applied. The latest budgeted cash flow forecasts provided by Rand Refinery as at 30 June 2026 were used,
and therefore classified as an unobservable input into the models. Other key observable/unobservable inputs into the model
include:
Rand Refinery operations
Observable/unobservable input
Unit
2026
2025
Forecast average gold price
Observable input
R/kg
2,273,530
1,620,480
Forecast average silver price
Observable input
R/kg
32,795
18,598
Average South African CPI
Observable input
%
4.9
4.5
South African long term
government bond rate
Observable input
%
8.40
9.70
Terminal growth rate
Unobservable input
%
2.4
4.5
Weighted average cost of capital
Unobservable input
%
15.8
16.0
Sensitivity analysis
The fair value measurement is most sensitive to the weighted average cost of capital, Rand US Dollar exchange rate and gold
price. The higher the gold price, the higher the fair value of the Rand Refinery investment. The higher the operating costs, the
lower the fair value of the Rand Refinery investment. The fair value measurement is also sensitive to the operating costs,
minority and marketability discounts applied. The below table indicates the extent of sensitivity of the Rand Refinery equity
value to the inputs:
2026
2025
Change in OCI, net of tax
Rand Refinery operations
% Increase/
(decrease)
Rm
Rm
Rm
Rm
Rand US Dollar exchange rate
Observable
inputs
1%
(1)%
8.1
(8.1)
6.9
(6.9)
Commodity prices (gold and
silver)
Observable
inputs
1%
(1)%
7.5
(7.5)
6.0
(6.0)
Operating costs
Unobservable
inputs
1%
(1)%
(5.4)
5.4
(4.7)
4.7
Weighted average cost of capital
Unobservable
inputs
1%
(1)%
(18.6)
18.6
(13.3)
13.3
Minority discount
Unobservable
inputs
1%
(1)%
(6.2)
6.2
(3.6)
3.6
Marketability discount
Unobservable
inputs
1%
(1)%
(6.2)
6.2
(3.5)
3.5
DRDGold_Breadcrumbs_Logo_RGB.jpg
DRDGOLD Limited Consolidated Annual Financial Statements 2026
F-46
NOTES TO THE CONSOLIDATED FINANCIAL STATEMENTS continued
for the year ended 30 June 2026
26CONTINGENCIES
SIGNIFICANT ACCOUNTING JUDGEMENTS
The assessment of whether an obligating event results in a liability or a contingent liability requires the exercise of significant
judgement of the outcome of future events that are not wholly within the control of the Group.
Litigation and other judicial proceedings inherently entail complex legal issues that are subject to uncertainties and
complexities and are subject to interpretation.
ACCOUNTING POLICIES
Contingent liabilities
A contingent liability is a possible obligation arising from past events and whose existence will be confirmed only by
occurrence or non-occurrence of one or more uncertain future events not wholly within the control of the Group. A
contingent liability may also be a present obligation arising from past events but is not recognised on the basis that an
outflow of economic resources to settle the obligation is not viewed as probable, or the amount of the obligation cannot be
reliably measured. When the Group has a present obligation, an outflow of economic resources is assessed as probable
and the Group can reliably measure the obligation, a provision is recognised.
Contingent assets
Contingent assets are possible assets whose existence will be confirmed by the occurrence or non-occurrence of uncertain
future events that are not wholly within the control of the entity. Contingent assets are not recognised, but they are disclosed
when it is more likely than not that an inflow of benefits will occur. However, when the inflow of benefits is virtually certain an
asset is recognised in the statement of financial position, because that asset is no longer considered to be contingent.
26.1CONTINGENT LIABILITY FOR OCCUPATIONAL LUNG DISEASES
On 3 May 2018, former mineworkers and dependents of deceased mineworkers (“Applicants”) and Anglo American South
Africa Limited, AngloGold Ashanti Limited, Sibanye Gold, Harmony Gold Mining Company Limited, Gold Fields Limited,
African Rainbow Minerals Limited and certain of their affiliates (“Settling Companies”) settled the class certification
application in which the Applicants in each sought to certify class actions against gold mining houses cited therein on behalf of
mineworkers who had worked for any of the particular respondents and who suffer from any occupational lung disease,
including silicosis or tuberculosis.
The DRDGOLD respondents, comprising DRDGOLD and East Rand Proprietary Mines Limited (“DRDGOLD Respondents”),
are not a party to the settlement between the Applicants and Settling Companies. The settlement agreement is not binding on
the DRDGOLD Respondents. The dispute, insofar as the class certification application and appeal thereof is concerned, still
stands and has not terminated in light of the settlement agreement.
In terms of the class action, the DRDGOLD Respondents have lodged an appeal against certain aspects of the class action
including, inter alia, the extension of the remedy entertained in the class action, and the inclusion of tuberculosis as a basis for
liability (“Appeal”). The Appeal record was finalised and the allocation of a date for the hearing of the Appeal was scheduled
for 11 November 2022. The hearing of the Appeal was held in the Supreme Court of Appeal and judgment was handed down
for the matter to be struck off the roll.
DRDGOLD maintains the view that settlement of the matter is not a current consideration, mainly for the following reasons:
•the Applicants have as yet not issued and served a summons (claim) in the matter;
•there is no indication of the number of potential claimants that may join the class action against the DRDGOLD
Respondents; and
•many principles upon which legal responsibility is founded, are required to be substantially developed by the trial court (and
possibly subsequent courts of appeal) to establish liability on the bases alleged by the Applicants.
In light of the above, the status quo remains in that there is inadequate information to determine if a sufficient legal and factual
basis exists to establish liability, and to quantify such potential liability.
DRDGold_Breadcrumbs_Logo_RGB.jpg
DRDGOLD Limited Consolidated Annual Financial Statements 2026
F-47
NOTES TO THE CONSOLIDATED FINANCIAL STATEMENTS continued
for the year ended 30 June 2026
26CONTINGENCIES continued
26.2CONTINGENT LIABILITY FOR ENVIRONMENTAL REHABILITATION
The flooding of the western and central basins has the potential to cause pollution due to Acid Mine Drainage (“AMD”)
contaminating the ground water. The government has appointed Trans-Caledon Tunnel Authority (“TCTA”) to construct a
pump station and partial treatment plant to treat and discharge the water and maintain the AMD below the Environmental
Critical level to prevent ground water contamination. TCTA completed the construction of the neutralisation plant for the Central
Basin and commenced treatment during July 2014. As part of the heads of agreement signed in December 2012 between
EMO, Ergo, ERPM and TCTA, sludge emanating from this plant since August 2014 has been co-disposed onto the Brakpan
Tailings Storage facility. Partially treated water has been discharged by TCTA into the Elsburg Spruit.
This agreement includes the granting of access to the underground water basin through one of ERPM’s shafts and the rental
of a site onto which it constructed its neutralisation plant. In exchange, Ergo and its associate companies including ERPM have
a set-off against any future directives to make any contribution toward costs or capital of up to R250 million. Through this
agreement, Ergo also secured the right to purchase up to 30ML of partially treated AMD from TCTA at cost, to reduce Ergo’s
reliance on potable water for mining and processing purposes.
While the heads of agreement should not be seen as an unqualified endorsement of the state’s AMD solution, and do not
affect our right to either challenge future directives or to implement our own initiatives should it become necessary, it is an
encouraging development.
In view of the limitation of current information for the accurate estimation of a potential liability, no reliable estimate can be
made for the possible obligation.
Mine residue deposits may have a potential pollution impact on ground water through seepage. The Group has taken certain
preventative actions as well as remedial actions in an attempt to minimise the Group’s exposure and environmental impact.
During the 2022 financial year, a report was produced regarding the extent of ground water seepage from the Brakpan tailings
storage facility by an expert. The report suggests that scavenger boreholes be constructed around the dam to deal with the
seepage. The majority of the scavenger boreholes have been constructed and are currently operational and the results are
continuously being monitored. Same evaluation and ongoing efforts are expected to be made to Daggafontein TSF when Ergo
resumes depositioning thereon in the near future. Management is currently investigating a sustainable solution to deal with the
seepage post the closure of the mine and therefore no reliable estimate can be made for the post closure liability.
26.3CONTINGENCIES REGARDING EKURHULENI METROPOLITAN MUNICIPALITY ELECTRICITY TARIFF
DISPUTE
Contingent liabilities
The Municipality has issued two summonses (“Municipal Summonses”) for the recovery of arrears it alleges it is owed
amounting to R74.0 million and R31.6 million, respectively. The Group, supported by the external legal team, is confident that
there is a high probability that Ergo will be successful in defending the Municipal Summonses. Therefore, there is no present
obligation as a result of a past event to pay the amounts claimed by the Municipality.
Contingent assets
Ergo instituted a counterclaim against the Municipality for the recovery of the surcharges which were erroneously paid to the
Municipality in the bona fide belief that they were due and payable prior to the Main Application of approximately R43 million
(these surcharges were expensed for accounting purposes).
Important Note: the above paragraphs referring to ‘contingent liabilities’ and ‘contingent assets’ ought to be read within the
backdrop of the ‘Case Management’ process mentioned above, which governs the now Consolidated Application relating to
the Ergo/ Eskom/ Ekurhuleni Municipality litigation.
Refer note 24 Payments Made Under Protest for a full description of the matter.
26.4CONTINGENT LIABILITY FOR THE SUMMONS RECEIVED FROM BENONI GOLD MINING COMPANY
(PTY) LTD (“BGM”)
On 18 May 2024, Ergo received a combined summons (“BGM Summons”) from BGM, a contractor with which it concluded
in May 2018, a land lease and load and haulage agreement (“Agreement”). The BGM Summons initiates two contractual
damages claims against Ergo. The claim amounts to R37.1 million for the alleged breach of Ergo’s duties of good faith and
breach of BGM’s haulage rights under the Agreement and the second for three alleged incidents of repudiation by Ergo of the
Agreement, for which damages of R53.3 million are being sought by BGM. On 25 June 2024, Ergo filed its plea to the
particulars of claim and in its defence on the matter. Pleadings have closed  in preparation for trial, and for Ergo to vehemently
defend its position on the allegations made by BGM. BGM is required to apply to the Registrar of Court for a trial date.
DRDGold_Breadcrumbs_Logo_RGB.jpg
DRDGOLD Limited Consolidated Annual Financial Statements 2026
F-48
NOTES TO THE CONSOLIDATED FINANCIAL STATEMENTS continued
for the year ended 30 June 2026
27FINANCIAL INSTRUMENTS
CLASSIFICATION AND MEASUREMENT OF FINANCIAL ASSETS
A financial asset shall be measured at amortised cost if both the following conditions are met:
•the financial asset is held within a business model whose objective is to hold financial assets in order to collect contractual
cash flows; and
•the contractual terms of the financial asset give rise on specified dates to cash flows that are solely payments of principal
and interest on the principal amount outstanding.
A debt instrument is measured at fair value through other comprehensive income if it meets both of the following conditions
and is not designated as at fair value through profit or loss:
•it is held with a business model whose objective is achieved by both collecting contractual cash flows and selling financial
assets; and
•its contractual terms give rise on specified dates to cash flows that are solely payments of principal and interest on the
principal amount outstanding.
On initial recognition of an equity investment that is not held for trading, the Group may make an irrevocable election to present
subsequent changes in fair value in other comprehensive income. This election is made on an investment-by-investment
basis. Equity investments designated at FVOCI are subsequently measured at fair value, with fair value gains and losses
recognised in OCI and not subsequently reclassified to profit or loss on disposal. Dividends are recognised in profit or loss
unless they clearly represent a recovery of part of the cost of the investment.
FINANCIAL RISK MANAGEMENT FRAMEWORK
Overview
The Group has exposure to credit risk, liquidity risks, as well as other market risks from its use of financial instruments. This
note presents information about the Group’s exposure to each of the above risks, the Group’s objectives and policies and
processes for measuring and managing risk. The Group’s management of capital is disclosed in note 19 capital management.
This note must be read with the quantitative disclosures included throughout these consolidated financial statements.
The Board has overall responsibility for the establishment and oversight of the Group’s risk management framework. The Risk
Committee (“RC”) is responsible for developing and monitoring the Group’s risk management policies. The RC reports
regularly to the Board on its activities.
The Group’s risk management policies are established to identify and analyse the risks faced by the Group, to set appropriate
risk limits and controls, and to monitor risks and adherence to limits. Risk management policies and systems are reviewed
regularly to reflect changes to market conditions and the Group’s activities. The Group, through its training and management
standards and procedures, aims to develop a disciplined and constructive control environment in which all employees
understand their roles and obligations.
The RC oversees how management monitors compliance with the Group’s risk management policies and procedures, and
reviews the adequacy of the risk management framework in relation to the risks faced by the Group. The RC is assisted in its
oversight role by the internal audit function. The internal audit function undertakes both regular and ad hoc reviews of risk
management controls and procedures, the results of which are reported to the RC.
CREDIT RISK
Credit risk is the risk of financial loss to the Group if a customer or counterparty to a financial instrument fails to meet its
contractual obligations, and arises principally from the Group’s trade and other receivables.
The Group’s financial instruments do not represent a concentration of credit risk due to the exposure to credit risk being
managed as disclosed in the following notes:
NOTE 11INVESTMENTS IN REHABILITATION AND OTHER FUNDS
NOTE 12CASH AND CASH EQUIVALENTS
NOTE 14TRADE AND OTHER RECEIVABLES
LIQUIDITY RISK
Liquidity risk is the risk that the Group will not be able to meet its financial obligations as they fall due. The Group’s approach to
managing liquidity is to ensure, as far as possible, that it will always have sufficient liquidity to meet its liabilities when due,
under both normal and stressed conditions, without incurring unacceptable losses or risking damage to the Group’s
reputation.
The Group ensures that it has sufficient cash on demand to meet expected operational expenses, including the servicing of
financial obligations; this excludes the potential impact of extreme circumstances that cannot reasonably be predicted, such
as natural disasters.
Additional disclosures are included in the following note:
NOTE 15TRADE AND OTHER PAYABLES
NOTE 19CAPITAL MANAGEMENT
DRDGold_Breadcrumbs_Logo_RGB.jpg
DRDGOLD Limited Consolidated Annual Financial Statements 2026
F-49
NOTES TO THE CONSOLIDATED FINANCIAL STATEMENTS continued
for the year ended 30 June 2026
27FINANCIAL INSTRUMENTS continued
MARKET RISK
Market risk is the risk that changes in market prices, such as commodity prices, foreign exchange rates, interest rates and
equity prices will affect the consolidated profit or loss or the value of its financial instruments. The objective of market risk
management is to manage and control market risk exposures within acceptable parameters, while optimising returns.
Commodity price risk
Additional disclosures are included in the following note:
NOTE 4REVENUE
Interest rate risk
Fluctuations in interest rates impact on the value of short term cash investments and financing activities, giving rise to interest
rate risk. In the ordinary course of business, the Group receives cash from its operations and is obliged to fund working capital
and capital expenditure requirements. This cash is managed to ensure surplus funds are invested in a manner to achieve
maximum returns while minimising risks. Lower interest rates result in lower returns on investments and deposits and also may
have the effect of making it less expensive to borrow funds. Conversely, higher interest rates result in higher interest payments
on loans and overdrafts.
Additional disclosures are included in the following notes:
NOTE 11INVESTMENTS IN REHABILITATION AND OTHER FUNDS
NOTE 12CASH AND CASH EQUIVALENTS
Foreign currency risk
The Group enters into transactions denominated in foreign currencies, such as gold sales denominated in US Dollar, in the
ordinary course of business The Group holds cash denominated in a foreign currency. This exposes the Group to fluctuations
in foreign currency exchange rates.
Additional disclosures are included in the following notes:
NOTE 4REVENUE
NOTE 14TRADE AND OTHER RECEIVABLES
Other market price risk
Additional disclosures are included in the following note:
NOTE 11INVESTMENTS IN REHABILITATION AND OTHER FUNDS
NOTE 25OTHER INVESTMENTS
28RELATED PARTIES
Disclosures are included in the following notes:
NOTE 1ABOUT THESE CONSOLIDATED FINANCIAL STATEMENTS
NOTE 5.1COST OF SALES
NOTE 15TRADE AND OTHER PAYABLES
NOTE 18.2TRANSACTIONS WITH KEY MANAGEMENT PERSONNEL
NOTE 20EQUITY
NOTE 21INTEREST IN SUBSIDIARIES
NOTE 22 ASSET HELD FOR SALE
DRDGold_Breadcrumbs_Logo_RGB.jpg
DRDGOLD Limited Consolidated Annual Financial Statements 2026
F-50
NOTES TO THE CONSOLIDATED FINANCIAL STATEMENTS continued
for the year ended 30 June 2026
29SUBSEQUENT EVENTS
There were no significant subsequent events between the year-end reporting date of 30 June 2026 and the date of issue of
these financial statements other than described below and included in the preceding notes to the consolidated financial
statements.
Declaration of dividend
On 19 August 2026, the Board declared a final dividend for the year ended 30 June 2026 of 120 SA cents per qualifying share
amounting to R1,042.5 million, which was paid on 14 September 2026.
Ordinary share issue
On 2 September 2026, 1,358,826 new ordinary shares were issued in terms of the new employee SIP incorporating the DSP,
increasing the total issued ordinary shares to 868,756,525.
DSP Award Granted
In terms of the SIP incorporating the DSP, approved by shareholders of DRDGOLD on 29 November 2023, qualifying
employees were awarded deferred shares (“Awards”).
On 12 August 2026, 1,358,826 deferred shares were granted to qualifying employees under the DSP. The Awards vest over
five years at 20% per annum for F-band participants, and over three years at 33.3% per annum for E and D band participants,
starting from the award date, and subject to the rules of the DSP, including the participant’s continued employment with the
Group. The number of deferred shares granted includes those granted to directors and prescribed officer as follows:
Number of deferred shares
Executive directors
DJ Pretorius
163,530
H Hooijer
74,019
Prescribed officer
WJ Schoeman
88,557
326,106
DRDGold_Breadcrumbs_Logo_RGB.jpg
DRDGOLD Limited Form 20-F 2026
85
ITEM 19. EXHIBITS
The following exhibits are filed as a part of this Annual Report:
1.1
2.1
2.2
4.1
4.2
4.3
4.4
4.5
4.6
4.7
4.8
4.9
4.10
4.11
4.12
4.13
8.1
DRDGold_Breadcrumbs_Logo_RGB.jpg
DRDGOLD Limited Form 20-F 2026
86
11.1
12.1
12.2
13.1
13.2
96.1
96.2
97.1
101.INS
XBRL Instance Document
101.SCH
XBRL Taxonomy Extension Schema Document
101.CAL
XBRL Taxonomy Extension Calculation Linkbase Document
101.DEF
XBRL Taxonomy Extension Definition Linkbase Document
101.LAB
XBRL Taxonomy Extension Label Linkbase Document
101.PRE
XBRL Taxonomy Extension Presentation Linkbase Document
† Confidential treatment has been requested over certain parts of this exhibit. Portions of this exhibit have been redacted in compliance with Item
601(a)(6) and Item 601(b)(10) of Regulation S-K. Schedules have been omitted pursuant to Item 601(a)(5) of Regulation S-K. The Company hereby
undertakes to supplementally furnish copies of any omitted schedules to the SEC upon request.
DRDGold_Breadcrumbs_Logo_RGB.jpg
DRDGOLD Limited Form 20-F 2026
87
SIGNATURES
The registrant hereby certifies that it meets all of the requirements for filing on Form 20-F and that it has duly caused and authorized
the undersigned to sign this annual report on its behalf.
DRDGOLD LIMITED
By:
/s/ D.J. Pretorius
D.J. Pretorius
Chief Executive Officer
By:
/s/ H Hooijer
H Hooijer
Chief Financial Officer
Date: October 02, 2026
Exhibit 2.2

DESCRIPTION OF SECURITIES
REGISTERED UNDER SECTION 12 OF THE EXCHANGE ACT
As of June 30, 2026, DRDGOLD Limited (the Company, DRDGOLD, we, us, and our) had the following securities registered pursuant to Section 12(b) of the Securities Exchange Act of 1934 (the Exchange Act):
Title of Each ClassTrading SymbolName of Each Exchange on Which Registered
American Depositary Shares, each representing ten ordinary sharesDRDNew York Stock Exchange
Ordinary sharesNew York Stock Exchange*
* Not for trading, but only in connection with the registration of the American Depositary Shares pursuant to the requirements of the Securities and Exchange Commission.
Capitalised terms used but not defined herein have the meanings given to them in DRDGOLD’s annual report on Form 20-F for the fiscal year ended June 30, 2026.
Ordinary shares
Item 9.A.3 Pre-emptive rights
Issue of additional shares
In accordance with the provisions of the JSE Listings Requirements and the DRDGOLD MOI, the Board shall not have the power to issue authorised shares other than:
•the issue of capitalisation shares or the offer of a cash payment in lieu of awarding capitalisation shares; and
•issues which do not require the approval of shareholders in terms of the Companies Act or the JSE Listings Requirements.
In accordance with the provisions of the Companies Act:
•an issue of shares must be approved by a special resolution of the shareholders of a company if the shares are issued to (i) a director, future director, prescribed officer or future prescribed officer of the company; (ii) any other person related or inter-related to the company or a director or prescribed officer of the company; or (iii) a nominee of a person contemplated in (i) or (ii); and
•an issue of shares in a transaction, or series of integrated transactions, requires approval of the shareholders by special resolution if the voting power of the shares that are issued as a result of the transaction will be equal to or exceed 30 per cent. of the voting power of all the shares held by shareholders immediately before the transaction or series of transactions.
Issues for Cash
In accordance with the provisions of the JSE Listings Requirements and the DRDGOLD MOI, shareholders may either convey a:
•special authority to issue shares for cash on terms that are specifically approved by shareholders in a shareholders meeting in respect of a particular issue (Specific Issue for Cash); or
•general authority to issue shares for cash on terms generally approved by shareholders in a shareholders meeting by granting the Board the authority to issue a specified number of securities for cash, which authority will be valid until the next annual general meeting or for 15 months from the date on which the resolution was passed, whichever period is shorter (General Issue for Cash).
In terms of the JSE Listings Requirements, a company may only undertake:


Exhibit 2.2
•a Specific Issue for Cash or a General Issue for Cash on the basis that a 75 per cent. majority of votes cast by shareholders at a shareholders meeting must approve the granting of such authority to the directors;
•a General Issue for Cash is subject to satisfactory compliance with certain requirements, including:
othe shares that are the subject of a General Issue for Cash may not exceed 5 per cent. of the company’s listed shares; and
othe maximum discount at which shares may be issued is 10 per cent. of the weighted average traded price of such shares measured over the 30 business days prior to the date that the price of the issue is agreed between the company and the party subscribing for the shares.
Pre-emptive rights
The Companies Act, the JSE Listings Requirements and the DRDGOLD MOI require that any new issue of shares by DRDGOLD must first be offered to existing shareholders in proportion to their shareholding in the Company, unless, among other things:
•the necessary shareholder approvals have been obtained;
•a capitalisation issue, an issue for an acquisition of assets (including another company) or an amalgamation or merger is to be undertaken; or
•the shares are to be issued in terms of option or conversion rights.
Repurchase of Shares
DRDGOLD or any subsidiary of DRDGOLD may, if authorised by special resolution by way of a general approval, acquire ordinary shares in the capital of DRDGOLD in accordance with the Companies Act and the JSE Listings Requirements, provided among other things that:
•the number of its own ordinary shares acquired by DRDGOLD in any one financial year shall not exceed 10 per cent. of the ordinary shares in issue at the date on which this resolution is passed;
•this authority shall lapse on the earlier of the date of the next annual general meeting or the date 15 months after the date on which the special resolution is passed;
•the Board has resolved to authorise the acquisition and that the Group will satisfy the solvency and liquidity test immediately after the acquisition and that since the test was done there have been no material changes to the financial position of the Group;
•the price paid per ordinary share may not be greater than 10 per cent. above the weighted average of the market value of the ordinary shares for the five business days immediately preceding the date on which an acquisition is made; and
•the number of shares acquired by subsidiaries of DRDGOLD shall not exceed 10 per cent. in the aggregate of the number of issued shares in DRDGOLD.
Item 9.A.5 Type and class of securities
DRDGOLD’s ordinary shares are listed on securities exchange operated by the JSE Limited (JSE). As of June 30, 2026, the total number of issued ordinary shares was 867,397,699. DRDGOLD’s ordinary shares are issued in registered (dematerialised) form. In addition, some of DRDGOLD’s shareholders hold a limited number of the shares in certificated form.
The transfer of any DRDGOLD certificated shares must be implemented in accordance with the provisions of the Companies Act, using the then common form of transfer. Dematerialised shares, which have been traded on the JSE, are transferred on the STRATE system and delivered five business days after each trade. The transferor of any share is deemed to remain the holder of that share until the name of the transferee is entered in DRDGOLD’s register for that share. Since DRDGOLD shares are traded through STRATE, only shares that have been dematerialised may be traded on the JSE. Accordingly, DRDGOLD shareholders who hold shares in certificated form must dematerialise their shares in order to trade on the JSE.


Exhibit 2.2
Item 9.A.6 Limitations or qualifications
Not applicable.
Item 9.A.7 Other rights
Not applicable.
Item 10.B.3 Shareholder rights
Dividends and payments to shareholders
DRDGOLD may make distributions (including the payment of dividends) from time to time in accordance with provisions of the Companies Act, the JSE Listings Requirements and the DRDGOLD MOI. In terms of the Companies Act, a company may only make a distribution (including the payment of any dividend) if:
•it reasonably appears that the company will satisfy the solvency and liquidity test immediately after completing the proposed distribution; and
•the board of the company, by resolution, has acknowledged that it has applied the solvency and liquidity test and reasonably concluded that the company will satisfy the solvency and liquidity test immediately after completing the proposed distribution.
In terms of the Companies Act, a company satisfies the solvency and liquidity test at a particular time if, considering all reasonably foreseeable financial circumstances of the company at that time:

•the assets of the company, as fairly valued, equal or exceed the liabilities of the company, as fairly valued; and
•it appears that the company will be able to pay its debts as they become due in the ordinary course of business for a period of:
o12 months after the date on which the test is considered; or
oin the case of a distribution (including the payment of dividends), 12 months following that distribution.
Subject to the above requirements, the directors of DRDGOLD may from time to time declare a dividend or any other distribution to shareholders in proportion to the number of shares held by them.
The Company must hold all monies due to the shareholders in trust indefinitely, subject to the laws of prescription. The Company shall be entitled at any time to delegate its obligations in respect of unclaimed dividends, or other unclaimed distributions, to any one of the Company’s bankers.
Voting Rights
Every shareholder of DRDGOLD, or representative of a shareholder, who is present at a shareholders meeting has one vote on a show of hands, irrespective of the number of shares he or she holds or represents, provided that a representative of a shareholder shall, irrespective of the number of shareholders he or she represents, have only one vote. Every DRDGOLD shareholder is, on a poll, entitled to one vote per ordinary share held. Neither the Companies Act nor the DRDGOLD MOI provide for cumulative voting.
A shareholder entitled to attend and vote at a shareholders meeting shall be entitled to appoint a proxy to attend, participate in, speak and vote at such shareholders meeting in the place of such shareholder. The proxy need not be a shareholder. However, the proxy may delegate the authority granted to him or her as a proxy as set out in the Companies Act.
Rights to share in the company’s profits
See “Dividends and payments to shareholders”.


Exhibit 2.2
Rights to share in any surplus in the event of liquidation
In the event of a voluntary or compulsory liquidation, dissolution or winding-up, the assets remaining after payment of all the debts and liabilities of DRDGOLD, including the costs of liquidation, shall be dealt with by a liquidator who may, among other things, divide among the shareholders any part of the assets of DRDGOLD, and may vest any part of the assets of DRDGOLD as the liquidator deems fit in trust for the benefit of shareholders. The division of assets is not required to be done in accordance with the legal rights of shareholders of DRDGOLD. In particular, any class may be given preferential or special rights or may be partly or fully excluded.
Redemption provisions
Not applicable.
Sinking fund provisions
Not applicable.
Liability to further capital calls by the Company
Not applicable.
Any provision discriminating against any existing or prospective holder of the ordinary shares as a result of such shareholder owning a substantial number of shares
Not applicable.
Item 10.B.4. Changes to shareholder rights
Amendments to DRDGOLD’s MOI
The DRDGOLD shareholders may, by the passing of a special resolution in accordance with the provisions of the Companies Act and the DRDGOLD MOI, or in compliance with a court order, and subject to the approval of the JSE, amend the DRDGOLD MOI, including:
•the creation of any class of shares;
•the variation of any preferences, rights, limitations and other terms attaching to any class of shares;
•the conversion of one class of shares into one or more other classes;
•an increase in DRDGOLD’s authorised share capital;
•a consolidation of DRDGOLD’s equity securities;
•a sub-division of DRDGOLD’s equity securities; and/or
•the change of DRDGOLD’s name.
Variation of Rights
All or any of the rights, privileges or conditions attached to DRDGOLD’s ordinary shares may be varied by a special resolution of DRDGOLD passed in accordance with the provisions of the Companies Act and the DRDGOLD MOI.
Item 10.B.6 Limitations
There are no limitations imposed by South African law or by the DRDGOLD MOI on the rights of non-South African shareholders to hold or vote DRDGOLD’s ordinary shares.
Item 10.B.7 Change in control
The DRDGOLD MOI does not contain any provisions that would have the effect of delaying, deferring or preventing a change in control of the company and that would operate only with respect to a merger, acquisition or corporate restructuring involving the company (or any of its subsidiaries).


Exhibit 2.2
Item 10.B.8 Disclosure of shareholdings
The Companies Act requires a registered holder of DRDGOLD shares who is not the beneficial owner of such shares to disclose to DRDGOLD, within five business days of the end of every month during which a change has occurred in the beneficial ownership, the identity of the beneficial owner and the number and class of securities held on behalf of the beneficial owner. Moreover, DRDGOLD may, by notice in writing, require a person who is a registered shareholder, or whom DRDGOLD knows or has reasonable cause to believe has a beneficial interest in DRDGOLD ordinary shares, to confirm or deny whether or not such person holds the ordinary shares or beneficial interest and, if the ordinary shares are held for another person, to disclose to DRDGOLD the identity of the person on whose behalf the ordinary shares are held. DRDGOLD may also require the person to give particulars of the extent of the beneficial interest held during the three years preceding the date of the notice. DRDGOLD is obliged to establish and maintain a register of the disclosures described above in accordance with the Companies Act and to publish in its annual financial statements a list of the persons who hold a beneficial interest equal to or in excess of 5 per cent. of the total number of ordinary shares issued by DRDGOLD, together with the extent of those beneficial interests.
Item 10.B.9 Differences in the law
With respect to Items 10.B.2-10.B.8, there are no significant differences between the South African law and U.S. federal law.
American Depositary Shares (12.D.1 and 12.D.2)
Deposit Agreement
DRDGOLD has an American Depositary Receipt facility. In connection with this facility, DRDGOLD is party to a Deposit Agreement, dated as of August 12, 1996, as amended and restated as of July 23, 2007, and as further amended and restated as of May 16, 2025, among DRDGOLD, JPMorgan Chase Bank, N.A. (JPMorgan), as Depositary, and all owners and holders from time to time of American Depositary Receipts issued thereunder.
This summary is subject to and qualified in its entirety by reference to the Deposit Agreement, including the form of ADRs attached thereto. Terms used in this section and not otherwise defined will have the meanings set forth in the Deposit Agreement. Copies of the Deposit Agreement are available for inspection at the Depositary Receipts Group of the Depositary, located at 383 Madison Avenue, Floor 11, New York, New York 10179. The Depositary’s principal executive office is also located at 383 Madison Avenue, Floor 11, New York, New York 10179.
American Depositary Shares
An American Depositary Receipt (ADR) is a receipt evidencing a specific number of American Depositary Shares (ADSs). The ADRs are issued by JPMorgan as Depositary. Each ADS represents an ownership interest in a designated number of shares which are deposited with the custodian, as agent of the Depositary, under the Deposit Agreement among ourselves, the Depositary, holders of ADRs, and all beneficial owners of an interest in the ADSs evidenced by ADRs from time to time.
Each DRDGOLD ADS represents ownership interests in ten DRDGOLD ordinary shares and the rights attributable to ten DRDGOLD ordinary shares that DRDGOLD will deposit with the custodian. The ADS to share ratio is subject to amendment as provided in the form of ADR (which may give rise to fees contemplated by the form of ADR). In the future, each ADS will also represent any securities, cash or other property deposited with the Depositary but which they have not distributed directly to you.

A beneficial owner is any person or entity having a beneficial ownership interest ADSs. A beneficial owner need not be the holder of the ADR evidencing such ADS. If a beneficial owner of ADSs is not an ADR holder, it must rely on the holder of the ADR(s) evidencing such ADSs in order to assert any rights or receive any benefits under the Deposit Agreement. A beneficial owner shall only be able to exercise any right or receive any benefit under the Deposit Agreement solely through the holder of the ADR(s) evidencing the ADSs owned by such beneficial owner. The arrangements between a beneficial owner of ADSs and the holder of the corresponding ADRs may affect the beneficial owner’s ability to exercise any rights it may have.


Exhibit 2.2
An ADR holder shall be deemed to have all requisite authority to act on behalf of any and all beneficial owners of the ADSs evidenced by the ADRs registered in such ADR holder’s name for all purposes under the Deposit Agreement and ADRs. The Depositary’s only notification obligations under the Deposit Agreement and the ADRs is to registered ADR holders. Notice to an ADR holder shall be deemed, for all purposes of the Deposit Agreement and the ADRs, to constitute notice to any and all beneficial owners of the ADSs evidenced by such ADR holder’s ADRs.
Unless certificated ADRs are specifically requested, all ADSs will be issued on the books of our Depositary in book-entry form and periodic statements will be mailed to you which reflect your ownership interest in such ADSs. In our description, references to American Depositary Receipts or ADRs shall include the statements you will receive which reflect your ownership of ADSs.
You may hold ADSs either directly or indirectly through your broker or other financial institution. If you hold ADSs directly, by having an ADS registered in your name on the books of the Depositary, you are an ADR holder. This description assumes you hold your ADSs directly. If you hold the ADSs through your broker or financial institution nominee, you must rely on the procedures of such broker or financial institution to assert the rights of an ADR holder described in this section. You should consult with your broker or financial institution to find out what those procedures are.
As an ADR holder or beneficial owner, DRDGOLD will not treat you as one of its shareholders and you will not have any shareholder rights. The law of the Republic of South Africa governs shareholder rights. Because the Depositary or its nominee will be the shareholder of record for the shares represented by all outstanding ADSs, shareholder rights rest with such record holder. Your rights are those of an ADR holder or of a beneficial owner. Such rights derive from the terms of the Deposit Agreement entered into among us, the Depositary and all holders and beneficial owners from time to time of ADRs issued under the Deposit Agreement and, in the case of a beneficial owner, from the arrangements between the beneficial owner and the holder of the corresponding ADRs. The obligations of the Depositary and its agents are also set out in the Deposit Agreement. Because the Depositary or its nominee will actually be the registered owner of the shares, you must rely on it to exercise the rights of a shareholder on your behalf.
The deposit agreement and the ADSs are governed by New York law. Under the Deposit Agreement, by holding an ADS or an interest therein, ADR holders and beneficial owners each irrevocably agree that any legal suit, action or proceeding against or involving us or the Depositary, arising out of or based upon the Deposit Agreement, the ADSs, the ADRs or the transactions contemplated thereby, may be instituted in a state or federal court in New York, New York, irrevocably waive any objection which you may have to the laying of venue of any such proceeding, and irrevocably submit to the exclusive jurisdiction of such courts in any such suit, action or proceeding.
The following is a summary of what we believe to be the material terms of the Deposit Agreement. Notwithstanding this, because it is a summary, it may not contain all the information that you may otherwise deem important. For more complete information, you should read the entire deposit agreement and the form of ADR which contains the terms of your ADSs. You can read a copy of the Deposit Agreement which is filed as an exhibit to the registration statement on Form F-6, which is available on the SEC’s website at http://www.sec.gov.
Share Dividends and Other Distributions
How will you receive dividends and other distributions on the shares underlying your ADSs?
We may make various types of distributions with respect to our securities. The Depositary has agreed that, to the extent practicable, it will pay to you the cash dividends or other distributions it or the custodian receives on shares or other deposited securities, after converting any cash received into U.S. dollars (if it determines such conversion may be made on a reasonable basis) and, in all cases, making any necessary deductions provided for in the Deposit Agreement. The Depositary may utilize a division, branch or affiliate of JPMorgan to direct, manage and/or execute any public and/or private sale of securities under the Deposit Agreement. Such division, branch and/or affiliate may charge the Depositary a fee in connection with such


Exhibit 2.2
sales, which fee is considered an expense of the Depositary. You will receive these distributions in proportion to the number of underlying securities that your ADSs represent.
Except as stated below, the Depositary will deliver such distributions to ADR holders in proportion to their interests in the following manner:
•Cash. The Depositary will distribute any U.S. dollars available to it resulting from a cash dividend or other cash distribution or the net proceeds of sales of any other distribution or portion thereof (to the extent applicable), on an averaged or other practicable basis, subject to (i) appropriate adjustments for taxes withheld, (ii) such distribution being impermissible or impracticable with respect to certain registered ADR holders, and (iii) deduction of the Depositary’s and/or its agents’ expenses in (1) converting any foreign currency to U.S. dollars to the extent that it determines that such conversion may be made on a reasonable basis, (2) transferring foreign currency or U.S. dollars to the United States by such means as the Depositary may determine to the extent that it determines that such transfer may be made on a reasonable basis, (3) obtaining any approval or license of any governmental authority required for such conversion or transfer, which is obtainable at a reasonable cost and within a reasonable time and (4) making any sale by public or private means in any commercially reasonable manner. If exchange rates fluctuate during a time when the Depositary cannot convert a foreign currency, you may lose some or all of the value of the distribution.
•Shares. In the case of a distribution in shares, the Depositary will issue additional ADRs to evidence the number of ADSs representing such shares. Only whole ADSs will be issued. Any shares which would result in fractional ADSs will be sold and the net proceeds will be distributed in the same manner as cash to the ADR holders entitled thereto.
•Rights to receive additional shares. In the case of a distribution of rights to subscribe for additional shares or other rights, if we timely provide evidence satisfactory to the Depositary that it may lawfully distribute such rights, the Depositary will distribute warrants or other instruments in the discretion of the Depositary representing such rights. However, if we do not timely furnish such evidence, the Depositary may:
osell such rights if practicable and distribute the net proceeds in the same manner as cash to the ADR holders entitled thereto; or
oif it is not practicable to sell such rights by reason of the non-transferability of the rights, limited markets therefor, their short duration or otherwise, do nothing and allow such rights to lapse, in which case ADR holders will receive nothing and the rights may lapse.
•Other Distributions. In the case of a distribution of securities or property other than those described above, the Depositary may either (i) distribute such securities or property in any manner it deems equitable and practicable or (ii) to the extent the Depositary deems distribution of such securities or property not to be equitable and practicable, sell such securities or property and distribute any net proceeds in the same way it distributes cash.
•Elective Distributions. In the case of a dividend payable at the election of our shareholders in cash or in additional shares whether or not we wish such elective distribution to be made available to ADR holders. The Depositary shall make such elective distribution available to ADR holders only if (i) we shall have timely requested that the elective distribution is available to ADR holders, (ii) the Depositary shall have determined that such distribution is reasonably practicable and (iii) the Depositary shall have received satisfactory documentation within the terms of the Deposit Agreement including any legal opinions of counsel that the Depositary in its reasonable discretion may request. If the above conditions are not satisfied, the Depositary shall, to the extent permitted by law, distribute to the ADR holders, on the basis of the same determination as is made in the local market in respect of the shares for which no election is made, either (x) cash or (y) additional ADSs representing such additional shares. If the above conditions are satisfied, the Depositary shall establish procedures to enable ADR holders to elect the receipt of the proposed dividend in cash or in additional ADSs. There can be no assurance that ADR holders generally, or any ADR holder in particular, will be given the opportunity to receive elective distributions on the same terms and conditions as the holders of shares.
If the Depositary determines in its discretion that any distribution described above is not practicable for the purpose of effecting such distribution with respect to any specific registered ADR holder entitled thereto, the


Exhibit 2.2
Depositary may choose any method of distribution that it deems practicable for such ADR holder, including the distribution of foreign currency, securities or property, or it may retain such items, without paying interest on or investing them, on behalf of the ADR holder as deposited securities, in which case the ADSs will also represent the retained items.
Any U.S. dollars will be distributed by checks drawn on a bank in the United States for whole dollars and cents. Fractional cents will be withheld without liability and dealt with by the Depositary in accordance with its then current practices.
The Depositary is not responsible if it fails to determine that any distribution or action is lawful or reasonably practicable.
There can be no assurance that the Depositary will be able to convert any currency at a specified exchange rate or sell any property, rights, shares or other securities at a specified price, nor that any of such transactions can be completed within a specified time period. All purchases and sales of securities will be handled by the Depositary in accordance with its then current policies, which are currently set forth in the “Depositary Receipt Sale and Purchase of Security” section of https://www.adr.com/Investors/FindOutAboutDRs, the location and contents of which the Depositary shall be solely responsible for.
Deposit, Withdrawal and Cancellation
How does the Depositary issue ADSs?
The Depositary will issue ADSs if you or your broker deposit shares or evidence of rights to receive shares with the custodian and pay the fees and expenses owing to the Depositary in connection with such issuance.
Shares deposited in the future with the custodian must be accompanied by certain delivery documentation and shall, at the time of such deposit, be registered in the name of JPMorgan Chase Bank, N.A., as Depositary for the benefit of holders of ADRs or in such other name as the Depositary shall direct.
The custodian will hold all deposited shares (including those being deposited by or on our behalf in connection with the offering to which this prospectus relates) for the account and to the order of the Depositary, in each case for the benefit of ADR holders. ADR holders and beneficial owners thus have no direct ownership interest in the shares and only have such rights as are contained in the Deposit Agreement. The custodian will also hold any additional securities, property and cash received on or in substitution for the deposited shares. The deposited shares and any such additional items are referred to as “deposited securities”.
Deposited securities are not intended to, and shall not, constitute proprietary assets of the Depositary, the custodian or their nominees. Beneficial ownership in deposited securities is intended to be, and shall at all times during the term of the Deposit Agreement continue to be, vested in the beneficial owners of the ADSs representing such deposited securities. Notwithstanding anything else contained herein, in the Deposit Agreement, in the form of ADR and/or in any outstanding ADSs, the Depositary, the custodian and their respective nominees are intended to be, and shall at all times during the term of the Deposit Agreement be, the record holder(s) only of the deposited securities represented by the ADSs for the benefit of the ADR holders. The Depositary, on its own behalf and on behalf of the custodian and their respective nominees, disclaims any beneficial ownership interest in the deposited securities held on behalf of the ADR holders.
Upon each deposit of shares, receipt of related delivery documentation and compliance with the other provisions of the Deposit Agreement, including the payment of the fees and charges of the Depositary and any taxes or other fees or charges owing, the Depositary will issue an ADR or ADRs in the name or upon the order of the person entitled thereto evidencing the number of ADSs to which such person is entitled. All of the ADSs issued will, unless specifically requested to the contrary, be part of the Depositary’s direct registration system, and a registered holder will receive periodic statements from the Depositary which will show the number of ADSs registered in such holder’s name. An ADR holder can request that the ADSs not be held through the Depositary’s direct registration system and that a certificated ADR be issued.


Exhibit 2.2
How do ADR holders cancel an ADS and obtain deposited securities?
When you turn in your ADR certificate at the Depositary’s office, or when you provide proper instructions and documentation in the case of direct registration ADSs, the Depositary will, upon payment of certain applicable fees, charges and taxes, deliver the underlying shares to you or upon your written order. Delivery of deposited securities in certificated form will be made at the custodian’s office. At your risk, expense and request, the Depositary may deliver deposited securities at such other place as you may request.
The Depositary may only restrict the withdrawal of deposited securities in connection with:
•temporary delays caused by closing our transfer books or those of the Depositary or the deposit of shares in connection with voting at a shareholders’ meeting, or the payment of dividends;
•the payment of fees, taxes and similar charges; or
•compliance with any U.S. or foreign laws or governmental regulations relating to the ADRs or to the withdrawal of deposited securities.
This right of withdrawal may not be limited by any other provision of the Deposit Agreement.
Record Dates
The Depositary may, after consultation with us if practicable, fix record dates (which, to the extent applicable, shall be as near as practicable to any corresponding record dates set by us) for the determination of the registered ADR holders who will be entitled (or obligated, as the case may be):
•to receive any distribution on or in respect of deposited securities,
•to give instructions for the exercise of voting rights at a meeting of holders of shares, or
•to pay the fee assessed by the Depositary for administration of the ADR program and for any expenses as provided for in the ADR,
•to receive any notice or to act or be obligated in respect of other matters, all subject to the provisions of the Deposit Agreement.
Voting Rights
How do you vote?
If you are an ADR holder and the Depositary asks you to provide it with voting instructions, you may instruct the Depositary how to exercise the voting rights for the shares which underlie your ADSs. Subject to the next sentence, as soon as practicable after receiving notice from us of any meeting at which the holders of shares are entitled to vote, or of our solicitation of consents or proxies from holders of shares, the Depositary shall fix the ADS record date in accordance with the provisions of the Deposit Agreement, provided that if the Depositary receives a written request from us and at least 30 days prior to the date of such vote or meeting, the Depositary shall, at our expense, distribute to the registered ADR holders a “voting notice” stating (i) final information particular to such vote and meeting and any solicitation materials, (ii) that each ADR holder on the record date set by the Depositary will, subject to any applicable provisions of South African law, be entitled to instruct the Depositary as to the exercise of the voting rights, if any, pertaining to the deposited securities represented by the ADSs evidenced by such ADR holder’s ADRs and (iii) the manner in which such instructions may be given, including instructions for giving a discretionary proxy to a person designated by us. Each ADR holder shall be solely responsible for the forwarding of voting notices to the beneficial owners of ADSs registered in such ADR holder’s name. There is no guarantee that ADR holders and beneficial owners generally or any holder or beneficial owner in particular will receive the notice described above with sufficient time to enable such ADR holder or beneficial owner to return any voting instructions to the Depositary in a timely manner.
Following actual receipt by the ADR department responsible for proxies and voting of ADR holders’ instructions (including, without limitation, instructions of any entity or entities acting on behalf of the nominee for DTC), the Depositary shall, in the manner and on or before the time established by the


Exhibit 2.2
Depositary for such purpose, endeavour to vote or cause to be voted the deposited securities represented by the ADSs evidenced by such ADR holders’ ADRs in accordance with such instructions insofar as practicable and permitted under the provisions of or governing deposited securities.
Holders are strongly encouraged to forward their voting instructions to the Depositary as soon as possible. Voting instructions will not be deemed received until such time as the ADR department responsible for proxies and voting has received such instructions, notwithstanding that such instructions may have been physically received by the Depositary prior to such time. The Depositary will not itself exercise any voting discretion in respect of deposited securities. The Depositary and its agents will not be responsible for any failure to carry out any instructions to vote any of the deposited securities, for the manner in which any such vote is cast, including, without limitation, any vote cast by a person to whom the Depositary is required to grant a discretionary proxy, or for the effect of any such vote. Notwithstanding anything contained in the Deposit Agreement or any ADR, the Depositary may, to the extent not prohibited by any law, rule or regulation or the rules and/or requirements of the stock exchange on which the ADSs are listed, in lieu of distribution of the materials provided to the Depositary in connection with any meeting of, or solicitation of consents or proxies from, holders of deposited securities, distribute to the registered holders of ADRs a notice that provides such holders with, or otherwise publicizes to such holders, instructions on how to retrieve such materials or receive such materials upon request (i.e., by reference to a website containing the materials for retrieval or a contact for requesting copies of the materials).
There is no guarantee that you will receive voting materials in time to instruct the Depositary to vote and it is possible that you, or persons who hold their ADSs through brokers, dealers or other third parties, will not have the opportunity to exercise a right to vote.
Reports and Other Communications
Will ADR holders be able to view our reports?
The Depositary will make available for inspection by ADR holders at the offices of the Depositary and the custodian the Deposit Agreement, the provisions of or governing deposited securities, and any written communications from us which are both received by the custodian or its nominee as a holder of deposited securities and made generally available to the holders of deposited securities.
Additionally, if we make any written communications generally available to holders of our shares, and we furnish copies thereof (or English translations or summaries) to the Depositary, it will distribute the same to registered ADR holders.
Fees and Expenses
What fees and expenses will you be responsible for paying?
The Depositary may charge each person to whom ADSs are issued, including, without limitation, issuances against deposits of shares, issuances in respect of share distributions, rights and other distributions, issuances pursuant to a stock dividend or stock split declared by us or issuances pursuant to a merger, exchange of securities or any other transaction or event affecting the ADSs or deposited securities, and each person surrendering ADSs for withdrawal of deposited securities or whose ADSs are cancelled or reduced for any other reason, $5.00 for each 100 ADSs (or any portion thereof) issued, delivered, reduced, cancelled or surrendered. The Depositary may sell (by public or private sale) sufficient securities and property received in respect of a share distribution, rights and/or other distribution prior to such deposit to pay such charge.
The following additional charges shall also be incurred by the ADR holders, the beneficial owners, by any party depositing or withdrawing shares or by any party surrendering ADSs and/or to whom ADSs are issued (including, without limitation, issuance pursuant to a stock dividend or stock split declared by us or an exchange of stock regarding the ADSs or the deposited securities or a distribution of ADSs), whichever is applicable:


Exhibit 2.2
•a fee of U.S.$0.05 or less per ADS held (i) upon which any cash distribution is made pursuant to the Deposit Agreement or (ii) in the case of an elective cash/stock dividend, upon which a cash distribution or an issuance of additional ADSs is made as a result of such elective dividend;
•an aggregate fee of U.S.$0.05 or less per ADS per calendar year (or portion thereof) for services performed by the Depositary in administering the ADRs (which fee may be charged on a periodic basis during each calendar year and shall be assessed against holders of ADRs as of the record date or record dates set by the Depositary during each calendar year and shall be payable in the manner described in the next succeeding provision);
•a fee for the reimbursement of such fees, charges and expenses as are incurred by the Depositary and/or any of its agents (including, without limitation, the custodian and expenses incurred on behalf of ADR holders in connection with compliance with foreign exchange control regulations or any law or regulation relating to foreign investment) in connection with the servicing of the shares or other deposited securities, the sale of securities (including, without limitation, deposited securities), the delivery of deposited securities or otherwise in connection with the Depositary’s or its custodian’s compliance with applicable law, rule or regulation (which fees and charges shall be assessed on a proportionate basis against ADR holders as of the record date or dates set by the Depositary and shall be payable at the sole discretion of the Depositary by billing such ADR holders or by deducting such charge from one or more cash dividends or other cash distributions);
•a fee for the distribution of securities (or the sale of securities in connection with a distribution), such fee being in an amount equal to the $0.05 per ADS issuance fee for the execution and delivery of ADSs which would have been charged as a result of the deposit of such securities (treating all such securities as if they were shares) but which securities or the net cash proceeds from the sale thereof are instead distributed by the Depositary to those ADR holders entitled thereto;
•stock transfer or other taxes and other governmental charges;
•SWIFT, cable, telex and facsimile transmission and delivery charges incurred at your request in connection with the deposit or delivery of shares, ADRs or deposited securities;
•transfer or registration fees for the registration of transfer of deposited securities on any applicable register in connection with the deposit or withdrawal of deposited securities;
•in connection with the conversion of foreign currency into U.S. dollars, JPMorgan Chase Bank, N.A. shall deduct out of such foreign currency the fees, expenses and other charges charged by it and/or its agent (which may be a division, branch or affiliate) so appointed in connection with such conversion; and
•fees of any division, branch or affiliate of the Depositary utilized by the Depositary to direct, manage and/or execute any public and/or private sale of securities under the Deposit Agreement.
JPMorgan Chase Bank, N.A. and/or its agent may act as principal for such conversion of foreign currency. For further details see https://www.adr.com.
We will pay all other charges and expenses of the Depositary and any agent of the Depositary (except the custodian) pursuant to agreements from time to time between us and the Depositary.
The right of the Depositary to receive payment of fees, charges and expenses survives the termination of the Deposit Agreement, and shall extend for those fees, charges and expenses incurred prior to the effectiveness of any resignation or removal of the Depositary.
The fees and charges described above may be amended from time to time by agreement between us and the Depositary.
The Depositary may make available to us a set amount or a portion of the depositary fees charged in respect of the ADR program or otherwise upon such terms and conditions as we and the Depositary may agree from time to time. The Depositary collects its fees for issuance and cancellation of ADSs directly from investors depositing shares or surrendering ADSs for the purpose of withdrawal or from intermediaries acting for them. The Depositary collects fees for making distributions to investors by deducting those fees from the amounts distributed or by selling a portion of distributable property to pay the fees. The Depositary may


Exhibit 2.2
collect its annual fee for depositary services by deduction from cash distributions, or by directly billing investors, or by charging the book-entry system accounts of participants acting for them. The Depositary will generally set off the amounts owing from distributions made to holders of ADSs. If, however, no distribution exists and payment owing is not timely received by the Depositary, the Depositary may refuse to provide any further services to ADR holders that have not paid those fees and expenses owing until such fees and expenses have been paid. At the discretion of the Depositary, all fees and charges owing under the Deposit Agreement are due in advance and/or when declared owing by the Depositary.
Payment of Taxes
ADR holders or beneficial owners must pay any tax or other governmental charge payable by the custodian or the Depositary on any ADS or ADR, deposited security or distribution. If any taxes or other governmental charges (including any penalties and/or interest) shall become payable by or on behalf of the custodian or the Depositary with respect to any ADR, any deposited securities represented by the ADSs evidenced thereby or any distribution thereon, such tax or other governmental charge shall be paid by the ADR holder thereof to the Depositary and by holding or having held an ADR or any ADSs evidenced thereby, the ADR holder and all beneficial owners thereof, and all prior ADR holders and beneficial owners thereof, jointly and severally, agree to indemnify, defend and save harmless each of the Depositary and its agents in respect of such tax or other governmental charge. Each ADR holder and beneficial owner of the ADSs evidenced thereby, and each prior ADR holder and beneficial owner thereof (collectively, the “Tax Indemnitors”), by holding or having held an ADR or an interest in ADSs, the ADR holder thereof (and prior ADR holder thereof) acknowledges and agrees that the Depositary shall have the right to seek payment of amounts owing from any one or more Tax Indemnitor(s) as determined by the Depositary in its sole discretion, without any obligation to seek payment from any other Tax Indemnitor(s). If an ADR holder owes any tax or other governmental charge, the Depositary may (i) deduct the amount thereof from any cash distributions, or (ii) sell deposited securities (by public or private sale) and deduct the amount owing from the net proceeds of such sale. In either case the ADR holder remains liable for any shortfall. If any tax or governmental charge is unpaid, the Depositary may also refuse to effect any registration, registration of transfer, split-up or combination of deposited securities or withdrawal of deposited securities until such payment is made. If any tax or governmental charge is required to be withheld on any cash distribution, the Depositary may deduct the amount required to be withheld from any cash distribution or, in the case of a non- cash distribution, sell the distributed property or securities (by public or private sale) in such amounts and in such manner as the Depositary deems necessary and practicable to pay such taxes and distribute any remaining net proceeds or the balance of any such property after deduction of such taxes to the ADR holders entitled thereto.
As an ADR holder or beneficial owner, you will be agreeing to indemnify us, the Depositary, its custodian and any of our or their respective officers, directors, employees, agents and affiliates against, and hold each of them harmless from, any claims by any governmental authority with respect to taxes, additions to tax, penalties or interest arising out of any refund of taxes, reduced rate of withholding at source or other tax benefit obtained.
Reclassifications, Recapitalizations and Mergers
If we take certain actions that affect the deposited securities, including (i) any change in par value, split-up, consolidation, cancellation or other reclassification of deposited securities or (ii) any distributions of shares or other property not made to holders of ADRs or (iii) any recapitalization, reorganization, merger, consolidation, liquidation, receivership, bankruptcy or sale of all or substantially all of our assets, then the Depositary may choose to, and shall if reasonably requested by us:
•amend the form of ADR;
•distribute additional or amended ADRs;
•distribute cash, securities or other property it has received in connection with such actions;
•sell any securities or property received and distribute the proceeds as cash; or
•none of the above.


Exhibit 2.2
If the Depositary does not choose any of the above options, any of the cash, securities or other property it receives will constitute part of the deposited securities and each ADS will then represent a proportionate interest in such property.
Amendment and Termination
How may the Deposit Agreement be amended?
We may agree with the Depositary to amend the Deposit Agreement and the ADSs without your consent for any reason. ADR holders must be given at least 30 days’ notice of any amendment that imposes or increases any fees or charges (other than stock transfer or other taxes and other governmental charges, transfer or registration fees, SWIFT, cable, telex or facsimile transmission costs, delivery costs or other such expenses), or otherwise prejudices any substantial existing right of ADR holders or beneficial owners. Such notice need not describe in detail the specific amendments effectuated thereby, but must identify to ADR holders and beneficial owners a means to access the text of such amendment. If an ADR holder continues to hold an ADR or ADRs after being so notified, such ADR holder and any beneficial owner are deemed to agree to such amendment and to be bound by the Deposit Agreement as so amended. No amendment, however, will impair your right to surrender your ADSs and receive the underlying securities, except in order to comply with mandatory provisions of applicable law.
Any amendments or supplements which (i) are reasonably necessary (as agreed by us and the Depositary) in order for (a) the ADSs to be registered on Form F-6 under the Securities Act of 1933 or (b) the ADSs or shares to be traded solely in electronic book-entry form and (ii) do not in either such case impose or increase any fees or charges to be borne by ADR holders, shall be deemed not to prejudice any substantial rights of ADR holders or beneficial owners. Notwithstanding the foregoing, if any governmental body or regulatory body should adopt new laws, rules or regulations which would require amendment or supplement of the Deposit Agreement or the form of ADR to ensure compliance therewith, we and the Depositary may amend or supplement the Deposit Agreement and the ADR at any time in accordance with such changed laws, rules or regulations. Such amendment or supplement to the Deposit Agreement in such circumstances may become effective before a notice of such amendment or supplement is given to ADR holders or within any other period of time as required for compliance.
Notice of any amendment to the Deposit Agreement or form of ADRs shall not need to describe in detail the specific amendments effectuated thereby, and failure to describe the specific amendments in any such notice shall not render such notice invalid, provided, however, that, in each such case, the notice given to the ADR holders identifies a means for ADR holders and beneficial owners to retrieve or receive the text of such amendment (i.e., upon retrieval from the SEC’s, the Depositary’s or our website or upon request from the Depositary).
How may the Deposit Agreement be terminated?
The Depositary may, and shall at our written direction, terminate the Deposit Agreement and the ADRs by mailing notice of such termination to the registered holders of ADRs at least 30 days prior to the date fixed in such notice for such termination; provided, however, if the Depositary shall have (i) resigned as Depositary under the Deposit Agreement, notice of such termination by the Depositary shall not be provided to registered ADR holders unless a successor Depositary shall not be operating under the Deposit Agreement within 60 days of the date of such resignation, and (ii) been removed as Depositary under the Deposit Agreement, notice of such termination by the Depositary shall not be provided to registered holders of ADRs unless a successor Depositary shall not be operating under the Deposit Agreement on the 60th day after our notice of removal was first provided to the Depositary.
After the date so fixed for termination, the Depositary and its agents will perform no further acts under the Deposit Agreement or the ADRs, except to receive and hold (or sell) distributions on deposited securities and deliver deposited securities being withdrawn. As soon as practicable after the date so fixed for termination, the Depositary shall use its reasonable efforts to sell the deposited securities and shall thereafter (as long as it may lawfully do so) hold in an account (which may be segregated or unsegregated account) the net proceeds of such sales, together with any other cash then held by it under the Deposit Agreement,


Exhibit 2.2
without liability for interest, in trust for the pro rata benefit of the holders of ADRs not theretofore surrendered. After making such sale, the Depositary shall be discharged from all obligations in respect of the Deposit Agreement and the ADR, except to account for such net proceeds and other cash.
Limitations on Obligations and Liability to ADR holders
Limits on our obligations and the obligations of the Depositary; limits on liability to ADR holders and holders of ADSs
Prior to the issue, registration, registration of transfer, split-up, combination, or cancellation of any ADRs, or the delivery of any distribution in respect thereof, and from time to time in the case of the production of proofs as described below, we or the Depositary or its custodian may require:
•payment with respect thereto of (i) any stock transfer or other tax or other governmental charge, (ii) any stock transfer or registration fees in effect for the registration of transfers of shares or other deposited securities upon any applicable register and (iii) any applicable fees and expenses described in the Deposit Agreement;
•the production of proof satisfactory to it of (i) the identity of any signatory and genuineness of any signature and (ii) such other information, including without limitation, information as to citizenship, residence, exchange control approval, beneficial or other ownership of any securities, compliance with applicable law, regulations, provisions of or governing deposited securities and terms of the Deposit Agreement and the ADRs, as it may deem necessary or proper; and
•compliance with such regulations as the Depositary may establish consistent with the Deposit Agreement.
The issuance of ADRs, the acceptance of deposits of shares, the registration, registration of transfer, split-up or combination of ADRs or the withdrawal of shares, may be suspended, generally or in particular instances, when the ADR register or any register for deposited securities is closed or when any such action is deemed advisable by the Depositary; provided that the ability to withdraw shares may only be limited under the following circumstances: (i) temporary delays caused by closing transfer books of the Depositary or our transfer books or the deposit of shares in connection with voting at a shareholders’ meeting, or the payment of dividends, (ii) the payment of fees, taxes, and similar charges, and (iii) compliance with any laws or governmental regulations relating to ADRs or to the withdrawal of deposited securities.
The deposit agreement expressly limits the obligations and liability of the Depositary, ourselves and our respective agents, provided, however, that no disclaimer of liability under the Securities Act of 1933 is intended by any of the limitations of liabilities provisions of the Deposit Agreement. The deposit agreement provides that each of us, the Depositary and our respective agents will:
•incur no liability to holders or beneficial owners of ADRs if any present or future law, rule, regulation, fiat, order or decree of the United States, the Republic of South Africa or any other country or jurisdiction, or of any governmental or regulatory authority or securities exchange or market or automated quotation system, the provisions of or governing any deposited securities, any present or future provision of our charter, any act of God, war, terrorism, nationalization, expropriation, currency restrictions, work stoppage, strike, civil unrest, revolutions, rebellions, explosions, computer failure or circumstance beyond our, the Depositary’s or our respective agents’ direct and immediate control shall prevent or delay, or shall cause any of them to be subject to any civil or criminal penalty in connection with, any act which the Deposit Agreement or the ADRs provide shall be done or performed by us, the Depositary or our respective agents (including, without limitation, voting);
•incur no liability to holders or beneficial owners of ADRs by reason of any non-performance or delay, caused as aforesaid, in the performance of any act or things which by the terms of the Deposit Agreement it is provided shall or may be done or performed or any exercise or failure to exercise discretion under the Deposit Agreement or the ADRs including, without limitation, any failure to determine that any distribution or action may be lawful or reasonably practicable;


Exhibit 2.2
•not incur or assume any liability to holders or beneficial owners of ADRs if it performs its obligations under the Deposit Agreement and ADRs without gross negligence or wilful misconduct and the Depositary shall not be a fiduciary or have any fiduciary duty to holders or beneficial owners of ADRs;
•in the case of the Depositary and its agents, be under no obligation to appear in, prosecute or defend any action, suit or other proceeding in respect of any deposited securities, the ADSs or the ADRs;
•in the case of us and our agents, be under no obligation to appear in, prosecute or defend any action, suit or other proceeding in respect of any deposited securities or the ADRs, which in our or our agents’ opinion, as the case may be, may involve it in expense or liability, unless indemnity satisfactory to us or our agent, as the case may be against all expense (including fees and disbursements of counsel) and liability be furnished as often as may be requested;
•not be liable to holders or beneficial owners of ADRs for any action or inaction by it in reliance upon the advice of or information from legal counsel, accountants, any person presenting shares for deposit, any registered holder of ADRs, any other person believed by it to be competent to give such advice or information, or in the case of the Depositary only, us; or
•may rely and shall be protected in acting upon any written notice, request, direction, instruction or document believed by it to be genuine and to have been signed, presented or given by the proper party or parties.
Neither the Depositary nor its agents have any obligation to appear in, prosecute or defend any action, suit or other proceeding in respect of any deposited securities, the ADSs or the ADRs. We and our agents shall only be obligated to appear in, prosecute or defend any action, suit or other proceeding in respect of any deposited securities, the ADSs or the ADRs, which in our opinion may involve us in expense or liability, if indemnity satisfactory to us against all expense (including fees and disbursements of counsel) and liability is furnished as often as may be required. The Depositary and its agents may fully respond to any and all demands or requests for information maintained by or on its behalf in connection with the Deposit Agreement, any registered holder or holders of ADRs, any ADRs or otherwise related to the Deposit Agreement or ADRs to the extent such information is requested or required by or pursuant to any lawful authority, including without limitation laws, rules, regulations, administrative or judicial process, banking, securities or other regulators. The Depositary shall not be liable for the acts or omissions made by, or the insolvency of, any securities depository, clearing agency or settlement system. Furthermore, the Depositary shall not be responsible for, and shall incur no liability in connection with or arising from, the insolvency of any custodian that is not a branch or affiliate of JPMorgan.
Notwithstanding anything to the contrary contained in the Deposit Agreement or any ADRs, the Depositary shall not be responsible for, and shall incur no liability in connection with or arising from, any act or omission to act on the part of the custodian except to the extent that any registered ADR holder has incurred liability directly as a result of the custodian having (i) committed fraud or wilful misconduct in the provision of custodial services to the Depositary or (ii) failed to use reasonable care in the provision of custodial services to the Depositary as determined in accordance with the standards prevailing in the jurisdiction in which the custodian is located. The Depositary and the custodian(s) may use third party delivery services and providers of information regarding matters such as pricing, proxy voting, corporate actions, class action litigation and other services in connection with the ADRs and the Deposit Agreement, and use local agents to provide extraordinary services such as attendance at annual meetings of issuers of securities. Although the Depositary and the custodian will use reasonable care (and cause their agents to use reasonable care) in the selection and retention of such third party providers and local agents, they will not be responsible for any errors or omissions made by them in providing the relevant information or services. The Depositary shall not have any liability for the price received in connection with any sale of securities, the timing thereof or any delay in action or omission to act nor shall it be responsible for any error or delay in action, omission to act, default or negligence on the part of the party so retained in connection with any such sale or proposed sale.
The Depositary has no obligation to inform ADR holders or beneficial owners about the requirements of the laws, rules or regulations or any changes therein or thereto of any country or jurisdiction or of any governmental or regulatory authority or any securities exchange or market or automated quotation system.


Exhibit 2.2
Additionally, none of us, the Depositary or the custodian shall be liable for the failure by any registered holder of ADRs or beneficial owner therein to obtain the benefits of credits or refunds of non-U.S. tax paid against such ADR holder’s or beneficial owner’s income tax liability. The Depositary is under no obligation to provide the ADR holders and beneficial owners, or any of them, with any information about our tax status. Neither we nor the Depositary shall incur any liability for any tax or tax consequences that may be incurred by registered ADR holders or beneficial owners on account of their ownership or disposition of ADRs or ADSs.
Neither the Depositary nor its agents will be responsible for any failure to carry out any instructions to vote any of the deposited securities, for the manner in which any such vote is cast, including, without limitation, any vote cast by a person to whom the Depositary is required to grant a discretionary proxy, or for the effect of any such vote. The Depositary may rely upon instructions from us or our counsel in respect of any approval or license required for any currency conversion, transfer or distribution. The Depositary shall not incur any liability for the content of any information submitted to it by us or on our behalf for distribution to ADR holders or for any inaccuracy of any translation thereof, for any investment risk associated with acquiring an interest in the deposited securities, for the validity or worth of the deposited securities, for the credit-worthiness of any third party, for allowing any rights to lapse upon the terms of the Deposit Agreement or for the failure or timeliness of any notice from us. The Depositary shall not be liable for any acts or omissions made by a successor depositary whether in connection with a previous act or omission of the Depositary or in connection with any matter arising wholly after the removal or resignation of the Depositary.
Neither us, the Depositary nor any of its agents shall be liable for any indirect, special, punitive or consequential damages (including, without limitation, legal fees and expenses) or lost profits, in each case of any form incurred by any person or entity (including, without limitation holders or beneficial owners of ADRs and ADSs), whether or not foreseeable and regardless of the type of action in which such a claim may be brought.
No provision of the Deposit Agreement or the ADRs is intended to constitute a waiver or limitation of any rights which an ADR holder or any beneficial owner may have under the Securities Act of 1933 or the Securities Exchange Act of 1934, to the extent applicable.
The Depositary and its agents may own and deal in any class of securities of our company and our affiliates and in ADRs.
Disclosure of Interest in ADSs
To the extent that the provisions of or governing any deposited securities may require disclosure of or impose limits on beneficial or other ownership of, or interests in, deposited securities, other shares and other securities and may provide for blocking transfer, voting or other rights to enforce such disclosure or limits, you as ADR holders or beneficial owners agree to comply with all such disclosure requirements and ownership limitations and to comply with any reasonable instructions we may provide in respect thereof.
Books of Depositary
The Depositary or its agent will maintain a register for the registration, registration of transfer, combination and split-up of ADRs, which register shall include the Depositary’s direct registration system. Registered holders of ADRs may inspect such records at the Depositary’s office at all reasonable times, but solely for the purpose of communicating with other ADR holders in the interest of the business of our company or a matter relating to the Deposit Agreement. Such register may be closed at any time or from time to time, when deemed expedient by the Depositary or, in the case of the issuance book portion of the ADR Register, when reasonably requested by the Company solely in order to enable the Company to comply with applicable law.
The Depositary will maintain facilities for the delivery and receipt of ADRs.


Exhibit 2.2
Appointment
In the Deposit Agreement, each registered holder of ADRs and each beneficial owner, upon acceptance of any ADSs or ADRs (or any interest in any of them) issued in accordance with the terms and conditions of the Deposit Agreement will be deemed for all purposes to:
•be a party to and bound by the terms of the Deposit Agreement and the applicable ADR or ADRs,
•appoint the Depositary its attorney-in-fact, with full power to delegate, to act on its behalf and to take any and all actions contemplated in the Deposit Agreement and the applicable ADR or ADRs, to adopt any and all procedures necessary to comply with applicable laws and to take such action as the Depositary in its sole discretion may deem necessary or appropriate to carry out the purposes of the Deposit Agreement and the applicable ADR and ADRs, the taking of such actions to be the conclusive determinant of the necessity and appropriateness thereof; and
•acknowledge and agree that (i) nothing in the Deposit Agreement or any ADR shall give rise to a partnership or joint venture among the parties thereto, nor establish a fiduciary or similar relationship among such parties, (ii) the Depositary, its divisions, branches and affiliates, and their respective agents, may from time to time be in the possession of non-public information about us, ADR holders, beneficial owners and/or their respective affiliates, (iii) the Depositary and its divisions, branches and affiliates may at any time have multiple banking relationships with us, ADR holders, beneficial owners and/or the affiliates of any of them, (iv) the Depositary and its divisions, branches and affiliates may, from time to time, be engaged in transactions in which parties adverse to us or ADR holders or beneficial owners may have interests, (v) nothing contained in the Deposit Agreement or any ADR(s) shall (A) preclude the Depositary or any of its divisions, branches or affiliates from engaging in such transactions or establishing or maintaining such relationships, or (B) obligate the Depositary or any of its divisions, branches or affiliates to disclose such transactions or relationships or to account for any profit made or payment received in such transactions or relationships, (vi) the Depositary shall not be deemed to have knowledge of any information held by any branch, division or affiliate of the Depositary and (vii) notice to an ADR holder shall be deemed, for all purposes of the Deposit Agreement and the ADRs, to constitute notice to any and all beneficial owners of the ADSs evidenced by such ADR holder’s ADRs. For all purposes under the Deposit Agreement and the ADRs, the ADR holders thereof shall be deemed to have all requisite authority to act on behalf of any and all beneficial owners of the ADSs evidenced by such ADRs.
Governing Law
The deposit agreement, the ADSs and the ADRs are governed by and construed in accordance with the internal laws of the State of New York. In the Deposit Agreement, we have submitted to the non-exclusive jurisdiction of the courts of the State of New York and appointed an agent for service of process on our behalf. Any action based on the Deposit Agreement, the ADSs, the ADRs or the transactions contemplated therein or thereby may be instituted by the Depositary against us in any competent court in the Republic of South Africa and/or the United States.
Under the Deposit Agreement, by holding an ADR or an interest therein, ADR holders and beneficial owners each irrevocably agree that any legal suit, action or proceeding against or involving us or the Depositary, arising out of or based upon the Deposit Agreement, the ADSs, the ADRs or the transactions contemplated thereby, may only be instituted in a state or federal court in New York, New York, and by holding an ADS or an interest therein each irrevocably waives any objection which it may now or hereafter have to the laying of venue of any such proceeding, and irrevocably submits to the exclusive jurisdiction of such courts in any such suit, action or proceeding.
Jury Trial Waiver
In the Deposit Agreement each party thereto (including, for avoidance of doubt, each holder and beneficial owner and/or holder of interests in ADSs and ADRs) irrevocably waives, to the fullest extent permitted by applicable law, any right it may have to a trial by jury in any suit, action or proceeding against the Depositary and/or us directly or indirectly arising out of or relating to the shares or other deposited securities, the ADSs or the ADRs, the Deposit Agreement or any transaction contemplated therein, or the


Exhibit 2.2
breach thereof (whether based on contract, tort, common law or any other theory), including any claim under the U.S. federal securities laws.
If we or the Depositary were to oppose a jury trial demand based on such waiver, the court would determine whether the waiver was enforceable in the facts and circumstances of that case in accordance with applicable state and federal law, including whether a party knowingly, intelligently and voluntarily waived the right to a jury trial. The waiver to right to a jury trial of the Deposit Agreement is not intended to be deemed a waiver by any holder or beneficial owner of ADSs of the Company’s or the Depositary’s compliance with the U.S. federal securities laws and the rules and regulations promulgated thereunder.


Exhibit 4.9 4 March 2025 The Directors DRDGOLD Limited Constantia Office Park Cnr 14th Avenue and Hendrik Potgieter Road Cycad House, Building 17, Ground Floor Weltevreden Park 1709 Attention: Riaan Davel Dear Sirs FIRST ADDENDUM TO THE AMENDED AND RESTATED FACILITY LETTER 1 DRDGOLD Limited (Registration Number 1895/000926/06) (Borrower) and Nedbank Limited (acting through its Nedbank Corporate and Investment Banking Division) (Registration Number 1951/000009/06) (Nedbank) entered into a facility letter on or about 28 June 2024 in terms of which Nedbank made available a general banking facility to the Borrower in an aggregate amount of ZAR500,000,000 (five hundred million Rand) (the Facility Letter), as amended and restated on or about 8 August 2024 (Amended and Restated Facility Letter). The Parties now wish to amend the Amended and Restated Facility Letter as set out herein (First Addendum). 2 Terms defined in the Amended and Restated Facility Letter have the same meaning in this First Addendum, unless given a different meaning herein. 3 Conditions Precedent 3.1 The Borrower shall deliver the following documents and other evidence in form and substance satisfactory to Nedbank. Nedbank shall notify the Borrower promptly upon being so satisfied (the date of such notification being the Effective Date): 3.1.1 receipt by Nedbank of a copy of a signed resolution by the board of each Obligor (as applicable) approving the entry into and performance by it of this First Addendum and any other Finance Documents to which it is party and giving specified officials the power to execute the aforesaid documents and all documents required to be delivered thereunder and to perform all acts required thereunder and in order to render the same unconditional. 3.1.2 In respect of section 45 of the Companies Act: 3.1.2.1 a copy certified a true copy of each board resolution of each company, providing the financial assistance (Assisting Company) to or for the benefit of Nedbank or other Nedbank 135 Rivonia Campus 135 Rivonia Road Sandown Sandton 2196 | PO Box 1144 Johannesburg 2000 South Africa T +27 11 294 4444 | F +27 11 295 1111 | E [email protected] | W nedbank.co.za/cib Directors: AD Mminele (Chairperson) JP Quinn (Chief Executive) HR Brody (Lead Independent Director) BA Dames MH Davis (Chief Financial Officer) NP Dongwana Dr MA Hermanus EM Kruger P Langeni RAG Leith L Makalima MC Nkuhlu (Chief Operating Officer) Dr TM Nombembe S Subramoney Company Secretary: J Katzin 15.07.2024 Nedbank Corporate and Investment Banking is a division of Nedbank Limited Reg No 1951/000009/06. Authorised financial services and registered credit provider (NCRCP16). LEGAL-1511177124-351


 
Page 2 R620 000 000.00 (Six Hundred and Twenty Million Rand). 1.3: Aggregate amount of Facilities General banking facility up to R500 000 000.00 (Five Hundred Million Rand), by means of an overdraft and overnight loans. 1.4: General Banking Facility parties (as the case may be) and the entering into of such agreements to which such Assisting Company is party; 3.1.2.2 a copy, certified a true copy of each special resolution passed by the shareholders of each Assisting Company in accordance with section 45 of the Companies Act, in terms whereof they approve the granting by each Assisting Company of the aforesaid financial assistance. 3.1.3 receipt by Nedbank of a written confirmation from the Facility Agent that the increase to the facility limits as contemplated in this First Addendum complies with clause 1.1.82.8 of the Revolving Credit Facility Agreement. 3.1.4 receipt by Nedbank of a written confirmation from the Borrower confirming that prior written consent of the Majority Lenders has been obtained in terms of clause 1.1.83.7 of the Revolving Credit Facility Agreement. 3.2 The Borrower shall use its best endeavours to procure the fulfilment at its cost, of the conditions precedent in this clause 3 on or before 30 April 2025. 3.3 The conditions precedent in this clause 3 have been stipulated for the benefit of Nedbank and Nedbank shall be entitled to waive fulfilment of all or any part of such conditions by giving written notice to that effect to the Borrower, on such terms and conditions as Nedbank may impose at the time and the fulfilment thereof to Nedbank’s satisfaction. 4 With effect from the Effective Date, the Amended and Restated Facility Letter is hereby amended as follows: 4.1 by the deletion of clause 1.3 of the Amended and Restated Facility Letter in its entirety and the substitution of the following in its place: 4.2 by the deletion of clause 1.4 of the Amended and Restated Facility Letter in its entirety and the substitution of the following in its place: 4.3 by the insertion of a new clause 1.10 and sub-clauses 1,10.1 – 1.10.6 after the existing clause 1.9 (VAT) of the Amended and Restated Facility Letter as follows:


Page 3 1.10: Indirect Facilities comprising of letters of guarantees Letters of guarantee up to an amount of R120 000 000.00 (One Hundred and Twenty Million Rand). 1.10.1: Rate/Commission The applicable rate or commission shall be the rate agreed in writing between the Parties at the time of request for the issuance of a letter of guarantee. 1.10.2: Amount This instrument is subject to the limit/sub-limit set out in the Amended and Restated Facility Letter, if any, or in any other agreement concluded between the Parties. 1.10.3: Period The applicable period shall be the period agreed to at the time of request for the issue of a guarantee. 1.10.4: Nedbank’s Obligations Nedbank’s obligations shall be limited to the payment of money. Unless otherwise agreed in writing between the Parties, all letters of guarantee shall be payable on the beneficiary’s first demand in writing and/or the presentation of the relevant guarantee to Nedbank. 1.10.5: Condition Precedent Guarantees shall only be issued after the signature by the Borrower of Nedbank Counter-Guarantee in respect of each guarantee or Nedbank’s Master Counter Guarantee Form, and/or any other forms as the case may be. 1.10.6: Other Terms Other terms shall be negotiated by the Parties at the time of request for the issue of a guarantee on terms and conditions acceptable to Nedbank. 5 If there is any conflict between the provisions of this First Addendum and the provisions of the Amended and Restated Facility Letter, the provisions of this First Addendum shall prevail. 6 Save as expressly contemplated herein, the Amended and Restated Facility Letter shall remain unamended and of full force and effect. If the terms of this First Addendum are acceptable to you, kindly indicate your acceptance by initialling each page and signing the attached duplicate original of this First Addendum where indicated and returning it to Nedbank. Should you require any further information or clarification, please contact Darryl Hardiman at [email protected] or 010 235 4660.


Page 4 S KHAN DIVISIONAL CREDIT EXECUTIVE CIB V PILLAY SENIOR CREDIT MANAGER CIB D HARDIMAN PRINCIPAL: TRANSACTIONAL SERVICES SALES Accepted at .................................................... on this the ..........15th.......... day of .......................................... 2025 For and on behalf of: DRDGOLD LIMITED (who hereby warrants his authority) For and on behalf of: DRDGOLD LIMITED (who hereby warrants his authority) Name: Adriaan Jacobus Davel Name: Mpho Mashatola Capacity: Capacity: Accepted at .................................................... on this the ..........11th.......... day of .......................................... 2025 For and on behalf of: ERGO MINING PROPRIETARY LIMITED (who hereby warrants his authority) F For and on behalf of: ERGO MINING PROPRIETARY LIMITED (who hereby warrants his authority) Name: Henriette Hooijer Name: Henry Nicolaas Gouws Capacity: Capacity: Accepted at .................................................... on this the ........11th............ day of .......................................... 2025 For and on behalf of: FAR WEST GOLD RECOVERIES PROPRIETARY LIMITED (who hereby warrants his authority) For and on behalf of: FAR WEST GOLD RECOVERIES PROPRIETARY LIMITED (who hereby warrants his authority) Name: Henriette Hooijer Name: Kevin Peter Kruger Capacity: Capacity: /s/ Henry Nicolaas Gouws /s/ S Khan /s/ Henriette Hooijer /s/ Kevin Peter Kruger /s/ V Pillay /s/ D Hardiman /s/ Adriaan Jacobus Davel /s/ Henriette Hooijer /s/ Mpho Mashatola


Exhibit 4.10 21 July 2025 The Directors DRDGOLD Limited Constantia Office Park Cnr 14th Avenue and Hendrik Potgieter Road Cycad House, Building 17, Ground Floor Weltevreden Park 1709 Attention: Riaan Davel Dear Sirs SECOND ADDENDUM TO THE AMENDED AND RESTATED FACILITY LETTER 1 DRDGOLD Limited (Registration Number 1895/000926/06) (Borrower) and Nedbank Limited (acting through its Nedbank Corporate and Investment Banking Division) (Registration Number 1951/000009/06) (Nedbank) entered into a facility letter on or about 28 June 2024 in terms of which Nedbank made available a general banking facility to the Borrower in an aggregate amount of ZAR500,000,000 (five hundred million Rand) (the Facility Letter), as amended and restated on or about 8 August 2024, as amended (Amended and Restated Facility Letter). The Parties now wish to amend the Amended and Restated Facility Letter as set out herein (Second Addendum). 2 Terms defined in the Amended and Restated Facility Letter have the same meaning in this Second Addendum, unless given a different meaning herein. 3 Conditions Precedent 3.1 The Borrower shall deliver the following documents and other evidence in form and substance satisfactory to Nedbank. Nedbank shall notify the Borrower promptly upon being so satisfied (the date of such notification being the Effective Date): 3.1.1 receipt by Nedbank of a copy of a signed resolution by the board of each Obligor (as applicable) approving the entry into and performance by it of this Second Addendum and any other Finance Documents to which it is party and giving specified officials the power to execute the aforesaid documents and all documents required to be delivered thereunder and to perform all acts required thereunder and in order to render the same unconditional. 3.1.2 In respect of section 45 of the Companies Act: Nedbank 135 Rivonia Campus 135 Rivonia Road Sandown Sandton 2196 | PO Box 1144 Johannesburg 2000 South Africa T +27 11 294 4444 | F +27 11 295 1111 | E [email protected] | W nedbank.co.za/cib Directors: AD Mminele (Chairperson) JP Quinn (Chief Executive) MS Bomela HR Brody (Lead Independent Director) BA Dames MH Davis (Chief Financial Officer) OD Fortuin NP Dongwana Dr MA Hermanus P Langeni RAG Leith L Makalima MC Nkuhlu (Chief Operating Officer) Dr TM Nombembe S Subramoney Company Secretary: J Katzin 01.06.2025 Nedbank Corporate and Investment Banking is a division of Nedbank Limited Reg No 1951/000009/06. Authorised financial services and registered credit provider (NCRCP16). LEGAL-1511177124-351


Page 2 Letters of guarantee up to an amount of R160 000 000.00 (One Hundred and Sixty Million Rand). 1.10: Indirect Facilities comprising letters of guarantees 3.1.2.1 a copy certified a true copy of each board resolution of each company, providing the financial assistance (Assisting Company) to or for the benefit of Nedbank or other parties (as the case may be) and the entering into of such agreements to which such Assisting Company is party; 3.1.2.2 a copy, certified a true copy of each special resolution passed by the shareholders of each Assisting Company in accordance with section 45 of the Companies Act, in terms whereof they approve the granting by each Assisting Company of the aforesaid financial assistance. 3.1.3 receipt by Nedbank of a written confirmation from the Facility Agent that the increase to the facility limits as contemplated in this Second Addendum complies with clause 1.1.82.8 of the Revolving Credit Facility Agreement. 3.1.4 receipt by Nedbank of a written confirmation from the Borrower confirming that prior written consent of the Majority Lenders has been obtained in terms of clause 1.1.83.7 of the Revolving Credit Facility Agreement. 3.2 The Borrower shall use its best endeavours to procure the fulfilment at its cost, of the conditions precedent in this clause 3 on or before 31 August 2025. 3.3 The conditions precedent in this clause 3 have been stipulated for the benefit of Nedbank and Nedbank shall be entitled to waive fulfilment of all or any part of such conditions by giving written notice to that effect to the Borrower, on such terms and conditions as Nedbank may impose at the time and the fulfilment thereof to Nedbank’s satisfaction. 4 With effect from the Effective Date, the Amended and Restated Facility Letter is hereby amended as follows: 4.1 by the deletion of clause 1.3 of the Amended and Restated Facility Letter in its entirety and the substitution of the following in its place: 1.3: Aggregate amount of Facilities R660 000 000.00 Million Rand). (Six Hundred and Sixty 4.2 by the deletion of clause 1.10 of the Amended and Restated Facility Letter in its entirety and the substitution of the following in its place: 5 If there is any conflict between the provisions of this Second Addendum and the provisions of the Amended and Restated Facility Letter, the provisions of this Second Addendum shall prevail. 6 Save as expressly contemplated herein, the Amended and Restated Facility Letter shall remain unamended and of full force and effect.


Page 3 Authorised Signatory Riaan Davel Chief Financial Officer Signatory Director Director Henry Gouws Henriette Hooijer If the terms of this Second Addendum are acceptable to you, kindly indicate your acceptance by initialling each page and signing the attached duplicate original of this Second Addendum where indicated and returning it to Nedbank. Should you require any further information or clarification, please contact Darryl Hardiman at [email protected] or 010 235 4660. M MURRAY DIVISIONAL CREDIT EXECUTIVE CIB V PILLAY SENIOR CREDIT MANAGER CIB D HARDIMAN PRINCIPAL: TRANSACTIONAL SERVICES SALES Weltevreden Park 30th July Accepted at .................................................... on this the .................... day of ................................................. 2025 For and on behalf of: DRDGOLD LIMITED (who hereby warrants his authority) For and on behalf of: DRDGOLD LIMITED (who hereby warrants his authority) Name: Name: Mpho Mashatola Capacity: Capacity: Weltevreden Park 30th July Accepted at .................................................... on this the .................... day of ................................................. 2025 For and on behalf of: ERGO MINING PROPRIETARY LIMITED (who hereby warrants his authority) For and on behalf of: ERGO MINING PROPRIETARY LIMITED (who hereby warrants his authority) Name: Name: Capacity: Capacity: /s/ Henry Nicolaas Gouws /s/ D Hardiman /s/ V Pillay /s/ Henriette Hooijer /s/ M Murray /s/ Riaan Davel /s/ Mpho Mashatola


Page 4 Weltevreden Park 30th July Accepted at .................................................... on this the .................... day of ................................................. 2025 For and on behalf of: FAR WEST GOLD RECOVERIES PROPRIETARY LIMITED (who hereby warrants his authority) For and on behalf of: FAR WEST GOLD RECOVERIES PROPRIETARY LIMITED (who hereby warrants his authority) Name: Henriette Hooijer Name: Kevin Kruger Capacity: Director Capacity: Director /s/ Henriette Hooijer /s/ Kevin Peter Kruger


Exhibit 4.11 30 September 2025 The Directors DRDGOLD Limited Constantia Office Park Cnr 14th Avenue and Hendrik Potgieter Road Cycad House, Building 17, Ground Floor Weltevreden Park 1709 Attention: Riaan Davel Dear Sirs THIRD ADDENDUM TO THE AMENDED AND RESTATED FACILITY LETTER 1 DRDGOLD Limited (Registration Number 1895/000926/06) (Borrower) and Nedbank Limited (acting through its Nedbank Corporate and Investment Banking Division) (Registration Number 1951/000009/06) (Nedbank) entered into a facility letter on or about 28 June 2024 in terms of which Nedbank made available a general banking facility to the Borrower in an aggregate amount of ZAR500,000,000 (five hundred million Rand) (the Facility Letter), as amended and restated on or about 8 August 2024, as further amended by First Addendum dated 4 March 2025 and a Second Addendum dated 21 July 2025 (Amended and Restated Facility Letter). The Parties now wish to amend the Amended and Restated Facility Letter as set out herein (Third Addendum). 2 Terms defined in the Amended and Restated Facility Letter have the same meaning in this Third Addendum, unless given a different meaning herein. 3 Conditions Precedent 3.1 The Borrower shall deliver the following documents and other evidence in form and substance satisfactory to Nedbank. Nedbank shall notify the Borrower promptly upon being so satisfied (the date of such notification being the Effective Date): 3.1.1 receipt by Nedbank of a copy of a signed resolution by the board of each Obligor (as applicable) approving the entry into and performance by it of this Third Addendum and any other Finance Documents to which it is party and giving specified officials the power to execute the aforesaid documents and all documents required to be delivered thereunder and to perform all acts required thereunder and in order to render the same unconditional. 3.1.2 In respect of section 45 of the Companies Act: Nedbank 135 Rivonia Campus 135 Rivonia Road Sandown Sandton 2196 | PO Box 1144 Johannesburg 2000 South Africa T +27 11 294 4444 | F +27 11 295 1111 | E [email protected] | W nedbank.co.za/cib Directors: AD Mminele (Chairperson) JP Quinn (Chief Executive) MS Bomela HR Brody (Lead Independent Director) BA Dames MH Davis (Chief Financial Officer) OD Fortuin NP Dongwana Dr MA Hermanus P Langeni RAG Leith L Makalima MC Nkuhlu (Chief Operating Officer) Dr TM Nombembe S Subramoney Company Secretary: J Katzin 01.06.2025 Nedbank Corporate and Investment Banking is a division of Nedbank Limited Reg No 1951/000009/06. Authorised financial services and registered credit provider (NCRCP16). LEGAL-1511177124-351


Page 2 R681 000 000.00 (Six Hundred and Eighty- One Million Rand). 1.3: Aggregate amount of Facilities 3.1.2.1 a copy certified a true copy of each board resolution of each company, providing the financial assistance (Assisting Company) to or for the benefit of Nedbank or other parties (as the case may be) and the entering into of such agreements to which such Assisting Company is party; 3.1.2.2 a copy, certified a true copy of each special resolution passed by the shareholders of each Assisting Company in accordance with section 45 of the Companies Act, in terms whereof they approve the granting by each Assisting Company of the aforesaid financial assistance. 3.1.3 receipt by Nedbank of a written confirmation from the Facility Agent acting on behalf of the Majority Lenders (as defined in the Revolving Credit Facility Agreement) that: 3.1.3.1 the increase to the facility limit to an amount of R681 000 000.00 as contemplated in this Third Addendum is approved in accordance with clause 1.1.82.8 of the Revolving Credit Facility Agreement, and 3.1.3.2 condonation (to the extent applicable) in respect of all increases to the facility limit, prior to the date hereof. 3.1.4 receipt by Nedbank of a written confirmation from the Facility Agent acting on behalf of the Majority Lenders (as defined in the Revolving Credit Facility Agreement) that: 3.1.4.1 each of the Guarantors are permitted to increase its obligations under this Third Addendum, to an amount of R681 000 000.00, in accordance with clause 1.1.83.7 of the Revolving Credit Facility Agreement, and 3.1.4.2 condonation (to the extent applicable) in respect of all increases to the guaranteed amount, prior to the date hereof. 3.2 The Borrower shall use its best endeavours to procure the fulfilment at its cost, of the conditions precedent in this clause 3 on or before 15 October 2025. 3.3 The conditions precedent in this clause 3 have been stipulated for the benefit of Nedbank and Nedbank shall be entitled to waive fulfilment of all or any part of such conditions by giving written notice to that effect to the Borrower, on such terms and conditions as Nedbank may impose at the time and the fulfilment thereof to Nedbank’s satisfaction. 4 With effect from the Effective Date, the Amended and Restated Facility Letter is hereby amended as follows: 4.1 by the deletion of clause 1.3 of the Amended and Restated Facility Letter in its entirety and the substitution of the following in its place: 4.2 by the deletion of clause 1.10 of the Amended and Restated Facility Letter in its entirety and the substitution of the following in its place:


Page 3 5 If there is any conflict between the provisions of this Third Addendum and the provisions of the Amended and Restated Facility Letter, the provisions of this Third Addendum shall prevail. 6 Save as expressly contemplated herein, the Amended and Restated Facility Letter shall remain unamended and of full force and effect. If the terms of this Third Addendum are acceptable to you, kindly indicate your acceptance by initialling each page and signing the attached duplicate original of this Third Addendum where indicated and returning it to Nedbank. Should you require any further information or clarification, please contact Darryl Hardiman at [email protected] or 010 235 4660. M MURRAY DIVISIONAL CREDIT EXECUTIVE CIB V PILLAY SENIOR CREDIT MANAGER CIB D HARDIMAN PRINCIPAL: TRANSACTIONAL SERVICES SALES Weltevreden Park 3rd October Accepted at .................................................... on this the .................... day of ................................................. 2025 For and on behalf of: DRDGOLD LIMITED (who hereby warrants his authority) For and on behalf of: DRDGOLD LIMITED (who hereby warrants his authority) Name: Mpho Mashatola Name: Riaan Davel Capacity: Authorised signatory Capacity: Chief Financial Officer Letters of guarantee up to an amount of R181 000 000.00 (One Hundred and Eighty- One Million Rand). 1.10: Indirect Facilities comprising letters of guarantees /s/ V Pillay /s/ M Murray /s/ D Hardiman /s/ Riaan Davel /s/ Mpho Mashatola


Page 4 Weltevreden Park 3rd October Accepted at .................................................... on this the .................... day of ................................................. 2025 For and on behalf of: ERGO MINING PROPRIETARY LIMITED (who hereby warrants his authority) Name: Henry Gouws For and on behalf of: ERGO MINING PROPRIETARY LIMITED (who hereby warrants his authority) Name: Henriette Hooijer Capacity: Director Capacity: Director Weltevreden Park city: ir t r Accepted at .................................................... on this the ..........3rd.......... day of…….October…..2025 For and on behalf of: FAR WEST GOLD RECOVERIES PROPRIETARY LIMITED (who hereby warrants his authority) For and on behalf of: FAR WEST GOLD RECOVERIES PROPRIETARY LIMITED (who hereby warrants his authority) Name: Kevin Kruger Name: Henriette Hooijer Capacity: Director Capacity: Director /s/ Henriette Hooijer /s/ Henry Nicolaas Gouws /s/ Henriette Hooijer /s/ Kevin Peter Kruger


Exhibit 4.12 1 DRDGOLD LIMITED SINGLE INCENTIVE POLICY adopted by DRDGOLD LIMITED (Registration No. 1895/000926/06) On 26th October 2023, the Remuneration Committee of DRDGOLD Limited approved the adoption of this Single Incentive Policy.


2 TABLE OF CONTENTS 1. DEFINITIONS AND INTERPRETATION ................................................................................................ 3 2. SCOPE AND APPLICATION .................................................................................................................. 7 3. COMPONENTS OF THE SINGLE INCENTIVE ..................................................................................... 7 4. DETERMINING THE SINGLE INCENTIVE ............................................................................................ 8 5. SETTLEMENT OF THE SINGLE INCENTIVE ..................................................................................... 10 6. DISCRETION OF THE REMCO ........................................................................................................... 11 7. SAFEGUARDS ..................................................................................................................................... 11 8. PRO-RATING OF CASH PAYMENT FOR TERMINATION ................................................................. 12 9. OTHER DEFERRED SHARE AWARDS .............................................................................................. 13 10. IMPLEMENTATION AND ADMINISTRATION ................................................................................. 13 ANNEXURE A – WEIGHTINGS FOR THE GROUP SCORECARD FOR YEAR ENDING [2024] .............. 14 ANNEXURE B – GROUP SCORECARD FOR THE YEAR ENDING [2024] ............................................... 15


3 1. DEFINITIONS AND INTERPRETATION Definitions In this Policy, unless the context indicates otherwise, the following words and expressions will have the meanings set out below: Award Date means the date on which the Remco resolves to make a Single Incentive award to an Eligible Employee; Board means the board of directors of the Company or any committee thereof to whom the powers of the board of directors of the Company in respect of the Single Incentive are delegated; Cash Payment means the payment referred to in clause 3.2; Companies Act means the Companies Act 71 of 2008, as amended or replaced from time to time; Company means DRDGOLD Limited, a company duly incorporated and registered in accordance with the laws of the Republic of South Africa under registration number 1895/000926/06, with a primary listing on the JSE and a secondary listing on the New York Stock Exchange; Cost to Company means the total annual guaranteed cost to company package for the period 1 July to 30 June of each Financial Year of the Eligible Employee which includes the cost to company of the Eligible Employee’s salary and benefits, but excludes all variable pay, and CTC shall be construed accordingly; Cash Portion means the percentage of the Single Incentive settled in Cash; Deferred Portion means the portion of the Single Incentive settled as a Deferred Share Award; Deferred Share Award means the award of deferred shares in terms of the DSP, referred to in clause 3.2; DSP means the DRDGOLD Limited Deferred Share Plan 2024; Eligible Employee means any Employee of the Company at category 19 to 26 (as detailed in clause 4.2.1.1 and Annexure A) who is deemed eligible for participation in the Single Incentive Plan by the Remco; Employee means any employee holding full-time and fixed term salaried employment or office:


4 (i) in category 19 and above (including any executive director, but excluding a non- executive director) within any member of the Group; and (ii) at the discretion of the Remco, any employee in category 18 and below based at the corporate office, provided that this category of employee will only be entitled to a Cash Payment under this Policy and not a Deferred Share Award under the DSP. For the avoidance of doubt, any person temporarily occupying a position (acting or relieving) with any member of the Group is not eligible to participate in the Single Incentive Plan on the basis of the temporary position or category in which s/he is acting or relieving; Employer Company means the specific entity (which includes both local and foreign entities) within the Group that is the employer of the relevant Eligible Employee; Fault Termination means the termination of employment of an Eligible Employee by reason of: 1.1.14.1 misconduct; 1.1.14.2 poor performance; or 1.1.14.3 resignation; Financial Year means the Company’s financial year, which runs from 1 July to 30 June of each year, as at the adoption of the Policy; Free Cash Flow means cash flow from operating activities, plus interest expense, minus tax shield on interest expense, minus growth capital expenditure; Free Cash Flow Portion has the meaning given to it in clause 3.3; Group means the Company and any other company, body corporate, or other undertaking which is or would be deemed to be a subsidiary of the Company in terms of the Companies Act, and the expression member of the Group shall be construed accordingly; Ill-health means a physical, mental, or psychological condition, including a disability or a condition caused by an injury, which renders the Eligible Employee incapable of performing his/her duties in terms of his/her contract of employment; JSE means the JSE Limited, a public company incorporated in accordance with the laws of the Republic of South Africa under registration number 2005/022939/06, which is licensed to operate as an exchange in terms of the Financial Markets Act 19 of 2012, as amended or replaced from time to time; LRA means the Labour Relations Act 66 of 1995, as amended or replaced from time to time;


5 Medical Practitioner means a person who is certified to diagnose and treat patients and who is registered with a professional council established by an act of the South African parliament or its equivalent in countries outside of the Republic of South Africa; No Fault Termination means the termination of employment of an Eligible Employee by reason of: 1.1.23.1 death; 1.1.23.2 injury, disability, or Ill-health, in each case diagnosed by a Medical Practitioner nominated by the relevant Employer Company; 1.1.23.3 Retrenchment; 1.1.23.4 retirement on or after the Retirement Date; 1.1.23.5 the company in which the Eligible Employee is employed ceasing to be a member of the Group; or 1.1.23.6 the undertaking in which the Eligible Employee is employed being transferred to a transferee which is not a member of the Group; Participant means an Eligible Employee that receives a Single Incentive award in terms of clauses 3 and 4 and accepts it, thereby becoming subject to the terms and conditions of the Policy; Performance Multiplier, detailed further in clause 4.2.2, is the weighted average of Company, business unit, and personal performance, where each performance multiplier ranges from 0% to 200% and is based on the Scorecard(s) applicable to each Eligible Employee; Policy means this policy document related to the Cash Payment portion of the Single Incentive, as amended or replaced by the Remco from time to time; Remco means the Remuneration Committee of the Board or any person(s) to whom the powers of the Remco in respect of the Single Incentive Plan have been delegated (but then only in accordance with the terms of such delegation), which persons do not hold any executive office within the Group; Retention Award means a discretionary award of Deferred Shares referred to in clause 9.1.2; Retirement Date means the earliest date on which, or age at which, an Eligible Employee can be required to retire by an Employer Company; Retrenchment means a dismissal based on the Employer Company’s operational requirements, as contemplated in the LRA;


6 Scorecard(s) means a number of key performance measures, which will be reviewed and defined bi-annually with appropriate performance measures, weightings, threshold, target, and stretch objectives per measure; Scorecard On-target Percentage means the Scorecard On-target Percentage tabulated in clause 4.2.1; Scorecard Portion has the meaning given to it in clause 3.4.1; Single Incentive means the annual Cash Payment and Deferred Share Award determined and governed by this Policy and the rules of the DSP; and Single Incentive Plan means the Company’s combined short-term and long-term incentive as set out in this Policy and read with the rules of the DSP; Interpretation In this Policy: clause headings are used for convenience only and shall be ignored in its interpretation; unless the context clearly indicates a contrary intention, an expression which denotes: 1.2.2.1 any gender includes the other genders; 1.2.2.2 a natural person includes a juristic person (whether corporate or unincorporate) and vice versa; and 1.2.2.3 the singular includes the plural and vice versa. all references to a statute shall be to such statute as at the date of adoption of this Policy by the Company and as amended, replaced, or superseded from time to time thereafter; the use of the word including, includes, or include followed by a specific example shall not be construed as limiting the meaning of the general wording preceding it and the eiusdem generis rule shall not be applied in the interpretation of such general wording or such specific example/s; and if any provision in a definition is a substantive provision conferring any right or imposing any obligation on anyone then, notwithstanding that it is only in a definition, effect shall be given to it as if it were a substantive provision in the body of this Policy.


7 2. SCOPE AND APPLICATION The Single Incentive Plan forms the basis of the Group’s variable pay offering for Eligible Employees and comprises a Cash Payment (short-term incentive component) and a Deferred Share Award (long-term incentive component). The Single Incentive Plan is based on performance against the Scorecard(s) applicable to the Eligible Employee for the relevant Financial Year. This Policy sets out the overall design, eligibility criteria, participation levels, and performance conditions which apply to the Single Incentive Plan. The eligibility criteria are aligned with the strategic objectives of the Group and the Single Incentive Plan aims to ensure that the Group attracts, retains, and motivates qualified and capable Eligible Employees to achieve its objectives. This Policy governs: the application of the Single Incentive Plan to Eligible Employees; the calculation, award, and settlement of the Single Incentive, comprising the Cash Payment and the Deferred Share Award; and the administration of the Single Incentive Plan. Participation in the Single Incentive Plan is limited to Eligible Employees. Unless otherwise determined by the Remco, an Eligible Employee must be in active service with the Group (and not serving his/her notice period) on the date on which the Single Incentive is awarded, failing which s/he will not be eligible to receive the Single Incentive. 3. COMPONENTS OF THE SINGLE INCENTIVE Overview of Components The annual Single Incentive comprises a Free Cash Flow Portion and a Scorecard Portion. Subject to clause 5.2.3, the Single Incentive is then apportioned with 67% being the Cash Payment and 33% the Deferred Share Award. This is represented by the following formula: Single Incentive = Free Cash Flow Portion + Scorecard Portion whereby: Cash Payment = Single Incentive x 67% Cash Portion; and


8 Deferred Share Award = Single Incentive x 33% Deferred Portion + any approved Retention Award. Free Cash Flow Portion The Free Cash Flow Portion, is determined as follows: 3.3.1.1 Free Cash Flow for the relevant Financial Year x 10% x personal share. The personal share will be determined jointly by the Chief Executive Officer and the Chief Financial Officer of the Company and approved by Remco considering factors such as occupation, production, service, qualifications personal performance but capped to 67% for Category D, EL, EU, and 50% for Category FU -Executive Directors and Prescribed Officers of CTC. Scorecard Portion the Scorecard Portion, is determined as follows: 3.4.1.1 CTC x Scorecard On-target Percentage x Performance Multiplier. 4. DETERMINING THE SINGLE INCENTIVE The Single Incentive value is determined as the sum of the Free Cash Flow Portion and the Scorecard Portion. The detail related to the Free Cash Flow Portion is set out in clause 3.3.1.1. The formula for the Scorecard Portion is described in clause 3.4.1.1 and the components are discussed below. Scorecard Portion 4.2.1.1 The Scorecard On-target Percentages are as follows: Strategic Level DRDGOLD Category Paterson Grade Scorecard On-Target Percentage Top Management, Strategic Intent 26 F Upper 90% 25 F Lower 75% General Management, Strategic Execution 24, 23 E Upper 60% Senior Management, Strategic Execution 22, 21 E Lower 45% Middle Management, Qualified Professionals, Experienced Professionals 20, 19 D 45% Performance Multiplier 4.2.2.1 The Performance Multiplier, which is a factor ranging from 0% to 200%, will be determined based on several key performance measures, which will be reviewed and defined annually


9 with appropriate weightings. The Performance Multiplier is determined using the Scorecard(s) applicable to the Eligible Employee for the relevant Financial Year. 4.2.2.2 The formula to determine the Performance Multiplier is determined as follows: (Company weighting x Company performance) + (business unit weighting x business unit performance) + (personal weighting x personal performance) The weightings for the Scorecard(s) are set out in Annexure A. 4.2.2.3 Each measure in the Scorecard(s) is weighted and has a threshold, target, and stretch target set annually by the Board or any committee of the Board or person to which authority has been delegated. 4.2.2.4 The Performance Multiplier for Company and business unit performance measures is determined as follows: 4.2.2.4.1 The outcome is 0% if the actual performance for the year is equal to the threshold for that measure. 4.2.2.4.2 The outcome is between 0% and 100% if the actual performance for the year is between the threshold and target for the measure, and is determined by linear interpolation according to the following formula: 0% + 100% x (actual performance – threshold) / (target – threshold) 4.2.2.5 The outcome is 100% if the actual performance for the year is equal to the target for that measure. 4.2.2.6 The outcome is between 100% and 200% if the actual performance for the year is between the target and stretch for the measure, and is determined by linear interpolation according to the following formula: 100% + 100% x (actual performance – target) / (stretch – target) 4.2.2.7 The outcome is 200% if the actual performance for the year is greater than or equal to the stretch for that measure. The business unit performance in the formula in clause 4.2.2.2 is determined in accordance with the methodology above and the weightings are specified in Annexure A. The personal performance in the formula in clause 4.2.2.2 is determined in accordance with the table below:


10 Description of performance Performance level Individual Performance Multiplier Exceptional 5 200% Stretch Very good 4 150% Meets expectations 3 100% Target Meets some performance expectations 2 0% Threshold Underachiever / underperformer 1 0% The Performance Multiplier for personal performance measures is determined as follows: 4.2.5.1 The outcome is 0% if the actual performance for the year is equal to a performance level 1 or less than performance level 3. (Threshold) 4.2.5.2 The outcome is 100% if the actual performance for the year is equal to a performance level 3 (Target). 4.2.5.3 The outcome is between 100% and 200% if the performance level is greater than performance level 3 (Target)and up to performance level 5 (Stretch Target) for the year. and is determined by linear interpolation. : The performance modifier for a Scorecard is the weighted outcome for all measures on the Scorecard, which is equal to the sum for all the measures of the weight for each measure multiplied by the outcome for the measure. The overall performance modifier is determined as the weighted average of the performance modifiers of the Scorecards applicable to each Participant, using the weightings specified in clause 4.2.1. 5. SETTLEMENT OF THE SINGLE INCENTIVE The determination of the pro-forma value for the Single Incentive, will be in accordance with clause 3.2. The Single Incentive will be settled as follows: Subject to clause 5.2.3, the Cash Payment will be settled annually in August of each year, in accordance with the provisions of this Policy; and The balance, in Deferred Share Awards, in accordance with the rules of the DSP. Provided where the aggregate Cash Payment for all Eligible Employees exceeds 15% of Free Cash Flow for the relevant Financial Year, then the Cash Flow Portion above this 15% level will also be awarded as Deferred Shares. Provision may be made for additional Retention Awards of Deferred Shares in terms of the rules of the DSP for purposes of retaining high potential Eligible Employees. Retention awards may be made


11 under the Policy in exceptional circumstances using the DRDGOLD Exceptional Services Policy in place at the Company from time to time. 6. DISCRETION OF THE REMCO There is no automatic entitlement to the Single Incentive, Cash Payment, and/or Deferred Share Award. The Remco will have a final and absolute discretion to determine whether an employee is eligible to receive a Single Incentive and, if so, the final amount thereof (i.e., both the Cash Payment and the Deferred Share Award). This discretion will be exercised reasonably and with due regard to, inter alia, the following: award of the Single Incentive placing undue liquidity pressure on the Company and/or relevant Employer Company; cost of the Single Incentive representing an undue portion of the Company’s and/or relevant Employer Company’s profit before tax for the Financial Year; key strategic objectives not being met by the Company and/or Eligible Employee; and/or avoiding unintended outcomes or excessive windfalls as a result of the Single Incentive calculation. The receipt of a Single Incentive in any Financial Year by a Participant does not create any rights and/or expectations that the same Participant will be entitled to any further Single Incentive in subsequent years. An employee’s eligibility to receive Single Incentive will be determined annually by the Remco. 7. SAFEGUARDS The award and quantum of the Single Incentive in a particular Financial Year, is subject to the discretion of the Remco which will be applied to the overall quantum of the Single Incentive, unless there are exceptional circumstances for not doing so, where: the total number of Deferred Share Awards is more than 1% (one percent) of the number of shares that the Company has in issue; and the Single Incentive may be reduced up to 25% of the Free Cash Flow pool per fatality, depending on the degree of culpability of the Company, as assessed by Remco, and if the fatality is found to be due to a breakdown in or disregard for a safety culture, the Single Incentive can be reduced by up to 100% of the Free Cash Flow pool at Remco discretion.


12 8. PRO-RATING OF CASH PAYMENT FOR TERMINATION An Eligible Employee must be rendering services to the Group in the Financial Year to which the Single Incentive relates in order to qualify for a Cash Payment. Newly engaged Eligible Employees may be granted the Cash Payment portion of the Single Incentive on a pro-rated basis at the discretion of the Remco. If an Eligible Employee ceases to be employed by reason of a Fault Termination in the Financial Year to which the Single Incentive relates, s/he will not be entitled to receive any Single Incentive, unless the Remco determines otherwise in its sole and absolute discretion. In the event of pending disciplinary and/or poor work performance proceedings against any Participant, or the contemplation of such proceedings, then the award or settlement, as applicable, of the Single Incentive shall be suspended until the conclusion of such proceedings (notwithstanding the conditions of suspension with full pay). An outcome short of dismissal may, at the Remco’s discretion, result in the grant or settlement of the Single Incentive, while a Fault Termination will have the same consequence as that set out in clause 8.3. If a Participant ceases to be employed by reason of a No-Fault Termination in the Financial Year to which the Single Incentive relates, s/he will qualify to receive a pro-rated portion of the Cash Payment regardless of the period of time s/he was employed by the Group since the previous payment date. Unless the Remco determines otherwise in its sole and absolute discretion, no Deferred Share Award will be made to an Eligible Employee whose employment has been terminated on a No-Fault Termination basis on the Award Date (which shall include where the Eligible Employee is serving his/her notice period). Any unvested Deferred Share Awards will be governed by the rules of the DSP. The pro-rated Cash Payment portion of the Single Incentive will be calculated as follows: A = B x (C/12) x D where: A is the pro-rated Cash Payment portion of the annual Single Incentive; B is the Single Incentive to which the Participant would have been entitled if s/he was employed or at work (as applicable) for the full Financial Year and no pro-rating was effected; C is the number of months served during the Financial Year to which the Single Incentive relates; and


13 D is the Cash Payment portion of the Single Incentive applicable for the Financial Year. 9. OTHER DEFERRED SHARE AWARDS For the avoidance of doubt, Deferred Share Awards may be made outside of the Single Incentive Plan from time to time. These include: sign-on awards for new employees, usually to compensate them for awards from the previous employer which will be forfeited on their resignation; and specific Retention Awards or counter-offer awards. Such awards must be motivated for by the Chief Executive Officer of the Company and approved by the Remco. 10. IMPLEMENTATION AND ADMINISTRATION This Policy will come into force and effect on the date of approval of the Single Incentive Plan by the Board. Where this Policy refers to the discretion of the Remco, such discretion will be sole, absolute, and unrestricted unless the contrary is expressed, provided that if the Remco delegates the authority to exercise discretion, the discretion should be exercised in terms of this Policy. Subject to the rules of the DSP, the Remco shall be entitled to make and establish this Policy, and amend it from time to time, as it deems expedient or necessary for the proper implementation of the Single Incentive Plan. Any amendments to this Policy must, inter alia: be approved by the Board; be in line with the Company’s remuneration policy; take due account of prevailing market trends and what is regarded as “remuneration best practice” at the time of such amendments; and not be to the prejudice of an Eligible Employee’s existing rights under this Policy.


Exhibit 4.15 14 ANNEXURE A – WEIGHTINGS FOR THE GROUP SCORECARD FOR THE FINANCIAL YEAR ENDING [2025] Weightings below will be considered and revised at the discretion of the Remco on an annual basis. Business unit performance will be considered from the second year of implementation onwards (2025 Financial Year) and will reflect as zero in the initial year of implementation per the table below: Strategic Level DRDGOLD Category Scorecard On-Target Percentage Weighting Company Business Unit* Personal Top Management, Strategic Intent 26 90% 90% 0% 10% 25 75% 90% 0% 10% General Management, Strategic Execution 24, 23 60% 90% 0% 10% Senior Management, Strategic Execution 22, 21 45% 90% 0% 10% Middle Management, Qualified Professionals, Experienced Professionals 20, 19 45% 90% 0% 10% *Business unit Scorecard


15 ANNEXURE B – GROUP SCORECARD FOR THE YEAR ENDING JUNE 2025 Group Scorecard Area Measure Weight Threshold Target Stretch Measures 0% 100% 200% Shareholders (20%) Relative Total Shareholder Return 10% Median Halfway between median / UQ Upper quartile … of comparators Return on Equity 10% Cost to equity* Cost to equity plus 3% Cost to equity plus 6% Cost to equity Financial (30%) Cash operating cost (R/ton) 10% 115% x Budget 110% x Budget Budget Based on the achievement vs budget, noting that budget is already a stretch target since it is based on “nameplate” capacity without de-risking for probable downtime. Cash operating cost (R/kg) 10% All-in Sustaining Cost (R/kg) 10% Operations (30%) Production (kg) 15%% 85% x Budget 90% x Budget Budget Based on the achievement vs budget, noting that budget is already a stretch target since it is based on “nameplate” capacity without de-risking for probable downtime. Throughput (tons) 15% Current scorecard modifier evaluation (ESG# factors) (20%) Environmental 4% Amber Score (2) Green Score (3) Blue Score (5) Based on current scorecard modifier evaluation, a portfolio of evidence compiled. Health & Safety 4% Local Economic Development 4% Human Resources Development 4% Transformation 4% # Environmental, social and governance Performance will be assessed based on the following: - For "threshold performance", 0% will be scored for that performance area - For "on-target performance", 100% will be scored for that performance area - For "stretch", 200% will be scored for that performance area - Linear vesting will be applied between threshold, on-target and stretch. Notes 1. In addition to the financial conditions in the scorecard free cash flow is reflected in the separate free cash flow portion of the incentive and in the determination of the cash vs deferred portion of the Single Incentive


16 2. In addition to the modifier scorecard evaluation, failures in governance and environmental compliance are considered in the malus and clawback provisions of the Single Incentive 3. In addition to the safety condition measured in terms of the lost time injury frequency rate (LTIFR), fatalities are considered in the malus and clawback provisions for the Single Incentive


Exhibit 4.13 1 DRDGOLD LIMITED (Registration No. 1895/000926/06) DEFERRED SHARE PLAN 2024


2 PART 1 – INTRODUCTION 1. DEFINITIONS AND INTERPRETATION In the DSP, unless the context indicates otherwise, the following words and expressions will have the meanings assigned thereto: Acceptance Date means the date by which an Eligible Employee is obliged to deliver an Acceptance Notice to the Employer Company to accept an Award, which date is set out in the Award Letter; Acceptance Notice means the notice delivered by an Employee to the Employer Company indicating his/her acceptance of an Award and its terms and conditions (in terms of clause 11.5); Administrator means a service provider appointed by the Company or relevant Employer Company to act on behalf of the Company or that Employer Company in performing its obligations in terms of the DSP; Applicable Laws in relation to any person or entity, all and any statutes, subordinate legislation and common law; regulations; ordinances and by-laws; accounting standards; directives, codes of practice, circulars, guidance notices, judgments and decisions of any competent authority, compliance with which is mandatory for that person or entity; Award means the award to an Eligible Employee of Deferred Shares in terms of clause 11 and the word Awarded will be construed accordingly, provided that an Award is subject to the Group’s policy on the mandatory recovery of erroneously awarded incentive-based compensation, and any rules, laws or regulations applicable to the Group in relation to the clawback or recovery of compensation; Award Date means the date on which Remco resolves to make an Award to an Eligible Employee; Award Letter means the letter delivered by an Employer Company to an Eligible Employee in terms of clause 11.2, notifying such Eligible Employee of an Award and setting out the terms of the Award; Award Price means a value that is determined by using the volume weighted average share price of a Share on the JSE over the 7 (seven) Business Days immediately preceding the Award Date, which is set out in the Award Letter; Award Value means the Rand value of that portion of the Participant’s incentive, granted in terms of the Single Incentive Plan, that will take the form of Deferred Shares in accordance with the provisions of the DSP and the Policy;


3 Auditors means the registered auditors of the Company, from time to time; Board means the board of directors of the Company or any committee thereof to whom the powers of the board of directors of the Company in respect of the DSP are delegated; Broker means the financial intermediary appointed by the Company or the relevant Employer Company to perform the services specified in the DSP on behalf of the Participants; Brokerage Account means a securities account held for the benefit of a Participant that may be used to trade in securities; Business Day means any day on which the JSE is open for the transaction of business; Change of Control means all circumstances where a party (or parties acting in concert), directly or indirectly, obtains - 1.1.15.1 beneficial ownership of the specified percentage or more of the Company's issued Shares; or 1.1.15.2 control of the specified percentage or more of the voting rights at meetings of the Company; or 1.1.15.3 the right to control the management of the Company or the composition of the Board; or 1.1.15.4 the right to appoint or remove directors holding a majority of voting rights at Board meetings; or 1.1.15.5 the approval by the Company's shareholders of, or the consummation of, a merger or consolidation of the Company with any other business or entity, or upon a sale of the whole or a major part of the Company's assets or undertaking. For the purposes of this clause 1.1.15 the expression specified percentage will have the meaning assigned to it from time to time in the Takeover Regulations read with the Companies Act, presently being 35% (thirty-five percent); Change of Control Date means the date on which the Change of Control of the Company becomes effective; Clawback means the recoupment of the Clawback Amount from a Participant upon the discovery of a Trigger Event in accordance with clause 17 and all existing and future Company compensation clawback policies in terms of the U.S. listing requirements, in accordance with the Final Rule pertaining to “Listing Standards for Recovery of Erroneously Awarded Compensation” outlined in Federal Register, SEC Release Nos. 33-11126; 34-96159) (the “Final Clawback Rules”),


4 Clawback Amount means the Award Value net of any Tax deducted; Companies Act means the South African Companies Act 71 of 2008, as amended or replaced from time to time; Company means DRDGOLD Limited, a company duly incorporated and registered in accordance with the laws of the Republic of South Africa under registration number 1895/000926/06, with a primary listing on the JSE and a secondary listing on the New York Stock Exchange; Date of Termination of Employment means the date on which a Participant is no longer employed by, or ceases to hold salaried office in, any Employer Company; provided that, where a Participant’s employment is terminated without notice or on terms in lieu of notice, the Date of Termination of Employment will be deemed to be the date on which the termination takes effect, and where such employment is terminated with notice, the Date of Termination of Employment will be deemed to be the date on which that notice expires; Deferred Shares means an Award of Shares registered in the name of the Participant, the Vesting of which is subject to the fulfilment of the Employment Condition as specified in the Award Letter; Dividends means all distributions declared and paid, as defined in the Companies Act; DSP means the DRDGOLD Limited Deferred Share Plan 2024, established in terms of these rules; Eligible Employee means an Employee who is deemed to be eligible for participation in the DSP by the Remco; [Sch 14.1(a)] Employee means any person holding full-time salaried employment or office (including any executive director but excluding a non-executive director) with any member of the Group; [Sch 14.1(a)] Employer Company means the specific entity (which includes both local and foreign entities) within the Group that is the employer of the relevant Eligible Employee; Employment Condition means the condition of continued employment with the Group for the duration of the Employment Period, as specified in the Award Letter; Employment Period means the period commencing on the Award Date and ending on the date specified in the Award Letter (both dates inclusive) during which the Participant is required to fulfil the Employment Condition;


5 Escrow Agent means the intermediary appointed by the Company to hold the unvested Deferred Shares on behalf of Participants; Fault Termination means the termination of employment of a Participant by the Group by reason of- 1.1.31.1 misconduct; 1.1.31.2 poor performance; 1.1.31.3 retirement before the Retirement Date; or 1.1.31.4 resignation by the Participant; Financial Markets Act means the Financial Markets Act 19 of 2012, as amended or replaced from time to time; Financial Year means the Company’s financial year, which runs from 1 July to 30 June of each year, as at the adoption of the DSP; Group means the Company and any other company, body corporate or other undertaking which is or would be deemed to be a subsidiary of the Company in terms of the Companies Act, and the expression member of the Group will be construed accordingly; Ill-health means a physical, mental or psychological condition, including a disability or a condition caused by an injury, diagnosed by a Company approved Medical Practitioner, which renders the Employee incapable of performing his/her duties in terms of his/her contract of employment; Income Tax Act means the South African Income Tax Act 58 of 1962, as amended or replaced from time to time, or any similar act promulgated in countries outside of the Republic of South Africa; JSE means the JSE Limited, a public company incorporated in accordance with the laws of the Republic of South Africa under registration number 2005/022939/06, which is licensed to operate as an exchange in terms of the Financial Markets Act; Listings Requirements means the JSE Limited Listings Requirements; LRA means the Labour Relations Act 66 of 1995, as amended or replaced from time to time; Malus means the reduction (in part or full) of unvested Awards due to the occurrence of a Trigger Event before the applicable Vesting Date. Whenever a reduction is made, the relevant Award or portion thereof shall be treated as having lapsed;


6 Market Value means the 7 (seven) day volume weighted average price of a Share on the Business Day immediately preceding the date on which a determination of the Market Value of a Share is to be made for purposes of these Rules; Medical Practitioner means a person who is certified to diagnose and treat patients and who is registered with a professional council established by an act of the South African parliament or its equivalent in countries outside of the Republic of South Africa; No Fault Termination means the termination of employment of a Participant by the Group by reason of - 1.1.43.1 death; 1.1.43.2 injury, disability, or Ill-health, in each case diagnosed by a Medical Practitioner nominated by the relevant Employer Company; 1.1.43.3 Retrenchment; 1.1.43.4 retirement on or after the Retirement Date; 1.1.43.5 the company in which the Eligible Employee is employed ceasing to be a member of the Group; or 1.1.43.6 the undertaking in which the Eligible Employee he is employed being transferred to a transferee which is not a member of the Group; Notice means the notice contemplated in clause 15; Participant means an Eligible Employee that receives an Award in terms of clause 11 and accepts it, thereby becoming subject to the terms and conditions of the DSP; Personal Information means personal information as defined in section 1 of the Protection of Personal Information Act 4 of 2013, as amended or replaced from time to time, or an equivalent definition in a similar act promulgated in a different country or jurisdiction; Policy means the DRDGold Limited Single Incentive Plan Policy, as amended or replaced by the Remco from time to time; Recharge Policy means a policy or agreement in force from time to time between the Company and an Employer Company regulating the manner in which Settlement will be funded; Remco means the Remuneration Committee of the Board or any person(s) to whom the powers of the Remco in respect of the DSP have been delegated (but then only in


7 accordance with the terms of such delegation), which persons do not hold any executive office within the Group; [Sch 14.4][Sch 14.5] Retirement means in relation to a Participant, normal retirement age as determined by any Employer Company, or with the approval of the directors of the Employer Company, prior to the normal retirement age; Retirement Date means the earliest date on which, or age at which, an Eligible Employee can be required to retire by any Employer Company; Retrenchment means a dismissal based on the Employer Company’s operational requirements, as contemplated in the LRA; Revenue Authority means the institution in a country that administers the relevant Tax legislation and/or to whom Tax should be paid by law; Rights Issue means the offer of any securities of the Company to all ordinary shareholders of the Company pro rata to their holdings at the applicable record date; Rules means these Rules, as amended from time to time; Secretary means the company secretary for the time being of the Company; Securities Transfer Tax means the tax levied on the transfer of a security; Settle means delivery to the Escrow Agent (for beneficial ownership by the Participant) of the number of Deferred Shares to which the Participant is entitled in terms of Clause 12 in accordance with one of the methods set out in Clause 13, and the words Settlement and Settled will be construed accordingly. It is recorded that any Shares which have been Settled to a Participant in terms of this DSP shall rank pari passu with Shares in all respects; [Sch 14.1(e)] Settlement Date means the date on which a Participant is entitled to Settlement in accordance with clause 15, provided that if the date falls on a date which, or during a period which: 1.1.59.1 by virtue of any Applicable Laws or any policy of the Group (including any corporate governance policy) it is not permissible to Settle Shares; or 1.1.59.2 by virtue of any Applicable Laws or any policy of the Group (including any corporate governance policy) it is not permissible for the Escrow Agent to receive or otherwise deal/trade in Shares, the Settlement Date will be as soon as reasonably practicable after the date on which it becomes permissible to Settle the Award of Shares and/or for the Escrow Agent to receive or deal/trade in Shares (as the case may be);


8 Shares means ordinary shares in the capital of the Company (or such other class of shares as may represent the same as a result of any reorganisation, reconstruction or other variation of the share capital of the Company to which the provisions of the DSP may apply from time to time); Single Incentive Plan means the Company’s combined short-term and long-term incentive as set out in the Policy read with the DSP; Tax means any present or future tax or other charge of any kind or nature whatsoever imposed, levied, collected, withheld or assessed by any competent authority, and includes all income tax (whether based on or measured by income/revenue or profit or gain of any nature or kind or otherwise and whether levied under the Income Tax Act or otherwise), capital gains tax, value-added tax and any charge in the nature of taxation, and any interest, penalty, fine or other payment on, or in respect thereof but specifically excluding issue duty, stamp duty, marketable securities tax and uncertificated securities tax; Trigger Event means an event, as set out in the Award Letter, read with the provisions of the DSP, that will give the Board the discretion to reduce or forfeit an Award (in whole or in part) (clause16) or apply Clawback (clause 17), as appropriate; Vest means the event which confers on the Participant the unconditional entitlement to the Deferred Shares, and Vested and Vesting will have equivalent meanings; Vesting Date means, in respect of an Award, the date (or dates) determined by the Remco in terms of clause 10.1.5 and notified to a Participant in the Award Letter in terms of clause 11.2.5; and Vesting Period means the period which commences on the Award Date and terminates on the Vesting Date. General Interpretation For purposes of the DSP: 1.2.1.1 clause headings are used for convenience only and shall be ignored in its interpretation; 1.2.1.2 unless the context clearly indicates a contrary intention, an expression which denotes: 1.2.1.2.1 any gender includes the other genders; 1.2.1.2.2 a natural person includes an artificial person (whether corporate or unincorporate) and vice versa; and 1.2.1.2.3 the singular includes the plural and vice versa;


9 The DSP will be given effect to in accordance with: 1.2.2.1 the Companies Act; 1.2.2.2 the Listings Requirements, including paragraphs 3.63 to 3.74 and 3.92 to the extent applicable; and [Sch 14.9(d)] unless the context clearly indicates a contrary intention, words and expressions defined in the Companies Act shall bear the meanings therein assigned to them; all references to a statute and the Listings Requirements shall be to such statute and the Listings Requirements (as the case may be) as at the date of adoption of the DSP by the Company and as amended, replaced or superseded from time to time thereafter. References to Sch in the Rules are to Schedule 14 of the Listings Requirements; the use of the word including, or includes, or include, followed by a specific example will not be construed as limiting the meaning of the general wording preceding it and the eiusdem generis rule will not be applied in the interpretation of such general wording or such specific example/s; the word "reacquired" when used in relation to an Award (or a portion of an Award) shall mean the acquisition and/or cancellation of such Award (or a portion of an Award) from a Participant by or on behalf of the Company for, where applicable, a total consideration at no par value where such Award (or a portion of an Award) has been forfeited (in terms of clause 16) or lapsed (in accordance with clause 18) prior to Vesting; [Sch 14.3(f)] a Participant who ceases to be employed by an Employer Company on the basis that s/he is: 1.2.7.1 immediately thereafter employed by another Employer Company; or 1.2.7.2 thereafter re-employed by such Employer Company pursuant to it being determined that his/her employment was terminated on a basis which was not in accordance with the LRA; shall be deemed not to have terminated his employment for the purposes of the DSP and his rights shall be deemed to be unaffected; and [Sch 14.1(h)] a Participant who is a director of any Employer Company who retires and/or resigns on the basis that he is immediately re-elected in accordance with the constitutional documents of that (or another) Employer Company will be deemed not to have terminated his/her employment with that Employer Company. [Sch 14.1(h)]


10 If any provision in a definition is a substantive provision conferring any right or imposing any obligation on anyone then, notwithstanding that it is only in a definition, effect will be given to it as if it were a substantive provision in the body of the DSP. When any number of days is prescribed in the DSP, same will be reckoned exclusively of the first and inclusively of the last day unless the last day falls on a Saturday, Sunday, or official public holiday, in which case the last day will be the next succeeding day which is not a Saturday, Sunday or official public holiday. 2. OBJECT The DSP forms part of the Single Incentive Plan and regulates the Share-settled portion of the long-term incentive component of the Single Incentive Plan. The short-term incentive component of the Single Incentive Plan takes the form of a Cash Payment in terms of, and as defined in, the Policy. The DSP should be read in conjunction with the Policy to gain a full understanding of the operation of the Single Incentive Plan. The object and purpose of the DSP is to: incentivise Employees to meet strategic short-, medium-, and long-term objectives that will help deliver value to the Company’s shareholders; achieve alignment between the Participants’ remuneration and the interests of the Company’s shareholders; and act as a retention mechanism in a market where skilled employees are in high demand. Additional Awards under the DSP may also be made from time to time in certain specified instances. These include: sign-on awards for new employees, usually to compensate them for awards from the previous employer which will be forfeited on their resignation; and specific retention or counter-offer awards. Any Award that is made outside of the Single Incentive Plan must be motivated for by the Chief Executive Officer of the Company and approved by the Remco.


11 PART 2 – ADMINISTRATION OF THE DSP 3. THE DSP The DSP is hereby constituted, which DSP will be administered for the purpose and in the manner set out herein. 4. ADMINISTRATION OF THE DSP The Remco is responsible for the operation and administration of the DSP and has the final discretion to decide whether and on what basis the DSP will be operated. Subject to clause 23, where the DSP refers to the discretion of the Remco or the Board (as applicable), such discretion will be sole, absolute, and unrestricted unless the contrary is expressed, provided that if the Remco or the Board (as applicable) delegates the authority to exercise discretion, the discretion should be exercised in terms of the DSP. Subject to clause 23 and clause 24, the provisions of the DSP and the approval of the Board, Remco will be entitled to make and establish such rules and regulations, and to amend them from time to time, as it deems necessary or expedient for the proper implementation and administration of the DSP. 5. ADMINISTRATOR The Company or relevant Employer Company (as applicable) may appoint an Administrator to act on its behalf in performing its obligations under the DSP. For purposes of the DSP, references to “Company” or “Employer Company” include an Administrator that has been appointed in terms of this clause 5. 6. ANNUAL REPORTING Remco shall ensure that a summary appears in the annual financial statements of the Company of the number of Deferred Shares awarded to Participants, the number of Shares that may be utilised for the purposes of this DSP, any changes in such numbers during the Financial Year under review, the number of Shares held by any Employer Company which may be received by Eligible Employees and the number of Shares then under the control of Remco for Settlement to Participants in terms of this DSP. [Sch 14.8] 7. AVAILABILITY OF SHARES The Company shall: ensure that Shares may only be issued or purchased for purposes of the DSP once a Participant (or group of Participants) to whom they will be awarded has been formally identified; and [Sch 14.9(a)]


12 ensure that any Shares held for purposes of the DSP will not have their votes at general/annual general meetings taken into account for the purposes of resolutions proposed in terms of the Listings Requirements or for purposes of determining categorisations as detailed in Section 9 of the Listings Requirements. [Sch 14.10] 8. COSTS Prior to the Vesting Date, all costs and expenses relating to the DSP including, for the avoidance of doubt, all costs relating to the Administrator, (Costs) will be for the Company’s account. The Company may recover from each Employer Company such Costs as may be attributable to the participation of any of its Employees in the DSP in accordance with the Recharge Policy. Notwithstanding the provisions of clauses 8.1 and 8.2, the Company may procure, if applicable, that the relevant Employer Company will: bear all Costs of and incidental to the implementation and administration of the DSP and will, as and when necessary, provide all requisite funds and facilities for that purpose; and provide all secretarial, accounting, administrative, legal, and financial advice and services, office accommodation, stationery, and so forth for the purposes of the DSP. After the Vesting Date, all Costs and Tax will be for the Participant’s account. The Participant will be liable for all Tax payable as a result of benefits due to him/her in terms of the DSP. 9. MAXIMUM NUMBER OF SHARES AVAILABLE FOR THE DSP Subject to clause 9.3, the aggregate number of Shares that may be Settled under this DSP shall not exceed 43,229,436 Shares (being approximately 5% of the issued share capital of the Company as at the finalisation of the DSP). [Sch 14.1(b)] Subject to clause 9.3 the maximum number of Shares which any one Participant may receive in terms of the DSP shall not exceed 5,187,532 Shares (being approximately 0.6% of the issued share capital of the Company as at the finalisation of the DSP). [Sch 14.1(c)] The limit referred to in clause 9.1 shall exclude: Shares that have been purchased on-market through the JSE in Settlement of Awards; and [Sch 14.9(c)] Awards under the DSP which do not Vest in a Participant as a result of the forfeiture or reacquisition thereof. [Sch 14.3(f)]


13 The limit referred to in 9.1 shall include: Shares that have been issued by the Company in Settlement of Awards; and Shares held in treasury by a subsidiary of the Company that have been used to Settle Awards. The number of Shares referred to in 9.1 and 9.2 shall be increased or reduced in direct proportion to any adjustment in the Company's issued share capital as provided for in clause 21. [Sch 14.3(a)] In the event of a discrepancy between number of Shares and the percentage it represents, the number will prevail. PART 3 –DEFERRED SHARE AWARDS 10. ANNUAL REMCO DETERMINATION Each year the Remco will determine the following: which Employees will receive an Award; the Award Date; the Award Value (calculated in accordance with the Policy); the number of Deferred Shares applicable to the Award (calculated in terms of clause 12); the Vesting Dates and Vesting Periods applicable to the Award; whether any additional performance or other vesting conditions are applicable to the Award; and the forfeiture and Clawback provisions applicable to the Award. For the avoidance of doubt, the Remco has the authority in its absolute discretion to determine that ad hoc Awards may be awarded in terms of the DSP on such terms and conditions as it may deem appropriate. Subject to clause 24, the Remco will be entitled, in its absolute discretion, to vary any of the terms of an Award, including, but not limited to, the Award Date, the Vesting Date(s) and the applicability of forfeiture or Clawback. Remco may, in its sole and absolute discretion, authorise the grant of ad hoc Awards of Deferred Shares to Employees on such terms and conditions as it may deem appropriate, taking into account the factors listed in clause 10.1.1 to 10.1.7 above. Furthermore, Remco may also determine that Deferred Shares may be awarded to Participants as any of the following: sign-on Shares (to compensate new Employees for value forfeited from their previous employers); and/or


14 retention Shares (to reward key talent Employees generally below executive committee level). 11. AWARDS Subject to clause 23, the Remco may, in its sole and absolute discretion, resolve to make Awards to Employees. [Sch 14.1(f)] The Employer Company will, as soon as reasonably practicable on or after the Award Date, notify the Employee of the Award in an Award Letter. The Award Letter will be in the form prescribed by the Remco from time to time and will specify: the Award Date; the Award Value (calculated in accordance with the Policy); the number of Deferred Shares applicable to the Award (calculated in terms of clause 12); the Award Price of the Deferred Shares; the Vesting Dates and Vesting Periods applicable to the Award; the Acceptance Date; whether any additional performance or other vesting conditions are applicable to the Award; the forfeiture and Clawback provisions applicable to the Award; a stipulation that the Award is subject to the provisions of the DSP; and where a copy of the DSP might be obtained for perusal. An Award is (and Deferred Shares are) personal to a Participant and will not be capable of being ceded, assigned, transferred or otherwise disposed of or encumbered by a Participant. [Sch 14.1(e)] There will be no consideration payable by the Participant for the Award. For the avoidance of doubt, the Employer Company may recover Securities Transfer Tax from the Participant [Sch 14.1(d)(i)] The Employee must deliver an Acceptance Notice to the Employer Company on or before the Acceptance Date indicating his/her acceptance of the terms and conditions of the DSP (including, but not limited to, those set out in clauses 16, 17 and 28). The obligations of the Company and relevant Employer Company under the DSP will be postponed until such time as the Employee has delivered his/her Acceptance Notice in


15 accordance with clause 11.5 above. Neither the Employer Company nor the Company will be liable for any loss that may be suffered by the Participant because of the postponement of its obligations in terms of this clause 11.6. An Award may be cancelled or forfeited at any time after the Award Date if the provisions of clauses 16 or 18 apply or if the Remco and the Participant so agree in writing. 12. CALCULATION OF DEFERRED SHARES Subject to clause 15, the number of Deferred Shares attributable to an Award will be calculated by dividing the Award Value by the Award Price and rounding-down the resultant number to the next whole number. This is illustrated by the following formula: A = B / C Where: A is the number of Deferred Shares, rounded down to the nearest whole number, to which a Participant is entitled; B is the Award Value; and C is the Award Price. 13. SETTLEMENT OF AWARDS Within 30 (thirty) days of the Award Date of all Deferred Shares, the Company or Employer Company shall procure the Settlement of the required number of Deferred Shares. Any one of the following Settlement methods may be used, as directed by Remco: the Company or relevant Employer Company will, if so instructed by Remco, incur an expense by making a cash contribution to any third party equal in value to the required number of Shares on the Vesting Date in Settlement of the Award on the basis that the third party will acquire the required number of Shares on the market and effect Settlement to the Participant; or [Sch 14.9(c)] the relevant Employer Company by which that Participant is employed will use Shares held in treasury account and effect Settlement to that Participant; or the Company or relevant Employer Company by which that Participant is employed will, if so instructed by Remco, incur an expense by making a cash contribution to any subsidiary, other than an Employer Company, which holds Shares in treasury account, on the basis that the subsidiary will deliver to the Participant, for and on behalf of the Company or relevant Employer Company, the number of Shares required for the purpose of discharging the Company or relevant Employer Company’s obligation to effect Settlement to that


16 Participant. The cash contribution which the Company or relevant Employer Company shall make to the subsidiary shall (at Remco’s election) be either: 13.2.3.1 the Market Value per Share on the Settlement Date; or 13.2.3.2 an amount equal to the cost incurred by the subsidiary in acquiring the Shares held in treasury; or the Company or relevant Employer Company will, if so instructed by Remco, incur an expense by making a cash contribution to a third party equal in value to the subscription price of the Shares concerned, on the basis that the third party will acquire the number of Shares required for the purpose of discharging the Company’s or the relevant Employer Company’s obligation to effect Settlement to Participants by way of subscription for new Shares to be allotted and issued by the Company, for a subscription price per Share of an amount equal to the cost incurred per Share on the Settlement Date, and deliver such Shares to the Participant; or the Company will, if so instructed by Remco, issue Shares to the Participants, and recharge the related costs to the respective Employer Company in terms of an applicable recharge policy. 14. OWNERSHIP IN RESPECT OF DEFERRED SHARES AND PARTICIPANTS’ RIGHTS BEFORE THE VESTING DATE Following the making of an Award of Deferred Shares, Remco will procure that the Deferred Shares are held by the Escrow Agent for the absolute benefit of the Participants as beneficial owners of the Deferred Shares, subject to the provisions of clause 18. The Deferred Shares may not be disposed of or otherwise encumbered at any time from the Settlement Date up to and including the Vesting Date. The Deferred Shares shall be subject to the control of the Escrow Agent acting on instructions from the Company from the Settlement Date up to and including the Vesting Date, whereafter the Company shall, subject to clause 18, procure unrestricted delivery of the Deferred Shares to the Participant and shall procure the release of the Deferred Shares from the Escrow Agent. The Participant shall provide their Employer Company with and shall consent to their Employer Company furnishing the Escrow Agent with any information relating the Participant’s identification that the Escrow Agent may require in order to ensure compliance with the Financial Intelligence Centre Act, No. 38 of 2001 or any other applicable legislation. The Participant shall, where required, enter into a written agreement with the Escrow Agent, in a form approved by the Employer Company, relating to the holding of the Deferred Shares by the Escrow Agent until the Vesting Date.


17 The Employer Company shall not be liable for any loss or damage arising from any act or omission of the Escrow Agent, central securities depository participant (CSDP) engaged by the Escrow Agent, any employee, director, or representative of the Escrow Agent or such CSDP in connection with or arising out of the holding of, or transacting in, the Deferred Shares. For the avoidance of doubt, subject to clause 7.2, the Deferred Shares awarded to a Participant in terms of the Plan are full free shares, with full Dividend and voting rights, which are held in escrow by the Escrow Agent on the Participant’s behalf until Vesting, unless they are subject to reduction or forfeiture in terms of clause 16 or the Participant’s employment is terminated in terms of clause 18. A Participant shall be entitled to all Dividends (or other distributions made) in respect of, the Deferred Shares awarded to them in their Award in accordance with the provisions of this Plan. rights in respect of Voting Deferred Shares are only permitted following Vesting of Awards. [Sch 14.1(e)] 15. VESTING AND DELIVERY OF DEFERRED SHARES The Vesting of an Award is subject to a Participant’s continued employment with the Group for the duration of the Vesting Period. Subject to clauses 16, 18 and 22, on the Vesting Date, a Participant will have the right to delivery of the number of Deferred Shares calculated in terms of clause 12. The Participant must provide his/her Employer Company with a Notice 20 (twenty) days before the Vesting Date, confirming whether the Participant would like his/her Shares to be: delivered to him/her (in which case s/he must provide his/her Employer Company with the details of his/her Brokerage Account in the Notice); or sold on the market on his/her behalf (in which case s/he will receive the net proceeds of such sale in cash). In line with the Notice in clause 15.3, the Company will instruct the Broker to procure that either: a portion of the Shares are sold in the market on behalf of the Participant in order to cover the Participant’s Tax liability, and the balance of the Shares are transferred from the Escrow Agent to the Participant’s Brokerage Account; or all the Shares held on the Participant’s behalf are sold in the market, and the proceeds from the sale (less the deduction of any applicable Tax) are remitted to the Participant. If the Participant: fails to provide his/her Employer Company with a Notice in accordance with clause 15.3; or fails to provide his/her Employer Company with the details of his/her Brokerage Account in his/her Notice in accordance with clause 15.3.1,


18 on the Vesting Date, the Company will instruct the Broker to sell all the Participant’s Shares on the JSE and procure the payment by the relevant Employer Company to the Participant of a cash amount equal to the proceeds from the sale of the Shares (less any applicable Tax payable in accordance with clause 22). For the avoidance of doubt, the Shares sold for purposes of this clause 15.5, will be sold as part of bulk sale and, in calculating the amount of proceeds to be distributed to each Participant, the Broker will apply an average amount attributable to each Share sold in the bulk sale, determined in accordance with the following formula: Y = (E - F) / G Where: Y is the average amount of proceeds per Share sold as part of the bulk sale; E is the total proceeds from the bulk sale of the Shares; F is the total amount of costs and Securities Transfer Tax that are attributable to the bulk sale; and G is the total Shares sold in the bulk sale. Notwithstanding the above, the Participant will pay, in such manner as the Remco may from time to time prescribe, any such additional amount which the Remco may notify the Participant of in respect of any deduction on account of Tax as may be required by Applicable Laws which may arise on Vesting or delivery of the Shares. Subject to clause 22, if the Participant elects to take transfer of the Shares (and complies with the provisions of clause 15.3.1), the Company or relevant Employer Company will instruct the Escrow Agent to procure that the number of Shares contemplated in 15.2 are transferred to the Participant’s Brokerage Account as soon as reasonably possible after the Vesting Date. The Shares will be fully paid up and will rank pari passu with the existing issued Shares, and will have the same voting rights as the existing issued Shares. If the Shares are not yet allotted and issued, the Board will procure that they are allotted, issued and listed on the JSE upon issue. [Sch 14.1(e)] The Participant will have full ownership rights in the Shares delivered to his/her Brokerage Account. A Participant will be entitled to all ordinary Dividends declared and paid in the ordinary course of business during the Vesting Period in respect of the Deferred Shares Awarded to him/her in accordance with the provisions of the DSP. A Participant will also be entitled to all special Dividends declared and paid, but these may only be used by the Broker to purchase additional Deferred Shares that will be held by the Escrow Agent until the applicable Vesting Date(s). These


19 additional Deferred Shares will be subject to the same conditions applicable to the underlying Award. For the avoidance of doubt, the Award of Deferred Shares does not constitute the delivery of Shares nor does it give a Participant the right to take transfer of the Shares until and to the extent that the provisions of the DSP have been satisfied. Accordingly, the Deferred Shares are Awarded on the understanding that the Deferred Shares may not be traded or used as security for any obligations and any attempt to trade in Deferred Shares or use them as security for any obligations will result in the forfeiture of the relevant Deferred Shares. [Sch 14.1(e)] The Participant will be personally responsible for maintaining his/her Brokerage Account and paying all relevant fees associated therewith. 16. REDUCTION OR FORFEITURE Prior to the Vesting Date, the Remco may exercise its discretion to determine that an Award is subject to reduction or forfeiture (in whole or in part) if any one or more of the following Trigger Events occur: the Group’s, Company’s, or Employer Company’s financial statements having been restated to a material extent other than a restatement which is as a result of non-compliance with financial reporting requirements (such as an appropriate change in accounting policy, an application of a change in reporting entity, or to rectify a minor error); the discovery that any financial information or the assessment of any performance criteria used to make an Award was based on a material error, or on materially incorrect information provided to the Group, Company, or Employer Company; the Group, Company, or Employer Company having suffered a material downturn in its financial performance in the financial years after the Award was made, which downturn can be attributed to events that occurred prior to the making of the Award and which were not known to the Remco at the time of making the Award; the Group, Company, or Employer Company having suffered a material downturn in its financial performance in the financial years after the Award was made and over which the Participant had influence and/or control; the Group, Company, or Employer Company having suffered a material failure of risk management over which the Participant had influence and/or control and for which the Participant’s employment has not been terminated on a Fault Termination basis; the Group, Company, or Employer Company having suffered material harm to its good name and reputation, which harm can be directly attributed to the Participant and/or over


20 which the Participant had influence and/or control and for which the Participant’s employment has not been terminated on a Fault Termination basis; and/or the Participant’s actions having amounted to misconduct or poor performance and for which the Participant’s employment has not been terminated on a Fault Termination basis. To the extent that clause 16.1 applies to an Award, the Remco will determine if the Award will be reduced in whole or in part and, if the Remco does so determine, then the Award will be forfeited in whole or in part, as applicable, on the date of such determination. The Company is hereby irrevocably and in rem suam nominated, constituted, and appointed as the Participant’s sole attorney and agent to sign and execute all such documents and do all such things as are necessary for that purpose. If the Award is reduced in its entirety, the Deferred Shares Awarded to the Participant to make up the Award will be forfeited, and the Participant will no longer have any entitlement to any of the rights or benefits attaching to the Shares. If the Award is subject to a partial reduction, the number of Deferred Shares Awarded to the Participant that make up that reduced portion of the Award will be treated in accordance with clause 16.3 above. The Remco may postpone the Vesting Date of an Award if, at the Vesting Date, there is an ongoing investigation or other procedure being carried on to determine whether the forfeiture provisions apply in respect of a Participant, or the Remco decides that further investigation is warranted. In such event, the Vesting Date will be deemed to be the date upon which the investigation or procedure has been completed and the Remco has determined that the Award will not be forfeited in whole or in part. 17. CLAWBACK Where there is reasonable evidence that a Clawback Trigger Event occurred prior to the Vesting Date, but was only discovered within a period of 3 (three) years after the Vesting Date (the Clawback Period), the Remco may exercise its discretion to require a Participant to repay the Clawback Amount (or a portion thereof). The occurrence of the following Clawback Trigger Events will allow Remco to exercise its discretion in: the discovery of a misstatement resulting in an adjustment to the Group’s, Company’s, or Employer Company’s audited accounts (or the audited accounts of any member of the Group company) in respect of a period for which the condition of continued employment and employment period applicable to an Award were assessed; and/or the discovery of the events that occurred prior to Award or Vesting that have led to the censure of the Group, Company, Employer Company, or any member of the Group by a


21 regulatory authority or have had a significant detrimental impact on the reputation of the Group, Company, Employer Company, or any member of the Group; and/or the discovery of action or conduct of a Participant which in the opinion of Remco amounts to gross misconduct that occurred prior to Award or Vesting; and/or the discovery that any information or the assessment of any performance condition(s) used to determine an Award was based on erroneous, or inaccurate or misleading information, and lead to a material error in the calculation of any Award. For the avoidance of doubt, where there is reasonable evidence that a Clawback Trigger Event occurred prior to the Vesting Date, and was discovered prior to the Vesting Date, the Remco may exercise its discretion to apply the provisions of clause 16. The Remco may extend the Clawback Period if, upon the expiry of the Clawback Period, there is an ongoing investigation or other procedure being carried on to determine whether the Clawback provisions apply in respect of a Participant, or the Remco decides that further investigation is warranted. In such event, the Clawback Period will be extended until the investigation or procedure has been completed and the Remco has made a final determination. 18. TERMINATION OF EMPLOYMENT [SCH 14.1(h)] No Fault Terminations Subject to clause 18.1.2 below, if a Participant ceases to be employed by reason of a No Fault Termination prior to the applicable Vesting Date, the Participant’s Award will not be forfeited and will continue in force in terms of the DSP and will Vest on the original Vesting Date(s), notwithstanding that the Participant has ceased to be employed. Death If a Participant ceases to be employed prior to the Vesting Date because of his/her death, the Award will Vest in full on the Date of Termination of Employment. Fault Terminations If a Participant ceases to be employed by reason of a Fault Termination prior to the applicable Vesting Date, any unvested Award will be deemed to have been forfeited and cancelled, provided that if, in the opinion of the Remco, the circumstances of the Participant’s ceasing to be employed are such as to warrant his/her being entitled to retain his/her Deferred Shares in terms of the DSP, then Remco in its sole and absolute discretion may indicate in writing to such Participant that s/he may retain his/her Award, or a portion thereof, notwithstanding that s/he has ceased to be employed. In such event, the Participant’s Award, or a portion thereof, will


22 not be forfeited and will continue in force in terms of the DSP and will Vest on the original Vesting Date(s), notwithstanding that the Participant has ceased to be employed. The Remco may exercise its discretion to determine the Fault Termination or No-Fault Termination status of Participants for any reason not contemplated in the DSP, including a mutual separation, in its sole and absolute discretion. Where a Participant is transferred from one Employer Company to another Employer Company: all Awards granted to such Participant by the first Employer Company will remain in force on the same terms and conditions as set out in the DSP; and the second Employer Company will assume a pro rata portion of the first Employer Company's obligations in respect of the relevant Awards in consideration for obtaining the Participant's services from the first Employer Company.


23 PART 4 – GENERAL 19. INSOLVENCY All unvested Awards will be deemed to have been reacquired, and accordingly not entitle a Participant to Settlement, upon the Participant’s making an application for the voluntary surrender of his/her estate or his/her estate being otherwise sequestrated or any attachment of any interest of a Participant under the DSP, unless the Remco, in its sole and absolute discretion, determines otherwise and then subject to such terms and conditions as the Remco may determine. If the Company is placed in final liquidation, the Secretary will notify the Participant thereof in writing and all Awards that have not Vested at the date of notification will be forfeited. [Sch 14.1(e)] 20. POOR PERFORMANCE AND DISCIPLINARY PROCEDURES In the event of pending disciplinary and/or poor performance proceedings against any Participant, or the contemplation of such proceedings, then the Vesting of any Award and/or the delivery of Shares will be suspended until the final conclusion of such proceedings, at which time the Award will Vest and/or the Shares be delivered, or the provisions of clauses 16 or 18 will be applied, whichever is applicable. [Sch 14.1(h)] 21. ADJUSTMENTS Notwithstanding anything to the contrary contained herein but subject to 21.5, if the Company makes a Special Distribution and/or if the Company restructures its capital in that it - [Sch 14.3(a), 14.3(b)] undertakes a conversion, redemption, subdivision or consolidation of its ordinary share capital, such adjustments shall be made to the number of equity securities in clause 9.1 and the number of unvested Awards held by Participants as may be determined to be fair and reasonable to the Participants concerned by Remco; provided that any adjustments pursuant to this clause 21 shall be confirmed by the Auditors and should give a Participant the entitlement to the same proportion of the equity capital as he was previously entitled, and should any Participant be aggrieved, he may utilise the dispute procedures set out in clause 27. No adjustments shall be required in terms of this clause 21.1 if the provisions of clauses 21.5 to 21.7 are applicable; [Sch 14.3(a)] undertakes a rights offer; or undertakes a bonus or capitalisation issue, such adjustments may be made to the number of equity securities in clause 9.2 and the number of unvested Awards held by Participants as may be determined to be fair and


24 reasonable to the Participants concerned by Remco; provided that any adjustments pursuant to this clause 21 shall be confirmed by the Auditors and should give a Participant the entitlement to the same proportion of the equity capital as he was previously entitled, and should any Participant be aggrieved, he may utilise the dispute procedures set out in clause 27. No adjustments shall be required in terms of this clause 21.1 if the provisions of clauses 21.5 to 21.7 are applicable. [14.3(b)] The Auditors will confirm to the JSE, in writing, that any adjustments made in terms of clause 21.1 are in accordance with the provisions of the DSP. Such written confirmation will be provided to the JSE at the time that the adjustments are finalised. [Sch 14.3(d)] Any adjustments made in terms of clause 21.1 will be reported in the Company’s annual financial statements in respect of the Financial Year during which the adjustment is made. [Sch 14.3 (e)] For the purposes of 21.1 the Company shall be deemed to make a Special Distribution if it distributes Shares to its shareholders - in the course of, and as part of any unbundling, reorganisation, rationalisation, compromise, arrangement or reconstruction (including the amalgamation of two or more companies or entities); in the course of, or as part of, a reduction of capital (including a share repurchase); as a special dividend or other payment in terms of the Companies Act; or in the course or in anticipation of the deregistration or liquidation of a company for any of the above purposes; provided that this clause 21.4 shall not apply to the normal annual interim and final cash or scrip dividends declared by a Company. No adjustments shall be required in terms of clause 21.1 in the event of the issue of equity securities as consideration for an acquisition in terms of clause 21.6, the issue of securities for cash and the issue of equity securities for a vendor consideration placing. [Sch 14.3(c)] Subject to clause 21.11, if the Company undergoes a Change of Control after an Award Date, then the rights of Participants under the Plan are to be accommodated on a basis which shall be determined by Remco to be fair and reasonable to Participants. [Sch 14.1(g)] Remco may determine, in its sole discretion, that all or a portion of a Participant’s unvested Award shall Vest early on the Change of Control Date. In respect of the pro-rated Vesting of Awards of Deferred Shares, the portion of the Award which shall Vest will reflect the number of complete months served between


25 the Award Date and the Change of Control Date, divided by the total number of months in the Employment Period. To the extent that there is more than one Vesting Date and more than one Employment Period in respect of a particular Award, the calculation set out above will be carried out in respect of each Employment Period. The portion of the Award that does not Vest on the Change of Control Date will continue to be subject to the terms of the Plan, unless Remco determines otherwise. If Remco makes such a determination, or in the event that the Participant’s unvested Shares cannot continue in force in terms of the original terms and conditions, they will be exchanged for replacement benefits in terms of a similar scheme, provided that such replacement benefits must: put the Participant in a similar position to the position they were in immediately before the replacement benefits accrued to the Participant; and have a similar fair value on the transaction date as the value of the unvested Shares held by the Participant (that were not subject to early Vesting). If the Company undergoes a Change of Control pursuant to a transaction, the terms of which transaction ensure that Participants' rights and their awards under the Plan must be accommodated on a basis which is determined by an independent valuer to be fair and reasonable to Participants, then the provisions of clause 21.5 shall not apply. [Sch 14.1(g)] For the purposes of this clause 21, the determination and verification that the replacement benefits have the same fair value should be performed by an independent valuer. 22. TAX LIABILITY Notwithstanding any other provision in the DSP (including clause 15.6), if the Company or relevant Employer Company is obliged (or would suffer a disadvantage of any nature if they were not) to account for, withhold, or deduct any Tax in any jurisdiction which is payable in respect of, or in connection with, the making of any Award, Settlement, delivery to a Participant of Shares, the payment of a cash amount, and/or otherwise in connection with the DSP, then the Company or relevant Employer Company, as the case may be, will be entitled to account for, withhold, or deduct such Tax from any amount due to the Participant, and the Company and/or relevant Employer Company will be relieved from the obligation to deliver any Shares to a Participant or to pay any amount to a Participant in terms of the DSP until the Tax has been discharged in full. The Participant agrees that the Company or relevant Employer Company may instruct the Broker, in accordance with the provisions of clause 15, to sell some or all of the


26 Shares that Vest in the Participant and to remit payment to the relevant Revenue Authority the relevant amounts out of the proceeds of the sale in discharge of the Tax. Participants agree to indemnify the Group, the Company, relevant Employer Company, and any other member of the Group against any Tax claim of whatever nature or any other liability or obligation incurred by the Group, the Company, relevant Employer Company, and any other member of the Group, which relates to the liability of the Participant because of his/her participation in the Plan. For the avoidance of doubt, an Award will not be grossed up to take into account any Tax of whatsoever nature. The Company is hereby irrevocably and in rem suam nominated, constituted, and appointed as the sole attorney and agent of a Participant, in that Participant's name, place, and stead to sign and execute all such documents and do all such things as are necessary to give effect to the provisions of clause 22.2. 23. LISTINGS AND LEGAL REQUIREMENTS Notwithstanding any other provision of the DSP - no Shares shall be Settled on any Participant or received pursuant to this DSP if Remco determines, in their sole discretion, that such Settlement will or may violate any Applicable Laws, the Listings Requirements or the listings requirements of any other securities exchange on which the Shares of the Company are listed; and the Company shall apply for the listing of all Shares which are Settled to Participants on the JSE. Despite the occurrence of a Vesting Date, all Participants shall be subject to the Group’s policies and procedures relating to trading in the Company’s securities, the Financial Markets Act and the Listings Requirements and no Participant shall undertake any action in respect of that Participant’s Shares that will cause the Company to breach its obligations in terms of the Financial Markets Act or the Listings Requirements. The Company will ensure that no Shares are Settled for the DSP at a time when such acquisition is prohibited by the provisions of the Financial Markets Act or the Listings Requirements. To the extent that the Company is unable to deliver the Shares to a Participant as a result of the provisions of the Financial Markets Act or the Listings Requirements, the Company will deliver the Shares to the Participant as soon as possible after the restriction is lifted; provided that the Company will not be liable for any loss that may be suffered by the Participant as a result of the postponement of delivery in terms of this clause 23. [Sch 14.9(e)] [Sch 14.9(f)] Whilst the companies in the Group will make every effort to Settle Shares within a reasonable period of time for purposes of satisfying their obligations under the DSP, they do not guarantee that they will be able to do so within set time periods. As such,


27 the Group will not be liable for any loss that may be suffered by the Participant as a result of any fluctuations in the Share price, or for any other reason. 24. AMENDMENT OF THE DSP Subject to approval of the Board, it shall be competent for Remco to amend any of the provisions of the DSP subject to the prior approval (if required) of every stock exchange on which the Shares are for the time being listed; provided that no such amendment affecting the Vested rights of any Participant shall be effected without the prior written consent of the Participant concerned, and provided further that no such amendment affecting any of the following matters shall be competent unless it is sanctioned by ordinary resolution of 75% (seventy-five percent) of the shareholders of the Company in a general meeting, excluding all of the votes attached to Shares owned or controlled by existing Participants in the DSP - [Sch 14.2] [Sch 14.1] the definition of Eligible Employees and Participants; the definition of Award Price; the total number of Shares which may be utilised for the purpose of or pursuant to the DSP; the maximum number of Shares which may be Awarded to any one Participant in terms of the DSP; the voting, dividend, transfer or other rights (including rights on liquidation of the Company) which may attach to any or Award; [Sch 14.10] [Sch 14.1(e)] the provisions in these Rules dealing with the rights (whether conditional or otherwise) in and to the Deferred Shares of Participants who leave the employment of the Group prior to Vesting; the basis for Awards in terms of these Rules; [Sch 14.1(f)] the treatment of Awards in instances of mergers, takeovers or corporate actions; [Sch 14.1(g)] the termination rights of Participants; and [Sch 14.1(h)] the provisions of this clause 24. Subject to approval from the JSE, clause 24.1 will not apply to any amendment which is: minor and to benefit the administration of the DSP; to take account of any changes in Applicable Laws; or


28 to obtain or maintain favourable Tax, exchange control or regulatory treatment for the Company, relevant Employer Company, or any present or future Participant. Without derogating from the provisions of clause 24.1, if it should become necessary or desirable by reason of the provisions of Applicable Laws at any time after the signing of the DSP, to amend the provisions of the DSP so as to preserve the substance of the provisions contained in the DSP but to amend the form so as to achieve the objectives embodied in the DSP in the best manner, having regard to such Applicable Laws and without prejudice to the Participants concerned, then Remco may amend the DSP accordingly. Notwithstanding any provision in the DSP, the Remco will be entitled to terminate the DSP at any time, provided that Awards granted before such termination will continue to be valid and will remain in force on the same terms and conditions as set out in the DSP. Any deficit arising from the winding up of the DSP will be borne by the Company, to the extent not recovered by the Company from the relevant Employer Company. 25. REACQUISITION If, in terms of any provision of the DSP, any Award or portion of an Award is deemed to have been reacquired, the Company is hereby irrevocably and in rem suam nominated, constituted and appointed as the sole attorney and agent of the Participant concerned in that Participant's name, place and stead to sign and execute all such documents and do all such things as are necessary for that purpose. [Sch 14.3(f)] 26. STRATE Notwithstanding any provision in the DSP, the Company will not be obliged to deliver to the Participant share certificates in respect of the Shares settled to him/her in terms of the DSP, but will instead be obliged to procure such electronic transactions and/or entries and to deliver to the Participant such documents (if any) as may be required to reflect his/her rights in and to such Shares pursuant to the provisions of the Companies Act, the Financial Markets Act, the Rules of the Central Securities Depository (being Share Transactions Totally Electronic Limited) and the requirements of the JSE. 27. DISPUTES Should any dispute of whatsoever nature arise from or in connection with the DSP (including an urgent dispute), then the dispute will, unless the parties thereto otherwise agree in writing, be referred to the Group Chief Executive Officer. If the Group Chief Executive Officer is unable to resolve the dispute, or if the dispute relates, directly or indirectly, to the Group Chief Executive Officer, it will be referred to the chairman of the Remco who, together with the Remco, will decide thereon, and that decision will be final and binding on all parties to the dispute.


29 This clause is severable from the rest of the DSP and will remain in effect even if the DSP is terminated for any reason. 28. DATA PROTECTION By participating in the DSP, a Participant is deemed to agree and consent to: the collection, use and processing by the Group, the Company, the Employer Company, and any other member of the Group of Personal Information relating to the Participant, for all purposes reasonably connected with the administration of the DSP; the Group, the Company, the Employer Company, and any other member of the Group transferring Personal Information to or between any of such persons for all purposes reasonably connected with the administration of the DSP and the use of such Personal Information by such persons for all purposes reasonably connected with the administration of the DSP; and the transfer to and retention of such Personal Information by any third party anywhere in the world for all purposes reasonably connected with the administration of the DSP. 29. DOMICILIUM AND NOTICES The parties choose domicilium citandi et executandi for all purposes arising from the DSP, including the giving of any notice, the payment of any sum, the serving of any process, as follows: the Company: Physical address: Constantia Office Park, Cnr 14th Avenue and Hendrik Potgieter, Cycad House, Building 17, Ground floor, Weltevreden Park, 1709 Postal address: P.O Box 390, Maraisburg, 1700 E-mail: [email protected] For attention: The Secretary each Participant: The chosen address and/or e-mail address of each Participant will be the address and/or e-mail address of that Participant reflected in the records of the Group’s payroll system from time to time. Each of the parties will be entitled from time to time, by written notice to the other, to vary its domicilium to any other physical address and/or (in the case of a Participant)


30 his/her address or e-mail address; provided in the case of a Participant such variation is also made to his/her details on the Group's payroll system. Any notice given and any payment made by any party to the other which: is delivered by hand during the normal business hours of the addressee (for attention: the Secretary in the case of the Company) at the addressee's domicilium for the time being will be rebuttably presumed to have been received by the addressee at the time of delivery; is posted by prepaid registered post from an address within the Republic of South Africa to the addressee (for attention: the Secretary in the case of the Company) at the addressee's domicilium for the time being will be rebuttably presumed to have been received by the addressee on the 7th (seventh) day after the date of posting; or is transmitted by electronic mail to the addressee at the addressee's electronic address for the time being (for attention: the Secretary in the case of the Company) will be presumed, until the contrary is proved by the addressee, to have been received by the addressee on the date of successful transmission thereof. 30. COMPLIANCE The Company shall comply with (and procure compliance by all members of the Group with) all Applicable Laws. The DSP shall at all times be operated and administered subject to all Applicable Laws. [Sch 14 Generally] Without derogating from the generality of the aforegoing, the Company shall ensure compliance with Schedule 14 and paragraphs 3.63 to 3.74 of the Listings Requirements of the JSE. [Sch 14.9(d)] Shares may not be purchased during a Prohibited Period (as defined in the Listings Requirements) unless there is a purchase programme in place and such programme has been submitted to the JSE in writing prior to the commencement of the Prohibited Period and the provisions of paragraph 14.9(e) of Schedule 14 of the Listings Requirements are fully complied with. [Sch 14.9(e)] If a purchase pursuant to clause 30.3 is made during a Prohibited Period through a purchase programme, an announcement will be made which will include a statement confirming that the purchase was put in place pursuant to a purchase programme prior to the commencement of the Prohibited Period. [Sch 14.9(f)] Any issue of Shares to Participants, which do not fall within the DSP, will be treated as a specific issue of shares for cash as contemplated in paragraph 5.51 of the Listings Requirements. [Sch 14.11]


31 Rolling over (including the arrangement assuming that Shares which have already vested and been issued to a Participant in terms of the DSP, and which revert back to the number of Shares referred to in clause 9.1 after a 10-year period) is prohibited. [Sch 14.12] Back-dating of Awards (i.e. the practice of issuing Awards retrospectively) is not permitted. The date upon which the decision to issue Awards is determined will be the date upon which all the components relating to the DSP are determined. [Sch 14.13] The Company, by its signature hereto, undertakes to procure compliance by every Employer Company with these Rules. 31. GENERAL PROVISIONS To the extent that shareholder approval is required to authorise any performance by the Group or any member of the Group as contemplated in the DSP, such performance will only take place once the requisite shareholder approval has been obtained. To the extent that the requisite shareholder approval is not obtained, the Remco will exercise its discretion in determining the appropriate response. In certain circumstances, the Remco may be obliged to inform the Participants that their rights under the DSP have been postponed or forfeited. The Company will not be liable for any loss that may be suffered by the Participant because of such postponement or forfeiture. The receipt of an Award in any Financial Year by a Participant does not create any rights and/or expectations that the same Participant will be entitled to any further Award in any subsequent years. An Employee’s eligibility to receive Awards will be determined annually by the Remco. The DSP and participation in it will not form part of any contract of employment between any Employer Company and any Employee, and the rights and obligations of any individual under the terms of their office or employment with the Employer Company will not be affected by their participation in the DSP. This DSP will not grant a Participant any right to continued employment nor will it afford an individual additional rights to compensation or damages for any loss or potential loss which s/he may suffer (by reason of being unable to receive an Award, Shares, or otherwise) in consequence of the termination of any office or employment within the Group for any reason whatsoever, regardless of whether such termination of employment was lawful, unlawful, fair, or unfair. The DSP will not confer on any person any legal or equitable rights (including, for the avoidance of doubt, any voting rights, or rights to receive Dividends) against any Employer Company directly or indirectly, or give rise to any cause of action at law or in equity against any Employer Company.


32 The DSP will be governed by and construed in accordance with the laws of the Republic of South Africa.


Exhibit 8.1
LIST OF MAIN SUBSIDIARIES AS AT JUNE 30, 2026

SUBSIDIARY NAME JURISDICTION OF INCORPORATION AND RESIDENCEPROPORTION OF OWNERSHIP INTEREST AND VOTING INTEREST
Ergo Mining Proprietary LimitedSouth Africa100%
Far West Gold Recoveries Proprietary LimitedSouth Africa100%

image.jpg        Exhibit 11.1

DIRECTORS’ & EMPLOYEES' DEALING POLICY AND PROCEDURES
1.INTRODUCTION

1.1.The JSE Limited’s (“JSE”) Listings Requirements, read with the Securities Services Act, 36 of 2004 (“SSA”) and the DRDGOLD Code of Ethics regulate dealings in securities for directors and employees of DRDGOLD Limited and its subsidiaries (“DRDGOLD” or “the Company”).

1.2.The JSE Listings Requirements are binding on directors and the company secretary of the listed company and of any major subsidiaries (defined in the JSE Listings Requirements as being a subsidiary that represents 25% or more of total assets or revenue of the consolidated group based on the latest published interim or year-end financial results) while the insider trading provisions under the SSA apply to all holders of unpublished, material price sensitive information.

1.3.The DRDGOLD Board views any breach of this policy in a serious light. All employees and directors must observe the laws and rules referred to under 1.1 above. A breach in the policy could result in a censure or fine being imposed on the directors or the Company by the JSE. If directors or employees do not-comply with the insider trading provisions of the SSA, they could be guilty of an offence.

2.PURPOSE

2.1.To reduce the risk of employees, particularly the directors and the company secretary contravening the laws which prohibit insider trading.

2.2.To promote the Company’s reporting obligations and prevent any individuals from unfairly deriving benefit by selling or buying shares to the disadvantage of the general body of shareholders

2.3.To give guidance to the directors and employees on their duty to comply with the relevant laws when trading in DRDGOLD securities, however every employee who deals in DRDGOLD securities must familiarise himself or herself with all the applicable legal provisions.

3.ESSENTIAL DEFINITIONS

1


image.jpg DIRECTORS’ DEALING POLICY AND PROCEDURE

3.1.The following summarised terms are extracted from legislative provisions and the JSE Listings Requirements so that the context of this policy can be clarified.

(1)"Associate” means:

(1)a director’s spouse and children below the age of 18 years; and/or
(2)the trustees of any trust of which a director and/or his or her family are beneficiaries; and/or
(3)a trust of which a director and/or his or her family control 35% of its votes; and/or
(4)a close corporation or a company in which a director and/or his or her family control at least 35% of the voting rights at general and board meetings, or which has the right to appoint/remove 35% of directors.

(2)“Closed period” means the date from the end of a reporting period to the date of the earliest publication of results in respect of that reporting period (12-month period, 6-month period or quarterly reporting period) and any period when the securities of DRDGOLD are traded under a cautionary announcement.

(3)“Company Secretary” means the Company Secretary of DRDGOLD Limited.

(4)"Designated Director” means either the Chairman of the Board or the Chairman of the Audit Committee or the Chairman of the Remuneration Committee who are entitled to give clearance required in terms of paragraph 3.66 of the JSE Listings Requirements.

(5)“Director” means a director of DRDGOLD including its Company Secretary directors and company secretaries of DRDGOLD’s major subsidiaries as defined in the JSE Listings Requirements.

(6)“Price sensitive information” means unpublished information that, if it were made public, would be reasonably likely to have an effect on the price of DRDGOLD’s securities.

(7)“Prohibited period” means a closed period and any period when there exists any matter which constitutes unpublished price sensitive information in relation to DRDGOLD securities (whether or not the director has knowledge of such matter).

(8)“Securities“means DRDGOLD securities which include shares, stocks, debentures, specialist securities, notes, units of stock issued in place of shares, options on stocks, shares, debentures, notes or units and rights thereto, options on indices of information as issued by a stock exchange on prices of any
2


image.jpg DIRECTORS’ DEALING POLICY AND PROCEDURE

of the aforementioned instruments, as well as any other instruments declared by the Registrar of Stock Exchanges by notice in the JSE Gazette.

(9) “Transaction” includes,
(10)any sale, purchase or subscription (including a rights offer, capitalisation award or scrip dividend) of securities relating to the Issuer;
(ii)    any agreement to sell, purchase or subscribe for securities relating to the issuer (irrespective of whether shares or cash flows);
(iii)    any donations of securities relating to the Issuer;
(4)any dealings in warrants, single stock futures, contracts for difference or any other derivatives issued in respect of the Issuer’s securities. It should be noted that, if shares are sold and the equivalent exposure is purchased through a single stock future or any other derivative, both legs will be deemed to be transactions. The closing out of a single stock future or other derivative is also a transaction. The rolling-over of a single stock future that is merely the extension of an existing position is not a transaction;

(5)the acceptance, acquisition, disposal or exercise of any option (including but not limited to options in terms of a share incentive/option scheme) to acquire or dispose of securities;

(6)any purchase or sale of nil or fully paid letters;

(7)the acceptance, acquisition or disposal of any right or obligation, present or future, conditional or unconditional, to acquire or dispose of securities; or

(8)any other transaction that will provide direct or indirect exposure to the share (price of the Issuer. It must be noted that this does not include cash settled share appreciation rights granted to directors by the Issuer in the ordinary course of business.

3.2    The list of definitions set out under 3.1 (a) to (i) above is not exhaustive, directors and employees are required to gather sufficient information before engaging in any transaction or dealing in DRDGOLD securities.

4.DEALING IN SECURITIES

4.1.Directors and employees must not deal or enter into a transaction when they hold unpublished price sensitive information. They are also prohibited from communicating insider trading information to other persons who might use it to deal in DRDGOLD securities as they would be guilty of an offence in terms of the insider trading provisions of the SSA.

4.2.Directors and employees must not deal or enter into a transaction during a closed period or a prohibited period.

3


image.jpg DIRECTORS’ DEALING POLICY AND PROCEDURE

4.3.A director must not deal in DRDGOLD securities without following the procedure outlined under paragraph 5 below.

4.4.A designated director defined under paragraph 3 above shall not grant clearance to deal in a closed or prohibited period even if the applicant director is not aware of the existence of price sensitive information.
4.5.A director must advise his/her associates and investment manager dealing on his/her behalf in writing of the names of the issuer(s) of which he/she is a director

4.6.Directors must advise their associates in writing that they must notify him or her immediately after entering into a transaction.

4.7.Directors must advise their investment managers in writing that they may not deal in securities unless they obtain his or her express consent in writing.

5.PROCEDURE FOR DIRECTORS DEALING IN SECURITIES.

Any director who intends to enter into a transaction or deal in securities must complete FORM DL 01 and send it to the office of the Company Secretary.

5.1.The office of the Company Secretary shall simultaneously transmit FORM DL 01 received from the applicant director to either the Chief Executive Officer (“CEO”) or the Chief Financial Officer (“the CFO”) so that they consider whether or not the company holds any price sensitive information at that stage. At the same time the Company Secretary’s office will also refer the application to DRDGOLD’s sponsor appointed in terms of the JSE Listings Requirements for comment and guidance.

5.2.If the CEO or the CFO are each satisfied that there is no price sensitive information in relation to DRDGOLD’s securities and there is no reason to refuse the applicant director's application for clearance to deal, the CEO or the CFO will sign off FORM DL 01 approving the application to deal.

5.3.Once the application has been granted by the CEO or CFO, he or she will return it to the Company Secretary for further attention.

5.4.The CEO or CFO must refuse the application contained in FORM DL 01 if DRDGOLD is in a closed period or he or she is aware of any price sensitive information even if the applicant director has no knowledge of such information.
5.5    In the event that the CEO or CFO intend to trade DRDGOLD securities their application will be considered by either the Chairman of the Board or the Audit Committee or the Remuneration Committee.
4


image.jpg DIRECTORS’ DEALING POLICY AND PROCEDURE

5.5.A director must immediately disclose particulars of his or her dealing, failing which by no later than 24 hours after dealing in securities. The particulars referred to in this paragraph shall be contained in FORM DL 02 and must be sent to the office of the company secretary within 24 hours after dealing in DRDGOLD securities.

6.CONCLUSION
Each director and each employee has an individual responsibility to obtain all necessary information which will assist him or her to comply with the laws relating to insider trading and the JSE Listings Requirements.
FORM DL 01
DEALING IN SECURITIES BY DIRECTORS
     APPLICATION FOR PERMISSION TO DEAL
(To be completed by Applicant Director)
I wish to apply for permission to deal in company shares.

Name:
Number of Shares:
Type of Transaction: (Please Tick)
Purchase      Sale             Option Exercise     

I have a direct/indirect interest in the transaction. (Please delete as applicable)
I declare that I am not in the possession of any price sensitive information.
I undertake to inform the Company Secretary as soon as possible once the transaction is completed, but no later than 24 hours afterwards.
5


image.jpg DIRECTORS’ DEALING POLICY AND PROCEDURE

Applicant:Date
Recommended/Not Recommended:
Chief Executive Officer
Date
Recommended/ Not Recommended:
Chief Financial Officer
Date
Approved/ Not Approved:
Chairman of the Board
Date
Approved/ Not Approved:
Chairman of the Audit Committee
Date
Approved/ Not Approved:
Chairman of Remuneration Committee
Date
Received by Company Secretary:Date
I understand that this permission is only valid for 30 days. If the above transaction has not been completed within this period then a re-application will be made.

SIGNATURES:
Please return this completed and signed form to The Company Secretary,
Quadrum Office Park, Building 1,50 Constantia Boulevard, Constantia Kloof ext.28,Roodepoort,1709
Fax: (011) 470 2626 or emails: [email protected] & [email protected]
FORM DL 02
(Listings Requirement 3.63 (b)
INFORMATION TO BE PROVIDED TO THE LISTING DIVISION

The following information is required:

The name of the company of which he/she is a director.

Date on which the transaction was effected.

6


image.jpg DIRECTORS’ DEALING POLICY AND PROCEDURE

The price, number, total value and class of securities concerned.

In the case of options or any other similar right or obligation, the option strike price, strike dates and periods of exercise and /or vesting.

The nature of the transaction.

The nature and extent of the director’s interest in the transaction (e.g. direct beneficial/indirect
beneficial).
Confirmation as to whether the trades were done on-market or off-market.

Confirmation that clearance has been given (not required for dealings by associates).
7


Exhibit 12.1
CERTIFICATION

I, Daniel Johannes Pretorius, certify that:

1)    I have reviewed this Annual Report on Form 20-F of DRDGOLD Limited.

2)    Based on my knowledge, this Annual Report does not contain any untrue statement of a material fact or omit to state a material fact necessary to make the statements made, in light of the circumstances under which such statements were made, not misleading with respect to the period covered by this Annual Report.

3)    Based on my knowledge, the financial statements, and other financial information included in this Annual Report, fairly present in all material respects the financial condition, results of operations and cash flows of the Company as of, and for, the periods presented in this Annual Report.

4)    The Company's other certifying officer and I are responsible for establishing and maintaining disclosure controls and procedures (as defined in Exchange Act Rules 13a-15(e) and 15d-15(e)) and internal control over financial reporting (as defined in Exchange Act Rules 13a-15(f) and 15d-15(f)) for the Company and have:

a)    Designed such disclosure controls and procedures, or caused such disclosure controls and procedures to be designed under our supervision, to ensure that material information relating to the Company, including its consolidated subsidiaries, is made known to us by others within those entities, particularly during the period in which this Annual Report is being prepared;

b)    Designed such internal control over financial reporting, or caused such internal control over financial reporting to be designed under our supervision, to provide reasonable assurance regarding the reliability of financial reporting and the preparation of financial statements for external purposes in accordance with generally accepted accounting principles;

c)    Evaluated the effectiveness of the Company's disclosure controls and procedures and presented in this Annual Report our conclusions about the effectiveness of the disclosure controls and procedures, as of the end of the period covered by this Annual Report based on such evaluation; and

d)    Disclosed in this Annual Report any change in the Company's internal control over financial reporting that occurred during the period covered by this Annual Report that has materially affected, or is reasonably likely to materially affect, the Company's internal control over financial reporting.

5)    The Company's other certifying officer and I have disclosed, based on our most recent evaluation of internal control over financial reporting, to the Company's auditors and the audit committee of the Company's board of directors (or persons performing the equivalent functions):

a)    All significant deficiencies and material weaknesses in the design or operation of internal control over financial reporting which are reasonably likely to adversely affect the Company's ability to record, process, summarize and report financial information; and

b)    Any fraud, whether or not material, that involves management or other employees who have a significant role in the Company's internal control over financial reporting.

Date:    October 02, 2026

/s/ Daniel Johannes Pretorius
Daniel Johannes Pretorius
Chief Executive Officer


Exhibit 12.2
CERTIFICATION

I, Henriette Hooijer, certify that:

1)    I have reviewed this Annual Report on Form 20-F of DRDGOLD Limited.

2)    Based on my knowledge, this Annual Report does not contain any untrue statement of a material fact or omit to state a material fact necessary to make the statements made, in light of the circumstances under which such statements were made, not misleading with respect to the period covered by this Annual Report.

3)    Based on my knowledge, the financial statements, and other financial information included in this Annual Report, fairly present in all material respects the financial condition, results of operations and cash flows of the Company as of, and for, the periods presented in this Annual Report.

4)    The Company's other certifying officer and I are responsible for establishing and maintaining disclosure controls and procedures (as defined in Exchange Act Rules 13a-15(e) and 15d-15(e)) and internal control over financial reporting (as defined in Exchange Act Rules 13a-15(f) and 15d-15(f)) for the Company and have:

a)    Designed such disclosure controls and procedures, or caused such disclosure controls and procedures to be designed under our supervision, to ensure that material information relating to the Company, including its consolidated subsidiaries, is made known to us by others within those entities, particularly during the period in which this Annual Report is being prepared;

b)    Designed such internal control over financial reporting, or caused such internal control over financial reporting to be designed under our supervision, to provide reasonable assurance regarding the reliability of financial reporting and the preparation of financial statements for external purposes in accordance with generally accepted accounting principles;

c)    Evaluated the effectiveness of the Company's disclosure controls and procedures and presented in this Annual Report our conclusions about the effectiveness of the disclosure controls and procedures, as of the end of the period covered by this Annual Report based on such evaluation; and

d)    Disclosed in this Annual Report any change in the Company's internal control over financial reporting that occurred during the period covered by this Annual Report that has materially affected, or is reasonably likely to materially affect, the Company's internal control over financial reporting.

5)    The Company's other certifying officer and I have disclosed, based on our most recent evaluation of internal control over financial reporting, to the Company's auditors and the audit committee of the Company's board of directors (or persons performing the equivalent functions):

a)    All significant deficiencies and material weaknesses in the design or operation of internal control over financial reporting which are reasonably likely to adversely affect the Company's ability to record, process, summarize and report financial information; and

b)    Any fraud, whether or not material, that involves management or other employees who have a significant role in the Company's internal control over financial reporting.

Date:    October 2, 2026

/s/ Henriette Hooijer
Henriette Hooijer
Chief Financial Officer


    Exhibit 13.1

CERTIFICATION PURSUANT TO 18 U.S.C. SECTION 1350, AS ADOPTED PURSUANT TO SECTION 906 OF THE SARBANES-OXLEY ACT OF 2002


In connection with the Annual Report on Form 20-F of DRDGOLD Limited (the "Company") for the fiscal year ended June 30, 2026, as filed with the Securities and Exchange Commission on the date hereof (the "Report"), Daniel Johannes Pretorius, as Chief Executive Officer of the Company, hereby certifies, pursuant to 18 U.S.C. Section 1350, as adopted pursuant to Section 906 of the Sarbanes-Oxley Act 2002, that, to the best of his knowledge:
(1)the Report fully complies with the requirements of Section 13(a) or 15(d) of the Securities Exchange Act of 1934; and
(2)the information contained in the Report fairly presents, in all material respects, the financial condition and results of operations of the Company.

/s/ Daniel Johannes Pretorius
By:    Daniel Johannes Pretorius
Title:    Chief Executive Officer
Date:    October 02, 2026


    Exhibit 13.2

CERTIFICATION PURSUANT TO 18 U.S.C. SECTION 1350, AS ADOPTED PURSUANT TO SECTION 906 OF THE SARBANES-OXLEY ACT OF 2002


In connection with the Annual Report on Form 20-F of DRDGOLD Limited (the "Company") for the fiscal year ended June 30, 2026, as filed with the Securities and Exchange Commission on the date hereof (the "Report"), Henriette Hooijer, as Chief Financial Officer of the Company, hereby certifies, pursuant to 18 U.S.C. Section 1350, as adopted pursuant to Section 906 of the Sarbanes-Oxley Act 2002, that, to the best of her knowledge:
(1)the Report fully complies with the requirements of Section 13(a) or 15(d) of the Securities Exchange Act of 1934; and
(2)the information contained in the Report fairly presents, in all material respects, the financial condition and results of operations of the Company.

/s/ Henriette Hooijer
By:    Henriette Hooijer
Title:    Chief Financial Officer
Date:    October 2, 2026


MINERAL INDUSTRY ADVISORY Sound Mining International SA (Proprietary) Limited Directorate: Vaughn Duke, Nicholas Weeks, Rochelle Blunden Sound Mining House, 2A Fifth Avenue, Rivonia, 2128, South Africa | Tel: +27 (0) 11 234 7152 | Reg No.: 2007/020184/07 soundmining.co.za TECHNICAL REPORT SUMMARY FAR WEST GOLD RECOVERIES (PROPRIETARY) LIMITED Prepared for: Far West Gold Recoveries (Proprietary) Limited, Cycad House, Building 17, Constantia Office Park, Cnr 14th Avenue and Hendrik Potgieter Road, Weltevredenpark, 1709 Document No.: PR/SMI/1684/26 Effective date: June 30, 2026 Document date: October 2, 2026 Exhibit 96.1 Far West Gold Recoveries (Proprietary) Limited Document No: PR/SMI/1684/26 2 Table of Contents 1. Executive Summary .............................................................................................................................................. 6 1.1. Introduction ...................................................................................................................................................... 6 1.2. History .............................................................................................................................................................. 9 1.3. Geological Setting .......................................................................................................................................... 10 1.4. Exploration ..................................................................................................................................................... 14 1.5. Metallurgical Testing ...................................................................................................................................... 15 1.6. Mineral Resource Estimation ......................................................................................................................... 15 1.7. Mineral Reserve Estimates ............................................................................................................................ 16 1.8. Mine Design and Mine Plan ........................................................................................................................... 17 1.9. Process and Recovery Methods .................................................................................................................... 19 1.10. Infrastructure .................................................................................................................................................. 19 1.11. Market Studies ............................................................................................................................................... 21 1.12. Environmental Permitting and Liability ........................................................................................................... 22 1.13. Capital Expenditure and Operating Costs ...................................................................................................... 23 1.14. Economic Assessment ................................................................................................................................... 24 1.15. Concluding Comments ................................................................................................................................... 27 2. Introduction ......................................................................................................................................................... 28 2.1. Corporate Structure and Compliance ............................................................................................................. 28 2.2. Purpose and Terms of Reference .................................................................................................................. 29 2.3. Qualified Persons Declaration and Qualifications .......................................................................................... 29 2.4. Units, Currencies and Survey Coordinate System ......................................................................................... 31 2.5. Political and Economic Climate ...................................................................................................................... 31 2.6. Minerals Industry ............................................................................................................................................ 31 3. Property Description ........................................................................................................................................... 33 3.1. Property Location ........................................................................................................................................... 33 3.2. Legal Tenure and Permitting .......................................................................................................................... 34 3.3. Material Agreements, Access and Surface Rights ......................................................................................... 34 3.3.1. Exchange Agreement ................................................................................................................................ 34 3.3.2. Use and Access Agreement ...................................................................................................................... 35 3.4. Permitting ....................................................................................................................................................... 35 3.4.1. Driefontein Operational Area ..................................................................................................................... 36 3.4.2. Kloof Operational Area .............................................................................................................................. 36 3.5. Water Use Licenses ....................................................................................................................................... 37 3.6. Other Permitting Requirements ...................................................................................................................... 37 3.7. Royalties ........................................................................................................................................................ 38 3.8. Liabilities ........................................................................................................................................................ 38 3.9. Concluding Comments ................................................................................................................................... 38 4. Accessibility, Climate, Local Resources, Infrastructure and Physiography ......................................................... 39 5. History ................................................................................................................................................................. 43 6. Geological Setting, Mineralization and Deposit ................................................................................................... 46 6.1. Regional Setting, Mineralization and Deposit ................................................................................................. 46 6.2. Local Geological Setting, Deposit and Mineralization .................................................................................... 48 6.3. Property Geology, Deposit and Mineralization ............................................................................................... 50 7. Exploration .......................................................................................................................................................... 53 7.1. Methods and Databases ................................................................................................................................ 53 7.2. Geophysical Characterization ........................................................................................................................ 53 7.3. Geo-hydrological Characterization ................................................................................................................. 53 7.4. Geotechnical Characterization ....................................................................................................................... 53 7.5. Surveying ....................................................................................................................................................... 53 7.6. Drilling ............................................................................................................................................................ 54 7.7. Exploration Budget ......................................................................................................................................... 55 8. Sample Preparation, Analysis and Security ........................................................................................................ 56 8.1. Sampling Method ........................................................................................................................................... 56 8.2. Sample Security ............................................................................................................................................. 57 8.3. Analytical Laboratories ................................................................................................................................... 57 8.4. Analytical Procedures .................................................................................................................................... 57 8.5. Bulk Density ................................................................................................................................................... 58 8.6. Concluding Comments ................................................................................................................................... 58 9. Data Verification .................................................................................................................................................. 59 9.1. Quality Assurance and Quality Control .......................................................................................................... 59 9.2. Independent Verification ................................................................................................................................ 59 10. Mineral Processing and Metallurgical Testing ..................................................................................................... 60 Far West Gold Recoveries (Proprietary) Limited Document No: PR/SMI/1684/26 3 10.1. Metallurgical Test Work .................................................................................................................................. 60 10.2. Recovery Optimization ................................................................................................................................... 61 10.3. Concluding Comments ................................................................................................................................... 62 11. Mineral Resource Estimates ............................................................................................................................... 63 11.1. Geological Models and Interpretation ............................................................................................................. 63 11.2. Estimation Methodology ................................................................................................................................. 63 11.3. Mineral Resource Classification ..................................................................................................................... 64 11.4. Mineral Resource Verification ........................................................................................................................ 65 11.5. Cross-sections and Grade Distribution ........................................................................................................... 66 11.6. Reasonable and Realistic Prospects for Economic Extraction ....................................................................... 74 11.7. Mineral Resource Estimation ......................................................................................................................... 74 11.8. Additional Mineral Resources......................................................................................................................... 75 11.9. Concluding Comments ................................................................................................................................... 75 12. Mineral Reserve Estimates ................................................................................................................................. 76 12.1. Risk to the Mineral Reserve Estimate ............................................................................................................ 77 13. Mining Method .................................................................................................................................................... 79 13.1. Mining Plan and Layout .................................................................................................................................. 82 13.2. Modifying Factors and Mining Schedule ........................................................................................................ 82 13.3. Cut-off Grade ................................................................................................................................................. 84 13.4. Mining Contractor ........................................................................................................................................... 84 13.5. Concluding Comments ................................................................................................................................... 84 14. Process and Recovery Methods ......................................................................................................................... 86 14.1. Existing DP2 Processing Facility .................................................................................................................... 86 14.2. Expansion of DP2 .......................................................................................................................................... 88 14.3. Concluding Comments ................................................................................................................................... 90 15. Infrastructure ....................................................................................................................................................... 91 15.1. Tailings Deposition ......................................................................................................................................... 92 15.2. Regional Tailings Storage Facility Design ...................................................................................................... 93 15.2.1. Design Criteria and Basis of Design .......................................................................................................... 93 15.2.2. Facility Layout and Storage Configuration ................................................................................................. 95 15.2.3. Water Management and Environmental Controls ...................................................................................... 97 15.2.4. Construction Status and Implementation ................................................................................................... 98 15.3. Technical Studies - Water .............................................................................................................................. 98 15.3.1. Concluding Comments ............................................................................................................................ 100 15.4. Technical Studies - Power............................................................................................................................ 100 15.4.1. Concluding Comment .............................................................................................................................. 101 15.5. Technical Studies - Pipelines and Pumping ................................................................................................. 101 15.5.1. Concluding Comments ............................................................................................................................ 102 16. Gold Market ...................................................................................................................................................... 103 16.1. Gold Price Trends ........................................................................................................................................ 103 16.2. Exchange Rate Forecast .............................................................................................................................. 104 16.3. Global Demand ............................................................................................................................................ 105 16.4. Global Supply ............................................................................................................................................... 105 16.5. Concluding Comments ................................................................................................................................. 106 17. Environmental Studies, Permitting, or Agreements with Local Individuals or Groups ....................................... 107 17.1. Permitting Status .......................................................................................................................................... 107 17.1.1. The National Environmental Management Act ........................................................................................ 107 17.1.2. National Environmental Waste Management Act .................................................................................... 108 17.1.3. National Water Act .................................................................................................................................. 108 17.2. Environmental Considerations ..................................................................................................................... 109 17.3. Social and Political Considerations .............................................................................................................. 110 17.3.1. Discussions with Local Individuals or Groups .......................................................................................... 110 17.4. Environmental Closure Liability Estimate ..................................................................................................... 112 17.4.1. Basis of the Closure Liability Estimate .................................................................................................... 112 17.4.2. Quantum of the Closure Liability ............................................................................................................. 112 17.5. Concluding Comments ................................................................................................................................. 114 18. Capital and Operating Costs ............................................................................................................................. 115 18.1. Capital Expenditure ...................................................................................................................................... 115 18.2. Operating Costs ........................................................................................................................................... 117 18.3. Concluding Comments ................................................................................................................................. 117 19. Economic Assessment ...................................................................................................................................... 118 19.1. Revenue Forecast ........................................................................................................................................ 118 19.2. Cashflows..................................................................................................................................................... 119 19.3. Sensitivities .................................................................................................................................................. 120 Far West Gold Recoveries (Proprietary) Limited Document No: PR/SMI/1684/26 4 19.4. Concluding Comments ................................................................................................................................. 121 20. Adjacent Properties ........................................................................................................................................... 122 21. Other Relevant Data and Information ............................................................................................................... 123 21.1. South African Minerals Policy and Legislative Framework ........................................................................... 123 21.1.1. South African Legislative Framework ...................................................................................................... 124 21.2. Changes to South African Minerals Policy and Legislative Framework ........................................................ 127 21.2.1. Requirement of a Mining Right ................................................................................................................ 127 21.2.2. BEE and Transformation Regime ............................................................................................................ 128 21.2.3. Beneficiation ............................................................................................................................................ 128 22. Interpretations and Conclusions........................................................................................................................ 129 23. References ....................................................................................................................................................... 130 24. Reliance on Information Provided by the Registrant ......................................................................................... 139 25. Qualified Persons Disclosure Consent .............................................................................................................. 140 25.1. Date and Signature Page ............................................................................................................................. 141 Appendix A: Cashflow Model .......................................................................................................................................... 142 List of Figures Figure 1: DRDGOLD Corporate Structure ......................................................................................................................... 29 Figure 2: Location of the FWGR Operations ..................................................................................................................... 33 Figure 3: FWGR Operations .............................................................................................................................................. 34 Figure 4: Sibanye Gold Mining Rights ............................................................................................................................... 36 Figure 5: Topography of Southern Africa .......................................................................................................................... 39 Figure 6: Topography Map of FWGR ................................................................................................................................ 40 Figure 7: Climate and Rainfall of South Africa ................................................................................................................... 41 Figure 8: Vegetation of South Africa ................................................................................................................................. 42 Figure 9: Regional Geological Setting of the Witwatersrand Supergroup ......................................................................... 47 Figure 10: Geology of the Witwatersrand Basin ................................................................................................................ 48 Figure 11: Witwatersrand Supergroup Stratigraphic Section ............................................................................................. 49 Figure 12: Property Geology ............................................................................................................................................. 52 Figure 13: Cross-Sections and Grade Distribution - Driefontein 5 TSF ............................................................................. 67 Figure 14: Cross-Sections and Grade Distribution - Driefontein 3 TSF ............................................................................. 68 Figure 15: Cross-Sections and Grade Distribution - Kloof 1 TSF ...................................................................................... 69 Figure 16: Cross-Sections and Grade Distribution - Kloof 2 TSF ...................................................................................... 70 Figure 17: Cross-Sections and Grade Distribution - Libanon TSF .................................................................................... 71 Figure 18: Cross-Sections and Grade Distribution - Venterspost North TSF .................................................................... 72 Figure 19: Cross-Sections and Grade Distributions - Venterspost South TSF .................................................................. 73 Figure 20: Mining Methodology ......................................................................................................................................... 80 Figure 21: Mining Widths................................................................................................................................................... 80 Figure 22: Mining Sequencing ........................................................................................................................................... 82 Figure 23: DP2 Block Plan ................................................................................................................................................ 88 Figure 24: Driefontein 4 TSF Location and Infrastructure ................................................................................................. 91 Figure 25: RTSF Footprint ................................................................................................................................................. 96 Figure 26: TSF Location, Make-up Water Shafts, Processing Plants and Pipeline Layouts ............................................. 99 List of Tables Table 1: Personal Inspection ............................................................................................................................................. 31 Table 2: Historical Development of FWGR ........................................................................................................................ 44 Table 3: Dry Densities used by Other Re-treatment Companies for the Witwatersrand Operations ................................. 58 Table 4: Full Diagnostic Leach Results on Un-milled Feed Samples ................................................................................ 60 Table 5: Driefontein 5 TSF Feed Sample Assay by Size................................................................................................... 60 Table 6: Driefontein 3 TSF Feed Sample Assay by Size................................................................................................... 61 Table 7: Summary of Process Recovery Potential ............................................................................................................ 61 Table 8: Data Interrogated per TSF .................................................................................................................................. 65 Table 9: Variogram Parameters ........................................................................................................................................ 66 Table 10: Measured Mineral Resource Estimate Inclusive of Mineral Reserves for FWGR as at June 30, 2026 ............. 75 Table 11: S-K 1300 Compliant Mineral Reserve Estimate as at June 30, 2026 ................................................................ 76 Table 12: Scheduled RoM Production ............................................................................................................................... 83 Table 13: Calculated Cut-off Grades ................................................................................................................................. 84 Table 14: Mining Equipment Planned for each TSF .......................................................................................................... 84 Table 15: RTSF Design Basis Summary ........................................................................................................................... 94 Table 16: Underground Water Sources ............................................................................................................................. 99 Table 17: Power Requirements for FWGR Operations ................................................................................................... 100 Table 18: Eskom Points of Delivery ................................................................................................................................ 101


Far West Gold Recoveries (Proprietary) Limited Document No: PR/SMI/1684/26 5 Table 19: Existing Pipeline and Pumping Infrastructure .................................................................................................. 102 Table 20: Additional Pipeline and Pumping Infrastructure ............................................................................................... 102 Table 21: Above Ground Gold Stocks in 2025 ................................................................................................................ 103 Table 22: Long Term Consensus Forecasts in Nominal Terms ...................................................................................... 104 Table 23: Global Gold Production ................................................................................................................................... 105 Table 24: Required Environmental Legislation and the Status for the Driefontein Mining Area ...................................... 108 Table 25: Activities for Phase 2 Requiring a Waste Management License (WML) .......................................................... 108 Table 26: Current Closure Cost Estimates for FWGR ..................................................................................................... 113 Table 27: Capital Expenditure Estimate as at June 30, 2026 .......................................................................................... 115 Table 28: Implementation Progress post 2023 ................................................................................................................ 116 Table 29: Operating Cost Estimate as at June 30, 2026 ................................................................................................. 117 Table 30: Economic Assumptions ................................................................................................................................... 118 Table 31: Sensitivity of Post-tax NPV .............................................................................................................................. 120 Table 32: Sensitivity of Gold Price .................................................................................................................................. 120 Table 33: Sensitivity of the Discount Rate ....................................................................................................................... 121 Table 34: Impact of UFR Inclusion .................................................................................................................................. 121 Table 35: TRS Data and Information Sources ................................................................................................................. 130 Table 36: Glossary and Abbreviations............................................................................................................................. 132 Table 37: QP Area of Responsibility and Disclosure Consent ......................................................................................... 140 List of Graphs Graph 1: LoM Production Forecast ................................................................................................................................... 83 Graph 2: Actual Production of DP2 for FY2020 to FY2026 ............................................................................................... 86 Graph 3: Actual Plant Recovery for DP2 versus Forecast Recovery for FY2020 to FY2026 ............................................ 87 Graph 4: Gold Price Historical Trendline ......................................................................................................................... 103 Graph 5: Exchange Rate Historical Trendline ................................................................................................................. 104 Graph 6: Global Gold Demand from 2015 to 2025 .......................................................................................................... 105 Graph 7: Global Gold Supply from 2015 to 2025 ............................................................................................................ 106 Graph 8: Capital Expenditure Forecast ........................................................................................................................... 116 Graph 9: Operating Cost Forecast .................................................................................................................................. 117 Graph 10: Gold Sales Forecast ....................................................................................................................................... 119 Graph 11: Post-Tax Discounted Cashflows..................................................................................................................... 119 Graph 12: Sensitivity to Expected Revenue and Costs ................................................................................................... 120 List of Photographs Photograph 1: Monitor Gun ............................................................................................................................................... 79 Photograph 2: Monitor Gun in Operation ........................................................................................................................... 81 Far West Gold Recoveries (Proprietary) Limited Document No: PR/SMI/1684/26 6 1. EXECUTIVE SUMMARY 1.1. Introduction DRDGOLD Limited (DRDGOLD), which has a primary listing on the Johannesburg Stock Exchange (JSE) and a secondary listing on the New York Stock Exchange (NYSE), is an established gold tailings retreatment company located near Johannesburg, South Africa. The company’s business is to profitably reclaim tailings from dormant surface Tailings Storage Facilities (TSFs). DRDGOLD has arranged its operations into two wholly owned entities covering their East Rand (east of Johannesburg) and far West Rand (far west of Johannesburg) businesses. The East Rand operations are run by Ergo Mining (Proprietary) Limited (Ergo) and the West Rand operations by Far West Gold Recoveries (Proprietary) Limited (FWGR). FWGR currently owns seven TSFs on the West Rand between Roodepoort and Carletonville, approximately 70km southwest of Johannesburg (Figure A). There are an additional three TSFs which are to be transferred from Sibanye Gold (Proprietary) Limited (Sibanye Gold) to FWGR once no longer required by the existing operations (Available TSFs). Numerous other TSFs are potentially available in the area for future reclamation (Target TSFs). Figure A: Location of the FWGR Operations Source: Sound Mining, 2023 This Technical Report Summary (TRS) was prepared by Sound Mining International SA (Proprietary) Limited (Sound Mining) for DRDGOLD as the registrant. It was compiled by Qualified Persons (QPs) in line with the Securities and Exchange Commission (SEC) requirements, Regulation S-K 1300. It presents the Mineral Resources and Mineral Reserves of FWGR as at June 30, 2026. Far West Gold Recoveries (Proprietary) Limited Document No: PR/SMI/1684/26 7 The QP has relied on information provided by FWGR with respect to legal matters (Item 3), environmental or social and labor planning aspects (Item 17) and economic assumptions (Item 19). The qualified persons, Mr. Nicholas Weeks (Mineral Resources), Mr. Vaughn Duke (Mineral Reserves) and Mr. Willem de Frey (Environmental, Social and Governance) have reviewed the exploration database; the geological block models; the processing plant design and costing; mine plans, production scheduling, infrastructure; legal tenure, permitting, environmental and social compliance status and the latest assessment of the environmental rehabilitation liabilities required for eventual closure of the operation. The information was used to substantiate confidence in the Mineral Resource and Mineral Reserve estimates and then incorporated into a Discounted Cashflow (DCF) Model for an economic assessment of the viability of the Mineral Reserves. The assets held by FWGR were acquired from Sibanye Gold, a subsidiary of Sibanye Stillwater Limited (Sibanye- Stillwater), in a transaction which was concluded in July 2018 in which common law ownership was established over various TSFs containing the Mineral Resources and Mineral Reserves. FWGR conducts its activities inter alia in accordance with Environmental Approvals and the provisions of the Mine Health and Safety regulations. A Use and Access Agreement with Sibanye Gold articulates the various rights, permits and licenses held by Sibanye Gold in terms of which FWGR operates, pending the transfer to FWGR of those that are transferable. The FWGR operations are presented in Table A. Table A: FWGR Assets Asset Type Asset Location TSFs Driefontein 3 Driefontein Mining Right area Driefontein 5 Kloof 1 Kloof Mining Right area Libanon Venterspost North Venterspost South Kloof 2 Depositional TSF Driefontein 4 Northeast of Driefontein Mining Right area Land for Phase 2 RTSF and Land Southeast of the Kloof Mining Right area; Located on: Farm Cardoville 647IQ; Re Ptn 6 Farm Cardoville 364 IQ; Ptn 8 of Ptn 6 of Farm Cardoville 364IQ; Ptn 13 of Ptn1 of Farm Cardoville IQ; Ptn 50 Farm Kalbasfontein 365IQ; Re Ptn 3 Farm Cardoville 364; Re Ptn 5 of Ptn 3 Farm Cardoville 364IQ; and Ptn 11 Farm Cardoville 364IQ Operating Surface Gold Processing Plants DP2 Located on: Farm Blyvooruitzicht 116IQ Portion (Ptn) 6; and Farm Driefontein 113IQ Remainder (Re) of Ptn 1 Pilot plant Located at: Driefontein 1 processing plant Access Rights Access to water from the Driefontein 10 shaft and Kloof 10 shaft, for the purposes of hydro-mining Located within the Driefontein and Kloof Mining Right areas Installation, supply, distribution and maintenance of power supply Driefontein 1 gold plant Located at Driefontein 1 processing plant Source: FWGR, 2026 Far West Gold Recoveries (Proprietary) Limited Document No: PR/SMI/1684/26 8 A review of the environmental permitting concluded that the necessary permitting requirements are in place or are being proactively addressed. Sufficient provision is included to address the rehabilitation liabilities associated with the above assets. The QPs are satisfied that FWGR has the legal right to reclaim and process the TSFs forming part of the operation. The operations are not subject to royalty payments. The initial phase of FWGR’s long-term growth strategy involved upgrading the Driefontein Plant 2 (DP2) to process tailings material from the hydro-mining of Driefontein 5 TSF at approximately 500ktpm. Phase 2 is planned to start in mid-2027, after the expansion of DP2 to a processing capacity of 1.2Mtpm. Current arisings will continue to report to the Driefontein 4 depositional TSF at 500ktpm until commissioning of a Regional Tailings Storage Facility (RTSF). Upon commencement of deposition to the RTSF, currently scheduled for mid-2027, deposition to the Driefontein 4 TSF will end. The RTSF will have sufficient storage capacity to also accommodate new arisings at a rate of 2.4Mtpm from the mining of available TSFs in the area well into the future. The operation’s infrastructure and current TSFs lie across two mining rights which stretch from Westonaria to Carletonville (Figure B). Figure B: FWGR Operations Source: Sound Mining, 2023 The TSFs are located at elevations between 1,570mamsl and 1,720mamsl in an area that is typical of a mature landscape with gentle rolling undulations and shallow sided river valleys. The area enjoys warm to hot, moist summers and cool dry winters with an average ambient temperature of 20°C. The operation experiences some 571mm of rain each year, with most of it occurring during summer in the form of thunderstorms. Most of the area


Far West Gold Recoveries (Proprietary) Limited Document No: PR/SMI/1684/26 9 comprises disturbed grazing land and minor crop production. The area is well serviced with schools, medical facilities, a rail network, power, water and other supporting infrastructure. Both tarred and gravel roads are used to commute between farms and mines, as well as to and from urban centers. 1.2. History Gold and uranium mining operations commenced in the late 1800s in the Witwatersrand Basin goldfields of South Africa and have resulted in the accumulation of substantial amounts of surface TSFs and other mine residues. The possible re-treatment of TSFs in the West Rand area has a long and complex history with Gold Fields Limited (Gold Fields), Rand Uranium Limited (Rand Uranium), Harmony Gold Mining Company Limited (Harmony), Gold One International Limited (Gold One) and Sibanye Gold completing a number of parallel, independent studies relating to the retreatment of these TSFs, with an approximate eighteen-year history of metallurgical test work. Prior to 2009, Gold Fields embarked on a project known as the West Wits Project (WWP) aimed at retreating several TSFs on its four mining complexes: Kloof, Driefontein, Venterspost and South Deep to recover gold, uranium and sulfur and storing the tailings on a new Central Tailings Storage Facility (CTSF). Similarly, Rand Uranium had embarked on the Cooke Uranium Project (CUP), which endeavored to treat the Cooke TSF for gold, uranium and sulfur. The two independent projects had similar operational and environmental mandates, within a 25km radius of each other. In 2009, Gold Fields and Rand Uranium evaluated the potential synergy of an integrated retreatment plan for TSFs located within the South Deep, Cooke, Kloof, Driefontein and Venterspost mining complexes. In 2012, Gold One acquired Rand Uranium and in the same year acquired the Ezulwini Mining Company (Proprietary) Limited (Ezulwini). During the same year Gold One revived the tailings retreatment project and Gold Fields entered into a joint venture (JV) partnership with Gold One to investigate the economic viability of concurrently reprocessing current arisings and historical tailings from a number of sites situated in the greater West Rand area. A scoping study was concluded in 2012. In early 2013, Gold Fields unbundled its Kloof and Driefontein Complex and Beatrix gold mines in the Free State Province to create a separate entity in Sibanye Gold and listed Sibanye Gold as a fully independent company on both the JSE and the NYSE stock exchanges. Subsequently, in October 2013, Sibanye Gold purchased the interest held by Gold One in Rand Uranium and Ezulwini. The Gold One assets, which became part of Sibanye Gold, included the Cooke operations (underground mining and surface reclamation operations) for gold and uranium production. This transaction gave Sibanye Gold control of a substantial portion of the surface mineral resources in the region. A Preliminary Feasibility Study (PFS) was completed in 2013 and confirmed that there is a significant opportunity to extract value from the surface Mineral Resources. Subsequently, a number of Definitive Feasibility Studies (DFSs) have been completed on various combinations of TSFs. Sibanye Gold’s TSF reclamation assets were housed in a special purpose vehicle (SPV) called West Rand Tailings Retreatment Project (WRTRP). In 2018, Sibanye Gold exchanged its SPV for an equity interest in DRDGOLD. The project was subsequently renamed FWGR and became wholly owned by DRDGOLD. In mid-2018, FWGR initiated Phase 1 of its reclamation operations, and has since reclaimed the bulk of the material from the first TSF in the Life-of-Mine (LoM) Plan. In 2023, FWGR commenced the execution of their Phase 2 project and started construction on the RTSF and expansion of the DP2 Plant. Far West Gold Recoveries (Proprietary) Limited Document No: PR/SMI/1684/26 10 In 2026, FWGR acquired the Kloof 2 TSF as a part of the exchange agreement. The transfer of the Kloof 2 TSF added approximately 67Mt to the FWGR Mineral Resource and Mineral Reserve and extended the estimated LoM by approximately four years. 1.3. Geological Setting The assets of FWGR are derived from the West Rand Goldfield of the gold-bearing, late Archaean (2.7Ga to 3.2Ga), Witwatersrand Supergroup (Witwatersrand Basin). The Witwatersrand Basin is a roughly oval-shaped sedimentary basin, filled with approximately 14,000m of sedimentary and subordinate volcanic units, of which only small portions outcrop to the south and west of Johannesburg (Figure C). Figure C: Regional Geological Setting of the Witwatersrand Supergroup Source: Sound Mining, 2023 Far West Gold Recoveries (Proprietary) Limited Document No: PR/SMI/1684/26 11 The basin hosts vast auriferous and uraniferous deposits which have been grouped into geographically distinct sub- basins or goldfields, which are separated by stratigraphy where no economic mineralization has been discovered (Figure D). Figure D: Local Geological Setting Source: Sound Mining, 2023 Recent studies consider the deposition in the Witwatersrand sediments to have taken place along the interface between a fluvial system and a major body of still water or an inland sea. Specifically, this body of water is considered to be a retro-arc-foreland basin which formed in response to crustal thickening on the northern edge of the Kaapvaal Craton, during a collision with the Zimbabwe Craton to the north. Far West Gold Recoveries (Proprietary) Limited Document No: PR/SMI/1684/26 12 The varying stratigraphic position of the narrow, 0.1m to 2.0m thick quartz-pebble conglomerate reefs are interpreted to represent major, diachronous, entry points of coarse-grained sediment into the basin. Complex patterns of syn-depositional faulting and folding have caused significant variations in sediment thickness and sub- vertical to over-folded reef structures are characteristic of the basin margins. Later faulting and folding of the sequence determined which parts of the Witwatersrand Basin remained buried, as well as the depth extent of mineable horizons, relative to the present-day surface. The TSFs to be reclaimed are located in the Western Witwatersrand Basin, within the West Rand and Carletonville goldfields. The TSFs contain the processed waste from the mining of auriferous and uraniferous ores from Driefontein, Kloof, Libanon and Venterspost underground mining operations. The mining operations have targeted different reefs and as a result the TSFs have developed from the following: • the Driefontein TSFs comprise primarily processed VCR, CLR and Middelvlei Reef; • the Kloof TSFs comprise primarily processed VCR, Middelvlei Reef and to a lesser extent the Kloof Reef; • the Venterspost TSFs comprise primarily processed Middelvlei Reef and VCR; and • the Libanon TSFs comprises material from the VCR, Libanon Reef, Kloof Reef and Middelvlei Reef.


Far West Gold Recoveries (Proprietary) Limited Document No: PR/SMI/1684/26 13 Figure E: Property Geology Source: Sound Mining, 2023 Far West Gold Recoveries (Proprietary) Limited Document No: PR/SMI/1684/26 14 These operations have exploited three primary reefs, namely the Ventersdorp Contact Reef (VCR) located at the top of the Central Rand Group, the Carbon Leader Reef (CLR) near the base of the Central Rand Group and the Middelvlei Reef, which stratigraphically occurs 50m to 75m above the Carbon Leader. Additional minor reefs including the Kloof, Elsburg, Kimberley and Libanon Reefs have also been exploited. The composition of a TSF depends on the geochemical make-up of the material being mined and the chemicals used in the extraction process. In addition to the internal structure, the TSF reflects the mining strategy and depositional methodologies employed at each operation. Variations in the density of tailings material is a critical factor in the accurate estimation of quantities as these factors can result in a considerable variation in gold content and distribution throughout a TSF where such variation has an impact on final recoveries and projected revenues for the operation. In addition, secondary processes such as metal re-mobilization, erosion, weathering, leaching and acid mine drainage can further affect the geochemical characteristics of a TSF. These processes tend to progress faster in a TSF compared to a primary ore body as weathering, erosion and oxidation are accelerated by the fine particle size of the material. Gold can undergo mobilization within the TSF with time and hence may exhibit areas of re-concentration and even be present in the sub-structure soil. Although exceptions occur, the TSFs generally show an increase in grade from top to bottom. 1.4. Exploration The extent, morphology and structure of a TSF require a relatively simple exploration program comprising: • surveys to determine physical dimensions and volumes; • auger and air-core drilling to facilitate sampling and mapping of the gold distribution; • metallurgical and flow sheet development test work; and • tailings toxicity tests and specific gravity determination. The QPs have concluded that the drilling programs are suitable for the type of deposits and that the drilling and sampling techniques are of a high standard, with sample contamination and losses kept to a minimum. The drilling and sampling programs have been conducted to industry standards, and the results are considered reliable and suitable for a Mineral Resource estimate. The analytical laboratories used in the exploration program are all ISO certified for gold analysis and all of them follow best practice principles of quality management. The Quality Assurance and Quality Control (QA/QC) of the field and laboratory verification procedures were independently audited and are considered appropriate. Full length samples were taken and are considered representative of the disseminated mineralization which has no orientation or structural control other than grade variations due to deposition variations and secondary remobilization of the gold. This gold distribution within the TSFs is adequately understood from the geological modeling. The Driefontein TSFs, Venterspost TSFs and Libanon TSF are located on Malmani Subgroup dolomites (Figure D) with the remainder located on non-dolomitic argillaceous and arenaceous sediments of the Timeball Hill and Hekpoort Formations. An independent density study by Geostrada concluded that basement lithology does not significantly impact the density of the tailings material. A dry bulk density of 1.42g/cm3 is applied for the Mineral Resource estimate, as per standard best practice. It is based on substantial empirical evidence and considered reliable. Far West Gold Recoveries (Proprietary) Limited Document No: PR/SMI/1684/26 15 1.5. Metallurgical Testing Test work has been performed on Driefontein 3 TSF, Libanon TSF, Kloof 1 TSF, Kloof 2 TSF and Venterspost North TSF. Less test work has been performed on the Venterspost South TSF. The metallurgical recovery originally assumed for the Driefontein 5 TSF was subsequently revised on the basis of actual recoveries recorded at DP2 during Phase 1. The QP is comfortable that the following processing recoveries are achievable for the respective TSFs (Table B). Table B: Summary of Process Recovery Potential TSF Recovery Process (%) Comment Driefontein 5 51.9% From actual recoveries Driefontein 3 51.5% From test work Kloof 1 50.5% Kloof 2 42.1% Libanon 47.2% Venterspost North 48.9% Venterspost South 57.6% Source: Sound Mining, 2026; and FWGR, 2026 Note: Above recoveries exclude UFR recoveries 1.6. Mineral Resource Estimation Sound Mining has independently reviewed the database, geological models, estimation methodology and classification criteria used for the Mineral Resource estimate and has concluded that the information is reliable with no material issues found that could affect the overall estimate. The exploration database is comprised of analytical data from reliable laboratory assays of samples obtained from sampling and drilling programs based on industry best practice. The drillhole grid spacing is comparatively close for typical TSF drilling programs, and the entire depth of each TSF was sampled. The data density is considered sufficient to ensure continuity of mineralization and structure and provides an adequate basis for estimation. The sampling for Driefontein 3 TSF was from 3.0m composite samples while those from all of the other TSFs were 1.5m in length. The end of the drillhole sample, where it contained footwall material, was separated into tailings and footwall material and treated separately by the laboratory. Ordinary Kriging was undertaken for the gold grade estimation which allows for testing of the accuracy and efficiency of the estimation (given the construction of the TSFs and potential gold remobilization). A spatial grade distribution was anticipated and since Kriging is based on modeling spatial variances within an orebody, it is considered a reliable and accurate methodology for the task. This classification is a function of the confidence of the asset tenure and the entire process from drilling, sampling, geological understanding and geostatistical relationships. The Mineral Resource estimates in Table C are all in the Measured category. Please note that if Mineral Resources were stated exclusive of Mineral Reserves, the figures would equate to zero. Far West Gold Recoveries (Proprietary) Limited Document No: PR/SMI/1684/26 16 Table C: Mineral Resource Estimate Inclusive of Mineral Reserves for FWGR as at June 30, 2026 TSF Volume ('000m3) Density (t/m3) Quantity (Mt) Grade (g/t) Content (t) Content (koz) Driefontein 5 179 1.42 0.25 0.54 0.14 4.45 Driefontein 3 22,586 1.42 32.07 0.47 15.21 489.08 Kloof 1 19,931 1.42 28.30 0.33 9.20 295.89 Kloof 2 47,438 1.42 67.36 0.24 16.29 523.69 Libanon 52,351 1.42 74.34 0.27 20.23 650.41 Venterspost North 38,954 1.42 55.32 0.27 15.16 487.26 Venterspost South 9,068 1.42 12.88 0.33 4.24 136.47 Total Mineral Resource Estimate 190,507 1.42 270.52 0.30 80.47 2,587.25 Source: Sound Mining, 2026 Notes: Apparent computational errors due to rounding These Mineral Resources are stated inclusive of Mineral Reserves Mineral Resources, if stated exclusive of Mineral Reserves, would equate to zero In situ Mineral Resource estimate reported according to S-K 1300 requirements The economic assessment provided in this TRS confirms reasonable prospects for eventual economic extraction No geological losses applied 1.7. Mineral Reserve Estimates A LoM plan and mining schedule was developed by FWGR as outlined in Item 13.2. The LoM plan was tested for economic viability in the DCF model which reveals positive cashflows through to the end of the LoM. The Mineral Reserves were prepared in accordance with the requirements of S-K 1300 (Table D). No mining losses or dilution are applied in determining the Mineral Reserve estimates because the TSFs are re-mined and re-processed in their entirety. All other modifying factors are captured in the mine design together with all of the associated technical aspects that inform the capital and operating cost estimates. The seven TSF assets convert to a total Mineral Reserve of 270.52Mt with a gold content of 80.47t.


Far West Gold Recoveries (Proprietary) Limited Document No: PR/SMI/1684/26 17 Table D: S-K 1300 Compliant Mineral Reserve Estimate as at June 30, 2026 TSF Volume ('000m3) Density (t/m3) Quantity (Mt) Grade (g/t) Content (t) Content (koz) Driefontein 5 179 1.42 0.25 0.54 0.14 4 Driefontein 3 22,586 1.42 32.07 0.47 15.21 489 Kloof 1 19,931 1.42 28.30 0.33 9.20 296 Kloof 2 47,438 1.42 67.36 0.24 16.29 524 Libanon 52,351 1.42 74.34 0.27 20.23 650 Venterspost North 38,954 1.42 55.32 0.27 15.16 488 Total Proved Mineral Reserve 181,439 1.42 257.64 0.30 76.23 2,451 Venterspost South 9,068 1.42 12.88 0.33 4.24 136 Total Probable Mineral Reserve 9,068 1.42 12.88 0.33 4.24 136 Total Mineral Reserve Estimate 190,507 1.42 270.52 0.30 80.47 2,587 Source: Sound Mining, 2026 Notes: Apparent computational errors due to rounding and are not considered significant Mineral Reserves are reported using a dry density of 1.42t/m3 and at the head grade on delivery to the plant The Mineral Reserves constitute the feed to the gold plants The Mineral Reserves are stated at a price of ZAR2,155,461/kg A cut-off grade of 0.14g/t is applicable to the FWGR LoM plan Although stated separately, the Mineral Resources are inclusive of Mineral Reserves Venterspost South TSF is classified as a Probable Mineral Reserve due to some uncertainty regarding the processing recovery Uranium has been excluded in the Mineral Reserve estimate as it is not being recovered by FWGR Grade and quantity measurements are reported in metric units (Mt) rounded to two decimal places The input studies are to a level of accuracy of –5%, +15% The Mineral Reserve estimates contained herein may be subject to legal, political, environmental or other risks that could materially affect the potential development of such Mineral Reserves 1.8. Mine Design and Mine Plan FWGR exploits TSFs through hydro-mining using high-pressure jets of water to dislodge tailings material or move sediment for transportation as a slurry to processing plants. The hydro-mining removes the tailings material from the top of a TSF to the natural ground level in 15m layers (Figure F). Figure F: Mining Methodology Source: Sound Mining, 2023 A safe bench height is dependent upon the stability of the material, which is influenced by the phreatic surface within a dump. The TSFs have been dormant for a number of years and so the phreatic surface is generally well below the surface Far West Gold Recoveries (Proprietary) Limited Document No: PR/SMI/1684/26 18 of the dumps. The drilling program to define the Mineral Resource did not encounter saturated zones or phreatic surfaces and so the risk of slope failure or liquefaction is low. Horizontal benches of 100m to 200m, inclusive of the face angles (45° to 50°), are created to maintain safe working distances between simultaneous operations at different bench elevations (Figure G). Figure G: Mining Widths Source: Sound Mining, 2023 All hydro-mining and the re-deposition of tailings are outsourced to competent and experienced service providers. The hydro-mining performance assumptions used for the LoM planning are based on the current reclamation operations where the method has been successfully “tried and tested”. The operating cost and capital expenditure assumptions are supported by actual operational figures rather than being only based on computations from “zero based” cost models or feasibility studies. Similarly, the equipment requirements, manning complements and necessary supporting infrastructure, in terms of water and power supply, are well understood by FWGR. There have been no untested technical assumptions made with regards to mining design criteria. The cost and maintenance of the mining equipment, and employees are paid for by the mining contractors. The pipeline and pumping design and associated capital expenditure estimate has been undertaken by independent specialists familiar with the mining operations. Specific mining schedules were developed for each TSF based on the grade distribution of the Mineral Resource block models. These schedules were integrated into a production plan that exhausts FWGR’s current Mineral Reserves (Graph A). Far West Gold Recoveries (Proprietary) Limited Document No: PR/SMI/1684/26 19 Graph A: LoM Production Forecast Source: Sound Mining, 2026 Sound Mining is satisfied that the LoM schedule is reasonable and appropriate for the operation. The hydraulic mining operation is not suited for selective mining, other than where broad sections of TSFs can be rejected, but the mine planning and scheduling has shown that this is unnecessary. No geotechnical constraints have been applied and hydrological aspects affecting the surface deposits are not significant to the operation. The mining contractor provides its own equipment (i.e., “mining units”), and so no provision has been made in the initial capital estimate for mining equipment. 1.9. Process and Recovery Methods Sound Mining is of the opinion that sufficient test work is available to support the metallurgical performance anticipated for the processing facilities. The LoM plan relies on the currently operating DP2 processing plant (~600ktpm) and an expansion thereof to 1,200ktpm. FWGR’s Phase 1 entailed a modification and refurbishment of the old DP2 plant to accommodate a nameplate throughput of 600ktpm. Based on bench-scale metallurgical test work, the QP has adopted a conservative UFR recovery of 10% for the economic assessment. This recovery represents the expected additional gold recovered from the CIL tailings stream through the implementation of the AZTEC UpFlow Reactor (UFR) technology and has been applied to material with a minimum tailings grade of 0.14 g/t. The 10% UFR recovery assumption has been included in the base case economic assessment, with the impact of lower and higher recovery outcomes evaluated through sensitivity analysis. A detailed design to double the throughput to 1.2Mtpm was prepared by external specialists with appropriate capital cost estimates. These were reviewed by Sound Mining and are considered to be appropriate and in-line with industry standards. 1.10. Infrastructure Sound Mining has inspected the existing infrastructure. The QP is of the opinion that this infrastructure has been correctly planned, properly installed, is fully functional, and well maintained. - 500 1 000 1 500 2 000 2 500 3 000 - 2 000 4 000 6 000 8 000 10 000 12 000 14 000 16 000 2 0 2 7 2 0 2 8 2 0 2 9 2 0 3 0 2 0 3 1 2 0 3 2 2 0 3 3 2 0 3 4 2 0 3 5 2 0 3 6 2 0 3 7 2 0 3 8 2 0 3 9 2 0 4 0 2 0 4 1 2 0 4 2 2 0 4 3 2 0 4 4 2 0 4 5 2 0 4 6 G o ld R e co v e re d ( k g ) T o n s ( M t) Driefontein No 5 TSF Driefontein No 3 TSF Libanon TSF Kloof 1 TSF Kloof 2 TSF Venterspost South TSF Venterspost North TSF Recovered Gold Far West Gold Recoveries (Proprietary) Limited Document No: PR/SMI/1684/26 20 Electricity is currently supplied from Eskom’s 132kV and 44kV grid to various Sibanye Gold owned gold mines in the vicinity of FWGR’s operations. The power requirement of FWGR remains within the current surplus capacity to the Driefontein, Kloof and Cooke mining complexes. Power supply remains a material risk to all mining operations in South Africa including FWGR’s operations. A closed water system has been designed to avoid having to treat water or having to discharge into surface water courses (Figure H). Figure H: TSF Location, Make-up Water Shafts, Processing Plants and Pipeline Layouts Source: Sound Mining, 2026 Water is pumped from underground workings at Kloof 10 shaft and Driefontein 10 shaft, and the consumption from these shafts will not exceed the pumping rates approved in the respective water use licenses (WULs). Water will also be reclaimed from the RTSF in due course and Sound Mining is satisfied that there will be more than enough water to meet the requirements of the operation as currently planned. The hydro-mining, reprocessing and re-deposition of tailings material requires a network of pipes. Slurry pipelines will be needed from the hydro-mining sites at the TSFs to DP2 and tailings pipelines from DP2 to the respective deposition facilities. High pressure water pipelines are necessary to supply the mining operations while separate low-pressure water


Far West Gold Recoveries (Proprietary) Limited Document No: PR/SMI/1684/26 21 pipes are needed for returning water to DP2 from water dams at the various TSFs. These have all been adequately designed and included in the LoM planning. A large regional tailings storage facility (RTSF) is being constructed to ensure adequate storage facilities for the long-term deposition of all tailings arising from FWGR operations. It is located on Transvaal Supergroup lithology (Figure D), to mitigate any risk of dolomite related sink holes. The design and cost estimate is for a storage capacity of 800Mt and a potential disposal rate of up to 2.4Mtpm. It will eventually cover an area of approximately 1,000ha with a final top surface area of around 600ha at a maximum height of 100m. The selected site of approximately 1,300ha is shown in Figure I. Figure I: RTSF Footprint Source: FWGR, 2026 The permitting for this site has been approved based on a design around a geomembrane barrier. New arisings will continue to be deposited on the Driefontein 4 TSF, until the RTSF is ready to receive new arisings. 1.11. Market Studies Gold is a precious metal, refined and sold as bullion on the international market. It is traded globally on financial markets almost continuously and traditionally used for jewelry, bartering or storing wealth. Aside from the gold holdings of central banks, current uses of gold include jewelry, private investment, dentistry, medicine and technology (Table E). Far West Gold Recoveries (Proprietary) Limited Document No: PR/SMI/1684/26 22 Table E: Above Ground Gold Stocks in 2025 Description Quantity (kt) Contribution (%) Jewelry 99.7 45.2 Private Investment 51.0 23.1 Bank Holdings 38.6 17.5 Other 31.4 14.2 Source: GoldHub, 2026 It is noted that all gold produced by DRDGOLD is sold directly to South African bullion banks at prevailing market prices denominated in South African Rand (ZAR). 1.12. Environmental Permitting and Liability A review of environmental status was undertaken by an independent environmental specialist. The authorizations required for the “listed activities” under NEMA, NEM: WA, NEM: AQA and NWA were reviewed in detail. EIA, EMPrs and environmental authorizations exist for the Kloof and Driefontein mining areas. Areas requiring amendments have been cited. Environmental permitting is underway and at an appropriate stage for the planned expansions. There is enough time for approval of amendment applications, and no fatal flaw exists from a compliance perspective. Some heritage and culturally significant areas have been identified, and these are accommodated in the construction plans. The activities of FWGR already contribute to the socio-economic environment on the West Rand. The operation contributes to the national GDP and provides long-term positive impacts in terms of employment, skills development, local procurement of goods and services, as well as local and regional economic development. The Social Impact Assessment notes that informal settlements in close proximity to the operation may pose a risk in terms of community stability. This has, however, improved through quarterly meetings facilitated by the FWGR Environmental Department. Sound Mining believes that these concerns can be managed. The closure liability is assessed annually to maintain environmental compliance. These constitute the quantum of the financial obligation and guarantees required by the Department of Mineral and Petroleum Resources (DMPR). They have been determined on both an “unscheduled” and “scheduled” basis. The unscheduled estimate is based on the costs of rehabilitating the TSFs in their present state without any mining activity having taken place. The disclosure to the DMPR and the quantum of financial guarantees required is based on the unscheduled estimate. The closure liability bank guarantees under Regulation 7 of the NEMA Financial Provision Regulations (2015) must ensure that the financial provision is, at any given time, equal to the sum of the actual costs of implementing the plans for a period of at least ten years forthwith (this includes the annual rehabilitation, final, decommissioning and closure plans). This figure is required to be updated annually and adjusted. In the case of the FWGR the annual updates will show reduced amounts as the tailing’s facilities decrease to only footprint rehabilitation. The scheduled estimate assumes that mining takes place and that the final rehabilitation will be confined to rehabilitation of the TSF footprints and the RTSF. Guardrisk has issued financial guarantees in favor of the DMPR of ZAR481.9 M. An amount of ZAR634.0 M is also invested in Guardrisk Cell Captive under a ring-fenced environmental rehabilitation policy. The financial guarantees and funds held with the Guardrisk Cell Captive (June 30, 2026) are sufficient to cover the 2026 estimated unscheduled liability of ZAR468.24 M as estimated for the operation. Far West Gold Recoveries (Proprietary) Limited Document No: PR/SMI/1684/26 23 1.13. Capital Expenditure and Operating Costs The capital and operating cost estimates used to examine the economic viability of the estimated Mineral Reserves were informed by current operations or appropriate study work, and where necessary, previous estimates have been appropriately inflated to June 2026 real terms. Sound Mining has included a 15% contingency on all costs to reflect a level of confidence between –5%, +15%. A Stay-in-Business (SiB) provision amounting to 2% of annual operating costs has been added to the capital forecast to cover maintenance and equipment replacement costs across the operation. The Guardrisk Cell Captive insurance policy exceeds the current environmental liability, and so no additional provision has been made in the capital estimate. Graph B presents the annual capital expenditure forecast for the operation. Graph B: Capital Expenditure Forecast Source: Sound Mining, 2026 The RTSF is scheduled to be ready in mid-2027, and the remaining capital expenditure is largely earmarked for piping and pumping infrastructure. The operating cost estimate (Table F) has been informed by the actual costs currently incurred by the operation. Economies of scale were taken into consideration for estimating the budget appropriate to an increase in throughput. Table F: Operating Cost Estimate as at June 30, 2026 Description Phase 1 (ZAR/t) Phase 2 (ZAR/t) Salaries and Wages 19.60 13.98 Contractors 15.28 10.76 Reagents 29.39 33.45 Other Engineering Stores 11.06 10.97 Electricity 22.16 40.46 Water 0.48 0.66 Machine Hire 4.18 2.29 Other 17.57 6.11 Other Corporate Costs 7.26 3.32 Contingency (15%) 19.05 18.30 Totals 146.02 140.32 Source: Sound Mining, 2026; and FWGR, 2026 - 500 1 000 1 500 2 000 2 500 2 0 2 7 2 0 2 8 2 0 2 9 2 0 3 0 2 0 3 1 2 0 3 2 2 0 3 3 2 0 3 4 2 0 3 5 2 0 3 6 2 0 3 7 2 0 3 8 2 0 3 9 2 0 4 0 2 0 4 1 2 0 4 2 C a p it a l E x p e n d it u re ( Z A R M ) Direct Capital Expenditure Indirect Capital Expenditure Capital Contingency Far West Gold Recoveries (Proprietary) Limited Document No: PR/SMI/1684/26 24 1.14. Economic Assessment A DCF modeling approach was adopted to examine the economic viability of the Mineral Reserves as stated. It was generated in June 2026 real South African Rand (ZAR) terms and is based on the revenue forecast, associated capital and operating cost forecasts. The DCF model assumes a 100% equity-based business. It does not consider the effect of working capital changes and relies on appropriate and reasonable economic assumptions (Table G). Table G: Inputs to the DCF Model Description Unit Quantum Key Terms Discount Rate % 10.9 SIB/Replacement Capital (% of Operating Costs) % 2 Company Tax % 33- (165 / (100*Operating Profit/Net Revenue)) Royalties % 0 Contingency % 15% Exchange Rate ZAR/USD 16.30 Price per Troy Ounce USD/oz 4,114 Price Per Kg ZAR/kg 2,155,461 Source: Sound Mining, 2026; and FWGR, 2026 The assets are part of the ongoing business of FWGR, which is not subject to the Mineral and Petroleum Resources Royalty Act, 2008 (Act No. 28 of 2008) and so the royalty formula for unrefined metals was not included in the revenue determination. The following processing recovery assumptions are supported by test work and current plant performance data: • 51.9% for Driefontein 5 TSF material; • 51.5% for Driefontein 3 TSF material; • 50.5% for Kloof 1 TSF material; • 42.1% for Kloof 2 TSF material; • 47.2% Libanon TSF material; • 48.9% for Venterspost North TSF material; and • 57.6% for Venterspost South TSF material. The revenue forecast relies on a real gold price of ZAR2,155,461/kg (i.e., USD4,114/oz at ZAR16.30/USD). Taxes would be determined using the gold mining tax formula with all unredeemed capital taken into account. These are applied to the material from the respective TSFs to compute the amount of gold sold. The expansion of DP2 facilitates an increase in gold sales over time (Graph C).


Far West Gold Recoveries (Proprietary) Limited Document No: PR/SMI/1684/26 25 Graph C: Gold Sales Forecast Source: Sound Mining, 2026 The operations could continue beyond 2046 if the available TSFs are eventually incorporated into the operation. At this stage, the economic assessment has only considered the depletion of the TSFs that comprise the current Mineral Reserves. The QP considers the inputs to the DCF model to constitute a level of accuracy of -5%, +15%. Graph D presents the post-tax cashflow for an operation that excludes the benefits that would eventually be derived from the available TSFs. Graph D: Post-tax Discounted Cashflows Source: Sound Mining, 2026 The cumulative post-tax cashflows over the LoM remain positive. When assuming a discount rate of 10.9% for the unleveraged operation, a Net Present Value (NPV) of ZAR15.97 billion is computed. - 500 1 000 1 500 2 000 2 500 3 000 2 0 2 7 2 0 2 8 2 0 2 9 2 0 3 0 2 0 3 1 2 0 3 2 2 0 3 3 2 0 3 4 2 0 3 5 2 0 3 6 2 0 3 7 2 0 3 8 2 0 3 9 2 0 4 0 2 0 4 1 2 0 4 2 2 0 4 3 2 0 4 4 2 0 4 5 2 0 4 6 G o ld S o ld ( k g ) - 5 000 10 000 15 000 20 000 25 000 30 000 35 000 40 000 - 500 1 000 1 500 2 000 2 500 3 000 3 500 2 0 2 7 2 0 2 8 2 0 2 9 2 0 3 0 2 0 3 1 2 0 3 2 2 0 3 3 2 0 3 4 2 0 3 5 2 0 3 6 2 0 3 7 2 0 3 8 2 0 3 9 2 0 4 0 2 0 4 1 2 0 4 2 2 0 4 3 2 0 4 4 2 0 4 5 2 0 4 6 2 0 4 7 Z A R M Free Cashflow After Tax Cumulative Free Cashflow After Tax Far West Gold Recoveries (Proprietary) Limited Document No: PR/SMI/1684/26 26 The achievability of the LoM plans, budgets and forecasts are subject to certain technical or economic risks and accordingly have been assessed against upside or downside changes of between -20% and +20%. The consequential potential impacts are presented in Table H and are illustrated graphically in Graph E. Table H: Sensitivity of Post-tax NPV Variance NPV10 (ZAR Billion) 80% 90% 100% 110% 120% Revenue 10.21 13.09 15.97 18.84 21.72 Capital Expenditure 18.10 17.03 15.97 14.90 13.83 Operating Costs 16.40 16.18 15.97 15.75 15.54 Source: Sound Mining, 2026 Graph E shows that changes to the revenue forecast will impact margins the most. Graph E: Revenue and Costs Sensitivity Source: Sound Mining, 2026 Table I shows the materiality of changes in the gold price. Table I: Sensitivity of Gold Price Gold Price ZAR/kg 800,000 1,200,000 1,600,000 2,000,000 2,100,000 2,300,000 NPV10 (ZAR Million) (3,563) 3,131 8,499 13,891 15,226 17,896 Source: Sound Mining, 2026 The operation is economically viable above a gold price of ZAR992,201/kg. The impact of changes to the operating cost forecast is materially less, and any variance in capital expenditure being relatively insensitive. As a final sensitivity, the QP has tested the impact of FWGR employing an Up-flow Reactor to improve on overall plant recoveries (Table J). Table J: Impact of UFR Inclusion UFR Recovery 0.0% 3.0% 6.0% 9.0% 12.0% 15.0% NPV10 (ZAR Billion) 13.63 14.33 15.03 15.73 16.43 17.13 Source: Sound Mining, 2026 - 5 000 10 000 15 000 20 000 25 000 80% 90% 100% 110% 120% N P V ( Z A R M ) Revenue Operating Costs Capital Expenditure Far West Gold Recoveries (Proprietary) Limited Document No: PR/SMI/1684/26 27 1.15. Concluding Comments The drilling, sampling, analytical processes and governance of the exploration programs are appropriate and in-line with industry best practice. They are considered to be of high confidence. The density used to determine quantities from volumes has been determined from both in situ measured values and empirical data and is considered reliable. The QPs conclude that the estimations are based on a suitable database of code compliant information. Despite the usual existence of environmental, political, social and infrastructural risks the QP’s are satisfied that the FWGR operation is a relatively low risk business in the context of the broader South African mining industry. FWGR’s legal tenure is underpinned by the amended EMPs and access and usage rights to exploit the moveable assets. The assets held by FWGR were acquired from Sibanye Gold (Proprietary) Limited, a subsidiary of Sibanye Stillwater Limited, in a transaction in which common law ownership was established over the various TSFs containing the Mineral Resources and Mineral Reserves. A Use and Access Agreement with Sibanye Gold articulates the various rights, permits and licenses held by Sibanye Gold in terms of which FWGR operates, pending the transfer to FWGR of those that are transferable. FWGR conducts its activities inter alia in accordance with Environmental Approvals (EAs) and the provisions of the Mine Health and Safety Act and regulations. The land on which the RTSF is being constructed has been secured by FWGR. TSFs constructed from the tailings of Witwatersrand gold mining operations have been successfully and economically exploited for several decades and the geotechnical and geometallurgical characteristics are well understood from experience and from test work on the FWGR assets themselves. Notwithstanding the risks identified herein, which can be managed, no material factors of a geotechnical or geometallurgical nature, for example, have been identified that would have a significant effect on the prospects for eventual economic extraction. The DP2 plant has performed in-line with expectations and the construction for its expansion to 1.2Mtpm is based on representative and adequate metallurgical test work. The mass balance for the plant is appropriate. Scrutiny of the LoM plan reveals that recoveries currently being achieved coincide with expectations from metallurgical test work and that the quantities and grades reported are consistent with forecasts from the Mineral Resource estimation. Historically achievable plant gold recoveries are expected to be realized from the expanded DP2 plant with gold recoveries being principally driven by the plant feed head grade. In addition, the UFR is expected to improve recoveries, however this improvement is still to be quantified though ongoing test work. New arisings will eventually be stored in the RTSF which will have excess capacity from both a depositional rate (2.4Mtpm) and final capacity perspective (800Mt). All the necessary infrastructure requirements have been reviewed and are considered appropriate. Sound Mining endorses the design for the RTSF. The estimated capital expenditure and operational costs are supported by actual operational data from the current operations and thus considered appropriate. The operation is robust, the Mineral Reserves are economically viable, and the QP considers the LoM plan to be sufficient for the Mineral Reserve estimate. Far West Gold Recoveries (Proprietary) Limited Document No: PR/SMI/1684/26 28 2. INTRODUCTION ITEM 2 - (I); (II); (III); (IV) AND (V) DRDGOLD Limited (DRDGOLD) is a tailings retreatment company located near Johannesburg, South Africa. It has a primary listing on the Johannesburg Stock Exchange (JSE) and a secondary listing on the New York Stock Exchange (NYSE). The DRDGOLD operations are comprised of two wholly owned entities covering their East Rand (east of Johannesburg) and far West Rand (far west of Johannesburg) businesses. The East Rand operations are run by Ergo Mining (Proprietary) Limited (Ergo) and the West Rand operations by Far West Gold Recoveries (Proprietary) Limited (FWGR). FWGR reclamation assets comprise seven Tailings Storage Facilities (TSFs) reclamation assets. There are numerous TSFs, owned by third parties, potentially available in the area for future reclamation (Available TSFs). This Technical Report Summary (TRS) was prepared for DRDGOLD as the registrant and presents the latest changes to the Mineral Resources and Mineral Reserves of FWGR. This submission is DRDGOLD’s third TRS filing and reflects updates to the Mineral Resources and Mineral Reserves of FWGR since the initial TRS filing on October 28, 2022. The update reflects the transfer of the Kloof 2 TSF to FWGR in December 2025, pursuant to the exchange agreement concluded between DRDGOLD and Sibanye Gold (Proprietary) Limited (Sibanye Gold). The TSF has added 67Mt to the FWGR’s Mineral Resources and Mineral Reserves and extended the estimated Life-of-Mine (LoM) by four years. FWGR’s Mineral Resources and Mineral Reserves are derived from seven TSFs and are 100% attributable to DRDGOLD (the registrant). The submission is to the Securities and Exchange Commission (SEC) and has been compiled to align with the requirements of Subpart 1300 of Regulation S-K under the U.S. Securities Exchange Act of 1934 (Regulation S-K) and Item 601(b)(96) of Regulation S-K (Item 601(b)(96)) (S-K 1300). FWGR is progressing with a phased approach to expanding the current operations: • Phase 1 is the current operation which involved upgrading the Driefontein Processing Plant 2 (DP2) to process tailings from the closest TSF at a planned throughput of around 500ktpm. This Phase was successfully commissioned and the operation reached steady state production in 2019; and • Phase 2 involves building additional processing capacity through the expansion of DP2 to a throughput of 1.2Mtpm. The ramp up in throughput is planned to take place over three months and is expected to be completed by the first quarter of FY2028. Current arisings will continue to report to the Driefontein 4 depositional TSF at 500ktpm until commissioning of a Regional Tailings Storage Facility (RTSF). Upon commencement of deposition to the RTSF, deposition to the Driefontein 4 TSF will end. The RTSF will have sufficient storage capacity to also accommodate new arisings at a rate of 2.4Mtpm from the mining of available TSFs in the area well into the future. Examples of these include Driefontein 1 TSF and Driefontein 2 TSF, which, once decommissioned, are to be transferred to FWGR from Sibanye Gold. 2.1. Corporate Structure and Compliance Figure 1 presents DRDGOLD’s corporate structure.


Far West Gold Recoveries (Proprietary) Limited Document No: PR/SMI/1684/26 29 Figure 1: DRDGOLD Corporate Structure Source: DRDGOLD, 2026 Sibanye Gold owns a 50.1% shareholding of DRDGOLD. Non-public ownership of DRDGOLD includes the shareholding of directors and prescribed officers of 0.1%. Such shareholding is classified as non-public. 2.2. Purpose and Terms of Reference FWGR commissioned Sound Mining International SA (Proprietary) Limited (Sound Mining) to compile a SEC S-K 1300 compliant TRS that describes the Mineral Resource and Mineral Reserve estimates as at June 30, 2026. The document date is October 2, 2026, and there are no material changes in the period between these dates. The Qualified Person (QP) has relied on information provided by FWGR for this purpose with respect to legal matters (Item 3), environmental or social and labor planning aspects (Item 17) and economic assumptions (Item 19). Sound Mining is an independent advisory company. The Terms of Reference (ToR) required an independent technical review of FWGR in order to identify factors of a technical and strategic nature that would influence the future viability of the Mineral Reserves. The review accords with the principles of open and transparent disclosure that are embodied in internationally accepted Codes for Corporate Governance. It has been based upon technical information supplied by FWGR and its appointed consultants. The contractual agreement with FWGR, for the preparation of the TRS, was with Sound Mining and not with the QP as an individual. The QPs provide independent opinions and conclusions throughout this TRS. The estimation of Mineral Resources and Mineral Reserves is inherently subject to some level of uncertainty and inaccuracy, because they are based on analytical results of samples that commonly represent only a small portion of a mineral deposit. The uncertainty of the estimates, where material, are explained in this TRS and are reflected in the choice of Mineral Resource and Mineral Reserve categories. 2.3. Qualified Persons Declaration and Qualifications The signatories to this TRS are qualified to express their professional opinions on the technical aspects and value of the mineral assets described. The technical and economic information provided is correct to the best of the QPs’ knowledge, having followed best endeavors. Far West Gold Recoveries (Proprietary) Limited Document No: PR/SMI/1684/26 30 The QPs responsible for this TRS and the Mineral Resource and Mineral Reserves as stated are: • Mr. V Duke is the designated QP responsible for the compilation and reporting of FWGR’s Mineral Reserves. He holds a B.Sc. Mining Engineering (Hons.) and is registered with the Engineering Council of South Africa (ECSA) (No. 940314) and is a Fellow of the Southern African Institute of Mining and Metallurgy (FSAIMM) (Membership No.: 37179). Mr. Duke has over 41 years' experience in the minerals industry and has sufficient experience that is relevant to the style of mineralization and type of deposit under consideration. The QP is recognized by ECSA located at Lake Office Park, 1st Floor, Waterview Corner Building, 2 Ernest Oppenheimer Avenue, Bruma, Johannesburg, South Africa; • Mr. N Weeks is the designated QP responsible for the compilation and reporting of FWGR’s Mineral Resources. Mr. Weeks who holds a B.Sc. (Hons.) in Geology, is registered with the South African Council for Natural Scientific Professions (Pr.Sci.Nat. No.: 155508), and the Geological Society of South Africa (GSSA) (Membership Number: 971184) located on the corner of Carlow Road and Rustenburg Road, Auckland Park, Johannesburg, South Africa. He is a principal geologist with over eight years' experience in mining, geology and consulting; and • Mr. W de Frey is the designated QP responsible for the interrogation and endorsement of the environmental and permitting requirements of FWGR. Mr. de Frey who holds a M.Sc. in Wildlife Management, is registered with the South African Council for Natural Scientific Professions (Pr.Sci.Nat. No.: 400100/02), and the Environmental Assessment Practitioners Association of South Africa (EAPASA) (Reg. No.: 2019/1842) located at 12B Centurus, Centuria Office Park, 265 Von Willich Avenue, Pretoria, Gauteng, South Africa. He is a consultant with more than thirty years’ experience in mining projects, environmental legal compliance, sustainability, construction and wildlife preservation. The QPs were assisted by the following specialists: • Mr. G. Bezuidenhout - Metallurgist; • Mr. G. de Swardt - RTSF; • Mr. T. O’Brien - Driefontein 4 TSF; • Mr. G. Ovens – Environmental and Permitting; • Mr. A. Twiggs – Exploration and Mineral Resource modeling; and • Mr. D. O'Callaghan – Exploration and Mineral Resource modeling. The QPs also relied on reports from: • DRA SA (Proprietary) Limited (DRA); • Aztec Mining Limited (Aztec); • Geo Tail (Proprietary) Limited (GTSA); and • Digby Wells Environmental (South Africa) (Proprietary) Limited (Digby Wells). Detailed references and sources of information and data contained in this TRS are presented in Item 23. The Sound Mining QPs and other specialists visited FWGR on several occasions from 2019 to 2026 and examined the operations as shown in Table 1. During the site visits, the infrastructure, TSFs, RTSF, and DP2 sites were inspected. Far West Gold Recoveries (Proprietary) Limited Document No: PR/SMI/1684/26 31 Table 1: Personal Inspection Professional Site Visit V. Duke Numerous Visits from 2019 to 2026 as a QP N. Weeks Numerous Visits from 2020 to 2026 as a QP G. Ovens Visited in 2026 G. Bezuidenhout Visited DP2 in 2026 A. Twiggs Visited Kloof 2 TSF and Driefontein 3 TSF in 2026 D. O'Callaghan Visited Kloof 2 TSF and Driefontein 3 TSF in 2026 Source: Sound Mining, 2026 2.4. Units, Currencies and Survey Coordinate System The economic assessment in this TRS has been carried out in South African Rands (ZAR). All other units used in this TRS are defined in the text or in the Glossary (Item 23). All references to tons are in metric tons; gold ounces (oz Au) are troy ounces (oz) and the conversion factor used for conversion to troy ounces is 31.10348. Unless explicitly stated, all units presented in this TRS are in the Système Internationale (SI) - i.e., metric tons (t), kilometers (km), meters (m), and centimeters (cm). Throughout the technical studies relating to the FWGR numerous acronyms have been used but for reporting purposes, the use of acronyms has been kept to a minimum, with the convention being definition of the acronym in the first usage. However, where required throughout the document the full term may be used for clarity and ease of reading. The coordinate system employed by the surface surveys at the operation is based on the Gauss Conform Projection (UTM), Hartebeeshoek 94 Datum, Ellipsoid WGS84, Central Meridian WG27. Some regional scale maps in this Technical Summary may be referenced with Latitude and Longitude coordinates for ease of reading. 2.5. Political and Economic Climate South Africa gained independence from Britain on May 31, 1961, and was declared a republic. From 1948 until 1990, the South African political and legal systems were based upon the concept of apartheid. South Africa became a constitutional democracy in 1994, and the first democratic elections brought an end to apartheid and ushered in majority rule under the African National Congress (ANC) political party, with a number of different political parties participating in the elections. South Africa continues to hold democratic, peaceful, free and fair elections. The most recent national and provincial elections were held on May 29, 2024. The ANC remained the largest political party but lost the outright parliamentary majority for the first time since 1994. Following the election, President Cyril Ramaphosa was re-elected for a second term and a Government of National Unity (GNU) was formed, which joined the ANC and a number of other political parties, including the Democratic Alliance (DA) and Inkatha Freedom Party (IFP), in a multi-party national executive. 2.6. Minerals Industry South Africa has a mature and well-established minerals industry developed from gold and diamond discoveries in the late 1800s. The country remains a globally significant producer of several commodities, ranking as the world’s largest producer of platinum group metals and chromium, and a major producer of manganese, coal, iron ore, vanadium and gold. The mining sector continues to play a critical role in the national economy, contributing approximately 6% to the GDP in recent years. GDP generated by the South African mining industry has averaged ZAR220 Billion per quarter between 1993 and 2026, reaching an all-time high of ZAR240 Billion in the fourth quarter of 2006, and a record low of ZAR147 Billion in the second quarter of 2020. One of the greatest challenges associated with the minerals and mining industry in South Africa is the political instability, concerns over the reliability of legal tenure, rising costs of labor, electricity, diesel and steel, among other costs. Labor and community unrest, driven by low wages, high unemployment, particularly among contract workers and under- resourced communities, and high crime levels, has proved problematic in recent years. These challenges can disrupt Far West Gold Recoveries (Proprietary) Limited Document No: PR/SMI/1684/26 32 mining operations, increase security and operational costs, and further exacerbate municipalities’ inability to provide adequate infrastructure and services to surrounding communities. Other important concerns for the mining industry are the effect of diseases (i.e., HIV/Aids and Covid-19) on the workforce, as well as historical and current pressures associated with South Africa’s sovereign rating. Although the South African political system remains established and broadly stable, recent political developments (formation of the GNU) have introduced a more complex and governance environment. The political risk index indicates that factors such as the country’s high degree of unionization, the potential for industrial action, persistent policy uncertainty (Item 21), and constraints related to infrastructure and economic performance continue to present risks to investors.


Far West Gold Recoveries (Proprietary) Limited Document No: PR/SMI/1684/26 33 3. PROPERTY DESCRIPTION ITEM 3 (I); (II); (III); (IV), (V) AND (VI) 3.1. Property Location The FWGR operations are located in the Gauteng province of South Africa, approximately 70km southwest of the city of Johannesburg (Figure 2). The operations can be accessed from Johannesburg by traveling for approximately one hour along tarred roads. The operations which are located between the latitudes and longitudes 26°32'34.90"S and 26°5'32.68"S, and 27°24'6.49"E and 27°49'4.84"E and cover an area of 29,577.62ha. Figure 2: Location of the FWGR Operations Source: Sound Mining, 2023 FWGR is located in an area with a long history of gold mining and as a consequence the region is disseminated with TSFs and supporting mining infrastructure. The operation’s infrastructure and current TSFs lie across two mining rights owned by Sibanye Gold which stretch from Westonaria to Carletonville (Figure 3). Far West Gold Recoveries (Proprietary) Limited Document No: PR/SMI/1684/26 34 Figure 3: FWGR Operations Source: Sound Mining, 2026 3.2. Legal Tenure and Permitting An independent environmental and permitting specialist has undertaken a review of the legal aspects of the assets. This review has been based on information provided by DRDGOLD and FWGR. DRDGOLD is a subsidiary of Sibanye Gold and FWGR operates within the extensive framework of legal tenure held by Sibanye Gold. 3.3. Material Agreements, Access and Surface Rights 3.3.1. Exchange Agreement Sibanye Gold and DRDGOLD signed an Exchange Agreement on November 22, 2017. The agreement contains terms in connection with FWGR which was established specifically to house the intended TSF reclamation activities. The agreement provided that Sibanye Gold initially obtained a 38.05% stake in DRDGOLD in exchange for the FWGR assets, with the option to increase it to 50.1% by way of a cash subscription. This option was exercised, and Sibanye Gold currently holds a 50.1% equity in DRDGOLD, meaning that Sibanye Gold is now the ultimate holding company of FWGR through its majority interest in DRDGOLD. In Exchange DRDGOLD is entitled to receive 3 TSFs, namely Driefontein 1, Driefontein 2 and Kloof 2 from Sibanye Gold when their depositional duties end. Accordingly, the Kloof 2 TSF has now transferred to FWGR in December 2025. Far West Gold Recoveries (Proprietary) Limited Document No: PR/SMI/1684/26 35 3.3.2. Use and Access Agreement A “Use and Access Agreement” signed in November 2017, grants FWGR the rights to following: • access to Kloof 10 shaft located in the Kloof Mining Right area and Driefontein 10 shaft located in the Driefontein Mining Right area for the purpose of pumping and supplying the required quantities of water to FWGR; • agreements for the installation, supply and distribution of power; • existing and proposed pipeline routes; • servitudes, wayleaves and surface right permits; and • access to the Driefontein 1 Gold Plant. The agreement stipulates that it will endure until the end of FWGR’s business and that FWGR is to give Sibanye Gold at least 18 months’ prior written notice of the anticipated end of life of the business. The surface rights agreements over both the Driefontein and Kloof Mining Rights (held by Sibanye Gold) for the TSFs and processing plant sites are adequate for the current Sibanye Gold operations and would therefore also be applicable to FWGR's operations. FWGR will secure servitudes for all of its infrastructure located on Sibanye Gold land. FWGR owns all the land on which the RTSF is being constructed, with the exception of two portions which are subject to a 99-year lease until such stage as the properties have been successfully subdivided and transferred to FWGR. FWGR has met the requirements of the Spatial Planning and Land Use Management Act, 2016 (Act No. 13 of 2016) (SPLUMA) and has successfully rezoned the land from agricultural use to that of mining. FWGR has submitted a Subdivision of Agricultural Land Act 70 of 1970 (SALA) application for the successful subdivision and consolidation of certain portions of land on which the RTSF is located. 3.4. Permitting The permitting associated with the different Mining Right (MR) areas (Figure 4) are commented below. The minerals in tailings fall outside the definition of ‘mineral’ in the Mineral and Petroleum Resources Development Act’ (MPRDA), where a MR as defined in this act is not a requirement, and the operations of FWGR are conducted in accordance with the Integrated Environmental Authorizations (IEAs) issued by the DMPR. In 2016, Sibanye Gold applied for IEAs for the West Rand Tailings Retreatment Project (WRTRP) following the applicable NEMA Environmental Impact Assessment (EIA) process, supported by the required specialist reports and Environmental Management Program reports (EMPrs). The IEAs were subsequently transferred to FWGR following approval of the transfer by the DMPR. As part of its expansion plans, FWGR will be required to make similar applications for appropriate IEAs. Far West Gold Recoveries (Proprietary) Limited Document No: PR/SMI/1684/26 36 Figure 4: Sibanye Gold Mining Rights Source: Sound Mining, 2026 3.4.1. Driefontein Operational Area The DMPR granted Sibanye Gold an EA under the 2014 EIA Regulations (GNR 983 and GNR 984) (the 2014 Regulations) on May 11, 2018. The approval is recorded in GP 30/5/1/2/3/2/1 (51) EM. This EA was transferred to FWGR in July 2023. Driefontein MR: a new order MR (GP 30/5/1/2/2/51MR) was issued in 2007 and is valid until January 2037 and covers 9,490.62ha. Sibanye Gold is entitled to mine all declared material situated within this MR and has all the necessary statutory requirements in place. 3.4.2. Kloof Operational Area In 2016, Sibanye Gold also applied for an IEA which includes a waste management license for Kloof to undertake various listed activities, which the DMPR equally granted on May 11, 2018. The grant is recorded under GP 30/5/1/2/3/2/1 (66) EM and the IEA remains valid until the end of LoM. This IEA was transferred to FWGR in January 2022. An IEA was granted to FWGR for the reclamation of the Libanon TSF GP30/5/1/1/2(000073) BP/BAR on July 15, 2026. Kloof MR: a new order MR (GP 30/5/1/2/2/66MR) issued in 2007, is valid until July 1, 2027, and covers 20,087ha. Sibanye Gold is entitled to mine all declared material falling within this MR and has all the necessary statutory requirements in place. Sibanye Gold is in the process of renewing the Kloof Mining Right in accordance with the provisions of the MPRDA.


Far West Gold Recoveries (Proprietary) Limited Document No: PR/SMI/1684/26 37 Two Section 102 amendments were submitted to extend the Driefontein and Kloof MR to include the Driefontein 4 TSF, Venterspost North, Venterspost South TSFs and RTSF. The Section 102 amendments were granted in 2018 and have been executed by Sibanye Gold in August of 2026. Neither Sibanye Gold nor FWGR are aware of any outstanding legal disputes that are applicable to FWGR as stated in the Exchange Agreement signed on November 22, 2017, and effective at the end of July 2018. To the best of Sibanye Gold’s and FWGR’s knowledge, no land claims exist over the relevant properties, and no outstanding legal disputes exist that could affect FWGR right to further develop the assets. To the best of Sound Mining’s legal specialist's knowledge, all statutory permits have either been approved or are in the process of being approved. In summary, the security of tenure for the FWGR is considered to be intact. The transfer of the TSFs by Sibanye Gold to FWGR involved the transfer of moveable assets; and therefore, are not subject to the transfer of the associated MRs to FWGR. In terms of the Exchange Agreement all risks and benefits of the business, passed from Sibanye Gold to FWGR including the rehabilitation liability of the TSFs. The portion of the Sibanye Gold’s rehabilitation trust fund related to these assets was transferred to an environmental trust fund. In 2022, these funds were subsequently transferred to a Guardrisk Cell Captive, under a ring-fenced environmental rehabilitation insurance policy for the sole use of the rehabilitation liability. The Kloof 2 TSF has been transferred to FWGR and falls within the Kloof MR, additionally, ZAR117 M will be transferred in terms of the agreement once all required regulatory approvals have been obtained. 3.5. Water Use Licenses Water Use Licenses (WULs) have been granted to FWGR in terms of Section 21 of the National Water Act, 1998 (Act No. 36 of 1998) (NWA) one over the Driefontein and Kloof mining areas on July 25, 2025, with Reference number: 10/C22B/ACFGI/4976. A further WUL has been issued for the reclamation of the Libanon TSF which was issued on July 25, 2026, with reference number:10/C23D/CGI/18789. The WUL's are valid for a period of 12 years from the date of issuance and thus expire on July 25, 2037, and July 25, 2038, respectively. FWGR is permitted to reclaim TSFs through hydraulic mining following which, retreatment takes place in and at the process plants. Makeup water comes from Driefontein’s underground works at Driefontein 10 shaft and from Kloof 10 shaft. The majority of the operational water requirements are supplied by process water returned from the active TSF. New tailings arisings from DP2 are disposed of on the Driefontein 4 TSF, until mid-2027. Thereafter, the commissioned RTSF will be the depositional facility. A return water dam will receive water from the RTSF where it will be pumped back to the reclamation sites for reuse in the reclamation operations. FWGR has opted for a closed water reticulation system to reduce its water consumption needs by recycling process water. The Dam Safety Regulations, under the NWA, require a Dam Safety License to be issued prior to the construction of the RTSF, which was obtained on March 14, 2024. 3.6. Other Permitting Requirements A Refinery License has been issued to FWGR by the South African Diamond and Precious Metals Regulator (SADPMR) to deal in unwrought precious metals. Far West Gold Recoveries (Proprietary) Limited Document No: PR/SMI/1684/26 38 FWGR is the holder of Certificates of Registration 281 (CoR) issued in July 2019, in terms of the National Nuclear Regulator (NNR) for Driefontein 3 TSF, Driefontein 4 TSF, Libanon TSF, Driefontein 5 TSF, Kloof 1 TSF, Kloof 2, Venterspost South TSF, Venterspost North TSF, DP2, Driefontein Plant 3 (DP3) and the RTSF. FWGR’s operations are governed by the Mine Health and Safety Act, 1996 (Act No. 29 of 1996) (MHSA). 3.7. Royalties Under the MPRDA, no Mineral Royalties are payable on the reprocessing of TSFs for gold. 3.8. Liabilities The Driefontein and Kloof EAs contain stipulative clauses as to what mitigatory and rehabilitative obligations exist and explicitly state that the rehabilitation requirements must be adhered to. Financial provision for remediation of environmental damage is stipulated in Section 24P of NEMA (Act No. 107 of 1998) (as amended). FWGR obtained a Closure Cost Assessment from Digby Wells in June 2026 which includes all FWGR’s assets. Currently, FWGR has sufficient rehabilitation guarantees and funds in place for all of its assets to satisfy the requirements under NEMA. The closure and rehabilitation liability for the operation is updated annually at the end of the financial year (FY). 3.9. Concluding Comments In terms of the Exchange Agreement all risks and benefits of the operation passed from Sibanye Gold to FWGR. In particular, the rehabilitation liability of the TSFs and associated infrastructure have been transferred to FWGR. The portion of the Sibanye Gold’s rehabilitation trust fund related to these assets has been transferred to the Guardrisk Cell Captive, under a ring-fenced environmental rehabilitation insurance policy for the sole use for environmental rehabilitation activities, with any shortfall covered by an insurance policy taken out by FWGR. The transfer of the rehabilitation funds for the Kloof 2 TSF from Sibanye Gold to FWGR remain pending, however FWGR has sufficient guarantees in place to cover environmental liabilities. FWGR owns the land on which the RTSF is being constructed. There are no significant factors or material risks to the access, title, or ability to perform work on the property. A consequence of the Use and Access Agreement is that there are no significant encumbrances to the property with regard to current and future permitting requirements. Outstanding permitting conditions are being proactively managed in line with the required timeframes (Item 17). FWGR has not been served with any fines for violations. The QP notes that the Dam Safety Regulations, under the NWA, require a Dam Safety License for the construction of the RTSF which was issued on March 14, 2024. Prior to the commencement of the RTSF, a license to impound is required as per the Dam Safety Regulations, as well as the engineering completion certificates and quality assurance reports submitted for approval to Department of Water and Sanitation (DWS). The existing and overarching WRTRP WUL has been successfully transferred to FWGR. As an administrative matter, an application has also been submitted for the transfer of water uses from the Driefontein WUL to FWGR. Approval of this application by the Department of Water Affairs and Sanitation is pending. This is not deemed a material risk to the ongoing operations. Far West Gold Recoveries (Proprietary) Limited Document No: PR/SMI/1684/26 39 4. ACCESSIBILITY, CLIMATE, LOCAL RESOURCES, INFRASTRUCTURE AND PHYSIOGRAPHY ITEM 4 (I); (II); (III) AND (IV) The FWGR operations are 70km west of Johannesburg from where they can be accessed by travelling for approximately one hour along tarred roads. The TSFs are located at elevations between 1,570mamsl and 1,720mamsl (Figure 5). Figure 5: Topography of Southern Africa Source: Sound Mining, 2023 The area which forms part of the South African inland plateau region is typical of a mature landscape with gentle rolling undulations and shallow sided river valleys as shown in the topographic map (Figure 6). 40 Far West Gold Recoveries (Proprietary) Limited Document No: PR/SMI/1684/26 Figure 6: Topography Map of FWGR Source: Sound Mining, 2026


41 Far West Gold Recoveries (Proprietary) Limited Document No: PR/SMI/1684/26 Climatically, the area is classified as a ‘moderate eastern plateau’ with well-defined seasons characterized by warm to hot, moist summers and cool dry winters, often accompanied by frost (Figure 7). Figure 7: Climate and Rainfall of South Africa Source: Sound Mining, 2023 The temperate climate has an average ambient temperature of 20°C with dry winters between May and July (0°C to 18°C) and wet, warm summers from September to March (0°C to 27°C). The daily mean temperatures in January and July are 21.2°C and 9.8°C respectively. The Randfontein area, on average, receives 571mm of rain per year, with most rainfall occurring during summer in the form of thunderstorms. The highest rainfall occurs in January (107mm) and the lowest in June (0mm) where the wet season occurs from November to April. With the exception of summer thunderstorms, the climatic conditions have little to no effect on the mining operations at FWGR where work is done at all times of the year and where there is no operating season. However, exceptionally high rainfall during the past two rainy seasons resulted in delays to construction activities at the RTSF. The vegetation of the region is typical savannah grassland (Figure 8) but most of the area comprises disturbed grazing land and minor crop production. The major land uses in the area include agriculture in the form of maize and soya production as well as livestock grazing, formal and informal residential, mining and business uses. 42 Far West Gold Recoveries (Proprietary) Limited Document No: PR/SMI/1684/26 Figure 8: Vegetation of South Africa Source: Sound Mining, 2023 The area developed on the back of gold mining and is now well serviced with schools, suburbs, medical facilities, a rail network and other supporting infrastructure. The operation lies across the Rand West City and Merafong City Local Municipalities, which provide potable water. Eskom Holdings SOC Ltd (Eskom), the national electricity supplier in South Africa, supplies electricity to the operation (see Item 15). Infrastructure includes formal and informal dwellings, buildings, commercial farming infrastructure, roadside shops, privately owned infrastructure such as access roads, boreholes and dams, public infrastructure (roads and transmission lines) and mine accommodation. Personnel and supplies, from the surrounding areas, make use of both tarred and gravel roads connecting farms, mines and urban centers such as Carletonville and Fochville. 43 Far West Gold Recoveries (Proprietary) Limited Document No: PR/SMI/1684/26 5. HISTORY ITEM 5 (I) AND (II) Gold and uranium mining operations commenced in the late 1800s in the Witwatersrand Basin goldfields of South Africa and have resulted in the accumulation of substantial amounts of surface tailings and other mine residues. The possible re-treatment of TSFs in the West Rand area has a long and complex history with Gold Fields Limited (Gold Fields), Rand Uranium Limited (Rand Uranium), Harmony Gold Mining Company Limited (Harmony), Gold One International Limited (Gold One) and Sibanye Gold completing a number of parallel, independent studies relating to the retreatment of these TSFs. There is an approximate eighteen-year history of metallurgical test work and process design which has been undertaken for a variety of combinations of assets and products recovered, as summarized in Table 2. Whilst these historical studies were for specific combinations of assets, they are not all relevant to FWGR in its current form. Prior to 2009, Gold Fields embarked on a project known as the West Wits Project (WWP) aimed at retreating several TSFs on its four mining complexes: Kloof, Driefontein, Venterspost and South Deep (Table 2) to recover residual gold, uranium and sulfur and storing the tailings on a new Central Tailings Storage Facility (CTSF). Similarly, Rand Uranium had embarked on the Cooke Uranium Project (CUP), which endeavored to treat Cooke TSF for gold, uranium and sulfur and ultimately deposit the tailings onto the Geluksdal TSF, located very close to the CTSF. The two independent projects had similar operational and environmental mandates, within a 25km radius of each other. In 2009, Gold Fields and Rand Uranium evaluated the potential synergy of an integrated retreatment plan for TSFs located within the South Deep, Cooke, Kloof, Driefontein and Venterspost mining complexes. In 2012, Gold One acquired Rand Uranium and in the same year acquired the Ezulwini Mining Company (Proprietary) Limited (Ezulwini) in an agreement with First Uranium Corporation. During the same year Gold One revived the tailings retreatment project and Gold Fields entered into a joint venture (JV) partnership with Gold One to investigate the economic viability of concurrently reprocessing current arisings and historical tailings from a number of sites situated in the greater Carletonville/Westonaria/Randfontein area. A scoping study was concluded in 2012. In early 2013, Gold Fields unbundled its Kloof and Driefontein Complex and Beatrix gold mines in the Free State Province to create a separate entity in Sibanye Gold and listed Sibanye Gold as a fully independent company on both the JSE and the NYSE stock exchanges. Subsequently, in October 2013, Sibanye Gold purchased the interest held by Gold One in Rand Uranium and Ezulwini. The Gold One assets which became part of Sibanye Gold, included the Cooke operations (underground mining and surface reclamation operations) for gold and uranium production. This transaction gave Sibanye Gold control of a substantial portion of the surface Mineral Resources in the region. A Preliminary Feasibility Study (PFS) was completed during 2013 and confirmed that there is a significant opportunity to extract value from the surface Mineral Resources. Subsequently, a number of Definitive Feasibility Studies (DFSs) have been completed on various combinations of TSFs as shown in Table 2. Sibanye Gold’s TSF reclamation assets were housed in a special purpose vehicle (SPV) called WRTRP. In 2018, Sibanye Gold vended its interest in WRTRP to DRDGOLD for an equity stake of 38.05% and an option to subscribe for additional shares for cash to take its stake to 50.1%. In mid-2018, FWGR initiated Phase 1 of a phased approach to its growing reclamation operations. 44 Far West Gold Recoveries (Proprietary) Limited Document No: PR/SMI/1684/26 Table 2: Historical Development of FWGR Owner/Operator Period Project and/or Transaction Properties Activity Comment Gold Fields Group Limited WWP Driefontein Complex (Driefontein 1, 2, 3, 4 and 5 TSFs); Kloof Complex (Kloof 1 and 2 TSFs, Libanon and Leeudoorn TSFs; Venterspost Complex (Venterspost North and Venterspost South); and the South Deep Complex Aimed at retreating several West Rand TSFs to recover gold, uranium and sulfur and storing the tailings on a new CTSF Gold Fields - subsidiary GFI Mining South Africa (Proprietary) Limited 2009 West Wits Tailings Treatment Project (WWTTP) Driefontein Complex, Kloof Complex, Libanon, Leeudoorn, Venterspost Complex and South Deep Complex WWTTP Feasibility Study near completion Rand Uranium Limited (Rand Uranium) 2009 CUP Cooke mining Complex CUP Feasibility Study near completion Treatment of the Cooke TSF for gold, uranium and sulfur. Arising tailings would be deposited onto the Geluksdal TSF located near the CTSF Gold Fields and Rand Uranium Late 2009 Discussion of synergy of WWTTP and CUP - combination of WWTTP and CUP Evaluation of a combined project Significant re-engineering and metallurgical test work required and the project was put on hold Rand Uranium 2010 to 2012 Completed the CUP and the Cooke Optimization Project (COP) CUP and COP Feasibility Study completed Applications for authorizations partially complete Gold One International Limited (Gold One) 2012 Acquisition of Rand Uranium and Ezulwini Revived the surface retreatment integration discussions - update CUP DFS Gold One JV with Gold Fields 2012 to 2013 JV to investigate economic potential of concurrently re-processing current arisings and TSFs TSFs and current arisings in the Carletonville/Westonaria/Randfontein region Gold One/Gold Fields JV Scoping Study completed end 2012 Gold Fields unbundled GFI Mining South Africa (Proprietary) Limited and created Sibanye Gold Limited Early 2013 Unbundling of the Kloof-Driefontein Complex and Beatrix Gold Mines and listing of Sibanye Gold on the JSE Limited and NYSE Unbundling of the Kloof-Driefontein Complex and Beatrix Gold Mines Sibanye Gold Limited (Later delisted to become Sibanye Gold Proprietary Limited) 2013 Acquisition from Gold One of the Rand Uranium and Ezulwini assets As a result of the transaction, Sibanye Gold held most of the surface resources in the region Gold One/Gold Fields JV Scoping Study completed a PFS PFS showed significant opportunity to extract value from the surface resources Sibanye Gold 2015 Study initiated for the original Version 1 West Rand Tailings Retreatment Project (V1-WRTRP) Treatment of the Driefontein 3 and 5 TSFs using Ezulwini uranium process plant DFS for the first phase of the V1-WRTRP Sibanye Gold December 2015 Integrated study on Version 2 of the WRTRP (V2-WRTRP) Cooke, Driefontein 3, Driefontein 5 and Cooke 4 South TSFs Integrated study for the production of gold, uranium and sulfuric acid - DFS for V2- WRTRP DFS for V2 - WRTRP. On completion of the DFS, the project progressed to Front End Engineering Design (FEED) level of accuracy whilst funding and permitting was sought Sibanye Gold 2016 Decision to close Cooke No 4 shaft DFS to determine economic viability of using existing infrastructure including DP2 and Ezulwini uranium process plant DRDGOLD Limited 2018 DRDGOLD acquired 100% of Sibanye Gold’s SPV (WRTRP) in exchange for 38% interest in DRDGOLD, which Sibanye Gold later Driefontein 3, Driefontein 4, Driefontein 5, Kloof 1, Libanon, Venterspost North, Venterspost South, TSFs, DP2 and land for a RTSF and CPP 2017 Competent Persons Report, required in terms of Chapter 12 of the JSE listing requirements, outlining category one transaction DRDGOLD renamed the WRTRP to FWGR


45 Far West Gold Recoveries (Proprietary) Limited Document No: PR/SMI/1684/26 Owner/Operator Period Project and/or Transaction Properties Activity Comment increased to 50.1% by exercising an option. Far West Gold Recoveries (Proprietary) Limited 2025 Kloof 2 TSF transferred from Sibanye Gold to FWGR Kloof 2 Transfer pursuant to the 2018 exchange agreement with Sibanye Gold. Source: DRDGOLD, 2026 46 Far West Gold Recoveries (Proprietary) Limited Document No: PR/SMI/1684/26 6. GEOLOGICAL SETTING, MINERALIZATION AND DEPOSIT ITEM 6 (I); (II) AND (III) 6.1. Regional Setting, Mineralization and Deposit The mineral assets considered in this TRS are the tailings derived through the mining and processing of the Driefontein, Kloof, Libanon and Venterspost mines of the Witwatersrand Gold Fields. As such, the mineralization of the mined material which produced the tailings, now being processed by FWGR, is described in this TRS. Whereas the nature of the underlying geology is not of direct relevance, an understanding of the scale and nature of the gold mineralization that was targeted in the historical mining operations provides insight into the structure and composition of the mineral assets. The assets of FWGR are derived from the West Rand and Carletonville Goldfields of the gold-bearing, late Archaean (2.7Ga to 3.2Ga), Witwatersrand Supergroup (Witwatersrand Basin). The Witwatersrand Basin is the largest gold bearing metallogenic province globally and is a roughly oval-shaped sedimentary basin, elongated in a northeast-southwest direction. The major north-south axis of the basin is approximately 160km long, stretching from Welkom to Johannesburg and where the minor, east-west axis, spans approximately 80km. The Witwatersrand Basin is filled with approximately 14,000m of sedimentary and subordinate volcanic units, of which only small portions outcrop to the south and west of Johannesburg. The Witwatersrand Supergroup overlies an Archaean (>3.1Ga) granite-greenstone basement and the 3.08Ga to 3.07Ga Dominion Group and is subsequently uncomfortably overlain, by units of the Ventersdorp (~2.7Ga), Transvaal (~2.6Ga) and Karoo (~280Ma) Supergroups (Figure 9). The basin hosts vast auriferous and uraniferous deposits which have been grouped into geographically distinct sub- basins or goldfields (Figure 10). The goldfields are separated by stratigraphy where no economic mineralization has been discovered. The stratigraphy of the Witwatersrand Supergroup is broadly split into two Groups, namely the Central Rand and the West Rand Groups, which in turn are split into a series of subgroups, formations and members (Figure 11). The stratigraphic structure of the Witwatersrand Supergroup is well understood at subgroup level; however, at formation level, correlation problems are encountered between the defined goldfields. The recognition of basin-wide disconformities can be used as a basis for stratigraphic correlation and thus permits the correlation of formations between the various goldfields to higher comfort levels (McCarthy and Rubidge, 2006). The principal economic reefs have been correlated across various goldfields and do not occur at the same stratigraphic level. Recent studies consider the deposition in the Witwatersrand sediments to have taken place along the interface between a fluvial system and an inland sea. Specifically, this body of water is commonly considered to be a retroarc- foreland basin which formed in response to crustal thickening on the northern edge of the Kaapvaal Craton, during a collision with the Zimbabwe craton to the north. The varying stratigraphic position of the narrow, 0.1m to 2.0m thick quartz-pebble conglomerate reefs are interpreted to represent major, diachronous, entry points of coarse- grained sediment into the basin. They appear to be laterally coalesced fluvial braid-plains, where gold was concentrated within conglomerates which developed, primarily along erosional unconformities. The extent of the development of the various unconformities is greatest near the basin margins and decreases towards the more distal areas. Complex patterns of syn-depositional faulting and folding have caused significant variations in sediment thickness and sub-vertical to over-folded reef structures are characteristic of the basin margins. 47 Far West Gold Recoveries (Proprietary) Limited Document No: PR/SMI/1684/26 Structurally, the Witwatersrand Basin has experienced a long and complex history, affected by several superimposed structural events, differentiated as syn- and post-depositional deformations. Syn-depositional deformation played a key role in the original distribution of sediments which controlled the locality of auriferous conglomerates and the thickness of enclosing sedimentary sequences. Later faulting and folding of the sequence determined which parts of the Witwatersrand Basin remained buried, as well as the depth extent of mineable horizons, relative to the present-day surface. Figure 9: Regional Geological Setting of the Witwatersrand Supergroup Source: Sound Mining, 2023 48 Far West Gold Recoveries (Proprietary) Limited Document No: PR/SMI/1684/26 6.2. Local Geological Setting, Deposit and Mineralization In terms of a more local description, the FWGR assets comprise of TSFs of tailings material derived from the mining and processing of ore from the Driefontein, Kloof, Libanon and Venterspost mining operations, located in the West Rand and Carletonville Goldfields, on the northwestern rim of the Witwatersrand Basin (Figure 10). Figure 10: Geology of the Witwatersrand Basin Source: Sound Mining, 2023 These operations exploit the Ventersdorp Contact Reef (VCR) located at the top of the Central Rand Group, the Carbon Leader Reef (CLR) near the base of the Central Rand Group and the Middelvlei Reef, which stratigraphically occurs 50m to 75m above the Carbon Leader. Additional minor reefs including the Kloof, Elsburg, Kimberley and Libanon Reefs are exploited at some operations (Figure 11). The Central Rand Group is dominated by coarse-


49 Far West Gold Recoveries (Proprietary) Limited Document No: PR/SMI/1684/26 grained siliciclastic metasedimentary facies with subordinate fine grained (mudstone) facies. Its depositional environment is interpreted as alluvial deltas and braided streams which formed at the fluvial - shallow marine interface. The proximal, high energy, facies are directly linked with the concentration of detrital gold, pyrite and uraninite and thus the Central Rand Group accounts for 95% of the gold production from the Witwatersrand Basin. Figure 11: Witwatersrand Supergroup Stratigraphic Section Source: Frimmel et al, 2005 50 Far West Gold Recoveries (Proprietary) Limited Document No: PR/SMI/1684/26 The gold bearing reefs are fundamentally distinguished by their association with quartz-pebble conglomerates, which are confined by a basal angular unconformity and an upper planar bedding surface separating it from an overlying quartz wacke or siltstone unit. The extent of the unconformable surfaces is typically greatest at the basin margins and decreases towards the distal areas of the basin. The Witwatersrand Supergroup is poorly exposed in outcrop due to the overlying, younger cover sequences. The surface geology of the mining area comprises outliers of Karoo Supergroup shales and sandstones, followed by Pretoria Group sediments and the Chuniespoort Group dolomites of the Transvaal Supergroup. In the center of the Witwatersrand Basin, units of the Witwatersrand Supergroup have been upturned and exposed in the Vredefort meteorite impact crater, which is dated at 2,023Ma. The region is structurally complicated with a major structural fault, the West Rand Fault, separating the West Rand Goldfield operations from the South Deep Gold Mine to the east (Figure 10). Additional horst structures are superimposed upon the southeast plunging West Rand Syncline including the Bank Fault (Figure 10), a large west dipping fault with a down-throw to the west. The structural features affect the preservation, depth and length of the economic reefs. In the area east of the Bank Fault the majority of mining exploits the VCR, with minor contributions from the Middelvlei Reef and the Kloof Reefs (Gold Fields). West of the Bank Break the CLR is generally a high- grade reef and represents the major source of Run-of-Mine (RoM) with minor contributions from the VCR and Middelvlei Reef. 6.3. Property Geology, Deposit and Mineralization FWGR TSFs are located on two mining rights (Figure 12) within the West Rand and Carletonville Goldfields. As stated above, they are the processed waste derived from the mining and processing of auriferous and uraniferous ores from Driefontein, Kloof, Libanon and Venterspost mining operations. The mining operations targeted different reefs, namely: • the Driefontein TSFs comprise primarily processed VCR, CLR and Middelvlei Reef; • the Kloof TSFs comprise primarily processed VCR, Middelvlei Reef and the Kloof Reef; • the Venterspost TSFs comprise primarily processed Middelvlei Reef and VCR; and • the Libanon TSF comprises material from the VCR, Libanon Reef, Kloof Reef and Middelvlei Reef. The composition of a TSF depends on the geochemical make-up of the material being mined and the chemicals used in the mining and extraction process. In addition to the internal structure, the TSF reflects the mining strategy and depositional methodologies employed at each operation. A single TSF can have portions of different composition and specific gravity (SG) due to changes in underlying orebody contribution, the deposition of tailings arising from different operations and differing depositional strategies. The bulk density of tailings material is a critical factor in the accurate estimation of quantities and thus an investigation into the lateral and vertical variation was conducted. These factors can result in considerable variation in gold content and distribution throughout a TSF where such variation has an impact on final recoveries and projected revenues for the operation. Various exploration programs and subsequent geological modeling have enabled the classification of FWGR TSFs as Mineral Resources with a bulk density ranging from 1.40g/cm3 to 1.45g/cm3. In addition, secondary processes such as metal re-mobilization, erosion, weathering, leaching, and acid mine drainage can further affect the geochemical characteristics of a TSF. These processes tend to progress faster in a TSF compared to a primary ore body as weathering, erosion and oxidation are accelerated by the fine particle size of the material, and leaching together with acid mine drainage occurs due to the large amount of water associated 51 Far West Gold Recoveries (Proprietary) Limited Document No: PR/SMI/1684/26 with TSFs. Gold can undergo mobilization within the TSF with time and hence may exhibit areas of re-concentration and even be present in the sub-structure soil. The geochemical characteristics of the footprint geology, such as dolomites, granites, quartzites, has a bearing on the mobilization dynamics of a TSF. Hence, depending on several factors such as footprint, age of deposition, beneficiation, and primary reef origin of slimes, a TSF may exhibit areas/layers of differing grade profiles. The modelled dumps show vertical and lateral variation in gold grade and although exceptions occur, in general, the grade tends to increase towards the bottom of the dump and into the footwall. Detailed exploration results and geological modeling is outlined in Item 7 and Item 11 respectively. 52 Far West Gold Recoveries (Proprietary) Limited Document No: PR/SMI/1684/26 Figure 12: Property Geology Source: Sound Mining, 2026


53 Far West Gold Recoveries (Proprietary) Limited Proposal No: PR/SMI/1685/26 7. EXPLORATION ITEM 7 (I); (II); (III); (IV); (V) AND (VI) 7.1. Methods and Databases The extent, morphology and structure of the TSFs is relatively simple when compared to conventional mineral deposits. Consequently, the exploration programs are also simple and straightforward. Exploration of the FWGR’s assets comprised: • auger drilling programs to permit sampling for gold content and mapping of the gold distribution undertaken in drilling campaigns by Gold Fields in 2007, 2008 and 2009 for the Driefontein, Kloof, Libanon and Venterspost TSFs; • auger drilling at the Driefontein 3 TSF to improve confidence in the distribution of gold grades within the TSF in 2026; • an auger drilling campaign was undertaken in 2009 on the lower portion of the Kloof 2 TSF. In 2026 an air-core drilling program was completed on Kloof 2 TSF to permit sampling for gold content and mapping of the gold distribution; • surveying of the borehole collars undertaken by Gold Fields in-house surveyors to determine physical dimensions and volumes verified independently by Light Detection and Ranging (LIDAR) consultants for the 2007, 2008 and 2009 drilling programs; and • surveying of the borehole collars and TSF surfaces for Driefontein 3 and Kloof 2 was independently undertaken by Geographix Surveys. The exploration data was captured in the form of Microsoft Excel files as well as the appropriate Datamine and Micromine software files. All data is independently stored by the QP’s on a secure cloud-based platform. A copy is made available to FWGR for internal use. 7.2. Geophysical Characterization No geophysical investigation of the TSFs has been undertaken as part of the exploration programs. 7.3. Geo-hydrological Characterization A geohydrological investigation of the TSFs did not form part of the exploration programs. It is not required for the determination and classification of FWGR’s Mineral Resources. The handling of surface water is described in the mining and processing Items (Item 13 and Item 14). 7.4. Geotechnical Characterization A geotechnical investigation of the TSFs did not form part of the exploration programs. It is not required for hydro-mining of the unconsolidated tailings material. The slope angles and bench widths do not pose a risk to the mine design (Item 13.1). Geotechnical assessments were performed for the design of the RTSF. The auger and air core drilling methods performed during exploration do not allow for the orientation of samples. Geotechnical characterization is not applicable to the determination and classification of FWGR’s Mineral Resources. 7.5. Surveying A detailed helicopter-based LIDAR survey was undertaken by Gold Fields in late 2008. The survey was conducted by Southern Mapping Company (Proprietary) Limited and the total area surveyed was approximately 44,000ha. The aerial survey was conducted using an aircraft mounted LIDAR system which scanned the ground below with a 70kHz laser. Digital color images were also gathered to produce color orthophotos. The survey was conducted at a height of 1,100m above datum with an image pixel size of 15cm. The vertical accuracy was 10cm and the horizontal accuracy was 20cm. The survey was calculated in Hartebeesthoek94, LO27 projection with ellipsoidal heights. The data was supplied to Gold 54 Far West Gold Recoveries (Proprietary) Limited Document No: PR/SMI/1684/26 Fields in CAPE LO27 with orthometric heights. The LIDAR survey provided surface data from which three-dimensional (3D) models of the TSFs were constructed. The Driefontein 5 TSF and Driefontein 3 TSFs were surveyed in 2004 and 2006 respectively by Gold Fields, using differential Global Positioning System (GPS) methodology. In all instances it was found that the vertical positioning of the drillhole collars were offset from the surface of the TSFs as determined from the LIDAR survey. The offset ranges from approximately 0.5m to several meters. It was assumed that the LIDAR survey was the more accurate of the two surveys and the drillhole positions were moved to intersect the top of the TSF wireframes. Recent surface surveys of the Kloof 2 TSF as well as ongoing production surveys are independently undertaken by Geographix Surveys on the Driefontein 5 and Driefontein 3 TSF’s. These surveys are undertaken using a GNSS Real Time Kinetic (RTK) approach. This data was processed to generate a high-resolution digital terrain model (DTM) and contour maps, of each TSF. The resulting topographic surface was used for volumetric calculations, reconciliations, and mine planning activities. 7.6. Drilling Historical and recent exploration programs have contributed to the current exploration database and Mineral Resource estimates. The exploration campaigns comprise: Historical programs: • a Mineral Resource estimate (Minxcon, 2008); and • Gold Fields (2007) undertook an initial drilling campaign on Driefontein 3 TSF and Driefontein 5 TSF. The Mineral Resources were reported in Minxcon (Proprietary) Limited (Minxcon) report R2008-14 (2008). The drilling continued in 2008 to cover 13 TSFs in the Kloof, Driefontein, and Venterspost areas. Recent Programs: • FWGR (April 2026) undertook an auger drilling program at the Driefontein 3 TSF; and • FWGR (May 2026) undertook an air-core drilling program at the Kloof 2 TSF. The historical drilling was completed on either a 100m × 100m or 200m × 200m grid using vertical auger drillholes, generally to depths of less than 70m. The recent program comprised an air-core drilling campaign at the Kloof 2 TSF over a 150m diagonal spacing and 200m horizontal spacing, with drillholes generally less than 50m deep. An auger drilling campaign at the Driefontein 3 TSF on a 150m × 150m grid with drillholes generally less than 25m deep. Owing to the shallow nature of the drilling, downhole surveys were considered unnecessary for all campaigns. The drilling density and sample spacing were considered sufficient to establish geological and grade continuity. Historical drilling was undertaken using portable hydraulic auger drill rigs fitted with a rotating spiral auger enclosed within a stainless-steel core barrel. The recent Kloof 2 program utilized an air-core drill rig with a dual-tube rod system to improve sample recovery and minimize contamination, while the Driefontein 3 program employed the same auger drilling methodology as the historical campaigns. Drilling was predominantly undertaken dry, with limited water used during the Kloof 2 air-core program where necessary to clear clay blockages. As the TSFs are essentially horizontally layered deposits, sample orientation was not considered relevant. Samples from all programs were logged, described and assayed using procedures considered appropriate for Mineral Resource estimation. Historical drilling was completed by Dump and Dune Drillers (Pty) Ltd and Gold Mine Sands and Slime Dam Drillers (Pty) Ltd, while the recent campaigns were completed by Torque Africa Group (Kloof 2 TSF) and Muloko 55 Far West Gold Recoveries (Proprietary) Limited Document No: PR/SMI/1684/26 Group (Driefontein 3 TSF). All contractors have demonstrated experience in drilling TSF’s and comply with industry standards. Recognizing that auger and air-core drilling within unconsolidated tailings is inherently susceptible to sample contamination, all programs were supervised by qualified geologists and undertaken in accordance with industry-standard procedures. The historical drilling methodologies were independently audited by SRK in 2008 for the Driefontein 3 TSF, Driefontein 5 TSF, Kloof 1 TSF, Libanon TSF, Venterspost North TSF and Venterspost South TSF. The 2026 drilling programs were observed by Sound Mining personnel, who confirmed that drilling and sampling were completed in accordance with industry best practice and are suitable for Mineral Resource estimation. Drilling logs were maintained for the historical campaigns, although sample photographs were not retained, which is considered appropriate given the drilling methodology employed. Overall, the historical and recent drilling programs were conducted to industry standards and provide a suitable basis for Mineral Resource estimation. The locations of the drillhole collars are shown in Figure 13 to Figure 19 and comprise 1,146 drillholes totaling approximately 74km of drilling. 7.7. Exploration Budget Numerous historical and recent exploration activities now contribute to the FWGR’s overall exploration database and it is anticipated that FWGR will continue to conduct exploration activities which are necessary to keep ahead of recoveries and to update knowledge of the content within the TSFs. Provisions for future exploration are included in the DCF model. 56 Far West Gold Recoveries (Proprietary) Limited Document No: PR/SMI/1684/26 8. SAMPLE PREPARATION, ANALYSIS AND SECURITY ITEM 8 (I); (II); (III); (IV) AND (V) 8.1. Sampling Method Auger Drilling: the auger drill comprises a rotating spiral auger drill bit encased in a stainless-steel core barrel. The core barrel comprises a 50mm drill rod and inner spiral, with the inner spiral rotating in the opposite direction to the outer casing as the tailings material is penetrated. The extension rods and spiral augers have three lengths; namely 1.5m, 3.0m and 4.5m. The typical drilling cycle comprised the following sequence, repeated until the floor of the TSF was intersected: • an initial sample was drilled with a 1.5m spiral auger/sample tube, after which the first sample was extracted; • the subsequent sample was drilled with a 3.0m auger/sample tube and the 1.5m sample extracted; • thereafter, a 4.5m spiral auger/sample tube was used and the sample extracted; and • the succeeding samples were extracted from the 4.5m spiral auger plus a 1.5m extension rod, followed by a 3.0m extension rod and then a 4.5m drill rod. The first two samples were extracted directly into new sample bags by using the drill rig to reverse the rotation of the spiral within the 1.5m and 3.0m auger/sample tubes. The sample bag was placed over the end of the tube to collect the sample following which the spiral auger and interior of the barrel were cleaned by using a cloth and a steel brush to remove the tailings material. Subsequent samples were extracted by removing the spiral auger and the sample collected in a rubber trough. The first 10cm to 15cm of the sample were discarded as they would be the most likely to have contamination and the remainder of the sample was transferred into the bag at the end of the rubber trough. The sample bag was then closed, placed in sequence and the tickets added. The sample at the floor of the TSF is collected into two separate bags containing the soil/footprint sample and the lowermost tailings sample. The entire sample was collected and consequently the full length of the TSF was sampled, ensuring representivity. No relationship exists between sample recovery and grade as the material is fine grained and the entire sample was collected so no preferential loss of fines is anticipated. Each resulting sample weighed between 2kg and 4kg and is considered suitable for the fine grain size of the tailings. No selective sampling was undertaken. The drilling sites were visited by independent consultants who concluded the sampling and management of samples by the drillers was of a high quality, well controlled and from the evaluation of the quality control data, the number of errors made by the drillers was very small. The samples were not geologically nor geotechnically logged as these criteria cannot be obtained from an auger sample. Air-Core Drilling: the air-core drill comprises a rotating three-bladed steel or tungsten drill bit attached to a dual-tube drill rod system. The drill rods consist of an outer barrel and an inner tube, through which compressed air is circulated. High- pressure air is injected down the annulus between the outer rod and inner tube, where it reaches the drill bit and facilitates cutting of the formation. The resulting tailings material is transported to surface via the inner tube, minimizing contamination and preserving sample integrity. The air-core drill string is advanced using sequential rod additions with a standard length of 3m.


57 Far West Gold Recoveries (Proprietary) Limited Document No: PR/SMI/1684/26 The typical drilling cycle comprised the following sequence, repeated until the floor of the TSF was intersected: • an initial 1.5m sample interval was drilled, after which the sample was recovered via the cyclone; • thereafter, the drill string was advanced in 3m rod increments, with samples collected at 1.5m intervals for each half- rod advance; and • this sequence was repeated, with continuous rod additions and sample recovery at 1.5m intervals, until the target depth was reached. Samples were recovered at surface via the cyclone and splitter system directly into new sample bags. For each 1.5m interval, the primary sample was collected from the splitter chute, ensuring that a representative portion of the returned tailings material was retained. Following each sample collection, the cyclone and splitter were routinely inspected and cleaned, using compressed air and manual tools where necessary, to minimize the risk of cross-contamination between successive samples. All samples were collected sequentially, with the sample bags securely closed after collection and placed in order, with corresponding sample tickets inserted to maintain chain of custody. The entire sample stream recovered from each interval was considered representative of the drilled material, with no selective sampling undertaken. The continuous nature of air- core sample return ensures that all tailings material transported to surface is included in the sample. Each resulting sample weighed between 3kg and 7kg and is considered suitable. The drilling sites were visited by the QP who concluded that the sampling and management of samples by the drillers was of a high quality, well controlled. The samples were not geologically nor geotechnically logged as these criteria cannot be obtained from an air core sample. 8.2. Sample Security The database used for the Mineral Resource estimation was thoroughly reviewed and found to be reliable. 8.3. Analytical Laboratories Five independent laboratories have been used for sample analysis, namely SGS, Set Point Laboratories (Set Point), ALS Chemex South Africa (Proprietary) Limited (ALS), Performance Laboratories (Proprietary) Limited (Performance Laboratories) and MAED Metallurgical Laboratories (MAED). All except for Performance Laboratories and MAED, are accredited by the South African National Accreditation System (SANAS) for gold assay. Set Point, ALS and MAED were independently inspected and found to follow best practice principles of quality management. They have procedures of chemical analysis and assay that meet the requirements for code compliance. They use sample preparation equipment that complies with international accepted practices and laboratory information management systems with sample tracking. Quality management systems exist with quality checks throughout the entire assay and analytical process. 8.4. Analytical Procedures Gold analysis was undertaken using standard fire assay methodology with gravimetric finish which is considered entirely appropriate for the sample type. The laboratory sample preparation was standard and includes drying, pulverizing with a disc pulverizer and manual homogenization. The final sample size submitted for assay was 500g and the likelihood of the samples being non- representative is low. 58 Far West Gold Recoveries (Proprietary) Limited Document No: PR/SMI/1684/26 8.5. Bulk Density In general, the conversion from volume to quantity in the case of mineral deposits is undertaken by the application of a density or the SG) determined experimentally on dry samples. Density is the mass per unit volume e.g., t/m3, whilst SG is the ratio of the density of a substance to the density of a reference substance (usually water); and is a unitless ratio of the mass of a substance to the mass of a reference substance for the same given volume. Wet density measurements can be undertaken for samples with moisture content. Bulk density, however is defined as the dry weight of a material per unit volume of that material. Bulk density considers both the solids and the pore space; whereas, density and SG consider only the solids. The density throughout the various TSFs will vary marginally depending on the original reefs mined. An average density of 1.42t/m3 is used because of data available to FWGR from the current operations and from recent test work performed by the RVN Group (Proprietary) Limited. This compares favorably with the average densities reported by other companies in the business of retreating Witwatersrand tailings (Table 3). Table 3: Dry Densities used by Other Re-treatment Companies for the Witwatersrand Operations Company TSF Dry Density (t/m3) Rand Uranium West Rand Operations 1.45 Anglo Gold Ashanti Vaal River Operations 1.45 Ergo Mining (Proprietary) Limited Elsburg Tailings Complex 1.42 Mintails SA West Rand Projects 1.40 Source: Sound Mining, 2023 The QP has therefore assumed a consistent density of 1.42t/m3 for the Mineral Resource estimate as at June 30, 2026. The use of a dry density in the estimation of an in situ Mineral Resource is standard best practice, and the dry density value has been applied to the Mineral Resource estimate. 8.6. Concluding Comments The QP considers the sampling method and preparation adequate for this type of mineralization. Sample security is considered adequate and the resulting database reliable. Standard analytical processes were used for sample grade determination with Quality Assurance and Quality Control (QA/QC) (Item 9) providing confidence in the results. 59 Far West Gold Recoveries (Proprietary) Limited Document No: PR/SMI/1684/26 9. DATA VERIFICATION ITEM 9 (I); (II) AND (III) 9.1. Quality Assurance and Quality Control The internal laboratory standards and blanks were inserted in every batch. Internal standards with a blind standard were used on all instruments. The laboratories undertake regular evaluation of overall performance by statistical evaluation of all QC data. The laboratory internal checking processes were independently checked and found to be standard and reliable. Several checks were undertaken on the importation of data into the Mineral Resource estimation software with no issues highlighted. Laboratory reports suggest that blanks and Certified Reference Materials (CRM) were included for every 100 samples. The CRMs submitted for the historical sampling were African Mineral Standards (AMIS) AMS0046 at 0.67g/t Au; AMIS AMS0080 at 1.14g/t Au and accredited blank AMIS AMS0069 <0.002g/t Au, while the CRMs submitted for the recent sampling were AMIS0644 at 0.151g/t Au; AMIS0805 at 0.347g/t Au and accredited blank AMIS0939 <0.002g/t Au. The spread of gold grades in the CRM is appropriate and the review of the quality control and quality assurance data concluded that 13.7% of the total population of samples (13,000 samples) were outside of the two standard deviation limits allowed and were re-analyzed. 9.2. Independent Verification The TSFs exploration programs were conducted during 2007 to 2009 with independent oversight and review provided by Minxcon, with auditing of the results by SRK Consulting (Proprietary) Limited. The overall conclusions for each drilling campaign suggests that the drilling and sampling programs were conducted to industry standards and are acceptable for a Mineral Resource estimate. The TSF volumes were independently verified by Southern Mapping Company Limited. Sound Mining has since completed an independent review of the available information and a verification of the data used for the LoM plan to exploit FWGR’s assets. This involved integrity checks on the capturing of data and interviews with the specialists involved in the original exploration programs. The 2026 exploration program was conducted under independent oversight by Sound Mining, who reviewed and monitored the drilling, sampling and data collection procedures, and confirmed that the program was carried out in accordance with industry standards and is acceptable for a Mineral Resource Estimate. Moreover, the 2026 exploration work and Mineral Resource estimate was the subject of third-party audits. The QP is satisfied with the accuracy and integrity of the data underpinning the Mineral Resource estimate. The QP is further comforted by the fact that mining of the Driefontein 5 TSF (December 2018 to current), and the Driefontein 3 TSF (June 2023 to current) has reconciled well confirming both the volume and grade estimates of the TSF. It should also be noted that the type and style of mineralization of the original reefs exploited during the establishment of the TSF assets are not relevant to the Mineral Resource estimate. 60 Far West Gold Recoveries (Proprietary) Limited Document No: PR/SMI/1684/26 10. MINERAL PROCESSING AND METALLURGICAL TESTING ITEM 10 (I); (II); (III); (IV) AND (V) 10.1. Metallurgical Test Work Metallurgical test work described here under relates to understanding the recoveries to be expected for each TSF reclaimed. The metallurgical characterization of the TSFs (i.e., Driefontein 3 TSF, Driefontein 5 TSF, Libanon TSF, Kloof 1 TSF, Kloof 2 TSF, Venterspost North TSF and Venterspost South TSF) have been informed by the results of numerous studies since 2000, which have ranged from Scoping Study to DFS levels of accuracy. The associated metallurgical test work considered various processing options including direct leach, grinding, ultra-fine grinding and flotation. Three independent laboratories were involved, namely SGS Lakefield (SA), Mintek, and Patterson & Cooke, and all three are accredited by the SANAS for gold assay. They have been independently inspected and are considered acceptable by the QP. They follow conventional best practice principles of quality management and have procedures of chemical analysis and assay that are accepted as fulfilling the requirements of compliancy demanded by modern mining companies. They use sample preparation equipment that complies with international accepted practice. They have installed well-developed laboratory information management systems with sample tracking. They have evolved quality management systems in place with quality checks through the entire assay and analytical process. The diagnostic leach results and gold deportment per size fraction of the TSFs currently being reclaimed are presented in Table 4, Table 5 and Table 6. Table 4: Full Diagnostic Leach Results on Un-milled Feed Samples Diagnostic Results Un-Milled Feed Sample Association Driefontein 3 TSF Driefontein 5 TSF (g/t Au) (% Au) (g/t Au) (% Au) Gold Available to Direct Cyanidation 0.24 54.7 0.22 52.4 Gold that is Preg-robbed Carbon-in-Leach (CIL) 0.02 3.5 0.00 0.0 Gold Associated with HCI Digestible Minerals 0.06 14.9 0.05 11.4 Gold Associated with HNO₃ Digestible Minerals 0.03 6.9 0.04 10.3 Gold Associated with Carbonaceous Matter 0.02 4.1 0.00 0.0 Gold Associated with Quartz (balance) 0.07 16.0 0.11 25.9 Total 0.43 100.0 0.41 100.0 Source: DRDGOLD, 2026 Note: Above recoveries exclude UFR recoveries Table 5: Driefontein 5 TSF Feed Sample Assay by Size Particle Size (µm) Mass (%) Cumulative Mass (% mass) Discrete Grade Au (g/t) Discrete Distribution (%) Cumulative Distribution (%) Au U3O8 S2 Au U3O8 S2 150 5.5 94.5 1.13 15.2 4.1 0.9 100.0 100.0 100.0 106 10.8 83.6 0.62 16.3 4.8 1.9 84.8 95.9 99.1 75 15.1 68.5 0.34 12.4 7.9 6.1 68.6 91.0 97.2 53 10.6 58.0 0.27 6.9 6.3 11.9 56.1 83.2 91.1 38 8.7 49.3 0.32 6.7 6.4 16.1 49.2 76.9 79.2 25 9.0 40.3 0.31 6.8 7.9 17.6 42.5 70.5 63.1 15 22.0 18.3 0.23 12.3 36.9 33.6 35.7 62.6 45.5 -15 18.3 0.53 23.4 25.7 11.9 23.4 25.7 11.9 Total 100.0 100.0 100.0 100.0 Head Grade (calculated) 0.41 Head Grade (measured) 0.41 Variance 0.70% Source: Mintek, 2015


61 Far West Gold Recoveries (Proprietary) Limited Document No: PR/SMI/1684/26 Table 6: Driefontein 3 TSF Feed Sample Assay by Size Particle Size (µm) Mass (%) Cumulative Mass (% mass) Discrete Grade Au (g/t) Discrete Distribution (%) Cumulative Distribution (%) Au U3O8 S2 Au U3O8 S2 150 5.0 95.0 1.48 18.0 5.5 0.08 100.0 100.0 100.0 106 12.9 82.0 0.39 12.2 5.9 1.8 82.0 94.5 99.2 75 17.0 65.0 0.37 15.3 8.9 7.9 69.8 88.6 97.5 53 10.5 54.6 0.34 8.6 6.8 12.6 54.5 79.8 89.5 38 8.4 46.2 0.34 6.9 6.3 16.1 45.9 72.9 76.9 25 7.8 38.4 0.27 5.1 6.1 14.7 38.9 66.7 60.7 15 24.9 13.5 0.29 17.5 40.2 38.8 33.8 60.5 46.1 -15 13.5 0.50 16.3 20.3 7.3 16.3 20.3 7.3 Total 100.0 100.0 100.0 100.0 Head Grade (calculated) 0.41 Head Grade (measured) 0.43 Variance 4.10% Source: Mintek, 2015 The presence of preg-robbers in the tailings material can be ascertained from the above results. Preg-robbing is the phenomenon whereby the gold cyanide complex, Au(CN)2, is removed from solution by the constituents of the ore. The preg-robbing components may be the carbonaceous matter present in the ore, such as wood chips, organic carbon, or other impurities, such as elemental carbon. The actual content of the preg-robbers in the samples seems to vary from 0% up to 10% in certain samples. This pattern is consistent with results from similar operations and is a function of the nature of the material being re-mined. In particular, areas on a TSF which contain organic matter and plants (i.e., side walls, reed beds etc.) will have elevated preg-robbing content. It is therefore an established practice to design a plant with a Carbon-in-Leach (CIL) system and not a Carbon-in- Pulp (CIP) system. The process design does allow for CIL to mitigate the impact of preg-robbers on recovery potential. The recoveries in Table 7 were relied on by the QP to assess economic viability. They are underpinned by the results of the test work performed to date or from actual recoveries recorded at DP2. Table 7: Summary of Process Recovery Potential TSF Process Recovery (%) Driefontein 5 51.9 Driefontein 3 51.5 Kloof 1 50.5 Kloof 2 42.1 Libanon 47.2 Venterspost North 48.9 Venterspost South 57.6 Source: Sound Mining, 2026; and FWGR, 2026 Note: Above recoveries exclude UFR recoveries 10.2. Recovery Optimization FWGR has been successful in liberating gold locked in silicates through additional grinding at DP2 because approximately 30% of the contained gold is found in the coarse fractions (>106µm). Historically the most favorable liberation on Witwatersrand Basin gold bearing ores has been achieved at grind sizes of <75µm. Both the diagnostic leach and assay by size results confirmed the need to mill the coarse fractions in order to improve recovery. 62 Far West Gold Recoveries (Proprietary) Limited Document No: PR/SMI/1684/26 FWGR continuously tests the DP2 CIL tails material to track the plants' performance and to understand where further improvement opportunities may lie. This insight prompted bench-scale test work on the benefit of using the AZTEC UpFlow Reactor (UFR) technology. UFR performance was examined for a range of carbon types and conditions, including virgin carbon, regenerated carbon, and acid-washed regenerated carbon at a baseline concentration of 50g/L. While this test work was limited, it yielded positive albeit variable results. The QP has examined these results and elected to include a preliminary and conservative recovery of 10% on the CIL tail material, to a minimum tail grade of 0.14g/t, for the assessment of economic viability. FWGR have committed capital in the LoM Plan for the inclusion of a UFR circuit, the implementation of which has already started. The decision to proceed followed positive results on the potential of the UFR technology at the Ergo operation. The benefit of including the UFR circuit will require confirmation and accordingly the QP has examined the impact of no benefit through to the assumed benefit by means of a sensitivity analysis in Item 19 of this report. Metallurgical recoveries reported elsewhere in this report exclude UFR recoveries unless explicitly stated otherwise. 10.3. Concluding Comments The recoveries used in support of the Mineral Resource and Mineral Reserve estimates are considered to be reasonable inclusive of the 10% benefit assumed from the inclusion of the UFR technology. The sensitivity analysis confirms that the Mineral Reserve estimate remains the same should UFR technology return no benefit. Bench-scale test work campaigns will need to be conducted for each TSF. Actual recoveries from the processing of the Driefontein 5 TSF material provided the QP with further confidence in that they exceeded the initial estimate for the Driefontein 5 TSF from test work, by 6%. 63 Far West Gold Recoveries (Proprietary) Limited Document No: PR/SMI/1684/26 11. MINERAL RESOURCE ESTIMATES ITEM 11 (I); (II); (III); (IV); (V); (VI) AND (VII) The Mineral Resource estimate is reported as at June 30, 2026, and includes the addition of the Kloof 2 TSF as well as the incorporation of additional exploration drilling on the Driefontein 3 TSF. Sound Mining independently updated Mineral Resource database, geological models, estimation methodology and classification criteria. Sound Mining is satisfied that the Mineral Resource estimates are based on a suitable database of reliable information and that no material issues were identified that would materially affect the overall estimates. The bulk density of 1.42t/m³, remains appropriate and has been used for the 2026 Mineral Resource estimates. Geological losses are not applied because the entire volume of a TSF will be processed once included into FWGR’s Mineral Resource base for future exploitation. 11.1. Geological Models and Interpretation TSFs constructed from the tailings of Witwatersrand gold mining operations have been successfully and economically exploited for decades and the geotechnical and geometallurgical characteristics are well understood from experience and test work on the FWGR assets themselves. Apart from the potential risks identified in Item 12.1, no factors of a geotechnical or geometallurgical nature have been identified that would have a significant effect on the prospects for eventual economic extraction. The exploration database has been demonstrated to comprise analytical data obtained from reliable laboratory assays on samples obtained from sampling and drilling programs based on industry best practice. The drillhole grid spacing is comparatively close for typical TSF drilling programs, and the entire depth of each TSF was sampled. The data density is therefore considered sufficient to assure continuity of mineralization and structure and provides an adequate basis for estimation. The exploration database was historically imported into DataMineTM Studio 3, Datamine Studio UG, Datamine Studio NPVS, Datamine Studio OP and Micromine Origin software. The 2026 modeling work was undertaken using Micromine Origin software and data validation was completed to ensure the integrity and validity of the imported data. The samples for Driefontein 3 TSF and Driefontein 5 TSFs represent 3.0m composite samples while the samples from the Kloof 1, Kloof 2, Libanon, Venterspost North, and Venterspost South TSFs were 1.5m in length. The end of the drillhole sample, where it contained footwall material, was separated into tailings and footwall material and treated separately by the laboratory. Three-dimensional wireframes were constructed from surveyed data and drillhole information. The topographic wireframe surfaces for the Driefontein 3, Driefontein 5, Kloof 1, Kloof 2, Libanon, Venterspost North and South TSFs were constructed from the survey data. The TSF base/footwall wireframe was constructed from the soil intercept depths from the drillhole data and the footprint perimeter. The wireframes comprised simple 3D representations of the volume of the TSFs and as such are not open to alternative interpretations. 11.2. Estimation Methodology Ordinary Kriging was undertaken for the gold grade estimation which allows for testing of the accuracy and efficiency of the estimation. Due to the construction of the TSFs and potential gold remobilization, a spatial grade distribution was anticipated and since Kriging is based on modeling the spatial variances within an orebody, this method was considered the most reliable and accurate. 64 Far West Gold Recoveries (Proprietary) Limited Document No: PR/SMI/1684/26 The capping of anomalously high-grade values was applied to Driefontein 3 TSF, Driefontein 5 TSF and Kloof 1 TSF These capping values were determined from the probability plots generated for each TSF. Capping in the variography stage of the estimation limits the excessive variances of the anomalously high grade from skewing the distribution away from the representative variance of the data distribution. Capping in the Kriging stage limits the zone of influence that the ultrahigh grades have on the estimation of the surrounding areas. This is considered an appropriate method of data handling. The following parameters were applied in the Kriging process: • 50m-by-50m-by-3m block size as derived from 100m-by-100m drillhole spacing and 1.5m sample lengths for Driefontein 5, Driefontein 3, Kloof 1, Kloof 2, Libanon, Venterspost North and South TSFs; • sub-cells employed at a minimum of 10m-by-10m (X and Y) for each TSF; • first search volume (SVOL1): o X and Y at approximately the variogram range; o Z search volume was in general the downhole variogram range equating to a search of 6m. Given the stratified nature of the TSFs an excessive search in the vertical direction could result in smearing of grades vertically; o minimum of 12 samples within the search volume one (SVOL1); and o maximum of 40 samples within the search volume one (SVOL1). • second search volume (SVOL2): o approximately 1.5 times the first search volume; o minimum of four samples within the search volume; and o maximum of 40 samples within the search volume. The spatial relationships of the sample grades were investigated with variograms. Both downhole and planar variograms were calculated and modelled. The aim of the downhole variograms was to determine a nugget value and the applicable vertical range of continuity, whilst the planar variogram used the nugget value determined from the downhole variogram. The anisotropy (the difference, when measured along different axes, in a material's physical or mechanical properties) for gold in each TSF was investigated. The variograms were deemed best represented by omni-directional models and the variogram parameters are shown in Table 9. The vertical (i.e., Z) range of the planar variogram model is replaced by the range determined from the downhole variogram. Where necessary (Driefontein 5 TSF and Kloof 1 TSF) both the downhole and planar variograms were conducted using top-cuts, determined from the probability plots generated for each element for each TSF. 11.3. Mineral Resource Classification The applied Mineral Resource classification is a function of the confidence of the asset tenure and consideration of the entire process from drilling, sampling, geological understanding and geostatistical relationships. FWGR’s legal tenure is secured through the necessary permitting required to access and exploit the moveable assets. The drilling, sampling, analytical processes and governance of the exploration programs have been appropriate and in-line with industry best practice and are considered to be of high confidence. The density used in the conversion from volume to tonnage has been determined from both in situ measured values and empirical data and is considered reliable.


65 Far West Gold Recoveries (Proprietary) Limited Document No: PR/SMI/1684/26 In addition, the following statistical criteria were applied to the Mineral Resource classification: • number of samples used to estimate a specific block: o Measured - at least four drillholes within the variogram range and minimum of twenty 1.5m composited samples; o Indicated - at least three drillholes within the variogram range and a minimum of twelve 1.5m composite samples; o Inferred - less than three drillholes within the variogram range. • distance to sample (variogram range): o Measured - within at least 60% of variogram range; o Indicated - within variogram range; o Inferred - further than variogram range. • lower confidence limit (blocks): o Measured - less than 20% from mean (80% confidence); o Indicated - 20% to 40% from mean (80% to 60% confidence); o Inferred - more than 40% (less than 60% confidence). • Kriging efficiency: o Measured - more than 40%; o Indicated - 20% to 40%; o Inferred - less than 20%. • Kriged variance - a relative parameter used in conjunction with the other criteria. • deviation from lower 90% confidence limit (data distribution within the Mineral Resource area considered for classification): o Measured - less than 10% deviation from the mean; o Indicated - 10% to 20%; o Inferred - more than 20%. In accordance with the criteria noted above all of the TSF Mineral Resources were classified as Measured Mineral Resources. 11.4. Mineral Resource Verification The following data was received, interrogated, and verified by Sound Mining (Table 8). Table 8: Data Interrogated per TSF TSF De-surveyed DataMineTM Borehole File Final Block Model Report Driefontein 5 compall1_au_u_s.dm 2.4_d5_depl_blw_bm.d mx 2026 FWGR TRS Driefontein 3 Combined_Composite_3m - BM 8.2_D3_Ext_Depl_NewR es_BM.dmx 2026 FWGR TRS Kloof 1 compall.dm kl1_krig_all_final3c.dm Minxcon 2009 Kloof 2 Combined Composite 1.5m - BM.dat K2 OK 2.dat 2026 FWGR TRS Libanon compall1.dm lib_krigall1_2010c.dm Minxcon 2009 Venterspost North BHA.dm vn_krig_all1_fin2d.dm Minxcon 2009 Venterspost South COMPALL1.dm vs_krig_all1_final2c.dm Minxcon 2009 Source: Sound Mining, 2026 66 Far West Gold Recoveries (Proprietary) Limited Document No: PR/SMI/1684/26 For the 2009 estimates, no original laboratory assay reports were received for verification of the assay results; however, it must be noted that head grade assays of the Driefontein 5 TSF correspond with that expected from the Mineral Resource model. An interrogation of the stated modeling parameters yielded acceptable results and demonstrated that the variography and parameters used in the Kriging process are reasonable (Table 9). The QP concludes that the reported Mineral Resource estimation methodologies and interpretations are reasonable and can be relied upon to reflect the Mineral Resource base for FWGR. Table 9: Variogram Parameters TSF Parameter Domain Sill Nugget Structure Partial Sill Range Driefontein 5 Au 1 0.0292 0.0052 1 0.0148 124.0 2 0.0092 544.6 Driefontein 3 Au 1 0.0240 0.0068 1 0.0151 133.7 2 0.0021 654.6 Kloof 1 Au 1 0.00823 0.00457 1 0.00224 119.5 2 0.00149 406.4 Kloof 2 Au 1 0.0121 0.00457 1 0.0061 161.0 2 0.0014 539.0 Libanon Au 1 0.0178 0.008 1 0.0083 130.0 2 0.0015 522.5 Venterspost North Au 1 0.0250 0.0072 1 0.0155 123.4 2 0.0023 384.8 Venterspost South Au 1 0.0196 0.0058 1 0.0091 117.0 2 0.0047 272.1 Source: Minxcon, 2009 and Sound Mining, 2026 11.5. Cross-sections and Grade Distribution Cross-sections and grade distribution through each TSF are provided in Figure 13 to Figure 19. Reclamation has commenced on both the Driefontein 5 TSF and the Driefontein 3 TSF and the cross-sections accordingly present the depleted TSFs as at June 30, 2026. The other TSFs have not yet been reclaimed. Driefontein 5 TSF and Driefontein 3 TSFs have the highest average grade of 0.54g/t Au and 0.47g/t Au respectively. Driefontein 3 TSF, Kloof 2 TSF, and Venterspost North TSF show a clear trend where grade increases with depth, whilst Driefontein 5 TSF appears to have no such pattern. Kloof 1 TSF and Libanon TSF show a slight increase in grade with depth, whilst the opposite is the case for Venterspost South TSF where grades increase quite markedly towards the surface. Libanon TSF and Venterspost North TSF display the lowest average grades but are both fairly large deposits of 74.3Mt and 55.3Mt respectively. 67 Far West Gold Recoveries (Proprietary) Limited Document No: PR/SMI/1684/26 Figure 13: Cross-Sections and Grade Distribution - Driefontein 5 TSF Source: Sound Mining, 2026 68 Far West Gold Recoveries (Proprietary) Limited Document No: PR/SMI/1684/26 Figure 14: Cross-Sections and Grade Distribution - Driefontein 3 TSF Source: Sound Mining, 2026


69 Far West Gold Recoveries (Proprietary) Limited Document No: PR/SMI/1684/26 Figure 15: Cross-Sections and Grade Distribution - Kloof 1 TSF Source: Sound Mining, 2023 70 Far West Gold Recoveries (Proprietary) Limited Document No: PR/SMI/1684/26 Figure 16: Cross-Sections and Grade Distribution - Kloof 2 TSF Source: Sound Mining, 2026 71 Far West Gold Recoveries (Proprietary) Limited Document No: PR/SMI/1684/26 Figure 17: Cross-Sections and Grade Distribution - Libanon TSF Source: Sound Mining, 2023 72 Far West Gold Recoveries (Proprietary) Limited Document No: PR/SMI/1684/26 Figure 18: Cross-Sections and Grade Distribution - Venterspost North TSF Source: Sound Mining, 2023


73 Far West Gold Recoveries (Proprietary) Limited Document No: PR/SMI/1684/26 Figure 19: Cross-Sections and Grade Distributions - Venterspost South TSF Source: Sound Mining, 2023 74 Far West Gold Recoveries (Proprietary) Limited Document No: PR/SMI/1684/26 11.6. Reasonable and Realistic Prospects for Economic Extraction Both Mineral Resources and Mineral Reserves for FWGR are determined by the average grade of a TSF which must be above or equal to a plant feed cut-off grade for each TSF. The assumptions on a Mineral Resource cut-off include working costs, the average plant recovery, the expected residue grade, the required yield based on working cost and gold price. The cut-off assumptions for FWGR (Item 13.2) have been based on the experience of FWGR from its current (i.e., Phase 1) operations. The capital and operational costs of the infrastructure and mining equipment have been estimated at a level of accuracy of -5%, +15%, and all services including water and power are current and appropriately priced. A real gold price of ZAR2,155,461/kg was used in the estimation of the Mineral Resources and Mineral Reserves as at June 30, 2026. The QP is comfortable with this price assumption in the context of the long-term consensus pricing used by FWGR for its LoM and annual business planning. These prices are based on information received from various independent sources. The economic assessment provided in this TRS demonstrates positive margins and confirms reasonable prospects for eventual economic extraction for all FWGR’s TSFs at an average cut-off grade of 0.14g/t. The average grades of the TSFs included in the Mineral Resource statement are therefore all above 0.14g/t. This means that the Mineral Resources when stated exclusive of Mineral Reserves will amount to zero because all of the Mineral Resources will be exploited and converted to Mineral Reserves. The QP is of the opinion that reasonable technical and economic factors have been considered and that there are reasonable and realistic prospects for economic extraction of the Mineral Resources as at June 30, 2026. There are no permitting risks in relation to mineral title with regard to eventual extraction. Security of tenure for eventual extraction is premised on common law ownership and EAs. Access to the moveable assets has been provided in the “Use and Access Agreement” with Sibanye Gold. The granting of the necessary environmental authorizations and permits to continue operations are in place. 11.7. Mineral Resource Estimation FWGR currently owns seven TSF assets totaling 270.5Mt with a total gold content of 80.47t (on a Mineral Reserve inclusive basis). All Mineral Resources estimates fall within the Measured Mineral Resource category. Table 10 presents the Mineral Resource estimate inclusive of Mineral Reserves for FWGR as at June 30, 2026. Please note that if Mineral Resources were stated exclusive of Mineral Reserves, the figures would equate to zero. 75 Far West Gold Recoveries (Proprietary) Limited Document No: PR/SMI/1684/26 Table 10: Measured Mineral Resource Estimate Inclusive of Mineral Reserves for FWGR as at June 30, 2026 TSF Volume ('000m3) Density (t/m3) Quantity (Mt) Grade (g/t) Content (t) Content (koz) Driefontein 5 179 1.42 0.25 0.54 0.14 4.45 Driefontein 3 22,586 1.42 32.07 0.47 15.21 489.08 Kloof 1 19,931 1.42 28.30 0.33 9.20 295.89 Kloof 2 47,438 1.42 67.36 0.24 16.29 523.69 Libanon 52,351 1.42 74.34 0.27 20.23 650.41 Venterspost North 38,954 1.42 55.32 0.27 15.16 487.26 Venterspost South 9,068 1.42 12.88 0.33 4.24 136.47 Total Measured Mineral Resource Estimate 190,507 1.42 270.52 0.30 80.47 2,587.25 Source: Sound Mining, 2026 Notes: Apparent computational errors due to rounding All of these Mineral Resources are above the cut-off grade of 0.14g/t All Mineral Resource estimates fall within the Measured Mineral Resource category In situ Mineral Resource estimate reported according to S-K 1300 requirements No geological losses applied The Mineral Resource estimates presented in Table 10 are reported inclusive of Mineral Reserves. Mineral Resources exclusive of Mineral Reserves will equate to zero, as the entirety of the TSFs are mined. It accounts for a bulk density of 1.42t/m3 and caters for the depletion of the Driefontein 5 TSF and Driefontein 3 TSF through hydro-mining until June 30, 2026. 11.8. Additional Mineral Resources Once decommissioned, FWGR is contractually entitled to receive the Driefontein 1, Driefontein 2, and Leeudoorn from Sibanye Gold as a part of the 2018 Exchange Agreement. These represent growth options available for FWGR to extend the LoM, but do not form part of FWGR’s current Mineral Resource. In addition to these currently available TSFs, the area hosts other potentially available TSFs. 11.9. Concluding Comments Upon interrogation of borehole and production data, Sound Mining observes the continuation of gold grade beyond the TSF material and into the footwall. This grade does not form part of the Mineral Resource estimation. No geological losses have been applied as the entire volume of the TSF will be mined. The initial TSF Mineral Resources were estimated by Minxcon 2009, confirmed by Sound Mining through remodeling of the TSFs in 2018 and then updated and restated. In 2026 Sound Mining oversaw the exploration drilling on Driefontein 3 and Kloof 2 TSFs and is satisfied with the quality of this data which was used to update the geological models and Mineral Resource estimates for each TSF. Both Driefontein 5 and Driefontein 3 TSFs have been depleted through reclamation, and the Kloof 2 TSF has been added to the overall Mineral Resource estimate. Sound Mining has accordingly updated the Mineral Resource estimate as at June 30, 2026. The QP is of the opinion that there are no material risks which are expected to hinder the prospects for reasonable and realistic economic extraction of the Mineral Resources. Both the actual recoveries and grades may differ to those used for the Mineral Resource estimate during exploitation of the TSFs, but experience from the reclamation to date suggests that these variations are unlikely to be material. The QP also notes that the underlying geology from which the TSFs are comprised, is similar and does not expect significant variation. 76 Far West Gold Recoveries (Proprietary) Limited Document No: PR/SMI/1684/26 12. MINERAL RESERVE ESTIMATES ITEM 12 (I); (II); (III); (IV); (V) AND (VI) The Mineral Reserves were prepared in accordance with the requirements of S-K 1300 (Table 11) and at a real gold price of ZAR2,155,461/kg, which FWGR has used for both LoM and annual business planning. The price assumption is based on information provided by various independent institutions that do commodity forecasting. ZAR2,155,461/kg is considered a reasonable representation of the price to be expected over the 20-year LoM in real June 30, 2026, terms. The operation remains economically viable above a gold price of ZAR992,201/kg (Item 19.3). The LoM plan and production schedule was developed by FWGR and is presented in Item 13.2. No mining losses or dilution are applied in determining the Mineral Reserve estimates because the TSFs are re-mined and re-processed in their entirety. All other modifying factors are captured in the LoM plan together with all of the associated technical aspects that inform the capital and operating cost estimates. The LoM plan was tested for economic viability in a discounted cash flow (DCF) model which indicated a positive cash flow through to the end of the LoM. FWGR’s seven TSF assets convert to a total Mineral Reserve of 270.52Mt with a gold content of 80.47t. Table 11: S-K 1300 Compliant Mineral Reserve Estimate as at June 30, 2026 TSF Volume ('000m3) Density (t/m3) Quantity (Mt) Grade (g/t) Content (t) Content (koz) Driefontein 5 179 1.42 0.25 0.54 0.14 4 Driefontein 3 22,586 1.42 32.07 0.47 15.21 489 Kloof 1 19,931 1.42 28.30 0.33 9.20 296 Kloof 2 47,438 1.42 67.36 0.24 16.29 524 Libanon 52,351 1.42 74.34 0.27 20.23 650 Venterspost North 38,954 1.42 55.32 0.27 15.16 488 Total Proved Mineral Reserve 181,439 1.42 257.64 0.30 76.23 2,451 Venterspost South 9,068 1.42 12.88 0.33 4.24 136 Total Probable Mineral Reserve 9,068 1.42 12.88 0.33 4.24 136 Total Mineral Reserve Estimate 190,507 1.42 270.52 0.30 80.47 2,587 Source: Sound Mining, 2026 Notes: Apparent computational errors due to rounding and are not considered significant Mineral Reserves are reported using a dry density of 1.42t/m3 and at the head grade on delivery to the plant The Mineral Reserves constitute the feed to the gold plants The Mineral Reserves are stated at a price of ZAR2,155,461/kg A cut-off grade of 0.14g/t is applicable to the FWGR LoM plan Although stated separately, the Mineral Resources are inclusive of Mineral Reserves Venterspost South TSF is classified as a Probable Mineral Reserve due the level of uncertainty regarding the processing recovery Uranium has been excluded in the Mineral Reserve estimate as it is not being recovered by FWGR Grade and quantity measurements are reported in metric units (Mt) rounded to two decimal places The Mineral Reserve estimates contained herein may be subject to legal, political, environmental or other risks that could materially affect the potential development of such Mineral Reserves


77 Far West Gold Recoveries (Proprietary) Limited Document No: PR/SMI/1684/26 12.1. Risk to the Mineral Reserve Estimate Uncertainties associated with the FWGR operations, and therefore the Mineral Resource and Mineral Reserve estimate, can all be mitigated. Sound Mining has not exposed any fatal flaws to the successful execution of the LoM plan, and the QP does not anticipate any material changes to the associated modifying factors. The uncertainties requiring comment in the context of their impact on these estimates are: • Mining: whilst the mining method and practices are well established and conducted by experienced hydro-miners, throughput could be affected by a variety of issues, including, but not limited to the availability of electricity and water. • Quality of the Mineral Assets: the seven TSFs that comprise the Mineral Reserve have all been adequately drilled, their likely content adequately assessed, and recovery test work satisfactorily completed. The actual recoveries will be influenced by the actual RoM grade entering DP2 and the amount of carbon (elemental and/or organic) in the RoM. This risk could be managed by blending material from different TSFs, if applicable. • Plant Performance: the management of the risk of a lower-than-expected overall throughput recovery is likely to be mitigated by implementing the UFR circuit. • RTSF Operational Risk: the QP considers the main operational risk of the RTSF to be water management. During the initial stages of operation, the presence of the basin liner and the phased implementation of the drainage system may limit the ability of incident water to drain from certain areas of the RTSF. • Delayed Commissioning of Key Infrastructure: any delays to the scheduled commissioning of the RTSF or expanded processing capacity of DP2 will impact on the proposed production forecast and anticipated revenues. Both Projects are currently progressing in accordance with the schedule and, the current LoM plan only requires RTSF by late FY2027. • Water Supply: South Africa is a relatively dry area and predictions are that dry conditions will escalate. Mining is heavily reliant on water to transport material over large distances and for processing. FWGR uses potable water for potable usage and not mining operations. Process water is secured through a combination of harvested return water from the treated tailings and dewatering from local shaft systems and local wellfields. • Power Supply: power is provided by the national power supplier, Eskom. The national power supply and distribution infrastructure is severely distressed, and this results in frequent disruptions to the power delivered to the South African mining industry. There is a curtailment agreement in place with Eskom which requires that during blackouts electricity use is to be curtailed, which is typically achieved by shutting down the milling section. Diesel generators are used to maintain critical equipment during power interruptions and facilitate a quicker restart of the plant once power is restored. Sound Mining understands that no alternative power supply arrangements are currently in place at FWGR and as such consider the threat of production losses resulting from power disruption to represent a significant production risk. • Long-term Sustainability: continued production beyond the current LoM plan and Mineral Reserve estimate relies on available TSFs that can be brought on line in the future. There is ample time for additional sampling and resource modeling to confirm their extent and content prior to production and the three currently available TSFs envisaged by FWGR’s long-term operational aspirations, are controlled by Sibanye Gold. Sound Mining do not envisage any future security of tenure complications arising from the inclusion of these TSFs in the overall LoM plan. • Extreme Weather: As a result of climate change, extreme weather events such as droughts, extreme rainfall and high wind volumes are on the increase. Specifically, the increase in intensity of events, such as thunderstorms on the Highveld, where the operations are situated, will impact operations. Major property, infrastructure and/or environmental damage as well as loss of human life could also be caused by extreme weather events. • Rising Costs: The global economic environment, geopolitical tensions and inflationary pressures world-wide have led to above inflationary increases in production costs as well as an unavailability of critical material such as reagents and critical equipment which affects production and operating costs. FWGR remains a relatively low-cost operation, however a prolonged period of high inflation will erode financial value over time. 78 Far West Gold Recoveries (Proprietary) Limited Document No: PR/SMI/1684/26 • Gold Price: FWGR takes full exposure to the gold price, and therefore a reduction in the price of gold may erode margins. • Supply Chain Risks: The operations are dependent on the reliable supply of key inputs, including cyanide, natural gas, and diesel. Supply disruptions, limited supplier availability, geopolitical events and price increases could increase operating costs and, if prolonged, reduce production. Cyanide supply risk is partly mitigated through the use of liquid cyanide and the commissioning of a briquette plant. • Regulatory Changes: The proposed Draft Mineral Resources Development Bill, 2025 may introduce additional regulatory requirements for the processing of historical tailings, including potential requirements to obtain a mining right for processing movable historical tailings. If enacted, the proposed legislation could increase regulatory requirements and costs and may restrict the ability to process tailings. For additional information regarding the Company’s risks, see Item 3D of the Form 20-F. 79 Far West Gold Recoveries (Proprietary) Limited Document No: PR/SMI/1684/26 13. MINING METHOD ITEM 13 (I); (II); (III); (IV) AND (V) The mining method is hydro-mining (or hydraulic mining), which uses high-pressure water monitors to deliver a high- pressure water jet to hydraulically repulp and mobilize tailings material within the TSFs. The water from the monitors mixes with the tailings and forms a slurry with a high solids content. The slurry flows under gravity along channels at the base of the dump to a collection sump at the lowest elevation of the bench being mined. Screens are installed to remove debris, which must be cleaned regularly to prevent an impact on the pumping operations. The monitors comprise 200mm self-propelled track monitor guns (Photograph 1), each with production rates of up to 300ktpm. They discharge approximately 500m3/hr of water at pressures up to 30bar through a variable sized nozzle depending on the hardness of the material being slurried, and can be controlled remotely by the operator. In order to minimize hydraulic pressure losses and poor reclamation gun efficiencies, water pressure is designed to reach the monitor guns at a minimum pressure of 25bar. Photograph 1: Monitor Gun Source: FWGR, 2020 The prerequisites for hydro mining are limited to the infrastructure discussed in Item 14 and Item 15. Pre-stripping and backfilling processes are not applicable to this mining method. Early forms of hydraulic mining were adapted from methods developed in the United Kingdom for the mining of primary kaolin deposits. These early attempts used a high-pressure monitor located at the base of the TSF to wash material from the base of the slope. A disadvantage of this approach is that by directing the water jet at the base of the slope, the slope is undercut and can become unstable, leading to uncontrolled slope failure. With sufficient off-set distance between the slope and the monitor and/or monitor operator, this is not necessarily a problem, however, given that many of the tailings dams that are available for reprocessing are located in urban locations, a safer system of monitor operation has subsequently been developed. The majority of tailings dams that have been mined in the last twenty years have utilized a monitor located on the upper bench of the tailings dam, directing a water jet downwards to cut a stable slope surface into the face of the TSF. This approach has been successfully applied within densely populated urban areas. It is considered 80 Far West Gold Recoveries (Proprietary) Limited Document No: PR/SMI/1684/26 safer and allows for rapid changes in slope angles to cope with any operational variances that may be encountered. The slopes usually consist of a 15m high bench with a 45º to 50º slope angle. Consistent slope angles can be maintained using the top-down hydraulic mining technique as shown in Figure 20 and Figure 21. Figure 20: Mining Methodology Source: Sound Mining, 2026 Figure 21: Mining Widths Source: Sound Mining, 2026 Increased production is achieved by the inclusion of additional units and this modular approach provides a high degree of flexibility that allows simultaneous mining at a number of points over a wide range of production rates and consequently, grade blending is readily achievable if required.


81 Far West Gold Recoveries (Proprietary) Limited Document No: PR/SMI/1684/26 The slurry density produced by the monitors is controlled by the operator. Actively moving the monitor and consistently cutting the face results in a slurry with relatively high solids content. Experience from FWGR’s ongoing operations has demonstrated that slurries with 35% to 50% solids can consistently be achieved. The monitor guns seek to maintain optimal slurry densities in the region of 1.42t/m3. The TSFs material, has a typical particle size of 70% <75µm. Relatively flat flow channels will develop with gradients in the order of 1:100m. The position of the sump will change as mining proceeds along a bench, to limit the distance between the monitor and the sump. If too far from the active face, tailings material may drop out of suspension and reduce the solids content of the slurry pumped to the plant. However, the slurry tends to flow at a natural beaching angle which is generally self-correcting. If the slope gets too steep, flow velocities increase in the channels causing erosion until the equilibrium slope is attained. If the slope is too flat the solids settle out reducing the height of the mining face until the equilibrium slope is achieved (Figure 21). A monitor gun dislodges the in-situ material which washes into slurry channels (Photograph 2). Photograph 2: Monitor Gun in Operation Source: FWGR, 2023 The slurry flows through the channel and passes through screens to remove debris which may cause blockages in the pipeline. After screening, the slurry collects in the sump and is pumped to the plant for processing. Slurry densities are maintained at approximately 1.42t/m3, for optimal pipeline performance. 82 Far West Gold Recoveries (Proprietary) Limited Document No: PR/SMI/1684/26 13.1. Mining Plan and Layout The hydro-mining and re-deposition of tailings is outsourced to competent and experienced service providers. The hydro- mining performance assumptions are based on the current operations where the method has been successfully “tried and tested”. The equipment requirements, manning complements and necessary supporting infrastructure, in terms of water and power supply, are well understood and have been accurately planned by both FWGR and their current service provider. No untested technical assumptions with regards to the mining have been made. Monitors remove the tailings material from the top of a TSF to the natural ground level in 15m layers. The monitor is positioned on the top of the working bench to direct the water jet down into the TSF. It will work the face in one direction along the front edge of the dam before returning in the opposite direction when it reaches the far end of the dam. As the mining faces advance, slurry is directed via launders to a pit pump which then transfers the slurry to a fixed transfer pump station that includes a vibrating trash screen. A stepped bench approach is planned to maintain slope stability. Horizontal benches of 100m to 200m, inclusive of the face angle, are created for safe working distances between simultaneous operations at different bench elevations. The layout is illustrated in a schematic cross-section (Figure 22). Figure 22: Mining Sequencing Source: Sound Mining, 2026 The top and second layers progress simultaneously until a safe distance (~200m) for the third 15m layer is reached, and so forth until ground level is reached and the entire TSF is reclaimed. As mining progresses and the footprint is exposed, the final layer is cleared, prepared and rehabilitated. 13.2. Modifying Factors and Mining Schedule No mining losses or dilution are applied in determining the Mineral Reserve estimates because the TSFs are re-mined and re-processed in their entirety. All other modifying factors are captured in the mine design together with all of the associated technical aspects that inform the capital and operating cost estimates. The QP has observed from on-site inspections of the mining process that FWGR also reclaims footwall material, where deemed economically viable. This practice could imply the application of an appropriate modifying factor in the derivation of Mineral Reserves when not part of the Mineral Resource estimate. FWGR are keeping suitable records to assess the materiality of this practice on the Mineral Reserve estimate and if material may be included in future Mineral Reserve estimates. 83 Far West Gold Recoveries (Proprietary) Limited Document No: PR/SMI/1684/26 Table 12 reports the production as scheduled from the TSFs. It reveals a total recovered RoM quantity of 270.52Mt at an average head grade of 0.30g/t. Table 12 also presents the average metallurgical recovery anticipated from each TSF. Table 12: Scheduled RoM Production TSF Mineral Resource Category RoM Quantity (Mt) In situ Grade (g/t Au) Recovery (%) Driefontein 5 Measured 0.25 0.54 51.9 Driefontein 3 Measured 32.07 0.47 51.5 Kloof 1 Measured 28.30 0.33 50.5 Kloof 2 Measured 67.36 0.24 42.1 Libanon Measured 74.34 0.27 47.2 Venterspost North Measured 55.32 0.27 48.9 Venterspost South Measured 12.88 0.33 57.6 Total 270.52 0.30 48.24 Source: Sound Mining, 2026; and FWGR, 2026 The reclamation sequence presents a phased approach to increasing production (Graph 1). Graph 1: LoM Production Forecast Source: Sound Mining, 2026 Graph 1 illustrates the inclusion of the Available TSFs in the longer-term. This growth strategy is aligned using the designed RTSF capacity and DP2 upgrade. - 500 1 000 1 500 2 000 2 500 3 000 - 2 000 4 000 6 000 8 000 10 000 12 000 14 000 16 000 2 0 2 7 2 0 2 8 2 0 2 9 2 0 3 0 2 0 3 1 2 0 3 2 2 0 3 3 2 0 3 4 2 0 3 5 2 0 3 6 2 0 3 7 2 0 3 8 2 0 3 9 2 0 4 0 2 0 4 1 2 0 4 2 2 0 4 3 2 0 4 4 2 0 4 5 2 0 4 6 G o ld R e co v e re d ( k g ) T o n s ( M t) Driefontein No 5 TSF Driefontein No 3 TSF Libanon TSF Kloof 1 TSF Kloof 2 TSF Venterspost South TSF Venterspost North TSF Recovered Gold 84 Far West Gold Recoveries (Proprietary) Limited Document No: PR/SMI/1684/26 13.3. Cut-off Grade A cut-off grade has been computed for each TSF considering the assumed gold price, anticipated recovery through the planned plant and the expected operating costs. The results are presented in Table 13. The cut-off grades for the respective dumps range from 0.11g/t to 0.16g/t with an average of 0.14g/t. Table 13: Calculated Cut-off Grades TSF Cut-off Grade (g/t) Driefontein 5 0.13 Driefontein 3 0.13 Kloof 1 0.13 Kloof 2 0.16 Libanon 0.14 Venterspost North 0.13 Venterspost South 0.11 Source: Sound Mining, 2026 13.4. Mining Contractor The cost and maintenance of the mining equipment at reclamation sites, employees and other operational resources are for the operating contractor’s account. They are the subject of contractual agreements with FWGR. Initial capital is not required for the mining. The equipment (i.e., monitor guns) supplied by the contractor is shown in Table 14. Table 14: Mining Equipment Planned for each TSF TSF Steady State Production (ktpm) Required Units (Number) Driefontein 5 45 1 Driefontein 3 600 2 Kloof 1 600 2 Kloof 2 600 2 Libanon 600 2 Venterspost North 600 2 Venterspost South 600 2 Source: Sound Mining, 2026 Driefontein 5 is approaching depletion and is now considered a cleanup site with an immaterial contribution to the steady state production. The mining contractor currently relies on two active mining units with a third unit in transit to the next planned set-up position. The operating cost estimate for the mining and re-deposition of tailings is supported by actual operational figures. They are presented in the working cost estimates as “contractor costs”. The capital expenditure estimates for the pipeline and pumping design to move the RoM material to the respective plants for processing and for the return of the processed material (new arisings) for re-deposition, is provided in Item 18. 13.5. Concluding Comments Hydro-mining is an existing “tried and tested” process which is well understood. The contractor is entitled to decide on various operational alternatives and to deploy capital equipment and manage costs. The QP has checked the integrity of the mine design and associated costs and is satisfied with the level of detail and accuracy of the study work completed. The selective mining of portions of a TSF is not considered an option by Sound Mining.


85 Far West Gold Recoveries (Proprietary) Limited Document No: PR/SMI/1684/26 From a health and safety perspective, hydro-mining does not create, but rather ameliorates the airborne dust problem often associated with fine tailings material. Safe bench heights are governed by the material’s strength which is influenced by the phreatic surface within a TSF. These have been dormant for many years, and the phreatic surface is generally well below the surface of the dumps. The drilling program to define the Mineral Resource did not encounter saturated zones or phreatic surfaces and so the risk of slope failure or liquefaction is considered to be low. Slope stability is however managed and the hydrological aspects affecting the TSFs are not considered significant to the operation. There is a clean/dirty water separation system with emergency paddocks to prevent any spillage or run-off from the facilities. These assist in preventing choked screens from vegetation or heavy rainstorm events, where the runoff needs to be contained prior to being pumped through the circuit back to the TSF. 86 Far West Gold Recoveries (Proprietary) Limited Document No: PR/SMI/1684/26 14. PROCESS AND RECOVERY METHODS ITEM 14 (I); (II); (III) AND (IV) An expansion of the currently operating DP2 processing plant is planned to facilitate an increase in processing throughput from the current TSF Mineral Reserve inventory. 14.1. Existing DP2 Processing Facility Phase 1 of FWGR’s long-term growth strategy required that the original DP2 be modified and refurbished to accommodate up to 600ktpm of RoM slime from the TSFs. This has been accomplished but with a throughput constraint of approximately 500ktpm imposed by the maximum deposition rate for new arisings onto the Driefontein 4 TSF. Based on current deposition rates, along with remodeling and reassessing, this TSF is due to reach its storage capacity in mid-2027. The Phase 1 work on the plant included a refurbishment of the conventional CIL plant and modifications to the milling and cyclone circuits to improve gold liberation as suggested by metallurgical test work. The existing primary ball mill design was modified to incorporate an overflow discharge rather than the grate discharge and the use of a 30mm ball charge instead of the 50mm ball size that was included in the original mill design. This improved contact between grinding media and gold ore particles for increased grinding efficiency in gold liberation. A new 45m diameter hi-rate thickener was also installed. The achievable grind of 70% <75µm proved to be satisfactory for current gold recoveries, however, closed circuit milling with cyclones was introduced for an improved grind of between 75% and 80% <75µm to improve the liberation of gold locked within coarser silicates. Further revisions to the process flow have since included a copper elution step on the loaded carbon, which delivers a higher-grade gold bar and an improved efficiency of gold removal from cathodes, by improving the gold to copper ratio in the RoM feed. Graph 2: Actual Production of DP2 for FY2020 to FY2026 Source: FWGR, 2026 Graph 2 and Graph 3 show actual DP2 plant production capacity and plant recoveries over the period FY2020 to FY2026. DP2 Plant throughput has remained stable over the past 3 financial years (FY2024 to FY2026) and has demonstrated greater throughput compared to FY2020 to 2023 (Graph 8). Metallurgical recovery in FY2026 has consistently remained above the forecast recovery and has shown more consistent recoveries than previous financial years. However, it should be noted that the metallurgical plant recoveries will be materially affected by plant head grade. - 100 200 300 400 500 600 Q u a n ti ty ( k t) Months Production (FY 2020) Production (FY 2021) Production (FY 2022) Production (FY 2023) Production (FY 2024) Production (FY 2025) Production (FY 2026) Phase 1 LoM Plan 87 Far West Gold Recoveries (Proprietary) Limited Document No: PR/SMI/1684/26 Graph 3: Actual Plant Recovery for DP2 versus Forecast Recovery for FY2020 to FY2026 Source: FWGR, 2026 The process flow is as follows: • the slurry from the hydro-mining operation is pumped to a surge tank via a 25m2 linear trash screen (800μm). Lime, sourced from a contract supplier as milk of lime, is added directly into a receiving tank for pH control; • from the receiving surge tank, the slurry is pumped to the milling and classification section from where the cyclone overflow reports to the thickener for thickening to 1.45t/m3 before being pumped to the CIL plant; • the CIL section comprises seven tank stages of 1,600m3 per tank combining to approximately twelve hours residence time. Each tank is fitted with carbon retaining screens and a recessed impeller vertical spindle carbon transfer pump. Sodium cyanide solution is added to CIL Tank 1 and Tank 2 in order to maintain the required concentration for the leach reaction. Slurry flows downstream through the screens and via launders from CIL Tank 1 to CIL Tank 7 from where it exits to the 25m2 tailings linear screen. Fine carbon is recovered from the screen overflow while the underflow is pumped by the CIL tailings pump to the tailings tank at the slurry receiving area; • loaded carbon flows upstream from CIL Tank 7 to CIL Tank 1 and is recovered daily from the CIL tank 1 by batch transferring of carbon slurry to the loaded carbon screen and into a holding tank for transfer to the elution circuit; • loaded carbon is batch processed through a 9t elution circuit for gold stripping with the stripped solution reporting to 128m3 holding tanks; • the solution is passed through a zinc precipitation process for recovering gold from dilution. The sludge is then calcined and smelted into doré bars; • the doré bars are dispatched to Rand Refinery Limited for final refining; • the eluted carbon is thermally regenerated in a horizontal kiln at 700°C and returned to DP2 for re-use in the CIL circuit. Fresh carbon is added to the circuit as required; and • CIL tailings and oversize waste from the incoming TSF re-mined slurry is stored in a mechanically agitated surge tank and pumped by the final tailings pumps to the Driefontein 4 TSF. 88 Far West Gold Recoveries (Proprietary) Limited Document No: PR/SMI/1684/26 14.2. Expansion of DP2 The expansion of DP2 from 600ktpm to a higher throughput rate of 1.2Mtpm has been undertaken as scheduled during FY2025 and FY2026, although the plant will only be required to treat an increased throughput from mid-2027 when the new RTSF is planned to be preliminary commissioned and operational. The design approach to the DP2 expansion has been to modify existing ball milling capacity and duplicate existing processing circuits. In addition to these upgrades, FWGR has elected to construct a UFR circuit which is installed after the plants' CIL process. The UFR infrastructure is scheduled to be constructed from June 2026 to June 2027. The block plan shown in Figure 23 presents the latest DP2 plant layout. Figure 23: DP2 Block Plan Source: FWGR, 2026 Historically achievable plant gold recoveries are expected to be realized from the expanded DP2 plant with gold recoveries being principally driven by the plant feed head grade. In addition, the UFR is expected to improve recoveries, however this improvement is still to be quantified though ongoing test work.


89 Far West Gold Recoveries (Proprietary) Limited Document No: PR/SMI/1684/26 ZAR108 M (excluding contingencies) has been included in the LoM plan for the remaining portion of this expansion with a further ZAR792M allocated to the UFR, giving a total of ZAR900M for the expansion. The principal areas of capital expenditure are: • Slurry Receiving and Trash Screening: the hydraulically mined material is pumped over trash screens before entering the respective receiving tanks. Lime can be added in the receiving tank for pH correction. From the slurry receiving tanks the material is pumped either to the classification and milling circuit or can be bypassed directly to the CIL or pre- leach thickeners. The provision addresses process design screen changes and the tank volume adjustments necessary to address the increased production capacity. • Milling and Thickening: prior to milling the material passes through a primary classification stage, via cycloning, where after the coarser material is closed circuit milled and the finer material from the milling circuit directed to the pre-leach thickeners. Thickener underflow is pumped to a second set of trash linear screens prior to CIL. The provision addresses the newly designed cyclone cluster installations, the new 45m diameter thickener circuit, along with all the adjustments and modifications necessary to the current ball milling circuit. • Leach and Adsorption: reclamation slurry is either pumped directly to the CIL or first passes through the classification, milling and thickening circuits before passing through the CIL trash screens and into the CIL. Each circuit consists of one stage of pre-oxidation and seven stages of CIL where gold is leached and adsorbed onto activated carbon, which flows counter-currently to gold-bearing slurry. Loaded carbon is directed to the holding hopper before being transferred to the elution circuits while tailings pass over carbon safety screens before being pumped to the final tailings tank. The provision provides for the installation of a new CIL section which will duplicate the currently installed capacity. • Tailings Disposal: CIL tails gravitate through to carbon safety screens. The screen oversize is pumped to the fine carbon handling circuit ensuring that any carbon passing through the CIL circuit is recovered. The screen undersize is sampled before being collected in the final tailings tank and then pumped to the TSF. The provision recognizes the requirement for additional pumping infrastructure to deliver the increased throughput capacity to the RTSF. • Services and Distribution: this provision considers all the supporting bulk services required for the plant expansion and includes the necessary road access construction for the expanded plant site. • Water and Air Services: the requirements for process water and compressed air services at the increased production capacity are covered by this provision. • Reagents: this provision covers the infrastructure necessary to ensure correct reagent dosage in the duplicated processing circuits. • Elution and Carbon Handling: loaded carbon from the CIL circuit is directed to the holding hopper to remove any foreign particles prior to elution. Adsorbed gold will be eluted from the activated carbon by means of a heated solution of sodium cyanide and caustic soda. Acid wash takes place in the elution column prior to gold elution. This elution process is followed by rinsing and cooling stages. Eluted carbon from the batch elution process will be directed to carbon regeneration while the pregnant eluate solution will be routed to pregnant solution tanks for zinc precipitation. The barren carbon from the elution circuits passes through carbon regeneration kilns to volatilize off impurities and reactivate the carbon where after it is transferred back to the last CIL tank of each circuit. The provision addresses the requirement for the installation of a new elution and carbon handling circuit which will duplicate the currently installed capacity. • Zinc Precipitation and Smelting: Gold in solution from the elution circuit will be recovered by zinc precipitation in plate and frame filters. The provision addresses the requirement for the installation of a new zinc precipitation and smelting circuit which will enable the production of doré to match the currently installed capacity. • Indirect Capital: which is comprised of Construction Costs, First Fill Consumables, Commissioning and Spares and Project Services. 90 Far West Gold Recoveries (Proprietary) Limited Document No: PR/SMI/1684/26 • UFR Capital: has been included for a UFR circuit to further enhance gold extraction. There will be a UFR circuit on the Phase 1 CIL tails and the Phase 2 CIL tails stream. Each UFR circuit will consist of four 300m3 UpFlow Reactors with allowance for an additional two reactors. The UFR optimizes gold dissolution and adsorption onto activated carbon by continuously recirculating the overflowing slurry into a high-energy, counter-current mixing chamber at its base. Interstage pumping screens in each UFR retain the carbon and pump the slurry to the next UFR. The UFR circuit operates on a carousel basis. Loaded carbon removal is done by isolating each UFR in turn and pumping the entire contents over the loaded carbon screen. The screened loaded carbon is collected in a column for pressure transfer to the CIL Plant. New carbon into the UFR circuit will be regenerated carbon that has been screened on the UFR sizing screen and collected in an acid wash column for treatment before pressure transfer to the selected reactor. Fine carbon in the undersized fraction of the UFR sizing screen is pumped to the carbon fines treatment circuit. Reagent usage is hydrochloric acid for the acid treatment of the regenerated carbon. The final UFR tails slurry stream flows onto the carbon safety screen and is collected in a tailings tank for pumping transfer to the TSF tailings disposal pumping system. 14.3. Concluding Comments The current DP2 process performance and subsequent modifications to the original DP2 plant circuit, along with the supporting metallurgical test work have indicated that the expanded DP2 will perform to specification. 91 Far West Gold Recoveries (Proprietary) Limited Document No: PR/SMI/1684/26 15. INFRASTRUCTURE ITEM 15 (I); (II); (III); (IV); (V); (VI); (VII); (VIII); (IX) AND (X) The FWGR operation is supported by an extensive network of infrastructure required for the reclamation, processing and deposition of historical tailings resources. Key infrastructure includes processing facilities, tailings storage facilities, pumping stations, slurry and return water pipelines, water management systems, power supply infrastructure, access roads and associated support services. The operation currently processes approximately 500ktpm of reclaimed tailings material. The ongoing DP2 expansion project is expected to increase processing capacity to approximately 1.2Mtpm following commissioning, resulting in a corresponding increase in infrastructure and tailings management requirements. Since publication of the initial TRS, significant progress has been made in the development of infrastructure supporting the expansion project. In particular, substantial capital expenditure has been committed to the development of the RTSF and associated infrastructure, including tailings delivery systems, return water infrastructure, pumping installations and supporting services. The RTSF project is 67% complete as at the end of FY2026 and will form the long-term tailings deposition solution for the operation. Figure 24: Driefontein 4 TSF Location and Infrastructure Source: FWGR, 2020 92 Far West Gold Recoveries (Proprietary) Limited Document No: PR/SMI/1684/26 Tailings are currently deposited to the Driefontein 4 TSF, which provides sufficient remaining storage capacity to support operations during completion and commissioning of the RTSF. The Leeudoorn TSF, which formed part of the tailings deposition strategy described in the previous TRS, is no longer required as part of the operational plan due to the successful progression of the RTSF project. The following sections describe the RTSF and associated infrastructure supporting the operation. Figure 24 shows the locality of the existing Driefontein 4 TSF and the DP2 plant. 15.1. Tailings Deposition FWGR requires sufficient tailings deposition capacity to support the continued reprocessing of historical tailings resources and the planned increase in processing capacity at DP2 from approximately 500ktpm to 1.2Mtpm. Tailings will continue to be deposited on the Driefontein 4 TSF until mid-2027, whereafter all future tailings will report to the RTSF. Since publication of the previous TRS, the RTSF project has progressed significantly. The supporting detailed engineering was completed by GTSA, all land required for the development has been secured, regulatory requirements have been addressed, and construction of Stage 1 of the RTSF is nearing completion. Significant capital expenditure has also been committed to the development of the RTSF and associated infrastructure, including tailings delivery systems, return water infrastructure, pumping installations, pipelines and supporting services required for long term operation. Construction of Stage 1 (lower compartment) of the RTSF is expected to be complete by Q4 2026, but commissioning has intentionally been deferred until completion of the summer rainfall season, around mid-2027. The final commissioning may be adjusted depending on prevailing weather conditions and the duration of the rainy season. After the rainfall season, the drainage systems will be sealed, and FWGR will apply for beneficial occupation to start depositing tailings. Deposition on the lower compartment of the RTSF will commence once these regulatory approvals for beneficial occupation are received.


93 Far West Gold Recoveries (Proprietary) Limited Document No: PR/SMI/1684/26 15.2. Regional Tailings Storage Facility Design The RTSF detailed design was developed from the original feasibility level design and associated regulatory approvals described in the previous TRS. Since completion of the previous TRS, the project has progressed through detailed engineering design, land acquisition, regulatory approval and eventual construction. The resulting RTSF represents the final engineered implementation of the tailings deposition strategy and provides the basis for long term tailings storage within the FWGR operation. The design is documented in the GTSA RTSF Design Report (2023). The design development process included a comprehensive review of the original facility configuration and deposition philosophy. Consideration was given to long term operational sustainability, environmental performance, water management, construction practicality, overall project economics and compliance with applicable regulatory requirements. A key design constraint was that the facility footprint remains within the approved WUL property boundary while maintaining sufficient capacity to support the LoM production plan. The final design has been developed to accommodate a capacity of approximately 800Mt of tailings over two development stages and support a maximum tailings deposition rate of 2.4Mtpm. The design philosophy adopted for the RTSF extends beyond the provision of tailings storage capacity and seeks to establish a stable and sustainable landform that can be progressively rehabilitated throughout the operational life of the facility. In this regard, the design objective adopted by FWGR was the development of an indefinitely sustainable landscape that, at worst, has a benign but preferably positive socio-environmental impact. Following evaluation of a number of disposal methodologies and engagement with the relevant regulatory authorities, the RTSF was designed as a fourth generation low-feed-density cyclone ring dyke facility incorporating a pumped decant system, an approved barrier system, integrated water management infrastructure and progressive rehabilitation of the outer slopes. The final facility configuration was selected to provide a balance between operational efficiency, environmental performance, long term stability and responsible land stewardship. 15.2.1. Design Criteria and Basis of Design The final RTSF design was developed by GTSA as the basis for the long term deposition of tailings generated by the FWGR operation. The design was undertaken within the constraints of the approved project footprint and WUL requirements while accommodating the projected LoM tailings inventory and production rates. The final design was developed from the original feasibility level design and incorporates the outcomes of additional geotechnical investigations, optimization studies and regulatory engagement completed since publication of the previous TRS. Key design considerations included maximizing storage efficiency within the approved footprint, reducing long term operational risks, improving water recovery, accommodating progressive rehabilitation and establishing a facility capable of supporting the planned expansion of processing capacity. Consideration was also given to long term closure requirements and the objective of creating a stable post-mining landform with a sustainable future land use potential. The selected solution comprises a fourth generation low feed density cyclone ring dyke TSF incorporating a pumped decant system, integrated return water management infrastructure and an Alternative Barrier System as approved through the regulatory process. The selected deposition methodology allows efficient storage utilization, controlled rates of rise and progressive development of the facility over the planned operating life. 94 Far West Gold Recoveries (Proprietary) Limited Document No: PR/SMI/1684/26 Table 15: RTSF Design Basis Summary Item Description Value / Output Source 1 Topographical Survey 1.1 LIDAR Survey Survey date: August 1, 2022 GTSA 1.2 Coordinate System Hartebeeshoek94 WG27 GTSA 2 Process Criteria 2.1 Tailings Deposition Rate Year 1 to 3: 1.2 million dry tpm Year 4 to 6: 1.8 million dry tpm Year 7 onwards: 2.4 million dry tpm FWGR 2.2 Tailings Storage Capacity Stage 1 = 278 million dry t Stage 2 = 522 million dry t Total = 800 million dry t FWGR 2.3 Design Life Stage 1 = 12 years Stage 2 = 18 years Total = 30 years FWGR 2.4 Solids SG 2.72 FWGR 2.5 Relative Slurry Density 1.35 to 1.40 FWGR 2.6 Minimum Cyclone Split 20% underflow to 80% overflow (by mass) GTSA 3 Water Management 3.1 Principles Minimize usage. Encourage drying and consolidation of the tailings. Separate clean runoff from potentially contaminated process water and divert clean stormwater away from the facility. Contain and re-use water emanating from the facility and prevent uncontrolled dirty water discharge to the environment. Discharge excess water only if structural stability is compromised. GTSA 3.2 Water Balance A continuous daily timestep water balance (GoldSim). Probabilistic and Time Series modeling. iLanda 3.3 Climatic Data MAP = 624mm MAE = 1,650mm iLanda 3.4 Storm Event 1 in 50-year, 24-hour = 119mm 1 in 10,000-year, 24-hour (PMP) = 405mm iLanda 3.5 Decant Rate Decant slurry water daily to ensure maximum decant return GTSA 3.6 Water Storage and Return Pumping Capacity The objective is to provide sufficient storage and return pumping capacity to prevent uncontrolled dirty water discharge. Water balance modeling will confirm the frequency for controlled discharges if required. The return water pumping system will be designed to return 100% of the process demand from the return water dams to the process plant. GTSA 3.7 Lining Requirement As approved by DWS GTSA 4 Structural Stability 4.1 Objective To create a safe and stable tailings storage complex and minimize the risk to human lives, health, environment and property GTSA 4.2 Overtopping The minimum freeboard target will accommodate the 1 in 50-year, 24- hour storm volume plus 0.8m dry freeboard above normal operating level (excluding decant return) or the GISTM flood criteria above normal operating level, whichever is greater GTSA 4.3 Side Slope Stability Minimum factor of safety of 1.5 for drained and undrained conditions at peak strength. Minimum factor of safety of 1.1 for undrained conditions at residual strength. Trigger analyses to be undertaken if criteria are not achieved. GTSA 5 Environmental 5.1 Objectives The design will remain fit for purpose and resist external environmental influences. Conserve land area, water, airspace, topsoil, mineralization and energy as far as possible. Minimize environmental impacts where possible. GTSA Source: Table 2, Design Criteria and Assumptions, FWGR RTSF Design Report (Rev 1, May 2023). 95 Far West Gold Recoveries (Proprietary) Limited Document No: PR/SMI/1684/26 15.2.2. Facility Layout and Storage Configuration The RTSF has been developed as a ring dyke tailings storage facility located within the approved project area approximately 10km east of Fochville. The final facility layout was optimized to maximize storage efficiency within the approved WUL boundary while maintaining operational flexibility, effective water management, long term stability and progressive rehabilitation opportunities. The design utilizes the approved site footprint and remaining available land in a manner that supports the full LoM tailings deposition requirement. The facility has been designed to accommodate approximately 800Mt of tailings and occupies a footprint of approximately 858ha. At final development, the RTSF will have an upper basin surface area of approximately 500ha and a final facility height of approximately 108m above natural ground level. The perimeter length of the toe embankment is approximately 10.7km. The final layout incorporates the RTSF, return water dams, silt traps, stockpile areas, drainage infrastructure, access roads and supporting operational infrastructure required for long term operation. A key aspect of the final design was optimization of the facility geometry. The design philosophy adopted by Geo Tail SA recognizes that facility shape has a significant influence on operational performance, water management, stability and overall project risk. Although the approved property boundaries necessitated an elongated footprint, the RTSF was configured as an ovoid ring dyke facility to retain as many of the operational and geotechnical benefits associated with a circular facility as possible. This configuration improves the area-to-perimeter ratio, promotes more efficient seepage and drainage behavior, facilitates more uniform deposition around the perimeter and assists in maintaining consistent freeboard conditions throughout the operating life of the facility. The RTSF is designed as a fourth-generation low feed density cyclone facility. Tailings slurry will be delivered from the processing plant and distributed around the perimeter through a ring main system. Cyclone deposition will be used to separate the coarse and fine fractions of the tailings stream, with cyclone underflow utilized to construct and progressively raise the perimeter embankments while cyclone overflow is discharged into the basin. This approach promotes efficient utilization of storage volume, supports the required rates of rise and provides a more compact and operationally efficient facility than the deposition methodology considered during the original feasibility study. Development of the facility will occur in a staged manner. Stage 1 has been designed to accommodate approximately 278Mt of tailings and Stage 2 a further 522Mt, resulting in a total storage capacity of approximately 800Mt. The staged configuration allows construction and operational activities to remain aligned with planned production growth while ensuring sufficient storage capacity is maintained throughout the LoM. The design life of the facility is approximately thirty years, comprising approximately twelve years for Stage 1 and eighteen years for Stage 2. The perimeter embankment system comprises a toe embankment, a substantial starter embankment and subsequent cyclone underflow raises. The starter embankment ranges from approximately 2m to 18m in height and serves the important function of separating cyclone underflow and overflow during the early stages of facility development until the perimeter wall has been sufficiently established. Material required for embankment construction is sourced predominantly from within the RTSF footprint, thereby limiting disturbance outside the approved project area while simultaneously increasing available storage volume within the basin. 96 Far West Gold Recoveries (Proprietary) Limited Document No: PR/SMI/1684/26 The final side slope configuration comprises intermediate slopes of approximately 1V:3H separated by 10m wide benches at 10m vertical intervals, resulting in an overall side slope angle of approximately 1V:4H. This geometry was selected as a practical balance between geotechnical stability, operational access, stormwater management and progressive rehabilitation requirements. Bench access also facilitates deposition operations, maintenance activities and long-term erosion management. Progressive rehabilitation forms an integral component of the facility layout and operating philosophy. Outer slopes will be progressively clad with selected growth medium and established vegetation as development advances. This approach reduces the final closure liability, limits dust generation and erosion potential, and supports the long-term objective of creating a stable post-mining landform. Designated stockpile areas have been incorporated into the facility layout to store topsoil, spoil and cladding materials recovered from the footprint during construction for subsequent use in rehabilitation activities. The final RTSF layout therefore provides a fully integrated long term tailings storage solution incorporating deposition infrastructure, water management facilities, seepage collection systems, return water infrastructure, operational access and progressive rehabilitation measures. The configuration represents a significant advancement from the conceptual facility presented in the previous TRS and forms the basis for safe, sustainable and efficient tailings management throughout the remaining life of the FWGR operation. Figure 25: RTSF Footprint Source: FWGR, 2026


97 Far West Gold Recoveries (Proprietary) Limited Document No: PR/SMI/1684/26 15.2.3. Water Management and Environmental Controls Water management and environmental protection formed key components of the RTSF design process and were fundamental considerations during optimization of the original feasibility level design. The final RTSF design incorporates an integrated water management system developed to maximize water recovery, minimize environmental impacts, maintain regulatory compliance and support the long term operational and closure objectives of the facility. The water management philosophy adopted for the RTSF is based on minimizing water consumption, encouraging drying and consolidation of the deposited tailings, separating clean and dirty water systems, containing and reusing contact water, and preventing uncontrolled discharges to the environment. The RTSF has been designed as a hydrologically closed ring dyke facility. Tailings slurry and rainfall reporting to the basin are retained within the facility where water is either entrained within the deposited tailings, recovered through the return water system, evaporated, or collected through the underdrainage network. The substantial storage capacity available within the basin provides significant attenuation capacity during extreme rainfall events and substantially reduces the risk of overtopping during operations. The minimum design freeboard incorporates the 1 in 50-year, twenty four hour storm event together with additional dry freeboard requirements and consideration of GISTM flood criteria. As noted in the previous TRS, geochemical investigations classified the tailings as a Type 3 waste stream requiring a Class C liner system or equivalent containment measure. During the regulatory approval process, the Department of Water and Sanitation approved the use of an Alternative Barrier System in place of the conventional Class C liner configuration. The final RTSF design has therefore been developed around the approved Alternative Barrier System and incorporates this requirement throughout the detailed engineering design. The liner system comprises a prepared foundation layer, HDPE geomembrane, selected drainage layers and the deposited tailings profile, together with seepage interception and recovery infrastructure. The facility incorporates a comprehensive seepage control and recovery system designed to minimize impacts on underlying groundwater resources while maintaining long term geotechnical stability. The underdrainage system includes toe drains, intermediate drains, main drains, borrow pit drains and radial drains positioned throughout the facility to intercept seepage, manage pore pressures and promote drainage within the deposited tailings mass. Water recovered through the underdrain system is collected via a dedicated collector pipeline network and transferred to the return water circuit for reuse within the operation. Detailed seepage modeling undertaken as part of the final design indicated that the approved barrier system and drainage network substantially limit seepage losses from the facility. The modeling predicted net seepage losses of approximately 147m³/day, equivalent to approximately 1.7l/s or 5.5mm/a over the footprint area. Groundwater modeling further concluded that potential seepage impacts would remain largely confined within the footprint area and immediately adjacent shallow weathered profile, provided that the facility continues to operate in accordance with the design intent and monitoring requirements. The water recovery system comprises a pumped decant arrangement together with a series of return water dams. Supernatant water reporting to the central basin pool is recovered through a decant system and transferred to Return Water Dams 1 and 2 before being returned to the processing circuit. Seepage recoveries and dirty stormwater collected through the underdrainage and surface water systems are diverted to Return Water Dams 3 and 4, from where the water is pumped back into the primary return water circuit for reuse. This arrangement maximizes process water recovery and reduces reliance on external water sources. 98 Far West Gold Recoveries (Proprietary) Limited Document No: PR/SMI/1684/26 Water balance modeling undertaken for the RTSF demonstrated that the proposed infrastructure is capable of supporting the planned deposition rates and operational requirements. The design was developed using probabilistic rainfall modeling and dynamic water balance simulations to evaluate facility performance over the anticipated 30-year operating life. The modeling indicates an average annual water recovery of approximately 59%, which is consistent with the performance achieved at comparable DRDGOLD operations including Brakpan and Driefontein 4. The RTSF operating pool is expected to maintain a normal operating storage volume of approximately 1.5Mm³ while retaining substantial contingency capacity during extreme rainfall events. Stormwater management measures have been incorporated into both the operational and rehabilitated portions of the facility. Clean runoff from external catchments is diverted around the RTSF footprint to prevent unnecessary reporting of clean water to the facility. Dirty runoff generated within the operational areas is collected, contained and recycled through the return water system. As rehabilitation progresses, runoff from rehabilitated slopes is classified as clean water and discharged via a series of engineered channels and chutes designed to safely convey stormwater to the receiving environment while preventing erosion of rehabilitated surfaces. Progressive rehabilitation forms an important component of the environmental management strategy. The outer slopes of the RTSF will be progressively cladded using selected soil and rock materials obtained from the footprint area and vegetated throughout the operating life of the facility. This approach reduces dust generation, limits erosion potential, improves stormwater management performance and progressively reduces the environmental liability associated with the facility. The closure philosophy adopted for the RTSF is aimed at developing a stable and sustainable long-term landform capable of supporting an environmentally acceptable post-mining land use. The final RTSF configuration therefore integrates containment measures, seepage management infrastructure, water recovery systems, stormwater controls and progressive rehabilitation into a single coordinated design. The adopted approach represents a significant advancement from the conceptual arrangements considered during the feasibility stage and provides a robust framework for environmentally responsible tailings management throughout the operating life of the FWGR project and beyond. 15.2.4. Construction Status and Implementation The RTSF project has progressed significantly since publication of the previous TRS and has advanced from the design and permitting phase into implementation. Detailed engineering has been completed, all land required for the development has been secured and substantial capital expenditure has been committed to the construction of the RTSF and associated infrastructure. The project now represents the approved long term tailings deposition solution for FWGR. Construction of Stage 1 of the RTSF is currently in its final stages, with physical completion anticipated by Q2 FY2027. 15.3. Technical Studies - Water Water is required for the hydro-mining of the TSF’s and for the processing of the reclaimed material. FWGR commissioned an external assessment of the water requirement for an expanded operation in 2020. The work involved modeling the waterflows to establish a water balance for the operation at steady state. The inputs to the model were examined by Sound Mining and found to be appropriate. The planned water supply will primarily be from the RTSF return water and make-up water from underground water sources (Figure 26). 99 Far West Gold Recoveries (Proprietary) Limited Document No: PR/SMI/1684/26 Figure 26: TSF Location, Make-up Water Shafts, Processing Plants and Pipeline Layouts Source: Sound Mining, 2026 Kloof 10 shaft, which is located at the Libanon TSF, and Driefontein 10 shaft, located adjacent to the DP2, are a source of make-up water for the hydro-mining of Kloof 1 TSF, Kloof 2 TSF Libanon TSF, Venterspost North TSF and Venterspost South TSF. Two WULs have been granted for the Kloof and Driefontein operating areas, which permit the pumping of water from nearby underground workings as presented in Table 16. Table 16: Underground Water Sources Facility Permitted Quantity (m3/a) Kloof 10 Shaft 9,487,500 Driefontein 10 Shaft 2,555,000 Source: Sound Mining, 2022; and FWGR, 2020 Return water from Driefontein 4 TSF is currently re-used for the reclamation of the Driefontein 5 and Driefontein 3 TSFs and associated processing at DP2. Make-up water is sourced from Driefontein 10 shaft (~6,000m3/d). 100 Far West Gold Recoveries (Proprietary) Limited Document No: PR/SMI/1684/26 Water and slurry from the hydro-mining of distal TSFs will be pumped to the pumping stations closer to the hydro-mining sites to piggy-back off these sites to avoid having to use additional Booster Pump Stations (BPS). The water pumps at DP2 supply sufficient pressure for the Driefontein 5 TSF and Driefontein 3 TSF hydro-mining operations. High-pressure water pumps will be placed at the various TSFs (i.e., excluding Driefontein 3 TSF) to avoid having high- pressure water pipelines between the hydro-mining sites and the processing plant. They will be utilized in series to deliver the required pressure of 25bar to 30bar, for hydro-mining. Approximately 42,000m³/d of water will be returned from the deposition facilities to support the DP2 expansion facility, with make-up water pumped from Driefontein 10 shaft to DP2 or the relevant mining sites as required. Each production unit (or monitor) requires in the order of 10,500m3/d for the hydro-mining of TSF material and each site will have two monitor units running and one on standby during steady state operations. Water will be recovered from the various deposition facilities and returned to the system. Make-up water (i.e., 30% - 40% of the total water requirement) will be required to compensate after accounting for losses and rainfall (~18,000m3/d), with Kloof 10 shaft alone, having ample available capacity (~36,000m3/d). 15.3.1. Concluding Comments The available water supply more than adequately meets the FWGR requirements including the make-up water during the dry season. The supply from Driefontein 10 shaft and Kloof 10 shaft do not exceed the permissible pumping rates approved in the WULs. According to the WULs the return water will be treated in an advanced water treatment facility and discharged into Leeuspruit or disposed to dust suppression. Instead of this open configuration FWGR has opted for a closed water system throughout the LoM so no water treatment or discharge into the surface water courses will occur. The final water still in use at the point of closure will be deposited onto the RTSF for evaporation, or an alternative water treatment and use will be considered. 15.4. Technical Studies - Power The power supply and Point of Delivery (PoD) for the operations has been determined by independent specialists. These have been reviewed and are deemed appropriate for the operation. Power is currently supplied to transformers at the various sites (Table 17) from Eskom’s 132kV and 44kV grid, where the voltage is reduced to 6.6kV. Table 17: Power Requirements for FWGR Operations Site Installed (kVA) Used (kVA) Available (kVA) Comments Driefontein 8 Shaft 20,000 11,000 9,000 Sufficient for reclamation operations Driefontein 13 Shaft 10,000 6,600 3,400 DP2 40,000 - 40,000 18,000kVA required by DP2 at 1.2Mtpm capacity Libanon 40,000 22,000 18,000 Sufficient for reclamation operations Kloof 4 Shaft 80,000 64,000 16,000 3,500kVA required by RTSF Kloof Main Complex 140,000 81,000 59,000 Leeudoorn Shaft 100,000 61,000 39,000 2,500kVA required by Leeudoorn TSF Total 430,000 245,600 184,400 Source: FWGR, 2026


101 Far West Gold Recoveries (Proprietary) Limited Document No: PR/SMI/1684/26 The capital estimates take account of the available equipment at the respective substations and routing from the substations. The PoDs feeding the substations are shown in Table 18. Table 18: Eskom Points of Delivery Eskom PoD NMD Maximum Utilized NMD Transformer Size Comments Driefontein 8 Shaft 14.0MVA 11.0MVA 4 by 5MVA Driefontein 13 Shaft 4.3MVA 6.6MVA 4 by 5MVA There are sufficient transformers Kloof 1 Shaft (132kV) 81MVA 81MVA 7 by 20MVA Libanon Shaft 5.2MVA 6.92MVA 1 by 20MVA Libanon Gold 22MVA 19.3MVA 2 by 20MVA Source: FWGR, 2026 Suitable PoDs have been identified for the FWGR operations. Eskom will be notified of the increased load - Nominal Maximum Demand (NMD) to be catered for within the existing contracts - at the appropriate time. Overhead lines will be utilized as far as possible to reduce the installation costs and reduce the risk of cable theft. The aggregate load requirement has been based on a conservative diversity factor of 0.8 for the low voltage loads, which represents a relatively flat load profile. The current Eskom supply is stable in that it is linked to the main ring feed. There is a curtailment agreement in place and only under severe power disruption would the area lose supply. In this case there is still sufficient capacity to run the vital plant areas by shutting down the milling section and using diesel generators which will provide enough emergency power to ensure that selected critical process plant equipment is able to re-start immediately in the event of a power failure. DRDGOLD has entered into an electricity supply agreement with the NOA Group Assets (Proprietary) Limited (NOA Group), for the provision of approximately 76GWh per annum of renewable energy, with supply scheduled to commence in January 2028. NOA Group is a South African independent power producer, energy aggregator and energy trader, and holds an electricity trading license from the National Energy Regulator of South Africa (NERSA). This agreement supports DRDGOLD’s objective of reducing its carbon footprint and aligns with the anticipated increase in production at FWGR. 15.4.1. Concluding Comment It is noted by Sound Mining that the power estimates determined are considered appropriate for the planned operations. The power requirement to the various components of the FWGR operation is within the spare capacity available to the related ongoing and current underground mining and processing operations. Management will need to ensure timely modifications to the agreements with Eskom and sufficient allowance for the rising cost of power. 15.5. Technical Studies - Pipelines and Pumping FWGR’s expansion planning requires a network of slurry pipelines from the TSF sites to DP2, and tailings pipelines from DP2 to the RTSF. High pressure pumps will provide the mining operations with the pressures they require (25bar to 30bar). This eliminates having to install high-pressure pipelines from the processing plants to the TSF sites. FWGR worked with specialists on the design and cost estimates for the pipelines. Cognizance was also taken of the environment, mine owned land and already disturbed areas. The pipeline layout has been designed to make use of the shortest possible routes, while also using existing mine servitudes as far as possible. Use was made of the road servitudes to prevent additional impacts associated with the clearing and construction of the pipelines, and to ensure that the pipelines are easily accessed for maintenance. Alternative routes were also considered to avoid wetland areas; and existing impacted land, in the context of the effect on operating costs due to the influence of topographical and pumping costs. A summary of the pipeline and pumping infrastructure (Figure 26), is provided in Table 19. 102 Far West Gold Recoveries (Proprietary) Limited Document No: PR/SMI/1684/26 Table 19: Existing Pipeline and Pumping Infrastructure Existing Pipeline and Pumping Infrastructure Approvals Pre-screening and Slurry Pumping Reclamation Station at Driefontein 5 TSF Hydraulic Mining Site Approved EA and Environmental Management Plan (EMP) Fine Screening and Slurry Transfer Pump Station at Mining Site Approved EA and EMP Slurry Pipeline between Driefontein 5 TSF and DP2 Approved EA and EMP Tailings Pipeline from DP2 to Driefontein 4 TSF Approved EA and EMP Return Water Dam at Driefontein 4 TSF and Process Water Supply to DP2 Approved EA and EMP Process Water Make-up Storage and Pump Station at Driefontein 10 Shaft Approved EA, Integrated Water Use Licenses (IWUL) and EMP Process Water from Driefontein 10 Shaft to DP2 Approved EA, IWUL and EMP Pre-screening and Slurry Pumping Reclamation Stations at Driefontein 3 TSF Approved EA and EMP Pre-screening and Slurry Pumping Reclamation Stations at Libanon TSF Approved EA and EMP Slurry Pipeline from Libanon TSF to DP2 Approved EA and EMP Water Pipeline from DP2 to Driefontein 3 TSF Approved EA and EMP Slurry Pipeline from DP2 to the RTSF Approved EA and EMP Slurry Pipeline from Libanon TSF to DP2 Approved EA and EMP Source: Sound Mining, 2026 A summary of the additional piping requirements is presented in Table 20. Table 20: Additional Pipeline and Pumping Infrastructure Planned Pipeline and Pumping Infrastructure Approvals Pre-screening and Slurry Pumping Reclamation Stations at Kloof 1 TSF Approved IEA and EMP Pre-screening and Slurry Pumping Reclamation Stations at Venterspost North TSF Approved IEA and EMP Pre-screening and Slurry Pumping Reclamation Stations at Venterspost South TSF Approved IEA and EMP Slurry Pipeline from Venterspost South TSF to Libanon TSF Approved IEA and EMP Slurry Pipeline from Kloof 1 TSF to DP2 Approved IEA and EMP Process Water Make-up Storage and Pump Station at Kloof 10 Shaft Approved IEA, IWUL and EMP Process Water from Kloof 10 Shaft to DP2 Approved IEA, IWUL and EMP Slurry Pipeline from Kloof 2 TSF to DP2 Approved IEA and EMP Source: Sound Mining, 2026 15.5.1. Concluding Comments The QP considers the pipeline infrastructure design to be well-engineered and underpinned by practical experience. There appear to be no fatal flaws in the thinking behind amendments to various EIAs and EMPs to accommodate the changes to the pipeline and pumping infrastructure. 103 Far West Gold Recoveries (Proprietary) Limited Document No: PR/SMI/1684/26 16. GOLD MARKET ITEM 16 (I) AND (II) Gold is a precious metal, which serves a dual role as both a commodity and a monetary asset. It is widely used in jewelry, private investment products, central bank reserves, technology applications, dentistry, and various industrial processes. Unlike most commodities, gold is virtually indestructible with substantial above-ground stocks having accumulated (Table 21). Table 21: Above Ground Gold Stocks in 2025 Description Quantity (kt) Contribution (%) Jewelry 99.7 45.2 Private Investment 51.0 23.1 Bank Holdings 38.6 17.5 Other 31.4 14.2 Source: GoldHub, 2026 These inventories are a distinctive feature of the gold market and contribute to gold’s unique pricing characteristics when compared to industrial commodities. 16.1. Gold Price Trends The QP has considered the historical trendlines in Graph 4 and Graph 5 to form an opinion of the gold price and exchange rate used to estimate the mineral reserves. The QP is of the opinion that the period sufficiently covers the market volatility seen in the international gold market. Graph 4: Gold Price Historical Trendline Source: Heraeus-precious-metals, 2026 Gold Prices have strengthened significantly over the past three years, supported by sustained central bank purchasing, geopolitical uncertainty, inflation concerns, and increased investor demand for safe-haven assets. The gold price increased to USD5,033.29/oz (i.e., ~ZAR2,589,224.19/kg at ZAR16/USD) in 2026. It has since declined to a spot price of USD4,015.51/oz as at June 30, 2026 (Graph 4). 0 1 000 2 000 3 000 4 000 5 000 6 000 M a y 2 0 1 7 N o v 2 0 1 7 M a y 2 0 1 8 N o v 2 0 1 8 M a y 2 0 1 9 N o v 2 0 1 9 M a y 2 0 2 0 N o v 2 0 2 0 M a y 2 0 2 1 N o v 2 0 2 1 M a y 2 0 2 2 N o v 2 0 2 2 M a y 2 0 2 3 N o v 2 0 2 3 M a y 2 0 2 4 N o v 2 0 2 4 M a y 2 0 2 5 N o v 2 0 2 5 M a y 2 0 2 6 G o ld P ri c e ( U S D /O z ) 104 Far West Gold Recoveries (Proprietary) Limited Document No: PR/SMI/1684/26 The economic assessment for the Mineral Reserve estimate has utilized a real price of ZAR2,155,461/kg (i.e., USD4,113/oz at ZAR16.30/USD) in June 30, 2026, terms. This aligns with the price used by FWGR for its annual business plan and is considered to be both realistic and reasonable for the purpose of estimating the Mineral Reserves. 16.2. Exchange Rate Forecast The ZAR to USD exchange rate reached a high of ZAR19.78/USD in May 2023 but has since dropped back to circa ZAR16/USD (Graph 5). The spot exchange rate as at June 30, 2026, was ZAR16.27/USD. Graph 5: Exchange Rate Historical Trendline Source: GoldHub, 2026 Various service providers and financial institutions can also be consulted to determine consensus forecasts of the gold price (Table 22). Table 22: Long Term Consensus Forecasts in Nominal Terms Description Year 1 (FY2026) Year 2 (FY2027) Year 3 (FY2028) Year 4 (FY2029) Year 5 (FY2030) Gold Price (USD/oz) 4,849 4,954 4,895 4,847 4,505 Exchange Rate (ZAR/USD) 16.30 16.20 16.50 16.80 17.10 Gold Price (ZAR/kg) 2,458,378 2,496,203 2,512,150 2,532,743 2,396,071 Source: Sound Mining, 2026 The QP considered the price assumption used for the Mineral Reserve estimate against linear trends in the demand and supply of gold as recorded over the period from 2015 to 2025 to form an independent opinion on whether it is reasonable. 10 12 14 16 18 20 22 J u n 2 0 1 7 D e c 2 0 1 7 J u n 2 0 1 8 D e c 2 0 1 8 J u n 2 0 1 9 D e c 2 0 1 9 J u n 2 0 2 0 D e c 2 0 2 0 J u n 2 0 2 1 D e c 2 0 2 1 J u n 2 0 2 2 D e c 2 0 2 2 J u n 2 0 2 3 D e c 2 0 2 3 J u n 2 0 2 4 D e c 2 0 2 4 J u n 2 0 2 5 D e c 2 0 2 5 J u n 2 0 2 6 E x c h a n g e R a te ( Z A R /U S D )


105 Far West Gold Recoveries (Proprietary) Limited Document No: PR/SMI/1684/26 16.3. Global Demand Graph 6 reveals a gradual increase in demand (~14.2%) over the past ten years. Graph 6: Global Gold Demand from 2015 to 2025 Source: GoldHub, 2026 16.4. Global Supply Table 23 shows the annual contributions from the top ten gold producing countries since 2015. Table 23: Global Gold Production Rank Country Production (t) 2015 2016 2017 2018 2019 2020 2021 2022 2023 2024 2025 1 China 460 464 429 404 383 368 332 375 378 380 384 2 Australia 279 288 293 313 325 328 307 306 296 284 293 3 Russia 255 262 281 295 327 332 331 330 322 330 345 4 United States of America 217 229 236 223 200 193 187 173 170 163 157 5 Peru 171 166 205 208 192 140 173 173 176 203 209 6 Canada 158 163 171 192 185 173 193 195 192 203 213 7 South Africa 157 155 147 126 113 102 114 99 106 99 99 8 Ghana 95 131 133 149 142 130 125 137 131 155 187 9 Indonesia 112 161 146 166 100 74 98 139 155 139 104 10 Mexico 132 131 120 118 109 110 125 124 127 118 114 Source: GoldHub, 2026 China is the largest gold producer contributing approximately 8% to global production during 2025. Graph 7 shows a relatively stable and increasing trend in the global supply of gold from mining and recycling activities since 2015. 0 1 000 2 000 3 000 4 000 5 000 6 000 2015 2016 2017 2018 2019 2020 2021 2022 2023 2024 2025 G o ld D e m a n d ( T o n s ) 106 Far West Gold Recoveries (Proprietary) Limited Document No: PR/SMI/1684/26 Graph 7: Global Gold Supply from 2015 to 2025 Source: GoldHub, 2026 These graphs indicate a reasonably stable gold market in the context of the prevailing gold price environment, which supports the QPs opinion that the gold price assumption is reasonable. 16.5. Concluding Comments It is noted that all gold produced by DRDGOLD is sold directly to South African bullion banks at prevailing market prices denominated in South African Rand (ZAR). The QP notes a reasonable consistent trend in the gold market against an elevated trend in the gold price. The QP considers the real June 30, 2026, gold price of ZAR2,155,461/kg to be an appropriately conservative assumption for examining the economic viability of the Mineral Reserve estimate (i.e., against a spot price of R2,118,590.46/kg as at June 30, 2026). 0 1 000 2 000 3 000 4 000 5 000 6 000 2015 2016 2017 2018 2019 2020 2021 2022 2023 2024 2025 G o ld S u p p ly ( T o n s ) Mine Production Recycled Gold 107 Far West Gold Recoveries (Proprietary) Limited Document No: PR/SMI/1684/26 17. ENVIRONMENTAL STUDIES, PERMITTING, OR AGREEMENTS WITH LOCAL INDIVIDUALS OR GROUPS ITEM 17 (I); (II); (III); (IV); (V); (VI) AND (VII) A review of environmental status of FWGR’s assets was undertaken by an independent environmental specialist. It relies on information provided by DRDGOLD and FWGR. The key environmental aspects are discussed below, along with any associated liabilities and risks. Risks or liabilities, that would generally be addressed in terms of accepted environmental practice, and which do not have significant cost implications, have not been discussed. 17.1. Permitting Status The environmental and social compliance status in relation to South African legislation is summarized in Item 21. The following expands the relevant authorizations or permits required. 17.1.1. The National Environmental Management Act EAs have been granted in terms of NEMA and the EIA Regulations of 2014 as described below. Driefontein Mining Right Area: in March 2016, Sibanye Gold Limited submitted an application for an IEA including a Waste Management License (WML) for the proposed activities on the Driefontein Mining Right area (DMPR) Ref. No.: GP 30/5/1/2/2 (51) MR. The DMPR granted the EA Ref. No.: GP 30/5/1/2/3/2/1 (51) EM on May 11, 2018. The Driefontein MR and EA are in good legal standing. Sibanye Gold applied for a Section 102 amendment to the MR to include the Driefontein 4 TSF, which has been granted. FWGR has submitted an application to the DMPR for the transfer of the existing Driefontein EA (Ref. No.: GP 30/5/1/2/3/2/1 (51) EM) as well as the inclusion of related activities covered by the existing Driefontein EMP relevant to the FWGR operation. The amendment was for the following: • the transfer of the Driefontein EA to FWGR; • a modification to scope of how the Phase 1 operations are currently being executed; and • to include DP2, DP3 and Driefontein 4 TSF. The associated rights and approvals have since been transferred to FWGR, and all related amendments have been finalized. Permission for depositing onto the Driefontein 4 TSF is contained in the original Driefontein EMP associated with the MR. This EMP is needed for the operation’s waste management obligations. The pipelines fall within the scope of the existing infrastructure recorded in the current EA and EMP. Table 24 summarizes the current environmental legal standing for the Driefontein mining area. 108 Far West Gold Recoveries (Proprietary) Limited Document No: PR/SMI/1684/26 Table 24: Required Environmental Legislation and the Status for the Driefontein Mining Area Act, Regulation or By-Law Requirements Status Driefontein Area MPRDA, 2002 (Act No. 28 of 2002) Mining Right This is currently in place. Social and Labor Plan (SLP) FWGR has an internally signed-off SLP; however, an SLP is not required for FWGR. NEMA, 1998 (Act No. 107 of 1998): Environmental Impact Assessment Regulations 2014 (GNR 982) EA This is currently in place. EMPr/EIA Forms part of the Driefontein EMPr/EIA. The Rehabilitation and Closure Cost plan must be annually adjusted. This is guaranteed through a Guardrisk Cell Captive. National Environmental Management: Air Quality Act, 2004 (Act No. 39 of 2004) (NEM:AQA) An Atmospheric Emissions License (AEL) is required for any listed activity within this Act. N/A NEM:WA, 2008 (Act No. 59 of 2008) A WML is required for any listed activities within the Act. There is an EA in place for Driefontein. The TSFs are currently managed under Sibanye Gold’s existing EMPs which were in operation prior to the legislation coming into effect. NWA, 1998 (Act No. 36 of 1998) Any abstraction, storage, diversion, flow reduction and disposal of water and effluent requires an IWUL. This is included in the WUL. Source: FWGR, 2020; and Sound Mining, 2022 Kloof Mining Right Area: in March 2016, Sibanye Gold submitted an application for an IEA including a WML for the proposed activities on the Kloof Mining Right area (DMPR Ref. No.: GP 30/5/1/2/2 (66) MR). The DMPR granted the IEA (Ref. No.: GP 30/5/1/2/3/2/1 (66) EM on May 11, 2018. The Kloof MR is in good legal standing, and its IEA has been transferred to FWGR. Sibanye Gold has applied for two Section 102 amendments to the Kloof MR for the inclusion of the Venterspost North and South TSFs as well as land for the RTSF. The Section 102 amendment for Venterspost North and Venterspost South TSFs was granted at the end of 2021. The RTSF Section 102 amendment was granted and executed in August 2026. 17.1.2. National Environmental Waste Management Act FWGR has confirmed that their TSFs have an approved CoP on Mine Residue Deposits in accordance with the requirements of the Mine Health and Safety Act (MHSA). The TSFs on the Driefontein MR and Kloof MR are covered under this CoP. For Phase 2, the following waste management activities have been granted in terms of GNR 921 of November 13, 2013 (as amended) under the National Environmental Waste Management Act (NEM:WA), 2008 (Act No. 59 of 2008). The DMPR granted the IEA Ref. No.: GP 30/5/1/2/3/2/1 (66) EM on May 11, 2018, which has been transferred to FWGR. The waste management activities allow FWGR to construct the RTSF and associated infrastructure. The requirements under NEM:WA have been covered. Table 25: Activities for Phase 2 Requiring a Waste Management License (WML) Number of the Relevant Government Notice Listed Activity Number Authorised Description of Activity GNR 921 Activity B (1) Construction and operation of the RTSF and the sewage treatment plant GNR 921 Activity B (7) Operation of RTSF GNR 921 Activity B (11) Establishment of the RTSF Source: FWGR, 2020 17.1.3. National Water Act FWGR is operating under two authorized WULs, the Driefontein and Kloof mining areas under the License No.: 10/C22B/ACFGI/4976, and the Libanon Reclamation License no: 10/C23D/CGU/18789. The WULs are valid for a period of twelve years from the date of issuance and may be reviewed at intervals of not more than five years. Compliance is also required with the general provisions of the regulations on the use of water for mining and related activities published under the NWA in GN 704 of 1999. Storm water needs to be managed in line with GN 704 of 1999.


109 Far West Gold Recoveries (Proprietary) Limited Document No: PR/SMI/1684/26 17.2. Environmental Considerations The EIAs for the Kloof and Driefontein operation areas state that the TSFs are permanent sources of pollution. Dust from the TSFs impacts on the ambient air quality, the surrounding soils and the wetlands and surface water resources. Ground water is also significantly affected by leaching and the seepage of pollutants from the TSFs that are located over dolomitic aquifers. Any seepage from the Driefontein 3 TSF, Driefontein 4 TSF, Libanon TSF, Venterspost North TSF, Venterspost South TSF, Driefontein 5 TSF and Kloof 1 and 2 are expected to migrate downwards into the aquifers. Monitoring data indicates elevated concentrations of sulphate, total dissolved solids (TDS) and nitrate in the groundwater which are all typical constituents associated with contamination emanating from gold mining areas. Additionally, the pH ranges from 4.1 to 8.0, with the lower values further supporting an indication of Acid Mine Drainage, which is associated with seepage from existing tailings and surface mining facilities. Underground mining in these areas have significantly dewatered the dolomitic systems, which have resulted in numerous sinkhole formations. Dewatering reduces pressure within the dolomite, and this encourages drainage from the overlying TSFs. The removal of these TSFs in the region will result in long-term positive benefits to the region. It is expected that the removal of the TSFs off the underlying dolomite will improve the ground water quality near the TSFs. There is no dolomitic risk in the area of the RTSF. The RTSF site is underlain by Transvaal Supergroup Strubenkop shale, Daspoort quartzite and Silverton shale units. The baseline groundwater quality is good, As RTSF will be a fully HDPE-lined facility, the risk is lower in terms of groundwater contamination. However, this will still need to be monitored and managed if any plumes are picked up through monitoring. The main elements of concern with regards to groundwater contamination are sulphate and manganese, and to a lesser extent, arsenic, uranium and iron, which could potentially impact private boreholes and the Leeuspruit or its tributary. TSFs will be relocated to the new RTSF which is more suitably located with respect to ground water. New environmental impacts and risks associated with the RTSF will need to be adequately mitigated, and appropriate measures implemented as required. Dust measurements from the TSFs are generally within the limits specified by the National Dust Control Regulations. However, the EIA found some sites to be a problem during the dry winter months. Land is used in the region for mining activities, the cultivation of crops, and for grazing. The pipeline routes will utilize existing servitudes and mine owned land. Prior to final rehabilitation of reclaimed TSF footprints and any subsequent land development, a radiological assessment will be undertaken to identify any areas of radioactivity. Where radiological hotspots are identified, these areas will be excavated and the material transferred to the RTSF. If a site falls within the clearance requirements of the NNR for the proposed land use, a report will need to be submitted to the NNR for approval. Following approval, the site will be rehabilitated with indigenous vegetation and returned to the landowner. The RTSF is being constructed on land previously used for agricultural purposes with small pans also located within the footprint area. The EA states that a wetland offset strategy must be implemented within one year of the wetland being impacted. FWGR has commenced the wetland offset strategy as a phased approach which has been submitted to the responsible authorities. The impacts due to contaminated water run-off and windblown dust will be mitigated through the use of wind breaks, concurrent rehabilitation of the RTSF and the installation of silt traps. Clearing and grubbing of the vegetation for construction will leave the soils open to erosion which could lead to sedimentation of surface water, wetlands, and the deterioration of aquatic habitats. These impacts will be mitigated through either silt curtains, cut off drains or siltation ponds. 110 Far West Gold Recoveries (Proprietary) Limited Document No: PR/SMI/1684/26 Fauna and Flora Impact Assessments formed part of the EIAs. The vegetation comprises Carletonville Dolomite Grassland and Gauteng Shale Mountain Bushveld (both with vulnerable conservation status), as well as Rand Highveld Grassland (Endangered) and Soweto Highveld Grassland (Endangered). There are also other vegetations, namely: grasslands, ridges and wetland vegetation of high-ecological importance due to their influence on the overall ecosystem. They are seen to be valuable to maintain the biodiversity balance and therefore, should be conservation priorities. Fauna expected to occur within the area including mammals, birds, reptiles, amphibians and invertebrates. Fauna species of importance are the White-Tailed Mouse (Endangered) and Rough Haired Golden Mole (Vulnerable). Some thirty-seven bird species were identified with some of them being the “Listed Red Data” bird species. However, the Grass Owl (Vulnerable) is expected to occur within the wetland habitats. Red Data reptile species that have a low probability of occurring within the operation area include the Giant Girdled Lizard (Vulnerable) and the Striped Harlequin Snake (Rare). None of the identified amphibians are of concern. Red Data butterfly species expected to occur on site are the Marsh sylph, Roodepoort Copper and Highveld Blue. A consolidated Heritage Resources Management process was completed in 2016 for the Driefontein and Kloof Mining Right areas. No fatal flaws were identified despite the fact that the operation is situated within a sensitive cultural landscape. An external independent environmental compliance audit of the Driefontein and Kloof EAs and the EMPrs conducted in 2024 recorded no major issues and an overall compliance of 94% and 100% respectively for the EAs and 100% for the EMPRs. 17.3. Social and Political Considerations The operation is located in the vicinity of the following two local municipalities: Merafong City and Rand West Local municipalities. The RTSF is in the Rand West City and Merafong City Local Municipalities. Local towns include Fochville, Carletonville, Westonaria and Venterspost. The land is used for mining, agriculture, residential, and businesses. Agriculture covers the largest portion of the area, followed by mining and residential uses. Human settlements are relatively scattered due to the mining activities and impact of dolomite. Over a third of the local GDP is from finance, personal services and government services. The Rand West City and Merafong City economies are more dependent on the mining industry than the district in general. Merafong City has an unemployment rate of over 27.2%, while the Westonaria unemployment rate exceeds 29.5%. The expansion is expected to improve the socio-economic status with new jobs created during construction. Capital investment and contributions to the GDP as a consequence of the FWGR operations, and the obvious multiplier effect, will have a positive impact on the area. Employment opportunities include direct employment by the operation; indirect employment will be created by procuring local goods and services, induced employment generated through spending and associated job creation in the economy. Operation-related employment has the potential to considerably improve the livelihoods and income stability of employees and their dependents. 17.3.1. Discussions with Local Individuals or Groups Interested and Affected Parties (I&APs) raised concerns during the public participation phase of the Kloof EIA process. A petition of 793 signatories was compiled in this regard by the “No for Mega Dump Forum” representing the community (farmers, business owners and residential areas). The concerns raised included: • environmental impacts from the existing TSFs and whether the FWGR operation would worsen the conditions; • dust being a major concern for health reasons; • safety and security on surrounding farms; • water quality; • population influx; and • reduced economic activity within the local community after the LoM. 111 Far West Gold Recoveries (Proprietary) Limited Document No: PR/SMI/1684/26 Some of the I&APs acknowledged that the FWGR operation would have a long-term positive impact by removing TSFs. Other positive impacts were expected skills development, employment creation and the benefits of the multiplier effect where local procurement of goods and services, as well as local and regional economic development would benefit. Improved quality of life and increased availability of land were also cited as positive impacts. These will be managed by the FWGR Social and Labor Plan (SLP). The Social Impact Assessment (SIA) revealed political and community expectations for sharing in the benefits by local communities. Local municipalities sometimes claim that they are disproportionately benefiting, or not benefiting at all, from mining when compared with district municipalities and the provinces at large. It is not the responsibility of FWGR to control informal settlements or to provide public services and facilities. However, the existence of informal settlements near the operations poses a risk to the operation in terms of political stability and community relations/support. This has, however, improved through an ongoing quarterly meeting set up by the FWGR Environmental Department where farmers and landowners adjacent to the operations can raise any concerns that they may have and ask questions relating to environmental matters. Similar forums have been set up by the FWGR HR Department in collaboration with FWGR CSI partners for discussions on labor and development. A social and labor plan exists to address any negative social impacts of the operation on host communities. Potential positive impacts on host communities are continually optimized and enhanced in a sustainable manner. Emphasis will be placed on skills development and local economic development as these aspects would constitute the foundation for enhancing the operation’s social capital. Moreover, negative impacts, such as increased pressure on infrastructure and services, and economic dependence on FWGR can be more effectively mitigated when the social capital of the operations are enhanced through ongoing community engagement, socio-economic development initiatives and skills development programs. It is anticipated that the consequence and/or probability of most negative impacts can be reduced to acceptable levels and that the positive impacts of the operations will outweigh the negative effects. 112 Far West Gold Recoveries (Proprietary) Limited Document No: PR/SMI/1684/26 17.4. Environmental Closure Liability Estimate A review of the closure estimates and associated plans covers the following aspects: • discussion of the methodology used to derive the costs for demolition, closure and rehabilitation; and • comment on the adequacy of the financial provisions made for the operation. 17.4.1. Basis of the Closure Liability Estimate The closure cost assessment was conducted according to the requirements of NEMA as amended (refer to Item 13), by Digby Wells in May 2026. The purpose of the financial provision assessment was to revise the existing estimate for closure and rehabilitation to reflect current conditions as of June 2026. The assessment was undertaken using third-party rates from Digby Wells’ database and contractor – and mine- specific rates supplied by FWGR, where applicable. 17.4.2. Quantum of the Closure Liability The closure cost estimate is for the purpose of reporting the liability in the annual financial statements of FWGR. NEMA as amended, requires the holder of a MR to make full financial provision for the rehabilitation of negative environmental impacts. This liability is required to be updated annually and adjusted. The closure costs are determined on both an “unscheduled” and “scheduled” basis. Scheduled costs assume that mining continues and that the final rehabilitation will be confined to the rehabilitation of the TSF footprints. Unscheduled costs assume the immediate termination of mining and provide rehabilitation of the area in its current condition. The detailed closure cost model calculates the cost of demolishing, removing and rehabilitating each infrastructure component which may include (but is not limited to): • rehabilitation of the pump station and pipeline footprints; • generalized rehabilitation and vegetation management strategies; • ensuring the reclaimed footprints are free draining; • vegetating the TSFs that will remain post closure; • radiation clearance for each rehabilitated footprint; • post-closure maintenance and monitoring costs; and • FWGR has provided for the quantum of the financial guarantees on an unscheduled estimate basis. The 2026 closure cost assessment estimated the total closure liability at ZAR468 M (excluding VAT) for the unscheduled closure scenario and ZAR381 M (excluding VAT) for the scheduled closure scenario, inclusive of project management and contingency allowances. Updates to the 2026 assessment included updated electricity and Rand Water rates, updated vegetation establishment quotations, revised vegetation monitoring and maintenance rates, updated groundwater monitoring rates inclusion of the DP2 expansion based on the current construction status, updated rehabilitation extents for Driefontein 4 and Driefontein 5 TSFs, inclusion of RTSF-related infrastructure and disturbance areas, and updated pipeline infrastructure. FWGR has provided the quantum of the financial guarantees on an unscheduled closure estimate basis. Table 26 presents the closure cost estimates of the June 2026 Digby Wells Annual Financial Provision Assessment.


113 Far West Gold Recoveries (Proprietary) Limited Document No: PR/SMI/1684/26 Table 26: Current Closure Cost Estimates for FWGR Asset Unscheduled Cost 2026 (ZAR M) Scheduled Cost 2026 (ZAR M) Driefontein 5 TSF 14.6 14.6 Driefontein 3 TSF 24.6 24.6 Kloof 1 TSF 28.2 20.9 Kloof 2 TSF 53.9 28.0 Libanon TSF 39.4 26.1 Venterspost North TSF 44.2 21.7 Venterspost South TSF 13.4 8.5 DP2 65.8 65.8 Driefontein 4 TSF 38.9 37.4 Pipelines 22.3 22.3 Regional Tailings Storage Facility (RTSF) 53.6 53.6 Pump electricity and maintenance 4.7 4.7 Project Management 24.2 19.7 Contingency 40.4 32.8 Total 468.2 380.7 Source: Digby Wells, 2026 Note: Apparent computational errors due to rounding This table includes the Post Closure Aspect Costs As mining of the TSFs progress, the liability for rehabilitation and closure will decrease from the current unscheduled cost of ZAR468.2 M to a final scheduled cost of ZAR380.7 M. FWGR will make appropriate application to the DMPR for adjustments to the closure obligation to cater for this decreasing liability. Guardrisk Insurance Company Limited (GICL) has issued financial guarantees in favor of the DMPR of ZAR481.9 M. An amount of ZAR634.0 M is also invested in Guardrisk Cell Captive under the ring-fenced environmental rehabilitation insurance policy. The funds are ring-fenced for the sole objective of future rehabilitation activities during and at the end of the LoM. The financial guarantees and funds held with the Guardrisk Cell Captive (June 30, 2026) are sufficient to cover the estimated unscheduled liability of ZAR468.2 M as estimated for the operation. Moreover, the environmental rehabilitation fund of ZAR117.4 M for the Kloof 2 TSF is still to be transferred to FWGR from Sibanye Gold in accordance with the Exchange Agreement. Table 26 also shows the closure liability for the RTSF calculated in the 2016 Digby Wells EIA and Environmental and Management Program Report Under Regulation 7 of the NEMA Financial Provision Regulations (2015) which states that the financial provision is, at any given time, equal to the sum of the actual costs of implementing the plans for a period of at least ten years forthwith (this includes the annual rehabilitation, final, decommissioning and closure plans). Sound Mining has been informed by FWGR that a ZAR169.0 M of the closure cost estimate for the RTSF has been guaranteed by FWGR through Guardrisk and satisfies the IEA requirements. 114 Far West Gold Recoveries (Proprietary) Limited Document No: PR/SMI/1684/26 17.5. Concluding Comments The FWGR IWUL for the RTSF was approved and construction commenced in June 2024. It is the opinion of the environmental specialist that the FWGR operations have been well planned and executed thus far. The legislative requirements have been identified and addressed, and where there are gaps, measures are being taken to address them. The identified risks are well understood by FWGR and at the time of this TRS are being addressed to avoid any significant impact on the operations. No fatal flaws were identified during this review. An insurance policy through Guardrisk of ZAR481.9 M, combined with the current balance in the Guardrisk Cell Captive of ZAR634.0 M is sufficient to cover the 2026 unscheduled liability of ZAR468.24 M as estimated for the operation. Cognizance needs to be taken of the following: • a risk assessment should be completed as per Government Gazette No.: GNR 1147 the NEMA Financial Provision Regulations (2015) (as amended January 2020) to determine any residual or latent costs to be included; • the RTSF design has been approved and construction has commenced; • illegal mining activities, and nearby informal settlements may encroach on the operations. In terms of the Extension of Security of Tenure Act, 1997 (Act No. 62 of 1997) (ESTA), any land occupiers may also be entitled to certain tenure rights, which could prevent landowners and government from evicting them unless the provisions of ESTA have been met; • dust resulting from the TSFs and the mining activities needs to be managed, and an investigation into the applicability of the Air Quality Act must be undertaken; • the quality or quantity of water available to agricultural activities needs to be preserved; and • constant vigilance is recommended to prevent illegal mining. These are being addressed according to the required timelines. 115 Far West Gold Recoveries (Proprietary) Limited Document No: PR/SMI/1684/26 18. CAPITAL AND OPERATING COSTS ITEM 18 (I) AND (II) The capital requirement and operating cost estimates have been informed by current operations and feasibility study work that covered mining, processing, the RTSF, and associated pumping and piping infrastructure. The QP deems these estimates to have been determined to within an accuracy level of –5%, +15%. The Phase 1 operation is nearing completion as it transitions to Phase 2, as described previously for the FWGR project. Some of the previous estimates have been replaced due to the increased certainty provided by data from the actual operations. The remaining estimates were appropriately inflated to June 2026 real terms, where deemed necessary. Sound Mining has included a 15% contingency on all costs to reflect the confidence ascribed to the estimates. 18.1. Capital Expenditure The capital estimates were determined by applying unit rates obtained from quotations or from the actual costs experienced for recent installations, to the designed quantities. Table 27 presents the latest capital expenditure estimate for the FWGR LoM planning (i.e. as at June 30, 2026, real terms). Table 27: Capital Expenditure Estimate as at June 30, 2026 Description June 2026 (ZAR M) DP2 Expansion Equipment and Infrastructure 109 Up Flow Reactor 792 Total for DP2 Expansion 901 RTSF RTSF Construction* 985 Total for RTSF 985 Pumping and Piping RTSF 101 Kloof 1 194 Kloof 2 534 Libanon 292 Venterspost South 500 Venterspost North 220 Total for Pumping and Piping Capital Expenditure 1,842 Total Direct Capital Expenditure 3,728 Indirect Capital Expenditure DP2 Maintenance/Replacement of Capital 662 Planned Closure Costs - Total Indirect Capital Expenditure 662 Contingency Contingency (15%) 435 Total Capital Expenditure 4,825 Source: Sound Mining, 2026; and FWGR, 2026 Note: * Remaining RTSF Provision with cost of a liner now included ** This rehabilitation requirement is currently exceeded by the provisions in the Guardrisk financial guarantees 116 Far West Gold Recoveries (Proprietary) Limited Document No: PR/SMI/1684/26 It is noted that a significant portion of the original capital estimates have been expensed as a consequence of phase 2 project implementation activities post the previously published 2023 LoM plan (i.e., FWGR TRS, 2023). Table 28: Implementation Progress post 2023 Description Capital Estimate (ZAR M) Comments June 2023 June 2026 Land (RTSF and Pipelines) 49 0 The required acquisitions have been made Equipment and Infrastructure 1,770 109 The expansion of DP2 is largely complete Up Flow Reactor 0 792* The UFR was included in the 2026 mine plan RTSF Construction 3,147 985 RTSF stage 1 anticipated to be complete in Q2 FY2027 RTSF - Piping 635 101 RTSF Piping Infrastructure Kloof 1 - Piping and Pumping 405 534 This estimate has been revised since 2023 Kloof 2 - Piping and Pumping 0 292* Kloof 2 TSF was included in 2026 mine plan Libanon - Piping and Pumping 467 194 Capital expenditure due to development of infrastructure Venterspost South - Piping and Pumping 361 500 This estimate has been revised since 2023 Venterspost North - Piping and Pumping 252 220 Capital expenditure due to development of infrastructure Source: Sound Mining, 2026; FWGR, 2023; and FWGR, 2026 Note: * Not part of the original FWGR Project planning Graph 8 illustrates the annual capital expenditure as forecast through to 2042. Graph 8: Capital Expenditure Forecast Source: Sound Mining, 2026 The bulk of the early expenditure will be on completing both the RTSF and the expansion of DP2. The replacement, or Stay-in-Business (SiB), capital provision of ZAR662 M will be expensed from year 2 onwards. The increases in 2040 and 2042 are for the pumping and piping needed to facilitate the mining of the two Venterspost TSFs. - 500 1 000 1 500 2 000 2 500 2 0 2 7 2 0 2 8 2 0 2 9 2 0 3 0 2 0 3 1 2 0 3 2 2 0 3 3 2 0 3 4 2 0 3 5 2 0 3 6 2 0 3 7 2 0 3 8 2 0 3 9 2 0 4 0 2 0 4 1 2 0 4 2 2 0 4 3 2 0 4 4 2 0 4 5 2 0 4 6 C a p it a l E x p e n d it u re ( Z A R M ) Direct Capital Expenditure Indirect Capital Expenditure Capital Contingency


117 Far West Gold Recoveries (Proprietary) Limited Document No: PR/SMI/1684/26 18.2. Operating Costs The operating cost estimate (Table 29) and forecast (Graph 9) are based on actual costs incurred at the current operation. The Phase 2 estimates also rely on current expenditure but with appropriate adjustments to account for economies of scale as DP2 increases its throughput. Table 29: Operating Cost Estimate as at June 30, 2026 Description Phase 1 (ZAR/t) Phase 2 (ZAR/t) Salaries and Wages 19.6 14.0 Contractors 15.3 10.8 Reagents 29.4 33.4 Other Engineering Stores 11.0 11.0 Electricity 22.2 40.4 Water 0.5 0.7 Machine Hire 4.2 2.3 Other 17.6 6.1 Other Corporate Costs 7.2 3.3 Contingency (15%) 19.0 18.3 Totals 146.0 140.3 Source: Sound Mining, 2026; and FWGR, 2026 Graph 9 illustrates the operating costs to be anticipated over the planned LoM. Graph 9: Operating Cost Forecast Source: Sound Mining, 2026 18.3. Concluding Comments The accuracy of the capital cost estimates have improved as the implementation of Phase 2 nears completion. The cost of power is likely to increase over time as mining of successive TSFs occur further away from the processing facility, but these are not expected to be material to the mineral reserve estimate. - 500 1 000 1 500 2 000 2 500 2 0 2 7 2 0 2 8 2 0 2 9 2 0 3 0 2 0 3 1 2 0 3 2 2 0 3 3 2 0 3 4 2 0 3 5 2 0 3 6 2 0 3 7 2 0 3 8 2 0 3 9 2 0 4 0 2 0 4 1 2 0 4 2 2 0 4 3 2 0 4 4 2 0 4 5 2 0 4 6 O p e ra ti n g C o s ts ( Z A R M ) 118 Far West Gold Recoveries (Proprietary) Limited Document No: PR/SMI/1684/26 19. ECONOMIC ASSESSMENT ITEM 19 (I); (II); (III) AND (IV) A DCF modeling approach was adopted to confirm the economic viability of the Mineral Reserves as stated (Appendix A). It was generated in real June 2026 ZAR terms, which is deemed more appropriate than a DCF model in nominal terms given the uncertainties around future global economics, the exchange rate, interest rate and gold price. The DCF model relies on the revenue and cost forecasts as described in the report. It assumes a 100% equity-based business, ignores the effect of working capital, and relies on appropriate and reasonable economic assumptions (Table 30). Table 30: Economic Assumptions Description Unit Quantum Key Terms Discount Rate % 10.9 SIB/Replacement Capital (% of Operating Costs) % 2 Company Tax % 33-165 / (100*Operating Profit/Net Revenue) Royalties % 0 Contingency % 15% Exchange Rate ZAR/USD 16.30 Price per Troy Ounce USD/oz 4,114 Price Per Kg ZAR/kg 2,155,461 Source: Sound Mining, 2026; and FWGR, 2026 The impact of changes to the discount rate assumption is considered by performing a sensitivity analysis. The stay-in-business (SiB) provision of 2% of the operating costs is consistent with surface operations in general. Taxes are determined using the gold mining tax formula with all unredeemed capital considered. The assets are part of the ongoing business of FWGR, which fall outside the ambit of the provision of the MPRDA that would place an obligation to pay royalties on the proceeds of the operations. These gold price related assumptions are based on information received from FWGR and interrogated by Sound Mining. The production forecast is based on inputs from various consultants who have contributed to the Mineral Resource estimates, LoM planning and associated technical study work. 19.1. Revenue Forecast The revenue forecast is a function of gold sales and the gold price assumption. The following processing recoveries were applied to the material planned for depletion from the respective TSFs to compute the amount of gold sold. They were derived after considering data from both the DP2 plant and external test work: • 51.9% for Driefontein 5 TSF material; • 51.5% for Driefontein 3 TSF material; • 47.2% Libanon TSF material; • 50.5% for Kloof 1 TSF material; • 42.1% for Kloof 2 TSF material (i.e., reduced from the test work result of 57.00%); • 57.6% for Venterspost South TSF material; and • 48.9% for Venterspost North TSF material (i.e., reduced from the test work result of 54.7%). The expansion of DP2 facilitates an increase in gold sales after the first year (Graph 10). 119 Far West Gold Recoveries (Proprietary) Limited Document No: PR/SMI/1684/26 Graph 10: Gold Sales Forecast Source: Sound Mining, 2026 Graph 11 covers the depletion of the TSFs that comprise the latest Mineral Resource base and the LoM gold sold from these TSFs equate to approximately 1.3Moz. FWGR would need additional mineral resources for processing to continue beyond 2046. 19.2. Cashflows Graph 11 presents the post-tax cashflow for the FWGR operation as currently planned. Graph 11: Post-Tax Discounted Cashflows Source: Sound Mining, 2026 The cumulative post-tax cashflows over the LoM remain positive. When assuming a discount rate of 10.9% the unleveraged operation reflects a Net Present Value (NPV10) of ZAR15.97 billion. The QP is satisfied with the quality of the information used to underpin the revenue and cost forecasts and considers the inputs to the DCF model to constitute a level of accuracy of –5%, +15%. The Mineral Reserves as estimated are supported by healthy operating margins - 500 1 000 1 500 2 000 2 500 3 000 2 0 2 7 2 0 2 8 2 0 2 9 2 0 3 0 2 0 3 1 2 0 3 2 2 0 3 3 2 0 3 4 2 0 3 5 2 0 3 6 2 0 3 7 2 0 3 8 2 0 3 9 2 0 4 0 2 0 4 1 2 0 4 2 2 0 4 3 2 0 4 4 2 0 4 5 2 0 4 6 G o ld S o ld ( k g ) - 5 000 10 000 15 000 20 000 25 000 30 000 35 000 40 000 - 500 1 000 1 500 2 000 2 500 3 000 3 500 2 0 2 7 2 0 2 8 2 0 2 9 2 0 3 0 2 0 3 1 2 0 3 2 2 0 3 3 2 0 3 4 2 0 3 5 2 0 3 6 2 0 3 7 2 0 3 8 2 0 3 9 2 0 4 0 2 0 4 1 2 0 4 2 2 0 4 3 2 0 4 4 2 0 4 5 2 0 4 6 Z A R M Free Cashflow After Tax Cumulative Free Cashflow After Tax 120 Far West Gold Recoveries (Proprietary) Limited Document No: PR/SMI/1684/26 19.3. Sensitivities The achievability of the LoM plans, budgets and forecasts cannot be assured as they are based on economic assumptions, many of which are beyond the control of the company. Future cashflows and profits derived from such forecasts are inherently uncertain and actual results may be significantly more or less favorable. The technical risks as identified by Sound Mining are provided in Item 12.1. These and other environmental risks can impact the anticipated revenue and cost forecasts and accordingly have been assessed against upside or downside changes of between -20% and +20%. The consequential potential impacts are presented in Table 31 and is illustrated graphically in Graph 12. Table 31: Sensitivity of Post-tax NPV Variance NPV10 (ZAR Billion) 80% 90% 100% 110% 120% Revenue 10.21 13.09 15.97 18.84 21.72 Capital Expenditure 18.10 17.03 15.97 14.90 13.83 Operating Costs 16.40 16.18 15.97 15.75 15.54 Source: Sound Mining, 2026 Graph 12 shows that changes to the revenue forecast will impact margins the most. Graph 12: Sensitivity to Expected Revenue and Costs Source: Sound Mining, 2026 Table 32 shows the materiality of changes in the gold price. Table 32: Sensitivity of Gold Price Gold Price ZAR/kg 800,000 1,200,000 1,600,000 2,000,000 2,100,000 2,300,000 NPV10 (ZAR M) (3,563) 3,131 8,499 13,891 15,226 17,896 Source: Sound Mining, 2026 The operation is economically viable above a gold price of ZAR992,201/kg. The impact of changes to the operating cost forecast is materially less, with any variance in capital expenditure being relatively insensitive. A sensitivity on the discount rate is displayed in Table 33. - 5 000 10 000 15 000 20 000 25 000 80% 90% 100% 110% 120% N P V ( Z A R M ) Revenue Operating Costs Capital Expenditure


121 Far West Gold Recoveries (Proprietary) Limited Document No: PR/SMI/1684/26 Table 33: Sensitivity of the Discount Rate Discount Rate 0.0% 5.0% 7.5% 10.0% 12.5% 15.0% NPV10 (ZAR Billion) 33.67 22.88 19.43 16.77 14.69 13.02 Source: Sound Mining, 2026 Table 34 presents the potential enhancement in value for a range of UFR Related recoveries Table 34: Impact of UFR Inclusion UFR Recovery 0% 3% 6% 9% 12% 15% NPV10 (ZAR Billion) 13.63 14.33 15.03 15.73 16.43 17.13 Source: Sound Mining, 2026 19.4. Concluding Comments The QP is satisfied that the Mineral Reserves as stated are all economically viable. 122 Far West Gold Recoveries (Proprietary) Limited Document No: PR/SMI/1684/26 20. ADJACENT PROPERTIES ITEM 20 (I); (II); (III) AND (IV) A discussion of the characteristics of adjacent properties is usually relevant for in situ mineral deposits. The TSF assets are independent from adjacent properties with no correlation in mineralization. 123 Far West Gold Recoveries (Proprietary) Limited Document No: PR/SMI/1684/26 21. OTHER RELEVANT DATA AND INFORMATION ITEM 21 Information relevant to the Mineral Resource and Mineral Reserve statements will certainly include the prevailing legislative framework in South Africa. 21.1. South African Minerals Policy and Legislative Framework The South African Government has an extensive legal framework within which mining, environmental and social aspects are managed. Inclusive within the framework are international treaties and protocols, and national acts, regulations, standards, and guidelines which address international, national, provincial and local management areas. The role of the Government and the relevant regulatory authorities can be summarized as follows: • the custodian of environmental and mining legislation as a Constitutional imperative; • a conduit between the public and mining companies to ensure that mineral rights holders satisfy the objectives of transforming the mining industry by, inter alia, increasing the number of black people in the industry to reflect the country’s population demographics, to empower and enable them to meaningfully participate in and sustain the growth of the economy; thereby ensuring transparency to achieve accelerated and shared economic growth; • advocate of sustainable development, from a socio-economic and environmental management perspective; and • ultimate custodian of historical mining legacies, inclusive of abandoned mines. The Government has significantly reformed its environmental legislation. The driving force behind this is the need to support the overall national objective of sustainable development. Most recently, in 2015, the government published the National Environmental Management Laws Amendment Bill for public comment and the Draft Revised Financial Provision Regulations were published in General Notice No.: R1228 of 10 November 2017 in Government Gazette No.: 41236 in respect of prospecting, exploration and mining or production operations. The applicable laws are listed below: • The Constitution of South Africa (Act No. 108 of 1996); • Mines and Works Act, 1956 (Act No. 27 of 1956); • the Mine Health and Safety Act, 1996 (Act No. 29 of 1996); • the National Environmental Management Act, 1998 (Act No. 107 of 1998) (NEMA); • National Water Act, 1998 (Act No. 36 of 1998) (NWA); • National Nuclear Regulator Act, 1999 (Act No. 47 of 1999) (NNRA); • National Environmental Management: Biodiversity Act, 2004 (Act No. 10 of 2004); • National Environmental Management: Air Quality Act, 2004 (Act No. 39 of 2004); • National Environmental Management: Waste Act, 2008 (Act No. 59 of 2008) (NEM:WA); • the Competition Act, 1998 (Act No. 89 of 1998); • the Companies Act, 2008 (Act No. 71 of 2008); • Mineral and Petroleum Resources Development Act, 2002 (Act No. 28 of 2002) (MPRDA); • Mineral and Petroleum Resources Royalty Act, 2008 (Act No. 28 of 2008) (MPRRA); • Mining Titles Registration Act, 1967 (Act No. 16 of 1967); • Mining Titles Registration Amendment Act, 2003 (Act No. 24 of 2003); • Broad-Based Socio-Economic Charter (and associated amendments, 2010), also known as the Mining Charter; • National Heritage Resources Act, 1999 (Act No. 25 of 1999) (NHRA); • National Environmental Management: Protected Areas Act, 2003 (Act No. 57 of 2003) (NEM:PAA); • National Environmental Management: Biodiversity Act, 2004 (Act No. 10 of 2004) (NEM:BA); • National Forests Act, 1998 (Act No. 30 of 1998) (NFA); • Hazardous Substances Act, 1973 (Act No. 15 of 1973) (HSA); • Explosives Act, 1956 (Act No. 25 of 1956); 124 Far West Gold Recoveries (Proprietary) Limited Document No: PR/SMI/1684/26 • National Road Traffic Act, 1993 (Act No. 93 of 1996) (NRTA); and • New Broad-Based Black-Economic Empowerment Charter for the South African Mining Industry (also known as the New Mining Charter) published in September 2018. 21.1.1. South African Legislative Framework South African legislation applicable to mining related activities and specifically with regard to environmental, social and community impact issues are: • The Constitution of South Africa Act, 1996 (Act No. 108 of 1996); • Mineral and Petroleum Resources Development Act, 2008 (Act No. 28 of 2002) (MPRDA); • National Environmental Management Act, 1998 (Act No. 107 of 1998) (NEMA); • National Water Act, 1998 (Act No. 36 of 1998) (NWA); • National Environmental Management: Waste Act, 2008 (Act No. 59 of 2008) (NEM:WA); • National Environmental Management: Air Quality Act, 2004 (Act No. 39 of 2004) (NEM:AQA); • Hazardous Substances Act, 1973 (Act No. 15 of 1973) (HSA); • National Heritage Resources Act, 1999 (Act No. 25 of 1999) (NHRA); • National Environmental Management: Protected Areas Act, 2003 (Act No. 57 of 2003) (NEM:PAA); • National Environmental Management: Biodiversity Act, 2004 (Act No. 10 of 2004); and • National Forests Act, 1998 (Act No. 30 of 1998) (NFA). A brief description of the above Acts is summarized below: The Constitution of South Africa Act, 1996 (Act No. 108 of 1996): Mines must comply with South African constitutional and common law by conducting their operational and closure activities with due diligence and care for the rights of others. Section 24(a) of the Constitution states that everyone has the right to (a) an environment which is not harmful to their health or well-being; and (b) to have the environment protected, for the benefit of present and future generations, through reasonable legislative and other measures that: • prevent pollution and ecological degradation; • promote conservation; and • secure ecologically sustainable development and use of natural resources. Mineral and Petroleum Resources Development Act, 2002 (Act No. 28 of 2002) (MPRDA): The MPRDA provides a holistic cradle-to-grave approach to prospecting and mining by fully considering economic, social and environmental costs to achieve sustainable development of South African Mineral Resources. In May 2025, the DMPR published the Draft Mineral Resources Development Bill, 2025 for public comment, proposing several amendments to the MPRDA. Should these amendments be enacted, DRDGOLD may require some adjustments to the operational and compliance processes. As the Bill remains subject to the legislative process, the potential implications for DRDGOLD are currently uncertain. National Environmental Management Act, 1998 (Act No. 107 of 1998) (NEMA): NEMA was promulgated in 1998 to replace the Environmental Conservation Act, 1989 (Act No. 73 of 1989) (ECA) as the overarching national environmental legislative framework. NEMA was promulgated to give effect to the Environmental Management Policy (published in 2007), and has been subsequently amended, including the National Environmental Management Amendment Act of 2003, and the National Environmental Management Second Amendment Act, 2004 (Act No. 8 of 2004).


125 Far West Gold Recoveries (Proprietary) Limited Document No: PR/SMI/1684/26 The requirements for financial provisions for rehabilitation and closure are evolving. Historically, closure and rehabilitation liability calculations and financial provisions had to be determined and provided for in accordance with Regulations 53 and 54 under the MPRDA (GN 527, April 2004), a guideline document for the evaluation of the quantum of closure-related financial provisions issued by the DMPR in 2004/5, and a set of master rates updated from time to time by the DMPR based on inflation. Financial provision regulations (GNR 1147) were published on November 2015 (as amended January 2020) to replace Regulations 53 and 54 under the MPRDA. The new regulations require the following: • annual rehabilitation, as reflected in an annual rehabilitation plan; • final rehabilitation, decommissioning and closure of the prospecting, exploration, mining or production operations at the end of the life of operations, as reflected in a final rehabilitation, decommissioning and mine closure plan; and • remediation of latent or residual environmental impacts which may become known in the future, including the pumping and treatment of polluted or extraneous water; as reflected in an environmental risk assessment report; and • The applicant or holder of a right or permit must ensure that the financial provision is, at any given time, equal to the sum of the actual costs of implementing the plans and report contemplated in regulation 6 and regulation 11 (1) for a period of at least 10 years forthwith. The NEMA Section 24P (as amended in April 2014) also applies. It requires: • financial provisions to be made in the prescribed manner before an environmental authorization is issued by the DMPR; • annual assessment of environmental liabilities; and • annual “increase” of available financial provisions to the satisfaction of the Minister of Mineral Resources. National Water Act, 1998 (Act No. 36 of 1998) (NWA): The NWA stipulates that a WUL is required for the abstraction, storage, use, diversion, flow reduction and disposal of water and effluent in terms of Section 21 of the Act. Use of water for mining and related activities is also regulated through regulations that were updated after the promulgation of the NWA in 1999 - GN 704. GN 704 addresses the regulations on use of water for mining and related activities aimed at the protection of water resources. Inclusive within GNR 704 are the control measures for activities and its regulation of the sizing, control and monitoring of water management measures. National Environmental Management: Waste Act, 2008 (Act No. 59 of 2008) (NEM:WA): Waste management activities listed in terms of the NEM:WA (GN 921, 29 November 2013) include: storage of waste; the reuse, recycling and recovery of waste; treatment of waste; and disposal of waste at specified thresholds. Historically, mine residues were managed in accordance with the MPRDA and the NEMA. This situation changed in 2014 with the promulgation of the National Environmental Management: Waste Amendment Act of 2014 and its inclusion of mine residue as a Category A (hazardous) waste, as well as the addition of mine residue stockpiles and residue deposits to the list of waste management activities requiring a WML. In 2008 the Ministers of Mineral Resources and Environmental Affairs concluded an agreement on the “One Environmental System” for the country with respect to mining. Ministers adopted an integrated mine environmental management system and sought to align the MPRDA, NEMA, NEM:WA, NEM:AQA and NWA. In short, the 126 Far West Gold Recoveries (Proprietary) Limited Document No: PR/SMI/1684/26 agreement implied that environmental issues resulting from mining, prospecting, production and related activities will be regulated in terms of the NEMA, whilst the Minister of Mineral Resources will become a competent authority in terms of NEMA. Following the acceptance of the above-mentioned agreement various amendments were made to environmental legislation, inter alia, the NEMA, MPRDA and NEM:WA. Significant to these amendments were the inclusion of residue stockpiles under the NEM:WA listed activities as well as the publication of regulations regarding the planning and management of residue stockpiles and residue deposits from the prospecting, mining, exploration or production operation in GNR 632 of 2015 and GN 921 July 2015. Transitional provisions specifically include the following: • any activity in terms of regulation 73 of the MPRDA relating to the management of residue stockpiles and residues deposits, that can be done in terms of a provision of GNR 632 of 2015, must be regarded as having been done in terms thereof; • management measures of residue stockpiles and residue deposits approved in terms of the MPRDA, at the time of the coming into operation of GNR 632 of 2015, must be regarded as having been approved in terms thereof; • a holder of a right or permit in terms of the MPRDA must continue the management of the residue stockpiles and residue deposits in accordance with the approved management measures; and • a person who lawfully conducts a waste management activity listed in the NEM:WA Schedule on the date of the coming into effect of this Notice may continue with the waste management activity until such time that the Minister by notice in a Gazette calls upon such a person to apply for a WML. National Environmental Management: Air Quality Act, 2004 (Act No. 39 of 2004) (NEM:AQA): In terms of Section 21 of the NEM:AQA, an Atmospheric Emissions License (AEL) is required for listed processes that may result in atmospheric emissions, which may have a significant detrimental effect on the environment, health, social and economic conditions. These requirements apply to smelters, refineries and certain processing plants. NEM:AQA GN 283 April 2015 requires mines to register with the Department and submit results in line with the National Atmospheric Emission Inventory System (NAEIS) requirements. The National Dust Control Regulations (GNR 827, 1 November 2013) provides standards for dust-fall in residential and non-residential areas, and the requirements of monitoring and reporting to the air quality officer. Mining operations have the responsibility to comply with the standards. Hazardous Substances Act, 1973 (Act No. 15 of 1973) (HSA): The regulations relating to Group IV Hazardous Substances (GNR 247 of 26 February 1993) in terms of the HSA apply to the use and transportation of radioactive nuclides used in metallurgical processing plants. National Heritage Resources Act, 1999 (Act No. 25 of 1999) (NHRA): The NHRA requires that a heritage assessment be undertaken for developments listed in the Act. The Act prohibits the following: the alteration, disturbance, damage or demolishment of buildings and structures older than 60 years; archaeological and paleontological artefacts; cultural significant graves and burial sites; and public monuments, except for where a permit was issued by the relevant Provincial Heritage Resources Authority. National Environmental Management: Protected Areas Act, 2003 (Act No. 57 of 2003) (NEM:PAA): The NEM:PAA regulates the system of protected areas in South Africa and their management. It distinguishes between the following types of protected areas: national parks; nature reserves; special nature reserves; and ‘protected environments. Mining is prohibited in national parks, nature reserves and special nature reserves, but mining in 127 Far West Gold Recoveries (Proprietary) Limited Document No: PR/SMI/1684/26 ‘protected environments’ may be allowed with the necessary permission from the Minister of Environmental Affairs as well as the Minister of Mineral Resources. National Environmental Management: Biodiversity Act, 2004 (Act No. 10 of 2004) (NEM:BA): Holders of a mining right need to comply with the alien and invasive species regulations (GNR 598 of 1 August 2014) in terms of NEM:BA for species listed in GN 864, of 29 July 2016, which deal with different categories of alien and invasive plant and animal species that are prohibited, must be combatted or eradicated, controlled, require a permit or are subject to certain exemptions and prohibitions. National Forest Act, 1998 (Act No. 84 of 1998) (NFA): The NFA prohibits the cutting, disturbance, damage or destruction of trees in natural forests and trees included in the lists of protected tree species published in terms of the NFA, except where a license was issued by the Department of Agriculture Forestry and Fisheries (DAFF). 21.2. Changes to South African Minerals Policy and Legislative Framework Changes in government policies or the regulatory environment in South Africa may adversely impact our operations and profitability. The mining industry in South Africa is extensively regulated through legislation and regulations promulgated by government departments and regulatory bodies. These regulatory requirements govern areas including health and safety, water usage, the exploration and mining of minerals, and environmental management. A variety of permits, regulatory approvals and authorizations are required to mine lawfully, and the Government enforces its regulations through the various government departments. A lack of communication between government departments and regulatory bodies, together with under-resourced regulators, continues to present challenges that may increase compliance costs and the time required to obtain permits. The formulation or implementation of government policies may be discretionary and unpredictable on certain issues, including changes in conditions for the issuance of licenses relating to labor plans, workplace transformation and Black Economic Empowerment (BEE) requirements, laws relating to mineral rights, ownership of mining assets and the rights to prospect and mine, additional taxes on the mining industry and in extreme cases, nationalization. Changes in regulatory or government policies could adversely affect our business and may result in increased project costs and potential delays. Complexity, uncertainty and regulatory changes continue to characterize the South African regulatory environment, and changes that are adverse to business and growth may result in increased project costs and potential delays. On May 20, 2025, the draft MPRD Bill (MPRD Bill) was gazetted for public comment. The two main areas of concern in the MPRD Bill are the requirement to now be granted a mining right for movable tailings dumps and a new Broad-Based Black Economic Empowerment (B-BBBEE) and transformation regime. The other notable concern with respect to the MPRD Bill relates to suggested Beneficiation. 21.2.1. Requirement of a Mining Right Currently, and as a general proposition in the mining industry, the processing of movable tailings dumps does not constitute “mining” for the purposes of the MPRDA. Movable tailings dumps created before May 1, 2004, when the MPRDA became effective, are not subject to the MPRDA and can be processed without a mining right. Tailings dumps processed by companies like DRDGOLD are all movable in nature, and the MPRD Bill, if it ultimately amends the MPRDA, will radically change our ability to process these movable tailings dumps. 128 Far West Gold Recoveries (Proprietary) Limited Document No: PR/SMI/1684/26 21.2.2. BEE and Transformation Regime Currently, there is no requirement for BEE when applying for a Prospecting Right. The MPRD Bill changes BEE and transformation imperatives to those which currently apply to the Mining Industry. The MPRD Bill amends the definition of “this Act” to include “the Codes of Good Practice for the South African Minerals Industry and Housing and Living Conditions Standards for the Minerals Industry”, gazetted on April 29, 2009 (Codes). The MPRD Bill makes these Codes enforceable legislation. The Codes conflict with the transformational imperatives in the remainder of the MPRD Bill. 21.2.3. Beneficiation "Beneficiation” is defined as “value addition to a higher value over baselines determined by the Minister” (the Minister of Mineral and Petroleum Resources). Therefore, the State has control over what comprises beneficiation. The Minister can prescribe “conditions required to ensure security of supply for local beneficiation”. The MPRD Bill provides that “Every producer of minerals must make available minerals or mineral products for local beneficiation”. In summary, the Minister can determine what comprises “Beneficiation”, can make regulations with respect to promotion of “Beneficiation” and mining companies will be compelled to ensure supply of minerals for “Beneficiation” in South Africa. We have submitted representations to the office of the Department of Mineral and Petroleum Resources (“DMPR”) (previously the Department of Mineral Resources and Energy (the “DMRE”) expressing our concerns regarding these proposed amendments. The Minerals Council of South Africa, which advocates on behalf of mining companies such as DRDGOLD, has also submitted its own representations to the office of the DMPR. However, there can be no assurance that such advocacy efforts will be successful. In addition, although we may challenge any attempts by the State to expropriate or otherwise restrict our ownership or use of movable tailings dumps, there can be no assurance that such challenges would be effective. If the MPRD Bill, or similar amendments, is promulgated into law, it could result in increased regulatory requirements, additional costs and taxes, restrictions on our ability to process tailings or other mineral resources, or potential risks relating to the ownership and use of movable tailings dumps. Any such developments could adversely affect our operations, results and financial conditions. Furthermore, certain regulators are significantly understaffed and under-resourced and not always able to process administrative filings in accordance with prescribed timelines, which could result in delays to our project planning and execution. In 2023 and 2024, this risk materialized when the commissioning of several new reclamation sites was delayed due to backlogs in the DWS's processing of Water Use License applications, leading to shortfalls in planned production. Delays in securing the required regulatory approvals for reclamation sites 4L39 and 5L23 during FY2026 have also resulted in the need for additional material trucking, which, combined with rising fuel prices, had significant impact on operating costs. Both Ergo and FWGR currently have license and other permit applications pending relating to the commissioning of reclamation sites and TSFs. If these are not processed in time, the projects may experience delays in commissioning, which could result in lower than targeted production.


129 Far West Gold Recoveries (Proprietary) Limited Document No: PR/SMI/1684/26 22. INTERPRETATIONS AND CONCLUSIONS ITEM 22 A full list of all technical documents used in the compilation of the TRS is provided in Item 23. The QP has interrogated all of this information in the process of generating the Mineral Resource and Mineral Reserve estimates and remains satisfied with the technoeconomic merits of the LoM planning and of the integrity of the information and study work performed. Both QP’s are of the opinion that the operations of FWGR are reasonably robust in the context of the current methodologies and systems. These operations are ongoing with an experienced management team, skilled employees and a mining contractor whose track record demonstrates the required competence. Apart from the uncertainties identified herein, which risks are manageable, no factors of an operational or geo-metallurgical nature have been identified that could significantly impact the prospects for eventual economic extraction, or the viability of the Mineral Reserves as stated. The drilling, sampling, analytical processes and governance of the exploration programs are appropriate and in-line with industry best practice. They are considered to be of high confidence. The density used to determine quantities from volumes has been determined from both in situ measured values and empirical data. Sound Mining concludes that the Mineral Resource estimates are based on a suitable database of reliable information. Scrutiny of the LoM plan has shown that the recoveries used for the economic assessment coincide with the recoveries repeated herein and that the quantities and grades used are consistent with those estimated in the Mineral Resource estimation. A review of the processing at DP2 confirms that the plant has performed in-line with expectations and with further modifications (i.e., inclusion of the UFR) is likely to continue to perform accordingly at the planned increase in throughput to 1,200ktpm for Phase 2. The tailings material arising from the expanded DP2 will be stored at the RTSF, which will have excess capacity from both a depositional rate (2.4Mtpm) and final capacity perspective (800Mt). Sound Mining has reviewed and endorsed the design for the RTSF and has visited the site during its development. Sound Mining has reviewed the EIA and Environmental Management Plan (EMP) for FWGR. The mineral assets were acquired from Sibanye Gold, a subsidiary of Sibanye Stillwater Limited, in a transaction in which common law ownership was established over the various TFSs containing the Mineral Resources and Mineral Reserves. FWGR conducts its activities inter alia in accordance with environmental legislation and the provisions of the Mine Health and Safety regulations. A Use and Access Agreement with Sibanye Gold articulates the various rights, permits and licenses held by Sibanye Gold in terms of which FWGR operates, pending the transfer to FWGR of those that are transferable. The capital provision for the necessary infrastructural requirements have been reviewed and are considered appropriate. The capital expenditure on expanding DP2 and building the RTSF have been in line with expectations. Operational expenditure has been estimated using actual data from the current operations. The cost estimates are considered appropriate and in-line with a level of accuracy of –5%, +15%. The mineral reserves are stated at the gold price of ZAR2,155,461.00/kg, which is not inconsistent with the spot price of ZAR2,118,590.46/kg (i.e., USD4,015.51/oz at ZAR16.41/USD) as at June 30, 2026. The QP notes the risks identified in Item 12.1, and is satisfied that the Mineral Resources and Mineral Reserves of FWGR are not likely to be impacted materially as a consequence of any of these uncertainties. 130 Far West Gold Recoveries (Proprietary) Limited Document No: PR/SMI/1684/26 23. REFERENCES ITEM 23 The sources of data and information used in preparation of this TRS are presented in Table 35. Table 35: TRS Data and Information Sources Source Date File Type Title Engineering AZTEC Mining (Proprietary) Limited April 2025 pdf AZT-S017 - DRD Gold Far West - UFR Test Work Results R2 AZTEC Mining (Proprietary) Limited July 2025 pdf AZT-S017-TEC-00-01-R0A - Far West Gold Recoveries Testwork Results AZTEC Mining (Proprietary) Limited December 2025 pdf AZ-P055-PR-OFS-001-01 - FWGR UFR Overall Flowsheet (15Dec25) - Issued DRA SA (Proprietary) Limited August 2020 pdf RTSF Hazard and Operational Study 2 Report DRA SA (Proprietary) Limited August 2020 pdf Far West Gold Recoveries RTF FS RTSF Complex Infrastructure Fencing 2.1m High Shotcrete Perimeter Wall Layout & Details DRA SA (Proprietary) Limited September 2020 pdf Far West Gold Recoveries Regional Tailings Facility - Basis of Estimate DRA SA (Proprietary) Limited September 2020 pdf Far West Gold Recoveries Regional Tailings Facility Basis of Estimate DRA SA (Proprietary) Limited June 2020 pdf Plant layout DRD FWGR Phase 2 Expansion Project (CPP) DRA SA (Proprietary) Limited June 2020 pdf DRD FWGR Phase 2 Expansion Project Feasibility Study Process Design Criteria (CPP) DRA SA (Proprietary) Limited June 2020 pdf DRD FWGR Phase 2 Expansion Project Feasibility Study Mechanical Equipment List (CPP) DRA SA (Proprietary) Limited November 2020 pdf DRD FWGR Phase 2 Expansion Project Feasibility Study Executive Summary DRA SA (Proprietary) Limited November 2020 pdf DRD FWGR Phase 2 Expansion Project Feasibility Study Opex (CPP) DRA SA (Proprietary) Limited November 2020 xlsx Phase 2 Expansion Project Feasibility Study Capital Cost Estimate (CPP and Piping Rev 6) DRA SA (Proprietary) Limited October 2020 xlsx Far West Gold Recoveries Regional Tailings Facility Capital Cost Estimate: Scenario 2 DRA SA (Proprietary) Limited October 2020 xlsx DRDGOLD - Far West Gold Recoveries Phase 2 Expansion Project Feasibility Study OPEX DRA SA (Proprietary) Limited August 2022 pdf 00301-Blockplan with Google Overlay DRA SA (Proprietary) Limited 2022 pdf 00301-Blockplan DRA SA (Proprietary) Limited 2022 xlsx DP2 - expansion capital spend DRA SA (Proprietary) Limited March 2022 pdf Far West Gold Recoveries DP2 Expansion Project Feasibility Study Basis of Estimate DRA SA (Proprietary) Limited 2022 pdf FZADBR6245-PROC-PDC-005-Rev B_PDC DRA SA (Proprietary) Limited 2022 xlsx FZADBR6245-PROC-PDC-005-Rev B_PDC DRA SA (Proprietary) Limited May 2022 pdf Far West Gold Recoveries Dp2 Expansion Project Feasibility Study Process Flow Diagram DRDGOLD Limited July 2026 docx Residue Diagnostic Report DRDGOLD Limited August 2020 docx Manual for the Management of the Disposal of Tailings on the Far West Gold Recoveries Regional Tailings Facility DRDGOLD Limited August 2020 pdf Electrical Point of Delivery Meeting minutes Geo Tail SA (Proprietary) Limited May 2023 pdf Far West Gold Recoveries Regional Tailings Storage Facility Design Report Geo Tail SA (Proprietary) Limited June 2022 pdf Leeudoorn TSF Cyclone Conversion Design Geo Pollution Technologies - Gauteng (Proprietary) Limited August 2021 pdf Kloof Gold Mine Leeudoorn Return Water Dam Strategy Highlands Hydrology (Proprietary) Limited and Water Hunters August 2020 pdf Hydrological Assessment for the Proposed Regional Tailings Facility, Far West Gold Recoveries Version 1 Mintek and DRDGOLD Limited September 2020 xlsx Predicted yields from the various dams based on test work results at September 2020 Water Hunters January 2020 xlsx WRTRP Output Analysis v 0.5e2 Base Case Water Hunters August 2020 pdf Far West Gold Recoveries - Regional Tailings Facility - Updated Ground Water Model Report Environmental/Legal 131 Far West Gold Recoveries (Proprietary) Limited Document No: PR/SMI/1684/26 Department of Minerals Resources and Energy May 2018 pdf WRTRP Driefontein Environmental Authorization GP30/5/1/2/3/2/1(51)EM Department of Minerals Resources and Energy May 2018 pdf WRTRP Kloof Integrated Environmental Authorization GP30/5/1/2/3/2/1 (66)EM Department of Minerals Resources and Energy July 2023 pdf EA Granting Letter for Far West Gold Recoveries (Pty) Ltd Ref No.: GP30/5/1/2/2 (51) MR Department of Mineral and Petroleum Resources July 2026 pdf Integrated Environmental Authorisation for Far West Gold Recoveries Libanon Project Ref No.: GP30/5/1/1/2(000073) BP/BAR Department of Water and Sanitation March 2017 pdf WRTRP Integrated Water Use License. License No.: 10/C22B/ACFGI/4976 Department of Water and Sanitation March 2017 pdf Driefontein Water Use License. License No.: 10/C23E/ACEFGIJ/4527 Department of Water and Sanitation July 2025 pdf Far West Gold Recoveries (Pty) Kloof Operations Water Use License. License No.: 10/C22B/ACFGI/4976 Department of Water and Sanitation July 2026 pdf Far West Gold Recoveries (Pty) Libanon Water Use License. License No.: 10/C23D/CGI/18789 Digby Wells Environmental (South Africa) (Proprietary) Limited May 2026 xlsx Far West Gold Recoveries Closure Cost Assessment 2026. Digby Wells Environmental (South Africa) (Proprietary) Limited August 2025 pdf Far West Gold Recoveries Closure Planning Documents Aligned with the Requirements of the Financial Provisioning Regulations Digby Wells Environmental (South Africa) (Proprietary) Limited March 2016 pdf Environmental Impact Assessment and Environmental Management Programme for the Amendment of the existing EMP and Inclusion of Listed Activities Associated with Operations at Driefontein Mining Right Area, Sibanye Gold Digby Wells Environmental (South Africa) (Proprietary) Limited March 2016 pdf Environmental Impact Assessment and Environmental Management Programme for the Amendment of the existing EMP and Inclusion of Listed Activities Associated with Operations at Kloof Mining Right Area, Sibanye Gold Digby Wells Environmental (South Africa) (Proprietary) Limited May 2020 pdf Far West Gold Recoveries Closure Costs Assessment 2020 (ERG6453) Digby Wells Environmental (South Africa) (Proprietary) Limited September 2020 pdf Driefontein Environmental Authorization Audit Malan Scholes Inc November 2017 pdf Due Diligence Report for DRDGOLD Limited in respect of the West Rand Tailings Retreatment Project National Nuclear Regulator July 2019 pdf Certificate of Registration in terms of the National Nuclear Regulator Act, 1999 (Act No. 4T of 1999) Werksmans Attorneys November 2017 pdf Exchange agreement between Sibanye Gold and K2017449061 (WRTRP to be renamed) and including DRDGOLD Schedule and Economics DRDGOLD Limited 2022 xlsx SK1300 - DP2 Expansion LOM plan_13Jul22_Option 3_REAL_Blended_50_MT Edited_Rev3 DRDGOLD Limited June 2026 xlsx DP2_FY26_June 26_BASE_V5 DRDGOLD Limited 2026 xlsx Gold and Tonnage Split_2026 GoldHub 2026 https World Gold Council, Gold supply and demand statistics - https://www.gold.org/goldhub/data/gold-supply-and-demand-statistics GoldHub 2026 https https://www.gold.org/goldhub/research/gold-demand-trends/gold-demand- trends-q2-2026 GoldHub 2026 https https://www.gold.org/goldhub/data/historical-mine-production GoldHub 2026 https Gold Supply and demand statistics 30 July 2026https://www.gold.org/goldhub/data/gold-supply-and-demand-statistics Sibanye Stillwater Limited 2019 pdf Mineral Resources and Mineral Reserves Report Sound Mining December 2017 pdf Competent Persons' Report on the West Rand Tailings Retreatment Project for DRDGOLD Limited Sound Mining December 2020 pdf PR SMI 0921 20 DFS Report for FWGR - Phase 2 Expansion Project World Gold Council 2026 https Gold Demand Trends Q2 2026 - https://www.gold.org/goldhub/research/gold- demand-trends/gold-demand-trends-q2-2026/supply Geology Frimmel et al 2005 pdf The Formation and Preservation of the Witwatersrand Goldfields, the World’s Largest Gold Province Geographicx Surveys CC July 2026 dwg DRIEFONTEIN 5 01072026 MERGE R1 132 Far West Gold Recoveries (Proprietary) Limited Document No: PR/SMI/1684/26 Geographicx Surveys CC July 2026 pdf QUANTITY REPORT OF DRIEFONTEIN 5 01072026 R1 Geographicx Surveys CC July 2026 dwg DRIEFONTEIN NO 3 01072026 MERGE R1 Geographicx Surveys CC July 2026 pdf QUANTITY REPORT OF DRIEFONTEIN 3 01072026 R1 Geoplan Materials Engineering (Proprietary) Limited November 2020 xlsx DRDGOLD Density Data McCarthy and Rubidge 2005 Book The Story of Earth and Life Minxcon (Proprietary) Limited June 2009 pdf Technical Report on the Surface Mineral Resource Estimation, Scheduling and Financial Valuation of the West Wits HTO Project, Gold Fields (Pty) Ltd. South Africa Minxcon (Proprietary) Limited February 2013 pdf A Technical Report on The Gold1 TSFs in the Gauteng Province, South Africa Minxcon (Proprietary) Limited 2013 dm d4_e_krig_all1 Minxcon (Proprietary) Limited 2013 dm d4_w_krig_all1 Minxcon (Proprietary) Limited 2009 dm drth_krig_allfinal2b Minxcon (Proprietary) Limited 2009 dm DTOPO_pt/tr Minxcon (Proprietary) Limited 2009 dm dr5_krig_all fin Minxcon (Proprietary) Limited 2009 dm dtopo_pt/tr Minxcon (Proprietary) Limited 2009 dm kl1_krig_all_final3c Minxcon (Proprietary) Limited 2009 dm DTOPO_pt/tr Minxcon (Proprietary) Limited 2009 dm lib_krig_all1_2010c Minxcon (Proprietary) Limited 2009 dm dtopo_pt/tr Minxcon (Proprietary) Limited 2009 dm vn_krig_all1_fin2d Minxcon (Proprietary) Limited 2009 dm vn_fin_pt/tr Minxcon (Proprietary) Limited 2009 dm vs_krig_all1_final2c Minxcon (Proprietary) Limited 2009 dm vs_fin_pt/tr Sound Mining 2026 dat K2 OK 2 Sound Mining 2026 dat Combined Composite 1.5m -BM The RVN Group (Proprietary) Limited July 2020 pdf Density Measurements and Supervision DRDGOLD The glossary of terms, units and abbreviations used in this TRS are presented in Table 36. Table 36: Glossary and Abbreviations Term Explanation Archaean Geological eon from 2,500Ma - 4,000Ma Assay The chemical analysis of ore samples to determine their metal content Auriferous Containing, or producing, gold Basin A geological basin is a large low-lying area, often below sea level Clastic A rock or sediment composed principally of transported broken fragments derived from pre-existing rocks or minerals Conformable A sequence of beds is said to be conformable when they represent an unbroken period of deposition Conglomerate A coarse-grained clastic sedimentary rock composed of rounded to subangular fragments set in a fine-grained matrix Craton An old and stable section of the continental lithosphere which has survived cycles of merging and rifting continents. Cratons are today generally found in the interior of tectonic plates Cut-off grade The lowest grade of mineralized rock that determines as to whether or not it is economic to recover its gold content by further concentration Density Measure of the relative “heaviness” of objects with a constant volume, density = mass/volume Deposit Any sort of earth material that has accumulated through the action of wind, water, ice or other agents De-survey Mathematical reconstruction in 3D space of a borehole trace using azimuth and dip survey data Detrital Formed from eroded loose rock and mineral material Dilution Waste or material below the cut-off grade that contaminates the ore during the course of mining operations and thereby reduces the average grade mined Definitive Feasibility Study (DFS) A definitive engineering estimate of all costs, revenues, equipment requirements and production at a -5% to +10% level of accuracy. The study is used to define the economic viability of a project and to support the search for project financing Distal Relating to or denoting the outer part of an area affected by geological activity Dolomite Carbonate mineral, CaMg(CO3)2. The word dolomite is also used to describe the sedimentary carbonate rock, which is composed predominantly of the mineral dolomite Doré An unrefined, therefore impure, alloy of gold with variable quantities of silver and smaller quantities of base metals, which is produced at a mine before passing on to a refinery for upgrading to London Good Delivery standard, which usually consists of 85% gold on average


133 Far West Gold Recoveries (Proprietary) Limited Document No: PR/SMI/1684/26 Term Explanation Drillhole Exploration hole drilled for the purposes of exploring for and evaluating sub-surface geology, in this instance the presence and distribution of gold Dyke A tabular vertical or near-vertical body of igneous rock formed by magmatic injection into planar zones of weakness such as faults or fractures that is discordant to the bedding or foliation of the country rock Estimation The quantitative judgement of a variable Exploration Prospecting, sampling, mapping, drilling and other work involved in the search for mineralization Facies The sum total of sedimentary features that characterize a sediment as having been deposited in a given environment; an assemblage of metamorphic rocks which are considered to have formed under similar conditions of temperature and pressure Fault A fracture in earth materials, along which the opposite sides have been displaced parallel to then plane of the movement Fire Assay The assaying of metallic ores by methods requiring the use of furnace heat Fluvial Produced by the action of a stream or river Footwall The underlying side of a stope or ore body Goldfield An auriferous deposit defined in a geographically distinct sub-basin Granite An intrusive felsic rock which is granular in texture Hydrothermal The circulation of hot water. Hydrothermal circulation occurs most often in the vicinity of sources of heat within the Earth's crust. In general, this occurs near volcanic activity Indicated Mineral Resource Is that part of a Mineral Resource for which quantity and grade or quality are estimated on the basis of adequate geological evidence and sampling. The level of geological certainty associated with an indicated Mineral Resource is sufficient to allow a qualified person to apply modifying factors in sufficient detail to support mine planning and evaluation of the economic viability of the deposit. Because an indicated Mineral Resource has a lower level of confidence than the level of confidence of a measured mineral resource, an indicated Mineral Resource may only be converted to a probable Mineral Reserve. Inferred Mineral Resource Is that part of a Mineral Resource for which quantity and grade or quality are estimated on the basis of limited geological evidence and sampling. The level of geological uncertainty associated with an inferred Mineral Resource is too high to apply relevant technical and economic factors likely to influence the prospects of economic extraction in a manner useful for evaluation of economic viability. Because an inferred Mineral Resource has the lowest level of geological confidence of all Mineral Resources, which prevents the application of the modifying factors in a manner useful for evaluation of economic viability, an inferred Mineral Resource may not be considered when assessing the economic viability of a mining project, and may not be converted to a Mineral Reserve. Karoo A large semi-desert natural region of South Africa which lends its name to the geological Karoo Supergroup which is often used as an age description for the eon from 145Ma - 360Ma Kriging An interpolation method that minimizes the estimation error in the determination of a mineral resource. Kriging is a method of interpolation for which the interpolated values are modelled by a Gaussian process governed by prior covariances License, Permit, Lease or other similar entitlement Any form of license, permit, lease or other entitlement granted by the relevant Government department in accordance with its mining legislation that confers on the holder certain rights to explore for and/or extract minerals that might be contained in the land, or ownership title that may prove ownership of the minerals Life-of-Mine (LoM) Number of years in the current mine plan that an operation will extract and treat ore Measured Mineral Resource is that part of a Mineral Resource for which quantity and grade or quality are estimated on the basis of conclusive geological evidence and sampling. The level of geological certainty associated with a measured Mineral Resource is sufficient to allow a qualified person to apply modifying factors, in sufficient detail to support detailed mine planning and final evaluation of the economic viability of the deposit. Because a measured Mineral Resource has a higher level of confidence than the level of confidence of either an indicated Mineral Resource or an inferred Mineral Resource, a measured Mineral Resource may be converted to a proven Mineral Reserve or to a probable Mineral Reserve. Mineable That portion of a mineral resource for which extraction is technically and economically feasible Mineral Asset(s) Any right to explore and/or mine which has been granted (“property”), or entity holding such property or the securities of such an entity, including but not limited to all corporeal and incorporeal property, mineral rights, mining titles, mining leases, intellectual property, personal property (including plant equipment and infrastructure), mining and exploration tenures and titles or any other right held or acquired in connection with the finding and removing of minerals and petroleum located in, on or near the Earth’s crust. Mineral Assets can be classified as Dormant Properties, Exploration Properties, Development Properties, Mining Properties or Defunct Properties Mineral Reserve Is an estimate of tonnage and grade or quality of indicated and measured Mineral Resources that, in the opinion of the QP, can be the basis of an economically viable project. More specifically, the economically mineable part of a measured or indicated Mineral Resource, which includes diluting materials and allowances for losses that may occur when the material is mined or extracted. The determination that part of a measured or indicated Mineral Resource is economically mineable must be based on a preliminary feasibility or feasibility study conducted by a QP applying the modifying factors to indicated or measured Mineral Resources. The study must demonstrate that, at the time of the reporting, extraction of the Mineral Reserve is economically viable under reasonable investment and market assumptions. The study must establish a life of mine plan that is technically achievable and economically viable, which will be the basis of determining the Mineral Reserve. And the term “economically viable” means that the QP has determined, using a discounted cashflow analysis, or has otherwise analytically determined that the extraction of the mineral reserve is economically viable under reasonable investment and market assumptions. 134 Far West Gold Recoveries (Proprietary) Limited Document No: PR/SMI/1684/26 Term Explanation Mineral Resource Is a concentration or occurrence of material of economic interest in or on the Earth's crust in such form, grade or quality, and quantity that there are reasonable prospects for economic extraction. A Mineral Resource is a reasonable estimate of mineralization, taking into account relevant factors such as cut-off grade, likely mining dimensions, location or continuity, that, with the assumed and justifiable technical and economic conditions, is likely to, in whole or in part, become economically extractable. It is not merely an inventory of all mineralization drilled or sampled. Modifying Factors Are the factors that a qualified person must apply to indicated and measured Mineral Resources and then evaluate in order to establish the economic viability of Mineral Reserves. A qualified person must apply and evaluate modifying factors to convert measured and indicated Mineral Resources to proven and probable Mineral Reserves. These factors include, but are not restricted to: Mining; processing; metallurgical; infrastructure; economic; marketing; legal; environmental compliance; plans, negotiations, or agreements with local individuals or groups; and governmental factors. The number, type and specific characteristics of the modifying factors applied will necessarily be a function of and depend upon the mineral, mine, property, or project. Reef A precious metal bearing stratiform tabular ore body Run-of-Mine (RoM) Means the mineralized, raw unprocessed or uncrushed material obtained after blasting or excavating Shale A fine-grained detrital sedimentary rock formed from clay, mud or silt Strike Refers to the orientation of a geologic feature which is a line representing the intersection of that feature with a horizontal plane. This is represented as a compass bearing of the strike line Syncline A fold with strata sloping upward on both sides from a common valley/base Tailings Material remaining after ore has been processed Unconformity A surface between successive strata representing a missing interval in the geologic record of time and produced either by an interruption in deposition or by the erosion of lithology followed by renewed deposition Uraninite A black, brown or grey uranium ore mineral, UO2 Variogram A measure of the average variance between sample locations as a function of sample separation Wireframe A 3D surface constructed from vertices with connecting straight lines or curves Term Description % percentage % Au percentage gold % mass percentage mass ~ approximate ‘ minutes ‘000m3 thousand cubic meters “ seconds ° Degree °C Degrees Celsius µm micrometer 3D three dimensional AEL Atmospheric Emissions License ALS ALS Chemex South Africa (Proprietary) Limited AMIS African Mineral Standards ANC African National Congress Au Gold Au(CN)2 gold cyanide complex Aztec AZTEC Mining (Proprietary) Limited bar metric unit of pressure BPS Booster Pump Stations CIL Carbon-in-Leach CIP Carbon-in-Pulp CLR Carbon Leader Reef cm centimeter cm3 cubic centimeter COP Cooke Optimization Project CoR Certificate of Registration Covid-19 Coronavirus Disease 2019 CPP Central Processing Plant CRM Certified Reference Material CTSF Central Tailings Storage Facility CUP Cooke Uranium Project DA Democratic Alliance 135 Far West Gold Recoveries (Proprietary) Limited Document No: PR/SMI/1684/26 Term Explanation DAFF Department of Agriculture Forestry and Fisheries DCF Discounted Cashflow DFS Definitive Feasibility Study Digby Wells Digby Wells Environmental (South Africa) (Proprietary) Limited DMPR Department of Mineral and Petroleum Resources DP2 Driefontein Plant 2 DP3 Driefontein Plant 3 DRA DRA SA (Proprietary) Limited DRDGOLD DRDGOLD Limited DWS Department of Water and Sanitation E east EA Environmental Authorization under NEMA EAPASA Environmental Assessment Practitioners Association of South Africa ECA Environmental Conservation Act ECSA Engineering Council of South Africa EIA Environmental Impact Assessment EMP Environmental Management Plan EMPr Environmental Management Program Report Ergo Ergo Mining (Proprietary) Limited Eskom Electricity Supply Commission ESTA Extension of Security of Tenure Act Ezulwini Ezulwini Mining Company (Proprietary) Limited FEED Front End Engineering Design FSAIMM Fellow of the Southern African Institute of Mining and Metallurgy FWGR Far West Gold Recoveries (Proprietary) Limited FY Financial Year g gram g/cm3 grams per cubic centimeter g/t grams per tons g/t Au grams per tons gold Ga Giga annum (a period of 1 billion years) GDP Gross Domestic Product GICL Guardrisk Insurance Company Limited GISTM Global Industry Standard on Tailings Management GN Government Notice GNR Government Notice Regulation GNU Government of National Unity Gold Fields Gold Fields Limited Gold One Gold One International Limited GPS Global Positioning System GSSA Geological Society of South Africa GTSA Geo Tail SA (Proprietary) Limited GWh Gigawatt-hour H2SO4 sulfuric acid ha Hectare Harmony Harmony Gold Mining Company Limited HDPE high-density polyethylene pipe HIA Heritage Impact Assessment HIV/AIDS Human Immunodeficiency Viruses/Acquired Immunodeficiency Syndrome HNO3 nitric acid hr Hour HSA Hazardous Substances Act I&APs Interested & Affected Parties IEA Integrated Environmental Authorization IFP Inkatha Freedom Party 136 Far West Gold Recoveries (Proprietary) Limited Document No: PR/SMI/1684/26 Term Explanation iLanda iLanda Water Services CC ISO International Organization for Standardization IWUL Integrated Water Use License JSE Johannesburg Stock Exchange Limited JV Joint Venture kg kilogram kHz kilohertz km kilometer koz kilo ounce ktpm kiloton per month kV kilovolt kVA kilovolt-ampere LIDAR light detection and ranging LoM Life-of-Mine m meters M million m/yr meters per year m2 square meter m³ cubic meter m³/a cubic meter per annum m³/d cubic meters per day m³/hr cubic meter per hour Ma Mega annum (a period of 1 million years) MAED MAED Metallurgical Laboratories mamsl meters above mean sea level MHSA Mine Health and Safety Act Minxcon Minxcon (Proprietary) Limited mm millimeters Mm3 Million cubic meters Mm3/a Million cubic meters per annum Moz Millions of ounces MPRDA Mineral and Petroleum Resources Development Act MPRRA Mineral and Petroleum Resources Royalty Act MR Mining Right Mt Million tons Mtpm Million tons per month MVA Mega Volt Ampere N north NAEIS National Atmospheric Emission Inventory System NEM:AQA National Environmental Management Air Quality Act NEM:BA National Environmental Management Biodiversity Act NEM:PAA National Environmental Management: Protected Areas Act NEM:WA National Environmental Management Waste NEMA National Environmental Management Act NERSA National Energy Regulator of South Africa NFA National Forests Act NHRA National Heritage Resources Act NMD Nominal Maximum Demand NNR National Nuclear Regulator NNRA National Nuclear Regulator Act NOA Group NOA Group Assets Proprietary Limited NPV Net Present Value NRTA National Road Traffic Act NWA National Water Act NYSE New York Stock Exchange


137 Far West Gold Recoveries (Proprietary) Limited Document No: PR/SMI/1684/26 Term Explanation oz troy ounce (conversion to troy ounces is 31.10348) oz Au gold ounces Performance Laboratories Performance Laboratories Proprietary Limited PFS Preliminary Feasibility Study pH scale used to specify the acidity or basicity of an aqueous solution PMP Probable Maximum Precipitation PoD Point of Delivery QA/QC Quality Assurance and Quality Control QP Qualified Person Rand Uranium Rand Uranium Limited RoM Run-of-Mine RTK Real Time Kinetic RTSF Regional Tailings Storage Facility S south S2 sulfur SACNASP South African Council for Natural Scientific Professions SADPMR The South African Diamond and Precious Metals Regulator SAIMM Southern African Institute of Mining and Metallurgy SALA Subdivision of Agricultural Land Act SANAS South African National Accreditation System SEC Securities and Exchange Commission Set Point Set Point Laboratories SG Specific Gravity SGS SGS South Africa (Proprietary) Limited SI Système Internationale SIA Social Impact Assessment SiB Stay-in-Business Sibanye Gold Sibanye Gold (Proprietary) Limited Sibanye-Stillwater Sibanye Stillwater Limited S-K 1300 Subpart 1300 of Regulation S-K under the U.S. Securities Exchange Act of 1934 SLP Social and Labor Plan Sound Mining Sound Mining International SA (Proprietary) Limited SPLUMA Spatial Planning and Land Use Management Act, SPV Special Purpose Vehicle SRK SRK Consulting (Proprietary) Limited SVOL1 first search volume SVOL2 second search volume t metric tons t/m3 tons per cubic meter TDS total dissolved solids the Trust DRDSA Empowerment Trust ToR Terms of Reference tpa tons per annum tph tons per hour tpm tons per month TRS Technical Report Summary TSF Tailings Storage Facility U uranium U3O8 triuranium octoxide UFR Aztec UpFlow Reactor USD United States Dollars USD/oz United States Dollars per ounce UTM Gauss Conform Projection V1 Version 1 138 Far West Gold Recoveries (Proprietary) Limited Document No: PR/SMI/1684/26 Term Explanation V2 Version 2 V:H Vertical Distance: Horizontal Distance VCR Ventersdorp Contact Reef W west Witwatersrand Basin Witwatersrand Supergroup WML Waste Management License WRTRP West Rand Tailings Retreatment Project (Proprietary) Limited WUL Water Use License WWP West Wits Project WWTTP West Wits Tailings Treatment Project ZAR South African Rands ZAR Billion Billion South African Rands ZAR M Million South African Rands ZAR M/yr Millions of South African Rands per year ZAR/kg South African Rands per kilogram ZAR/t South African Rands per tons ZAR/USD South African Rands and United States Dollars exchange rate 139 Far West Gold Recoveries (Proprietary) Limited Document No: PR/SMI/1684/26 24. RELIANCE ON INFORMATION PROVIDED BY THE REGISTRANT ITEM 24 The information and conclusions within this TRS are based on information made available to the QPs by DRDGOLD and FWGR at the time of the preparation of this TRS. The QPs have relied on this information with respect to legal matters (Item 3), environmental or social and labor planning aspects (Item 17) and economic assumptions (Item 19). The QPs have reviewed this information at face value and are satisfied that it is both reasonable and appropriate. QPs consider it reasonable to rely on the information provided by FWGR since they are familiar with the operations and ongoing progress of FWGR since inception, and as a consequence enjoy an enhanced level of comfort with respect to management integrity and the processes, procedures and quality of planning conducted at FWGR. Additional information provided by FWGR included technical reports supplied by its consultants and associates and the relevant published data, as listed below: • the QPs have not independently conducted any title or litigation searches but have relied upon FWGR for information on the property title, agreements and other pertinent conditions; • these studies were undertaken by Digby Wells Environmental (South Africa) (Proprietary) Limited (Digby Wells) and Sound Mining has relied on the findings of these studies; • DRA SA (Proprietary) Limited were responsible for the detailed design for the expansion of DP2 and associated piping and pumping infrastructure; • Geo Tail SA (Proprietary) Limited (GTSA) were responsible for the Cyclone Conversion Design as well as the design of the RTSF; and the QPs have relied on the findings of this study; and • AZTEC Mining (Proprietary) Limited (AZTEC) were responsible for the UpFlow Reactor Test Work. 140 Far West Gold Recoveries (Proprietary) Limited Document No: PR/SMI/1684/26 25. QUALIFIED PERSONS DISCLOSURE CONSENT ITEM 25 We, the signees, in our capacity as Qualified Persons in connection with the Technical Report Summary of Far West Gold Recoveries Proprietary Limited dated October 2, 2026 (The Technical Report Summary) as required by Item 601(b)(96) of Regulation S-K and filed as an exhibit to DRDGOLD Limited’s (DRDGOLD) annual report on Form 20-F for the year ended June 30, 2026 and any amendments or supplements and/or exhibits thereto (collectively, the “Form 20-F”) pursuant to Subpart 1300 of Regulation S-K promulgated by the U.S. Securities and Exchange Commission (1300 Regulation S-K), each hereby consent to: • the public filing and use by DRDGOLD of the Technical Report Summary for which I am responsible as an exhibit to the Form 20-F; • the use and reference to my name, including my status as an expert or Qualified Person (as defined by SK-1300) in connection with the Form 20-F and Technical Report Summary for which I am responsible; • use of any extracts from, or summary of, the Technical Report Summary in the Form 20-F and the use of any information derived, summarized, quoted or referenced from the Technical Report Summary, or portions thereof, that is included or incorporated by reference into the Form 20-F; and any amendments or supplements thereto. I am responsible for authoring, and this consent pertains to, the Technical Report Summary for which my name appears below and certify that I have read the 20-F and that it fairly and accurately represents the information in the Technical Report Summary for which I am responsible. Table 37: QP Area of Responsibility and Disclosure Consent Property Name TRS Effective Date QP Name Affiliation to Registrant Field or Area of Responsibility Signature Far West Gold Recoveries Proprietary Limited (A subsidiary of DRDGOLD Limited) June 30, 2026 Mr Vaughn Duke Independent Consultant Item 1 to 5, 10, 12 to 16, and 18 to 25 /s/ Vaughn Duke Far West Gold Recoveries Proprietary Limited (A subsidiary of DRDGOLD Limited) June 30, 2026 Mr Nicholas Weeks Independent Consultant Item 1, 6 to 9 and 11 /s/ Nicholas Weeks Far West Gold Recoveries Proprietary Limited (A subsidiary of DRDGOLD Limited) June 30, 2026 Mr W de Frey Independent Consultant Item 17 /s/ Willem de Frey


141 Far West Gold Recoveries (Proprietary) Limited Document No: PR/SMI/1684/26 25.1. Date and Signature Page This report titled “S-K 1300 Technical Report Summary for Far West Gold Recoveries (Proprietary) Limited with an effective date of June 30, 2026, was prepared and signed by: QP Name Field or Area of Responsibility Signature Date Mr Vaughn Duke Mineral Reserves /s/ Vaughn Duke October 2, 2026 Mr Nicholas Weeks Mineral Resources /s/ Nicholas Weeks October 2, 2026 Mr W de Frey Environmental and Social Governance /s/ Willem de Frey October 2, 2026 142 Far West Gold Recoveries (Proprietary) Limited Document No: PR/SMI/1684/26 APPENDIX A: CASHFLOW MODEL Description Unit Total/Average FY2027 FY2028 FY2029 FY2030 FY2031 FY2032 FY2033 FY2034 FY2035 FY2036 FY2037 FY2038 FY2039 FY2040 FY2041 FY2042 FY2043 FY2044 FY2045 FY2046 Reclaimed Tons kt 270,521 7,625 14,400 14,400 14,400 14,092 14,400 14,400 14,400 14,352 14,400 14,400 14,147 14,077 14,400 14,400 14,400 14,400 14,113 14,400 4,915 Head Grade g/t 0.30 0.46 0.37 0.37 0.37 0.34 0.30 0.30 0.30 0.28 0.26 0.26 0.28 0.28 0.26 0.26 0.26 0.26 0.26 0.27 0.27 Recovery % 52.5 52.3 54.9 54.9 54.9 54.6 54.1 54.1 54.1 52.7 50.3 50.3 55.1 55.8 48.4 48.4 48.4 48.4 48.5 51.5 51.5 Gold Sold kg 42,216 1,833 2,925 2,925 2,925 2,645 2,328 2,328 2,328 2,136 1,865 1,865 2,193 2,237 1,799 1,799 1,799 1,799 1,767 2,030 693 Revenue ZAR M 90,812 3,942 6,292 6,292 6,292 5,689 5,007 5,007 5,007 4,594 4,011 4,011 4,718 4,811 3,869 3,869 3,869 3,869 3,802 4,368 1,491 Operating Costs ZAR M 38,047 1,064 2,021 2,010 2,010 1,977 2,021 2,021 2,021 2,014 2,021 2,021 1,985 1,975 2,021 2,021 2,021 2,021 1,980 2,021 805 Capital Expenditure ZAR M 4,744 2,032 247 38 38 664 164 164 111 38 38 383 211 349 38 38 38 38 38 38 38 Pre-tax Free Cashflow ZAR M 48,022 846 4,024 4,244 4,244 3,048 2,823 2,823 2,875 2,543 1,953 1,607 2,523 2,487 1,810 1,810 1,810 1,810 1,783 2,309 648 Corporate Tax ZAR M 14,349 214 1,224 1,297 1,297 912 849 849 866 763 578 464 755 741 534 534 534 534 526 690 189 Post-tax Free Cashflow ZAR M 33,673 632 2,800 2,947 2,947 2,136 1,974 1,974 2,009 1,779 1,375 1,143 1,768 1,746 1,277 1,277 1,277 1,277 1,258 1,619 459 Cumulative Post-tax Free Cashflow ZAR M 33,673 632 3,432 6,379 9,327 11,463 13,437 15,411 17,420 19,199 20,574 21,717 23,485 25,231 26,507 27,784 29,061 30,338 31,595 33,214 33,673 Post-tax Discounted Cashflow ZAR M 15,966 600 2,397 2,276 2,052 1,341 1,117 1,008 925 738 514 386 538 479 316 285 257 232 206 239 61 Cumulative Post-tax Discounted Cashflow ZAR M 15,966 600 2,998 5,273 7,325 8,666 9,784 10,791 11,716 12,454 12,969 13,355 13,893 14,372 14,687 14,972 15,229 15,461 15,666 15,905 15,966


RVN Group Head Offices, Corner Hendrik Potgieter Road and 8 Tugela Avenue, Florida Glen, Roodepoort, 1708, South Africa WWW.RVNGROUP.CO.ZA Exhibit 96.2 ERGO’S TECHNICAL REPORT SUMMARY OF THE MATERIAL TAILINGS STORAGE FACILITIES Report Prepared by Qualified Persons from: THE RVN GROUP PROPRIETARY LIMITED Prepared for: Ergo Mining Proprietary Limited, a subsidiary of DRDGOLD Limited Attention: Ryno Botha Mineral Resources Manager Document No.: R4005 Effective date: 30 June 2025 Document date: 30 October 2025 ERGO’S TECHNICAL REPORT SUMMARY OF THE MATERIAL TAILINGS STORAGE FACILITIES PAGE 2 2 Table of Contents 1. Executive Summary ........................................................................................................................................................... 11 1.1. Introduction .......................................................................................................................................................... 11 1.2. Property Description ............................................................................................................................................. 11 1.3. Mineral Rights and Ownership ............................................................................................................................. 11 1.4. Development and Operations ............................................................................................................................... 12 1.5. Geology and Mineralization .................................................................................................................................. 12 1.6. Evaluation Drilling and Sampling .......................................................................................................................... 12 1.7. Sample Preparation .............................................................................................................................................. 13 1.8. Assays .................................................................................................................................................................. 14 1.9. Quality Assurance and Quality Control ................................................................................................................. 14 1.10. Metallurgical Sampling and Testing ...................................................................................................................... 14 1.11. Mineral Resource Estimates ................................................................................................................................ 15 1.12. Mineral Reserve Estimates .................................................................................................................................. 17 1.13. Capital and Operating Cost Estimates ................................................................................................................. 19 1.14. Permitting Requirements ...................................................................................................................................... 19 1.15. Conclusion and Recommendations ...................................................................................................................... 20 2. Introduction ........................................................................................................................................................................ 21 2.1. Project background .............................................................................................................................................. 21 2.2. Terms of Reference and Purpose of the Technical Report .................................................................................. 21 2.3. Participants and their Areas of Responsibility ...................................................................................................... 22 2.4. Units, Currencies and Survey Coordinate System ............................................................................................... 22 2.5. Sources of Information ......................................................................................................................................... 24 2.6. Site Inspection ...................................................................................................................................................... 25 2.7. Independence....................................................................................................................................................... 25 3. Property Description .......................................................................................................................................................... 26 3.1. Location and Operations Overview ...................................................................................................................... 26 3.2. Mineral Rights Conditions .................................................................................................................................... 30 3.3. Mineral Title .......................................................................................................................................................... 30 3.4. Violation and Fines ............................................................................................................................................... 31 3.5. Royalties .............................................................................................................................................................. 31 3.6. Legal Proceedings and Significant Encumbrances to Property ............................................................................ 31 4. Accessibility, Climate, Local Resources, Infrastructure and Physiography ........................................................................ 33 4.1. Topography, Elevation and Vegetation ................................................................................................................ 33 4.2. Access, Towns and Regional Infrastructure ......................................................................................................... 33 4.3. Climate ................................................................................................................................................................. 33 4.4. Infrastructure and Bulk Service Supplies .............................................................................................................. 34 4.5. Personnel Sources ............................................................................................................................................... 34 5. History................................................................................................................................................................................ 35 5.1. Ownership ............................................................................................................................................................ 35 5.1.1. Crown Complex .................................................................................................................................... 35 5.1.2. City Deep Complex ............................................................................................................................... 35 5.1.3. Knights Complex .................................................................................................................................. 35 5.1.4. Ergo Complex ....................................................................................................................................... 35 5.1.5. Marievale Complex ............................................................................................................................... 35 5.1.6. 6L14TSF ............................................................................................................................................... 35 5.2. Construction of the TSFs ...................................................................................................................................... 36 5.3. Previous Exploration and Mine Development ....................................................................................................... 36 5.3.1. Previous Evaluation Drilling .................................................................................................................. 36 5.3.2. Previous Development ......................................................................................................................... 36 6. Geological Setting, mineralization and deposit .................................................................................................................. 38 6.1. Regional Geology ................................................................................................................................................. 38 6.2. Mineralization, Local and Property Geology ......................................................................................................... 38 6.3. Stratigraphy and Cross-sections .......................................................................................................................... 39 ERGO’S TECHNICAL REPORT SUMMARY OF THE MATERIAL TAILINGS STORAGE FACILITIES PAGE 3 3 6.4. Deposit Type ........................................................................................................................................................ 41 7. Exploration ......................................................................................................................................................................... 42 7.1. Exploration ........................................................................................................................................................... 42 7.2. Topographic Surveys ........................................................................................................................................... 42 7.3. Evaluation Drilling ................................................................................................................................................. 42 7.4. Drilling Methodology ............................................................................................................................................. 42 7.4.1. Auger Drilling ........................................................................................................................................ 43 7.4.2. Reverse Circulation and Aircore ........................................................................................................... 44 7.5. Crown ................................................................................................................................................................... 45 7.6. City Deep ............................................................................................................................................................. 46 7.7. Knights ................................................................................................................................................................. 47 7.7.1. 4L14 ..................................................................................................................................................... 47 7.7.2. 4L39 ..................................................................................................................................................... 47 7.8. Ergo ...................................................................................................................................................................... 49 7.8.1. 7L15 ..................................................................................................................................................... 49 7.8.2. Rooikraal .............................................................................................................................................. 50 7.9. Marievale .............................................................................................................................................................. 51 7.10. 6L14 ..................................................................................................................................................................... 52 7.11. Logging and Sampling .......................................................................................................................................... 52 7.11.1. Logging ................................................................................................................................................. 53 7.11.2. Sampling .............................................................................................................................................. 53 7.12. Sample Recovery ................................................................................................................................................. 53 7.13. On-site Security Measures ................................................................................................................................... 53 7.14. Collar Survey Data ............................................................................................................................................... 53 7.15. Density Determination .......................................................................................................................................... 54 7.16. Hydrogeological Drilling and Test Work ............................................................................................................... 56 7.17. Geotechnical Data, Testing and Analysis ............................................................................................................. 56 8. Sample Preparation, Analyses and Security ...................................................................................................................... 57 8.1. Sampling Governance and Quality Assurance ..................................................................................................... 57 8.2. Sample Preparation and Analysis ........................................................................................................................ 57 8.2.1. On-site Sample Preparation ................................................................................................................. 57 8.2.2. Laboratories, Sample Preparation and Analyses .................................................................................. 58 8.2.3. QP Opinion ........................................................................................................................................... 59 8.3. Analytical Quality Control ..................................................................................................................................... 59 8.3.1. Nature and Extent of the Quality Control Procedures ........................................................................... 59 8.3.2. Quality Control Results ......................................................................................................................... 60 8.3.3. QP Opinion ........................................................................................................................................... 60 8.4. Sample Storage and Security ............................................................................................................................... 60 8.5. Data Storage and Data Management ................................................................................................................... 60 9. Data verification ................................................................................................................................................................. 62 10. Mineral Processing and Metallurgical Testing.................................................................................................................... 63 10.1. Nature and Extent of the Metallurgical Testing Method ........................................................................................ 63 10.2. Procedure ............................................................................................................................................................. 63 10.3. Representative of the Samples ............................................................................................................................ 63 10.4. Details of the Laboratories ................................................................................................................................... 63 10.5. Results ................................................................................................................................................................. 64 10.6. Interpretation of the Results ................................................................................................................................. 65 10.7. QP Opinion ........................................................................................................................................................... 65 11. Mineral Resource Estimates .............................................................................................................................................. 66 11.1. Volume Modelling ................................................................................................................................................. 67 11.2. Bulk Dry Density ................................................................................................................................................... 67 11.3. Exploratory Data Analysis .................................................................................................................................... 67 11.4. Estimation Techniques ......................................................................................................................................... 68 11.5. Modelling and Estimation Parameters .................................................................................................................. 68 11.6. Model Validation ................................................................................................................................................... 69 ERGO’S TECHNICAL REPORT SUMMARY OF THE MATERIAL TAILINGS STORAGE FACILITIES PAGE 4 4 11.7. Technical and Financial Parameters .................................................................................................................... 69 11.8. Assessment of the Reasonable Prospects for Economic Extraction .................................................................... 70 11.9. Uncertainties and Classification Criteria ............................................................................................................... 70 11.10. Crown Complex .................................................................................................................................................... 71 11.10.1. Exploratory Data Analysis .................................................................................................................... 71 11.10.2. Modelling and Estimation Parameters .................................................................................................. 77 11.10.3. Technical and Economic Factors .......................................................................................................... 78 11.10.4. Mineral Resource Classification Criteria ............................................................................................... 78 11.10.5. Mineral Resource Statement ................................................................................................................ 78 11.10.6. Mineral Resource Changes .................................................................................................................. 79 11.10.7. Mineral Resource Risks and Uncertainty .............................................................................................. 79 11.11. City Deep Complex .............................................................................................................................................. 79 11.11.1. Exploratory Data Analysis .................................................................................................................... 79 11.11.2. Modelling and Estimation Parameters .................................................................................................. 83 11.11.3. Technical and Economic Factors .......................................................................................................... 83 11.11.4. Mineral Resource Classification Criteria ............................................................................................... 83 11.11.5. Mineral Resource Statement ................................................................................................................ 85 11.11.6. Mineral Resource Changes .................................................................................................................. 85 11.11.7. Mineral Resource Risks and Uncertainty .............................................................................................. 85 11.12. Knights Complex .................................................................................................................................................. 85 11.12.1. Exploratory Data Analysis .................................................................................................................... 85 11.12.2. Modelling and Estimation Parameters .................................................................................................. 92 11.12.3. Technical and Economic Factors .......................................................................................................... 92 11.12.4. Mineral Resource Classification Criteria ............................................................................................... 93 11.12.5. Mineral Resource Statement ................................................................................................................ 94 11.12.6. Mineral Resource Changes .................................................................................................................. 94 11.12.7. Mineral Resource Risks and Uncertainty .............................................................................................. 94 11.13. Ergo Complex....................................................................................................................................................... 94 11.13.1. Exploratory Data Analysis .................................................................................................................... 95 11.13.2. Modelling and Estimation Parameters .................................................................................................. 99 11.13.3. Technical and Economic Factors ........................................................................................................ 100 11.13.4. Mineral Resource Classification Criteria ............................................................................................. 100 11.13.5. Mineral Resource Statement .............................................................................................................. 101 11.13.6. Mineral Resource Changes ................................................................................................................ 101 11.13.7. Mineral Resource Risks and Uncertainty ............................................................................................ 101 11.14. Marievale Complex ............................................................................................................................................. 101 11.14.1. Exploratory Data Analysis .................................................................................................................. 101 11.14.2. Modelling and Estimation Parameters ................................................................................................ 106 11.14.3. Technical and Economic Factors ........................................................................................................ 106 11.14.4. Mineral Resource Classification Criteria ............................................................................................. 106 11.14.5. Mineral Resource Statement .............................................................................................................. 108 11.14.6. Mineral Resource Changes ................................................................................................................ 108 11.14.7. Mineral Resource Risks and Uncertainty ............................................................................................ 108 11.15. 6L14 ................................................................................................................................................................... 109 11.15.1. Exploratory Data Analysis .................................................................................................................. 109 11.15.2. Modelling and Estimation Parameters ................................................................................................ 109 11.15.3. Technical and Economic Factors ........................................................................................................ 110 11.15.4. Mineral Resource Classification Criteria ............................................................................................. 110 11.15.5. Mineral Resource Statement .............................................................................................................. 111 11.15.6. Mineral Resource Changes ................................................................................................................ 111 11.15.7. Mineral Resource Risks and Uncertainty ............................................................................................ 111 11.16. Summary Mineral Resource Estimates .............................................................................................................. 112 11.17. QP’s Opinion ...................................................................................................................................................... 116 12. Mineral Reserve Estimates .............................................................................................................................................. 117 12.1. Grade Control and Reconciliation ....................................................................................................................... 117


ERGO’S TECHNICAL REPORT SUMMARY OF THE MATERIAL TAILINGS STORAGE FACILITIES PAGE 5 5 12.2. Cut-off Grade Estimation .................................................................................................................................... 118 12.3. Estimation and Modelling Techniques ................................................................................................................ 119 12.4. Mineral Reserve Classification Criteria ............................................................................................................... 119 12.5. Mineral Reserve Statement ................................................................................................................................ 120 12.6. QP Statement on the Mineral Reserve Estimation ............................................................................................. 120 13. Mining Methods ............................................................................................................................................................... 122 13.1. Mining Method .................................................................................................................................................... 122 13.2. Hydraulic Mining ................................................................................................................................................. 123 13.3. Conventional Load, Haul and Slurry ................................................................................................................... 126 13.4. Geotechnical and Geohydrology ........................................................................................................................ 129 13.5. Requirements for Stripping ................................................................................................................................. 130 13.6. Mining Equipment and Personnel Requirements ............................................................................................... 131 13.7. Mining Sections .................................................................................................................................................. 131 13.7.1. West Rand .......................................................................................................................................... 131 13.7.2. Central Rand – City Section ............................................................................................................... 131 13.7.3. Central Rand – Knights Section.......................................................................................................... 134 13.7.4. East Rand – Ergo Section .................................................................................................................. 134 13.8. Mine Design and Schedule ................................................................................................................................ 134 13.9. Material TSFs ..................................................................................................................................................... 138 13.9.1. Central Rand Section – City Section .................................................................................................. 138 13.9.2. City Deep - 4L3, 4L4 and 4L6 TSFs ................................................................................................... 138 13.9.3. Crown Complex .................................................................................................................................. 140 13.9.4. Central Rand Section – Knights Section ............................................................................................. 141 13.9.5. East Rand Section – Ergo Section ..................................................................................................... 141 13.9.6. Marievale Complex ............................................................................................................................. 142 14. Processing and Recovery Methods ................................................................................................................................. 143 14.1. Introduction ........................................................................................................................................................ 143 14.2. Plant Feed Grade and Metallurgical Test Work .................................................................................................. 143 14.3. Mineral Process and Equipment Characteristics ................................................................................................ 146 14.3.1. Reception ........................................................................................................................................... 146 14.3.2. De-sanding Section ............................................................................................................................ 146 14.3.3. Carbon in Leach (CIL) ........................................................................................................................ 146 14.3.4. Carbon Treatment .............................................................................................................................. 146 14.4. Plant Services .................................................................................................................................................... 147 14.4.1. Instrument Air ..................................................................................................................................... 147 14.4.2. Blower Air ........................................................................................................................................... 147 14.4.3. Process Water .................................................................................................................................... 147 14.4.4. Fresh Water ........................................................................................................................................ 147 14.5. Natural Gas ........................................................................................................................................................ 147 14.6. Assay Laboratory ............................................................................................................................................... 147 14.7. Personnel Requirements .................................................................................................................................... 147 14.8. Energy and Water Requirements ....................................................................................................................... 147 14.9. Process Materials Requirements........................................................................................................................ 147 15. Infrastructure .................................................................................................................................................................... 148 15.1. Roads ................................................................................................................................................................. 148 15.2. Site Offices and Workshops ............................................................................................................................... 148 15.3. Power ................................................................................................................................................................. 148 15.4. Pumps and Pipelines .......................................................................................................................................... 148 15.5. Water .................................................................................................................................................................. 149 15.6. Infrastructure ...................................................................................................................................................... 150 15.7. Tailings Disposal ................................................................................................................................................ 152 15.8. Conclusion ......................................................................................................................................................... 153 16. Market Studies ................................................................................................................................................................. 154 16.1. Markets .............................................................................................................................................................. 154 16.2. Gold Price .......................................................................................................................................................... 154 ERGO’S TECHNICAL REPORT SUMMARY OF THE MATERIAL TAILINGS STORAGE FACILITIES PAGE 6 6 16.3. Exchange Rate Trends ....................................................................................................................................... 155 16.4. Global Demand .................................................................................................................................................. 156 16.5. Global Supply ..................................................................................................................................................... 157 16.6. Concluding Comments ....................................................................................................................................... 158 17. Environmental studies, permitting, and plans, negotiations, or agreements with local individuals or groups ................... 159 17.1. Results of Environmental Studies....................................................................................................................... 159 17.2. Requirements for Tailings Disposal, Site Monitoring and Water Management ................................................... 159 17.3. Site Monitoring ................................................................................................................................................... 159 17.4. Vegetation Monitoring ........................................................................................................................................ 160 17.5. Vegetation Maintenance ..................................................................................................................................... 160 17.6. Water Management ............................................................................................................................................ 160 17.7. Water Monitoring ................................................................................................................................................ 160 17.8. Legal and Permitting .......................................................................................................................................... 161 17.9. Plan Negotiations, or Agreements with Local Individuals or Groups .................................................................. 161 17.10. Mine Closure Plans Remediation Plans, and Associated Costs ......................................................................... 162 17.11. QP Statement on the Environmental Studies, Permitting, Plans, Negotiations, with Local Individuals or Groups163 18. Capital and Operating Costs ............................................................................................................................................ 164 18.1. Capital Expenditure ............................................................................................................................................ 164 18.1.1. Ergo Section Capital Expenditure ....................................................................................................... 164 18.1.2. City Section Capital Expenditure ........................................................................................................ 165 18.1.3. Knights Section Capital Expenditure .................................................................................................. 165 18.2. Tailing Storage Facility for Deposition - Capital Expenditure .............................................................................. 165 18.3. QP commentary ................................................................................................................................................. 166 18.4. Operating Costs ................................................................................................................................................. 166 19. Economic Analysis ........................................................................................................................................................... 168 19.1. Economic Analysis ............................................................................................................................................. 168 19.2. Sensitivity Analysis ............................................................................................................................................. 173 19.3. Risk Assessment ................................................................................................................................................ 173 19.3.1. Limited Tailings Storage Capacity ...................................................................................................... 173 19.3.2. Rising Electricity Prices and Eskom Supply Distribution ..................................................................... 174 19.3.3. Depletion of Mineral Reserves............................................................................................................ 175 19.3.4. Environmental, Social and Governance (ESG) related risks including climate change ...................... 175 19.3.5. Fluctuations in the Gold Price and Exchange Rate ............................................................................ 176 19.3.6. Potable water scarcity and access and cost to secondary water sources (contaminated water) ........ 176 19.3.7. Complexity of legal / regulatory requirements..................................................................................... 177 19.3.8. Operational efficiencies and plant performance.................................................................................. 177 19.3.9. Infrastructure dependency .................................................................................................................. 178 19.3.10. Rising costs ........................................................................................................................................ 178 19.3.11. Uncertainties regarding supply chain .................................................................................................. 178 19.3.12. Social license to operate .................................................................................................................... 178 19.3.13. Country risk ........................................................................................................................................ 179 20. Adjacent properties .......................................................................................................................................................... 179 21. Other relevant Data and Information ................................................................................................................................ 179 22. Interpretation and Conclusions ........................................................................................................................................ 180 23. Recommendations ........................................................................................................................................................... 180 24. References ...................................................................................................................................................................... 180 25. Reliance on Information Provided by the Registrant ........................................................................................................ 181 26. Qualified Persons Disclosure Consent ............................................................................................................................ 182 27. Date and Signatures ........................................................................................................................................................ 183 List of Figures Figure 1: Mineral Resource Reconciliation (Inclusive) ......................................................................................................... 17 Figure 2: Location of the Material TSFs and Infrastructure (the material properties of Ergo) .............................................. 28 ERGO’S TECHNICAL REPORT SUMMARY OF THE MATERIAL TAILINGS STORAGE FACILITIES PAGE 7 7 Figure 3: A map illustrating the areas covered by the Mining Rights and Common Law Ownership ................................... 29 Figure 4: A Typical Stratigraphy for Ergo’s TSFs ................................................................................................................ 39 Figure 5: A Map showing Location of Cross-section ........................................................................................................... 40 Figure 6: Cross-section of the TSF ...................................................................................................................................... 41 Figure 7: Crown Complex: Map showing Drill Hole Locations ............................................................................................. 45 Figure 8: City Deep Complex: Map showing Drill Hole Locations ........................................................................................ 46 Figure 9: Knights Complex - 4L14: Map showing Drill Hole Locations ................................................................................ 47 Figure 10: Knights Complex - 4L39: Map showing Drill Hole Locations ................................................................................ 48 Figure 11: Ergo Complex - 7L15: Map showing Drill Hole Locations ..................................................................................... 49 Figure 12: Ergo Complex - Rooikraal: Map showing Drill Hole Locations ............................................................................. 50 Figure 13: Marievale Complex: Map showing Drill Hole Locations ........................................................................................ 51 Figure 14: 6L14: Map showing Drill Hole Locations .............................................................................................................. 52 Figure 15: Coning and Quartering Method ............................................................................................................................ 57 Figure 16: 3L7 (Mooifontein): Distribution of Raw Gold Capped Data ................................................................................... 72 Figure 17: 3L7 (Mooifontein): Distribution of Capped Gold Data ........................................................................................... 72 Figure 18: Mooifontein: Variography ..................................................................................................................................... 73 Figure 19: GMTS: Distribution of Raw Gold Capped Data .................................................................................................... 74 Figure 20: GMTS: Distribution of Capped Gold Data ............................................................................................................ 74 Figure 21: Diepkloof: Distribution of Raw Gold Capped Data ................................................................................................ 75 Figure 22: 3L5 (Diepkloof): Distribution of Capped Gold Data............................................................................................... 76 Figure 23: Diepkloof: Distribution of Raw Gold Capped Data ................................................................................................ 77 Figure 24: 4L3: Distribution of Raw Gold Capped Data ......................................................................................................... 80 Figure 25: 4L3: Distribution of Composited Gold Data .......................................................................................................... 81 Figure 26: 4L4: Distribution of Raw Gold Capped Data ......................................................................................................... 81 Figure 27: 4L4: Distribution of Composited Gold Data .......................................................................................................... 82 Figure 28: 4L6: Distribution of Raw Gold Capped Data ......................................................................................................... 82 Figure 29: 4L6: Distribution of Composited Gold Data .......................................................................................................... 83 Figure 30: 4L14: Distribution of Slime Raw Data ................................................................................................................... 86 Figure 31: 4L14: Log Distribution of Slime Raw Data ............................................................................................................ 87 Figure 32: 4L14: Distribution of Slime 6m Composited Data ................................................................................................. 87 Figure 33: 4L14: Log Distribution of Slime 6m Composited Data .......................................................................................... 88 Figure 34: 4L14: Distribution of Soil Raw Data ...................................................................................................................... 88 Figure 35: 4L14: Log Distribution of Soil Raw Data ............................................................................................................... 89 Figure 36: 4L14: Distribution of Soil Raw Capped Data ........................................................................................................ 89 Figure 37: 4L14: Log Distribution of Soil Raw Capped Data ................................................................................................. 90 Figure 38: Histogram 4L39 TSF ............................................................................................................................................ 91 Figure 39: Log Histogram for 4L39 TSF ................................................................................................................................ 91 Figure 40: Log Probability for 4L39 TSF ................................................................................................................................ 92 Figure 41: Rooikraal: Distribution of Raw Gold Data ............................................................................................................. 95 Figure 42: Rooikraal: Log Distribution of Composited Gold Data .......................................................................................... 96 Figure 43: Box Plots of the Data (red line represents a gold mean per mean) ...................................................................... 97 Figure 44: 7L15 TSF Domains .............................................................................................................................................. 97 Figure 45: North Domain: Histogram and Probability Plots of the Raw Capped Data ........................................................... 98 Figure 46: South Domain: Histogram and Probability Plots of the Raw Capped Data ........................................................... 98 ERGO’S TECHNICAL REPORT SUMMARY OF THE MATERIAL TAILINGS STORAGE FACILITIES PAGE 8 8 Figure 47: South Domain: Histogram and Probability Plots of the Capped Data ................................................................... 99 Figure 48: 7L4: Distribution of Capped Raw Gold Data ....................................................................................................... 102 Figure 49: 7L4: Distribution of Composited Raw Gold Data ................................................................................................ 103 Figure 50: 7L5: Distribution of Raw Gold Data .................................................................................................................... 103 Figure 51: 7L5: Distribution of Composited Gold Data ........................................................................................................ 104 Figure 52: 7L6: Distribution of Raw Gold Data .................................................................................................................... 104 Figure 53: 7L6: Distribution of Composited Gold Data ........................................................................................................ 105 Figure 54: 7L7: Distribution of Raw Capped Gold Data ....................................................................................................... 105 Figure 55: 7L7: Distribution of Composited Capped Gold Data ........................................................................................... 106 Figure 56: 6L14: Distribution of Raw Capped Gold Data ..................................................................................................... 109 Figure 57: Mineral Resource Classification Map for the Material TSFs ............................................................................... 114 Figure 58: Mineral Resource Reconciliation (Inclusive) ....................................................................................................... 116 Figure 59: Mine design model showing top, isometric, and grade model of TSF (Deswik, 2025)........................................ 117 Figure 60: Crown Complex Footprint ................................................................................................................................... 123 Figure 61: Example of Hydraulic Mining .............................................................................................................................. 124 Figure 62: Hydraulic Mining Process Diagram .................................................................................................................... 125 Figure 63: Typical Mining Method for a TSF........................................................................................................................ 126 Figure 64: Example of Loading with a FEL .......................................................................................................................... 127 Figure 65: Example of Loading with a FEL into a Hopper ................................................................................................... 127 Figure 66: Example of Material on Conveyor ...................................................................................................................... 128 Figure 67: Slurry Point for Loading ...................................................................................................................................... 128 Figure 68: Example of Transportation Truck Prior to Loading Activities .............................................................................. 129 Figure 69: Hydraulic Mining with Monitor showing Distance and Angle .............................................................................. 130 Figure 70: Vegetation on top of 3L7 (Mooifontein) .............................................................................................................. 131 Figure 71: Ergo Operations Overview (Note: For overview purposes only) ......................................................................... 133 Figure 72: LoM Plan - Annual Tonnage ............................................................................................................................... 137 Figure 73: LoM Plan - Recovered Gold (kgs) ...................................................................................................................... 137 Figure 74: Deswik mine planning views of 4L3 .................................................................................................................... 139 Figure 75: Deswik mine planning views of 4L4 TSF ............................................................................................................ 139 Figure 76: Deswik mine planning views of 4L6 TSF ............................................................................................................ 140 Figure 77: Process Plant Flow Diagram .............................................................................................................................. 145 Figure 78: Above Ground Pipeline System.......................................................................................................................... 149 Figure 79: Mooifontein General Arrangement - Site Layout ................................................................................................ 151 Figure 80: Plan Layout - Lift 1 and 2 ................................................................................................................................... 153 Figure 81: Plan Layout - Lift 3 and 4 ................................................................................................................................... 153 Figure 82: Gold Price Historical Trendline ........................................................................................................................... 155 Figure 83: Exchange Rate Trendline ................................................................................................................................... 155 Figure 84: Global Gold Demand from 2010 to 2024 ............................................................................................................ 157 Figure 85: Global Gold Supply from 2010 to 2024 .............................................................................................................. 157 Figure 86: Sensitivity Analysis ............................................................................................................................................. 173 List of Tables Table 1: Ergo’s Mineral Resource Statement as at 30 June 2025 (Inclusive) .................................................................... 16 Table 2: Ergo’s Mineral Resource Statement as at 30 June 2025 (Exclusive) ................................................................... 16


ERGO’S TECHNICAL REPORT SUMMARY OF THE MATERIAL TAILINGS STORAGE FACILITIES PAGE 9 9 Table 3: Ergo’s Mineral Reserve Statement as at 30 June 2025 ....................................................................................... 17 Table 4: Mineral Reserve Reconciliation ............................................................................................................................ 18 Table 5: List of QPs and their Responsibilities ................................................................................................................... 22 Table 6: List of Abbreviations ............................................................................................................................................. 23 Table 7: Details of the Material TSFs ................................................................................................................................. 26 Table 8: Mining Right and the Material TSFs ..................................................................................................................... 27 Table 9: Mineral Rights Information as at 30 June 2025 .................................................................................................... 31 Table 10: Land Tenure Information ...................................................................................................................................... 31 Table 11: History and Status of the TSFs............................................................................................................................. 36 Table 12: Ergo Production History ....................................................................................................................................... 37 Table 13: Origin of the TSF Material .................................................................................................................................... 39 Table 14: Survey Details of the TSFs ................................................................................................................................... 43 Table 15: Bulk Density Information and Statistics ................................................................................................................ 55 Table 16: Laboratories Used ................................................................................................................................................ 58 Table 17: Summary of Predicted Ergo Processing Plant Performance ................................................................................ 64 Table 18: Financial and Technical Data considered for Mineral Resource .......................................................................... 69 Table 19: Mineral Resource Estimate Cut-off Grades .......................................................................................................... 70 Table 20: Mooifontein: Basic Statistics ................................................................................................................................. 73 Table 21: GMTS Basic Statistics .......................................................................................................................................... 75 Table 22: Diepkloof: Basic Statistics .................................................................................................................................... 76 Table 23: Search Parameters: OK and Inverse Distance Estimation Methods .................................................................... 77 Table 24: Confidence Levels for Key Criteria for Mineral Resource Classification ............................................................... 78 Table 25: Crown Complex Mineral Resource Estimate (Inclusive) ....................................................................................... 78 Table 26: Crown Complex Mineral Resource Estimate (Exclusive) ..................................................................................... 79 Table 27: Search Parameters: Inverse Distance Estimation Method ................................................................................... 83 Table 28: Confidence Levels of Key Criteria for Classification of the TSFs Mineral Resources ........................................... 84 Table 29: City Deep Complex Mineral Resource Estimates (Inclusive) ............................................................................... 85 Table 30: City Deep Complex Mineral Resource Estimates (Exclusive) .............................................................................. 85 Table 31: 4L14 and 4L39: Search Parameters: Inverse Distance Estimation Method ......................................................... 92 Table 32: Confidence Levels of Key Criteria for Classification of the 4L14 TSF Mineral Resources .................................... 93 Table 33: Confidence Levels of Key Criteria for Classification of the 4L39 TSF Mineral Resource ..................................... 93 Table 34: Knights Complex Mineral Resource Estimates (Inclusive) ................................................................................... 94 Table 35: Knights Complex Mineral Resource Estimates (Exclusive) .................................................................................. 94 Table 36: Rooikraal: Search Parameters: Inverse Distance Estimation Method .................................................................. 99 Table 37: 7L15: Search Parameters: Inverse Distance Estimation Method ......................................................................... 99 Table 38: Ergo: Confidence Levels for Key Criteria for Mineral Resource Classification ................................................... 100 Table 39: Ergo Mineral Resource Estimates (Inclusive) ..................................................................................................... 101 Table 40: Ergo Mineral Resource Estimates (Exclusive) ................................................................................................... 101 Table 41: Search Parameters: Inverse Distance Estimation Method ................................................................................. 106 Table 42: Confidence Levels for Key Criteria for Mineral Resource Classification ............................................................ 107 Table 43: Marievale Mineral Resource Estimates (Inclusive) ............................................................................................. 108 Table 44: Marievale Resource Estimates (Exclusive) ........................................................................................................ 108 Table 45: Summary of the Basic Statistics ......................................................................................................................... 109 Table 46: Search Parameters: Inverse Distance Estimation Method ................................................................................. 110 ERGO’S TECHNICAL REPORT SUMMARY OF THE MATERIAL TAILINGS STORAGE FACILITIES PAGE 10 10 Table 47: Confidence Levels for Key Criteria for Mineral Resource Classification ............................................................. 110 Table 48: 6L14 Mineral Resource Estimates (Inclusive) .................................................................................................... 111 Table 49: Inclusive Mineral Resource Estimates of the 15 Material Properties as at 30 June 2025 .................................. 112 Table 50: Exclusive Mineral Resource Estimates of the 15 Material Properties as at 30 June 2025 ................................. 113 Table 51: Ergo Inclusive Mineral Resources Statement as at 30 June 2025 ..................................................................... 115 Table 52: Ergo Exclusive Mineral Resources Statement as at 30 June 2025 .................................................................... 115 Table 53: Total Mineral Resource Reconciliation (Inclusive) .............................................................................................. 116 Table 54: Reconciliation of RoM Head Grade (Au) ............................................................................................................ 118 Table 55: Reconciliation of RoM Tonnage ......................................................................................................................... 118 Table 56: LoM Cut-off Grade and Mineral Reserve Grades ............................................................................................... 118 Table 57: Ergo TSF Mineral Reserves Statement as at 30 June 2025 .............................................................................. 120 Table 58: Mineral Reserve Reconciliation .......................................................................................................................... 120 Table 59: Historical Ergo Operational Results .................................................................................................................... 122 Table 60: Central Rand (City Section) ................................................................................................................................ 134 Table 61: Central Rand (Knights Section) .......................................................................................................................... 134 Table 62: East Rand Section (Ergo Section) ...................................................................................................................... 134 Table 63: Summary of Modifying Factors for the LoM Plan................................................................................................ 135 Table 64: Ergo’s Forecast of Production from July 2025 to June 2047 .............................................................................. 136 Table 65: Material TSFs ..................................................................................................................................................... 138 Table 66: Mine Schedule for 4L3, 4L4 and 4L6.................................................................................................................. 139 Table 67: Mine Schedule for 3L5 (Diepkloof) ..................................................................................................................... 140 Table 68: Mine Schedule for 3L7 (Mooifontein) .................................................................................................................. 140 Table 69: Mine Schedule for 3L8 (GMTS) .......................................................................................................................... 141 Table 70: Mine Schedules for 4L14 and 4L39 TSFs .......................................................................................................... 141 Table 71: Mine Schedules for Rooikraal TSF ..................................................................................................................... 141 Table 72: Mine Schedules for 6L14 .................................................................................................................................... 142 Table 73: Mine Schedules for 7L15 TSF ............................................................................................................................ 142 Table 74: Mine Schedules for the Marievale Complex ....................................................................................................... 142 Table 75: Ergo Process Recoveries ................................................................................................................................... 146 Table 76: Above Ground Gold Stocks in 2025 ................................................................................................................... 154 Table 77: Long Term Consensus Forecasts in Nominal Terms ......................................................................................... 156 Table 78: Global Gold Production ...................................................................................................................................... 157 Table 79: Ergo Water Consumption ................................................................................................................................... 160 Table 80: SLP Financial Provision Summary ..................................................................................................................... 162 Table 81: Ergo Rehabilitation Financial Provision Summary .............................................................................................. 162 Table 82: Capital Expenditure Summary ............................................................................................................................ 164 Table 83: Ergo Capital Expenditure Estimate..................................................................................................................... 165 Table 84: City Total Capital Expenditure Summary ............................................................................................................ 165 Table 85: Capital Expenditure Summary for 4L39 .............................................................................................................. 165 Table 86: Withok TSF Capital Expenditure ........................................................................................................................ 165 Table 87: Daggafontein TSF Capital Expenditure .............................................................................................................. 166 Table 88: Average LoM Operating Cost for Ergo ............................................................................................................... 167 Table 89: Economic Analysis ............................................................................................................................................. 171 Table 90: Qualified Person’s Details .................................................................................................................................. 182 ERGO’S TECHNICAL REPORT SUMMARY OF THE MATERIAL TAILINGS STORAGE FACILITIES PAGE 11 11 1. EXECUTIVE SUMMARY 1.1. Introduction Ergo Mining Proprietary Limited (Ergo) is a wholly owned subsidiary of DRDGOLD Limited (DRDGOLD). DRDGOLD is domiciled in South Africa and listed on the Johannesburg Stock Exchange (JSE: DRD) and the New York Stock Exchange (NYSE: DRD). DRDGOLD, a South African based gold mining company, specializes in the retreatment of Tailings Storage Facilities (TSF’s) and owns 100% of Ergo. DRDGOLD is a Tailings Storage Facilities retreatment company. The TSFs’ Mineral Resource and Mineral Reserve estimates declared in this Technical Report Summary (this Report) are 100% attributable to DRDGOLD. The Mineral Resource and Mineral Reserve estimates contained in this Technical Report Summary were compiled and reported by the independent Qualified Persons (QPs) for DRDGOLD in accordance with Items 601(b)(96) and 1300 through 1305 of Regulation S-K (Title 17, Part 229, Items 601(b)(96) and 1300 through 1305 of the Code of Federal Regulations) promulgated by the Securities and Exchange Commission (SEC). This document is the third Technical Report Summary filed with the SEC due to the following material changes:  Removal of the Daggafontein TSF (214Mt at 0.24g/t Au) from the total Mineral Resource and Mineral Reserve estimates as Daggafontein TSF is now reclassified as a deposition facility and has no reasonable prospect for economic extraction; and  Conversion of three TSFs from Crown Complex to Mineral Reserves. The three TSFs have a total of 272Mt at 0.23g/t Au all converted into Mineral Reserves This Technical Report Summary is based on information available to the QPs until 30 June 2025. There were no material changes between the effective date (30 June 2025) and the reporting date (30 October 2025). 1.2. Property Description Ergo is reclaiming TSFs for gold in the City of Johannesburg and the City of Ekurhuleni, Gauteng, South Africa. The Crown and City Deep Complexes are in the City of Johannesburg, while all other TSFs are in the City of Ekurhuleni. The TSFs covered in the report are from the Crown, City Deep, Knights, Ergo and Marievale Complexes and one TSF from Springs. A complex is a cluster of TSFs. Ergo and DRDGOLD identified a total of 15 TSFs as material properties. 1.3. Mineral Rights and Ownership Ergo’s mineral titles associated with its Mineral Resources include ownership through common law, contractual arrangements and various Mining Rights issued in terms of the provisions of the Mineral and Petroleum Resources Development Act, 2002 (Act No. 28 of 2002) (MPRDA) as well as required Environmental Permitting. Ergo has applied to renew all of its Mining Rights; these applications are receiving attention from the Department of Mineral and Petroleum Resources (DMPR). The Department of Mineral Resources and Energy (DMRE) in South Africa is now referred to as the Department of Mineral and Petroleum Resources as of July 2024. Renewal applications have been submitted to the DMPR for each expired Right. Ergo has applied to extend the Mining Rights for up to 30 years, which is the maximum allowable renewal period as detailed in the MPRDA. ERGO’S TECHNICAL REPORT SUMMARY OF THE MATERIAL TAILINGS STORAGE FACILITIES PAGE 12 12 This report has considered section 24(5) of the MPRDA, as amended: “A mining right in respect of which an application for renewal has been lodged shall despite its expiry date remain in force until such time as such application has been granted or refused.” A prospecting right may be renewed for a period of up to three years, after which the right lapses and cannot be renewed further. 1.4. Development and Operations Ergo has TSFs at different mining stages as presented below:  Crown (3L5, 3L7 and 3L8): The TSFs are at an advanced exploration stage, with all TSFs classified as Indicated Mineral Resources and Probable Mineral Reserves;  City Deep (4L3, 4L4 and 4L6): The Complex is at a production stage with all TSFs declared as Measured Mineral Resources and Proven Mineral Reserves;  Knights (4L14 and 4L39): The Complex is at a production stage, with 4L14 TSF reported as Measured Mineral Resources and Proven Mineral Reserves, and 4L39 as Indicated Mineral Resources and Probable Mineral Reserves.  Ergo (Rooikraal and 7L15): The Complex is at a production stage with Measured Mineral Resources and Proven Mineral Reserves declared;  Marievale (7L4, 7L5, 7L6 and 7L7): The Complex is at a development stage with TSFs reported as Measured Mineral Resources and Proven Mineral Reserves; and  6L14: Measured Mineral Resource and Proven Mineral Reserve were declared. The TSF is at a development stage. 1.5. Geology and Mineralization The TSFs are man-made (human-made) features, comprising material that have been processed through metallurgical plants that generate residue (tailings), which are relatively uniform in comparison with the natural deposit from which the mineralized material is derived. The variation between grades is small as the process residue TSFs were constructed in layers. Grade variation primarily follows variations in the processing and, to a lesser extent, the primary deposits characteristic. The TSFs are the waste product of the mineral recovery process. They took the form of a liquid slurry made of fine mineral particles - created when mined ore was crushed, milled and processed. The tailings were pumped to TSFs which were constructed using the Upstream Deposition Methodology. Water contained within the slurry was removed via various drainage systems and then re-used in the process whilst the TSF was in operation. Once a TSF is decommissioned and declared dormant, water is still drained and recovered but evaporation and seepage are the main reasons for water loss. Rehabilitation of the side slopes and top surface of the TSF, by way of vegetation and irrigation, was previously only implemented once the TSF was declared dormant. 1.6. Evaluation Drilling and Sampling A qualified surveyor surveyed the evaluation drill hole positions. Holes were drilled into the TSF and samples taken at 1.5m intervals to determine grade distribution. The number of samples, correlated with surveying data, provided the height of the TSF and tonnage based on a bulk solid’s density of 1.42t/m3.


ERGO’S TECHNICAL REPORT SUMMARY OF THE MATERIAL TAILINGS STORAGE FACILITIES PAGE 13 13 The typical exploration programs (geophysics, trenching, mapping, and soil sampling) were not undertaken on the TSFs. Evaluation drilling programs were conducted on the TSFs. No typical exploration is required to locate TSFs, as their locations are known and established above natural ground level. Two drilling techniques were followed by specialized drilling contractors on the TSFs. The Reverse Circulation (RC) or aircore method was used where auger drilling techniques could not drill to the base of the TSFs, mainly due to the drill hole length and moisture content of the TSFs towards their bases. With auger drilling, the rotation of a helical screw causes the blade of the screw to lift the sample to the surface. This drilling method does not require heavy machinery to drill to the desired depth. The auger method can be used for shallow environmental drilling, geotechnical drilling, soil engineering and mineral deposits where the formation is soft and the hole does not collapse. This is done by pressing the spiral rods into the ground using a drilling head machine, which can drill up to a depth of approximately 55m. Samples were collected through the spiral at 1.5m intervals, and the spiral was cleaned with water and brushed after every run. The auger technique utilized casing to prevent contamination from the drill hole wall during drilling. The RC drilling technique was chosen in preference to auger drilling in certain locations because RC drilling could drill deeper than auger drilling. In addition, because of its higher power, RC can drill through wet or hard material and has better recovery percentages than auger drilling, which loses wet samples through its spiral. The RVN Group Proprietary Limited (RVN Group) monitored the drilling and sampling process. The methods were to an acceptable industry standard, and the results were considered by the QP to be appropriate for conducting Mineral Resource estimations. Logging was carried out as per the Ergo protocols and the QP considered it appropriate for the deposit under consideration. Drill holes were logged on-site by the RVN Group and Ergo geologists. Samples were taken for the entire length of the drill holes. Samples were classified, based on visual inspection, according to whether they were slimes or soil, moist or wet and on color. All drill hole data was provided to Ergo for storage in electronic and hardcopy formats as drill hole logs, sample logs and assay certificates. 1.7. Sample Preparation As the samples were moist to wet, all samples were split on-site using the coning and quartering method. One set was prepared for routine exploration analyses for use in Mineral Resource estimation and the other set for metallurgical process test work. All the samples were presented to the laboratory in a well-organized and sorted manner with easily understandable documentation, including fully completed Sample Submission Forms. The samples were sent to the following three laboratories for further preparation and assaying:  MAED Metallurgical Laboratories Proprietary Limited (MAED) is located at Ergo’s processing plant in Brakpan. The facility is not accredited, however, and is used by Ergo for its grade control and daily sampling. Although MAED is not owned by Ergo, it is situated in the Ergo processing plant and was supplied with all routine exploration samples;  SGS South Africa Proprietary Limited (SGS) is located in Randfontein. SGS is an accredited facility (SANAS accreditation no. T0265) by the South African National Accreditation System (SANAS) for the selected analytical method. Randomly selected check samples (approximately 10% of total samples per TSF) from MAED were sent to SGS for confirmation. SGS is independent of Ergo; and ERGO’S TECHNICAL REPORT SUMMARY OF THE MATERIAL TAILINGS STORAGE FACILITIES PAGE 14 14  AngloGold Ashanti Limited Chemical Laboratory (Anglo Lab), located in Carletonville, analyzed some check samples for 7L15 TSF in 2016/2017 as a secondary laboratory to MAED. The laboratory no longer exists and was not SANAS accredited. The laboratory was independent of Ergo. The slime material has been previously processed and sample preparation only requires weighing, drying, screening, splitting, and milling before assaying. Screening (<2mm) removes potentially carbonaceous and other oversized materials to represent the material to be processed through the metallurgical plant. 1.8. Assays The laboratories weighed the samples on receipt before dry screening to remove foreign material. The samples were then dried at 105˚C, crushed (80% passing 2mm), before being riffle split and pulverized to 75µm. The samples were then analyzed to determine the gold content by fire assay with gravimetric finish by MAED and Atomic Absorption Spectroscopy (AAS) finish by SGS. The lower detection limit for these methods is 0.01g/t, with no upper detection limit for the gravimetric method and a 10g/t upper limit for AAS. The lower limit is relevant to the current project as the TSFs consist of processed materials and are generally low-grade, with grades slightly higher than 10 to 30 times the detection limit. The laboratories were instructed to use a 100g aliquot to analyze for gold. Through the experience of the QPs, it is known that analyzing gold in low-grade slimes, anything less than a 100g aliquot may report inaccurate results. 1.9. Quality Assurance and Quality Control The laboratories used in analyzing the samples have robust internal quality control checks. They routinely insert reference material (standards and blanks) and create duplicates to internally check the accuracy and precision of their assaying techniques. A batch is re-assayed if the quality control samples do not perform as expected. The results of the quality control checks were provided with the sample assays and were all found to be acceptable by the QP. The RVN Group or Ergo geologist inserted certified quality control samples as an additional check for contamination, precision and accuracy. The RVN Group quality control samples' results were satisfactory as they generally reported values within the expected ranges. 1.10. Metallurgical Sampling and Testing The TSFs were portioned into logical sections for metallurgical testing based either on area, shape or elevation. The selected intervals for compositing into the metallurgical test work samples were taken at different elevations within the TSF to provide sufficient material for the test work. The “as received” material was blended and divided into 2kg portions using the coning and quartering splitting method. A portion is set aside for gold assaying. Leaching of “as received” material was done using the following parameters, which simulates the existing Ergo leach plant:  pH = or > 10.5;  Precondition with lime for one hour or more to maintain pH at a minimum 10.5;  Carbon-in-Leach (CIL) with 20g/l carbon;  NaCN addition 0.35kg/t to 0.5kg/t;  Oxygen is added in form of hydrogen peroxide/bubbled air. It is assumed that because the leach bottles are unsealed, the solution will be aerated adequately;  Leach time seven hours; ERGO’S TECHNICAL REPORT SUMMARY OF THE MATERIAL TAILINGS STORAGE FACILITIES PAGE 15 15  All samples (washed solids, carbon, solution) are submitted to MAED for gold analysis; and  Titrations are done to determine the free cyanide and lime in the solution after the seven-hour leach. This is to determine the lime and cyanide consumptions. The metallurgical test work confirms that the material tested can be processed via the current Ergo metallurgical plant process to recover residual gold from the TSFs assessed. Predicted recoveries from the TSFs tested vary between 30% and 60% and are dependent on head grade and the nature of the material. These values are typical for gold TSF processing. 1.11. Mineral Resource Estimates The Mineral Resource Estimates for the TSFs were adjusted for depletion as at 30 June 2025. The Mineral Resource estimate for all the TSFs is declared as follows:  The TSFs themselves are the reference points;  No geological or other losses were applied as all material is accessible and there are no geological structures.  The Mineral Resource Estimates are stated as both inclusive and exclusive of Mineral Reserves as defined in Subpart 1300 of Regulation S-K;  Mineral Resource is 100% attributable to DRDGOLD; and  Mineral Resources are not Mineral Reserves as they have not demonstrated economic viability. The 30 June 2025 Mineral Resources Estimates are based on the 30 June 2024 Mineral Resources, with 19.25Mt at 0.33g/t depleted through mining operations conducted between 1 July 2024 and 30 June 2025. Material changes to Mineral Resources are:  Removal of the Daggafontein TSF (192Mt at 0.24g/t Au Indicated and 21Mt at 0.24g/t Inferred) from the Mineral Resource Statement as the TSF has been designated as a deposition facility to support the Life of the Mine plan and the QP concluded that the TSF has no reasonable prospect of economic extraction;  The QP removed the three TSFs from Grootvlei Complex (107.66Mt at 0.26g/t), following the lapse of the prospecting rights and as common law ownership could not be secured;  The inclusion of an additional TSF has been made. A new TSF, 4L39, containing 7.5Mt at 0.28 g/t Au Indicated, was added to the Mineral Resource Statement; this TSF was previously owned by a third party but is now owned by Ergo; and  Additionally, a negative survey adjustment of 7.75Mt at 0.15g/t was applied, mainly due to recent survey work on the Fleurhof dumps. A total of 12 smaller TSFs/cleanup areas, containing 2.29 Mt at 0.44 g/t Au, were excluded from the Mineral Resource Statement because the QP conducted a study and determined they have no reasonable prospects for economic extraction. This change is not considered significant as it only affected smaller TSFs/cleanup sites. The depletion applied at Ergo is a straight tonnage subtraction, and the survey adjustment is a straight tonnage addition or subtraction; thus, no individual block grade changes are considered, except in TSFs where additional drilling was completed. The QP deemed this technique suitable for the deposits under consideration. ERGO’S TECHNICAL REPORT SUMMARY OF THE MATERIAL TAILINGS STORAGE FACILITIES PAGE 16 16 Mineral Resource Estimates are presented in Table 1 and Table 2. Table 1: Ergo’s Mineral Resource Statement as at 30 June 2025 (Inclusive) Mineral Resource Classification Mineral Resource as at 30 June 2024 Mineral Resource as at 30 June 2025 Tonnes (Mt) Au (g/t) Contents (Moz) Tonnes (Mt) Au (g/t) Contents (Moz) Measured Mineral Resource 236.10 0.29 2.22 150.54 0.30 1.46 Indicated Mineral Resource 561.95 0.25 4.46 325.26 0.25 2.64 Sub-total Measured and Indicated Mineral Resource 798.04 0.26 6.68 475.80 0.27 4.10 Inferred Mineral Resource 21.32 0.24 0.16 - - - Total Mineral Resources 819.36 0.26 6.85 475.80 0.27 4.10 Notes: 1. Tonnes and grades were rounded and this may result in minor discrepancies; 2. Mineral Resources are reported inclusive of Mineral Reserves; 3. Mineral Resources have been reported in accordance with the classification criteria of Subpart 1300 of Regulation S-K; and 4. Mineral Resources were estimated using the $2,982/oz, ZAR17.63:1USD and ZAR1,689,997/kg financial parameters and recoveries are in Table 17. Table 2: Ergo’s Mineral Resource Statement as at 30 June 2025 (Exclusive) Mineral Resource Classification Mineral Resource as at 30 June 2024 Mineral Resource as at 30 June 2025 Tonnes (Mt) Au (g/t) Contents (Moz) Tonnes (Mt) Au (g/t) Contents (Moz) Measured Mineral Resource 66.04 0.26 0.55 - - - Indicated Mineral Resource 365.78 0.24 2.87 42.43 0.30 0.41 Sub-total Measured and Indicated Mineral Resource 431.81 0.25 3.42 42.43 0.30 0.41 Inferred Mineral Resource 21.32 0.24 0.16 - - - Total Mineral Resources 453.13 0.25 3.59 42.43 0.30 0.41 Notes: 1. Tonnes and grades were rounded and this may result in minor discrepancies; 2. Mineral Resources are reported exclusive of Mineral Reserves; 3. Mineral Resources have been reported in accordance with the classification criteria of Subpart 1300 of Regulation S-K; and 4. Mineral Resources were estimated using the $2,982/oz, ZAR17.63:1USD and ZAR1,689,997/kg financial parameters and recoveries are in Table 17. Figure 1 illustrates the waterfall diagram for the Mineral Resource estimates, depicting the changes between the Mineral Resource declared in June 2024 and that declared on 30 June 2025. Removal of Daggafontein and Grootvlei TSFs accounted for a substantial portion of the previously declared Mineral Resource, so their exclusion led to a significant reduction in the overall Mineral Resource estimate.


ERGO’S TECHNICAL REPORT SUMMARY OF THE MATERIAL TAILINGS STORAGE FACILITIES PAGE 17 17 Figure 1: Mineral Resource Reconciliation (Inclusive) A note is given to explain that depletion of Mineral Resources does not always equal depletion of Mineral Reserves. This is because depletion includes mining of Mineral Resources that were not part of the Life of Mine (LoM) plan—that is, Mineral Resources not converted into Mineral Reserves. In such cases, Mineral Resource depletion will exceed Mineral Reserve depletion. The difference between the two is considered immaterial and consistent with industry practice. 1.12. Mineral Reserve Estimates The total Mineral Reserve estimate for Ergo is presented in Table 3. The 30 June 2025 Mineral Reserve statement is based on mining depletion and survey adjustments from 1 July 2024 to 30 June 2025. The QP has reviewed all the inputs used in the 30 June 2025 Mineral Reserve estimation and the QP considers all inputs technically robust. A cut-off grade of 0.20g/t has been determined for the Ergo 22-year Life-of-Mine (LoM) plan which is below the average Mineral Reserve grade of 0.26g/t. The QP confirms that all the grades of TSF in the Mineral Reserve are above their respective cut-off grade. Table 3: Ergo’s Mineral Reserve Statement as at 30 June 2025 Mineral Resource Classification Mineral Reserve as at 30 June 2024 Mineral Reserve as at 30 June 2025 Tonnes (Mt) Au (g/t) Contents (Moz) Tonnes (Mt) Au (g/t) Contents (Moz) Proven Mineral Reserve 170.06 0.31 1.67 150.54 0.30 1.46 Probable Mineral Reserve 196.17 0.25 1.60 282.83 0.24 2.22 Total Mineral Reserves 366.23 0.28 3.27 433.37 0.26 3.69 Notes: 1. Tonnes and grades were rounded and this may result in minor discrepancies; 2. Mineral Reserve has been reported in accordance with the classification criteria defined in the 2016 edition of the SAMREC Code, and Regulation S-K 1300 3. Mineral Reserves were estimated using the $2,982/oz, ZAR17.63:1USD and ZAR1,689,997/kg financial parameters for reporting 4. No mining losses or dilution has been applied in the conversion process, nor has a mine call factor been applied 5. Tonnes and grade Run of Mine (RoM) as delivered to the plant 6. Attributable Mineral Reserve is 100% of the total Mineral Reserve. Table 4 depicts the Mineral Reserve reconciliation between 30 June 2024 and 30 June 2025. Some 18.22Mt was depleted through mining operations; 0.23Mt was added due to survey adjustments; 192.79Mt was removed from the Mineral Reserve by removing the Daggafontein TSF; a further 1.53 Mt was removed as seven TSFs were moved from the Mineral 4.10 -0.20 -2.580.07 -0.04 6.85 0 1 2 3 4 5 6 7 8 M ine ra l R e so u rc e s a s a t 30 Ju ne 2024 (In c lu sive ) D e p le tio ns A d d itio n o f the TSF - 4L39 Re m o va l o f the TSFs - D a g g a fo n te in , G ro o tvle i a n d Sm a lle r TSFs Su rve y A d ju stm e n t M ine ra l R e so u rc e s a s a t 30 Ju ne 2025 (In c lu sive ) A u c o nt e nt ( M o z) ERGO’S TECHNICAL REPORT SUMMARY OF THE MATERIAL TAILINGS STORAGE FACILITIES PAGE 18 18 Reserve and moved to the Not In Reserve “NIR” category; finally 271.96Mt at 0.23g/t Au from the Crown Complex and 7.50Mt at 0.28g/t Au from the 4L39 TSF was added to the Mineral Reserve Category. Table 4: Mineral Reserve Reconciliation Source Tonnes (Mt) Au (g/t) Contents (Moz) Mineral Reserve as at 30 June 2024 366.227 0.277 3.267 Depletion through Mining (18.22) 0.33 (0.19) Survey Adjustments (addition) 0.23 1.28 0.01 Removed from Reserves (192.79) 0.24 (1.49) Removed from Reserve to NIR (1.53) 0.47 (0.02) Add to Reserves 279.46 0.24 2.12 Mineral Reserve as at 30 June 2025 433.37 0.27 3.69 The various modifying factors, i.e., mining, metallurgical, processing, infrastructure, economic, marketing, legal, environmental, social, and governmental factors, are discussed in this report. The 30 June 2025 LoM plan was developed for the Ergo operations and is based on the Mineral Resource Estimate as at 30 June 2025 together with a set of modifying factors based on recent historical results and economic inputs provided by Ergo. The assumptions applied in determining the modifying factors and economic inputs are reasonable and appropriate. The LoM plan is sufficiently detailed to ensure achievability and is based on historical achievements. All the inputs used in the estimation of the Mineral Reserve have been thoroughly reviewed and can be considered technically robust. The current mining methods applied by Ergo are suitable for all TSFs. No selective mining will occur with the entire TSFs being processed. The Ergo processing plant targets a Run-of-Mine (RoM) throughput of approximately 19.2 Mtpa to 21.6Mtpa. The City Deep plant has been reconfigured to operate as a milling and pump station and feed the Ergo processing plant via a 50km pipeline. The City Deep plant processes material from mining areas of the Central Rand areas of Johannesburg. Mining areas of Germiston, and some areas of Boksburg are treated via the Knights plant, with mining operations scheduled to close in FY2029. An average processing plant recovery of 41.4% has been estimated over the 22-year LoM. The recoveries are based on metallurgical test work for the various TSFs, slimes and silted wetland areas that are scheduled to be mined over the LoM plan. The QP is of the opinion that all significant infrastructure and logistical requirements have been considered and costed. It is notable that Ergo has been operating for more than 20 years and has a very good understanding of infrastructural and logistical requirements. A gold price of ZAR1,689,997/kg is used to support the 30 June 2025 Mineral Resource and Mineral Reserve statements. A gold price of USD2,982/oz and an exchange rate of ZAR17.63:1USD was used in the estimation process. The gold price and exchange rates were considered reasonable by the QPs to support the Mineral Resource and Mineral Reserve estimates as at 30 June 2025. ERGO’S TECHNICAL REPORT SUMMARY OF THE MATERIAL TAILINGS STORAGE FACILITIES PAGE 19 19 Mining Rights, Environmental Approvals and Prospecting Rights held are listed under Ergo. Ergo has numerous Surface and Prospecting Rights and the ownership of the surface rights and mine TSFs vests in various legal entities. Ergo’s Environmental Management Plan (EMP) encompasses all the activities of its operations and assesses the environmental impacts of mining at reclamation sites, processing plants, TSFs and sand dumps. It also outlines the closure process, including financial provisions. A closure cost of ZAR683.9million has been estimated for the Ergo operations. The QP is satisfied that funding for rehabilitation and mine closure is adequate. The QP is satisfied that all material issues relating to Environmental, Social and Governance have been addressed in this document. 1.13. Capital and Operating Cost Estimates A total capital of ZAR5.96 billion is scheduled to support the 22-LoM plan. The breakdown of capital expenditure indicates that the majority of the capital, ZAR5.07 billion, is allocated to the Ergo operation over the duration of the LoM plan which includes the recommissioning of the Withok TSF. An additional ZAR805.4 million is allocated for the City Deep Complex and a capital expenditure of ZAR78.1 million is scheduled for the Knight section. The level of accuracy for the capital expenditure is at least to a preliminary feasibility study (PFS) level of accuracy, (i.e., +/-25%) with a maximum level of contingency of 15%. The planned average operating cost for the Ergo budget over the 22-year operations is estimated at a PFS level of accuracy (i.e., +/-25%) and a total working cost of ZAR139/t. The 30 June 2025 22-year LoM plan, which is the basis of the Mineral Reserve estimate, is scheduled to mine a total of 440.03Mt at 0.27g/t and produce 48,401kg of gold over the same period. The LoM includes 6.66Mt (0.38g/t) of non-mineral reserve mineralized material, resulting in the LoM plan supporting a Mineral Reserve of 434.37Mt at a RoM grade of 0.26g/t. The economic analysis is based on a LoM plan that is designed to a PFS level of accuracy (i.e., +/-25%). The economic analysis conducted by the QP indicates a net present value (NPV) of ZAR5.19 billion after capital expenditure and taxation utilizing a real discount rate of 8.91%. As the Ergo operations are an on-going operation with an annual positive cashflow, the internal rate of return (IRR) and payback period are not applicable. The sensitivity analysis of the Ergo LoM model assesses variations in revenue (based on gold price and grade), operating cost and capital expenditure by applying 5% increments above and below the base case. The analysis indicates that the Ergo operations are very sensitive to revenue parameters such as gold price, exchange rate, grade and recovery. In addition, the LoM is also very sensitive to changes in operating costs. The sensitivity analysis indicates that the LoM is not overly sensitive to capital and therefore, capital expenditure should be considered if the expenditure will reduce operating costs or increase revenue. The sensitivity analysis indicates that the achievement of the LoM Plan in terms of tonnage is critical in realizing the planned operating costs and being able to mine the individual TSFs at or above the planned cut-off grade. 1.14. Permitting Requirements Ergo is one of only a few surface operators that holds Mining Rights under the MPRDA over a large portion of its mineral reserves. The provisions of the MPRDA, and the definition of ‘mineral’ had inadvertently created a regulatory exclusion in the Act placing the ‘minerals’ in certain TSFs beyond the regulatory scope of the MPRDA and limiting its competency to issue rights upon application. However, in terms of the transitional arrangements of the MPRDA, which were peremptory upon the DMPR if the petitioner met the conditions for conversion from ‘old order’ to ‘new order’, Ergo was able to convert its old order rights, thus extending ERGO’S TECHNICAL REPORT SUMMARY OF THE MATERIAL TAILINGS STORAGE FACILITIES PAGE 20 20 its “license to mine” into the dispensation introduced by the MPRDA. Ergo has also submitted applications to renew all its Mining and Prospecting Rights with the DMPR. The current Mining and Prospecting Rights have expired but remain in force until such time that the renewal applications have been granted or refused by the DMPR. Water use licenses are applied for as and when required to remain compliant with relevant legislation. Ergo complies with all the conditions for renewal and has no reason to believe that the submitted renewals would not be granted. Ergo is in constant communication with the DMPR and has submitted the required information as per their requests to finalize these renewal applications. 1.15. Conclusion and Recommendations The QP of Mineral Resources concludes that the protocols for drilling, sampling preparation and analysis, verification, and security meet industry standard practices and are appropriate for the purposes of a Mineral Resource estimate. The studies have found that Ergo TSFs have reasonable prospects for economic extraction. The QP is satisfied with the Quality Assurance (QA) developed by The RVN Group and the Quality Control (QC) programs implemented, as there was no significant bias in reporting data. The QP contends that the assumptions, parameters, and methodology used for the Mineral Resource estimates are appropriate for the style of mineralization and deposit type. There is sufficient information to allow for decision-making in the future. The QPs recommend no additional work. The QP considers the conversion of Mineral Resources to Mineral Reserves to be appropriate. TSFs reported in this document have sufficient information to be used in the Mineral Reserve estimate and demonstrate economic viability. The modifying factors applied are considered appropriate as they contain sufficient detail to support at least a PFS level of accuracy (i.e., +/-25%), with a maximum level of contingency of 15%. The significant risks that could affect the Mineral Resource and Mineral Reserve are:  Limited Tailings Storage Capacity  Rising Electricity Prices and Eskom Supply Distribution;  Depletion of Profitable Mineral Reserves;  Climate Change Physical Risk;  Fluctuations in the Gold Price and Exchange Rate;  Potable water scarcity, access and cost to secondary water sources (contaminated water);  Complexity of legal/regulatory requirements;  Operational efficiencies and plant performance;  Infrastructure dependency;  Rising costs;  Uncertainties regarding supply chain;  Social license to operate; and  Country risk.


ERGO’S TECHNICAL REPORT SUMMARY OF THE MATERIAL TAILINGS STORAGE FACILITIES PAGE 21 21 2. INTRODUCTION 2.1. Project background Ergo is a subsidiary of DRDGOLD. DRDGOLD is domiciled in South Africa and listed on the Johannesburg Stock Exchange (JSE:DRD) and the New York Stock Exchange (NYSE: DRD). DRDGOLD, a South African-based gold mining company, has a 100% share in Ergo. TSFs’ Mineral Resource and Mineral Reserve estimates declared in this Technical Report Summary (this Report) are owned by Ergo and are 100% attributable to DRDGOLD. The TSFs covered in the report are from the Crown, City Deep, Knights, Ergo, Marievale and 6L14. As at 30 June 2025, Ergo identified a total of 15 TSFs to be material properties and have been described individually in this report. Grootvlei TSFs and Daggafontein TSFs identified as material in 2023 are no longer classified as material as they are no longer included in the Mineral Resource statement. As at 30 June 2025, Ergo has a total of 41 TSFs declared Mineral Resources, inclusive of 26 smaller TSFs and clean-up sites. In the FY2024, a review of all TSFs was carried out. Some sites were counted twice or split into North and South sections, resulting in a total of 98 TSFs in the FY2023 and this is corrected to a total of 41 TSFs excluding Grootvlei, Daggafontein and the 12 small TSFs. The QP of Mineral Resources removed 12 smaller TSFs and cleanup sites from the total Mineral Resources, as the QP determined that these TSFs have no reasonable prospects for economic extraction. The TSFs remained unclassified as they are no longer Mineral Resource. The Mineral Resource and Mineral Reserve estimates contained in this Technical Report Summary were compiled and reported by the QPs for DRDGOLD in accordance with Items 601(b)(96) and 1300 through 1305 of Regulation S-K (Title 17, Part 229, Items 601(b)(96) and 1300 through 1305 of the Code of Federal Regulations) promulgated by the Securities and Exchange Commission (SEC). The material TSFs are at different mining stages as presented below:  Crown (3L5, 3L7 and 3L8): The TSFs are at an advanced exploration stage, with all TSFs classified as Indicated Mineral Resources and Probable Mineral Reserves;  City Deep (4L3, 4L4 and 4L6): The Complex is at a production stage with all TSFs declared as Measured Mineral Resources and Proven Mineral Reserves;  Knights (4L14 and 4L39): The Complex is at a production stage, with 4L14 TSF reported as Measured Mineral Resources and Proven Mineral Reserves, and 4L39 as Indicated Mineral Resources and Probable Mineral Reserves.  Ergo (Rooikraal and 7L15): The Complex is at a production stage with Measured Mineral Resources and Proven Mineral Reserves declared;  Marievale (7L4, 7L5, 7L6 and 7L7): The Complex is at a development stage with TSFs reported as Measured Mineral Resources and Proven Mineral Reserves; and  6L14: Measured Mineral Resource and Proven Mineral Reserve were declared. The TSF is at a development stage. 2.2. Terms of Reference and Purpose of the Technical Report Ergo commissioned the QPs from The RVN Group to compile the FY2025 Technical Report Summary to report on their Mineral Resource and Mineral Reserve estimates. ERGO’S TECHNICAL REPORT SUMMARY OF THE MATERIAL TAILINGS STORAGE FACILITIES PAGE 22 22 This report details the results of the evaluation drilling, sampling, assaying, bulk density determination, surveying and metallurgical test work and the resultant Mineral Resource, modifying factors and Mineral Reserve estimations. This report is the third filed Technical Report Summary for DRDGOLD prepared under the SEC's Subpart 1300 of Regulation S-K disclosure requirements. This report is an updated version of the second Technical Report Summary entitled “Technical Report Summary of the material Tailings Storage Facilities”, with an effective date of 30 June 2023. The same QPs were retained. The effective date of the Mineral Resource and Mineral Reserve estimates for the TSFs is 30 June 2025. The QPs noted that there had been no material change to the information between the effective date and the signature date of the Report. Ergo is a South African gold producer, recovering gold from the retreatment of surface TSFs located in the Central and Eastern areas of the Gauteng Province. The RVN Group is a South African-based mining consulting firm that provides services and advice to the local and international mineral industries. Ergo has retained The RVN Group since 2016 to manage drilling activities, estimate Mineral Resources and Mineral Reserves and compile technical reports. The QPs from The RVN Group prepared this Technical Report Summary. 2.3. Participants and their Areas of Responsibility The following personnel were nominated to the project team, and their qualifications and specific areas of responsibility are summarized in Table 5. Table 5: List of QPs and their Responsibilities Personnel Company Qualifications Responsibility Mpfariseni Mudau, Pr.Sci.Nat. The RVN Group B.Sc. (Hons) Geology, Graduate Diploma in Mining Engineering, M.Sc. Mining Engineering, B.Sc. Applied Mathematics and Statistics, SACNASP Registration No.: 400305/12 Items 1 to 11 and 20 to 25 Steven Rupprecht, FSAIMM The RVN Group B.Sc. Mining Engineering, Ph.D. Mechanical Engineering SAIMM Registration No.: 701013 Items 1 and 12 to 19 The QP responsible for reporting and signing off on the exploration activities and Mineral Resource estimates is Mr Mpfariseni Mudau. Mr Mudau is a Professional Natural Scientist (with registration number 400305/12) registered with the South African Council for Natural Scientific Professions (SACNASP) with more than five years of experience relevant to the drilling, estimation and reporting of TSF Mineral Resources. Mr Mudau works for The RVN Group and is independent of Ergo and DRDGOLD. The QP with responsibility for reporting and signing off on the Mineral Reserve estimates is Professor Steven Rupprecht. Professor Rupprecht is an Honorary Fellow of the Southern African Institute of Mining and Metallurgy (SAIMM with registration number 701013) with more than five years of experience relevant to the estimation and reporting of TSF Mineral Reserves. Professor Rupprecht is an associate of The RVN Group and is independent of Ergo and DRDGOLD. 2.4. Units, Currencies and Survey Coordinate System Unless otherwise stated, all figures in this report are expressed in metric units. All geographic coordinates are UTM WGS84 system or LO29 Meridian. The elevation datum is the mean sea level. All monetary figures expressed in this Report are in South African Rand (ZAR) and United States Dollar (USD). ERGO’S TECHNICAL REPORT SUMMARY OF THE MATERIAL TAILINGS STORAGE FACILITIES PAGE 23 23 A point is used as the decimal marker, and the comma is used for the thousand’s separator (for numbers larger than 999). Unless otherwise stated, the word “tonnes” denotes a metric tonne (1,000kg). Table 6 presents the abbreviations used in the report. Table 6: List of Abbreviations Units Description % percentage ˚ degrees ˚C Degrees Centigrade ‘ minutes “ seconds µm Micron 3D three-dimensional AAS Atomic Absorption Spectroscopy AMD acid mine drainage AMIS African Mineral Standards amsl above mean sea level Anglo Lab AngloGold Ashanti Limited Chemical Laboratory Au gold BESS Battery energy storage system CIL Carbon-in-Leach cm centimeter(s) CoV Coefficient of Variation CRM Certified Reference Material Crown Mines Crown Mines Limited DMPR Department of Mineral and Petroleum Resources DMRE Department of Mineral Resources and Energy DRDGOLD DRDGOLD Limited EIA Environmental Impact Assessment EMP Environmental Management Plan EMPr Environmental Management Program Ergo Ergo Mining Proprietary Limited ERPM East Rand Proprietary Mines Limited Eskom Electricity Supply Commission FEL Front-End Loader FY Financial Year g gram(s) g/l grams per liter g/t grade grams per ton Geografix Geografix Surveys CC GPS Global Positioning System ha hectares = 100m-by-100m HDPE High-Density Polyethylene HRD Human Resource Development IDW Inverse Distance Weighting InSAR Interferometric Synthetic Aperture Radar IRR internal rate of return ISO International Organization for Standardization JSE Johannesburg Stock Exchange kg kilograms = 1,000 grams kg/t kilograms per ton km kilometer(s) = 1,000 meters km2 square kilometers ERGO’S TECHNICAL REPORT SUMMARY OF THE MATERIAL TAILINGS STORAGE FACILITIES PAGE 24 24 Units Description koz kilo ounces= 1,000 ounces (troy) kt kilotonnes ktpm kilotons per month LED Local Economic Development liter Metric unit of volume = 1,000cm3 LoM Life-of-Mine m meter(s) m2 square meters MAED MAED Metallurgical Laboratories Proprietary Limited mamsl meters above mean sea level mm millimeter(s) = meter/1000 Moz Million ounces (troy) MR Mining Right Mt Million metric tonnes Mtpa Million tonnes per annum MWP Mining Works Program NaCN sodium cyanide NERSA National Energy Regulator of South Africa NN Nearest Neighbor NNR National Nuclear Regulator NPV net present value NYSE New York Stock Exchange oz Troy ounces = 31.1034768 grams pH quantitative measure of the acidity or basicity of a solution ppm parts per million PR Prospecting Right PWP Prospecting Work Program QA Quality Assurance QC Quality Control QP Qualified Persons RC Reverse Circulation RoM Run-of-Mine SAIMM Southern Africa Institute of Mining and Metallurgy SANAS South African National Accreditation System SCADA supervisory control and data acquisition SEC Securities and Exchange Commission SGS SGS South Africa Proprietary Limited S-K 1300 Subpart 1300 of Regulation S-K under the U.S. Securities Exchange Act of 1934 SLP Social and Labor Plan t metric tonne = 1,000 kilograms t/m3 density - tonne per cubic meter TCTA Trans-Caledon Tunnel Authority The RVN Group The RVN Group Proprietary Limited this Report Technical Report Summary tonnes metric tonnes = 1,000 kilograms TPMS Tailings Performance Management System USD United States Dollars WGS84 World Geographic System 1984 WUL Water Use License ZAR South African Rand 2.5. Sources of Information Most of the technical information utilized for the preparation of this report was obtained from the drilling campaigns that The RVN Group supervised. Other technical information and engineering data were sourced from Ergo, their contractors


ERGO’S TECHNICAL REPORT SUMMARY OF THE MATERIAL TAILINGS STORAGE FACILITIES PAGE 25 25 and third-party reports available in the public domain. These sources are acknowledged in the body of the report, and some listed in Item 25. Information provided by the registrant upon which the QPs relied is listed in Item 26. The QPs also had discussions with the management and contractors of Ergo. In preparing the report, the QPs have relied upon contributions from a range of technical, financial, environmental and engineering specialists for the disciplines outside their expertise. Based on the support and advice from the specialists, the QPs consider it reasonable to rely upon the information/advice provided. 2.6. Site Inspection Mr. Mpfariseni Mudau visited the drilling projects on commencement, during, and completion of the drilling campaigns. These visits were conducted consecutively from FY2016 through FY2025. Mr. Mudau further visited the sample sorting and storage facilities at the Ergo processing plant in Brakpan. On several occasions, Mr. Mudau also visited MAED and SGS where the samples were prepared and analyzed. Mr. Mudau also visited the mining sites on several occasions. The objectives of the site visits were to:  familiarize the QP with the TSFs and the general infrastructure;  inspect the drilling and sampling sites;  conduct assessment of sampling methodologies, quality control processes and data validation;  provide training and conduct planned task observations;  validate the geological logging;  inspect the sample storage area and the sample preparation methods;  discuss and agree on the analytical method with the laboratories; and  collection of database and additional technical information. Professor Steven Rupprecht conducted site visits to the TSFs from FY2020 to FY2025. 2.7. Independence The QPs or The RVN Group received a fee for preparing this Technical Report Summary in accordance with standard professional consulting practice. The QPs or The RVN Group will receive no other benefit for the preparation of this report. Neither QPs, The RVN Group, nor any of its employees and associates employed in the preparation of this report has any pecuniary or beneficial interest in Ergo, DRDGOLD, or their associates. The QPs consider themselves independent. ERGO’S TECHNICAL REPORT SUMMARY OF THE MATERIAL TAILINGS STORAGE FACILITIES PAGE 26 26 3. PROPERTY DESCRIPTION 3.1. Location and Operations Overview Ergo is reclaiming TSFs in the City of Johannesburg and the City of Ekurhuleni, Gauteng, South Africa. The Crown and City Deep Complexes are located in the City of Johannesburg while all other TSFs dumps are located in the City of Ekurhuleni, as shown in Figure 2. This TRS covers a total of 15 material TSFs of varying sizes. The smaller TSFs or clean-up sites (26 in total) are not extensively covered in this report for various reasons: they are too small while others are not part of an immediate plan to be included in the LoM plan by Ergo. The total of the 15 material TSFs contributes over 98% of the tonnes in the LoM Plan tonnage, i.e. 98.04% of the Mineral Reserve tonnes are from material properties. Non-material properties contribute approximately 2% in the LoM Plan. Of the total Ergo Mineral Resource estimates declared, 89% contribution by tonnage is from the material properties. The material TSFs consists of only slimes, and no sand dump was considered material. The details of the 15 material TSFs are shown in Table 7. Engineering parameters and topography determined the size and shapes of the properties at the time of deposition of the waste products from the respective processing plants. Table 7: Details of the Material TSFs TSF Centre Coordinates Maximum Height (m) 3L5 (Diepkloof) 26013’34.95”S, 27057’09.70”E 67.50 3L7 (Mooifontein) 26°13'32.20"S, 27°58'17.29"E 88.50 3L8 (GMTS) 26014’23.75”S, 27058’07.91”E 94.50 4L3 26°13'51.72"S, 28° 5’50.63”E 40.50 4L4 26°13’59.91”S, 28° 6’9.99”E 16.50 4L6 26°13’59.56”S, 28° 7’15.02”E 19.50 4L14 26°12'23.76"S, 28° 8'54.38"E 37.50 4L39 26°12'34.70"S, 28°11'23.67"E 29.00 Rooikraal 26021’48.16” S, 28017’40.88”E 47.50 7L15 26°19'49.59"S, 28°24'46.01"E 37.50 7L4 26°19'30.94"S, 28°30'5.07"E 25.00 7L5 26°19'55.08"S, 28°30'3.08"E 22.50 7L6 26°19'56.20"S, 28°30'22.96"E 34.50 7L7 26°20'51.49"S, 28°30'5.43"E 13.50 6L14 26°12'51.98"S, 28°28'28.65"E 31.50 ERGO’S TECHNICAL REPORT SUMMARY OF THE MATERIAL TAILINGS STORAGE FACILITIES PAGE 27 27 The areas of the Mining Rights are presented in Figure 3. The total area covered by the Mining Rights and Common Law Ownership is 6,373 Ha. Table 8 and Table 9 present the Mining Rights and Common Law Ownership details. Table 8: Mining Right and the Material TSFs Mining Right Material TSF in the Mining Right GP184MR 3L5 (Diepkloof) 3L7 (Mooifontein) 3L8 (GMTS) GP185MR 4L3 4L4 4L6 GP187MR 4L14 GP158MR 7L15 6L14 Common Law Ownership Rooikraal 4L39 7L4 7L5 7L6 7L7 ERGO’S TECHNICAL REPORT SUMMARY OF THE MATERIAL TAILINGS STORAGE FACILITIES PAGE 28 28 Figure 2: Location of the Material TSFs and Infrastructure (the material properties of Ergo)


ERGO’S TECHNICAL REPORT SUMMARY OF THE MATERIAL TAILINGS STORAGE FACILITIES PAGE 29 29 Figure 3: A map illustrating the areas covered by the Mining Rights and Common Law Ownership ERGO’S TECHNICAL REPORT SUMMARY OF THE MATERIAL TAILINGS STORAGE FACILITIES PAGE 30 30 3.2. Mineral Rights Conditions TSFs, in most instances, are considered movable assets and capable of being owned under the common law separately from land. As such, they are distinguishable from underground minerals, which can no longer be individually owned in South African but in respect of which the Department of Mineral and Petroleum Resources (DMPR) may issue Mining Rights in terms of the MPRDA of 2002 (MPRDA), as amended. The construct of the MPRDA caused the minerals in certain TSFs to therefore fall outside the MPRDA. The transitional arrangements of the MPRDA provided for existing operations, however, to convert old order rights (Mining Licenses held under the previous dispensation) to new order rights. Ergo successfully converted its old order licenses to Mining Rights . In terms of reserves in TSFs over which are owned by common law and are not covered by a Mining Right, Environmental and Waste Management Approvals are obtained from the DMPR for the retreatment of such TSFs. For an exploration project, a Prospecting Right (PR), valid for five years, is issued, and for a mining operation, a Mining Right (MR) valid for up to 30 years, is issued. The PR, which is conducted in terms of a Prospecting Work Program (PWP), is renewable for a further three years. The MR is undertaken in terms of the Mining Works Program (MWP), Social and Labor Plan (SLP), and an approved Environmental Management Program (EMPr), which can be renewed for a further 30 years. A PR or MR may be cancelled or suspended subject to Section 47 of the MPRDA. The MPRDA makes provisions relating to the ownership and Broad-Based Socio-Economic Empowerment Charter. A shareholding, equity, interest or participation in the mining right or joint venture, or a controlling interest in a company/joint venture may not be encumbered, ceded, transferred, mortgaged, let, sublet, assigned, alienated, or otherwise disposed of without the written consent of the Minister, except in the case of a change of controlling interest in listed companies. The SLP is submitted to the DMPR every five years for approval, while the SLP’s annual progress report is submitted annually to the DMPR. The Environmental Management Plans (EMPs) and Water Use Licenses (WULs) are assessed for compliance annually. 3.3. Mineral Title Ergo’s title to its TSFs is vested in either common law ownership, Mining and Prospecting Rights and third-party agreements as presented in Table 10, including Environmental Approvals in respect of the same. Ergo has submitted applications for the renewal of its mining rights . The renewal applications were made to the DMPR on different dates per mining right. Ergo in the process of renewal has applied to extend the mining period for a further 30 years through its MWPs. The period of 30 years is the maximum period allowable for a Mining Right renewal as detailed in the MPRDA, as amended. This report has considered Section 24(5) of the MPRDA, as amended: “A mining right in respect of which an application for renewal has been lodged shall despite its expiry date remain in force until such time as such application has been granted or refused.” A prospecting right may be renewed for a period of up to three years, after which the right lapses and cannot be renewed further. ERGO’S TECHNICAL REPORT SUMMARY OF THE MATERIAL TAILINGS STORAGE FACILITIES PAGE 31 31 Freehold landowners are presented in Table 10. Ergo owns a significant portion of the freehold where the TSFs are located. Where Ergo does not own the property, use and access agreements are in place with third-party landowners. Access to the TSFs for evaluation drilling purposes is enabled through the provisions in the MPRDA. Table 9: Mineral Rights Information as at 30 June 2025 Complex Permit Holder Permit Type Reference Number with the DMPR Expiry Date Renewal Submission Application Date Renewal Reference Number with the DMPR Crown Ergo Mining Right GP184MR 20/06/2014 24/03/2014 GP 10022 MR City Deep Ergo Mining Right GP185MR 20/06/2014 24/03/2014 GP 10023 MR Knights (4L14) Ergo Mining Right GP187MR 20/06/2018 13/03/2018 GP 10067 MR Knights (4L39) Ergo Common Law Ownership Not applicable Not applicable Not applicable Not applicable Ergo (6L14) Ergo Mining Right GP158MR 27/10/2021 23/07/2021 GP 10097 MR Marievale (7L4) Ergo Common Law Ownership Not applicable Not applicable Not applicable Not applicable Marievale (7L5, 7L6 and 7L7) Ergo Common Law Ownership Not applicable Not applicable Not applicable Not applicable Table 10: Land Tenure Information Reclamation Sites Surface Rights Owner Crown Complex Ergo City Deep Complex Ergo and iPROP Knights Complex Ergo, Abland, Living Africa and EMM Ergo Complex Ergo and Ekurhuleni Metropolitan Municipality Marievale Complex Ergo, Ekurhuleni Metropolitan Municipality, Scarlet Sun and STI Consulting 6L14 Ekurhuleni Metropolitan Municipality Ergo's application for the renewal of its prospecting rights over Grootvlei dumps 6L16, 6L17 and 6L17A to the DMPR was granted in July 2022. During the 2023 financial year, an external party raised a conflicting claim of common law ownership of 6L16, 6L17 and 6L17A TSFs. The Grootvlei TSFs have been excluded from Mineral Reserves and Resources and the life of mine, as common law ownership could not be secured and the prospecting rights lapsed and could not be renewed further. 3.4. Violation and Fines Ergo has no fines resulting from violating their mineral rights conditions. 3.5. Royalties Ergo is not required to pay royalties to the State, nor does it receive royalties from any other operation. Royalties in South Africa are guided by the Mineral and Petroleum Resources Royalty Act, 2002 (Act No. 28 of 2008) (MPRRA). Ergo does not pay royalties, as the treatment of TSFs does not trigger the requirement to pay royalties. 3.6. Legal Proceedings and Significant Encumbrances to Property The QP was advised by Ergo that there are no material legal challenges concerning its Mineral Resource and Mineral Reserve. From the documentation reviewed and input by the relevant Technical Specialists, the QPs could not identify any significant factors or risks regarding title permitting, surface ownership, environmental and community factors that would prevent the evaluation or economic extraction of the TSFs. The QPs were assured that Ergo complies with all title and environmental ERGO’S TECHNICAL REPORT SUMMARY OF THE MATERIAL TAILINGS STORAGE FACILITIES PAGE 32 32 permitting requirements. The QPs were informed by Ergo that no significant factors or risks might affect access, title, or the right or ability to perform work on the TSFs.


ERGO’S TECHNICAL REPORT SUMMARY OF THE MATERIAL TAILINGS STORAGE FACILITIES PAGE 33 33 4. ACCESSIBILITY, CLIMATE, LOCAL RESOURCES, INFRASTRUCTURE AND PHYSIOGRAPHY 4.1. Topography, Elevation and Vegetation The project areas fall in the Grassland Biome of South Africa. The Grassland Biome is found on the high central plateau of South Africa and the inland areas of Kwazulu-Natal and the Eastern Cape. The topography is mainly flat and elevation ranges between 1,560mamsl and 1,700mamsl. Natural vegetation for the project is limited to areas outside the urban footprint. Within the urban environment where most of the TSFs are to be reclaimed, little vegetation occurs in its natural state. Some TSFs are situated in highly urbanized and industrialized areas with limited fauna and flora. The TSFs are man-made and the trees and grasses on the TSFs have been planted to prevent dust and erosion from the TSFs. 4.2. Access, Towns and Regional Infrastructure The TSFs are situated in the Gauteng Province of South Africa. Gauteng is the most industrialized province in South Africa and has adequate infrastructure. All the regional and on-site infrastructure that is required for mining is well established. There is a good supply chain for all necessary consumables and equipment in or near the mine sites. The areas surrounding the mine sites have good health facilities (i.e., public and private hospitals) and education facilities (i.e., ranging from pre-primary to secondary and tertiary education levels). A good road transportation system can be found in the area. The TSFs are well serviced by highways, paved regional roads and a network of dirt tracks that Ergo utilizes to access mining and project visits. The QPs consider access to the TSFs to be in good condition. For international supplies or travel, the OR Tambo and Lanseria International Airports, in Kempton Park and Lanseria, respectively, are well-positioned to service Ergo. Tele-communication on the TSFs is good for all major network providers. Most parts of the project areas are fully covered by the third or fourth-generation (3G or 4G) wireless mobile telecommunications technology. Other areas are now covered by high-end 5G technology. Item 15 presents the infrastructure in more detail. 4.3. Climate A summer rainfall climate prevails in the areas. Summer rain occurs mainly as thunderstorms with a mean annual precipitation of approximately 680mm, and evaporation is about 1,800mm per year. Winds are generally light and blow predominantly from the northwest. Winters are cold and dry. Extreme weather conditions occur in the form of frost (2 to 20 occurrences per annum) and the occasional hailstorm. The average annual temperature for the year is approximately 19˚C, with average maximum temperatures ranging between 22˚C and 32˚C and average minimum temperatures ranging between 2˚C and 18˚C. The hottest months are from December to February. During April and May, there is a noticeable drop in temperature, which signals the commencement of winter. The coldest months are June and July. The QP noted that rain and temperature have minimal effects on operations. ERGO’S TECHNICAL REPORT SUMMARY OF THE MATERIAL TAILINGS STORAGE FACILITIES PAGE 34 34 The area generally has a high evaporation rate in the summer months from November to January. This gives rise to high relative humidity. Evaporation is greater in summer than in winter due to higher ambient temperatures. There are no long-term associated climatic risks other than those associated with climate change and global warming, and the operating season is year-round with minor interruptions. 4.4. Infrastructure and Bulk Service Supplies The TSFs are situated in the well-developed province of Gauteng and have most major supplies. All the regional and on- site infrastructure that is required for mining and processing is well established. There is a good supply chain for all necessary consumables and equipment in or near the mine sites. Item 15 of this report details the infrastructure relevant to Ergo. The TSFs are located near hospitals offering basic and advanced medical care. The project areas are supplied with bulk electricity from the regional grid supplied by Eskom, the national power supplier, or by the local municipality. Like most parts of South Africa, the operations are affected by occasional load shedding implemented by Eskom during periods of constrained power generation. Ergo has a solar plant integrated with a battery energy storage system, discussed in detail in Items 14.8 and 15.3. Water to the TSFs and related infrastructure is supplied by Rand Water. Ergo recycles most of the water. 4.5. Personnel Sources Where mining activities take place, Ergo has commissioned contractors to conduct mining and secure the TSFs. Where there are no mining activities, Ergo has employed contractors to maintain the TSFs (to minimize dust and monitor water levels on the TSFs ) and security companies to secure the properties. Ergo employees conduct site inspections on a regular basis of the TSFs. Should additional employees be required, the surrounding areas have a large semi-skilled and skilled workforce. The cities of Johannesburg and Ekurhuleni have a large source of talent for trades and technical management. These cities have well-established mining operations. The majority of employees hired by Ergo are sourced from Gauteng Province, where all the properties are situated. Contractors and specialist consultants are also predominantly based in Gauteng Province. ERGO’S TECHNICAL REPORT SUMMARY OF THE MATERIAL TAILINGS STORAGE FACILITIES PAGE 35 35 5. HISTORY 5.1. Ownership Anglo American Corporation commissioned the Ergo facility (processing plant) on the East Rand in 1977. The objective was to recover gold and uranium and produce sulfuric acid from surface tailings material via a metallurgical flotation process. In 1977, a carbon in leach (CIL) plant was added. In 1990, when the uranium market collapsed, the uranium plant and the larger of the two acid plants were closed. In 1998, Ergo became part of Anglo Gold Limited (later Anglo Gold Ashanti Limited). In 2005, Ergo was closed. In 2007, Ergo Mining Proprietary Limited was formed as a joint venture between DRDGOLD and Mintails to re-establish the tailings treatment operations. A year later (2008) re-commissioning of the plant started, and Ergo acquired the Mintails’ stake in the gold recovery phase of the project. In 2009 a second feed line was brought into the Ergo plant from the Elsburg TSFs and the plant capacity doubled to 1.2Mt per month. In 2010, DRDGOLD acquired the balance of Mintails’ interest. 5.1.1. Crown Complex Crown Mines Limited (Crown Mines), previously known as Rand Mines (Milling and Mining) Limited, belonged to Rand Mining Proprietary Group, which commenced retreatment operations in 1982. At least 90% of the Crown Complex material was deposited onto the Crown TSF Complex Facility by Crown Gold Recoveries Proprietary Limited (“Crown Gold Recoveries”), which retreated processed material originally mined from the historical mines in the area. The Crown complex is situated on the farm Mooifontein 225-IQ. 5.1.2. City Deep Complex City Deep belonged to Rand Mines (Milling and Mining) Limited and fell under the same group as Crown Gold Recoveries. Records indicate that in 1986, City Deep Complex belonged to City Deep Rand Mines. Most of City Deep TSFs are located on the farms Elandsfontein 107-IR, Kliprivierfontein 106-IR and Doornfontein 92-IR. 5.1.3. Knights Complex Most of the TSFs in the Knights complex were previously owned by Simmer and Jack, dating back to 1986. Witwatersrand Gold Mine owned other TSFs. The Knight complex is situated on the farms Elandsfontein 90 IR, Driefontein 87 IR and Driefontein 85 IR. 5.1.4. Ergo Complex The Ergo Complex was created by East Rand Proprietary Mines Limited (ERPM) around 1958. ERPM was established more than 125 years ago as an underground gold mining operation and produced gold from 1896 to 2008. ERPM had approximately 15 shafts in the area, which were the primary sources of the tailings mineralized material deposited onto TSFs. 7L15 TSF is on Vlakfontein 130 IR, Portion 21 and Rooikraal is on Rooikraal 156 IR, Portion 12 and Rooikraal 156 IR, Portion 16 5.1.5. Marievale Complex Marievale Complex was previously owned by General Mining Union Corporation (Gencor) and operated by Marievale Consolidated Mines. The primary commodity was gold, and the secondary commodity was silver. The first year of production was 1939. Mining stopped in 1998. The Marievale complex is located on the farm Vlakfontein 281-IR. Ergo has Common Law Ownership over 7L5 to 7L7. Ergo acquired 7L4 from EBM Projects, the landowner of the majority of the freehold under the 7L4 TSF and the common law owner of the TSF. 5.1.6. 6L14TSF 6L14 was previously owned by Gencor and operated by Grootvlei Proprietary Mines Limited from 1967 to 1981 at an average RoM grade of 5g/t of gold. 6L14 is in farms Geduld 123 IR, portion 192 and Grootvaly 124 IR, portion 6. ERGO’S TECHNICAL REPORT SUMMARY OF THE MATERIAL TAILINGS STORAGE FACILITIES PAGE 36 36 5.2. Construction of the TSFs The TSFs were constructed in accordance with the then Chamber of Mines guidelines and best practices at the time. The guidelines provided for a starter wall, toe drain and blanket drain. Gravity penstocks were provided on all TSFs, which were subsequently replaced with elevated penstocks during their operations. The final design heights for a ‘typical’ TSF operated using day-walls were generally between 30m and 100m. When the TSFs were built, dump stability and environmental safety were key considerations. A deposition density of 1.40 to 1.45 t/m³ was targeted to ensure sufficient compaction and stability. All the TSFs were constructed as upstream TSFs. Upstream TSFs need to be raised slowly to allow the solid tailings time to dry and consolidate enough to support a new level of the TSF. Table 11 presents the history and status of TSFs. The TSFs are considered old, and the properties have been dormant for a considerable number of years. Table 11: History and Status of the TSFs TSF Commissioned Date Decommissioned Date Status as at 30 June 2025 Age since becoming Dormant (Years) Crown 3L5 +/-1920 2009 Dormant 16 3L7 Dormant 3L8 Dormant City Deep 4L3 1965 1984 Mining 41 4L4 Mining 4L6 Development Knights 4L14 1960 2000 Mining 25 4L39* Dormant >20 Ergo Rooikraal 1985 2012 Mining 13 7L15 1964 1986 Dormant 39 Marievale 7L4 1964 1998 Dormant 27 7L5 1964 1998 Dormant 27 7L6 1964 1998 Dormant 27 7L7 1964 1998 Dormant 27 6L14 6L14 2005 Dormant 20 *A newly acquired TSF with unknown commissioning and decommissioning dates. Source: Ergo, 2025 5.3. Previous Exploration and Mine Development 5.3.1. Previous Evaluation Drilling Previous evaluation drilling was completed on the TSFs in the 1970s by Anglo-American and from 2006 to 2008 by Ergo and Mintails SA Proprietary Limited. The QP was made aware of these activities, however, the QP did not use data acquired before 2008 in this report as the QP could not perform data quality assessment and validation satisfactorily. 5.3.2. Previous Development


ERGO’S TECHNICAL REPORT SUMMARY OF THE MATERIAL TAILINGS STORAGE FACILITIES PAGE 37 37 In 1976, the construction of the processing plant and associated infrastructure commenced and Ergo formally came into production on 25 February 1978. Table 12 presents Ergo’s production data over the last five years. Table 12: Ergo Production History Period Tonnes Processed (Mt) Processing Plant Head Grade (g/t) Yield Au (g/t) Gold Produced (kg) Gold Produced (koz) FY2021 23.0 0.36 0.19 4,263 137 FY2022 22.1 0.37 0.19 4,156 134 FY2023 17.3* 0.38 0.23** 3,931 126 FY2024 16.1*** 0.41 0.23 3,639 117 FY2025 19.5 0.36 0.18 3,473 112 Note: *Reduction in tonnage was due to significant load shedding at the beginning of the financial year, the depletion of high-volume reclamation sites and delays experienced in obtaining the necessary authorizations to commence the reclamation of a major reclamation site, Rooikraal. **The yield increased by 21% to 0.227g/t (FY2022: 0.19g/t) as a result of higher-grade material encountered during the final stages of reclamation and the reclamation of high-grade sand material. ***The reduced tonnage throughput resulted mainly from the late commissioning of the 5L27 and 4L3 sites. ERGO’S TECHNICAL REPORT SUMMARY OF THE MATERIAL TAILINGS STORAGE FACILITIES PAGE 38 38 6. GEOLOGICAL SETTING, MINERALIZATION AND DEPOSIT 6.1. Regional Geology Gold was discovered in the conglomerates of the Witwatersrand sedimentary basin in about 1886. The Witwatersrand Supergroup is aerially and structurally related to the underlying Dominion Reef System and the overlying Ventersdorp System. The Supergroup is an elongated sedimentary basin stretching some 320km in a north- easterly direction and 160km in a north-westerly direction. The upper portions of the Witwatersrand Supergroup contain quartz conglomerates that have been mined for their gold and uranium contents. The Transvaal Supergroup is a stratigraphic unit consisting of clastic sediments, carbonates, banded iron formations and volcanics younger than the Witwatersrand Supergroup. It occasionally directly overlies the gold-bearing conglomerates of the Witwatersrand Supergroup where the Ventersdorp Volcanics have been eroded or were not developed. At the base of the Transvaal Supergroup is a conglomerate layer, the Black Reef, that has been mined for gold. The operations are situated in the Witwatersrand Central Rand and East Goldfields. The East Goldfield is linked to the Central basin across a large monoclinal structure, the Springs Monocline. The major economic horizons mined were the South Reef together with Main Reef, Main Reef Leader and the Elsburg and Kimberley Reefs. The Black Reef, where mineralized, was also mined in the area. The TSFs are man-made features, and mineral distribution reflects the artificial nature of the deposit. The materials are the waste products (tailings) of the mining and metallurgical process recovery from the Witwatersrand and Transvaal Supergroups gold deposits. These tailings consist predominantly of quartz, lesser amounts of mica, chlorite, chloritoid, pyrite (1% to 2%) and low concentrations of gold, uranium and sulfur. 6.2. Mineralization, Local and Property Geology The TSFs have been processed through metallurgical plants that eject a residue (tailings), which is relatively uniform in terms of gold mineralization when compared with the natural deposit from which the mineralized material is derived. The variation between gold grades is small as the process residue dump was constructed in layers/benches. Grade variation primarily follows variations in the processing and, to a lesser extent, primary deposit characteristics. The gold mineralization is well distributed throughout the TSF. The width, length and depth (height) of the TSFs varies depending on the engineering designs and deposition capacities. The TSFs do not always have regular shapes. Table 7 presents the heights of the TSFs. The TSFs are the by-product of the mineral recovery process. They took the form of a liquid slurry made of fine mineral particles – created when mined ore was crushed, milled and processed. The tailings were pumped to the TSFs, which were constructed using earth starter walls, transitioning to upstream packed tailings walls. As the residue of the tailings gradually drained and became compacted, grass and other vegetation were planted to rehabilitate the environment. The TSFs evaluated in this report originated from different sources or processing plants, as shown in Table 13. ERGO’S TECHNICAL REPORT SUMMARY OF THE MATERIAL TAILINGS STORAGE FACILITIES PAGE 39 39 Table 13: Origin of the TSF Material TSF Source Mine Mined and Processed Reef Crown Complex 3L5 Crown Mines Main Reef 3L7 Crown Mines Main Reef 3L8 Crown Mines Main Reef City Deep Complex 4L3 City Deep Gold Mine Proprietary Limited Kimberley Reef 4L4 City Deep Gold Mine Proprietary Limited Kimberley Reef 4L6 City Deep Gold Mine Proprietary Limited Kimberley Reef Knights Complex 4L14 Simmer and Jack Gold Mine Black Reef 4L39 Simmer and Jack Gold Mine Black Reef Ergo Complex Rooikraal Knights Plant Residue from Knights Plant 7L15 Vlakfontein Mine Black Reef Marievale Complex 7L4 Marievale Consolidated Mine Kimberley Reef, Nigel Reef and Main Reef 7L5 Marievale Consolidated Mine Kimberley Reef, Nigel Reef and Main Reef 7L6 Marievale Consolidated Mine Kimberley Reef, Nigel Reef and Main Reef 7L7 Marievale Consolidated Mine Kimberley Reef, Nigel Reef and Main Reef 6L14 Grootvlei Proprietary Mines Limited Kimberley Reef 6.3. Stratigraphy and Cross-sections Unlike the stratigraphy of the in situ mineral deposit, the stratigraphy of a TSF is man-made. A typical stratigraphy is presented in Figure 4. Slime was deposited on soil (original ground level). The color of topsoil ranges from red to black. In some cases, soil is mineralized or enriched. A map and cross-section through the TSF are presented in Figure 5 and Figure 6 respectively. Figure 4: A Typical Stratigraphy for Ergo’s TSFs ERGO’S TECHNICAL REPORT SUMMARY OF THE MATERIAL TAILINGS STORAGE FACILITIES PAGE 40 40 Figure 5: A Map showing Location of Cross-section


ERGO’S TECHNICAL REPORT SUMMARY OF THE MATERIAL TAILINGS STORAGE FACILITIES PAGE 41 41 Figure 6: Cross-section of the TSF 6.4. Deposit Type The deposits under consideration are man-made features that are sometimes referred to as dumps, tailing dams, or simply mine dams. The TSF generally lies above the prevailing ground level and there is no host rock. No geological or mineralization controls are relevant to the TSFs as they are man-made features from plant residue. The grades are generally uniform. The engineering design parameters determine the size and shape of the TSF at the time of the deposition of the waste products from the respective processing plants. ERGO’S TECHNICAL REPORT SUMMARY OF THE MATERIAL TAILINGS STORAGE FACILITIES PAGE 42 42 7. EXPLORATION 7.1. Exploration The TSFs are man-made engineering features and typical exploration programs (geophysics, trenching, mapping and soil sampling) were not undertaken on the TSFs. An evaluation drilling program was conducted on the TSFs. No typical exploration work was required to locate the TSFs, as their locations are well known, rising well above ground level. The QP considered that non-drilling exploration was not material to the Ergo properties. This Report discusses only the declared Mineral Resources and Mineral Reserves; no exploration results or exploration targets are included. 7.2. Topographic Surveys The topographic surfaces of the TSFs were surveyed by a qualified surveyor from Geografix Surveys CC (Geografix), using a differential Global Positioning System (GPS) unit. The method has accuracy in the range of 10 to 20cm. The conventional survey equipment (total stations, prisms and related equipment) and GPS Real Time Kinetic systems were used to accurately determine the coordinated positions of the surface features as required to create a digital terrain model. Daily calibration through transformation was completed to ensure the instruments reported accurate results. This standard procedure was performed daily before surveying. After surveying was conducted or when the day’s work was completed, the calibration was rechecked through measurements of the benchmark points to confirm that the instruments measured the correct values. Data from survey measurements were checked through repeated measurements of selected points. No bias was identified. Surveys were undertaken on a 10m grid and measurements were also taken on all breaker lines. An additional 10m to 20m outside the footprint of each TSF was also surveyed. No additional tailings material was deposited on the TSFs after the surveys were conducted. For the TSFs where mining is taking place (e.g. Rooikraal, 4L14), monthly surveys are completed, and the tonnage depleted from the Mineral Resources and Mineral Reserves up to 30 June 2025. The details of the survey information are presented in Table 14. The QP was satisfied to rely on the survey measurements as an accurate representation of the TSFs. 7.3. Evaluation Drilling Evaluation drilling campaigns were completed on the material TSFs. The drilling grid was not always regular due to access issues and TSF shapes; however, the QP noted that drill holes were well spread. The well-spread drill holes ensured that the samples collected were representative of the respective TSFs. All drilling activities detailed in this report were completed prior to the commencement of mining. 7.4. Drilling Methodology Two drilling techniques (Reverse Circulation (RC)/Aircore and Auger drilling methods) were followed by specialized independent drilling contractors on the TSFs. The RC or aircore method was implemented where the auger drilling technique could not drill to the base of the TSF due to drill hole length exceeding 55m or areas of high moisture content at the base of the TSF. ERGO’S TECHNICAL REPORT SUMMARY OF THE MATERIAL TAILINGS STORAGE FACILITIES PAGE 43 43 The QP was satisfied that all measures were taken to ensure that drilling, sampling and recoveries were acceptable and would not affect the accuracy and reliability of the results. The experienced geologists from The RVN Group or Ergo monitored the drilling process. The QP made ad-hoc site visits during drilling and sampling. In the opinion of the QP, the processes followed were adequate for collecting quality samples and information for use in the interpretation of results and in the Mineral Resource estimation. Table 14: Survey Details of the TSFs TSF Surveyed Area (ha)* Date Surveyed** Coordinate System, Datum Crown 3L5 (Diepkloof) 158.5 02/09/2013 WGS84 LO27, amsl*** 3L7 (Mooifontein) 108.4 15/08/2013 WGS84 LO27, amsl 3L8 (GMTS) 159.3 20/09/2013 WGS84 LO27, amsl City Deep 4L3 33.9 15/05/2017 WGS84 LO29, amsl 4L4 20.6 08/06/2017 WGS84 LO29, amsl 4L6 44.2 15/06/2017 WGS84 LO29, amsl Knights 4L14 22.4 13/11/2015 WGS84 LO29, amsl 4L39 40.0 13/10/2022 WGS84 LO29, amsl Ergo Rooikraal 155.8 23/05/2018 WGS84 LO29, amsl 7L15 97.6 23/05/2008 WGS84 LO29, amsl Marievale 7L4 116.3 19/01/2009 WGS84 LO29, amsl 7L5 31.1 08/01/2009 WGS84 LO29, amsl 7L6 62.0 20/01/2009 WGS84 LO29, amsl 7L7 69.1 22/01/2009 WGS84 LO29, amsl 6L14 64.8 26/05/2015 WGS84 LO29, amsl Note: *area includes 10m outside the TSF footprint **amsl is the abbreviation for above mean sea level 7.4.1. Auger Drilling Auger drilling, a cost-effective method, was commissioned by Ergo on most of their TSFs for holes less than 55m and located within areas of lower moisture content. With auger drilling, the rotation of a helical screw causes the blade of the screw to lift the sample to the surface. This drilling method does not require heavy machinery to drill to the desired depth. This auger method can be used for shallow environmental drilling, geotechnical drilling, soil engineering and mineral deposits where the formation is soft and the hole does not collapse. This is done by pressing the spiral rods into the ground using a drilling head machine which can drill up to a depth of 55m. Samples were collected through the spiral at every 1.5m interval and the spiral was cleaned with water and brushed clean after every run. ERGO’S TECHNICAL REPORT SUMMARY OF THE MATERIAL TAILINGS STORAGE FACILITIES PAGE 44 44 7.4.2. Reverse Circulation and Aircore RC or Aircore drilling, with better sample recovery than auger drilling, is a method of drilling which uses dual wall drill rods consisting of an outer drill rod with an inner tube. These hollow inner tubes allow the drill cuttings to be transported back to the surface in a continuous, steady flow. The drilling mechanism is often a pneumatic reciprocating piston called a hammer, which in turn drives a clay cutter, specifically made to cut soft material such as tailings and soil. The clay cutter is used to remove samples that are pushed through the machine with compressed air. When air is blown down the annulus (ring-shaped structure) of the rod, the pressure shift creates a reverse circulation, bringing the tailings up the inner tube. When the tailings reach a deflector box at the top of the rig, the material is moved through a hose attached to the top of the cyclone. The drill cuttings will travel around the cyclone until they fall through the bottom opening into a sample bag. These bags are sorted and marked with the location and depth where the sample was collected. RC drilling technique can drill up to 1,500m deep. The other benefits of RC drilling include:  more reliable and less contaminated samples than those from auger drilling;  a high drill penetration rate;  a larger sample size; and  a more cost-effective method than diamond or sonic drilling. Samples were collected through the cyclone at 1.5m intervals and the rods and cyclone were cleaned with compressed air after every run. The RC drilling technique was chosen because RC drilling could drill deeper holes than auger drilling. In addition, because of its higher power, RC drilling can drill through wet material and has a better recovery percentage than auger drilling, which is prone to losing wet samples through its spiral.


ERGO’S TECHNICAL REPORT SUMMARY OF THE MATERIAL TAILINGS STORAGE FACILITIES PAGE 45 45 7.5. Crown A total of 62 RC/aircore drill holes at approximately 150m-by-150m average grid spacing were completed in FY2017 and FY2025 on the Crown Complex as shown in Figure 7. The QP removed two drillholes from GMTS (GMT01 and GMT02) from any evaluation process as they were not surveyed and their physical locations are unknown. All historical (pre 2016 holes) drill holes were excluded as the QP could not confirm their locations. Figure 7: Crown Complex: Map showing Drill Hole Locations ERGO’S TECHNICAL REPORT SUMMARY OF THE MATERIAL TAILINGS STORAGE FACILITIES PAGE 46 46 7.6. City Deep A total of 34 auger drill holes between 100m and 200m spacing were completed in 2017 on the City Deep Complex, as shown in Figure 8. All drillholes were considered for evaluation. Figure 8: City Deep Complex: Map showing Drill Hole Locations ERGO’S TECHNICAL REPORT SUMMARY OF THE MATERIAL TAILINGS STORAGE FACILITIES PAGE 47 47 7.7. Knights 7.7.1. 4L14 A total of 17 auger drill holes were completed on 4L14. The average drill hole spacing was 100m. Drill holes are well spread throughout the TSF as presented in Figure 9. The TSF has a maximum height of 37.5m. The intersected soil reported higher gold values; thus, the soil was modelled as a separate domain and added to the TSF’s Mineral Resource. All drill holes were utilized in the evaluation process. Figure 9: Knights Complex - 4L14: Map showing Drill Hole Locations 7.7.2. 4L39 A total of 14 auger drill holes between 100m and 150m spacing were completed on 4L39 TSF in 2022. The holes were well spread as presented in Figure 10. A total of 296.5m were drilled. The 4L39 TSF is overlain by a layer of municipal/industrial waste with a thickness of up to 5m. Drill spots were prepared (excavator removed waste) before drilling commenced. Of the 14 drill holes completed, a total of 12 intersected the TSF base, i.e. drilled to the soil. Drill hole BH10 could not be drilled deeper because the rod hit a hard object at 21m, and drill hole BH08 could not reach the soil because of ground wetness and was also stopped at 21m. Two drill holes (BH01 and BH03) could not be drilled due to access challenges. ERGO’S TECHNICAL REPORT SUMMARY OF THE MATERIAL TAILINGS STORAGE FACILITIES PAGE 48 48 BH01 was waterlogged and BH03 had thicker rubble that could not be removed due to the excavator being unavailable at the time. Figure 10: Knights Complex - 4L39: Map showing Drill Hole Locations


ERGO’S TECHNICAL REPORT SUMMARY OF THE MATERIAL TAILINGS STORAGE FACILITIES PAGE 49 49 7.8. Ergo 7.8.1. 7L15 A total of 22 auger drill holes were completed on 7L15. Some holes were twin holes to confirm the results obtained in previous drilling campaigns. The drill hole pattern has an irregular spacing averaging less than 100m (Figure 11). The 2015 drill campaign is excluded as detailed in Item 11.13.1.2. Figure 11: Ergo Complex - 7L15: Map showing Drill Hole Locations ERGO’S TECHNICAL REPORT SUMMARY OF THE MATERIAL TAILINGS STORAGE FACILITIES PAGE 50 50 7.8.2. Rooikraal A total of 64 RC drill holes were completed on Rooikraal. Irregular drill hole spacing was due to access challenges (Figure 12). An average drill hole spacing of less than 100m was achieved. All holes were used in the evaluation. Figure 12: Ergo Complex - Rooikraal: Map showing Drill Hole Locations ERGO’S TECHNICAL REPORT SUMMARY OF THE MATERIAL TAILINGS STORAGE FACILITIES PAGE 51 51 7.9. Marievale A drill hole map for the Marievale complex is presented in Figure 13. An average spacing of 100m was followed. Auger drilling was conducted in 2020. All drill holes were used in the mineral resource estimation process. Figure 13: Marievale Complex: Map showing Drill Hole Locations ERGO’S TECHNICAL REPORT SUMMARY OF THE MATERIAL TAILINGS STORAGE FACILITIES PAGE 52 52 7.10. 6L14 RVN supervised the auger drilling campaigns at 6L14 TSF in 2017 and 2023, as shown in Figure 14. The 2017 drilling campaign was done for metallurgical testing purposes, and the 2023 drilling campaign was completed to report gold grades and for metallurgical test work. The grid spacing for 6L14 is approximately 100m-by-100m or less. Historical drillholes (1974/1994 dataset) only had one grade per hole. The QP assumed this represented a full-length composite, but the length values were missing. This updated data was crucial for assessing average gold grades and their distribution. Figure 14: 6L14: Map showing Drill Hole Locations 7.11. Logging and Sampling The RVN Group used comprehensive logging and sampling standard procedures, including extensive Quality Assurance (QA) and Quality Control (QC) procedures. In addition, the geologist and drilling supervisor counted the rods after each hole had intersected the soil to confirm the borehole depths. Where samples were split, coning and quartering was done by the geologist on-site to ensure the representativity of these samples. The samples were assigned unique sample identification numbers and tagged before being submitted to the laboratory. The RVN Group geologists prepared sample submission sheets that accompanied the samples. Records of the sample data were captured in a database.


ERGO’S TECHNICAL REPORT SUMMARY OF THE MATERIAL TAILINGS STORAGE FACILITIES PAGE 53 53 The RVN Group monitored the drilling and sampling process. Logging was qualitative in nature, except for sample intervals. All drill holes were logged in entirety from top to bottom on-site. As drilling progressed, the spiral for auger and rods for RC/aircore drilling were cleaned after every drilling run to prevent sample contamination. 7.11.1. Logging Drill holes were logged on-site by The RVN Group or Ergo geologist using the individual 1.5m samples taken throughout the drill hole. The geological description of the samples was completed manually using paper logging sheets established by the RVN Group. Samples were classified according to whether they were slimes, sand, silt or soil, dry, moist or wet and on color. Logging was done on-site and then captured electronically into Microsoft Excel spreadsheets and reviewed by QP for any input errors. 7.11.2. Sampling Every drill hole was sampled at 1.5m intervals for the entire length of the hole. The samples were immediately bagged and tagged on site. Sampling (plastic) bags were labelled and tagged with a sample book tag. The drill log and sample book were regularly checked against the drill hole depth as drilling proceeded to ensure compatibility. Samples were noted as “dry”, “moist” or “wet” in the drill log and sample book. The geologist responsible planned sample numbers and the QC samples in a Microsoft Excel spreadsheet and assigned them to the appropriate sample interval. The RVN Group safely and carefully collected, secured and transported the samples from the site to avoid contamination and sample loss. All the samples were presented to the laboratory in an organized and sorted manner with easily understandable documentation, including a fully completed Sample Submission Form. 7.12. Sample Recovery Samples recovered from the TSFs material were mostly moist and fine-grained. The sample size was visually checked on- site to ensure they were of a similar size and sufficient quantity. The gold grade did not show a definable relationship with sample weights. The QP considered the recovery and sample quality satisfactory for further evaluation. 7.13. On-site Security Measures Access to the drill sites was restricted to the drilling and The RVN Group teams. Any unauthorized access to the drill sites was prohibited. Drilling sites were demarcated by danger tape and no visitors could cross the demarcated area unless authorized by the QP. Once samples were packed and the bags sealed, no one was allowed to open the bags. 7.14. Collar Survey Data A qualified surveyor from Geografix surveyed the drill hole collar positions using total station surveying equipment and differential GPS instruments. The accuracy of the method was within a 10cm range. ERGO’S TECHNICAL REPORT SUMMARY OF THE MATERIAL TAILINGS STORAGE FACILITIES PAGE 54 54 Collar positions were plotted on the satellite images to verify positions and collars plots were inspected. Elevations were compared to the topographic survey. Collar positions were verified to be accurate. The QP is satisfied with the surveying methodology followed. The surveys were performed by a qualified surveyor who has sufficient experience to undertake the task. The surveys were considered by the QP to be of adequate quality for use in the evaluations of the TSFs. No downhole survey measurements were taken as the drill holes were shallow and vertical, and the QP anticipated no deviations. 7.15. Density Determination Bulk densities on the TSFs were measured in situ by Letsatsi Materials Engineering Proprietary Limited (a South African National Accreditation System (SANAS) accredited institution for engineering materials testing) using a Troxler densitometer between September 2020 and January 2021. The bulk density measurements included compaction rates and moisture content. The use of densitometers on TSFs and sand dumps is common practice for geotechnical assessments, as TSFs and sand dumps are engineered features with consistent physical properties. The density of the TSF is directly proportional to the compaction rate, moisture and material type. As the moisture content increases, density decreases and vice versa. The compaction rate and material type do not vary significantly with depth (TSFs are largely homogeneous as they are from the same source over time); thus, measurements taken at any depth (>10cm) are representative of the TSF compartments. Density measurement points were prepared, and measurements were taken per TSF. The points were well spread. Preparation of points involved removing the topmost 5cm to 10cm of loose material and flattening (levelling) the surface. Measurements were taken at 150mm and 300mm depths per point. As part of quality control, some points are measured more than once. The statistics of the density measurements are presented in Table 15. The average bulk densities determined for the TSFs were slightly higher than the 1.42t/m3 that Ergo uses for the TSFs they are mining. The mean tests showed that the density is more than 1.42t/m3 with a 95% confidence level. Confidence intervals for the densities indicated, with a 95% confidence level, that the mean density applied at Ergo is within the range. The QP decided to continue using a lower mean density of 1.42t/m3 as it is within the 95% confidence and prediction intervals, and passed the mean test. In addition, Ergo has been successfully applying 1.42t/m3 in their mining production reconciliation for more than 15 years. The QP is satisfied using a 1.42t/m3 mean dry bulk density for all the TSFs with the understanding of the upside potential if the mean density is later determined to be higher. ERGO’S TECHNICAL REPORT SUMMARY OF THE MATERIAL TAILINGS STORAGE FACILITIES PAGE 55 55 Table 15: Bulk Density Information and Statistics Reclamation Site TSF Number of Samples Mean Density (t/m3) Standard Deviation (t/m3) Minimum (t/m3) Maximum (t/m3) CoV*** Crown Complex 3L5 60 1.479 0.044 1.353 1.567 0.03 3L7 60 1.443 0.020 1.381 1.485 0.01 3L8 32 1.397 0.028 1.331 1.440 0.02 City Deep Complex 4L3 20 1.419 0.078 1.214 1.560 0.05 4L4 20 1.456 0.031 1.410 1.522 0.02 4L6* - - - - - - Knights Complex 4L14* - - - - - - 4L39* - - - - - - Ergo Complex 7L15 30 1.513 0.035 1.443 1.591 0.02 Rooikraal 90 1.457 0.051 1.350 1.602 0.04 Marievale Complex 7L4 60 1.457 0.033 1.405 1.526 0.02 7L5 30 1.434 0.047 1.360 1.520 0.03 7L6 60 1.453 0.060 1.335 1.595 0.04 7L7 60 1.461 0.032 1.374 1.548 0.02 6L14 6L14* - - - - - - Total 817 1.450** 0.017 1.214 1.602 0.03 Notes: *no measurements were taken **weighted average ***CoV is the abbreviation for Coefficient of Variation ERGO’S TECHNICAL REPORT SUMMARY OF THE MATERIAL TAILINGS STORAGE FACILITIES PAGE 56 56 7.16. Hydrogeological Drilling and Test Work No hydrogeological studies were completed to acquire data on surface and groundwater parameters. No hydrogeologic model has been prepared and no site-specific water availability study was carried out for the TSF. However, some relevant hydrological data was captured during drilling and logging by The RVN Group. The RVN Group logs have moisture content recorded based on visual inspection (i.e., dry, moist, wet or watery). Additionally, Ergo installed piezometers in some larger TSFs (Crown Complex) to monitor water levels. Smaller TSFs are considered low risks as they are dormant and mostly moist to dry; thus, no piezometers were installed. 7.17. Geotechnical Data, Testing and Analysis No geotechnical testing and sampling were completed on the TSFs and sand dumps. However, stability assessment studies were completed on the TSFs with a greater than 60Mt of Mineral Resource material. In 2024, stability assessments were conducted on Crown Complex TSFs by Lutails Engineering Proprietary Limited. No studies were completed on the other TSFs as they are small, dormant and pose a low geotechnical stability risk. The Stability Performance Review has comprehensively examined the geotechnical integrity of the Crown TSF. This evaluation included critical aspects of dam stability such as Peak Drained, Peak Undrained, Undrained Residual Strength slope stability analyses and a Seismic Analysis to account for potential seismic events. The thorough analysis has confirmed that the stability of the Crown TSF meets all required regulatory, safety and engineering standards. Additionally, the assessment evaluated the stormwater control measures in place at the facility. The findings indicate that the existing stormwater management systems are adequate, effectively mitigating the risk of dam overtopping and ensuring TSF’s integrity even under adverse weather conditions. Hydrogeological and geotechnical advice is obtained prior to mining activities as the combination of high moisture content and fine particles could, during mining activities, result in liquefaction and mud rush conditions. A comprehensive risk assessment is undertaken before commencing mining of a TSFs to avoid slope failures. Ergo and their mining contractors have informed the QP that there are procedures in place to ensure safe mining of TSFs. The QP is satisfied that the stability studies of the TSFs are sufficient and meet the requirements for the Mineral Resource evaluation purposes.


ERGO’S TECHNICAL REPORT SUMMARY OF THE MATERIAL TAILINGS STORAGE FACILITIES PAGE 57 57 8. SAMPLE PREPARATION, ANALYSES AND SECURITY 8.1. Sampling Governance and Quality Assurance The RVN Group used Ergo’s standard operating procedure for data collection, analysis, validation and storage. In addition, regular planned task observations of procedures and their implementations are undertaken to ensure compliance and appropriateness for the drilling program. Training and planned task observations are provided by the QP on regular basis. The sample chain of custody is managed by experienced geologists from The RVN Group. The QP is satisfied with the QA and QC protocols in place. 8.2. Sample Preparation and Analysis 8.2.1. On-site Sample Preparation All samples were halved on-site by a geologist through the coning and quartering method as the samples were too moist or wet to use a riffle splitter, which has the potential to introduce cross-contamination and bias. The cone and quartering method does not introduce a systematic bias as it involves pouring each sample on a clean, flattened bag (1.0m-by-0.5m). The coning and quartering method is considered appropriate for the TSF material as TSF samples are homogeneous due to the deposition procedure. Figure 15 shows the cone and quartering methodology followed. One half is for the metallurgical test and the other half is for a routine exploration sample. Figure 15: Coning and Quartering Method Source: Modified after Alakangas, 2015 Sorting of samples took place on the TSFs and at the storage site at Ergo. ERGO’S TECHNICAL REPORT SUMMARY OF THE MATERIAL TAILINGS STORAGE FACILITIES PAGE 58 58 Where a field duplicate was required, a selected routine exploration sample underwent a further coning and quartering process. To maintain the validity and integrity of samples and as part of security measures, only geologists worked on the samples, and samples were sealed immediately after preparation. 8.2.2. Laboratories, Sample Preparation and Analyses The samples were sent to the following three reputable laboratories for further preparation and assaying:  MAED at Ergo’s Plant in Brakpan: The facility is not accredited but it is the laboratory used by Ergo for its grade control and daily plant samples. MAED is not owned by Ergo, although it is situated in the Ergo Plant and was supplied with all routine exploration samples for analysis. MAED is independent of Ergo;  SGS in Randfontein: SGS is a SANAS accredited facility (T0265) and has been used for the selected analytical method. Randomly selected check samples (approximately 10% of the total samples) from MAED were sent to SGS for confirmation. SGS is independent of Ergo; and  Anglo Lab in Carletonville: Anglo Lab analyzed some check samples for 7L15 TSF in 2016 and 2017 as a secondary laboratory to MAED. The laboratory no longer exists, and it was not SANAS accredited. The laboratory was independent of Ergo. Table 16 presents information about where the samples were analyzed. Table 16: Laboratories Used TSF Primary Laboratory Secondary Laboratory Crown Complex 3L5 MAED SGS 3L7 MAED SGS 3L8 MAED SGS City Deep Complex 4L3 MAED SGS 4L4 MAED 4L6 MAED Knights Complex 4L14 MAED SGS 4L39 MAED Ergo Complex Rooikraal MAED SGS 7L15 MAED SGS and Anglo Lab Marievale Complex 7L4 MAED 7L5 MAED 7L6 MAED 7L7 MAED 6L14 6L14 MAED SGS The laboratories sorted and weighed samples on receipts, conducted dry screening to remove foreign material and to ensure no coarse material which would not be treated at the plant was removed. Subsequently, the samples were dried at 105˚C, then crushed to 80% passing 2mm, riffle split and finally pulverized to 75µm before being analyzed. The selected laboratories follow analytical procedures that are conventional industry practice. ERGO’S TECHNICAL REPORT SUMMARY OF THE MATERIAL TAILINGS STORAGE FACILITIES PAGE 59 59 The samples were analyzed for gold by fire assay with gravimetric finish by MAED and Atomic Absorption Spectroscopy (AAS) finish by SGS and Anglo Lab. These methods are conventional and have been used for more than 50 years with minor adjustments. The methods have a lower detection limit of 0.01g/t Au and there is no upper detection limit for gravimetric finish. The AAS has a 10g/t Au upper limit. The lower limit is relevant to the TSFs. The TSFs are processed materials and are generally low-grade materials with slightly higher grades than ten times the detection limit. The laboratories were instructed to use a 100g aliquot to analyze for gold. Through experience, it is known that to analyze for gold in low-grade slimes, anything less than a 100g aliquot may report less accurate results. 8.2.3. QP Opinion The QP is satisfied with the sample preparation, analytical methods and level of cleanliness at the analytical laboratories. The analytical techniques employed are suited to the mineralization style and expected grades. The techniques meet the requirements for the intended use. 8.3. Analytical Quality Control 8.3.1. Nature and Extent of the Quality Control Procedures A comprehensive QC program comprising reference material, duplicates and commercially sourced certified blanks were inserted by The RVN Group in a random but stratified manner, at frequencies targeting ±10% coverage of all samples. The QC program identifies various aspects of the results that could negatively influence the subsequent evaluation processes. The QC samples were used to monitor the sampling, sample preparation and analytical processes. Analysis of QC data is performed to assess the reliability of all sample assay data and the confidence in the data used for Mineral Resource estimation. All QC sample insertions maintained consecutive numerical order. These control samples were inserted as part of a continuous sample number sequence and the QC samples were not obviously different from routine samples when the milled material was prepared and analyzed. Applying the QC process, it was possible to identify samples that have been swapped, gone missing or incorrectly labelled amongst other aspects. QC samples were sourced from African Mineral Standards (AMIS) based in Modderfontein, Johannesburg. The RVN Group ensured that all standards and blanks were stored in sealed containers and considerable care was taken to ensure that they were not contaminated in any manner (i.e., through storage in a dusty environment or being placed in a contaminated sample bag, etc.). Field duplicates were prepared on-site as the TSF material was already loose and fine-grained. The QC set of samples consisted of:  the certified silica blanks (AMIS0484, AMIS0577 and AMIS0865) from AMIS;  certified reference materials (CRMs) (AMIS0647 with 0.17g/t Au, AMIS0299 with 0.36g/t Au, AMIS0515 with 0.51g/t Au and AMIS0828 with 0.395g/t) from AMIS;  standard reference material L-AU015 and L-AU16 with an average value of 0.20g/t Au and 0.30g/t Au, respectively. Standard reference materials with the averages of 0.22g/t Au, 0.33g/t Au and 0.74g/t Au were also used; and ERGO’S TECHNICAL REPORT SUMMARY OF THE MATERIAL TAILINGS STORAGE FACILITIES PAGE 60 60  field duplicates (prepared through the cone and quartering technique). From 2021, only CRMs were used, and the use of in-house standard reference material was discontinued as in-house standards performance was not always consistent. The QP noted that this does not imply that the previous results were of low quality as rigorous quality control assessments were implemented. The new procedure of using only CRM with a matched matrix was implemented because the CRMs come with defined certified values and are easier to monitor. 8.3.2. Quality Control Results Analytical results for the blank and standards are analyzed graphically on control charts to facilitate the identification of anomalous data points. A sufficient number of standards, duplicates and blanks were inserted into the sample stream. If the QC sample result was reported outside three standard deviations of the certificate value a re-assay would be requested for the whole batch from the laboratory. 8.3.3. QP Opinion In the QP’s opinion, the QC samples covered a reasonable range of grades with respect to the overall resource grades and no significant bias was observed. The laboratories’ analytical data indicates overall acceptable precision and accuracy and no evidence of overwhelming contamination by the laboratory that would affect the integrity of the data. As a result, the analytical data from the laboratories is of acceptable integrity and can be relied upon for TSF grade estimation. 8.4. Sample Storage and Security Samples were stored at the Archive Store at Ergo’s processing plant in Brakpan. The storage facility is always locked and has an electric fence to prevent unauthorized entry. Sample rejects and pulps are stored for six months after all assays are received from the laboratory and then discarded due to space constraints. In the QP’s opinion, the sample storage and security measures are adequate for TSF evaluation. 8.5. Data Storage and Data Management Procedures are in place to ensure the accuracy and security of the databases. Laboratories reported results in Microsoft Excel and *.pdf formats. Information was obtained by RVN Group and captured into a Microsoft Excel spreadsheets (‘database’). Spot checks were randomly performed to identify transcriptional errors. The RVN Group created and validated the database on behalf of Ergo. The database was developed and validated in Microsoft Excel. The database was sent to Ergo for further use and storage. The RVN Group compiled the following key digital databases:  a drill hole database that includes collar location, assay and geology data;  assay quality control data;  density data; and  process samples information. The QP is satisfied with data storage and validation. The QP is of the opinion that the databases are a fair and accurate record of all drill hole and assay data.


ERGO’S TECHNICAL REPORT SUMMARY OF THE MATERIAL TAILINGS STORAGE FACILITIES PAGE 61 61 The RVN Group has saved the information, including the databases, in the cloud-based storage service as a backup, in line with the latest technological developments. Additionally, data is stored on external hard drives placed in different locations. The RVN Group has provided sufficient provisions to ensure the security and integrity of the data stored in the databases. ERGO’S TECHNICAL REPORT SUMMARY OF THE MATERIAL TAILINGS STORAGE FACILITIES PAGE 62 62 9. DATA VERIFICATION Post-2016: The QP performed verifications of the data collected. The QP experienced no limitations to the review, analysis and verification of data. The QP did compare a selection of the hardcopy logs with the drill holes database and the logs and database match. The collars were checked by comparing the collars with the topography surface from the surveyor. Collars were also plotted on Google Earth Pro for confirmation. The collars were found to be accurate. Logging, surveying and sampling were monitored by the exploration geologists and verified routinely for consistency. The RVN Group geologists regularly maintain and validate the databases using validation routines and regularly check the drill hole data visually on-screen. A first check consists of identifying duplicate sample numbers or lack of sample information. Paper records are stored in a safe location at Ergo’s Offices. The QP is of the opinion that the data collection, import and validation workflows are consistent with industry standards and are of sufficient quality to support the Mineral Resource estimation. The QP has taken a number of steps to verify the Mineral Resource estimates, including assumptions and inputs into the estimate and the estimation process itself. The QP checked the volume, density and grade, noting that based on historical information, no dilution or mining loss is applied to the Mineral Reserve. The QP conducts reconciliations of Run-of-Mine (RoM) grade, tonnage, recovery (metallurgical assumptions) and other modifying factors from the ongoing mining operations to demonstrate that the modifying factors applied to the mine plan are as predicted by the geological block model. Actual performance for operational mining areas provides a high level of confidence where similar performance can be expected from future mining areas. The current Mineral Reserves have not demonstrated any material differences in the planned and actual modifying factors. The QP is of the opinion that the data used to estimate the Mineral Reserve is adequate. Historical: Sampling and assaying techniques of the TSFs prior to 2016 are essentially the same as the current work. The only real change noted by the QP is that the sieve size was reduced to 850µm in 2016, where it was 1,000µm previously. There is no apparent difference between the results using these different sieve sizes. The analytical method is fire assay, a well-established technique used in South African gold mines. The methods differed slightly over time and between laboratories, but the results are consistent within a TSF. Aliquot sizes have been either 100g or 125g, depending on the laboratory used. Quality control systems are in place in laboratories to monitor accuracy and precision. ERGO’S TECHNICAL REPORT SUMMARY OF THE MATERIAL TAILINGS STORAGE FACILITIES PAGE 63 63 10. MINERAL PROCESSING AND METALLURGICAL TESTING 10.1. Nature and Extent of the Metallurgical Testing Method Samples were received from the various drilling exercises in 1.5m increments per hole. Composites were made over a 15m horizon as this corresponds with the monitoring/mining vertical cuts. The TSFs were generally divided into a top, middle and bottom horizon, depending on the height of the TSF. The TSFs were also divided in plan into areas or compartments, providing distinct samples for metallurgical test work. 10.2. Procedure The individual samples were split in two using a blending mat, and cone and quartering methods. The one half of the sample was returned to the sample bag for possible future use and for reference. The other half was composited as per the areas/horizons or domain alluded to earlier. The composite was well mixed, and sub-samples were taken for test work at Ergo Metallurgical Research laboratory or at the Maelgwyn South Africa Proprietary Limited’s laboratory. The proposed processing route for all TSF material is hydraulic mining, cyaniding in a Carbon-in-Leach (CIL) circuit and then carbon eluted for gold recovery before it is recycled back to the leach circuit. The eluate (gold bearing solution from the elution circuit) is sent to the zinc precipitation process, where gold is recovered from the solution on zinc dust. The zinc is filtered before it is calcined. The calcine cake is then smelted to produce gold bullion. A standard bottle roll test was done on each composite using the following leaching parameters:  samples slurried to a density of 1.45t/m3;  screened to remove +850µm discard material;  head sample was taken for triplicate fire assay;  pre-conditioning with lime for one hour to stable pH of 10.5;  cyanide added at 0.35kg/t to 0.5kg/t;  activated carbon added at 20g/l;  leach terminated after seven hours;  solids filtered and washed twice and solutions tested for residual reagents and gold content; and  residue assays done in triplicate. 10.3. Representative of the Samples Drill holes were drilled on a defined grid down to the soil. The samples received were split and composited in the laboratory and are representative of the various volumes within the TSFs. 10.4. Details of the Laboratories The Ergo Metallurgical Research Laboratory, located in Brakpan inside the Ergo processing plant, is geared to perform bottle roll testing on a routine basis with skilled technicians. Internal accounting checks are undertaken to ensure the accuracy of the work done. The laboratory is not accredited and is the internal test facility for Ergo. The laboratory is not independent of Ergo. ERGO’S TECHNICAL REPORT SUMMARY OF THE MATERIAL TAILINGS STORAGE FACILITIES PAGE 64 64 Some tests were completed at Maelgwyn South Africa Proprietary Limited (Maelgwyn) laboratory, situated in Northriding, Johannesburg. Maelgwyn is accredited for International Organization for Standardization (ISO 9001:2025) to perform gold leaching test work with their assays analysis conducted by the SGS laboratory, in Randfontein. SGS is an SANAS accredited facility (T0265) for gold analysis. Both the Maelgwyn and SGS laboratories are independent of Ergo. 10.5. Results The main assumption was that the laboratory procedure emulates the processing plant and historical test work has shown to be a fair assumption. To accommodate the dissolved loss encountered in the processing plant, an allowance of 0.008g/t Au (plant inefficiency) is made to estimate the predicted recovery in the plant. Table 17 presents the results of metallurgical test work. Table 17: Summary of Predicted Ergo Processing Plant Performance TSF Head Au (g/t) Washed Residue Au (g/t) Dissolution Loss Au (g/t) Recovery* (%) Analysis Laboratory Crown Complex 3L8 (GMTS) 0.24 0.150 0.008 36.8 Ergo 3L7 (Mooifontein) 0.23 0.134 0.008 42.1 Ergo 3L5 (Diepkloof ) 0.23 0.134 0.008 42.1 Ergo City Deep Complex 4L3 0.32 0.165 0.008 48.3 Ergo 4L4 0.37 0.182 0.008 50.8 Ergo 4L6 0.32 0.142 0.008 55.6 Ergo Knights Complex 4L14 0.29 0.134 0.008 53.1 Maelgwyn/Ergo 4L39 0.28 0.198 0.008 29.9 Ergo Ergo Complex Rooikraal 0.26 0.173 0.008 33.5 Ergo 7L15 0.34 0.209 0.008 37.5 Maelgwyn/Ergo Marievale Complex 7L4 0.29 0.141 0.008 51.5 Ergo 7L5 0.29 0.198 0.008 32.1 Ergo 7L6 0.26 0.154 0.008 40.7 Ergo 7L7 0.32 0.215 0.008 33.3 Ergo 6L14 0.36 0.190 0.008 46.4 Maelgwyn/Ergo *Note: The recovery factor estimate included consideration of Ergo plant performance, specifically accounting for plant inefficiency. Where applicable, weighted averages were applied to estimate recoveries (weighting was not applied in the 2023 TRS), with the weights determined by how the TSF was divided into different areas. Recoveries for some TSFs were re-tested and confirmed in 2024.


ERGO’S TECHNICAL REPORT SUMMARY OF THE MATERIAL TAILINGS STORAGE FACILITIES PAGE 65 65 10.6. Interpretation of the Results Table 17 summarizes the results of metallurgical test work that has been done on the various TSFs. In the table under the ‘comments’ column, an indication as to which laboratories carried out the test work is given. The head grade and washed residue are the results achieved in the laboratory. To predict how the material would respond to treatment in the Ergo processing plant, a dissolved gold loss of 0.008g/t Au (to account for plant inefficiency) has been applied. In general, the head grades vary between 0.20g/t Au and 0.37g/t Au. The response to cyanidation is varied which could be due to numerous factors such as different material from different sites. 10.7. QP Opinion In the opinion of the QP, data derived from metallurgical test work is adequate for designing processing facilities and techniques and provides suitable grade and recovery predictions for use in the LoM plan. Confidence is further increased by Ergo processing plant performance demonstrated through reconciliation for over 15 to 20 years. The metallurgical process is well-tested and utilized by numerous tailings retreatment operators in South Africa and elsewhere. There were no processing factors or deleterious elements that could significantly affect reasonable prospects of economic extraction. ERGO’S TECHNICAL REPORT SUMMARY OF THE MATERIAL TAILINGS STORAGE FACILITIES PAGE 66 66 11. MINERAL RESOURCE ESTIMATES The gold grade estimation was completed using various modelling techniques depending on data properties: Inverse Distance Weighting (IDW) to the power of 2 and Ordinary Kriging where applicable and validation using the Nearest Neighbor (NN) technique. The techniques reported a similar average global gold grade with no significant conditional bias. The estimation approach was considered appropriate based on the review of several factors, including the quantity and spacing of available data, the interpreted control on mineralization, the style and geometry of the mineralization as well as geological logging and additional information recorded from the drill holes. TSFs are man-made engineering features which was considered in the estimation process. Mineral Resources were estimated for all the TSFs, and the estimation procedures are similar in approach for all the TSFs. However, each TSF is treated as a separate entity/domain as each has differences due to location, data distribution and characteristic of the material. Estimation procedures and parameters are given individually per TSF. All tailings material is above the current land surface and continuity of grade within the TSFs is defined based on +/- 100m drill hole spacing. The tailings material has been processed through a metallurgical treatment plant that ejects a waste residue that is relatively uniform when compared with the natural deposit from which the material is derived. The variation between samples in drill hole is small (0.1g/t to 1.0g/t) in comparison to in situ gold deposits. However, the percentage difference may be huge as is the case with trace elements. Datamine’s Studio RM was utilized for geological modeling, geo-statistical analysis, and mineral resource estimation. Most of the statistical and geostatistical study was completed using SAS JMP Pro and the RStudio, an open-source integrated development environment for “R”, a programming language for advanced statistical computing and graphics. Mineral Resource estimates are not Mineral Reserves and do not have demonstrated economic viability. There is no certainty that all or any part of the Mineral Resource will be converted into a Mineral Reserve. The Mineral Resource estimates for all the TSFs are declared as follows:  The TSFs themselves are the reference points;  no geological or other losses were applied as all material is accessible and there were no geological structures observed;  Mineral Resource estimates are stated as both inclusive and exclusive of Mineral Reserves as defined in Subpart 1300 of Regulation S-K; and  the Mineral Resource is 100% attributable to Ergo. DRDGOLD, the registrant, owns 100% of Ergo, thus the Mineral Resource is 100% attributable to the registrant. Item 11.1 to Item 11.9 present the methodology followed a similar methodology for all the TSFs. Item 11.10 to Item 11.15 provides details for each complex or TSF. The 26 smaller TSFs and clean-up material contribute about 11% of the total Mineral Resource estimates by tonnage. The other 12 smaller TSFs were excluded from the Mineral Resource statement as the QP conducted a study and determined that the 12 smaller TSFs have no reasonable prospects for economic extraction. The Mineral Resource estimates in these 26 smaller dumps pose a less than material risk to Ergo as less than 2% of the smaller TSF Mineral Resources makes it to the Life of Mine (LoM) plan. The majority of the small TSF Mineral Resources was estimated from survey information, production and/or historical data, applying straight arithmetic ERGO’S TECHNICAL REPORT SUMMARY OF THE MATERIAL TAILINGS STORAGE FACILITIES PAGE 67 67 averages as the TSFs or clean-up sites are too small to be evaluated by 3D modelling. The QP considered the inclusion of the smaller TSFs and clean-up operations as appropriate and has conducted verification checks to support their inclusion. The Mineral Resource estimates of these TSFs and clean-up operations are not discussed individually but are part of the total Mineral Resource for Ergo. All material TSFs are included in the LoM plan and have been converted into Mineral Reserves, thus the exclusive Mineral Resource tables in this Chapter are empty (have zero tonnes) as at 30 June 2025. All the material TSFs included in this Report are slimes dams. No sand dump is included. The material changes in this chapter compared to the previously filed Technical Report Summary are:  Removal of the Daggafontein TSF (192Mt at 0.24g/t Au Indicated Mineral Resource and 21Mt at 0.24g/t Inferred Mineral Resource) from the Mineral Resource Statement as the TSF has been designated as a deposition site to support Life of the Mine plan and the QP concluded that the TSF has no reasonable prospect of economic extraction.  The QP removed the three TSFs from Grootvlei Complex (107.66Mt at 0.26g/t), following the lapse of the prospecting rights and as common law ownership could not be secured.  The inclusion of two TSFs has been made. A new TSF, 4L39, containing 7.5Mt at 0.28 g/t Au Indicated Mineral Resource, was added to the Mineral Resource Statement; this TSF was previously owned by a third party and was purchased by Ergo in 2025. Additionally, a second TSF, 6L14 containing 6.98Mt at 0.36g/t Measured Mineral Resource, which has always been owned by Ergo, has been newly classified as a material property as at 30 June 2025. Only gold was estimated; no metal equivalent evaluations were performed. 11.1. Volume Modelling For all material TSFs, three-dimensional (3D) modelling was completed using drill hole information and survey data. Volumes were estimated using a top surface defined by a ground survey and associated digital terrain model. The bases of the TSFs were defined by the drill hole data and the edges of the TSFs. All drill holes, where possible, were drilled to intersect soil at the base of the TSFs. The block models were constructed inside of this volume. Tonnages and grades were then extracted from the block models. The QP excluded drill holes that were terminated prematurely before intersecting the TSF bases from the floor definitions. To further validate and improve the floor or volume definition, a team made up of the QP (Mineral Resources), Ergo’s Mineral Resources Manager and the qualified surveyor from Geografix conducts internal peer review process and validates the volumes for the TSFs. The QP takes ownership of the process and signs off the floors. This process commenced in the FY2024 and it is now the standard operating procedure at Ergo. The QP of Mineral Resources regards this approach as the best practice. 11.2. Bulk Dry Density An average dry bulk density of 1.42t/m3 described in Item 7.15 was applied to all the TSFs. The tonnes were reported as dry tonnes. 11.3. Exploratory Data Analysis ERGO’S TECHNICAL REPORT SUMMARY OF THE MATERIAL TAILINGS STORAGE FACILITIES PAGE 68 68 All drillholes, including the ones that did not intersect the base, were used in the estimation process. Only holes that were excluded are holes not surveyed (only two holes from the Crown Complex were excluded). Exploratory data analysis was done on raw and composited gold data. Samples were collected at 1.5m intervals. For OK or IDW estimation method, the sample lengths were adequate. The samples were composited to 6m to allow for NN estimation as the modelled blocks were 6m high to represent the TSF bench height. Samples were composited based on the mean sea level to mimic deposition. This allowed for estimations to be carried out based on the levels. The requirement for high-grade capping was assessed to ascertain the reliability and spatial clustering of the high- grade data. The steps completed as part of the high-grade capping assessment are summarized below:  review of the data to identify any data that deviates from the general data distribution. This was completed using histograms and log probability plots;  review of plots comparing the contribution to the mean and standard deviation of the highest-grade data; and  visual review in 3D to allow assessment of the clustering of the higher-grade data. The QP decided whether to apply capping or no capping to the gold grades for all the TSFs, based on the considerations outlined above. 11.4. Estimation Techniques The estimation was constrained by mineralization interpretations. The statistical characteristics of the available sample information and the spatial distribution aided the definition of the estimation parameters, such as search volume and orientation of the search ellipses. The IDW (to the power of 2) and NN method of estimation were chosen as the most appropriate methods for evaluation of TSFs, as the dataset for each TSF is generally homogeneous (laterally), grade variations are small due to deposition technique and the drill holes are well spread and spacing is moderately wide. The methods, when applied appropriately, retain the grade variation of the deposit, as opposed to an arithmetic average, and is simpler and more appropriate for TSF evaluation. Ordinary Kriging was used only where the variogram could be modeled, resulting in fewer TSFs having OK estimates. These estimation techniques have been found to be reliable by Ergo over the last 15 to 20 years of mining and processing TSFs. Hard domain boundaries were used throughout, preventing samples lying outside the domain from being used for the estimation, meaning slime and soil samples were separated during the estimation process. A three-pass estimation strategy was applied to each zone, applying an expanded and less restrictive sample search to the second and subsequent estimation passes and only considering blocks not previously assigned an estimate. However, more than 80% of the estimates were completed in the first pass. A record was kept of the number of samples used to estimate the grade into a block. The variance of each block and the search volume that satisfied the criteria used to select samples for use in the estimation of each block. 11.5. Modelling and Estimation Parameters The parent block size for all the TSFs was largely based on the average drill spacing and sample compositing interval. The height of the original dump benches is approximately 5m to 6m. The parent block size is selected to estimate the deposit approximates half the drill hole spacing and maps the bench height. Sub-blocking was allowed for a good volume definition.
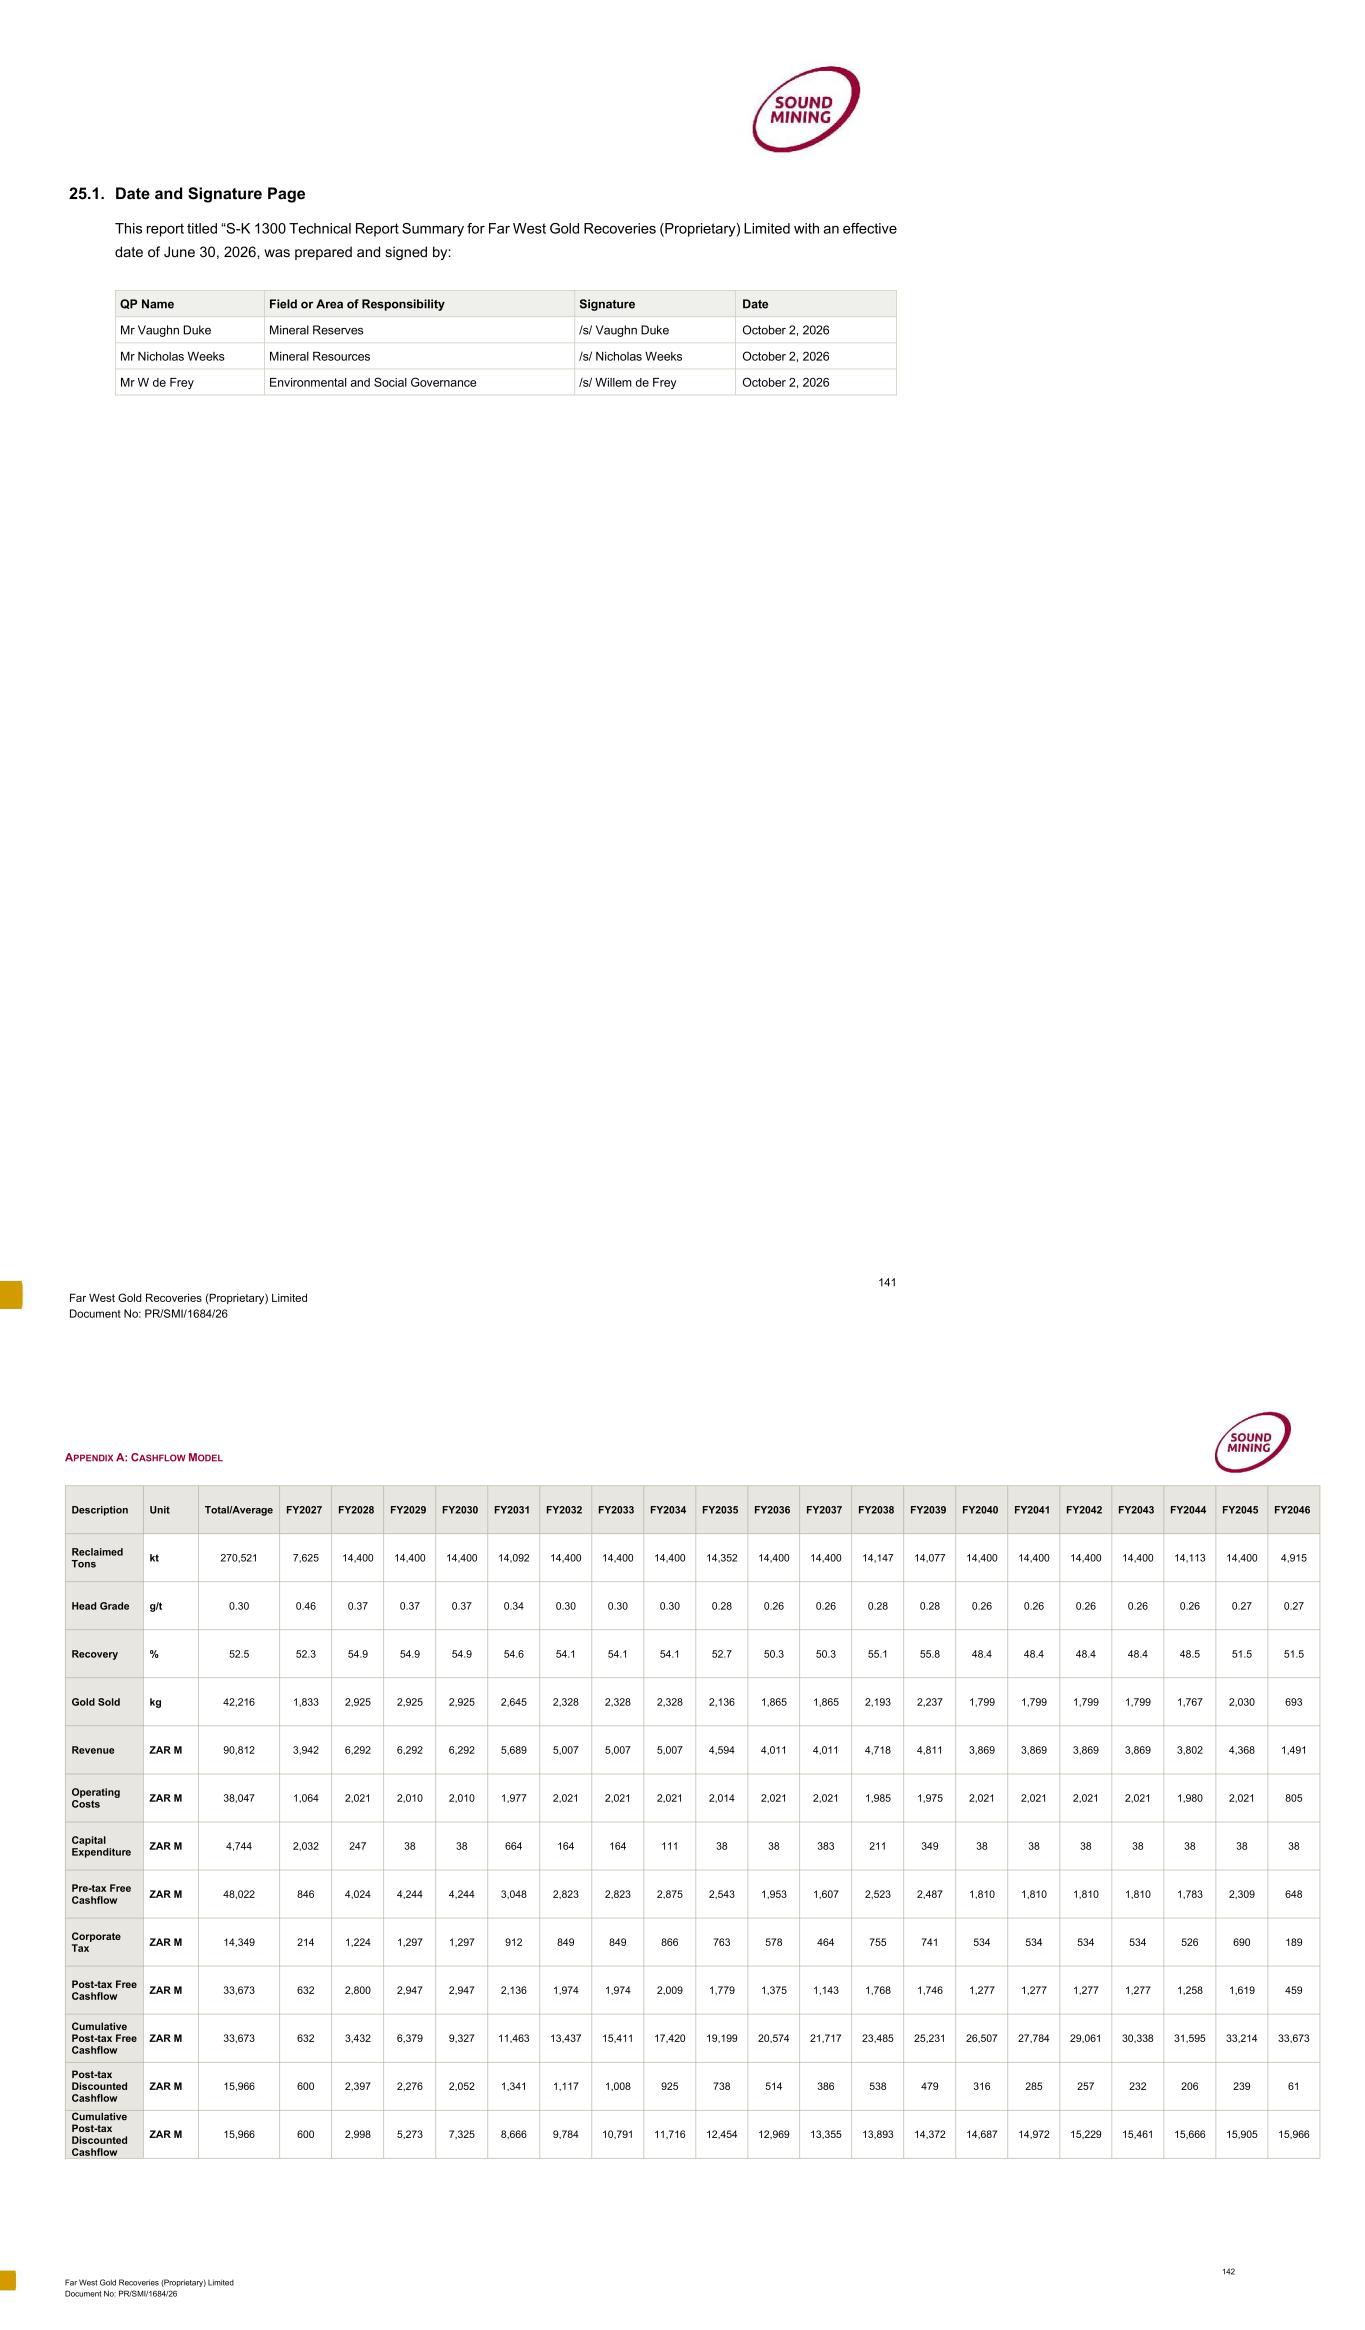

 
ERGO’S TECHNICAL REPORT SUMMARY OF THE MATERIAL TAILINGS STORAGE FACILITIES PAGE 69 69 11.6. Model Validation A routine validation process was followed for all the TSFs. All relevant statistical information was recorded to enable validation and review of the estimates. The recorded information included:  the number of samples used per block estimate;  average distance to a sample per block estimate;  estimation flag to determine in which estimation pass a block was estimated; and  the number of drill holes from which composite data were used to complete the block estimate. The estimates were reviewed visually and statistically prior to being accepted. The review included the following activities:  comparison of volume estimates between the block model, the 3D wireframe model and the surveyor's report;  check for global bias through comparison of the estimate versus the mean of the composite dataset, including weighting where appropriate to account for data clustering;  histogram comparison of grade block distribution versus composite grade distribution;  visual checks of cross-sections, long-sections and plans; and  where production data was available, reconciliation was carried out as part of the model validation process. Alternative estimates were also completed to test the sensitivity of the reported model to the selected interpolation parameters. An insignificant amount of variation in overall grade was noted in the alternate estimations. The results were satisfactory for the level of accuracy anticipated for TSF evaluation. 11.7. Technical and Financial Parameters In determining the cut-off grades of Mineral Resources, the QP applied the data presented in Table 18. The QP considered the gold price, exchange rate and working cost per tonne (long-term prices as at 30 June 2025), as applied reasonable for use in declaring Mineral Resources. Justification for the financial parameters including the gold price used is detailed in Item 16.2. Additional technical parameters per TSF are presented in the relevant items. The QP considered both technical and financial parameters (infrastructure, mine design and planning, processing plant, environmental compliance and permitting) to justify the reasonable prospects for economic extraction. All TSFs have studies done to a PFS level of accuracy (i.e., +/- 25%) to confirm the properties have reasonable prospects for economic extraction. All the material TSFs are included in the LoM plan. Table 18: Financial and Technical Data considered for Mineral Resource Element Unit Value Mineral Resource Gold Price USD/oz 2,982 Mineral Resource Gold Price ZAR/kg 1,689,997 Exchange Projection ZAR/USD 17.63 Working Costs per Tonne ZAR/t 139 The QP has considered that Ergo does not selectively mine a TSF. The average grade of the TSF is used to determine whether or not a TSF is mined in its entirety. Where the average grade of the TSF is above the cut-off grade, all the material in the TSF is considered for mining. The QP applied no individual block cut-off. ERGO’S TECHNICAL REPORT SUMMARY OF THE MATERIAL TAILINGS STORAGE FACILITIES PAGE 70 70 A cut-off grade is also determined per Complex. A TSF may report an average gold grade below a cut-off grade, but when included in a complex, the total complex should be above the cut-off grade. See Table 19 for the cut-off information. The QP determined cut-off grades using the formula presented in Item 12.2. Table 19: Mineral Resource Estimate Cut-off Grades TSF Au Head Grade Recovery Factor Cut-off Grade (g/t) (%) (g/t) Crown Complex 3L8 (GMTS) 0.24 36.8 0.22 3L7 (Mooifontein) 0.23 42.1 0.20 3L5 (Diepkloof) 0.23 42.1 0.20 City Deep Complex 4L3 0.32 48.3 0.17 4L4 0.37 50.8 0.16 4L6 0.32 55.6 0.15 Knights Complex 4L14 0.29 53.1 0.15 4L39 0.28 29.9 0.27 Ergo Complex Rooikraal 0.26 33.5 0.25 7L15 0.34 37.5 0.22 Marievale Complex 7L4 0.29 51.5 0.16 7L5 0.29 32.1 0.26 7L6 0.26 40.7 0.20 7L7 0.32 33.3 0.25 6L14 6L14 0.36 46.4 0.18 The following statements apply to all Mineral Resources tables:  Mineral Resources are not Mineral Reserves;  Mineral Resources are reported inclusive and exclusive of Mineral Reserves;  Mineral Resources have been reported in accordance with Subpart 1300 of Regulation S-K;  Mineral Resources were estimated using the $2,982/oz, ZAR17.63/USD and ZAR1,689,997/kg financial parameters;  the recovery information is presented in Table 17;  the reference point is physical TSFs themselves (in situ);  a troy ounce = 31.1034768g; and  quantities and grades were rounded to reflect the accuracy of the estimates; any apparent errors are insignificant. 11.8. Assessment of the Reasonable Prospects for Economic Extraction All the material TSFs reported in this Technical Report Summary are included in the LoM plan and have undergone evaluation at the Pre-Feasibility Study (PFS) level (see Items 18 to 19 of this Report). The QP confirms that these TSFs demonstrate reasonable prospects for economic extraction (RPEE), and the related estimates satisfy the criteria to be classified as Mineral Resources as defined in Subpart 1300 of Regulation S-K. 11.9. Uncertainties and Classification Criteria Definitions for Mineral Resource categories used in this report are those defined by the Security and Exchange Commission in Subpart 1300 of Regulation S-K. Mineral Resource Estimates are classified to reflect the increased level of geological confidence into Inferred, Indicated and Measured Mineral Resource categories. ERGO’S TECHNICAL REPORT SUMMARY OF THE MATERIAL TAILINGS STORAGE FACILITIES PAGE 71 71 By their nature, all Mineral Resource estimates carry an inherent amount of risk and uncertainty depending on various factors, including interpretation of data, drilling data quality, uncertainty in the survey and metallurgical test work data collected and the modelling process. However, Ergo has been in operation for more than 15 years treating TSFs and sand dumps and has sufficiently mitigated Mineral Resource risks through obtaining sufficient sampling information. Some uncertainties were resolved through reconciliations, process improvement and the use of experienced personnel in data collection and interpretation. The QP based the Mineral Resource categorization on the robustness of the various data sources available, the confidence of the geological interpretation and various estimation parameters (e.g., distance to data, number of data, maximum search radii etc.) and reconciliation data where it is available. The QP considers the Mineral Resource classification as a function of the confidence of the whole process from drilling, sampling, geological understanding and variables relationships. TSFs are evaluated individually and there are no blanket classification parameters as TSFs are different. However, drill hole spacing and data quality contribute significantly to the classification confidence. Each TSF has its classification criteria discussed separately. Mineral Resource confidence was assessed via internal peer reviews, with no material issues identified. Mineral Resources have reasonable prospects for economic extraction and the QP considered a range of mining, processing, infrastructural, social, environmental and permitting factors. 11.10. Crown Complex Infill drilling was conducted at Crown Complex in March 2025, primarily to confirm the recoveries. The data was also used to define the TSF floors and grades. The QP noted no material changes in volumes and grades, the variance between previously reported tonnages and average grades for the TSFs was <1%. The QP interpreted this to mean the declared Mineral Resource is robust. The QP maintained the classification Indicated unchanged as the QP deemed the drillhole spacing too wide to support an upgrade to the Measured category. Sub-sections below summarize the evaluation procedure followed, with new data included. 11.10.1. Exploratory Data Analysis Statistical analysis of data was completed on raw data. Data was analyzed as raw, capped and composites. There was no material changed between the data sets. The data sets show positively skewed distribution. Based on the high-grade cap investigations, high-grade caps were selected and applied to the raw dataset:  3L7 (Mooifontein): gold grades were capped at 0.40g/t, which is 95% percentile of data;  3L8 (GMTS): gold grades were capped at 0.50g/t after studying probability plot; and  3L5 (Diepkloof): two domains (compartments) were modelled and gold grades were also capped at 0.50g/t based on data distribution. Capping was only applied to raw data and the impact on the means was deemed immaterial. 11.10.1.1. Mooifontein Grade distribution for Mooinfontein is shown in Figure 16 to Figure 18. Table 20 summarizes the basic statistics for Mooifontein. ERGO’S TECHNICAL REPORT SUMMARY OF THE MATERIAL TAILINGS STORAGE FACILITIES PAGE 72 72 Figure 16: 3L7 (Mooifontein): Distribution of Raw Gold Capped Data Figure 17: 3L7 (Mooifontein): Distribution of Capped Gold Data



 
ERGO’S TECHNICAL REPORT SUMMARY OF THE MATERIAL TAILINGS STORAGE FACILITIES PAGE 73 73 Table 20: Mooifontein: Basic Statistics Parameter Raw Au Capped Au Number of Samples* 681 681 Average Au (g/t)** 0.245 0.242 Minimum Au (g/t) 0.050 0.050 Maximum Au (g/t) 0.790 0.400 Standard deviation 0.068 0.056 CoV 0.276 0.233 * All historical (pre 2016 holes) drill holes were excluded as the QP could not confirm their locations; thus fewer number of samples compared to the 2023 TRS. The decision did not change data distribution. **the statistic parameter is an arithmetic average (basic statistics). Variogram Variography was performed to evaluate spatial autocorrelation among the samples, as presented in Figure 18. The variogram could be modeled and was used in the estimation process to obtain krigged estimates. Figure 18: Mooifontein: Variography 11.10.1.2. GMTS Grade distribution for GMTS is presented in Figure 19 to Figure 21. Table 21 summarizes basic statistics of GMTS. ERGO’S TECHNICAL REPORT SUMMARY OF THE MATERIAL TAILINGS STORAGE FACILITIES PAGE 74 74 Figure 19: GMTS: Distribution of Raw Gold Capped Data Figure 20: GMTS: Distribution of Capped Gold Data ERGO’S TECHNICAL REPORT SUMMARY OF THE MATERIAL TAILINGS STORAGE FACILITIES PAGE 75 75 Table 21: GMTS Basic Statistics Parameter Raw Au Capped Au Number of Samples* 1091 1091 Average Au (g/t)** 0.246 0.245 Minimum Au (g/t) 0.001 0.001 Maximum Au (g/t) 1.050 0.500 Standard deviation 0.075 0.067 *All historical (pre 2016 holes) drill holes were excluded as the QP could not confirm their locations; thus fewer number of samples compared to the 2023 TRS. The decision did not change data distribution. **the statistic parameter is an arithmetic average (basic statistics). Variography The variography study was conducted, but the QP was unable to identify a robust variogram for modeling. Inverse distance weighting method was used in the estimation process. 11.10.1.3. Diepkloof Grade distribution for Diepkloof is presented in Figure 21 to Figure 23. Figure 21: Diepkloof: Distribution of Raw Gold Capped Data ERGO’S TECHNICAL REPORT SUMMARY OF THE MATERIAL TAILINGS STORAGE FACILITIES PAGE 76 76 Figure 22: 3L5 (Diepkloof): Distribution of Capped Gold Data Table 22: Diepkloof: Basic Statistics Parameter Raw Au Capped Au Number of Sample*s 512 512 Average Au (g/t)** 0.262 0.254 Minimum Au (g/t) 0.125 0.125 Maximum Au (g/t) 3.465 0.500 Standard deviation 0.160 0.067 CoV 0.613 0.263 *no historical drill hole was included due to location issues. **the statistic parameter is an arithmetic average. Variography Variography was performed to evaluate spatial autocorrelation among the samples. A variogram was modeled as presented in Figure 23.


ERGO’S TECHNICAL REPORT SUMMARY OF THE MATERIAL TAILINGS STORAGE FACILITIES PAGE 77 77 Figure 23: Diepkloof: Distribution of Raw Gold Capped Data 11.10.2. Modelling and Estimation Parameters Half the drill hole spacing was chosen as the block size. Block size of 100m-by-100m-by-6m was chosen for the TSFs. Sub-celling was allowed for better volume definition. The OK and IDW estimation methods were utilized. The sample search parameters are supplied in Table 23. Table 23: Search Parameters: OK and Inverse Distance Estimation Methods TSF Domain Estimation Pass Search Distance Minimum Number of Composites Maximum Number of Composites X (m) Y (m) Z (m) 3L7 (Mooifontein) Mooifontein 1 300 300 6 5 20 2 600 600 12 5 20 3 900 900 18 5 20 3L8 (GMTS) GMTS 1 400 400 10 4 10 2 800 800 20 4 10 3 1,200 1,200 30 4 10 3L5 (Diepkloof) Homestead 1 400 400 10 4 10 2 800 800 20 4 10 3 1,200 1,200 30 4 10 Diepkloof 1 400 400 10 4 10 2 800 800 20 4 10 3 1,200 1,200 30 4 10 ERGO’S TECHNICAL REPORT SUMMARY OF THE MATERIAL TAILINGS STORAGE FACILITIES PAGE 78 78 11.10.3. Technical and Economic Factors Item 13 to Item 19 were considered in declaring the Mineral Resource estimates. The TSFs are included in the LoM plan. The technical and economic studies were done at a PFS level of accuracy. The QP concluded that there are reasonable prospects for economic extraction. 11.10.4. Mineral Resource Classification Criteria A list of the criteria used to classify Mineral Resources is given in Table 24. Applying these confidence levels, Mineral Resource classification codes were assigned to the block model. A low confidence in one of the listed items will mean classification is downgraded to Inferred Mineral Resources, a moderate confidence in at least one item will mean a property is Indicated Mineral Resource while all highs mean the property is in the Measured Mineral Resource category. Table 24: Confidence Levels for Key Criteria for Mineral Resource Classification Items Discussion Confidence Drilling Techniques RC/aircore drilling technique to international standards High Logging Detailed logging throughout High Drill Sample Recovery The sample recovery was considered satisfactory and was acceptable for mineral resource estimation High Sub-sampling Techniques and Sample Preparation Material has previously been processed and quartering was applied High Quality of Assay Data Available data is of robust quality however there is a relatively high variability in the lowest grade assays High Verification of Sampling and Assaying A comprehensive QC program implemented during exploration High Location of Sampling Points Survey of all collars and TSFs surfaces High Data Density and Distribution Data points were well spread, though widely spaced. Approximately 150m to 200m spacing was followed Moderate Database Integrity Errors identified and rectified High Geological Interpretation Geometry is known accurately High Bulk Density A mean density of 1.42t/m3 was considered reasonable High Mineralization Type Mineralization is well known from processing High Estimation and Modelling Techniques Estimation techniques used are considered suitable for the projects High The drill hole spacing was approximately 150m to 200m on all the TSFs. With this grid, the grade, floor elevation and TSF geometry were estimated with sufficient confidence to allow the application of modifying factors in sufficient detail to support mine planning and evaluation of the economic viability of the TSFs. All TSFs were classified as Indicated Mineral Resources. No Measured Mineral Resource was declared as the drill space is too wide to conclusively define grade continuity and volume. No Inferred Mineral Resource was declared as drilling provided sufficient information for an Indicated Mineral Resource. The data or supporting information is derived from the adequately detailed and reliable exploration, sampling and testing and is sufficient to assume geological and grade or quality continuity between points of observation. 11.10.5. Mineral Resource Statement The inclusive and exclusive Mineral Resource estimates for the Crown Complex are presented in Table 25 and Table 26 respectively. The three TSFs from Crown Complex are included in the LoM plan and converted into Mineral Reserves, thus there were no exclusive Mineral Resources as at 30 June 2025. Table 25: Crown Complex Mineral Resource Estimate (Inclusive) TSF Mineral Resources as at 30 June 2024 (Inclusive) Mineral Resources as at 30 June 2025 (Inclusive) ERGO’S TECHNICAL REPORT SUMMARY OF THE MATERIAL TAILINGS STORAGE FACILITIES PAGE 79 79 Mineral Resource Category Tonnes (kt) Au (g/t) Content (oz) Tonnes (kt) Au (g/t) Content (oz) Measured Mineral Resources - - - - - - 3L5 (Diepkloof) Indicated 97 174 0.23 724 818 96 574 0.23 720 344 3L7 (Mooifontein) Indicated 67 556 0.23 501 726 67 486 0.23 501 209 3L8 (GMTS) Indicated 107 226 0.24 820 480 107 896 0.24 825 607 Sub-total Indicated Mineral Resources 271 956 0.23 2 047 024 271 956 0.23 2 047 160 Sub-total Measured and Indicated Mineral Resources 271 956 0.23 2 047 024 271 956 0.23 2 047 160 Inferred Mineral Resources - - - - - - Total Mineral Resource 271 956 0.23 2 047 024 271 956 0.23 2 047 160 Table 26: Crown Complex Mineral Resource Estimate (Exclusive) TSF Mineral Resource Category Mineral Resources as at 30 June 2024 (Exclusive) Mineral Resources as at 30 June 2025 (Exclusive) Tonnes (kt) Au (g/t) Content (oz) Tonnes (kt) Au (g/t) Content (oz) Measured Mineral Resources - - - - - - 3L5 (Diepkloof) Indicated 97 174 0.23 724 818 - - - 3L7 (Mooifontein) Indicated 67 556 0.23 501 726 - - - 3L8 (GMTS) Indicated 107 226 0.24 820 480 - - - Sub-total Indicated Mineral Resources 271 956 0.23 2 047 024 - - - Sub-total Measured and Indicated Mineral Resources 271 956 0.23 2 047 024 - - - Inferred Mineral Resources - - - - - - Total Mineral Resource 271 956 0.23 2 047 024 - - - 11.10.6. Mineral Resource Changes There was no material change in Mineral Resource, except that all the TSFs are included in the LoM plan. The minor change in the Mineral Resource was due to infill drilling and better floor definition. 11.10.7. Mineral Resource Risks and Uncertainty The application to renew the Mining Right was launched in 2014 and Ergo has since been constantly engaging with the DMPR. This report has considered section 24(5) of the MPRDA, as amended; as quoted below: “A mining right in respect of which an application for renewal has been lodged shall despite its expiry date remain in force until such time as such application has been granted or refused.” The QP classified the overall Mineral Resource risk as medium due to the lower grades of the Crown Complex. In the opinion of the QP, no further technical work is required as the drilling program provided sufficient data to define grade and tonnage. 11.11. City Deep Complex 11.11.1. Exploratory Data Analysis Figure 24 to Figure 29 show the frequency distributions of the gold grades on 4L3, 4L4 and 4L6. Data was analyzed as raw, capped and composites. There was no material change between the data sets. The data sets show a positively skewed distribution. ERGO’S TECHNICAL REPORT SUMMARY OF THE MATERIAL TAILINGS STORAGE FACILITIES PAGE 80 80  Based on the high-grade cap investigations, high-grade caps were selected and applied to the raw dataset. A little/insignificant reduction in the available metal is noted.  4L3: capped at 0.65g/t Au;  4L4: capped at 0.65g/t Au; and  4L6: capped at 0.50g/t Au. Figure 24: 4L3: Distribution of Raw Gold Capped Data


ERGO’S TECHNICAL REPORT SUMMARY OF THE MATERIAL TAILINGS STORAGE FACILITIES PAGE 81 81 Figure 25: 4L3: Distribution of Composited Gold Data Figure 26: 4L4: Distribution of Raw Gold Capped Data ERGO’S TECHNICAL REPORT SUMMARY OF THE MATERIAL TAILINGS STORAGE FACILITIES PAGE 82 82 Figure 27: 4L4: Distribution of Composited Gold Data Figure 28: 4L6: Distribution of Raw Gold Capped Data ERGO’S TECHNICAL REPORT SUMMARY OF THE MATERIAL TAILINGS STORAGE FACILITIES PAGE 83 83 Figure 29: 4L6: Distribution of Composited Gold Data 11.11.2. Modelling and Estimation Parameters A block model with 100m-by-100m blocks was constructed for 4L3, 4L4 and 4L6 inside the respective volumes. Tonnages and grades were estimated into the block model. The parent block sizes selected to estimate the deposit approximates the drill hole spacing. The tailings bench heights are 5m to 8m high. The QP selected 6m in the Z direction for the City Deep Complex to correspond with the average bench height. The IDW (2) estimation method was utilized. The sample search parameters are supplied in the Table 27. Table 27: Search Parameters: Inverse Distance Estimation Method TSF Estimation Pass Search Distance Minimum Number of Composites Maximum Number of Composites X (m) Y (m) Z (m) 4L3, 4L4, 4L6 1 400 400 10 4 10 2 800 800 20 4 10 3 1,200 1,200 30 4 10 11.11.3. Technical and Economic Factors Item 13 to Item 19 were considered in declaring the Mineral Resource estimates. The TSFs are included in the LoM plan. The QP concluded that there are reasonable prospects for economic extraction. 11.11.4. Mineral Resource Classification Criteria An additional list of the criteria used by the QP to classify the Mineral Resource estimates in addition to the statistical parameters is given in Table 28. Applying these confidence levels, Mineral Resource classification codes were assigned to the block model. A low confidence in one of the listed items will mean classification is downgraded to ERGO’S TECHNICAL REPORT SUMMARY OF THE MATERIAL TAILINGS STORAGE FACILITIES PAGE 84 84 Inferred, a moderate confidence in at least one item will mean a property is Indicated while all highs mean the property is in the Measured Mineral Resource category. Table 28: Confidence Levels of Key Criteria for Classification of the TSFs Mineral Resources Items Discussion Confidence Drilling Techniques Auger to industry standards High Logging Detailed logging throughout High Drill Sample Recovery The sample recovery is estimated as >90% and was considered acceptable for Mineral Resource estimation High Sub-sampling Techniques and Sample Preparation Material has previously been processed and was submitted directly for sampling High Quality of Assay Data Available data is of robust quality High Verification of Sampling and Assaying A comprehensive QC program was implemented High Location of Sampling Points Survey of all collars and TSF surfaces High Data Density and Distribution Data points are well distributed and provide sufficient information High Geological Interpretation Geometry is known accurately High Mineralization Type Mineralization is well known from processing High Estimation and Modelling Techniques Inverse distance used for resource declaration. NN used for validation High The QP classified the Mineral Resources into the Measured Mineral Resource Category as the drill hole spacing was tight enough (approximately 100m apart) to provide sufficient evidence of grade continuity and estimate tonnes with high confidence. No Indicated and Inferred Mineral Resources were declared.


ERGO’S TECHNICAL REPORT SUMMARY OF THE MATERIAL TAILINGS STORAGE FACILITIES PAGE 85 85 11.11.5. Mineral Resource Statement Table 29 to Table 30 present Mineral Resources for 4L3, 4L4 and 4L6 as at 30 June 2025. There were no exclusive Mineral Resources for the three TSFs as all have been converted to Mineral Reserves. Table 29: City Deep Complex Mineral Resource Estimates (Inclusive) TSF Mineral Resource Category Mineral Resources as at 30 June 2024 (Inclusive) Mineral Resources as at 30 June 2025 (Inclusive) Tonnes (kt) Au (g/t) Content (oz) Tonnes (kt) Au (g/t) Content (oz) 4L3 Measured 11,855 0.32 121,969 8,127 0.32 83,613 4L4 Measured 2,410 0.37 28,665 2,198 0.37 26,145 4L6 Measured 4,738 0.32 48,741 4,738 0.32 48,741 Sub-total Measured Mineral Resources 19,003 0.33 199,375 15,063 0.33 158,499 Indicated Mineral Resources - - - - - - Sub-total Measured and Indicated Mineral Resources 19,003 0.33 199,375 15,063 0.33 158,499 Inferred Mineral Resources - - - - - - Total Mineral Resource 19,003 0.33 199,375 15,063 0.33 158,499 Table 30: City Deep Complex Mineral Resource Estimates (Exclusive) TSF Mineral Resource Category Mineral Resources as at 30 June 2024 (Exclusive) Mineral Resources as at 30 June 2025 (Exclusive) Tonnes (kt) Au (g/t) Content (oz) Tonnes (kt) Au (g/t) Content (oz) 4L3 Measured - - - - - - 4L4 Measured - - - - - - 4L6 Measured - - - - - - Sub-total Measured Mineral Resources - - - - - - Indicated Mineral Resources - - - - - - Sub-total Measured and Indicated Mineral Resources - - - - - - Inferred Mineral Resources - - - - - - Total Mineral Resource - - - - - - 11.11.6. Mineral Resource Changes There was no material change in Mineral Resources as only mining depletion was applied. 11.11.7. Mineral Resource Risks and Uncertainty The QP’s opinion is that the overall grade and tonnage estimates are reasonable for mine planning based on the drill hole data and assay statistics. The gold price fluctuations present the main risk to the declared Mineral Resource estimates. Risks of grade, continuity of mineralization and tonnes were mitigated through the reasonable drilling space, validation procedures, metallurgical testing, advanced statistical analyses and the use of robust modelling techniques. The QP classified the overall Mineral Resource risk as low. In the opinion of the QP, no further technical work is required as the drilling program provided enough data to define continuity. 11.12. Knights Complex 11.12.1. Exploratory Data Analysis ERGO’S TECHNICAL REPORT SUMMARY OF THE MATERIAL TAILINGS STORAGE FACILITIES PAGE 86 86 11.12.1.1. 4L14 TSF Statistics of the sample population from raw, capped and composited data are given in Figure 30 to Figure 37. At 4L14, both slime and soil were mineralized with soil having a maximum grade of 1.96g/t Au. The spread of both the slimes and soil data is not large which indicates that the grade variability is low. The gold grades for soil were capped at 0.94g/t to reduce the over-estimation of soil gold resources. Capping reduced the mean by about 10%; however, this is due to lack of data rather than a large volume of high-grade material. The slimes grades were composited into 6m intervals. The soil domain was not composited as there was not enough data. The 6m composites were based on numerous statistical tests and bench height. The bench height is 5m to 6m high. Figure 30: 4L14: Distribution of Slime Raw Data ERGO’S TECHNICAL REPORT SUMMARY OF THE MATERIAL TAILINGS STORAGE FACILITIES PAGE 87 87 Figure 31: 4L14: Log Distribution of Slime Raw Data Figure 32: 4L14: Distribution of Slime 6m Composited Data ERGO’S TECHNICAL REPORT SUMMARY OF THE MATERIAL TAILINGS STORAGE FACILITIES PAGE 88 88 Figure 33: 4L14: Log Distribution of Slime 6m Composited Data Figure 34: 4L14: Distribution of Soil Raw Data


ERGO’S TECHNICAL REPORT SUMMARY OF THE MATERIAL TAILINGS STORAGE FACILITIES PAGE 89 89 Figure 35: 4L14: Log Distribution of Soil Raw Data Figure 36: 4L14: Distribution of Soil Raw Capped Data ERGO’S TECHNICAL REPORT SUMMARY OF THE MATERIAL TAILINGS STORAGE FACILITIES PAGE 90 90 Figure 37: 4L14: Log Distribution of Soil Raw Capped Data 11.12.1.2. 4L39 TSF Figure 38 presents basic statistics for 4L39. The layer of municipal/industrial waste on top of the TSF was modeled. This was done so the volume of waste could be removed from the total volume of the TSF. Samples were collected at 1.5m intervals. For the IDW estimation method, the sample lengths were adequate. The samples were further composited to 3m to allow for NN estimation, as the modelled blocks were 3m high to represent a multiple of bench height. No data capping was performed as the QP deemed it unnecessary. ERGO’S TECHNICAL REPORT SUMMARY OF THE MATERIAL TAILINGS STORAGE FACILITIES PAGE 91 91 Figure 38: Histogram 4L39 TSF Figure 39: Log Histogram for 4L39 TSF ERGO’S TECHNICAL REPORT SUMMARY OF THE MATERIAL TAILINGS STORAGE FACILITIES PAGE 92 92 Figure 40: Log Probability for 4L39 TSF 11.12.2. Modelling and Estimation Parameters The parent block sizes for the TSFs were based on the average drill spacing and compositing interval. The height of the dump benches is around 5m to 6m. The parent block sizes selected to estimate the deposit approximates half the drill hole spacing. Sub-blocking was allowed for good volume definition. Soil was modelled as a separate domain for 4L14. Soil was modelled because it had high gold values, the QP attributed this high gold value to gold remobilization from the TSF. IDW (2) was Estimation Parameters for 4L14 and 4L39 are given in Table 31. Table 31: 4L14 and 4L39: Search Parameters: Inverse Distance Estimation Method Domain Estimation Pass Search Distance Minimum Number of Composites Maximum Number of Composites Maximum Number of Composites per Drill Hole X (m) Y (m) Z (m) Slime 1 500 500 12 5 10 2 2 1,000 1,000 24 5 10 2 3 1,500 1,500 36 5 10 2 Soil 1 500 500 12 5 10 2 2 1,000 1,000 24 5 10 2 3 1,500 1,500 36 5 10 2 A number of search parameters were tested; optimum parameters were chosen by the QP. 11.12.3. Technical and Economic Factors Item 13 to Item 19 were considered in declaring the Mineral Resource Estimates. The technical studies were done at a PFS level. As at 30 June 2025, there were mining activities on 4L14. No mining was taking place on 4L39.


ERGO’S TECHNICAL REPORT SUMMARY OF THE MATERIAL TAILINGS STORAGE FACILITIES PAGE 93 93 11.12.4. Mineral Resource Classification Criteria The 4L14 TSF was classified using a number of criteria including data density, estimation statistics and TSF knowledge and interpretation. A list of the criteria used to classify the Mineral Resources in addition to the statistical parameters, is given in Table 32 and Table 33. Applying these confidence levels, Mineral Resource classification codes were assigned to the block model. A low confidence in one of the listed items will mean classification is downgraded to an Inferred Mineral Resource, a moderate confidence in at least one item will mean a property is Indicated while all highs mean the property is in the Measured Mineral Resource category. Table 32: Confidence Levels of Key Criteria for Classification of the 4L14 TSF Mineral Resources Items Discussion Confidence Drilling Techniques Auger to international standards High Logging Detailed logging throughout High Drill Sample Recovery The sample recovery is estimated as >90% and is considered acceptable for Mineral Resource estimation High Sub-sampling Techniques and Sample Preparation Material has previously been processed and can be submitted directly for sampling High Quality of Assay Data Available data is of good quality High Verification of Sampling and Assaying A comprehensive QC program implemented during exploration High Location of Sampling Points Survey of all collars and TSFs surfaces High Data Density and Distribution Drilled with auger drill holes at 100m-by-100m High Database Integrity Errors identified and rectified High Geological Interpretation Geometry is known accurately High Mineralization Type Mineralization is well known from processing High Estimation and Modelling Techniques NN and Inverse Distance Squared High The TSF was classified as a Measured Mineral Resource due to a tight drill hole spacing of <100m and high data quality. This spacing enabled the QP to estimate tonnage and grade continuity with high confidence. Table 33: Confidence Levels of Key Criteria for Classification of the 4L39 TSF Mineral Resource Items Discussion Confidence Drilling Techniques Auger to international standards High Logging Detailed logging throughout High Drill Sample Recovery The sample recovery is estimated as >90% and is considered acceptable for Mineral Resource estimation High Sub-sampling Techniques and Sample Preparation Material has previously been processed and can be submitted directly for sampling High Quality of Assay Data Available data is of robust quality however there is a relatively high variability in the lowest grade assays Moderate Verification of Sampling and Assaying A comprehensive QC program implemented during exploration High Location of Sampling Points Survey of all collars and TSFs surfaces. Data points were well spread. No drilling in some areas due to access issues Moderate Data Density and Distribution Drilled with auger drill holes at 100m-by-100m High Database Integrity Errors identified and rectified High Geological Interpretation Geometry is known accurately High Mineralization Type Mineralization is well known from processing High Estimation and Modelling Techniques NN and Inverse Distance Squared High 4L39 was classified as Indicated Mineral Resource due to wide drilling spacing (100m to 150m) and some spots are not accessible for drilling. No Measured Mineral Resource is declared for 4L39. ERGO’S TECHNICAL REPORT SUMMARY OF THE MATERIAL TAILINGS STORAGE FACILITIES PAGE 94 94 11.12.5. Mineral Resource Statement Table 34 and Table 35 present the Mineral Resource for 4L14 and 4L39. There were no exclusive Mineral Resource as all have been converted into Mineral Reserves. A layer of municipal and industrial waste with a thickness of 4 to 5 m overlies the 4L39 TSF, representing an estimated volume of approximately 393,344 m3 to be removed prior to and/or during mining, as detailed in Item 13.5. Table 34: Knights Complex Mineral Resource Estimates (Inclusive) TSF Mineral Resource Category Mineral Resources as at 30 June 2024 (Inclusive) Mineral Resources as at 30 June 2025 (Inclusive) Tonnes (kt) Au (g/t) Content (oz) Tonnes (kt) Au (g/t) Content (oz) 4L14 Measured Mineral Resources 7,015 0.29 64,275 4,012 0.29 36,763 Sub-total Measured Mineral Resources 7,015 0.29 64,275 4,012 0.29 36,763 4L39 Indicated Mineral Resources - - - 7,500 0.28 68,240 Sub-total Measured and Indicated Mineral Resources 7,015 0.29 64,275 11,512 0.28 105,003 Inferred Mineral Resources - - - - - - Total Mineral Resource 7,015 0.29 64,275 11,512 0.28 105,003 Table 35: Knights Complex Mineral Resource Estimates (Exclusive) TSF Mineral Resource Category Mineral Resources as at 30 June 2024 (Exclusive) Mineral Resources as at 30 June 2025 (Exclusive) Tonnes (kt) Au (g/t) Content (oz) Tonnes (kt) Au (g/t) Content (oz) 4L14 - - - - - - - Sub-total Measured Mineral Resources - - - - - - 4L39 Indicated Mineral Resources - - - - - - Sub-total Measured and Indicated Mineral Resources - - - - - - Inferred Mineral Resources - - - - - - Total Mineral Resource - - - - - - 11.12.6. Mineral Resource Changes Mining on 4L14 TSF resulted in a depletion of the Mineral Resource. Depletion and reconciliation are detailed in Table 54. The modeled average gold grade correlated well with production data. Ergo obtained ownership of 4L39 in FY2025. No mining has taken place on 4L39 TSF. 11.12.7. Mineral Resource Risks and Uncertainty The QP’s opinion is that the overall grade and tonnage estimates are reasonable for planning based on the drill hole data and assay statistics. The gold price fluctuations present the main risk to the declared Mineral Resource estimates. Risks of grade, continuity of mineralization and tonnage were mitigated through the reasonable drilling spacing, validation procedures, metallurgical testing, advanced statistical analyses and the use of robust modelling techniques. The QP classified the overall Mineral Resource risk as low. In the opinion of the QP, no further technical work is required as the drilling program provided enough data to determine continuity. 11.13. Ergo Complex ERGO’S TECHNICAL REPORT SUMMARY OF THE MATERIAL TAILINGS STORAGE FACILITIES PAGE 95 95 11.13.1. Exploratory Data Analysis 11.13.1.1. Rooikraal Exploratory data analysis was done on raw and composited gold data (Figure 41 and Figure 42). The distribution of the raw and composite is symmetrical with similar coefficient of variation and a low standard deviation. Based on the high-grade cap investigations, the QP decided not to apply high-grade capping as no extreme values were noted. Figure 41: Rooikraal: Distribution of Raw Gold Data ERGO’S TECHNICAL REPORT SUMMARY OF THE MATERIAL TAILINGS STORAGE FACILITIES PAGE 96 96 Figure 42: Rooikraal: Log Distribution of Composited Gold Data 11.13.1.2. 7L15 A comprehensive study on the 2015 versus the 2016 to 2017 datasets was performed. The 2015 dataset has higher grades than the 2016 to 2017 dataset. The 2015 dataset reported an average gold grade of 0.40g/t and the 2016 to 2017 dataset has an average gold grade of 0.26g/t. A decision was made to re-drill three drill holes and compare the 2015 samples against the 2016 samples in the same horizon. The 2016 samples were split on-site into three subsamples and were sent to two different laboratories. One batch was sent to the local mine laboratory (MAED at Ergo plant) and two batches of same samples were sent to the Anglo Lab with completely different sample numbers to avoid the laboratory identifying that the samples were from the same drillholes. Data for the campaigns were analyzed for compatibility. Figure 43 shows the plot of the data distribution per campaign. The 2015 results reported higher values than other campaigns. The QP noted that 2016/2017 and 2023 data differences is minor and these datasets can be combined and used for modeling purposes. The QP decided not to include the 2015 dataset in the modelling purpose as data quality could not be ascertained. The MAED laboratory analyzing the 2016 samples is a new laboratory at the Ergo processing plant and not the old laboratory at the Crown processing plant, which analyzed the 2015 samples.


ERGO’S TECHNICAL REPORT SUMMARY OF THE MATERIAL TAILINGS STORAGE FACILITIES PAGE 97 97 Figure 43: Box Plots of the Data (red line represents a gold mean per mean) Domaining was completed based on physical location (compartments) and Exploratory Data Analysis. Statistical analysis was performed per domain. The TSF was partitioned into North and South domains (Figure 44). Figure 44: 7L15 TSF Domains ERGO’S TECHNICAL REPORT SUMMARY OF THE MATERIAL TAILINGS STORAGE FACILITIES PAGE 98 98 Exploratory Data Analysis The QP noted that there is no relationship between TSF thickness and gold values, however, the base has elevated gold grades compared to the rest of the TSF. The requirement for high-grade capping was assessed to ascertain the reliability and spatial clustering of the high- grade data. The steps completed as part of the high-grade capping assessment are summarized below:  review of the data to identify any data that deviates from the general data distribution. This was completed using histograms and log probability plots;  review of plots comparing the contribution to the mean and standard deviation of the highest-grade data; and  visual review in 3D to allow assessment of the clustering of the higher-grade data. Capping was applied for the South domain at 0.60g/t (Figure 46). No capping or cutting was applied for North domain (Figure 45). Datasets show that the distribution of gold grade is positively skewed. Figure 45: North Domain: Histogram and Probability Plots of the Raw Capped Data Figure 46: South Domain: Histogram and Probability Plots of the Raw Capped Data ERGO’S TECHNICAL REPORT SUMMARY OF THE MATERIAL TAILINGS STORAGE FACILITIES PAGE 99 99 Figure 47: South Domain: Histogram and Probability Plots of the Capped Data 11.13.2. Modelling and Estimation Parameters Rooikraal and 7L15 were evaluated using IDW (2) estimation method. Rooikraal The height of the original dump benches is approximately 5m to 6m. The parent block sizes selected to estimate the deposit approximates the drill hole spacing (at least a drill hole in a block) and maps the bench height. A number of search parameters were tested and optimum parameters were chosen by the QP. The sample search parameters are supplied in Table 36. Table 36: Rooikraal: Search Parameters: Inverse Distance Estimation Method Domain Estimation Pass Search Distance Minimum Number of Samples Maximum Number of Samples Maximum Number of Samples per Drill Hole X (m) Y (m) Z (m) Rooikraal 1 600 600 12 6 18 5 2 1,200 1,200 24 6 18 5 3 1,800 1,800 36 6 18 5 7L15 The parent block sizes for the 7L15 TSFs were based on the average drill spacing and compositing interval. The parent block sizes selected to estimate the deposit approximate half the drill hole spacing. Sub-blocking was allowed for good volume definition. The search parameters are presented in Table 37. Table 37: 7L15: Search Parameters: Inverse Distance Estimation Method Domain Estimation Pass Search Distance Minimum Number of Composites Maximum Number of Composites Maximum Number of Composites per Drill Hole X (m) Y (m) Z (m) North 1 400 400 6 2 5 - 2 800 800 12 2 5 - 3 1,200 1,200 24 2 5 - South 1 400 400 6 2 5 - 2 800 800 12 2 5 - ERGO’S TECHNICAL REPORT SUMMARY OF THE MATERIAL TAILINGS STORAGE FACILITIES PAGE 100 100 3 1,200 1,200 24 2 5 - 11.13.3. Technical and Economic Factors The QP used the PFS information (Item 13 to Item 19) to declare that the Rooikraal and 7L15 TSFs have reasonable prospects for economic extraction. The TSFs are included in the LoM plan. The QP’s opinion is that there is a reasonable prospect for economic extraction based on the total mix of technical and economic factors. 11.13.4. Mineral Resource Classification Criteria A list of the criteria used to classify Mineral Resources in addition to the statistical parameters is given in Table 38. Applying these confidence levels, Mineral Resource classification codes were assigned to the block model. A low confidence in one of the listed items will mean classification is downgraded to Inferred Mineral Resource, a moderate confidence in at least one item will mean a property is Indicated Mineral Resource while all highs mean the property is in the Measured Mineral Resource category. Table 38: Ergo: Confidence Levels for Key Criteria for Mineral Resource Classification Items Discussion Confidence Drilling Techniques Auger for 7L15 and for Rooikraal TSF, RC and auger drilling techniques were used. These methods are industry standard for drilling TSFs High Logging Detailed logging throughout High Drill Sample Recovery The sample recovery was considered satisfactory and was acceptable for Mineral Resource estimation High Sub-sampling Techniques and Sample Preparation Material has previously been processed and quartering was applied High Quality of Assay Data Available data is of robust quality however there is a relatively high variability in the lowest grade assays High Verification of Sampling and Assaying A comprehensive QC program implemented during exploration High Location of Sampling Points Survey of all collars and TSFs surfaces High Data Density and Distribution Data points were well spread. Approximately 100m-by-100m spacing was followed High Database Integrity Errors identified and rectified High Geological Interpretation Geometry is known accurately. High Bulk Density A mean density of 1.42t/m3 was considered reasonable with a potential upside High Mineralization Type Mineralization is well known from processing High Estimation and Modelling Techniques NN and Inverse Distance High The drillhole spacing was approximately 100m-by-100m. With this grid, the grade, floor elevation and TSF geometry were estimated with sufficient confidence to allow the application of modifying factors in sufficient detail to support mine planning and evaluation of the economic viability of the TSF. Some auger drill holes that did not intersect the floor, had the floor defined by the RC drill holes. All the RC drill holes intersected the floor or the base. The TSF material was classified as a Measured Mineral Resource.


ERGO’S TECHNICAL REPORT SUMMARY OF THE MATERIAL TAILINGS STORAGE FACILITIES PAGE 101 101 11.13.5. Mineral Resource Statement The Mineral Resource in Table 39 to Table 40 is 100% attributable to DRDGOLD. There is no exclusive Mineral Resource as the TSFs have been converted to Mineral Reserve. Table 39: Ergo Mineral Resource Estimates (Inclusive) TSF Mineral Resource Category Mineral Resources as at 30 June 2024 (Inclusive) Mineral Resources as at 30 June 2025 (Inclusive) Tonnes (kt) Au (g/t) Content (oz) Tonnes (kt) Au (g/t) Content (oz) 7L15 Measured 17,909 0.34 192,887 17,909 0.34 192,887 Rooikraal Measured 52,517 0.26 438,997 47,351 0.26 395,817 Sub-total Measured Mineral Resources 70,426 0.28 631,884 65,260 0.28 588,704 Indicated Mineral Resources - - - - - - Sub-total Measured and Indicated Mineral Resources 70,426 0.28 631,884 65,260 0.28 588,704 Inferred Mineral Resources - - - - - - Total Mineral Resource 70,426 0.28 631,884 65,260 0.28 588,704 Table 40: Ergo Mineral Resource Estimates (Exclusive) TSF Mineral Resource Category Mineral Resources as at 30 June 2024 (Exclusive) Mineral Resources as at 30 June 2025 (Exclusive) Tonnes (kt) Au (g/t) Content (oz) Tonnes (kt) Au (g/t) Content (oz) 7L15 Measured - - - - - - Rooikraal Measured - - - - - - Sub-total Measured Mineral Resources - - - - - - Indicated Mineral Resources - - - - - - Sub-total Measured and Indicated Mineral Resources - - - - - - Inferred Mineral Resources - - - - - - Total Mineral Resource - - - - - - 11.13.6. Mineral Resource Changes The change in the Mineral Resource for Rooikraal is due to normal mining depletion. The change in the average gold grade for 7L15 reported in the FY2023 TRS (0.26g/t) was due to additional drilling conducted in October and November 2023. 11.13.7. Mineral Resource Risks and Uncertainty The QP classified the overall Mineral Resource risk for both the Rooikraal and 7L15 TSFs as low to medium due to the low-grade margin, gold price, recovery and working costs. In the opinion of the QP, no further technical work is required as the drilling program provided sufficient data to define continuity. 11.14. Marievale Complex 11.14.1. Exploratory Data Analysis Exploratory data analysis was done on raw and composited gold data (Figure 48 to Figure 56). Data was analyzed as raw, capped and composites. There was no material changed between the data sets. The data sets distribution is symmetrical. Based on the investigation, cutting or capping of the extreme values was considered. Lower extreme grades were noted and visualized in 3D space. They were considered part of the population: ERGO’S TECHNICAL REPORT SUMMARY OF THE MATERIAL TAILINGS STORAGE FACILITIES PAGE 102 102  7L4: capping was applied at 0.45g/t Au. All gold grades greater than 0.45g/t were set as 0.45g/t;  7L5: no capping was applied as no outliers were noted;  7L6: no capping was applied as no outliers were noted; and  7L7: capping was applied at 0.70g/t Au to minimize the impact of extremely high values. A study on domaining was conducted. The TSFs were not domained laterally or vertically; however, the QP noted the vertical stratification. This stratification aided in defining the search volume (estimation parameter) in a vertical direction. The gold distributions are symmetrical and the variability is low, typical for a TSF. Figure 48: 7L4: Distribution of Capped Raw Gold Data ERGO’S TECHNICAL REPORT SUMMARY OF THE MATERIAL TAILINGS STORAGE FACILITIES PAGE 103 103 Figure 49: 7L4: Distribution of Composited Raw Gold Data Figure 50: 7L5: Distribution of Raw Gold Data ERGO’S TECHNICAL REPORT SUMMARY OF THE MATERIAL TAILINGS STORAGE FACILITIES PAGE 104 104 Figure 51: 7L5: Distribution of Composited Gold Data Figure 52: 7L6: Distribution of Raw Gold Data


ERGO’S TECHNICAL REPORT SUMMARY OF THE MATERIAL TAILINGS STORAGE FACILITIES PAGE 105 105 Figure 53: 7L6: Distribution of Composited Gold Data Figure 54: 7L7: Distribution of Raw Capped Gold Data ERGO’S TECHNICAL REPORT SUMMARY OF THE MATERIAL TAILINGS STORAGE FACILITIES PAGE 106 106 Figure 55: 7L7: Distribution of Composited Capped Gold Data 11.14.2. Modelling and Estimation Parameters The height of the original dump benches is approximately 5m to 6m. The parent block sizes selected to estimate the deposit approximates the half the drill hole spacing and corresponds to the bench height or multiple thereof. Sub- blocking was allowed for good volume definition. The IDW (2) estimation method was utilized. The sample search parameters are supplied in Table 41. Table 41: Search Parameters: Inverse Distance Estimation Method Domain Estimation Pass Search Distance Minimum Number of Composites Maximum Number of Composites Maximum Number of Samples Per Drill Hole X (m) Y (m) Z (m) Slime 1 400 400 6 3 10 2 2 800 800 12 3 10 2 3 1,200 1,200 18 3 10 2 11.14.3. Technical and Economic Factors The technical and financial studies completed for the Marievale Complex were at the preliminary feasibility study (PFS) level of accuracy, (i.e., +/-25%) as presented in Item 13 to Item 19. The QP concluded that there are reasonable prospects for economic extraction. 11.14.4. Mineral Resource Classification Criteria A list of the criteria used to classify Mineral Resources is given in Table 42. Applying these confidence levels, Mineral Resource classification codes were assigned to the block model. A low confidence in one of the listed items will mean ERGO’S TECHNICAL REPORT SUMMARY OF THE MATERIAL TAILINGS STORAGE FACILITIES PAGE 107 107 classification is downgraded to Inferred Mineral Resource, a moderate confidence in at least one item will mean a property is Indicated Mineral Resource while all highs mean the property is in the Measured Mineral Resource category. Table 42: Confidence Levels for Key Criteria for Mineral Resource Classification Items Discussion Confidence Drilling Techniques Auger drilling technique to international standards High Logging Detailed logging throughout High Sub-sampling Techniques and Sample Preparation Material has previously been processed and quartering was applied High Quality of Assay Data Available data is of robust quality however there is a relatively high variability in the lowest grade assays High Verification of Sampling and Assaying A comprehensive QC program implemented during exploration High Location of Sampling Points Survey of all collars and TSFs surfaces High Data Density and Distribution Data points were well spread High Database Integrity Errors identified and rectified High Geological Interpretation Geometry is known accurately High Bulk Density A mean density of 1.42t/m3 was considered reasonable High Mineralization Type Mineralization is well known from processing High Estimation and Modelling Techniques NN, and Inverse Distance High The material was classified as a Measured Mineral Resource as drill hole spacing was approximately 100m-by-100m. No Indicated or Inferred Mineral Resources were declared as the geological confidence derived from exploration, test work and Mineral Resource estimation work was conclusive, and the Mineral Resource can be used for mine planning studies. ERGO’S TECHNICAL REPORT SUMMARY OF THE MATERIAL TAILINGS STORAGE FACILITIES PAGE 108 108 11.14.5. Mineral Resource Statement The Mineral Resource Estimates are stated as both inclusive and exclusive of Mineral Reserve (Table 43 to Table 44). There are no exclusive Mineral Resource estimates as all the TSFs have been converted into Mineral Reserves. Table 43: Marievale Mineral Resource Estimates (Inclusive) TSF Mineral Resource Category Mineral Resources as at 30 June 2024 (Inclusive) Mineral Resources as at 30 June 2025 (Inclusive) Tonnes (kt) Au (g/t) Content (oz) Tonnes (kt) Au (g/t) Content (oz) 7L4* Measured 17,590 0.29 164,570 17,590 0.29 164,570 7L5 Measured 6,980 0.29 65,528 6,980 0.29 65,528 7L6 Measured 12,760 0.26 106,663 12,760 0.26 106,663 7L7 Measured 16,784 0.32 174,297 16,784 0.32 174,297 Sub-total Measured Mineral Resources 54,114 0.29 511,058 54,114 0.29 511,058 Indicated Mineral Resources - - - - - - Sub-total Measured and Indicated Mineral Resources 54,114 0.29 511,058 54,114 0.29 511,058 Inferred Mineral Resources - - - - - - Total Mineral Resource 54,114 0.29 511,058 54,114 0.29 511,058 * The TSFs were re-evaluated in FY2024 and the QP confirmed the grades for the Marievale TSFs with 7L4 reporting 0.29g/t compared to 0.34g/t reported in the 2023 TRS. Table 44: Marievale Resource Estimates (Exclusive) TSF Mineral Resource Category Mineral Resources as at 30 June 2024 (Exclusive) Mineral Resources as at 30 June 2025 (Exclusive) Tonnes (kt) Au (g/t) Content (oz) Tonnes (kt) Au (g/t) Content (oz) 7L4 Measured - - - - - - 7L5 Measured - - - - - - 7L6 Measured - - - - - - 7L7 Measured - - - - - - Sub-total Measured Mineral Resources - - - - - - Indicated Mineral Resources - - - - - - Sub-total Measured and Indicated Mineral Resources - - - - - - Inferred Mineral Resources - - - - - - Total Mineral Resource - - - - - - 11.14.6. Mineral Resource Changes There was no change in Mineral Resource as no drilling, mining, or additional deposition was done on Marievale Complex since the latest estimate. 11.14.7. Mineral Resource Risks and Uncertainty The QP’s opinion is that the overall grade and tonnage estimates are reasonable for mine planning based on the drill hole data and assay statistics. This presents a low risk for preliminary feasibility or feasibility mine planning work, as only Mineral Resources with the highest level of geoscientific knowledge are included in an economic assessment. The gold price fluctuations present the main risk to the declared Mineral Resource. Risks of grade and continuity of mineralization were mitigated through the closely spaced drilling, validation procedures, metallurgical testing, advanced statistical analyses and the use of robust geological modelling techniques. The QP classified the overall Mineral Resource risk as low to medium. In the opinion of the QP, no further technical work is required as the drilling program provided enough data to define continuity.


ERGO’S TECHNICAL REPORT SUMMARY OF THE MATERIAL TAILINGS STORAGE FACILITIES PAGE 109 109 11.15. 6L14 11.15.1. Exploratory Data Analysis Analysis of data from different campaigns was completed to check compatibility. Tools used for this were box plots, histograms, PP and QQ plots, and ANOVA table. Datasets from different campaigns were then combined. Based on the high-grade cap investigations, high-grade caps were selected and applied to the raw dataset. An insignificant reduction in the available metal was noted. 6L14: gold grades were capped at 0.90g/t; Figure 56 and Table 45 present the basic statistics data for 6L14. Data was analyzed as raw, capped and composites. There was no material changed between the data sets. The data sets show positively skewed distribution. Figure 56: 6L14: Distribution of Raw Capped Gold Data Table 45: Summary of the Basic Statistics Parameter Gold g/t Number of Samples 111 Average Au (g/t) 0.355 Minimum Au (g/t) 0.165 Maximum Au (g/t) 0.900 Standard deviation 0.109 11.15.2. Modelling and Estimation Parameters The parent block size for the TSF was largely based on the average drill spacing and sample compositing interval. The height of the original dump benches is approximately 5m to 6m. The parent block size selected to estimate the deposit ERGO’S TECHNICAL REPORT SUMMARY OF THE MATERIAL TAILINGS STORAGE FACILITIES PAGE 110 110 approximates the drill hole spacing for the TSF and maps the bench height. Sub-blocking was allowed for a good volume definition. The IDW (2) estimation method was utilized. The sample search parameters are supplied in Table 46. Table 46: Search Parameters: Inverse Distance Estimation Method Domain Estimation Pass Search Distance Minimum Number of Composites Maximum Number of Composites X (m) Y (m) Z (m) 6L14 1 400 400 10 5 20 2 800 800 20 5 20 3 1,200 1,200 30 5 20 11.15.3. Technical and Economic Factors The Mineral Resource Estimates were declared considering the PSF studies completed. The TSF is included in the LoM plan. 11.15.4. Mineral Resource Classification Criteria A list of the criteria used to classify the Mineral Resources, in addition to the statistical parameters, is given in Table 47. Applying these confidence levels, Mineral Resource classification codes were assigned to the block model. A low confidence in one of the listed items will mean classification is downgraded to Inferred Mineral Resource, a moderate confidence in at least one item will mean a property is Indicated Mineral Resource while all highs mean the property is in the Measured Mineral Resource category. Table 47: Confidence Levels for Key Criteria for Mineral Resource Classification Items Discussion Confidence Drilling Techniques Auger drilling technique to international standards High Logging Detailed logging throughout High Drill Sample Recovery The sample recovery was considered satisfactory and was acceptable for Mineral Resource estimation High Sub-sampling Techniques and Sample Preparation Material has previously been processed and quartering was applied High Quality of Assay Data Available data is of robust quality however there is a relatively high variability in the lowest grade assays High Verification of Sampling and Assaying Full QC program implemented during exploration High Location of Sampling Points Survey of all collars and TSFs surfaces High Data Density and Distribution Data points were well spread, though widely spaced. Approximately 100m-by-100m spacing was followed High Database Integrity Errors identified and rectified High Geological Interpretation Geometry is known accurately High Bulk Density A mean density of 1.42t/m3 was considered reasonable High Mineralization Type Mineralization is well known from processing High Estimation and Modelling Techniques NN and Inverse Distance High The drill hole spacing was approximately 100-by-100m or less. With this grid, the grade, floor elevation and TSF geometry were estimated with sufficient confidence to allow the application of modifying factors in sufficient detail to support mine planning and evaluation of the economic viability of the TSFs. The TSF was classified in the Measured Mineral Resource category. ERGO’S TECHNICAL REPORT SUMMARY OF THE MATERIAL TAILINGS STORAGE FACILITIES PAGE 111 111 The data or supporting information is derived from adequately detailed and reliable exploration, sampling and testing and is sufficient to assume geological and grade or quality continuity between the points of observation. 11.15.5. Mineral Resource Statement The Mineral Resource Estimates for the 6L14 are presented in Table 48. There is no exclusive Mineral Resource as the TSF is declared a Mineral Reserve. Table 48: 6L14 Mineral Resource Estimates (Inclusive) TSF Mineral Resource Category Mineral Resources as 30 June 2024 (Inclusive) Mineral Resources as at 30 June 2025 (Inclusive) Tonnes (kt) Au (g/t) Content (oz) Tonnes (kt) Au (g/t) Content (oz) 6L14 Measured 6,980 0.36 79,667 6,980 0.36 79,667 Sub-total Measured Mineral Resources 6,980 0.36 79,667 6,980 0.36 79,667 6L14 Indicated - - - - - - Sub-total Indicated Mineral Resources - - - - - - Sub-total Measured and Indicated Mineral Resources 6,980 0.36 79,667 6,980 0.36 79,667 Inferred Mineral Resources - - - - - - Total Mineral Resource 6,980 0.36 79,667 6,980 0.36 79,667 11.15.6. Mineral Resource Changes There was no change in Mineral Resource as no additional drilling, mining, and additional deposition was done on the 6L14 TSF. 11.15.7. Mineral Resource Risks and Uncertainty The mining right over 6L14 has expired and Ergo has applied for renewal. This report has considered section 25(5) of the MPRDA, as amended: “A mining right in respect of which an application for renewal has been lodged shall despite its expiry date remain in force until such time as such application has been granted or refused.” The QP classified the overall Mineral Resource risk as low. In the opinion of the QP, no further technical work is required as the drilling program provided sufficient data to define continuity. ERGO’S TECHNICAL REPORT SUMMARY OF THE MATERIAL TAILINGS STORAGE FACILITIES PAGE 112 112 11.16. Summary Mineral Resource Estimates Table 49 and Table 50 present the summary of the Mineral Resource estimates (inclusive) for the 15 TSFs. The Mineral Resource estimates are reported as inclusive of the Mineral Reserve and the reference point is in situ, meaning the physical TSFs are Mineral Resources themselves. Table 49: Inclusive Mineral Resource Estimates of the 15 Material Properties as at 30 June 2025 Complex TSF* Category Mineral Resources as at 30 June 2024 (Inclusive) Mineral Resources as at 30 June 2025 (Inclusive) Tonnes (kt) Au (g/t) Content (oz) Tonnes (kt) Au (g/t) Content (oz) City Deep 4L3 Measured 11 855 0.32 121 969 8 127 0.32 83 613 4L4 Measured 2 410 0.37 28 665 2 198 0.37 26 146 4L6 Measured 4 738 0.32 48 741 4 738 0.32 48 741 Knights 4L14 Measured 7 015 0.29 64 275 4 012 0.29 36 763 Ergo 7L15 Measured 17 909 0.34 192 887 17 909 0.34 192 887 Rooikraal Measured 52 517 0.26 438 997 47 351 0.26 395 819 Marievale 7L4 Measured 17 590 0.29 164 570 17 590 0.29 164 570 7L5 Measured 6 980 0.29 65 528 6 980 0.29 65 528 7L6 Measured 12 760 0.26 106 663 12 760 0.26 106 663 7L7 Measured 16 784 0.32 174 297 16 784 0.32 174 297 6L14 6L14 Measured 6 980 0.36 79 667 6 980 0.36 79 667 Sub-total Measured Mineral Resources 157 538 0.29 1 486 259 145 429 0.29 1 374 694 Crown 3L5 (Diepkloof) Indicated 97 174 0.23 724 818 96 574 0.23 720 344 3L7 (Mooifontein) Indicated 67 556 0.23 501 726 67 486 0.23 501 209 3L8 (GMTS) Indicated 107 226 0.24 820 480 107 896 0.24 825 607 Knights 4L39** Indicated - - - 7 500 0.28 68 240 Sub-total Indicated Mineral Resources 271 956 0.23 2 047 024 279 456 0.24 2 115 400 Sub-total Measured and Indicated Mineral Resources 429 494 0.26 3 533 283 424 885 0.26 3 490 094 Inferred - - - - - - Sub-total Inferred Mineral Resources - - - - - - Total Material Mineral Resources 429 494 0.26 3 533 283 424 885 0.26 3 490 094 * Daggafontein TSF, previously classified as a material property in the prior Technical Report Summary, has been removed from the Mineral Resource Statement as at 30 June 2025. This change reflects the TSF’s designation as a deposition site with the QP concluding that there are no reasonable prospects for economic extraction. **4L39 was not owned by Ergo in the FY2024. Additional Notes: i. Mineral Resources are not Mineral Reserves. ii. Mineral Resources are reported inclusive of Mineral Reserves. iii. Mineral Resources have been reported in accordance with Subpart 1300 of Regulation S-K iv. Mineral Resources were estimated using the $2,982/oz, ZAR17.63:1USD and ZAR1,689,997/kg financial parameters and recoveries in Table 17 v. Quantities and grades were rounded to reflect the accuracy of the estimates; and if any apparent errors are insignificant


ERGO’S TECHNICAL REPORT SUMMARY OF THE MATERIAL TAILINGS STORAGE FACILITIES PAGE 113 113 Table 50 presents exclusive Mineral Resource estimates for the material properties. Table 50: Exclusive Mineral Resource Estimates of the 15 Material Properties as at 30 June 2025 Complex TSF Category Mineral Resources as at 30 June 2024 (Exclusive) Mineral Resources as at 30 June 2025 (Exclusive) Tonnes (kt) Au (g/t) Content (oz) Tonnes (kt) Au (g/t) Content (oz) City Deep 4L3 Measured - - - - - - 4L4 Measured - - - - - - 4L6 Measured - - - - - - Knights 4L14 Measured - - - - - - Ergo 7L15 Measured - - - - - - Rooikraal Measured - - - - - - Marievale 7L4 Measured - - - - - - 7L5 Measured - - - - - - 7L6 Measured - - - - - - 7L7 Measured - - - - - - 6L14 6L14* Measured - - - - - - Sub-total Measured Mineral Resources - - - - Crown 3L5 (Diepkloof) Indicated 97 174 0.23 724 818 - - - 3L7 (Mooifontein) Indicated 67 556 0.23 501 726 - - - 3L8 (GMTS) Indicated 107 226 0.24 820 480 - - - Knights 4L39** Indicated - - - - - - Sub-total Indicated Mineral Resources 271 956 0.23 2 047 024 - - - Sub-total Measured and Indicated Mineral Resources 271 956 0.23 2 047 024 - - - Inferred - - - - - - Sub-total Inferred Mineral Resources - - - - - - Total Material Mineral Resources 271 956 0.23 2 047 024 - - - *6L14 was not included in the previous TRS as it was not a material property. **4L39 was not owned by Ergo in the FY2024. Additional Notes: i. Mineral Resources are not Mineral Reserves. ii. Mineral Resources are reported exclusive of Mineral Reserves. iii. Mineral Resources have been reported in accordance with Subpart 1300 of Regulation S-K. iv. Mineral Resources were estimated using the $2,982/oz, ZAR17.63:1USD and ZAR1,689,997/kg financial parameters and recoveries in Table 17. vi. Quantities and grades were rounded to reflect the accuracy of the estimates; and if any apparent errors are insignificant ERGO’S TECHNICAL REPORT SUMMARY OF THE MATERIAL TAILINGS STORAGE FACILITIES PAGE 114 114 Figure 57: Mineral Resource Classification Map for the Material TSFs ERGO’S TECHNICAL REPORT SUMMARY OF THE MATERIAL TAILINGS STORAGE FACILITIES PAGE 115 115 The total Mineral Resource Estimates for Ergo are presented in Table 51 and Table 52. The total Mineral Resource consisted of 15 material properties and 26 small TSFs and clean-up sites. The changes in Mineral Resource from June 2024 to June 2025 are due to depletion of 19.25Mt at 0.33g/t Au as presented on Figure 58 and Table 53. Material changes to Mineral Resources are:  The entire Daggafontein TSF (214.11Mt at 0.24g/t) has been removed from the total Mineral Resources, as Ergo has decided to designate Daggafontein as a deposition site and the QP concluded that the TSF has no reasonable prospect for economic extraction.  All three Grootvlei dumps (107.66Mt at 0.26g/t) have been removed, following the lapse of the prospecting rights and as common law ownership could not be secured.  A new dump, 4L39, containing 7.5Mt at 0.28g/t Au, was purchased by Ergo and has been added to the total Mineral Resources. Additionally, a negative survey adjustment of 7.75Mt at 0.15g/t was applied, mainly due to recent survey work on the Fleurhof dumps. A total of 12 smaller TSFs/cleanup areas, containing 2.29 Mt at 0.44 g/t Au, were excluded from the Mineral Resource Statement because the QP conducted a study and determined they have no reasonable prospects for economic extraction. This change is not considered significant as it only affected smaller TSFs/cleanup sites. The depletion applied at Ergo is a straight tonnage subtraction, and the survey adjustment is a straight tonnage addition or subtraction; thus, no individual block grade changes are considered, except in TSFs where additional drilling was completed. The QP deemed this technique suitable for the deposits under consideration. Table 51: Ergo Inclusive Mineral Resources Statement as at 30 June 2025 Mineral Resource Classification Mineral Resource as at 30 June 2024 Mineral Resource as at 30 June 2025 Tonnes (Mt) Au (g/t) Contents (Moz) Tonnes (Mt) Au (g/t) Contents (Moz) Measured Mineral Resource 236.10 0.29 2.22 150.54 0.30 1.46 Indicated Mineral Resource 561.95 0.25 4.46 325.26 0.25 2.64 Sub-total Measured and Indicated Mineral Resource 798.04 0.26 6.68 475.80 0.27 4.10 Inferred Mineral Resource 21.32 0.24 0.16 - - - Total Mineral Resources 819.36 0.26 6.85 475.80 0.27 4.10 Table 52: Ergo Exclusive Mineral Resources Statement as at 30 June 2025 Mineral Resource Classification Mineral Resource as at 30 June 2024 Mineral Resource as at 30 June 2025 Tonnes (Mt) Au (g/t) Contents (Moz) Tonnes (Mt) Au (g/t) Contents (Moz) Measured Mineral Resource 66.04 0.26 0.55 - - - Indicated Mineral Resource 365.78 0.24 2.87 42.43 0.30 0.41 Sub-total Measured and Indicated Mineral Resource 431.81 0.25 3.42 42.43 0.30 0.41 Inferred Mineral Resource 21.32 0.24 0.16 - - - Total Mineral Resources 453.13 0.25 3.59 42.43 0.30 0.41 ERGO’S TECHNICAL REPORT SUMMARY OF THE MATERIAL TAILINGS STORAGE FACILITIES PAGE 116 116 Figure 58: Mineral Resource Reconciliation (Inclusive) Table 53: Total Mineral Resource Reconciliation (Inclusive) Mineral Resource as at 30 June 2024 Tonnes (Mt) Au (g/t) Contents (Moz) 819.36 0.26 6.85 Depletion (19.25) 0.33 (0.21) Survey adjustments (positive and negative) (7.75) 0.15 (0.04) Removal of Daggafontein TSF (214.11) 0.24 (1.65) Removal of Grootvlei TSFs (107.66) 0.26 (0.90) New TSF Added – 4L39 7.50 0.28 0.07 Removal of 12 small TSFs or rehab sites as they had no reasonable prospect for economic extraction (2.29) 0.44 (0.03) Mineral Resource as at 30 June 2025 475.80 0.27 4.10 Note: Quantities and grades have been rounded to two decimal places; therefore minor computational errors may occur. A note is given to explain that depletion of Mineral Resources does not always equal depletion of Mineral Reserves. This is because depletion includes mining of Mineral Resources that were not part of the Life of Mine (LoM) plan—that is, Mineral Resources not converted into Mineral Reserves. In such cases, Mineral Resource depletion will exceed Mineral Reserve depletion. The difference between the two is considered immaterial and consistent with industry practice. 11.17. QP’s Opinion In the QP’s opinion, all relevant technical and economic factors that may likely affect the reasonable prospects of economic extraction, were adequately considered for the Mineral Resources reported. The QP recommended no further work. 4.10 -0.20 -2.580.07 -0.04 6.85 0 1 2 3 4 5 6 7 8 M in e ra l R e so u rc e s a s a t 30 Ju ne 2024 (Inc lu sive ) D e p le tio n s A d d itio n o f th e TSF - 4L39 R e m o va l o f th e TSFs - D a g g a fo n te in a nd G ro o tvle i Su rve y A d ju stm e n t M in e ra l R e so u rc e s a s a t 30 Ju ne 2025 (Inc lu sive ) A u c o n te nt ( M o z)


ERGO’S TECHNICAL REPORT SUMMARY OF THE MATERIAL TAILINGS STORAGE FACILITIES PAGE 117 117 12. MINERAL RESERVE ESTIMATES This section includes discussion and comments on the conversion of Mineral Resources to Mineral Reserves. Specifically, comments are based on the key assumptions, parameters, and methods (Modifying Factors) used to estimate the 30 June 2025 Mineral Reserve. Mineral Reserves estimates are affected by multiple factors that change over time. Fluctuations in the gold price, exchange rates, legislation in the operating country, other reporting jurisdictions and a wide range of operating conditions may affect the mineral reserve estimates. Estimates of the Mineral Reserves should be considered best estimates at the time of reporting. The level of the study conducted to support the declaration of the 30 June 2025 Mineral Reserve is based on a mine plan and design conducted to at least a Preliminary Feasibility Study (PFS) level of work. Ergo utilizes Measured and Indicated Mineral Resources incorporated into the Life of Mine (LoM) plan. No Inferred Mineral Resources have been converted to Mineral Reserves. 12.1. Grade Control and Reconciliation The Ergo LoM plan and schedule for the individual TSFs is based on 3-D geological models, which provide grade, density, and volume for each block. The planning department takes this information and establishes a grade for the proposed mining cut, typically in the order of 15m. The mine plan accounts for each block, resulting in a tonnage and grade estimate for the entire mining block or mining cut. The mining cut is then sequenced and scheduled. Figure 59 provides examples of top, isometric and grade model views of a TSF planned to be mined. Figure 59: Mine design model showing top, isometric, and grade model of TSF (Deswik, 2025) Ergo conducts grade and tonnage reconciliations on a quarterly basis with no material difference between the planned and actual grades and tonnages observed. ERGO’S TECHNICAL REPORT SUMMARY OF THE MATERIAL TAILINGS STORAGE FACILITIES PAGE 118 118 Table 54: Reconciliation of RoM Head Grade (Au) Year Actual RoM Head Grade (g/t) Actual Processing Plant Head Grade (g/t) Head Grade Difference (g/t) Percentage Difference (%) 2019/2020 0.358 0.354 -0.004 -2.10% 2020/2021 0.366 0.363 0.006 -0.70% 2021/2022 0.372 0.365 0.007 -1.93% 2022/2023 0.391 0.381 0.010 -3.51% 2023/2024 0.404 0.405 0.001 0.25% 2024/2025 0.348 0.363 0.015 4.32% Table 55: Reconciliation of RoM Tonnage Year Measured Survey Tonnage (kt) Processing Plant Tonnage (kt) Tonnage Difference (kt) Percentage Difference (%) 2019/2020 20 247 20 228 -37 -0.18% 2020/2021 22 905 22 952 47 0.21% 2021/2022 22 683 22 111 -572 -2.52% 2022/2023 16 971 17 334 363 2.14% 2023/2024 16 220 16 101 -119 -0.73% 2024/2025 20 329 19 487 -842 -4.14% The results in Table 54 and Table 55 indicate there is no material difference between the planned grade and actual RoM grade, indicating a reasonable correlation between the survey and realized processing plant grade. The reconciliation between the surveyed and actual processing plant tonnage indicates no material difference over the past six years. 12.2. Cut-off Grade Estimation The cut-off grade, for the purposes of the Mineral Reserve definition, is defined as the grade at which the value of the contained metal in a unit quantity is equivalent to the cost of its production, i.e., the breakeven cut-off grade. Cut-off Grade = Total On-Mine Production Costs (Metal Market Price – Off-Mine Costs) x Recovery The gold price and other operational inputs are discussed in various Items of this Report; justification for the gold price is given in Item 16.2 and 16.6; plant recoveries are reviewed in Item 14, Item 16 reports on marketing and pricing, and operating costs are commented on in Item 18. The cut-off grade and Mineral Reserve grades for the source areas are provided in Table 56. Note that due to the nature of mining TSFs, the cut-off grade is not based on a block value or individual sections of the TSF but based on the total TSF (i.e., if the entire TSF grade is above the cut-off grade, the TSF will be mined. Table 56: LoM Cut-off Grade and Mineral Reserve Grades Source Area Plant Recovery (%) LoM Cut-off Au Grade (g/t) Mineral Reserve Au Grade (g/t) Ergo 41.4 0.20 0.26 ERGO’S TECHNICAL REPORT SUMMARY OF THE MATERIAL TAILINGS STORAGE FACILITIES PAGE 119 119 The cut-off grade provided above is based on the June 2025 LoM plan and used to validate the 30 June 2025 Mineral Resource and Mineral Reserve estimation. Gold price ZAR1,689,997/Kg Au (Item 16) On-mine cost ZAR139/t (Item 18) Off-mine cost ZAR0.00/t Recoveries as per Item 14 of this TRS All TSFs grades in the LoM plan are above the calculated cut-off grade for each individual TSF 12.3. Estimation and Modelling Techniques Ergo reports its Mineral Resources and Mineral Reserves in accordance with the Regulation S-K 1300. In no case has Measured Mineral Resources been downgraded to a Probable Mineral Reserve category. Other than geological modelling, no other modelling or estimation techniques are used in the selection of Mineral Reserves. Selection for inclusion in the Mineral Reserves is based on the average grade of the TSF being above the required cut-off grade. The Mineral Reserve estimate for all the TSFs and sand dumps are declared as follows: • Tonnes and grade are RoM as delivered to the processing plant; • No mining losses or dilution have been applied in the conversion process, nor has a mine call factor been applied; • Mineral Reserves were estimated using the $2,982/oz, ZAR17.63 and ZAR1,689,997/kg financial parameters and individual TSF recoveries are used to determine the cut-off grade; • Mineral Reserves have been reported in accordance with the classification criteria defined in the Subpart 1300 of Regulation S-K; and • Mineral Reserve is 100% attributable to DRDGOLD. 12.4. Mineral Reserve Classification Criteria The Mineral Reserve classification of Proven and Probable is a function of the Mineral Resource classification with due considerations of the minimum criteria for the “modifying factors” as considered in the S-K1300. In no case has Measured Mineral Resources been downgraded to a Probable Mineral Reserve Category. Due to the length of approval times for the renewal of permits, some of the Mineral Reserves may be based on permits (approvals) still in the process of being renewed. At this time, there is no indication that these renewals will not be granted and therefore have been used in the LoM plan and Mineral Reserve statement. ERGO’S TECHNICAL REPORT SUMMARY OF THE MATERIAL TAILINGS STORAGE FACILITIES PAGE 120 120 12.5. Mineral Reserve Statement The QP confirms that the Mineral Reserve statement presented in Table 57 is disclosed in accordance with the S- K1300 guidelines. Table 57: Ergo TSF Mineral Reserves Statement as at 30 June 2025 Mineral Reserve Classification Mineral Reserve as at 30 June 2024 Mineral Reserve as at 30 June 2025 Tonnes (Mt) Au (g/t) Contents (Moz) Au (g/t) Tonnes (Mt) Contents (Moz) Proven 170.06 0.31 1.67 150.54 0.30 1.46 Probable 196.17 0.25 1.60 282.83 0.24 2.22 Total Mineral Reserves 366.23 0.28 3.27 433.37 0.26 3.69 Notes: 1. Tonnes and grades were rounded, and this may result in minor adding discrepancies. 2. The Mineral Reserve has been reported in accordance with the classification criteria defined in the Regulation S-K 1300. 3. The Mineral Reserve is estimated using the $2,982/oz, ZAR17.63 and ZAR1,689,997/kg financial parameters. 4. No mining losses or dilution has been applied in the conversion process nor has a mine call factor been applied. 5. Tonnage and grade RoM delivered to the processing plant. 6. The attributable Mineral Reserve is 100% of the total Mineral Reserve. Only gold was estimated; no metal equivalent evaluations were performed. Table 58 depicts the Mineral Reserve reconciliation between 01 July 2024 and 30 June 2025. Some 18.22Mt was depleted through mining operations; 0.23Mt was added due to survey adjustments; 192.79 Mt was removed from the Mineral Reserve by removing the Daggafontein TSF; a further 1.53 Mt was removed as seven TSFs were moved from the Mineral Reserve and moved to the Not In Reserve “NIR”; finally 279.46 Mt from the Crown Complex and the 4L39 TSFs was added by Ergo to the Mineral Reserve category. Table 58: Mineral Reserve Reconciliation Source Tonnes (Mt) Au Grade (g/t) Content (Moz) Mineral Reserve as at 30 June 2024 366.23 0.28 3.27 Depletion through Mining (18.22) 0.33 (0.19) Survey Adjustments (addition) 0.23 1.28 0.01 Removed from Reserves (192.79) 0.24 (1.49) Removed from Reserve to NIR (1.53) 0.47 (0.02) Added to Reserves 279.46 0.24 2.12 Mineral Reserve as at 30 June 2025 433.37 0.27 3.69 Note: 1. Quantities and grades have been rounded to two decimal places, therefore minor computational errors may occur. The various modifying factors, i.e., mining, metallurgical, processing, infrastructure, economic, marketing, legal, environmental, social and governmental factors, are discussed in the following Items of this Report. 12.6. QP Statement on the Mineral Reserve Estimation The Mineral Reserves declared are estimated from the 30 June 2025 Mineral Resource statement and the 30 June 2025 LoM plan. The 2025 LoM plan was developed by Ergo and is based on the Mineral Resource Estimates as at 30 June 2025, together with a set of modifying factors derived from recent historical results, and economic inputs provided by Ergo. The assumptions applied in determining the modifying factors and economic inputs are reasonable and appropriate. The LoM plan is sufficiently detailed to ensure achievability and is based on infrastructure capabilities as well as historical achievements. All the inputs used in the estimation of the Mineral Reserves have been thoroughly reviewed


ERGO’S TECHNICAL REPORT SUMMARY OF THE MATERIAL TAILINGS STORAGE FACILITIES PAGE 121 121 and can be considered technically robust. The QP applies a low risk to the Mineral Reserves but acknowledges that several external factors can impact Mineral Reserves, such as environmental, social and governmental aspects. The Mineral Reserve is sensitive to the gold price, exchange rate, recovery, and operating costs, all of which impact the cut-off grade estimation for Ergo. The sensitivities highlighted are typical of most gold mining operations. Ergo focuses on those areas where it may have an impact, e.g., recovery and operating costs. The sensitivity analysis is discussed in more detail in Item 19. Since external factors determine revenue, Ergo manages this risk by being focused on areas that it can influence – costs and operational efficiency. Ergo continues to investigate ways to mitigate cost increases and reduce costs by making ongoing improvements on process and efficiencies. For example, precise dosing of chemicals and consumables, based on the continuing analysis of key drivers in the Ergo processing plant, contributes to minimizing costs. In addition, reducing friction in pipelines through high-density polyethylene (HDPE) lining reduces power consumption, and maintaining a closed water circuit and using recycled water, which reduces the costs of water consumption, are a few initiatives implemented. The QP has reviewed all the inputs used in the 30 June 2025 Mineral Reserve estimation and can be considered technically robust. ERGO’S TECHNICAL REPORT SUMMARY OF THE MATERIAL TAILINGS STORAGE FACILITIES PAGE 122 122 13. MINING METHODS Ergo’s business is the retreatment of old gold-bearing sand dumps and slimes dams (termed TSFs) to recover gold. Consequently, Ergo has acquired an extensive inventory of gold-bearing sand and slimes TSFs spread across the Central and East Rand goldfields. The sand and slimes TFSs were produced from the processing of gold ores of the Witwatersrand Supergroup by the historic gold mines that operated across the gold fields. These mines are now mostly defunct and stretch from the Crown, City Deep and Knights plants in the Central Rand to the south of Johannesburg to the Daggafontein TSF in the East Rand, over some 70km. The result of Ergo’s retreatment is the creation of ‘new’ TSFs, which are currently deposited onto the Brakpan TSF. The Brakpan TSF is a mature facility and approaching its final phase as a mega-volume tailings storage facility. Therefore, in light of Ergo’s planned future production plans, Ergo has commenced with the process of recommissioning the adjacent Withok TSF, to create an additional 310 million tonnes of deposition capacity. The requisite public participation process has been completed, and the project is in its authorization phase. Commissioning is planned to occur within the next three to four years. Ergo plans to maintain its current deposition rate of 1.65 million tonnes per month for another three to four more years before moving onto the adjacent Withok TSF. The regulatory process to recommission Withok is complex, though, and the regulator may not approve all aspects of the envisaged design. The footprint and location of the facility also make for a challenging construction process, and this may result in target dates not being met, and planned throughput rates not being achieved. The Daggafontein TSF has been removed out the Mineral Resource statement to resume depositioning to support Ergo’s life of mine and supplement the Brakpan TSF. The designation of the Daggafontein TSF as deposition facility will also provide some mitigation in the event that challenges are encountered during the authorisation and construction phases of the Withok TSF. In this way, Ergo plays a dual role in creating value and undertaking environmental clean-up. Ergo consists of the Knights plant (operating as a milling and and pump station) and City plant (operating as a pump station) feed material to the Ergo processing plant, pipeline infrastructure, the mining rights, licenses and permits to access many surface resources (old TSFs made up of slimes and sand), and the Brakpan TSF as the current deposition facility. Table 59 presents recent historical operation results with 19.8Mtpa being the production target. During the three-year financial periods, although operational tonnage was lower than planned, operational performances were boosted by a high average gold price for FY2025 (ZAR1,6732,357/kg), FY2024 (ZAR1,248,679/kg) and FY2023 (ZAR1,041,102/kg), resulting in robust net cash flows. Table 59: Historical Ergo Operational Results Year FY2025 FY2024 FY2023 Tonnage (t) ('000) 19,487 16,101 17,334 Gold Produced (kg) 3,473 3,639 3,931 Yield (g/t) 0.18 0.23 0.23 13.1. Mining Method The current mining methods applied by Ergo are suitable for all TSFs (dumps/dams). No selective mining will occur with the entire TSF being processed. No selective mining is the result of four conditions inherent in the Ergo’s operation of reclaiming the dumps:  there is nowhere on the mining sites to dump the below cut-off grade material; ERGO’S TECHNICAL REPORT SUMMARY OF THE MATERIAL TAILINGS STORAGE FACILITIES PAGE 123 123  the mining method is not conducive to selective mining;  the operation is a rehabilitation exercise, and all mineralized material must be removed from the site, and it is, therefore, economically beneficial to process all material, even low-grade material; and  Concurrent rehabilitation takes place which reduces the environmental impact as well as the rehabilitation liabilities. Figure 60: Crown Complex Footprint 13.2. Hydraulic Mining The use of water plus energy to mine unconsolidated material has a long history. Documented and physical evidence indicate widespread and sophisticated use in the Californian goldfields in the mid-19th century. Thousands of kilometres of ditches and flumes were constructed to gravitate water from high in the mountains to generate sufficient pressure to “flush” the alluvial gravel beds into sluices. In recent years, however, the most popular techniques have been based on hydraulic mining used to mine unconsolidated materials, alluvial deposits, freshly blasted ores, and for the recovery (or re-mining) of dewatered TSFs. Hydraulic mining can be loosely defined as the process of excavating material (the ore body) from its in-situ state using water. A stream of water is directed at the ore body (mineralized tailings material) to break and/or soften the material mechanically, allowing the water flow to carry it away. The application or effectiveness of the method is a function of various factors ranging from the size, velocity and pressure of the water stream to the location, as well as the hardness, particle size, and moisture content of the material to be mined. ERGO’S TECHNICAL REPORT SUMMARY OF THE MATERIAL TAILINGS STORAGE FACILITIES PAGE 124 124 Hydraulic mining is typically undertaken using 100mm or 150mm monitor guns (Figure 61), with increased production achieved by including additional units. Hydraulic mining provides a high degree of flexibility that allows simultaneous mining at several points over a wide range of production rates. Consequently, grade blending is readily achievable. Figure 61: Example of Hydraulic Mining Hydraulic mining in semi or near-saturated conditions is possible and common and has a clear advantage over load- and-haul operations. Hydraulic mining does not create, but rather ameliorate the airborne dust problem often associated with fine TSFs and dry mining techniques. A typical generic hydraulic mining system is shown in Figure 62.


ERGO’S TECHNICAL REPORT SUMMARY OF THE MATERIAL TAILINGS STORAGE FACILITIES PAGE 125 125 Figure 62: Hydraulic Mining Process Diagram Notes: Source: modified after J Engels, No Date Note: the pumps have been excluded for clarity The planning of hydraulic mining considers several factors:  The required production rate,  The life of the operation,  The type of material to be mined, including hardness, density, grading, specific gravity, degree of contamination (vegetation),  The site topography, shape and form of the ore body,  The slurry quality requirements,  The pumping distances, and  Water, power, equipment and labour availability. Considering the aspects mentioned above allows the size and number of monitor guns to be determined. Essentially, most applications require 1m3 of water per dry tonne to be mined targeting for 50% solids. A monitor gun (100mm or 150mm) can be fitted with different diameter nozzles that allow production rates to be “fine-tuned”. Before the slurry enters the pumping facilities, it is usually necessary to pass the slurry through a screen or series of screens depending upon the degree of contamination and oversize material. Satellite pumps are typically vertical spindle pumps suspended from gantries above a sump and pumps into a thickener or header tank ahead of the plant that accommodate surges in flow, grading or density. Hydraulic mining provides the slurry feedstock to the mineral processing plant continuously. To maintain production, high pressure must be ensured. Slurry densities and production rates will not be achieved if the water pressure is not ERGO’S TECHNICAL REPORT SUMMARY OF THE MATERIAL TAILINGS STORAGE FACILITIES PAGE 126 126 maintained. Critical to hydraulic mining is consistent high slurry densities. If densities drop, less tonnage is delivered to the processing plant, thus increasing the mining cost. Figure 63 demonstrates a cross-sectional view of mining a TSF. Figure 63: Typical Mining Method for a TSF 13.3. Conventional Load, Haul and Slurry A second mining method employed by Ergo is the use of front-end loaders (FEL) to load slimes and sand (Figure 64). In these cases, the FELs load from the bottom of the dump and transport the mineralized material to a feed hopper which feeds a conveyor. The conveyor transports (Figure 64 to Figure 68) the mineralized material to the satellite pump station where it is mixed with water to form a slurry then pumped to the processing plant. In other cases, the FELs load directly onto trucks for transport to the processing plant. ERGO’S TECHNICAL REPORT SUMMARY OF THE MATERIAL TAILINGS STORAGE FACILITIES PAGE 127 127 Figure 64: Example of Loading with a FEL Figure 65: Example of Loading with a FEL into a Hopper ERGO’S TECHNICAL REPORT SUMMARY OF THE MATERIAL TAILINGS STORAGE FACILITIES PAGE 128 128 Figure 66: Example of Material on Conveyor Figure 67: Slurry Point for Loading


ERGO’S TECHNICAL REPORT SUMMARY OF THE MATERIAL TAILINGS STORAGE FACILITIES PAGE 129 129 Figure 68: Example of Transportation Truck Prior to Loading Activities 13.4. Geotechnical and Geohydrology The Witwatersrand TSFs have been successfully and economically exploited for some time, and the geotechnical and geohydrology characteristics are well understood from practical experience. A safe bench height is dependent upon the material being mined and is also influenced by the phreatic surface within the dump. No geotechnical or hydrological risks surrounding Ergo’s operations have been identified that would impact the declaration of a Mineral Reserve. As no open pit mining is taking place, the mine design does not account for slope angles but rather the natural angle of repose from hydraulic mining. To ensure the competency of the wall, an angle of 45˚ is used for mining (Figure 69). No geotechnical or hydrological factors affecting the surface deposits are significant to the Ergo operations. However, the QP is aware that a FEL loader operator sustained fatal injuries (FY2024) when a sidewall slip at the 5L27 TSF impacted the loader he was operating. The mining bench heights are approximately 15 m. Hydraulic mining supplies the slurry feedstock to the mineral beneficiation plant continuously. To maintain production, it is essential to ensure high water pressure. Consistent high slurry densities are critical to hydraulic mining; if densities decrease, less tonnage will be delivered to the plant, leading to an increase in unit mining costs. The following series of steps offer an overview of the hydraulic mining process:  the water monitor washes the slime material of approximately 15m high benches with a mining width of 15m and a length of 9m or more (“mining cut”);  monitoring will be conducted from the bench of the TSF (i.e., top-down approach);  the resulting slurry stream is channelled in the 15m wide mining cut, which forms a trough to ensure a good flow of the slurry material to the pumps, which will then transport the slurry to the processing plant; and  approximately 6,950t/d (316tph) per water monitor is achievable equating to four hydraulic monitors to produce 600ktpm. ERGO’S TECHNICAL REPORT SUMMARY OF THE MATERIAL TAILINGS STORAGE FACILITIES PAGE 130 130 The operating position of the monitor will be on the top of the mining cut and operating at a 45˚ angle, as seen Figure 69. The reclamation gun position and bench angles are based on experience and on-site observations. Figure 69: Hydraulic Mining with Monitor showing Distance and Angle When FELs are used, care is taken to ensure that there is no undermining of the TSF highwall with operators being cognisant of the risks related to slumping highwalls. Dozers are used to remove over hanging material where required. No geotechnical or hydrological aspects affecting the surface deposits are significant to the operation. 13.5. Requirements for Stripping As no underground mining is conducted, there is no underground development and backfilling required. In general, minimal precleaning (grubbing) with a dozer at the top of the TSFs is required, however the QP notes that a couple of TSFs contain municipality rubbish (~ 4 to 5m thick) on top, for example 4L39. Figure 70 provides a typical example of vegetation that would need to be cleared before commencing mining operations. ERGO’S TECHNICAL REPORT SUMMARY OF THE MATERIAL TAILINGS STORAGE FACILITIES PAGE 131 131 Figure 70: Vegetation on top of 3L7 (Mooifontein) 13.6. Mining Equipment and Personnel Requirements The equipment required for hydraulic mining is as follows:  Track mounted hydraulic monitor;  Water columns, 250mm diameter pipes to feed water to the hydraulic monitor;  Vibrating screen to remove debris from slurry;  Satellite pump stations to pump slurry to main pump station; and  Main pumping station. For loading of sand, excavators, dozers, FELs trucks and conveyors are required as shown in the previous Section 13.2.2. Ergo employs 693 full time employees and 1945 special service providers, with service providers deployed mostly in security, reclamation and tailings deposition. 13.7. Mining Sections Ergo re-treats slimes and sand dumps from three sections, the West Section, Central Section and the East Section. Figure 71 provides an overview of Ergo’s operations mining a total of 440.03Mt. 13.7.1. West Rand No Mineral Reserve was declared. 13.7.2. Central Rand – City Section Mining areas located from the Central Rand are planned to be loaded and hauled to the City Deep Basin or alternatively 4L25. Slurry is pumped from the City Deep Basin via a 600ktpm (500mm NB pipe) pipeline to the Ergo processing plant. ERGO’S TECHNICAL REPORT SUMMARY OF THE MATERIAL TAILINGS STORAGE FACILITIES PAGE 132 132 Table 60 and Table 61 depict the working places in the Central Rand City Section and Knights Section respectively. The Knights Section includes material from Upwards Spiral that is included in the LoM plan but as the site is being mined/toll treated on a contract basis, it is not included in the Mineral Reserve.


ERGO’S TECHNICAL REPORT SUMMARY OF THE MATERIAL TAILINGS STORAGE FACILITIES PAGE 133 133 Figure 71: Ergo Operations Overview (Note: For overview purposes only) ERGO’S TECHNICAL REPORT SUMMARY OF THE MATERIAL TAILINGS STORAGE FACILITIES PAGE 134 134 Table 60: Central Rand (City Section) Workplace Tonnage (kt) Grade Au (g/t) Recovery (%) Commentary 3L5 (Diepkloof) 96,574 0.23 42.1 3L7 (Mooifontein) 67,486 0.23 42.1 3L8 (GMTS) 107,896 0.24 36.8 4L3 8,127 0.32 48.3 4L4 2,198 0.37 50.8 4L6 4,738 0.32 55.6 Rosherville 3,375 1.07 68.4 Valley Silts 1,287 0.99 51.8 Total 291,681 0.25 42.2 Source: The RVN Group, 2025 13.7.3. Central Rand – Knights Section Table 61: Central Rand (Knights Section) Workplace Tonnage (kt) Grade Au (g/t) Recovery (%) Commentary 4A18 120 0.49 65.3 4L14 4 012 0.29 53.1 4L39 7 500 0.28 29.9 Upward spiral 1 800 0.48 65.3 Purchased mineralized material Total 13 432 0.31 44.1 Source: The RVN Group, 2025 13.7.4. East Rand – Ergo Section Table 62 indicates the TSF planned working sites located in the East Rand - Ergo Section, including sites that are being mined on a contract basis (5L25 TSFs), which are not included in the Mineral Reserve. 5L23 represents a TSF declared as an Indicated Mineral Resource, but remains a Mineral Resource as the plant recovery was determined to require further test work. Table 62: East Rand Section (Ergo Section) Workplace Tonnage (kt) Grade (g/t) Recovery (%) Commentary 5L23 3 860 0.30 58.3 Indicated Resource, 5L25 1 000 0.47 65.3 Contract -Toll Processing 5L27 1 618 0.28 40.7 6L13 1 789 0.48 48.7 6L14 6 980 0.36 46.4 7L15 17 909 0.34 37.5 Benoni Slime 300 0.35 46.5 Rooikraal 47 351 0.26 33.5 Marievale 7L4 17 590 0.29 51.5 Marievale 7L5 6 980 0.29 32.1 Marievale 7L6 12 760 0.26 40.7 Marievale 7L7 16 784 0.32 33.3 Total 134 921 0.29 38.89 Source: The RVN Group, 2025 13.8. Mine Design and Schedule The technical work/studies conducted by Ergo to support the conversion of Mineral Resources to Mineral Reserves and to generate the on-going LoM plan are at least to a Pre-Feasibility Study (PFS) level. The LoM schedule mines approximately ERGO’S TECHNICAL REPORT SUMMARY OF THE MATERIAL TAILINGS STORAGE FACILITIES PAGE 135 135 19.2 to 21.6 Mtpa from several TSF sites. A total of 440.03Mt at a grade of 0.27g/t producing 48,401kg of gold, is included in the LoM. Noting that the LoM includes 6.66Mt (0.38g/t) of non-mineral reserve mineralized material (Indicated resources and 3rd party material), resulting in the LoM plan supporting a Mineral Reserve of 433.37Mt at a RoM grade of 0.26g/t (46,648kg of gold). Table 63 provides the modifying factors used to convert the Mineral Resources to a Mineral Reserve used in the 22-year LoM Plan. Due to the nature of mining TSFs, no mining loss or dilution is applied during the conversion process. Recovery factors are determined based on metallurgical testing and the actual performance of the processing plant, which are reconciled on a quarterly and annual basis. The LoM recovery is lower than recent recoveries experienced, as the LoM includes lower-grade TSFs with associated lower recoveries. Table 63: Summary of Modifying Factors for the LoM Plan Table 64, Figure 72 and Figure 73 provide the 30 June 2025 22-year LoM tonnage and recovered gold schedule used to support the declaration of the Mineral Reserve. The June 2025 LoM plan has a cut-off grade of 0.20g/t, which is below the planned LoM head grade of 0.27 g/t. The LoM plant recovery of 41.4% and working cost of ZAR139/t are based on the LoM totals and a gold price of ZAR1,689,997/kg. The current LoM is very robust. However, it remains sensitive to RoM grade, gold price, recovery and operating costs. Source Area/Plant MCF (%) LoM Recovery (%) Mining Loss (%) Dilution (%) Ergo Mine 100 *41.4 0 0 *Recovery represents all mineral reserve and excluded TSFs being toll treated ERGO’S TECHNICAL REPORT SUMMARY OF THE MATERIAL TAILINGS STORAGE FACILITIES PAGE 136 136 Table 64: Ergo’s Forecast of Production from July 2025 to June 2047 Years 1 2 3 4 5 6 7 FY2026 FY2027 FY2028 FY2029 FY2030 FY 2031 FY2032 Tonnes (kt) Recovered Au (kg) Tonnes (kt) Recovered Au (kg) Tonnes (kt) Recovered Au (kg) Tonnes (kt) Recovered Au (kg) Tonnes (kt) Recovered Au (kg) Tonnes (kt) Recovered Au (kg) Tonnes (kt) Recovered Au (kg) Ergo 8 560 1 130 8 628 1 129 9 990 1 176 13 200 1 540 13 540 1 421 12 825 1 262 12 600 1 232 City 5 950 1 268 6 240 1 476 6 600 1 484 6 600 1 139 7 760 1 252 8 775 1 400 9 000 875 Knights 5 290 919 4 93 660 3 210 272 - - - - - - - Total 19 800 3 317 19 800 3 265 19 800 2 932 19 800 2 678 21 300 2 672 21 600 2 302 21 600 2 108 Years 8 9 10 11 12 13 14 FY2033 FY2034 FY2035 FY2036 FY2037 FY2038 FY2039 Tonnes (kt) Recovered Au (kg) Tonnes (kt) Recovered Au (kg) Tonnes (kt) Recovered Au (kg) Tonnes (kt) Recovered Au (kg) Tonnes (kt) Recovered Au (kg) Tonnes (kt) Recovered Au (kg) Tonnes (kt) Recovered Au (kg) Ergo 12 600 1 469 12 600 1 549 12 050 1 513 7 319 801 3 600 452 3 600 452 3 600 452 City 9 000 875 9 000 875 9 550 929 14 281 1 335 18 000 1 577 18 000 1 577 18 000 1 577 Knights - - - - - - - - - - - - - - Total 21 600 2 344 21 600 2 425 20 590 2 442 21 600 2 136 21 600 2 029 21,600 2 029 21,600 2 029 Years 15 16 17 18 19 20 21 FY2040 FY2041 FY2042 FY2043 FY2044 FY2045 FY2046 Tonnes (kt) Recovered Au (kg) Tonnes (kt) Recovered Au (kg) Tonnes (kt) Recovered Au (kg) Tonnes (kt) Recovered Au (kg) Tonnes (kt) Recovered Au (kg) Tonnes (kt) Recovered Au (kg) Tonnes (kt) Recovered Au (kg) Ergo 209 26 - - - - - - - - - - - - City 19 191 1 681 19 200 1 682 19 200 1 775 19 200 1 875 19 200 1 875 19 200 1 875 19 200 1 875 Knights - - - - - - - - - - - - - - Total 19 400 11 707 19 200 1 682 19 200 1 775 19 200 1 875 19 200 1 875 19 200 1 875 19 200 1 875 Years 22 Total FY2047 Tonnes (kt) Recovered Au (kg) Tonnes (kt) Recovered Au (kg) Ergo 0 - 134 921 15 606 City 10 534 1 029 291 681 30 945 Knights - - 13 432 1 850 Total 10 534 61 029 440 034 48 401 Source: Ergo, 2025


ERGO’S TECHNICAL REPORT SUMMARY OF THE MATERIAL TAILINGS STORAGE FACILITIES PAGE 137 137 Figure 72: LoM Plan - Annual Tonnage Figure 73: LoM Plan - Recovered Gold (kgs) ERGO’S TECHNICAL REPORT SUMMARY OF THE MATERIAL TAILINGS STORAGE FACILITIES PAGE 138 138 13.9. Material TSFs In defining the material properties Ergo applies one of the following criteria:  The TSFs with over 5Mt or a cluster of no more than three TSFs collectively exceeding 10Mt and the dumps are in the Life of Mine (LoM) plan.  The qualitative criteria as deemed crucial by the company. Table 65: Material TSFs Section TSF Tonnes (t) 2023 TRS 2025 TRS Central (City) Section City Deep 15,062,430 4L3 8,127,040 Yes Yes 4L4 2,2197,887 Yes Yes 4L6 4,737,503 Yes Yes Crown Complex 271,956,573 3L5 (Diepkloof) 96,574,191 Yes Yes 3L7 (Mooifontein) 67,486,382 Yes Yes 3L8 (GMTS) 107,896,000 Yes Yes Central (Knights) Section Knights 11,512,117 4L4 4,012,117 Yes Yes 4L39 7,240,000 No Yes East Section Ergo 72,377,191 Rooikraal 47,351,296 Yes Yes 7L15 17,908,809 Yes Yes 6L14 6,980,000 No Yes Marievale 54,114,000 7L4 17,590,000 Yes Yes 7L5 6,980,000 Yes Yes 7L6 12,760,000 Yes Yes 7L7 16,784,000 Yes Yes Total Material Dumps 15 425,022,311 13.9.1. Central Rand Section – City Section The Central Rand Section (City Section) is made up of two areas; City Deep area and the Crown Complex. The City Section produce some 287.06 Mt over a 22-year period. 13.9.2. City Deep - 4L3, 4L4 and 4L6 TSFs The 4L3, 4L4 and 4L6 TSFs are mined over a four-year period producing some 15.06t. Figure 74, Figure 75, and Figure 76 provide top, isometric, grade views and cross sectional views generated by the Deswik mine planning consultants of the three TSFs that make up the 4L3, 4L4, and the 4L6 TSFs. The reader should note that Deswik generated similar views for all the TSFs included in the LoM plan. ERGO’S TECHNICAL REPORT SUMMARY OF THE MATERIAL TAILINGS STORAGE FACILITIES PAGE 139 139 Table 66: Mine Schedule for 4L3, 4L4 and 4L6 Years 1 2 3 FY2026 FY2027 FY2028 Workplace Tonnes (kt) RoM Grade (g/t) Recovery (%) Tonnes (kt) RoM Grade (g/t) Recovery (%) Tonnes (kt) RoM Grade (g/t) Recovery (%) 4L3 3,730 0.320 48.3 2,927 0.320 48.3 1,470 0.320 48.3 4L4 1,380 0.370 50.8 818 0.370 50.8 - - - 4L6 - - - 1,508 0.320 55.6 3,230 0.320 55.6 Figure 74: Deswik mine planning views of 4L3 Figure 75: Deswik mine planning views of 4L4 TSF ERGO’S TECHNICAL REPORT SUMMARY OF THE MATERIAL TAILINGS STORAGE FACILITIES PAGE 140 140 Figure 76: Deswik mine planning views of 4L6 TSF 13.9.3. Crown Complex The Crown Complex totals 271.96Mt and is made up of 3L5 (Diepkloof), 3L7 (Mooifontein), and 3L8 (GMTS). The following tables (Table 67, Table 68, and Table 69) provide the planned mine schedule for the three TSFs. Table 67: Mine Schedule for 3L5 (Diepkloof) Years 17 18 19 FY2042 FY2043 FY2044 workplace Tonnes (kt) RoM Grade (g/t) Recovery (%) Tonnes (kt) RoM Grade (g/t) Recovery (%) Tonnes (kt) RoM Grade (g/t) Recovery (%) 3L5 (Diepkloof) 9,240 0.23 42.1 19,200 0.23 42.1 19,200 0.23 42.1 Years 20 21 22 FY2045 FY2046 FY2047 workplace Tonnes (kt) RoM Grade (g/t) Recovery (%) Tonnes (kt) RoM Grade (g/t) Recovery (%) Tonnes (kt) RoM Grade (g/t) Recovery (%) 3L5 (Diepkloof) 19,200 0.23 42.1 19,200 0.23 42.1 10,534 0.23 42.1 Table 68: Mine Schedule for 3L7 (Mooifontein) Years 3 4 5 FY2028 FY2029 FY2030 workplace Tonnes (kt) RoM Grade (g/t) Recovery (%) Tonnes (kt) RoM Grade (g/t) Recovery (%) Tonnes (kt) RoM Grade (g/t) Recovery (%) 3L7 (Mooifontein) 1,060 0.23 42.1 5 760 0.23 42.1 6,920 0.23 42.1 Years 6 7 8 FY2031 FY2032 FY2033 workplace Tonnes (kt) RoM Grade (g/t) Recovery (%) Tonnes (kt) RoM Grade (g/t) Recovery (%) Tonnes (kt) RoM Grade (g/t) Recovery (%) 3L7 (Mooifontein) 8,460 0.23 42.1 9 000 0.23 42.1 9,000 0.23 42.1 Years 9 10 11 FY2034 FY2035 FY2036 Workplace Tonnes (kt) RoM Grade (g/t) Recovery (%) Tonnes (kt) RoM Grade (g/t) Recovery (%) Tonnes (kt) RoM Grade (g/t) Recovery (%) 3L7 (Mooifontein) 9 000 0.23 42.1 9 550 0.23 42.1 8,736 0.23 42.1


ERGO’S TECHNICAL REPORT SUMMARY OF THE MATERIAL TAILINGS STORAGE FACILITIES PAGE 141 141 Table 69: Mine Schedule for 3L8 (GMTS) Years 11 12 13 FY2036 FY2037 FY2038 Workplace Tonnes (kt) RoM Grade (g/t) Recovery (%) Tonnes (kt) RoM Grade (g/t) Recovery (%) Tonnes (kt) RoM Grade (g/t) Recovery (%) 3L8 (GMTS) 5,545 0.24 36.8 18,000 0.24 36.8 18,000 0.24 36.8 Years 14 15 16 FY2039 FY2040 FY2041 Workplace Tonnes (kt) RoM Grade (g/t) Recovery (%) Tonnes (kt) RoM Grade (g/t) Recovery (%) Tonnes (kt) RoM Grade (g/t) Recovery (%) 3L8 (GMTS) 18,000 0.24 36.8 19,191 0.24 36.8 19,200 0.24 36.8 Years 17 FY2042 Workplace Tonnes (kt) RoM Grade (g/t) Recovery (%) Tonnes (kt) RoM Grade (g/t) Recovery (%) Tonnes (kt) ROM Grade (g/t) Recovery (%) 3L8 (GMTS) 9,960 0.24 36.8 13.9.4. Central Rand Section – Knights Section The Central Rand section (Knights ~Section) is made up the 4L14 and the 4L39 TSTs that will be mined from FY2026 to FY2028 (Table 70). Table 70: Mine Schedules for 4L14 and 4L39 TSFs Years 1 2 3 FY2026 FY2027 FY2028 workplace Tonnes (kt) RoM Grade (g/t) Recovery (%) Tonnes (kt) RoM Grade (g/t) Recovery (%) Tonnes (kt) RoM Grade (g/t) Recovery (%) 4L14 2,880 0.28 53.1 1,132 0.28 53.1 4L39 1,210 0.28 29.9 3,080 0.28 29.9 3,210 0.28 29.9 13.9.5. East Rand Section – Ergo Section The east Rand Section (Ergo Section) is made up of the Rooikraal TSF, the 6L14 TSF, 7L15 TSF, and the Marievale Complex. Table 71: Mine Schedules for Rooikraal TSF Years 1 2 3 FY2026 FY2027 FY2028 Workplace Tonnes (kt) RoM Grade (g/t) Recovery (%) Tonnes (kt) RoM Grade (g/t) Recovery (%) Tonnes (kt) RoM Grade (g/t) Recovery (%) Rooikraal 4 802 0.26 33.5 5 279 0.26 33.5 5 800 0.26 33.5 Years 4 5 6 FY2029 FY2030 FY2031 Workplace Tonnes (kt) RoM Grade (g/t) Recovery (%) Tonnes (kt) RoM Grade (g/t) Recovery (%) Tonnes (kt) RoM Grade (g/t) Recovery (%) Rooikraal 4 200 0.26 33.5 5 200 0.26 33.5 5 400 0.26 33.5 Years 7 8 9 FY2032 FY2033 FY2034 Workplace Tonnes (kt) RoM Grade (g/t) Recovery (%) Tonnes (kt) RoM Grade (g/t) Recovery (%) Tonnes (kt) RoM Grade (g/t) Recovery (%) Rooikraal 5,400 0.26 33.5 5,400 0.26 33.5 5,400 0.26 33.5 Years 10 FY2035 Workplace Tonnes (kt) RoM Grade (g/t) Recovery (%) Tonnes (kt) RoM Grade (g/t) Recovery (%) Tonnes (kt) RoM Grade (g/t) Recovery (%) Rooikraal 470 0.260 33.5 ERGO’S TECHNICAL REPORT SUMMARY OF THE MATERIAL TAILINGS STORAGE FACILITIES PAGE 142 142 Table 72 and Table 73 depict mine schedules for 6L14 and 7L15 TSFs Table 72: Mine Schedules for 6L14 Years 3 4 5 FY2028 FY2029 FY2030 workplace Tonnes (kt) RoM Grade (g/t) Recovery (%) Tonnes (kt) RoM Grade (g/t) Recovery (%) Tonnes (kt) RoM Grade (g/t) Recovery (%) 6L14 2,140 0.36 46.4 3,600 0.36 46.4 1,240 0.36 46.4 Table 73: Mine Schedules for 7L15 TSF Years 10 11 12 FY2035 FY2036 FY2037 workplace Tonnes (kt) RoM Grade (g/t) Recovery (%) Tonnes (kt) RoM Grade (g/t) Recovery (%) Tonnes (kt) RoM Grade (g/t) Recovery (%) 7L15 3,300 0.34 37.5 3,600 0.34 37.5 3,600 0.34 37.5 Years 13 14 15 FY2038 FY2039 FY2040 workplace Tonnes (kt) RoM Grade (g/t) Recovery (%) Tonnes (kt) RoM Grade (g/t) Recovery (%) Tonnes (kt) RoM Grade (g/t) Recovery (%) 7L15 3,600 0.34 37.5 3,600 0.34 37.5 209 0.34 37.5 13.9.6. Marievale Complex Table 74: Mine Schedules for the Marievale Complex Years 3 4 5 FY2028 FY2029 FY2030 workplace Tonnes (kt) RoM Grade (g/t) Recovery (%) Tonnes (kt) RoM Grade (g/t) Recovery (%) Tonnes (kt) RoM Grade (g/t) Recovery (%) 7L4 - - - - - - - - - 7L5 - - - - - - - - - 7L6 - - - - - - - - - 7L7 590 0.32 33.3 5,400 0.32 33.3 7,100 0.32 33.3 Years 6 7 8 FY2031 FY2032 FY2033 workplace Tonnes (kt) RoM Grade (g/t) Recovery (%) Tonnes (kt) RoM Grade (g/t) Recovery (%) Tonnes (kt) RoM Grade (g/t) Recovery (%) 7L4 - - - - - - 5 371 0.29 51.5 7L5 - - - - - - - - - 7L6 3,731 0.26 40.7 7,200 0.26 40.7 1,829 0.26 40.7 7L7 3,694 0.32 33.3 - - - - - - Years 9 10 11 FY2034 FY2035 FY2036 workplace Tonnes (kt) RoM Grade (g/t) Recovery (%) Tonnes (kt) RoM Grade (g/t) Recovery (%) Tonnes (kt) RoM Grade (g/t) Recovery (%) 7L4 7,200 0.29 51.5 5,019 0.29 51.5 - - - 7L5 - - - 3,261 0.29 32.1 3,719 0.29 32.1 7L6 - - - - - - - - - 7L7 - - - - - - - - - ERGO’S TECHNICAL REPORT SUMMARY OF THE MATERIAL TAILINGS STORAGE FACILITIES PAGE 143 143 14. PROCESSING AND RECOVERY METHODS 14.1. Introduction The Ergo processing plant located in Brakpan is Ergo’s flagship metallurgical plant which currently targets throughput between 19.8 to 21.6Mtpa. The City Deep plant has been reconfigured to operate as a pump station and feed the Ergo processing plant via a 50km pipeline. The City Deep plant recovers ore from the Central Rand areas of Johannesburg mine’s dumps, with mining operations scheduled to close in FY2029. Knights Plant treats sand and slime and will operate until FY2029. Ergo processing plant follows the conventional method of extracting gold. The plant has been in operation for more than 30 years, with minor improvements and maintenance conducted on a regular basis. Ergo retreats historical tailings, and the remaining gold in the TSFs is finely disseminated within the material. The gold does not respond to physical recovery methods. Direct cyanidation has been used for decades to solubilize the gold and then recover it by hydrometallurgical techniques. The Carbon in leach (CIL) process is used with elution and final recovery by zinc cementation which produces bullion. 14.2. Plant Feed Grade and Metallurgical Test Work The Ergo processing plant is fed from several different mining sites that are being mined and fed into the plant at any one time. Slimes material which is the product of previous rotating mills, is mined hydraulically and in some cases with FEL feeding a batch plant where the material is slurried and pumped to the beneficiation plant. The feed grade is obtained by taking a sample from the re-pulped slurry. Sand material which is the product of previous stamp milling, is taken from the face of the sand dumps before re-pulping. Daily composites are submitted to the assay laboratory for grade determination to assist with the management of the operations. A sub-sample is split and composited over a week for metallurgical test work. A bottle roll test is conducted utilizing the same parameters that are used on the full-scale plant. Should any deviations be reported, further investigations are undertaken. Prior to commencing reclamation of any mineralized material (ore), a comprehensive drilling exercise is carried out. As part of the evaluation, sub-samples are sent to Ergo’s in-house metallurgical research laboratory for testing to assess the amenability of the material to cyanidation and what recoveries can be expected. Mineralogy work is not carried out on a routine basis but on a needs basis associated with the exploration program. Sand material that is coarse in nature, is first milled prior to cyanidation, while slimes material is processed without pre- milling. All feed streams are combined before removing extraneous oversize, which could contaminate the activated carbon, over linear screens. The material is then leached with cyanide at an elevated pH in mechanically agitated tanks. Activated carbon is then used to adsorb the dissolved gold. The loaded carbon is then removed from the circuit and the gold eluted off the carbon. The gold is then finally recovered using zinc precipitation and smelting of bullion bars. The tailings are currently pumped to Brakpan TSF located south of the Ergo processing plant. Plans are currently underway to recommission the adjacent Withok TSF to create additional capacity of 310Mt, as the Brakpan TSF is approaching its final phase as a mega-volume tailings deposition facility. The Brakpan and Withok TSFs as of June 2025 have a remaining capacity of approximately (~372Mt). The Daggafontein TSF will have a deposition capacity of 120Mt and a life of 20 years, at a deposition rate of between 500,000tpm and 750,000tpm. Resumption is expected to be completed in the first quarter ERGO’S TECHNICAL REPORT SUMMARY OF THE MATERIAL TAILINGS STORAGE FACILITIES PAGE 144 144 of FY2027. Construction of the 21km dual pipeline (tailings and return water) linking Ergo's Brakpan plant with the TSF is well advanced and on schedule for completion in time for the commissioning of the Daggafontein TSF. The Ergo plant capacity is 64 000 tonnes per day (tpd) and gold recovery is between 30% and 68%. A 100% mine call factor is applied at the Ergo processing plant. For planning purposes, Ergo uses the RoM head grade, i.e. the grade of the ore as delivered to the processing plant and the anticipated residue grade to estimate the recovery, i.e. head grade minus residue grade multiplied by the tonnage treated. During the life of each TSF, the mined grade is monitored and compared to the estimated mineral reserve grade. Generally, these grades tend to track each other. When the TSF is completely mined, a final reconciliation is conducted. Metallurgical test work is carried out routinely using laboratory equipment and leach conditions, which closely mimic the full-scale operation. The test work is considered representative as historical results are consistent, and generally minor deviations are observed on numerous tests from the same source material. Each material differs slightly in terms of head grade, particle size and origin, so different recovery factors are used for each source. Due to the consistency of the exploration metallurgical test work, no bulk sampling or pilot scaling test work is conducted. No specific assumptions or allowances are made for deleterious elements in the mineralized material. They are either screened out before entering the processing plant or if they cannot be removed the metallurgical test work results will include the impact. If the impact is too great, the material will not be treated. Cyanidation of gold bearing material, with elution of gold from the loaded carbon is a tried and tested process and there is nothing novel about the process. Figure 77 presents the Ergo processing plant flow diagram.


ERGO’S TECHNICAL REPORT SUMMARY OF THE MATERIAL TAILINGS STORAGE FACILITIES PAGE 145 145 Figure 77: Process Plant Flow Diagram ERGO’S TECHNICAL REPORT SUMMARY OF THE MATERIAL TAILINGS STORAGE FACILITIES PAGE 146 146 Table 75 indicates the process recoveries for the various plants for the past two years, and the planned average recoveries over the 22-year LoM. The recoveries are based on metallurgical testwork for the various TSFs, slimes and silted vleis that are scheduled to be mined over the 22-year LoM plan. Table 75: Ergo Process Recoveries Description 2023/2024 2024/2025 2025 LOM Average Ergo 55.5% 49.1% 41.4% 14.3. Mineral Process and Equipment Characteristics 14.3.1. Reception Material received from the various mining sites is first sampled through slurry samplers and then thickened in four large thickeners to produce an underflow with an SG of 1.45t/m3 for leaching and for recovery of excess water. 14.3.2. De-sanding Section Thickened material from the four large thickeners is pumped to a distribution box in the de-sanding section. Here the tailings can be directed to four linear screens which have an 850-micron aperture cloth for the removal of debris to prevent contamination of the carbon. The undersize from the linear screens is pumped up to a two-way distribution box ahead of the leach. 14.3.3. Carbon in Leach (CIL) The CIL section comprises of two streams of 11 tanks per stream. Each tank has a capacity of 2,000m3 and at a throughput of 1.8Mtpm gives a leach residence time of about 11.5 hours with the first tank being used for pre- conditioning with lime and oxygen. Cyanide is added to the second and fourth tanks in the leach train. Carbon is present in all but the first two tanks and is retained by interstage screens. Carbon is moved counter-current up the leach using recessed impeller pumps. The carbon concentration in the tanks is about 10g/l. Loaded carbon is transferred to the four loaded carbon hoppers over vibrating screens. Loaded carbon values vary between 200g/t and 300g/t. CIL tailings flows through residue samplers before passing over four safety linear screens. Screened material reports to a residue sump from where it is pumped to the TSF through three tailings pipelines using five of six installed D-frame pumps. 14.3.4. Carbon Treatment Loaded carbon is acid treated in 8.5t batches in three independent acid wash columns. The carbon then reports to four elution columns. Another dedicated column is used to scavenge gold from the zinc precipitation tails. Loaded carbon is first washed with dilute hydrochloric acid to remove acid soluble contaminants. Acid washed carbon is transferred to the elution column which is operated at elevated temperature and pressure to strip gold off the carbon using a cyanide / caustic solution (eluant). The eluate, which now contains the gold in solution is contacted with ultra-fine zinc powder to precipitate the gold. This gold bearing sludge is then filtered in a plate and frame filter. Sludge is then calcined at 600 Degree C before being smelted in an arc furnace and cast into dorè bars. ERGO’S TECHNICAL REPORT SUMMARY OF THE MATERIAL TAILINGS STORAGE FACILITIES PAGE 147 147 Eluted carbon is regenerated in three rotating kilns operating at temperatures of about 750 Degree C. In total, about 125 elutions are conducted monthly. 14.4. Plant Services 14.4.1. Instrument Air Instrument air is supplied to the float from one compressor house and the remainder of the plant from a centrally located facility. 14.4.2. Blower Air Blower air is supplied to the float cells by one of four low pressure units. 14.4.3. Process Water Process water is made up of thickener overflow and return dam water and is distributed throughout the plant by a network of pumps and pipes. 14.4.4. Fresh Water Rand Water Board water is received at a reservoir for use in the process and directly for fire hydrants and human consumption. 14.5. Natural Gas Natural gas is obtained by pipeline from Sasol and used for elution heating purposes. 14.6. Assay Laboratory All assays are conducted by MAED laboratory which is located on the Ergo site but is operated by an independent third party. The laboratory is not accredited by SANAS. 14.7. Personnel Requirements Ergo employs 693 full time employees and 1945 special service providers, with service providers deployed mostly in security, reclamation and tailings deposition. 14.8. Energy and Water Requirements Bulk power is supplied to the Ergo processing plant by the Eskom, Solar and BESS. Energy and water requirements are discussed in sections 15.3 and 15.5. 14.9. Process Materials Requirements Ergo has access to all required process material required through their local or international suppliers. ERGO’S TECHNICAL REPORT SUMMARY OF THE MATERIAL TAILINGS STORAGE FACILITIES PAGE 148 148 15. INFRASTRUCTURE Ergo currently mines the existing TSFs and sand dumps in the Johannesburg and Brakpan areas with slurry pumped via pipelines from the numerous mining operations to the Ergo processing plant located in Brakpan. Ergo has removed the Daggafontein TSF from the LoM plan to become a tailings deposition site and is busy with the design of the Withok TSF to enable the mining of the Crown Complex. All design work by Ergo is being undertaken to at least a PFS level of accuracy (i.e., +/-25%) with a maximum level of contingency of 15%. Infrastructure requirements and capital costs are based on sustaining current and planned mining operations, as well as the development of the Daggafontein and Withok deposition sites (TSFs). The use of railways, port facilities, dams, leach pads and other infrastructure components are not discussed below as they are not material infrastructure components the Ergo operations. 15.1. Roads Access to the mining sites is via current municipal and regional road networks with no construction or upgrading of unpaved roads. 15.2. Site Offices and Workshops The mining contractors establish site offices as part of the mining contract. Workshops for the maintenance of roads, pumps and pipelines are based at the Ergo processing plant, and no additional infrastructure is required. 15.3. Power Bulk power is supplied to Ergo by Eskom and the newly commissioned Ergo Solar plant and integrated battery energy storage system . The power grid infrastructure serving the East Rand is particularly extensive, with electrical power being received through several alternative substations on the Eskom grid. Mining sites are supplied via several separate feeders with Ergo’s total electrical demand reaching approximately 50 MW. Although Ergo has invested in constructing its own 60MW solar PV plant integrated with a 160mWh battery energy storage system, which was fully commissioned on 1 November 2024, power supply is still viewed as a risk to Ergo operations as a result of the unpredictable state of national electricity supplier Eskom. A risk-mitigating measure that has been implemented by Ergo is the provision of back-up power and other engineering upgrades to prevent plant choke-up/silt-down during power interruptions. These measures have enabled the processing plant to resume full production without extensive delay after each power interruption. Ergo has a curtailment agreement with Eskom whereby the total consumption is reduced on request by an agreed percentage during load-shedding hours. This involves reducing total consumption by between 4MVA and 8MVA during load-shedding hours. The reduction in the power consumption results in the operations maintaining an uninterrupted tonnage throughput, but recoveries are lower due to certain parts of the process plant not operating during the load reduction periods. 15.4. Pumps and Pipelines Slurry transport is mainly via pipelines that carry it to the Ergo processing plant (Figure 78). Ergo uses a standard set of pipes and pumps (500mm pipes). Equipment selection is based on the most suitable sizes from the standard equipment range.


ERGO’S TECHNICAL REPORT SUMMARY OF THE MATERIAL TAILINGS STORAGE FACILITIES PAGE 149 149 Figure 78: Above Ground Pipeline System The pipelines are mainly installed above ground, providing access for maintenance and making it easier to identify and rectify any failures on these pipelines. Where necessary, pipe bridges are used along the pipeline routes to cross streams and rivers. The existing pumping and slurry pipeline systems are managed through a supervisory control and data acquisition (SCADA) system. The SCADA system allows Ergo to operate the equipment remotely. Thereby, Ergo can monitor the entire pipeline system via a centralized system. For example, pumps and valves can be used (open/closed or on/off), and readings taken (pressures and flows) from the centralized site, with no actual human-machine interface on the actual site. As the pumps are installed with a duty and standby configuration, the operation of the existing and planned pumping and pipeline systems should be adequate to support the requirements of the LoM plan. Operations west of the Ergo processing plant are serviced by pipeline and other existing infrastructure. The Marievale mining areas east of the processing plant have pipeline permits/servitudes/surface rights in place. The QP has not identified any impediments that would prevent the construction of the necessary infrastructure to support the LoM plan. Similarly, the Crown Complex located west of the processing plant also has pipeline permits/servitudes/surface rights in place. 15.5. Water The primary uses for water are in the Ergo processing plant and for hydraulic mining of the various TSFs. Water used for hydraulic mining turns the dry tailings into a slurry, which is then pumped to the processing plant for processing. Excess water recovered at the thickeners in the processing plant is then returned to the hydraulic mining sites for re- use. However, the main source of water for reclamation purposes is derived from the Brakpan TSF as return water in a “closed circuit”. Ergo also makes use of a central water reticulation plant to provide Ergo the ability to deliver water to all parts of the operation and return it through a fully integrated closed system. ERGO’S TECHNICAL REPORT SUMMARY OF THE MATERIAL TAILINGS STORAGE FACILITIES PAGE 150 150 Currently 60% to 70% of all process make up water at Ergo is drawn from the Brakpan TSF to various reclamation sites by way of return water columns. A further 16% of process water top-up requirements are from treated underground acid mine drainage (AMD), drawn from a facility operated by the Trans-Caledon Tunnel Authority (TCTA,) from whom DRDGOLD has secured the right to use up to 30Ml of AMD water per day. Another 14% is from dams in the region that capture the inflow of seasonal rain and storm water inflows, harvested in terms of the requisite extraction licenses. Potable water is used only where the sensitivity of equipment requires it and for certain early stages of dry land vegetation established on Brakpan TSF. Given the location of the Ergo operations, the QP does not foresee the likelihood of the operations being curtailed due to a water shortage. 15.6. Infrastructure General arrangement drawings are provided for the 3L7 (Mooifontein) TSF to demonstrate design work typical of a mining site (Figure 79). The actual construction work will vary slightly to account for specific site conditions, but generally, the infrastructure is common from site to site, with 24 TSFs planned to be mined over the 22-year LoM plan. ERGO’S TECHNICAL REPORT SUMMARY OF THE MATERIAL TAILINGS STORAGE FACILITIES PAGE 151 151 Figure 79: Mooifontein General Arrangement - Site Layout ERGO’S TECHNICAL REPORT SUMMARY OF THE MATERIAL TAILINGS STORAGE FACILITIES PAGE 152 152 15.7. Tailings Disposal The Brakpan TSF is a single large TSF that was built by cycloning the tailings at the point of deposition with the larger particles from the tailings, forming the dam wall. The annual rate of rise is between 4m and 5m. The fines from the cyclones run out into the center of the dam. This generates a more stable wall with the finer material safely stored inside the TSF. With the deposition rate of up to 1.65Mtpm, the use of cycloning is viewed as the most appropriate method for disposal of the tailings material. 250mm diameter cyclone units are used with over 300 cyclones connected to the tailings pipeline system. The TSF was originally designed by Knight Piésold. Operational activities are currently under contract by Fraser Alexander. Immediately adjacent to the Brakpan TSF lies the former cleared footprint of the Withok TSF an area licensed for tailings storage, spanning an approximate 400 hectares. This area, on which a large portion of the Withok compartment stood, was retreated and cleared by the former owners of Ergo and deposited onto the Brakpan TSF. The Brakpan TSF is nearing the end of its operational life as such plans to recommission the Withok TSF are currently underway. Ergo plans to maintain its current deposition rate of 1.65 million tonnes per month on Brakpan TSF and Daggafontein TSFs combined for another three to four more years before moving onto the adjacent Withok TSF. Recommissioning requires an environmental authorization and Waste Management License from DMPR as well as a Water Use License and a license to construct from the Department of Water and Sanitation (DWS) and Dam Safety Office respectively. These applications have been finalised and submitted to the relevant authorities and are awaiting their record of decision. The regulatory process to recommission Withok is complex, though, and the regulator may not approve all aspects of the envisaged design. The footprint and location of the facility also make for a challenging construction process, and this may result in target dates not being met, and planned throughput rates not being achieved. The Withok recommission design will result in increased deposition capacity, improved operation and management of the facility. Figure 80 and Figure 81 indicate the plan for the initial four lifts of the Withok TSF. The Daggafontein TSF which was previously included in the life of mine as a reclamation has been removed from the Mineral Resource and Mineral Reserve Statement as a decision was made by Ergo to resume depositioning onto the TSF. Depositioning is expected to resume in the second half of calendar year 2027 at an initial 500Ktpm. Daggafontein has a proposed designed life for a further 20 years with a capacity of 120Mt. The planned work to convert the Daggafontein TSF to a deposition site includes the installation and commissioning of a residue pump station at the Ergo plant, installation of two X 550NB HDPE pipelines to the Daggafontein TSF for cyclone deposition and return water. The Brakpan TSF as of 30 June 2025, has a current capacity of 62Mt, with a design life until August 2028. Once commissioned, the Withok TSF will have an additional deposition capacity of 310Mt. The Brakpan TSF will operate until FY2030 handling up to the following amounts: 19.8Mtpa in FY2026, 10.8Mtpa in FY2027, 10.8Mtpa in FY2028, 8.4Mtpa in FY2029 and 600Ktpa in FY2030. The Withok TFS is planned to commence in FY2029 (2.4Mtpa) and ramp-up to a steady state slimes feed of 15.6Mtpa in FY2031. The Daggafontein TSF commences in FY2027 at a rate of 9.0Mtpa reducing to 6.5Mtpa in FY2030 and 6.0Mtpa from FY2031 to FY2039. In FY2040 the Daggafontein TSF will receive 3.8Mtpa and then reach a steady state rate of 3.6Mtpa until FY2046. The Brakpan, Withok and Daggafontein TSFs provide sufficient storage capacity (~492Mt) to support Ergo’s 22-year LoM plan.


ERGO’S TECHNICAL REPORT SUMMARY OF THE MATERIAL TAILINGS STORAGE FACILITIES PAGE 153 153 Figure 80: Plan Layout - Lift 1 and 2 Note: diagram not to scale Figure 81: Plan Layout - Lift 3 and 4 Note: diagram not to scale 15.8. Conclusion The QP is of the opinion that all significant infrastructure and logistical requirements have been considered. It is notable that Ergo has been operating for more than 15 years and has a very good understanding of infrastructural and logistical requirements. ERGO’S TECHNICAL REPORT SUMMARY OF THE MATERIAL TAILINGS STORAGE FACILITIES PAGE 154 154 16. MARKET STUDIES 16.1. Markets All gold produced is delivered to the Rand Refinery Proprietary Limited (Rand Refinery) for refining and administration of gold bars delivered. DRDGOLD has a long standing refining agreement with Rand Refinery and as consideration for the service, Ergo pays a variable refining fee and administration fee which is payable within 30 days of the invoice date. Ergo holds a 1.1% shareholding in Rand Refinery, and together with DRDGOLD Limited, it holds an 11.3% shareholding. Rand Refinery is based in Germiston, South Africa, approximately 23 km from the Ergo operations. Ergo sells its refined gold to South African bullion banks at the gold price derived on the gold market on the day a contract is entered into with the bullion bank. Ergo has no other material contracts related to its sale of gold, except for the agreement with Rand Refinery and the bullion banks. When applying the 30 June 2025 spot exchange rate (ZAR17.88/USD) to the associated gold price of USD3,328/oz Au, a real gold price of ZAR1,913,119/kg is computed (DRDGOLD, 2025). Gold is a precious metal, refined and sold as bullion on the international market. Aside from the gold holdings of central banks, current uses of gold include jewelry, private investment, and technological applications such as electronics and dentistry (Table 76). Table 76: Above Ground Gold Stocks in 2025 Description Quantity (t) Jewelry Fabrication 2,012.2 Technology 326.3 Investment 1,181.7 Central Banks 1,086.0 Source: GoldHub, 2025 The largest use of gold is in jewelry, accounting for approximately 44% of the above-ground gold. Gold does not follow the usual supply and demand logic because it is virtually indestructible and can easily be recycled. In addition, gold stored in the vaults of banks is relatively illiquid and subject to the vagaries of global economies. These characteristics of the gold market make it challenging to forecast the gold price. 16.2. Gold Price The QP considered 30 years of historical analysis to form an opinion for the expected gold price and 5-year historical analysis of the ZAR to USD exchange rate to confirm the gold price and ZAR:USD exchange rate going forward, as the QP believes that these periods sufficiently cover the market volatility seen in the international gold market. This is also consistent with the five years of consensus pricing relied on for the price forecast (Figure 82). The gold price increased in 2024 due to market volatility related to geopolitical risks and recent concerns around US tariffs. ERGO’S TECHNICAL REPORT SUMMARY OF THE MATERIAL TAILINGS STORAGE FACILITIES PAGE 155 155 Figure 82: Gold Price Historical Trendline 16.3. Exchange Rate Trends The ZAR to USD exchange rate reached record-breaking highs in May 2023 (ZAR19.80:1USD) with a recent peak in the exchange rate on the 9th of April 2025 (ZAR 19.77/USD) but has subsequently dropped back to ZAR 17.88/USD as of June 30, 2025. The exchange rate of ZAR 17.39/USD compares well with the recent historical trend line (January 2023 to June 2025), as displayed in Figure 83. Figure 83: Exchange Rate Trendline ERGO’S TECHNICAL REPORT SUMMARY OF THE MATERIAL TAILINGS STORAGE FACILITIES PAGE 156 156 Various service providers and financial institutions are consulted to determine consensus forecasts of the gold price (Table 77). Table 77: Long Term Consensus Forecasts in Nominal Terms Description Year 1 (FY2025) Year 2 (FY2026) Year 3 (FY2027) Year 4 (FY2028) Year 5+ (LT) USD/oz 2,982 2,982 2,897 2,779 2,380 ZAR/USD 17.63 17.63 18.44 18.60 18.44 ZAR Price/kg 1,689,997 1,689,997 1,717,800 1,661,713 1,473,892 Source: DRDGOLD, 2025 The economic assessment for the Mineral Reserve estimate relies on a real price of ZAR1,689,997/kg (i.e., USD2,982/oz at ZAR17.63/USD) as of 30 June 2025 terms as provided by DRDGOLD. The QP has considered the consensus forecasts supplied by DRDGOLD against trends in the demand and supply of gold as recorded over the period from 2010 to 2024 to examine whether these forecasts are reasonable. 16.4. Global Demand The following annotation is based on the Goldhub research commentary (Goldhub, 2025). The total gold demand reached a record annual total of 4,974t. Central banks continued to purchase gold, with purchases exceeding 1,000 tonnes for the third consecutive year. Annual investment in gold reached a four-year high of 1,180t. Full-year bar and coin demand was in line with 2023 at 1,186t. Annual technology demand also contributed to the global total, growing by 21t in 2024, largely driven by continued growth in AI adoption. Gold jewellery was an outlier, with annual consumption dropping 11% to 1,877 tonnes, as consumers could only afford to buy in lower quantities. The outlook for gold (Goldhub, 2025) in 2025 is that central banks and EFT investors are likely to drive demand, with economic uncertainty supporting gold’s role as a risk hedge. Figure 84 illustrates global demand over the past 14 years (i.e., 2010-2024).


ERGO’S TECHNICAL REPORT SUMMARY OF THE MATERIAL TAILINGS STORAGE FACILITIES PAGE 157 157 Figure 84: Global Gold Demand from 2010 to 2024 Source: GoldHub, 2025 16.5. Global Supply The global gold supply from mining and recycling activities over the same period is presented in Figure 85. Figure 85: Global Gold Supply from 2010 to 2024 Source: GoldHub, 2025 Below are the top thirteen gold-producing countries in 2024 (Table 78). Table 78: Global Gold Production Rank Country Production (t) 2019 2020 2021 2022 2023 2024 1 China 383 368 332 375 378 380 2 Russia 330 331 331 325 322 330 3 Australia 325 328 315 314 294 284 4 Canada 183 171 193 194 192 202 5 United States 200 190 187 173 167 158 ERGO’S TECHNICAL REPORT SUMMARY OF THE MATERIAL TAILINGS STORAGE FACILITIES PAGE 158 158 6 Ghana 142 139 129 127 135 141 7 Mexico 109 102 125 124 127 140 8 Indonesia 92 101 118 125 132 140 9 Peru 143 98 127 126 130 137 10 Uzbekistan 93 100 105 111 120 129 11 Mali 97 92 99 102 105 100 12 South Africa 111 99 114 93 104 99 13 Burkina Faso 83 93 103 96 99 94 Source: GoldHub, 2025 16.6. Concluding Comments The QP is satisfied that a real 30 June 2025 gold price of ZAR 1,689,997/kg (USD 2,982/oz at a USD/ZAR exchange rate of ZAR17.63) is a reasonable assumption for examining the economic viability of the Mineral Reserve estimate. ERGO’S TECHNICAL REPORT SUMMARY OF THE MATERIAL TAILINGS STORAGE FACILITIES PAGE 159 159 17. ENVIRONMENTAL STUDIES, PERMITTING, AND PLANS, NEGOTIATIONS, OR AGREEMENTS WITH LOCAL INDIVIDUALS OR GROUPS 17.1. Results of Environmental Studies Numerous Environmental Impact Assessments (EIAs) have been conducted over the Ergo operation with the findings of the EIAs indicating that the operation could result in certain negative impacts during the operational phase to the environment if not mitigated. No specialist studies objected to the continued operations. During the mining operations, negative impacts are largely Moderate to Insignificant, and after mitigation measures the impacts were deemed to be a Low significance. During the decommissioning and post-decommissioning phases, the majority of the impacts will be positive as the historical TSFs and associated environmental impacts of the TSFs are removed. Social and community interaction remains a key focus for Ergo. Stakeholder engagement is reported annually with the SLP compliant and filed with the proper authorities. Ergo appears to have good relations with surrounding communities and engages proactively. The QP is unaware of any material flaws in terms Ergo’s social license to operate, however, it is noted that in the current South African socio-political issues remain a risk and require constant monitoring. Rehabilitation is carried out once the reclamation of individual TSFs is completed, with rehabilitation returning the disturbed land to that of industrial standard or otherwise determined with the landowner. The principles for rehabilitation are:  preparing a comprehensive rehabilitation plan prior to the commencement of any activities on site;  stormwater management must be in place at the site prior to commencing with any activities;  landform design (e.g., shaping, re-grassing, etc.);  maintenance management and eradication of invader species;  a plan on how waste will be managed on site; and  an emergency preparedness/response plan.  The objective of the site rehabilitation (in accordance with the NEMA EIA Regulations of 2014) must be measurable, practical and be feasible to implement through:  providing the vision, objectives, targets and criteria for final rehabilitation of the project;  outlining the principles for rehabilitation;  explaining the risk assessment approach and outcomes and link decommissioning activities to risk;  rehabilitation detailing the decommissioning and rehabilitation actions that clearly indicate the measures that will be taken to mitigate and/ or manage identified risks and describing the nature of residual risks that will need to be monitored and managed post decommissioning;  identifying knowledge gaps and how these will be addressed and filled; and  outlining monitoring, auditing and reporting requirements. 17.2. Requirements for Tailings Disposal, Site Monitoring and Water Management The general description of the Brakpan, Withok and Daggafontein TSFs is covered in Item 15.7. 17.3. Site Monitoring Site monitoring provides information on whether rehabilitation methods employed are functioning correctly or not. The purpose of monitoring is to ensure that the objectives of the rehabilitation program are met, and that the progressive rehabilitation process is followed as planned during the LoM. Ergo actively manages and monitors the consumption of ERGO’S TECHNICAL REPORT SUMMARY OF THE MATERIAL TAILINGS STORAGE FACILITIES PAGE 160 160 natural resources (including potable water and energy) at monthly and weekly meetings. This entails the analysis of trends to identify excess use and discuss various focus areas to encourage responsible natural resource usage. The post closure monitoring period will begin once scheduled decommissioning and rehabilitation activities for the sites have been completed. The duration of post closure monitoring will be determined based on environmental performance and until it can be demonstrated that the rehabilitation work has achieved the agreed outcomes; however, at present, it has been assumed that post closure monitoring will not continue for more than five years. It is important that the data obtained during monitoring is used to gauge the success of rehabilitation. Negative monitoring findings should be clearly linked to specific corrective actions. The following aspects should be monitored during the post-closure phase. 17.4. Vegetation Monitoring The following vegetation monitoring is recommended:  vegetation cover;  species composition;  erosion; and  alien invasive plants. 17.5. Vegetation Maintenance Vegetation maintenance will specifically focus on fertilizing the rehabilitated areas annually if required, controlling alien invasive plants where needed and general maintenance such as in-filling of erosion gullies. In the case of erosion, the cause should be identified, and rectified. 17.6. Water Management The quality of groundwater and surface water at the various sites will be monitored quarterly for five years post closure, except for the Knights Mining Right which requires 30 years monitoring at certain monitoring points as per the approved WULs, to ensure compliance of the various constituents with the standards. Samples should be analyzed for particulate and soluble contaminants. Water monitoring will be taking place at 76 different locations. 17.7. Water Monitoring Currently, 61% of all process water at Ergo is supplied from water returned from the Brakpan TSF as detailed in Table 79, with the other sources making up the total process water requirement. Table 79: Ergo Water Consumption Description Total Consumption 2024 Total Consumption 2025 Ml % Ml % Potable Water Sources Externally 861 4 1,025 5 Rondebult Waste Water - - - - Surface Water Extracted 3,065 15 4,363 20 Water Recycled in Process 14,484 71 13,144 61 TCTA Water (AMD) 1,935 10 2,919 14 Total Water Used 20,345 100 21,451 100


ERGO’S TECHNICAL REPORT SUMMARY OF THE MATERIAL TAILINGS STORAGE FACILITIES PAGE 161 161 17.8. Legal and Permitting Items 3.2 and 3.3 of the TRS discusses the Mining Rights and Prospecting Rights details for Ergo’s and the status thereof. Ergo’s EMPs encompasses all the activities of Ergo’s operations and assesses the environmental impacts of mining at reclamation sites, plants and TSFs. It also outlines the closure process, including financial provisions. There are currently no legal challenges to Ergo’s title to its Mineral Reserves. Ergo has numerous surface, mining and prospecting rights and ownership of the surface rights and mine dumps vests in various legal entities. The Mineral Resources and Mineral Reserves held by Ergo include ownership through common law, verified contractual arrangements and various mining rights, as well as the required environmental permitting. Ergo has submitted applications to renew these mining rights. The intention is to consolidate the various mining rights into a single mining right once the renewals have been granted. These applications are receiving attention from the DMPR. Ergo has applied to renew the mining rights for up to 30 years, which is the maximum allowable period as detailed in the MPRDA. These rights are enforceable until such stage as the DMPR has accepted or rejected the mining renewal applications as per the MPRDA. In South Africa, mining operations are regulated under several laws, primarily the MPRDA. In order to carry out mining operations a company requires a number of legal permits and authorizations. The key permits required are highlighted below:  Water Use License  Integrated Environmental Authorization  Atmospheric Emissions License  Financial Provision for Rehabilitation  Social and Labor Plan (updated every 5 years)  Dam (TSF) safety (updated every 5 years) Water use licenses are applied for as and when required to remain compliant with relevant legislation. Ergo complies with all the conditions for renewal and has no reason to believe that the submitted renewals would not be granted. Ergo is in constant communication with the DMPR and is submitting the required information as per their requests to finalize these renewal applications. 17.9. Plan Negotiations, or Agreements with Local Individuals or Groups Social and community interaction remains a key focus for Ergo. Stakeholder engagement is reported annually against the SLP and any complaint is filed with the proper authorities. The QP is unaware of any material flaws of Ergo’s social license to operate. However, it is noted that in the current South African political environment, social and community issues always remain a risk and require constant monitoring. The five-year SLP was submitted by Ergo in terms of the requirements of the MPRDA. The development, submission and implementation of an SLP is a requirement of the MPRDA and the right to mine. Summary indicates the budget for the 2023 to 2027 SLP, noting that the SLP plan is conducted in five-year segments. Currently, the SLP is not approved by the DMPR, but Ergo is in discussion to rectify this matter and in the interim is abiding by the proposed SLP program. The SLP covers three key elements:  Human Resource Development (HRD): which focuses on the empowerment of historically disadvantaged South Africans to progress to higher career levels within the industry. Ergo has various programs to address this aspect, including skills development programs, career progression and mentorship employment equity targets; ERGO’S TECHNICAL REPORT SUMMARY OF THE MATERIAL TAILINGS STORAGE FACILITIES PAGE 162 162  Local Economic Development (LED): which focuses on the upliftment of both the surrounding (affected) and labor- providing communities. Ergo has four projects, one agricultural development, a sewing project and two projects to upgrade facilities at primary schools. A ZAR10 million budget is allocated to these LED projects; and  Program for Management of Downscaling and Retrenchment: which focuses on minimizing negative impact due to either job losses through retrenchment and mine closure in the long-term. Table 80: SLP Financial Provision Summary Description FY2023 FY2024 FY2025# FY2026 FY2027 Total (ZAR million) HRD Total 32.162 29.380 133.260 LED Total N/A awaiting DMPR approval 4.171 23.100 Downscaling Retrenchment 17.100* SLP Budget 10.48 13.33 8.29 8.11 8.58 173.460 Source: Ergo, 2025 Note: #The DMPR is based on calendar year reporting, hence 2025 data is only available at the end of the year *This amount has already been accrued and is available for reskilling should the mine prematurely be forced to close. 17.10. Mine Closure Plans Remediation Plans, and Associated Costs In accordance with South African mining legislation, all mining companies are required to rehabilitate the land on which they work to a determined standard for alternative use. Financial guarantees are issued through approved insurance products from Guardrisk Insurance Company Limited (Guardrisk) to make financial provisioning for rehabilitation. A ring-fenced policy, issued by Guardrisk for the DRDGOLD group is in place for the sole objective of future rehabilitation during and at the end of the relevant life of mines. At 30 June 2025, a total of R765.0 million of funds for the DRDGOLD group, were held mainly in fixed income investment funds and hedge funds in the Guardrisk Cell Captive as security for financial guarantees issued for the expected rehabilitation costs. Guardrisk has issued financial guarantees for the DRDGOLD group to the value of R941.3 million. At 30 June 2025, a total of R142.3 million of funds were attributable to Ergo Mining Proprietary Limited and financial guarantees to the value of R383.9 million. The funds and financial guarantees will be used to cover the outstanding rehabilitation funding and closure cover as shown Table 81. The closure cost assessment was developed in accordance with the requirements of the National Environmental Management Act, 1998 (Act No. 107 of 1998) (NEMA) as amended. These Regulations provide that the holder of a mining right must make full financial provision for the rehabilitation of negative environmental impacts. The calculated costs for gross rehabilitation and closure of the Ergo operations estimated by Digby Wells are ZAR683.54 million (Table 81). Ergo systematically audits and monitors progress on rehabilitation and closure and adjusts its provision accordingly. Required audits are undertaken and submitted to the DMRP annually. Table 81: Ergo Rehabilitation Financial Provision Summary Area and Mining Right Closure Cost FY2025 (ZAR ‘000) CMR - GP186MR 12,166 Crown - GP184MR 60,630 City Deep - GP185MR 45,972 Knights - GP187MR 55,588 Ergo - GP158MR 509,588 Total (excluding VAT) 683,544 Source: Digby Wells, 2025 In FY2025, Ergo vegetated 40 hectares of the active TSF (FY2024: 25ha). Clearance of 41ha of rehabilitated mining land was received from the National Nuclear Regulator for redevelopment in FY2025 (FY2024: nil). New clearance ERGO’S TECHNICAL REPORT SUMMARY OF THE MATERIAL TAILINGS STORAGE FACILITIES PAGE 163 163 applications in respect of 76ha of mining land (all Ergo-related) were lodged with the NNR during the year, compared with 41ha in FY2024. 17.11. QP Statement on the Environmental Studies, Permitting, Plans, Negotiations, with Local Individuals or Groups The QP is satisfied that all material issues relating to Environmental, Social and Governance have been addressed in this document. ERGO’S TECHNICAL REPORT SUMMARY OF THE MATERIAL TAILINGS STORAGE FACILITIES PAGE 164 164 18. CAPITAL AND OPERATING COSTS The capital expenditure and operating costs provided take cognizance of the requirements to support the LoM plan. The capital expenditure considers the ongoing requirements of starting new operating sites as current TSFs Mineral Reserves are depleted. This capital expenditure schedule is based on the LoM production schedule with the capital expenditure based on mining and engineering designs conducted to a PFS level of accuracy (i.e., +/-25%) with a maximum level of contingency of 15% being applied. The operating costs support the planned LoM production profile taking into consideration whether slimes or sand material is mined and the method and distance in which the mineralized material is transported (i.e., pumped or trucked). Operating costs are activity-based costs accounting for surface mining costs (extraction and transportation); processing costs (including tailings disposal costs), cost of maintaining key mine infrastructure and general and administrative costs. The estimate of operating costs is based on historical operating cost data, which is well understood as Ergo is a well-established mining operation. Operating costs are estimated to at least a PFS level of accuracy (i.e., +/-25%) with no contingency applied due to the understanding of the cost to mine and process the RoM material. 18.1. Capital Expenditure A total capital of ZAR5.96 billion is scheduled to support the Ergo LoM plan. The breakdown of capital expenditure indicates most of the capital, ZAR5.07 billion, is allocated to the Ergo Section over the duration of the LoM plan with an additional ZAR805.41 million allocated for the City Section and ZAR78.14 million allocated for the Knights Section. The capital expenditure summary (inclusive of contingency) as proposed in the 30 June 2025 LoM plan is presented in Table 82. The level of accuracy for the capital expenditure is to at least a PFS level of accuracy (i.e., +/-25%) with a maximum level of contingency of 15%. Table 82: Capital Expenditure Summary Area Budgeted Capital Expenditure ZAR(000) Ergo Section (inclusive of the Withok TSF) 5,072,975 City Section 805,411 Knights Section 78,143 Total (excluding VAT) *5,956,529 Source: DRDGOLD, 2025 *Inclusive of Contingency Typical capital expenditure for of pump stations associated with the mining of TSFs are as follows:  Consultants,  Civil Engineering,  Structural steelwork,  Mechanicals,  Instrumentation, and  Security. The other three main capital components to mining a TSF include:  The slurry pipeline,  The water pipeline  Water transfer 18.1.1. Ergo Section Capital Expenditure This section depicts the capital expenditure estimate for the Ergo Section as indicated in Table 83 excluding capital for the recommissioning of the Withok TSF and resuming depositioning at Daggafontein TSF.


ERGO’S TECHNICAL REPORT SUMMARY OF THE MATERIAL TAILINGS STORAGE FACILITIES PAGE 165 165 Table 83: Ergo Capital Expenditure Estimate Area Budgeted Capital Expenditure (ZAR ‚000) Marievale 7L4 115,007 Marievale 7L7 341,266 5L23 88,171 6L14 109,112 7L15 103,540 Maintenance over LoM 1,645,602 Total (excluding VAT) *2,402,698 Source: DRDGOLD, 2025 * Contingency applied 18.1.2. City Section Capital Expenditure Table 84 indicates the capital expenditure estimate for the City Section. The capital estimate accounts for the Mooifontein transfer pump station, satellite pumps stations at Mooifontein, Diepkloof and GMTS TSFs, and the pipe and installation of the pipeline for the 16.2 km servitude from Mooifontein to 4A8. Table 84: City Total Capital Expenditure Summary Area Budgeted Capital Expenditure (ZAR ‚000) 3L5 (Diepkloof) 52,775 3L7 (Mooifontein) 391,662 3L8 (GMTS) 60,824 4L6 TSF 12,650 Additional Crown Piping 287,500 Total (excluding VAT) *805,411 Source: ERGO 2025 *Contingency applied 18.1.3. Knights Section Capital Expenditure A capital of ZAR 78.14 million (with no contingency applied) has been allocated to the 4L39 TSF (Table 85). Table 85: Capital Expenditure Summary for 4L39 Area Budgeted Capital Expenditure ZAR (‚000) 4L39 TSF 78,143 Total (excluding VAT) *78,143 Source: ERGO 2025 *Contingency applied 18.2. Tailing Storage Facility for Deposition - Capital Expenditure The Withok TSF design is a centreline & upstream cyclone deposition TSF with a lined for containment. The Withok TSF has been digitally modelled to inform the various quantities for the infrastructure requirements. The capital costs to implement the Withok TSF has been estimated upon typical contractor tender methodologies. This includes smooth HDPE liners and double textured HDPE liners; 7.1 km of return water pipe line, 6.0 km of decant pipe line, and pumping system. Table 86 indicates the capital expenditure budget for the proposed Withok TSF. The Withok TSF design work has been conducted to a PFS level of accuracy with a 15% contingency applied to the capital estimate. Table 86: Withok TSF Capital Expenditure Area Budgeted Capital Expenditure ZAR (‚000) ERGO’S TECHNICAL REPORT SUMMARY OF THE MATERIAL TAILINGS STORAGE FACILITIES PAGE 166 166 Withok prework 108,494 Withok TSF 2,210,661 Total (excluding VAT) *2,319,155 Source: ERGO, 2025 *Contingency applied Table 87 shows the estimated capital expenditure of ZAR 351.12 million for the Daggafontein deposition TSF, planned for FY2025 and FY2026. The capital expenditure accounts for the design, installation and commissioning of a residue pump station at the Ergo plant, the installation of two x 550NB HDPE pipelines 18km in length to Daggafontein. The conversion of the Daggafontein TSF to a cyclone deposition and includes the upgrade of the barge and return water pump station at Daggafontein to pump water back to Ergo Plant. Table 87: Daggafontein TSF Capital Expenditure Description Budgeted Capital Expenditure ZAR (000) Daggafontein TSF 351,123 Total (excluding VAT) *351,123 Source: DRDGOLD, 2025 *Contingency applied 18.3. QP commentary The QP associates a low risk to the engineering capital expenditure for the mining associated projects as the design and construction of pump stations and pipelines have been conducted numerous times by Ergo. The QP notes the level of accuracy for the capital expenditure estimates are to a Pre-Feasibility Study level accuracy (i.e., +/-25%). Contingency varies between 0% to 15% with contingency typically applied to civil work, structural steelwork and electrical and instrumentation. In no case is the contingency above 15%. The QP is of the opinion that the risk associated with the Withok TSF capital estimate is Low to Medium and typical of a FS level of accuracy (i.e., +/-25%). 18.4. Operating Costs Mining related operating costs are assigned to the Ergo processing plant and the mining of the various TSFs. A different operational cost is applied to each deposit, depending on its composition, proximity to the processing plant and the reclamation method. Sand dumps have a higher cost than slimes, as sand must be milled down to 80% less than 75µm while the slime can be treated in the CIL tanks directly. Mining related operating costs are assigned to the planned TSFs to be mined and the Ergo processing plant. The planned average operating cost for the Ergo 22-year LoM plan is estimated at a Pre-Feasibility Study level of accuracy (i.e., +/-25%) with a maximum level of contingency of 15% with a total working cost of ZAR139/t (Table 88). ERGO’S TECHNICAL REPORT SUMMARY OF THE MATERIAL TAILINGS STORAGE FACILITIES PAGE 167 167 Table 88: Average LoM Operating Cost for Ergo Operating Cost Average LoM Operating Cost (ZAR/t) Labor 24 Consumables & Reagents 51 Electricity 24 Water 2 Contractors 17 Machine hire 3 Other 11 Total cash cost per tonne 132 Corporate Cost 7 Total Working Cost 139 Source: ERGO, 2025 The development of the annual operating costs is based on historical cost data as Ergo has been operational for numerous years. The QP associates a Low risk with many of the operating costs, however a medium risk is associated with consumables, electricity and water due to the volatile nature of the market of these items. Ergo is attempting to mitigate the volatility with the installation of the solar power project and reuse of water where possible. Refer to Item 19 for more details on risk. ERGO’S TECHNICAL REPORT SUMMARY OF THE MATERIAL TAILINGS STORAGE FACILITIES PAGE 168 168 19. ECONOMIC ANALYSIS 19.1. Economic Analysis The 30 June 2025, 22-year LoM plan, which is the basis of the Mineral Reserve, is scheduled to mine a total of 440.03Mt at 0.27g/t Au and produce 48,401kg of gold over the same period. The economic analysis is based on a LoM plan that is designed to a PFS level of accuracy (i.e., +/-25%). The economic analysis conducted by the QP indicates a net present value (NPV) of ZAR5.19 billion after capital expenditure and taxation utilizing a real discount rate of 8.91% (real terms). As the Ergo operations are ongoing with an annual positive cashflow, the internal rate of return (IRR) and payback period are not applicable.


ERGO’S TECHNICAL REPORT SUMMARY OF THE MATERIAL TAILINGS STORAGE FACILITIES PAGE 169 169 Table 89 presents the Ergo cashflow model over the 22-year LoM Plan. The NPV has been calculated by discounting the positive cashflows at the appropriate rate and subtracting the required capital expenditure. The QP has made the assumptions listed below to derive a realistic base case operational cashflow model:  the production schedule is sourced from the Ergo LoM plan. The mining tonnage schedule varies between 19.2Mtpa and 21.6Mtpa;  plant feed grade as per the LoM schedule with an average grade of 0.27g/t gold;  the average metallurgical recovery over the LoM schedule is 41.4%;  total working costs estimated at ZAR139/t RoM are inclusive of mining, metallurgical and general and administration costs (working costs);  the gold market price is set at ZAR1,689,997kg (A gold price of USD2,982/oz and an exchange rate of ZAR17.63:1USD was used in the estimation process);  capital expenditure of ZAR5.96 billion is inclusive of contingency;  no salvage value of assets has been assumed;  a tax rate of 24.98% based on the gold tax formula - Tax rate y=33-(165/X); where y is the calculated tax rate and X is the ratio of taxable income, net of any qualifying capital expenditure that bears to gold mining income derived, expressed as a percentage;  a discount rate of 8.91% in real (no inflation) terms;  no royalty payment is applicable to Ergo, as the operation is not subject to royalties on the retreatment of TSFs;  capital expenditure was fully written-off against operating profit, with no time constraint;  no salvage value of assets has been assumed; and  no escalation or inflationary effects have been included in the economic evaluation, which is based on constant money value (real terms). The NPV of the Ergo LoM plan as at 30 June 2025 was calculated at ZAR5.19 billion at a discount rate of 8.91% as shown in ERGO’S TECHNICAL REPORT SUMMARY OF THE MATERIAL TAILINGS STORAGE FACILITIES PAGE 170 170 Table 89. ERGO’S TECHNICAL REPORT SUMMARY OF THE MATERIAL TAILINGS STORAGE FACILITIES PAGE 171 171 Table 89: Economic Analysis Jun-26 Jun-27 Jun-28 Jun-29 Jun-30 Jun-31 Jun-32 Jun-33 Jun-34 Jun-35 Jun-36 Year 1 Year 2 Year 3 Year 4 Year 5 Year 6 Year 7 Year 8 Year 9 Year 10 Year 11 Production tonnes Ergo 8 560 8 628 9 990 13 200 13 540 12 825 12 600 12 600 12 600 12 050 7 319 City 5 950 6 240 6 600 6 600 7 760 8 775 9 000 9 000 9 000 9 550 14 281 Knights 5 290 4 932 3 210 - - - - - - - - Total 19 800 19 800 19 800 19 800 21 300 21 600 21 600 21 600 21 600 21 600 21 600 Production kg's Ergo 1 130 1 129 1 176 1 540 1 421 1 262 1 232 1 469 1 549 1 513 801 City 1 268 1 476 1 484 1 139 1 252 1 040 875 875 875 929 1 335 Knights 919 660 272 - - - - - - - - Total 3 317 3 265 2 932 2 678 2 672 2 302 2 108 2 344 2 425 2 442 2 136 Revenue Gold price - R/kg 1 689 997 1 689 997 1 689 997 1 689 997 1 689 997 1 689 997 1 689 997 1 689 997 1 689 997 1 689 997 1 689 997 Gold revenue 5 605 819 5 518 051 4 954 591 4 526 453 4 516 350 3 890 694 3 561 675 3 961 470 4 097 613 4 127 106 3 609 964 Other revenue 15 557 22 354 6 723 21 042 17 675 14 895 12 258 9 715 7 228 10 249 2 312 Total 5 621 376 5 540 406 4 961 315 4 547 495 4 534 025 3 905 589 3 573 933 3 971 185 4 104 841 4 137 356 3 612 276 Cost Total cash cost 3 759 121 3 562 410 3 408 279 3 183 525 3 179 132 2 857 998 2 637 730 2 643 650 2 645 721 2 571 254 2 474 087 Total working cost 3 904 912 3 708 201 3 554 070 3 347 255 3 332 546 3 003 610 2 764 686 2 770 606 2 772 677 2 698 210 2 601 043 Profit / (loss) before capex 1 716 464 1 832 204 1 407 245 1 200 241 1 201 479 901 978 809 247 1 200 579 1 332 164 1 439 146 1 011 233 Capex 978 884 956 039 1 454 022 810 108 195 935 65 734 132 547 103 932 347 430 163 601 117 728 Profit / (loss) after capex 737 580 876 166 (46 777) 390 133 1 005 544 836 245 676 700 1 096 647 984 733 1 275 545 893 505 Tax - 198 087 - 38 621 257 310 211 764 164 543 296 529 257 351 352 833 235 292 Profit after tax and capex 737 580 678 079 (46 777) 351 512 748 235 624 480 512 157 800 118 727 382 922 712 658 213 Discount factor 8.91% 0.92 0.84 0.77 0.71 0.65 0.60 0.55 0.51 0.46 0.43 0.39 Discounted cash flow 677 238 571 669 (36 210) 249 844 488 314 374 207 281 792 404 214 337 406 392 997 257 407 ERGO’S TECHNICAL REPORT SUMMARY OF THE MATERIAL TAILINGS STORAGE FACILITIES PAGE 172 172 Jun-37 Jun-38 Jun-39 Jun-40 Jun-41 Jun-42 Jun-43 Jun-44 Jun-45 Jun-46 Jun-47 Total Year 12 Year 13 Year 14 Year 15 Year 16 Year 17 Year 18 Year 19 Year 20 Year 21 Year 22 Production tonnes Ergo 3 600 3 600 3 600 209 - - - - - - - 134 921 City 18 000 18 000 18 000 19 191 19 200 19 200 19 200 19 200 19 200 19 200 10 534 291 681 Knights - - - - - - - - - - - 13 432 Total 21 600 21 600 21 600 19 400 19 200 19 200 19 200 19 200 19 200 19 200 10 534 440 034 Production kg's Ergo 452 452 452 26 - - - - - - - 15 606 City 1 577 1 577 1 577 1 681 1 682 1 775 1 875 1 875 1 875 1 875 1 029 30 945 Knights - - - - - - - - - - - 1 850 Total 2 029 2 029 2 029 1 707 1 682 1 775 1 875 1 875 1 875 1 875 1 029 48 401 Revenue Gold price - R/kg 1 689 997 1 689 997 1 689 997 1 689 997 1 689 997 1 689 997 1 689 997 1 689 997 1 689 997 1 689 997 1 689 997 1 689 997 Gold revenue 3 428 602 3 428 602 3 428 602 2 884 960 2 841 921 2 999 450 3 169 255 3 169 255 3 169 255 3 169 255 1 738 799 81 797 744 Other revenue - - - - - - - - - - - 140 009 Total 3 428 602 3 428 602 3 428 602 2 884 960 2 841 921 2 999 450 3 169 255 3 169 255 3 169 255 3 169 255 1 738 799 81 937 753 Cost Total cash cost 2 489 507 2 496 024 2 499 021 2 320 311 2 311 172 2 319 739 2 324 407 2 331 036 2 337 656 2 351 774 1 340 921 58 044 475 Total working cost 2 616 464 2 622 980 2 625 977 2 447 208 2 438 063 2 446 630 2 451 299 2 457 928 2 464 548 2 478 666 1 479 598 60 987 179 Profit / (loss) before capex 812 138 805 621 802 624 437 752 403 857 552 820 717 957 711 328 704 708 690 589 259 200 20 950 574 Capex 57 259 57 409 57 477 53 367 66 351 92 935 53 461 53 614 53 766 54 091 30 841 5 956 529 Profit / (loss) after capex 754 879 748 213 745 147 384 385 337 507 459 885 664 495 657 714 650 942 636 498 228 359 14 994 045 Tax 192 538 190 338 189 327 79 245 64 485 102 271 166 991 164 753 162 518 157 752 46 668 3 529 218 Profit after tax and capex 562 341 557 875 555 820 305 140 273 021 357 614 497 505 492 961 488 424 478 747 181 691 11 464 827 Discount factor 8.91% 0.36 0.33 0.30 0.28 0.26 0.23 0.22 0.20 0.18 0.17 0.15 Discounted cash flow 201 923 183 931 168 262 84 817 69 681 83 804 107 048 97 392 88 602 79 741 27 787 5 191 866 Source: ERGO, 2025


ERGO’S TECHNICAL REPORT SUMMARY OF THE MATERIAL TAILINGS STORAGE FACILITIES PAGE 173 173 19.2. Sensitivity Analysis The sensitivity analysis of the Ergo financial model that varies revenue (price and grade); operating cost and capital expenditure at 5% increments above and below the base case is shown in Figure 86. The analysis indicates that the Ergo operations are very sensitive to revenue parameters such as gold price, grade, and recovery in addition, the LoM plan is also sensitive to changes in operating costs. The sensitivity indicates that the LoM plan is not as sensitive to capital and therefore capital expenditure should be considered if the expenditure will result in reducing operating cost or increase revenue. The sensitivity indicates that achievement of the LoM plan in terms of tonnage is critical in realizing the planned operating costs and being able to mine at the planned cut-off grade. Any delays in the recommissioning of the Withok TSF and resuming depositioning at the Daggafontein TSF due to regulatory approvals could negatively impact the LoM plan or cashflow. The regulatory process to recommission Withok is complex, though, and the regulator may not approve all aspects of the envisaged design. The footprint and location of the facility also make for a challenging construction process, and this may result in target dates not being met, and planned throughput rates not being achieved. The QP is of the opinion that no extreme weather conditions will materially impact on the capital development program. Figure 86: Sensitivity Analysis 19.3. Risk Assessment The following highlights show the key risks that Ergo has identified as critical to their operations and Mineral Resources and Mineral Reserves, as well as comments on mitigation of these risks. 19.3.1. Limited Tailings Storage Capacity Ergo is a high volume-driven business and is dependent on large TSFs to deposit waste material after processing and extracting gold in the plant. Ergo needs to ensure that there is sufficient capacity in its TSFs to continue in future at the planned depositions rates as per the LoM. Increasing deposition capacity is therefore critical for Ergo. Primary TSFs are subject to a five-yearly Dam Safety Evaluation (DSE) by an independent Approved Professional Person (APP), who is required to make proposals in a prescribed form to the regulator, the Department of Water and Sanitation (DWS), based on his findings, for the implementation of his recommendations. These recommendations may include adjustments to deposition rates or other recommendations that may result in changes, limitations or restrictions on the use of the TSF, which may impact throughput rate and affect production. ERGO’S TECHNICAL REPORT SUMMARY OF THE MATERIAL TAILINGS STORAGE FACILITIES PAGE 174 174 Ergo monitors the geo-technical integrity of its TSFs carefully in accordance with a prescribed set of parameters. Any deterioration in any of these parameters may result in a reduction in or suspension of throughput which may affect production. The Brakpan TSF is a mature facility and is approaching its final phase as a mega-volume tailings storage facility. Therefore, in light of Ergo’s planned future production plans, Ergo has commenced with the process of recommissioning the adjacent Withok TSF, to create an additional 310 million tonnes of deposition capacity. The requisite public participation process has been completed and the project is in its authorization phase. Commissioning is planned to occur within the next three to four years. Ergo plans to maintain its current deposition rate of 1.65 million tonnes per month for another three to four more years before moving onto the adjacent Withok TSF. The regulatory process to recommission Withok is complex, though, and the regulator may not approve all aspects of the envisaged design. The footprint and location of the facility also make for a challenging construction process, and this may result in target dates not being met, and planned throughput rates not being achieved. Regulatory and construction delays in commissioning replacement tailings storage facilities as existing facilities approach capacity could result in reduced or suspended deposition and adversely affect our production and results of operations. Ergo has allocated ZAR2.67 billion for the implementation of the Withok and Daggafontein TSFs final life design. The timing to have these facilities on-line is crucial as a delay may result in reduced depositions rates or a halt in deposition which will have an adverse financial impact on Ergo. 19.3.2. Rising Electricity Prices and Eskom Supply Distribution The South African economy has over the past years been affected by load shedding and significant electricity tariff increases. The mining industry is a dominant consumer of electricity, consuming approximately 30% of the national electricity supply. The state-owned power utility, Eskom, has stabilized power supply over the past six months, bringing much needed relief to the economy. Although the improvements in energy supply by Eskom have provided much respite for typically energy- intensive mining companies, Eskom is proposing extensive price hikes that will result in increased input costs. Ergo is a 24/7/365 operation therefore, continuous electricity supply is paramount to achieve stable throughput with enhanced efficiencies. Currently, electricity makes up approximately 13% of total operating costs. It is therefore imperative that alternative sources of power supply are explored. At operational level, Ergo has installed extensive back-up systems to counteract the impact of unscheduled interruptions in its power supply. This include emergency generators for critical equipment and infrastructure to ensure the plants remain in motion and are operational immediately after power is cut off. To manage the impact of load shedding at the operations, a load curtailment agreement is in place with Eskom to avoid complete interruption of power supply during blackouts. Functional working relationships with Eskom assist in the proactive management of load curtailment during times of national loadshedding. The construction of the solar plant at Ergo is now complete with 60MW solar power and 160MWh BESS fully operational and integrated into the national grid. The installation of this facility aligns with Ergo’s business objectives and will reduce the cost of electricity while minimizing the impact of power outages, which have both significant operational and environmental consequences. The facility is supplying approximately half of Ergo’s energy requirements and is expected to notably reduce the electricity cost over the LoM. In future, excess power generated will be wheeled through the Eskom grid to other supply points within the group.. The solar plant and BESS have contributed to approximately ZAR108 million cost saving in FY2025. ERGO’S TECHNICAL REPORT SUMMARY OF THE MATERIAL TAILINGS STORAGE FACILITIES PAGE 175 175 Underperformance of the solar plant and battery energy storage system The solar plant integrated with a battery energy storage system is expected to perform at certain key performance indicator targets. Failure of the plant to deliver into these targets may expose Ergo to increased Eskom tariffs that may negatively impact Ergo’s cash position. 19.3.3. Depletion of Mineral Reserves A risk associated with Ergo’s Mineral Reserve is the depletion of higher-grade Mineral Reserves. The assumptions used in the economic analysis (section 19) supports the economic viability of lower grade etraction; however, when the gold price declines, it will be essential to optimize the LoM plan to enable the mining of lower-grade TSFs. Ergo’s strategy is to maintain its Mineral Reserve base by improving the robustness of LoM plan by improving the mineral recovery efficiencies, optimizing the mining throughput and reducing operating costs. The QP associates a low to medium risk to the Mineral Reserve base as some TSF are operating close to the cut-off grade. In certain instances, the risk may be negated by increasing the mining rate of the TSF, thereby reducing the per unit operating cost and the cut-off grade. 19.3.4. Environmental, Social and Governance (ESG) related risks including climate change Increased scrutiny and expectation by stakeholders including governments, non-government organisations (“NGOs”), shareholders, investors, communities and other parties of interest regarding our ESG performance and practices as well as increased reporting requirements, may expose us to additional costs and possible penalties for not complying to related standards. Ergo is exposed to include climate change physical and transitions risks, compliance to environmental legislation and practices, air pollution, soil and water contamination, radiation, noise, water availability and efficient use thereof, energy efficiencies and decarbonization, inappropriate waste management practices, compromised safety and occupational wellbeing, compromised employee health and mental wellness, failure to manage diversity and inclusion, raising community expectations and concerns, complexity of legal and regulatory compliance, supply chain risks, tailings management risks etc. Failure to manage these as well as to achieve the ESG performance targets may negatively impact the business and lead to reduced investor confidence and reputational challenges. Failure to adapt or transition to climate change measures including physical risks as a result of climate change The need to adapt or transition in response to climate change, including complying with new regulations and responding to increased stakeholder expectations, could result in increased compliance and operating costs as well as having other business impacts on production costs and capacity. Failure to adopt measures in the face of transition risks may also negatively impact the business and could lead to reduced investor confidence. Ergo’s approach encompasses  the transition to renewable energy;  optimisation and reuse of water;  Ergo aim to limit their footprint and reduce the affected impact of mining legacies by restoring land for productive use; and  Ergo embarked on several biodiversity studies at and around its operations. Ergo seeks to understand both the ecological and agricultural value associated with the areas that we are regenerating, so that their approach enables them to maximize the best outcomes within their unique contexts. Climate change is influencing weather patterns, which could potentially lead to severe weather events affecting Ergo’s operational areas. Such events could significantly disrupt operations and result in substantial damage to property, infrastructure and the environment, as well pose a risk to human life. To mitigate these risks, operational protocols, particularly those related to the TSF’s, are being actively managed to ensure that, in the event of such events, infrastructure damage is minimized and the consequence of any major failure are effectively contained. ERGO’S TECHNICAL REPORT SUMMARY OF THE MATERIAL TAILINGS STORAGE FACILITIES PAGE 176 176 19.3.5. Fluctuations in the Gold Price and Exchange Rate Gold price and exchange rates are influenced by global economic trends which currently is volatile. A noticeable upswing in the gold price has occurred since 2023, with a peak of USD3,500/oz achieved in April 2025, and a 30 June 2025 price of USD3,284/oz. Between 01 July 2020 and 30 June 2025, a gold price low of USD1 768 was reached on 1 July 2020, indicating price volatility of approximately USD1 732/oz between the high and low gold prices from 2020 to 2025. As a market price taker, Ergo is exposed to fluctuations in the United States Dollar gold price and ZAR/USD exchange rate. The higher the gold price, the higher the profitability. Any sustained decline in the market price of gold from current level may adversely affect Ergo. A decline in the gold price may affect Ergo’s mineral resource, which may negatively impact the life of mine. Ergo’s production costs are in rands, while gold is sold in dollars and then converted to rands. As a result, Ergo’s operating and financial results could be in future materially affected by an appreciation in the value of the rand. Since the revenue line is directly impacted by gold price and rand dollar exchange rate fluctuations, Ergo manages this risk by being very focused on areas that it can influence such as costs and operational efficiency. Ergo continues to look at ways to mitigate the increase of costs and save costs by making ongoing continuous improvements on processes and efficiencies. Precise dosing of chemicals and consumables, based on the ongoing analysis of key drivers in the Ergo processing plant, contributes to keeping costs as low as possible; lower friction in pipelines through HDPE lining reduces power consumption, and maintaining a closed water circuit and use of recycled water reduces the costs of water consumption are a few initiatives implemented. To limit the vulnerability to a drop in the price of gold in ZAR terms, Ergo monitors costs in line with the approach stated above. In addition to that, Ergo also works hard to increase recoveries. 19.3.6. Potable water scarcity and access and cost to secondary water sources (contaminated water) Ergo’s surface retreatment operations are reliant on large volumes of water to transport the slimes from reclaimed areas to the processing plant and to the TSF. Failure to secure access to secondary water sources may negatively impact production and may lead to operational disruptions. Access to these sources is also costly and can increase operational costs significantly. Inadequate water supply can also negatively impact the business from an environmental, social and regulatory aspect and may lead to competition with other water users. Water scarcity is one of the most pressing environmental, economic and social challenges facing South Africa today due to limited freshwater resources, growing demand and inadequate infrastructure (including storage, treatment and distribution systems) from state utilities. It is also acknowledged that water is a limited natural resource, crucial for the sustainability of the planet. There are increasing calls from interest groups for intervention to avoid future deficits in water supply. Ergo has over the past few years reduced its reliance on potable water through various initiatives and strategies. This includes optimisation of their closed water reticulation systems, the use of treated acid mine drainage (AMD) water and several improvements in infrastructure throughout the mining process. Ergo is reliant on retreated acid mine drainage water supplied by a third party – the state-funded Trans-Caledon Tunnel Authority (TCTA) – as a secondary water source. Should TCTA not be able to deliver the required quantities of water to Ergo, operations may be severely affected.


ERGO’S TECHNICAL REPORT SUMMARY OF THE MATERIAL TAILINGS STORAGE FACILITIES PAGE 177 177 Securing adequate volumes and quality of water from secondary sources for operational needs can be costly which may increase operational costs significantly. As part of life of mine planning, water requirements are continuously assessed and as part of wider DRDGOLD group initiatives, research and strategies to secure the required amount of water for the short- to longer-term are being developed. 19.3.7. Complexity of legal / regulatory requirements The evolving and complex regulatory environment governing tailings reclamation, processing, and deposition may lead to compliance challenges, operational and project execution delays, or increased costs. Changes in environmental, mining, or waste management regulations, along with uncertain permitting requirements, could impact plant operations, project timelines, and long-term sustainability. The recently proposed MPRD Bill is also contributing to our exposure to these regulatory uncertainties. The impact of this Bill on DRDGOLD group is high based on the following:  The requirement to apply for a mining right to process movable ‘historical tailings’ pursuant to the MPRD Bill; and  The intended amendments to the MPRD Act allow the relevant Minister to set beneficiation targets for the mining industry and exercise control over the beneficiation of minerals in South Africa. Furthermore, certain regulators are significantly understaffed and under-resourced and not always able to process administrative process in accordance with prescribed timelines, with the result that project planning and execution are delayed. In 2023 and 2024 this risk materialised when the commissioning of a number of new reclamation sites was delayed because of delays in the offices of the DWS, processing application for the issuance of Water Usage Licenses, leading to shortfalls in planned production. Ergo currently has licence and other permit applications pending relating to the re-commissioning of TSFs and the construction of reclamation sites. If these are not processed in time, the projects may experience delays in commissioning, which may lead to lower that targeted production. Various measures and structures are in place to deal with the legal and regulatory framework Ergo is subjected to. This includes amongst other measures:  Defined regulatory processes;  Legal process to enforce regulatory processes;  Leveraging relationships of internal and external consultants within the regulator (in accordance with anti-corruption requirements);  Ongoing stakeholder engagement;  Competent internal and external resources; and  Regulatory collaboration with other mines and Leverage relationship through Minerals Council 19.3.8. Operational efficiencies and plant performance Decline in operational recovery efficiencies such as lower than expected gold output, higher than expected use of reagents, higher than expected residue grades etc. may negatively impact on Ergo’s production and financial objectives. Research is ongoing to improve operational efficiencies and plant performance. Automated process control systems allow for real- time monitoring that enables for early detection and addressing of recovery issues. ERGO’S TECHNICAL REPORT SUMMARY OF THE MATERIAL TAILINGS STORAGE FACILITIES PAGE 178 178 19.3.9. Infrastructure dependency Ageing and inadequately maintained infrastructure can result in unplanned breakdowns and stoppages resulting in production targets not being met and increased costs. Failure of equipment can cause further damage to infrastructure and may result in injuries. Ergo has preventative maintenance measures in place. Ergo also utilizes real-time monitoring tools, such as SCADA systems, to detect infrastructure vulnerabilities and predict potential failures. 19.3.10. Rising costs Ergo’s operating costs mainly comprise labour, steel, electricity, water, reagents, fuels, lubricants and other oil- and petroleum-based products. Many of these consumables are linked to the price of oil and steel and fluctuate accordingly. The global economic environment, geopolitical tensions and inflationary pressures world-wide have led to inflationary increases in production costs which will erode financial value over time. Increases in production costs, if material, will adversely impact our results of operations. Initiatives to reduce costs are ongoing and include amongst other initiatives, self-generation of power through a solar plant and battery system, using of recycled water, reduction of corporate overhead, negotiating lower price increases for consumables where possible, budget and cost controls. Most of the South African labour force is unionised, and wage increase demands have in recent years been above the prevailing rates of inflation. Ergo’s wage agreement for employees in the Bargaining Unit expired at the end of June 2025 and negotiations have since been taking place with organised labour who represent the employees in the Bargaining Unit. At the time of writing this report, the parties (management and organised labour) are in deadlock. The deadlock is at a stage now where a mediator from the Commission for Conciliation Mediation and Arbitration (CCMA) has called on the parties to agree picketing rules by November 3rd, 2025. There is an increased likelihood of wage-related disputes escalating into industrial action, including potential labour strikes. Such developments could significantly disrupt operations and pose safety risks to employees. Management is monitoring developments closely and has initiated contingency planning to mitigate potential operational and safety impacts. 19.3.11. Uncertainties regarding supply chain The global inflationary pressures as well as geopolitical volatility may negatively impact availability and cost of critical material and equipment. This may be further exacerbated by the increase in the frequency and severity of natural disasters such as severe weather, floods and earthquakes which may further increase this risk. The risk of dependency on key suppliers requires ongoing focus and proactive management. A sustained unavailability and increased cost of critical material such as reagents and critical equipment may require Ergo to find acceptable substitute suppliers and may also require it to pay higher prices for such materials, potentially affect production and increase operating costs resulting in loss of revenue. Furthermore, there is a growing risk of a shortage of cyanide supply in South Africa. Ergo being a high-volume operation is a high consumer of cyanide. Shortages would result in a decrease in production. New projects may also be adversely affected by delays in supplies, freight costs and higher than inflationary increases for capital equipment which may affect operations and production and ultimately result in failure to deliver into the business plans. Ergo is pursuing initiatives that broaden access to critical materials and reagents (including cyanide), including exploring alternative sources and recovery opportunities. Ongoing efforts to engage more broadly across the mining industry further enhance our ability to navigate these challenged. 19.3.12. Social license to operate Pressures and demands on business by local communities and non-government organizations have increased. Social license to operate issues are typically driven by the social and economic landscape; and has been exacerbated by the social and economic issues in South Africa. Unemployment, hunger and desperation are of great concern and have led to demands to participate in and benefit from the economic activities of Ergo’s business activities. Failure to recognize these ERGO’S TECHNICAL REPORT SUMMARY OF THE MATERIAL TAILINGS STORAGE FACILITIES PAGE 179 179 could result in miscommunication, misaligned expectations and loss of trust. This could lead to increased potential of violent strikes that could cause damage to property, harm to people and disrupt operations and in turn also threaten their social license to operate. Ergo’s social value-add includes various initiatives that are focused on the realities faced by communities and aims to alleviate poverty and provide educational opportunities to the youth. Exposure to these social demands and challenges is expected to remain for the foreseeable future. Ergo will continue to strive to improve the quality of life for those living in proximity to their operations. 19.3.13. Country risk Operating within the South African context remains challenging due to ongoing leadership struggles within the Government of National Unity (GNU), which contribute to unpredictable policy and regulatory changes. These uncertainties, combined with rising crime, corruption, systemic failures, persistent public infrastructure constraints, and inadequate service delivery, continue to erode public trust and heighten social tensions. As a result, there is growing pressure on the private sector to provide essential services and extend support to affected communities. High levels of poverty and unemployment further drive expectations for greater participation in, and benefits from, the economic activities of our business. If these dynamics are not effectively recognized and managed, they may lead to miscommunication, misaligned expectations, and a loss of trust. This, in turn, increases the risk of violent strikes, property damage, threats to personal safety, operational disruptions, and ultimately a weakening of their social license to operate. Ergo also faces heightened exposure to security-related risks such as organized crime, fraud, theft, bribery, and corruption—exacerbated by inefficiencies within law enforcement. These risks pose potential threats to employee safety and operational continuity. To address these challenges, they continue to enhance and adapt our security measures to safeguard their people, assets, and operations. For additional information regarding the Company’s risks, see Item 3D of the Form 20-F. 20. ADJACENT PROPERTIES There are no adjacent properties to report. 21. OTHER RELEVANT DATA AND INFORMATION Ergo is committed to improving governance and transparency in the safety and management of TSFs, a commitment that so far has taken Ergo to implement the following:  an internal Tailings Performance Management System (TPMS) was implemented for dedicated data collection, storage and processing to ensure the integrity of the data for day-to-day management and oversight purposes;  quarterly drone surveillance; and  review of historical Interferometric Synthetic Aperture Radar (InSAR) imagery for mapping ground deformation over large areas. An external Tailings Review Panel review panel has been in place since 2018. The QPs and Ergo have a number of internal controls to manage risk and uncertainty in the Mineral Resource and Mineral Reserve estimation process. Regular meetings are held with the QPs, Ergo contractors and Ergo’s MRM Manager to discuss any ongoing improvements, concerns or areas requiring further work. The QPs liaise with the relevant specialists on an on-going basis to check on progress of a number of technical programs. There is no other known available relevant data or information material to the discussed properties in this regard. ERGO’S TECHNICAL REPORT SUMMARY OF THE MATERIAL TAILINGS STORAGE FACILITIES PAGE 180 180 22. INTERPRETATION AND CONCLUSIONS The QP concludes that the protocols for drilling, sampling preparation and analysis, verification, and security meet industry standard practices and are appropriate for the purposes of a Mineral Resource estimate. The initial assessments have found that the Ergo TSFs have reasonable prospects for economic extraction. The QP is satisfied with the QA developed by The RVN Group and the QC program implemented, as there was no significant bias in reporting data. The QP contends that the assumptions, parameters and methodology used for the Mineral Resource estimate are appropriate for the style of mineralization and deposit type. The tonnage and content of the TSFs are as expected and can be processed in the current Ergo processing plant. TSFs reported in this document have sufficient information to be used in the Mineral Reserve estimates and demonstrate economic viability. The identified risks that could affect the Mineral Resources and Mineral Reserves are:  Limited Tailings Storage Capacity  Rising Electricity Prices and Eskom Supply Distribution;  Depletion of Mineral Reserves;  Environmental, Social and Governance (ESG);  Fluctuations in the Gold Price and Exchange Rate;  Potable water scarcity and access and cost to secondary water sources (contaminated water);  Complexity of legal/regulatory requirements;  Operational efficiencies and plant performance;  Infrastructure dependency;  Rising costs;  Uncertainties regarding supply chain;  Social license to operate; and  Country risk. 23. RECOMMENDATIONS There is sufficient information to allow for decision-making. Accordingly, the QPs did not recommend any additional work. 24. REFERENCES Alakangas, E. (2015). Quality guidelines of wood fuels in Finland (VTT-M-04712-15). VTT Technical Research Centre of Finland. Sourced July 2025 - https://publications.vtt.fi/julkaisut/muut/2015/VTT-M-04712-15.pdf DRDOLD Limited Annual Integrated Report 2025. Sourced October 2025 https://www.drdgold.com/component/jdownloads/?task=download.send&id=373&catid=138&m=0 Engles, J., (n.d.). Tailings Info. Sourced July 2022 - https://www.tailings.info/technical/hydraulic.htm Goldprice, 2025. Sourced July 2025 - https://goldprice.org/gold-price-today/2025-06-30 Macrotrends. (2025). Sourced July 2025 - (https://www.macrotrends.net/1333/historical-gold-prices-100-year-chart) Mudau, M., & Rupprecht, S. M. (2023). Technical Report Summary of the Material Tailings Storage Facility. The RVN Group, Johannesburg. Sourced July 2025: https://www.sec.gov/Archives/edgar/data/1023512/000102351223000062/ergominingconsolidatedtr.htm


ERGO’S TECHNICAL REPORT SUMMARY OF THE MATERIAL TAILINGS STORAGE FACILITIES PAGE 181 181 25. RELIANCE ON INFORMATION PROVIDED BY THE REGISTRANT The QPs relied on the following information provided by the registrant:  legal matters about the Mining and Prospecting Rights. The QPs considered it reasonable to rely on the registrant’s legal opinion (legal or permitting matters are discussed in Item 1.3, Item 3.3 to Item 3.6 and Item 17.8);  environmental matters discussed in Item 17.1 and Item 17.2 relating to Ergo compliance;  Ergo commits or plans to provide to local individuals or groups (Item 17.9);  macroeconomic trends, data, and assumptions and interest rates (Item 16); and  marketing information and plans (Item 16). The QPs considered it reasonable to rely on the above information as the registrant has the necessary expertise and has been in operation for more than 15 years of successful and profitable retreatment of TSFs and sand dumps. The QP also found that the data provided aligns with the industry norms. The QPs have no reason to believe that any material facts had been withheld or misstated. ERGO’S TECHNICAL REPORT SUMMARY OF THE MATERIAL TAILINGS STORAGE FACILITIES PAGE 182 182 26. QUALIFIED PERSONS DISCLOSURE CONSENT We, the signees, in our capacity as Qualified Persons in connection with the Technical Report Summary of Ergo Mining Proprietary Limited dated 30 October 2025 (The Technical Report Summary) as required by Item 601(b)(96) of Regulation S-K and filed as an exhibit to DRDGOLD Limited’s (DRDGOLD) annual report on Form 20-F for the year ended 30 June 2025 and any amendments or supplements and/or exhibits thereto (collectively, the “Form 20-F”) pursuant to Subpart 1300 of Regulation S-K promulgated by the U.S. Securities and Exchange Commission (1300 Regulation S-K), each hereby consent to:  the public filing and use by DRDGOLD of the Technical Report Summary for which I am responsible as an exhibit to the Form 20-F;  the use and reference to my name, including my status as expert or Qualified Person (as defined by SK-1300) in connection with the Form 20-F and Technical Report Summary for which I am responsible;  use of any extracts from, or summary of, the Technical Report Summary in the Form 20-F and the use of any information derived, summarized, quoted or referenced from the Technical Report Summary, or portions thereof, that is included or incorporated by reference into the Form 20-F; and any amendments or supplements thereto. I am responsible for authoring, and this consent pertains to, the Technical Report Summary (Table 90) for which my name appears below and certify that I have read the 20-F and that it fairly and accurately represents the information in the Technical Report Summary for which I am responsible. Table 90: Qualified Person’s Details Property Name TRS Effective Date QP Name Affiliation to Registrant Field or Area of Responsibility Signature Ergo Mining Proprietary Limited (A subsidiary of DRDGOLD Limited) 30 June 2025 Professor Steven Rupprecht Independent Consultant Item 1 and 12 to 19 /s/ Steven Rupprecht Ergo Mining Proprietary Limited (A subsidiary of DRDGOLD Limited) 30 June 2025 Mr Mpfariseni Mudau Independent Consultant Item 1 to 11 and 20 to 25 /s/ Mpfariseni Mudau ERGO’S TECHNICAL REPORT SUMMARY OF THE MATERIAL TAILINGS STORAGE FACILITIES PAGE 183 183 27. DATE AND SIGNATURES This report entitled ‘Ergo’s Technical Report Summary of the Material Tailings Storage Facilities’, with an effective date of 30 June 2025 was prepared for Ergo Mining Proprietary Limited by the Qualified Persons: Mr Mpfariseni Mudau and Professor Steven Rupprecht. Dated at Johannesburg, 30 October 2025. /s/ Mpfariseni Mudau __________________________________ Mpfariseni Mudau (Pr.Sci.Nat) Resource Geology Manager The RVN Group (Pty) Ltd /s/ Steven Rupprecht __________________________________ Steven Rupprecht (HFSAIMM) Principal Mining Engineer The RVN Group (Pty) Ltd


Exhibit 97.1
image_1.jpg
NYSE EXECUTIVE REMUNERATION COMPENSATION CLAWBACK POLICY
1.PURPOSE
a.The purpose of this policy (this “NYSE Clawback Policy”) is to set out the basis for the mandatory recovery of erroneously awarded Incentive-Based Compensation (as defined below) from Executives (as defined below) of DRDGOLD LIMITED (the “Company”, together with its subsidiaries, the “Group”) in the event of a Restatement (as defined below).
b.The remuneration committee (the “Remuneration Committee”) of the board of directors of the Company (the “Board”) has adopted this NYSE Clawback Policy in accordance with the requirements of Section 303A.14 of the New York Stock Exchange (“NYSE”) Listed Company Manual, which was mandated by Rule 10D-1 of the Securities Exchange Act of 1934 (the “Exchange Act”).
c.This NYSE Clawback Policy may be amended from time to time by the Remuneration Committee pursuant to any laws, regulations or rules of the US Securities and Exchange Commission, the NYSE, any other stock exchange on which the Company’s securities are listed or other regulatory authority applicable to the Group or the Executive (“Applicable Law”). Applicable Law includes Section 304 of the US Sarbanes-Oxley Act of 2002. Executives will be notified of any significant amendments to this NYSE Clawback Policy and how such amendments may impact their remuneration.
2.APPLICABILITY
a.This NYSE Clawback Policy applies to the Company’s current and former executive directors or members of senior management of the Company (or its equivalent from time to time), as well as any other person(s) (if any) as the Company may determine also constitute “executive officers” as defined in Section 303A.14(e) of the NYSE Listing Company Manual (each an “Executive”). Executives of the Company’s parent(s) or subsidiaries are deemed to be Executives of the Company if they perform such policy making functions for the Company. Individuals will be notified as soon as practicable after becoming or being determined to be an Executive.
b.Remuneration shall be subject to recovery pursuant to this NYSE Clawback Policy where: (i) the Remuneration Committee determines that such remuneration constitutes Incentive-Based Compensation; and (ii) the remuneration was Received (as defined below) by an Executive:
i.after beginning their services as an Executive;
ii.who served as an Executive at any time during the performance period for that Incentive-Based Compensation;
iii.while the Company has a class of securities listed on the NYSE, another national securities exchange, or a national securities association in the United States; and
iv.during the Recovery Period (as defined below);


image_1.jpg
provided that this NYSE Clawback Policy shall only apply to remuneration Received on or after 2 October 2023 (the “Effective Date”).
c.For the avoidance of doubt, this NYSE Clawback Policy continues to apply to an Executive following any termination of their office or employment.
d.This NYSE Clawback Policy will be notified to Executives through any means determined by the Remuneration Committee.
3.RECOVERY OF ERRONEOUSLY AWARDED INCENTIVE-BASED COMPENSATION
a.In the event that the Company is required to prepare an accounting restatement due to the material noncompliance of the Company with any financial reporting requirement under Applicable Law (a “Restatement”), including any required accounting restatement to correct an error in previously issued financial statements that is material to the previously issued financial statements, or that would result in a material misstatement if the error were corrected in the current period or left uncorrected in the current period, the Remuneration Committee shall recover the amount of Incentive-Based Compensation Received by an Executive in the Recovery Period that exceeds the amount of Incentive-Based Compensation that otherwise would have been Received by the Executive had such remuneration been determined based on the restated amounts, computed without regard to any taxes/duties/contributions/levies (“Taxes”) paid or payable (“Recoverable Amount”). The Recoverable Amount shall not exceed the differential between the amount of Incentive-Based Compensation paid to such Executive in connection with the Restatement and the amount of Incentive-Based Compensation that would have been paid to such Executive had the Restatement not occurred (in each case without regard to any Taxes paid or payable). Where Incentive-Based Compensation is based only in part on the achievement of a Financial Reporting Measure performance goal, the Remuneration Committee shall first determine the portion of the original Incentive-Based Compensation based on or derived from the Financial Reporting Measure that was restated. The Remuneration Committee shall then recalculate the affected portion based on the Financial Reporting Measure as restated, and recover the difference between the greater amount based on the original financial statements and the lesser amount that would have been received based on the restatement.
b.Whether a Restatement has occurred for the purposes of this NYSE Clawback Policy shall be confirmed by the Remuneration Committee, which shall rely on any decision in this respect of the audit committee of the Company (the “Audit Committee”).
c.The Recovery Period shall mean the period of three full financial years of the Company preceding the Restatement Date (as defined below) and any transition period that results from a change in the Company’s financial year within or immediately following such period.
d.For Incentive-Based Compensation based on share price or total shareholder return, where the Recoverable Amount is not subject to mathematical recalculation directly from the information in the Restatement, the Recoverable Amount will be determined by the
Remuneration Committee based on the Remuneration Committee’s reasonable estimate of

2

image_1.jpg
the effect of the Restatement on the share price or total shareholder return upon which the Incentive-Based Compensation was received. The Company must maintain documentation of the determination of that reasonable estimate and provide such documentation to the NYSE.
e.Following a Restatement, the Remuneration Committee shall:
i.determine the Recoverable Amount in accordance with Section 3.1 of this NYSE Clawback Policy; and
ii.to the extent the Recoverable Amount has been Received by an Executive, instruct the Company to recover reasonably promptly the full Recoverable Amount in accordance with Section 3.6 of this NYSE Clawback Policy; or
iii.to the extent the Recoverable Amount has not been Received, but is otherwise owed to an Executive, cancel the right of such Executive to receive the Recoverable Amount.
f.To the extent permitted by Applicable Law, the Remuneration Committee may seek to recoup Recoverable Amounts by all legal means available, including but not limited to, by requiring any affected Executive to repay such amount to the Company, by set-off, by reducing future remuneration of such affected Executive, or by such other means or combination of means as the Remuneration Committee, in its sole discretion, determines to be appropriate.
g.Recoupment of the Recoverable Amount under this NYSE Clawback Policy will be initiated by the Company as soon as practicable following the written request of the Remuneration Committee.
h.All amounts recoverable pursuant to this NYSE Clawback Policy shall be payable by the Executive to the Company (or as the Company directs) and shall be payable immediately on demand.
i.For purposes of this NYSE Clawback Policy:
i.“Incentive-Based Compensation” means any remuneration that is granted, earned, or vested/released based wholly or in part upon the attainment of a Financial Reporting Measure (as defined below). Incentive-Based Compensation is based in part upon the attainment of a Financial Reporting Measure if such compensation is subject to multiple conditions one or more, but not all, of which are Financial Reporting Measures.
1.Incentive-Based Compensation includes remuneration Received under the DRDGOLD Deferred Share Plan 2024 or any other variable remuneration structures operated by the Group from time to time under which awards are wholly or in part based upon the attainment of a Financial Reporting Measure.
ii.“Financial Reporting Measure” means any measure that is determined and presented in accordance with International Financial Reporting Standards as issued by the International Accounting Standards Board (“IFRS”) (or any other accounting principles used to prepare the Group’s financial statements from time to

3

image_1.jpg
time), and any measure derived wholly or in part from such measure, including non-IFRS financial measures (as well as other measures, metrics and ratios that are non-IFRS measures). The term Financial Reporting Measure includes stock price and total shareholder return. Financial Reporting Measures may be presented outside the Company’s financial statements.
iii.“Received”: Incentive-Based Compensation is deemed Received in the Company’s financial period during which the Financial Reporting Measure specified in the Incentive-Based Compensation award is attained, even if the payment or grant occurs after the end of the financial period in which the Financial Reporting Measure is attained. For the avoidance of doubt, an Executive receives the Incentive-Based Compensation even when the Executive has established only a contingent right to payment at that time. Ministerial acts or other conditions necessary to effect issuance or payment, such as calculating the amount earned or obtaining Remuneration Committee approval of payment do not affect the determination of the date Received. In the case of awards subject to multiple conditions, not all conditions must be satisfied for the Incentive-Based Compensation to be deemed Received. The Remuneration Committee shall have the discretion to determine when the Incentive-Based Compensation was Received, and such determination need not be uniform across the type of Incentive-Based Compensation or for all Executives.
iv.“Restatement Date” means the date on which the Company is required to prepare a Restatement, which is the earlier to occur of: (i) the date on which the Board, or the Audit Committee concludes, or reasonably should have concluded, that the Company is required to prepare a Restatement; or (ii) the date a court, regulator or other legal authorised body directs the Company to prepare a Restatement.
4.IMPRACTICABILITY EXCEPTION TO RECOVERY OBLIGATION
a.The Company must recover the Recoverable Amount in compliance with this NYSE Clawback Policy except to the extent that the conditions set out in 4.2.1, 4.2.2 or 4.2.3 of this NYSE Clawback Policy are met and the Remuneration Committee determines, in its sole discretion, that recovery would be impracticable.
b.The Remuneration Committee may determine that a recovery is impracticable only if:
i.following a reasonable attempt to recover the Recoverable Amount, the Remuneration Committee determines, in its sole discretion, that the direct expense that would need to be paid to a third party to assist in enforcing this NYSE Clawback Policy would exceed the Recoverable Amount. The Company must document such reasonable attempt(s) to recover and provide that documentation to the NYSE;
ii.recovery would violate a law of the Republic of South Africa, where such law was adopted prior to November 28, 2022. Before concluding that it would be impracticable to recover any Recoverable Amount based on a violation of the law of the Republic of South Africa, the Company must obtain an opinion of South African

4

image_1.jpg
counsel, acceptable to the NYSE that recovery would result in such a violation and provide such opinion to the NYSE; or
iii.if applicable, the Remuneration Committee determines that recovery would likely cause an otherwise tax-qualified retirement plan, under which benefits are broadly available to employees of the Company, to fail to meet the requirements of 26 U.S.C. 401(a)(13) or 26 U.S.C. 411(a) and regulations thereunder.
c.In determining whether a recovery would be impracticable due to costs in accordance with 4.2.1 above, the only criteria that the Remuneration Committee may consider is whether the direct costs, such as reasonable legal expense and consulting fees, amongst others, paid to a third party to assist in enforcing recovery would exceed the Recoverable Amount. Indirect costs, such as reputational concerns or the effect on hiring of new Executives, amongst others, may not be considered when determining whether recovery is impracticable.
5.INDEMNIFICATION AND INSURANCE
a.The Group is prohibited from insuring or indemnifying any Executive against the loss of erroneously awarded remuneration as set forth in this NYSE Clawback Policy. If an Executive purchases a third-party insurance policy to fund potential recovery obligations, the Company is prohibited from paying or reimbursing the Executive for premiums for such an insurance policy.
6.OTHER RECOVERY RIGHTS
a.Any right of recovery under this NYSE Clawback Policy applies in addition to (and without limiting) any other remedies and/or rights to reduce, cancel or recover any elements of remuneration (or similar) that may be available to any member of the Group pursuant to any remuneration policy (including any further malus and clawback policies) operated by any member of the Group, the terms of any incentive plans or awards operated by any member of the Group, any employment agreement, any other terms and conditions and/or Applicable Law applicable to any Executive, in each case from time to time in force, and/or pursuant to any other legal remedies available to any member of the Group. Recovery (or similar) may be applied pursuant to both this NYSE Clawback Policy and any such other policies, plans, awards, agreements, terms, conditions, Applicable Laws or similar in

5

image_1.jpg
respect of the same award of remuneration, provided that there shall be no duplication of recovery.
7.DISCLOSURE
a.In the event of any Restatement, the Company shall disclose certain information in its annual report on Form 20-F, as required by Form 20-F. This information shall include, without limitation:
i.the date on which the Company was required to prepare the Restatement;
ii.the aggregate Recoverable Amount (in US dollars), including an analysis of how the Recoverable Amount was calculated, or, if not determined, an explanation of the reasons;
iii.any estimates used to determine the Recoverable Amount for Financial Reporting Measures related to share price or total shareholder return and an explanation of the methodology used for such estimates;
iv.any required details of Recoverable Amounts that remain outstanding (on an aggregate, individual, group or other basis, as required) and for which recovery has been forgone due to impracticability and the reasons why, for the relevant annual report on Form 20-F and otherwise pursuant to the requirements of any other annual report or statement it is obligated to prepare and file under the Exchange Act.
b.This NYSE Clawback Policy shall be filed as an exhibit to the first annual report on Form 20-F that the Company is required to file under the Exchange Act after the adoption of this NYSE Clawback Policy. If this NYSE Clawback Policy is amended, the amended policy shall be filed as an exhibit to the first annual report on Form 20-F that the Company is required to file under the Exchange Act after such amendment.
8.ADMINISTRATION AND OPERATION
a.The Remuneration Committee has the exclusive power and full and final authority to: (i) administer this NYSE Clawback Policy, including, without limitation, the right and power to interpret the provisions of this NYSE Clawback Policy; (ii) make all determinations deemed necessary or advisable in applying this NYSE Clawback Policy (which in every case shall be made at the Remuneration Committee’s absolute discretion, without this being limited by references in certain clauses but not others to a discretion being absolute), including, without limitation, determinations as to: (a) what constitutes Incentive-Based Compensation, a Recoverable Amount or other remuneration; (b) that a Restatement has occurred (in reliance on any decision in this respect of the Audit Committee); and (c) whether a recovery is impracticable; and (iii) delegate any power or discretion under this NYSE Clawback Policy to such person or persons as it may determine (and in which case this NYSE Clawback Policy shall be applied accordingly). The Remuneration Committee

6

image_1.jpg
may delegate administrative duties with respect to this NYSE Clawback Policy to one or more officers or employees of the Company.
b.Any action, interpretation or determination taken or made by the Remuneration Committee pursuant to this NYSE Clawback Policy will be final, conclusive and binding.
c.From and after the adoption of this NYSE Clawback Policy, each award agreement or other document setting forth the terms and conditions of any annual incentive or other performance-based award granted to an Executive shall include a provision incorporating the requirements of this NYSE Clawback Policy.
9.GENERAL
a.Any provision in this NYSE Clawback Policy can apply even if the Executive was not responsible for the Restatement in question or if it took place before the grant and/or vesting/release of any remuneration which is subject to recovery.
b.The means of recovery can be different for different Executives in relation to the same or different events depending on the particular facts and circumstances of the Executive and their remuneration.
c.An Executive will not be entitled to any remuneration or compensation from the Group in respect of any application of this NYSE Clawback Policy.
d.The remedy specified in this NYSE Clawback Policy shall not be exclusive and shall be in addition to every other right or remedy at law or in equity that may be available to the Company or a member of the Group.
e.The terms of this NYSE Clawback Policy shall apply regardless of any agreement, undertaking or suggestion (or similar), whether or not contractual, that any remuneration shall not be subject to recovery.
f.The invalidity or unenforceability of any provision of this NYSE Clawback Policy shall not affect the validity or enforceability of any other provision.
g.South African law governs this NYSE Clawback Policy and its construction. The South African courts have non-exclusive jurisdiction in respect of disputes arising under or in connection with this NYSE Clawback Policy.
h.References in this NYSE Clawback Policy to the phrase “including” (or similar) shall not limit or prejudice the generality of the following words (without this being limited by such references in some clauses but not others).

7