dt-202210310001773383false10/31/202200017733832022-10-312022-10-31
UNITED STATES
SECURITIES AND EXCHANGE COMMISSION
Washington, D.C. 20549
FORM 8-K
CURRENT REPORT
Pursuant to Section 13 OR 15(d) of The Securities Exchange Act of 1934
Date of Report (Date of earliest event reported): October 31, 2022
DYNATRACE, INC.
(Exact name of registrant as specified in its charter)
| | | | | | | | | | | | | | |
| | | | |
Delaware | | 001-39010 | | 47-2386428 |
(State or other jurisdiction of
incorporation) | | (Commission File Number) | | (I.R.S. Employer Identification No.) |
| | | | | | | | | | | |
1601 Trapelo Road, Suite 116 | | 02451 |
Waltham | MA | | |
(Address of principal executive offices) | | (Zip Code) |
(781) 530-1000
Registrant's telephone number, including area code
Not Applicable
(Former name or former address, if changed since last report.)
Check the appropriate box below if the Form 8-K filing is intended to simultaneously satisfy the filing obligation of the registrant under any of the following provisions (see General Instruction A.2. below):
☐ Written communications pursuant to Rule 425 under the Securities Act (17 CFR 230.425)
☐ Soliciting material pursuant to Rule 14a-12 under the Exchange Act (17 CFR 240.14a-12)
☐ Pre-commencement communications pursuant to Rule 14d-2(b) under the Exchange Act (17 CFR 240.14d-2(b))
☐ Pre-commencement communications pursuant to Rule 13e-4(c) under the Exchange Act (17 CFR 240.13e-4(c))
Securities registered pursuant to Section 12(b) of the Act:
| | | | | | | | |
| Title of each class | Trading Symbol(s) | Name of each exchange on which registered |
| Common Stock, par value $0.001 per share | DT | New York Stock Exchange |
Indicate by check mark whether the registrant is an emerging growth company as defined in Rule 405 of the Securities Act of 1933 (§230.405 of this chapter) or Rule 12b-2 of the Securities Exchange Act of 1934 (§240.12b-2 of this chapter).
Emerging growth company ☐
If an emerging growth company, indicate by check mark if the registrant has elected not to use the extended transition period for complying with any new or revised financial accounting standards provided pursuant to Section 13(a) of the Exchange Act. o
Item 2.02. Results of Operations and Financial Conditions.
On November 2, 2022, Dynatrace, Inc. (the "Company") issued a press release announcing, and will hold a conference call to discuss, the Company's financial results and other information for the quarter ended September 30, 2022. The full text of the press release is furnished as Exhibit 99.1 to this report and incorporated into this Item 2.02 by reference.
Item 5.02. Departure of Directors or Certain Officers; Election of Directors; Appointment of Certain Officers; Compensatory Arrangements of Certain Officers.
On November 2, 2022, the Company announced that the Company’s Board of Directors (the “Board”) has appointed Jim Benson, age 55, as the Company’s Chief Financial Officer and Principal Financial Officer, effective November 15, 2022. Prior to joining the Company, Mr. Benson served as Executive Vice President and Chief Financial Officer of Akamai Technologies, Inc. from 2012 through February 2020. Mr. Benson has served on the Board of Directors of publicly traded Temenos AG since May 2021 and is a director of several other private companies. Mr. Benson holds a Bachelor of Science in Finance from Bentley University and a Master of Business Administration from Clark University.
In connection with his appointment as Chief Financial Officer of the Company, the Company entered into an Offer Letter with Mr. Benson providing for: (i) a base salary of $475,000 per year, (ii) eligibility to receive cash incentive compensation with a target of 75% of his base salary, subject to the terms of any applicable incentive compensation plan(s), and with a guaranteed at-plan attainment for fiscal year 2023 only, and (iii) a grant of restricted stock units valued at $10,500,000, which shall vest over four (4) years, with 25% vesting after 1 year, and thereafter in twelve (12) equal quarterly installments, in each case subject to Mr. Benson’s continued service with the Company. The foregoing summary does not purport to be complete and is qualified in its entirety by the Offer Letter, a copy of which is attached hereto as Exhibit 10.1 and is incorporated herein by reference. The Company and Mr. Benson will also enter into an employment agreement reflecting the terms included in the Offer Letter and an agreement regarding confidentiality, intellectual property assignment and certain post-termination covenants of Mr. Benson, including non-solicitation and non-competition.
The Company will enter into an indemnification agreement with Mr. Benson in connection with his employment, which will be in substantially the same form as that entered into with the other executive officers of the Company filed as Exhibit 10.5 to the Company’s Registration Statement on Form S-1/A filed on July 22, 2019 and incorporated herein by reference.
There are no family relationships between Mr. Benson and any director or executive officer of the Company, and the Company has not entered into any transactions with Mr. Benson that are reportable pursuant to Item 404(a) of Regulation S-K. Except as described above, there are no arrangements or understandings between Mr. Benson and any other persons pursuant to which he was appointed as Chief Financial Officer.
Mr. Burns will resign as Chief Financial Officer and Principal Financial Officer effective November 15, 2022 and will remain with the Company to ensure a smooth transition of his duties to Mr. Benson.
Item 7.01. Regulation FD Disclosure
On November 2, 2022, the Company issued a press release announcing Mr. Benson’s appointment as Chief Financial Officer. A copy of the press release is furnished as Exhibit 99.2 to this Report on Form 8-K.
The information in Item 2.01, this Item 7.01 and Exhibits 99.1, 99.2 and 99.3 attached hereto is intended to be furnished and shall not be deemed “filed” for purposes of Section 18 of the Securities Exchange Act of 1934, as amended (the “Exchange Act”), or otherwise subject to the liabilities of that section, nor shall it be deemed incorporated by reference in any filing under the Securities Act of 1933, as amended, or the Exchange Act, except as expressly set forth by specific reference in such filing.
Item 9.01. Financial Statements and Exhibits.
(d) Exhibits
| | | | | | | | |
Exhibit
No. | | Description |
| |
| | |
| | |
| | |
| | |
| 104 | | Cover Page Interactive Data File - the cover page XBRL tags are embedded within the Inline XBRL document |
| | |
SIGNATURES
Pursuant to the requirements of the Securities Exchange Act of 1934, the registrant has duly caused this report to be signed on its behalf by the undersigned hereunto duly authorized.
| | | | | | | | | | | |
Date: November 2, 2022 | Dynatrace, Inc. | |
| | | |
| By: | /s/ Rick McConnell | |
| | Rick McConnell | |
| | Chief Executive Officer | |
| | (Principal Executive Officer) | |
October 31, 2022
Jim Benson
Dear Jim,
Are you excited?! We are! We cannot wait to have you join the team at Dynatrace LLC (“Dynatrace”) as Chief Financial Officer! We are counting on your positive contribution and know that together we can accelerate innovation and digital transformation for the biggest and brightest brands around the globe!
Ready?
Provided we have all the necessary documentation to move forward with your employment, your target start date will be on or before November 15, 2022 (or as otherwise mutually agreed).
Team
As Chief Financial Officer, you will report to Rick McConnell, Chief Executive Officer. This is a full-time, exempt position located in our Waltham, Massachusetts office. As you grow your career at Dynatrace, Dynatrace has the right to change the position, modify or assign additional responsibilities.
Compensation
Your initial base salary will be equivalent to $475,000.00 annually, which will be paid in semi-monthly installments of $19,791.67 subject to deductions for taxes and other withholdings as required by law or the policies of Dynatrace.
Incentive Plan
In addition to your base salary, you will be eligible to participate in the current fiscal year Incentive Plan with a target incentive bonus of 75% of your base salary at plan as determined by your position within Dynatrace. The terms and conditions of your Incentive Plan specific to any award or payment will be outlined in a separate document provided to you by your manager. For the FY23 Incentive Plan only, you will receive a guaranteed at plan target attainment applied to your FY23 earnings.
Equity
In the month following your date of hire, management will recommend to the Compensation Committee that you be granted an RSU equity award valued at $10,500,000 vesting over four years, with 25% vesting after 1 year, and thereafter in twelve (12) equal quarterly installments. This equity grant will be subject to approval by the Compensation Committee and will be governed by the terms and conditions of the Company’s 2019 Equity Incentive Plan and award agreement issued thereunder.
Out of Office
You will be eligible for paid time off, and sick pay based on the company’s time off policy, included in the enclosed Benefit Summary document.
Benefits
Dynatrace provides a competitive benefits package for our full-time employees. You are eligible for Dynatrace’s healthcare benefits and 401(k) Plan, as defined in the enclosed summary of benefits. Should you choose to enroll, your eligibility to participate will be effective on your first day of employment.
Fine Print (yes, we have to do this!)
As is true for all Dynatrace employees, your employment with Dynatrace will be “at will,” meaning that either you or Dynatrace may terminate your employment at any time for any reason. Also, your employment is conditioned on you successfully completing and satisfactorily passing a background check and verifying your work authorization in the United States.
Lastly, as a condition of employment, we will ask that you sign the Dynatrace Code of Business Conduct and Ethics, Unlawful Harassment Policy, and Employee Agreement on or before your first day of employment. You also confirm that you will not remove or take any documents or proprietary data or materials of any kind, electronic, or otherwise, with you from your current or former employer to Dynatrace without written authorization from your current or former employer. By accepting this offer, you confirm that you are free from any contractual obligations that would prevent you from performing your duties as an employee of Dynatrace, such as restrictions imposed by a current or former employer. If you have executed an employment agreement with your current, or any former employer, the terms of which are still in effect, you must present a copy of that agreement for Dynatrace's review and approval prior to accepting this offer. This offer may be withdrawn if any of the above conditions are not satisfied.
We are delighted to have you join Dynatrace and look forward to your acceptance of this offer. This offer for employment expires October 31, 2022. Welcome home!
Best regards,
/s/ Sue Quackenbush
Sue Quackenbush Chief People Officer Dynatrace LLC
Dynatrace Reports Second Quarter of Fiscal Year 2023 Financial Results
Delivers Adjusted ARR growth of 33% year-over-year
WALTHAM, Mass, November 2, 2022 (Business Wire) - Software intelligence company Dynatrace (NYSE: DT) today released financial results for the second quarter of its fiscal 2023 ended September 30, 2022.
“Dynatrace delivered strong second quarter results, demonstrating top to bottom line performance exceeding guidance across all of our key metrics," said Rick McConnell, Chief Executive Officer. “Observability solutions are becoming increasingly mandatory as digital transformation, in particular cloud modernization, remains one of the most durable areas of investment for enterprises. At the same time, we are not immune to the macro-environment and believe it is appropriate to take a more cautious approach to ARR growth in the back half of fiscal 2023. We'll continue to invest in product innovation and go-to-market initiatives that position us well for the long-term. Expanding the Dynatrace Platform with our Grail technology exemplifies this and represents a major leap forward for customers looking to cost effectively address log management and analytics."
Second Quarter Fiscal 2023 and Other Recent Business Highlights:
All growth rates are compared to the second quarter of fiscal 2022, unless otherwise noted.
Financial Highlights:
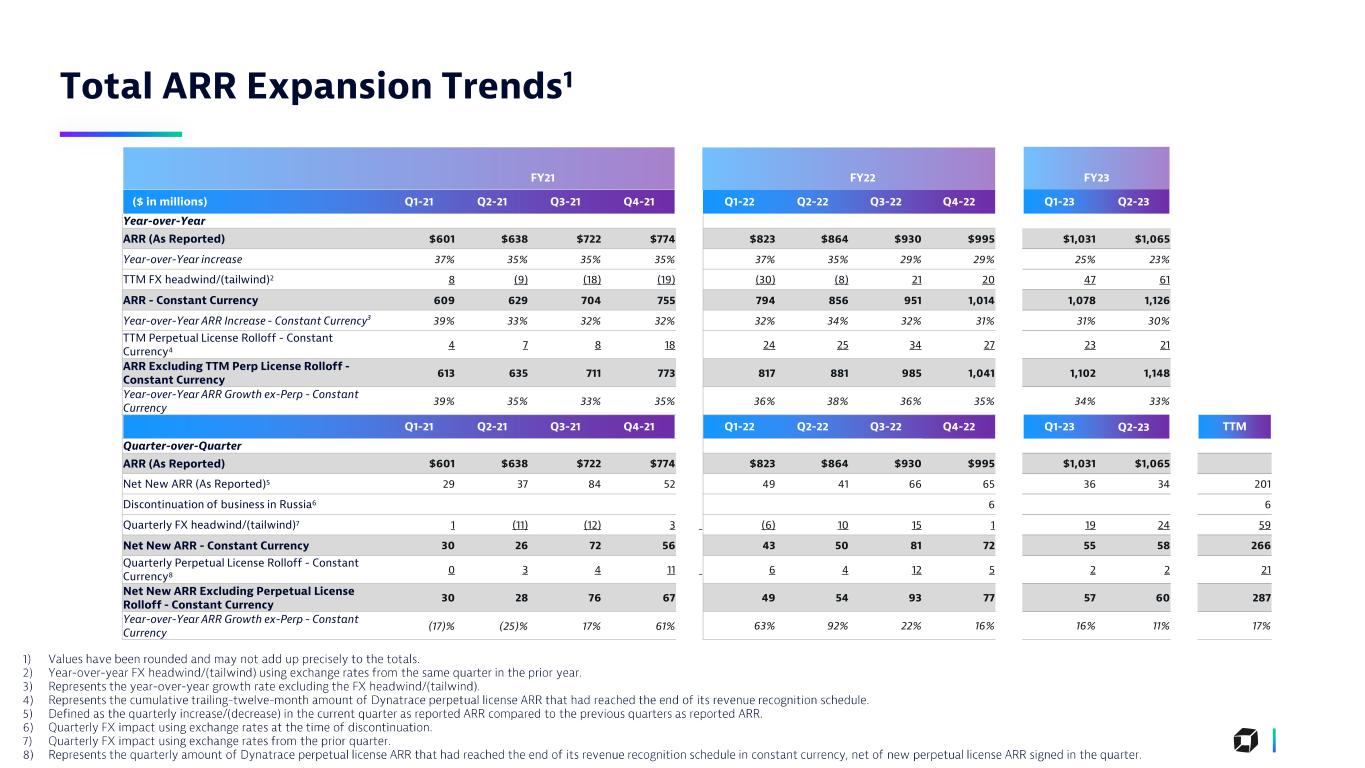
•Total ARR of $1,065 million, Adjusted ARR growth of 33% year-over-year
•Total Revenue of $279 million, up 30% on a constant currency basis
•Subscription Revenue of $261 million, up 29% on a constant currency basis
•Operating Income of $20 million and Non-GAAP Operating Income of $73 million
•EPS of $0.04 and Non-GAAP EPS of $0.22, both on a dilutive basis
Business Highlights:
•Platform Innovation: Launched our core Grail™ technology within the Dynatrace Platform, a major advancement in data analytics. It simplifies cloud complexity through unifying observability, as well as security, and business data to deliver answers and intelligent automation with the scale, speed, and cost-effectiveness demanded by modern digital transformation.
•Market Leadership: The 2022 ISG Provider Lens™ named Dynatrace a Leader with the top overall position in cloud-native observability and a Leader in cloud-native security. This recognition reflects our strong position as the trend of converging the observability and security markets continues.
•Go-to-market Success: Expanded partnership with DXC Technology, embedding Dynatrace as the preferred observability solution within DXC Platform X™, helping DXC customers to optimize and automate their clouds and digital services. Added 164 new logos to the Dynatrace® platform in the second quarter, up slightly from the second quarter of last fiscal year. Delivered a net expansion rate above 120% for the eighteenth consecutive quarter.
Second Quarter 2023 Financial Highlights
(Unaudited – In thousands, except per share data)
| | | | | | | | | | | | |
| Three Months Ended September 30, | |
| 2022 | | 2021 | |
| Key Operating Metric: | | | | |
| Annualized recurring revenue | $ | 1,064,951 | | | $ | 863,863 | | |
Year-over-Year Increase | 23 | % | | | |
| Year-over-Year Increase - constant currency | 30 | % | | | |
| Adjusted ARR Growth | 33 | % | | | |
| | | | |
| | | | |
| | | | |
| | | | |
| Revenue: | | | | |
| Total revenue | $ | 279,326 | | | $ | 226,354 | | |
Year-over-Year Increase | 23 | % | | | |
| | | | |
| | | | |
Year-over-Year Increase - constant currency (*) | 30 | % | | | |
| | | | |
| | | | |
| | | | |
| | | | |
| | | | |
| | | | |
| | | | |
Subscription revenue | $ | 261,306 | | | $ | 212,601 | | |
Year-over-Year Increase | 23 | % | | | |
| | | | |
| | | | |
Year-over-Year Increase - constant currency (*) | 29 | % | | | |
| | | | |
| Non-GAAP Financial Measures: | | | | |
Non-GAAP operating income (*) | $ | 72,888 | | | $ | 61,468 | | |
Non-GAAP operating margin (*) | 26 | % | | 27 | % | |
| | | | |
Non-GAAP net income (*) | $ | 64,454 | | | $ | 52,165 | | |
| | | | |
| | | | |
| Non-GAAP net income per share - diluted | $ | 0.22 | | | $ | 0.18 | | |
| | | | |
| | | | |
| Non-GAAP shares outstanding - diluted | 290,601 | | | 291,177 | | |
| | | | |
Free Cash Flow (*) | $ | 25,067 | | | $ | 13,638 | | |
* Use of Non-GAAP Financial Measures
In our earnings press releases, conference calls, slide presentations, and webcasts, we may use or discuss non-GAAP financial measures, as defined by Regulation G. The GAAP financial measure most directly comparable to each non-GAAP financial measure used or discussed, and a reconciliation of the differences between each non-GAAP financial measure and the comparable GAAP financial measure, are included in this press release after the consolidated financial statements. Our earnings press releases containing such non-GAAP reconciliations can be found in the Investors section of our website at https://ir.dynatrace.com.
Financial Outlook
Since March 31, 2022, Dynatrace has seen an incremental strengthening of the U.S. dollar resulting in a foreign exchange ("FX") headwind in fiscal 2023. Total FY23 FX impact on a constant currency basis is expected to be approximately $60 million on ARR, up from prior quarter expectations of approximately $40 million. Total FY23 FX impact is expected to be approximately $60 million on Revenue, up from prior quarter expectations of approximately $47 million.
Growth rates for Adjusted ARR, Total revenue, and Subscription revenue are presented in constant currency in the
table below to provide better visibility into the underlying growth of the business.
Based on information available, as of November 2, 2022, Dynatrace is issuing guidance for the third quarter and updating guidance for full year fiscal 2023 as follows:
| | | | | | | | | |
| (In millions, except per share data) | Q3 Fiscal 2023 Guidance | | | | |
| Total revenue | $283 - $286 | | | | |
| As reported | 18% - 19% | | | | |
| Constant currency | 24% - 25% | | | | |
| Subscription revenue | $266.5 - $268.5 | | | | |
| As reported | 18% - 19% | | | | |
| Constant currency | 24% - 25% | | | | |
| Non-GAAP operating income | $71.5 - $73.5 | | | | |
| Non-GAAP operating margin | 25.5% | | | | |
| Non-GAAP net income | $62 - $63.5 | | | | |
| Non-GAAP net income per diluted share | $0.21 - $0.22 | | | | |
| Diluted weighted average shares outstanding | 292 - 293 | | | | |
| | | | | | | | | | | | | | | | | |
| (In millions, except per share data) | Current Guidance Fiscal 2023 | | Prior Guidance Fiscal 2023 | | Guidance Change
at Midpoint* |
| Total ARR | $1,164 - $1,172 | | $1,213 - $1,226 | | $(52) |
| As reported | 17% - 18% | | 22% - 23% | | (500) bps |
| Constant currency | 23% - 24% | | 26% - 27% | | (300) bps |
| Adjusted ARR growth | 24% | | 27% - 28% | | (300) bps |
| Total revenue | $1,119 - $1,126 | | $1,125 - $1,136 | | $(8) |
| As reported | 20% - 21% | | 21% - 22% | | (100) bps |
| Constant currency | 27% | | 26% - 27% | | 50 bps |
| Subscription revenue | $1,047 - $1,052 | | $1,053 - $1,062 | | $(8) |
| As reported | 20% - 21% | | 21% - 22% | | (100) bps |
| Constant currency | 27% | | 26% - 27% | | 50 bps |
| Non-GAAP operating income | $273 - $279 | | $252 - $261 | | $20 |
| Non-GAAP operating margin | 24.5% | | 22.5% - 23% | | 175 bps |
| Non-GAAP net income | $237.5 - $242.5 | | $214.5 - $223 | | $21 |
| Non-GAAP net income per diluted share | $0.81 - $0.83 | | $0.73 - $0.76 | | $0.07 |
| Diluted weighted average shares outstanding | 292 - 293 | | 292 - 294 | | 0.5 |
| Free cash flow | $308 - $321 | | $310 - $325 | | $(3) |
| Free cash flow margin | 27.5% - 28.5% | | 27.5%- 28.5% | | 0 bps |
*Changes in our guidance for ARR and Revenue metrics are rounded to the nearest 50 bps
Our guidance is based on foreign exchange rates as of the end of September.
Reconciliation of non-GAAP operating income, non-GAAP net income, non-GAAP net income per diluted share and free cash flow guidance to the most directly comparable GAAP measures is not available without unreasonable efforts on a forward-looking basis due to the high variability, complexity and low visibility with respect to the charges excluded from these non-GAAP measures; in particular, the measures and effects of share-based compensation expense, employer taxes and tax deductions specific to equity compensation awards that are directly impacted by future hiring, turnover and retention needs, as well as unpredictable fluctuations in our stock price. We expect the variability of the above charges to have a significant, and potentially unpredictable, impact on our future GAAP financial results.
Conference Call and Webcast Information
Dynatrace will host a conference call and live webcast to discuss its results and business outlook for investors and analysts at 8:00 a.m. Eastern Time today, November 2, 2022. To access the conference call from the U.S. and Canada, dial (866) 405-1247, or internationally, dial (201) 689-8045 with conference ID# 13733395. The call will also be available live via webcast on the company’s website, ir.dynatrace.com.
An audio replay of the call will also be available until 11:59 p.m. Eastern Time on November 16, 2022, by dialing (877) 660-6853 from the U.S. or Canada, or for international callers by dialing (201) 612-7415 and entering conference ID# 13733395. In addition, an archived webcast will be available at ir.dynatrace.com.
The company has used, and intends to continue to use, the investor relations portion of its website as a means of disclosing material non-public information and for complying with disclosure obligations under Regulation FD.
Non-GAAP Financial Measures & Key Metrics
In addition to disclosing financial measures prepared in accordance with GAAP, this press release and the accompanying tables contain certain non-GAAP financial measures.
Non-GAAP financial measures do not have any standardized meaning and are therefore unlikely to be comparable to similarly titled measures presented by other companies. Dynatrace considers these non-GAAP financial measures to be important because they provide useful indicators of its performance and liquidity measures. These are key measures used by our management and board of directors to understand and evaluate our core operating performance and trends, to prepare and approve our annual budget and to develop short and long-term operational plans. In addition, investors often use similar measures to evaluate the performance of a company. Non-GAAP financial measures are presented for supplemental informational purposes only for understanding the company’s operating performance. The non-GAAP financial measures should not be considered a substitute for financial information presented in accordance with GAAP, and may be different from non-GAAP financial measures presented by other companies. The GAAP financial measure most directly comparable to each non-GAAP financial measure used or discussed, and a reconciliation of the differences between each non-GAAP financial measure and the comparable GAAP financial measure, are included in this press release after the consolidated financial statements.
Dynatrace presents constant currency amounts for Revenue and Annual Recurring Revenue to provide a framework for assessing how our underlying businesses performed excluding the effect of foreign currency rate fluctuations. To present this information, current and comparative prior period results for entities reporting in currencies other than United States dollars are converted into United States dollars using the average exchange rates from the comparative period rather than the actual exchange rates in effect during the respective periods. All growth comparisons relate to the corresponding period in the last fiscal year. Dynatrace provides this non-GAAP financial information to aid investors in better understanding our performance.
Annual Recurring Revenue “ARR” is defined as the daily revenue of all subscription agreements that are actively generating revenue as of the last day of the reporting period multiplied by 365. We exclude from our calculation of Total ARR any revenues derived from month-to-month agreements and/or product usage overage billings.
Adjusted ARR is defined as ARR excluding the impact of foreign exchange rate fluctuations that occurred over the trailing twelve month period. This calculation also excludes the headwind associated with the Dynatrace® perpetual license ARR that rolled off in the trailing twelve month period.
Adjusted ARR Growth is defined as year-over-year growth in Adjusted ARR divided by ARR as reported.
Dynatrace® Net Expansion Rate is defined as the Dynatrace® ARR at the end of a reporting period for the cohort of Dynatrace® accounts as of one year prior to the date of calculation, divided by the Dynatrace® ARR one year prior to the date of calculation for that same cohort. This calculation excludes the benefit of Dynatrace® ARR resulting from the conversion of Classic products to the Dynatrace® platform. Effective the first quarter of fiscal year 2023, we began to exclude the headwind associated with the Dynatrace perpetual license ARR given diminishing impact of perpetual license ARR. We believe that eliminating the perpetual license headwind will result in a Net Expansion Rate metric that better reflects Dynatrace’s ability to expand existing customer relationships. We present Dynatrace® net expansion rate on a constant currency basis to provide a framework for assessing how our business performed excluding the effects of foreign currency rate fluctuations.
Dynatrace customers are defined as accounts, as identified by a unique account identifier, that generate at least $10,000 of Dynatrace® ARR as of the reporting date. In infrequent cases, a single large organization may comprise multiple customer accounts when there are distinct divisions, departments or subsidiaries that operate and make purchasing decisions independently from the parent organization. In cases where multiple customer accounts exist under a single organization, each customer account is counted separately based on a mutually exclusive accounting of ARR.
Free Cash Flow is defined as net cash provided by (used in) operating activities less capital expenditures.
About Dynatrace
Dynatrace exists to make the world's software work perfectly. Our unified software intelligence platform combines broad and deep observability and continuous runtime application security with the most advanced AIOps to provide answers and intelligent automation from data at an enormous scale. This enables innovators to modernize and automate cloud operations, deliver software faster and more securely, and ensure flawless digital experiences. That is why the world's largest organizations trust Dynatrace® to accelerate digital transformation.
Cautionary Language Concerning Forward-Looking Statements
This press release includes certain “forward-looking statements” within the meaning of the Private Securities Litigation Reform Act of 1995, including statements regarding management’s expectations of future financial and operational performance and operational expenditures, expected growth, and business outlook, including our financial guidance for the third fiscal quarter and full year 2023, and statements regarding the size of our market and our positioning for capturing a larger share of our market. These forward-looking statements include, but are not limited to, plans, objectives, expectations and intentions and other statements contained in this press release that are not historical facts and statements identified by words such as “expects,” “anticipates,” “intends,” “plans,” “believes,” “seeks,” “estimates” or words of similar meaning. These forward-looking statements reflect our current views about our plans, intentions, expectations, strategies and prospects, which are based on the information currently available to us and on assumptions we have made. Although we believe that our plans, intentions, expectations, strategies and prospects as reflected in or suggested by those forward-looking statements are reasonable, we can give no assurance that the plans, intentions, expectations or strategies will be attained or achieved. Furthermore, actual results may differ materially from those described in the forward-looking statements and will be affected by a variety of risks and factors that are beyond our control including, without limitation, the effect of the COVID-19 pandemic on our business operations and demand for our products as well as its impact on general economic and financial market conditions, a potential downturn in or instability of general economic conditions including currency fluctuations, our ability to maintain our subscription revenue growth rates in future periods, our ability to service our indebtedness, market adoption of software intelligence solutions for application performance monitoring, digital experience monitoring, infrastructure monitoring, AIOps, business intelligence and analytics and application security, continued spending on and demand for software intelligence solutions, our ability to maintain and acquire new customers, our ability to differentiate our platform from competing products and technologies, our ability to successfully recruit and retain highly-qualified personnel, the price volatility of our common stock, and other risks set forth under the caption “Risk Factors” in our Form 10-K filed on May 26, 2022 and our other SEC filings. We assume no obligation to update any forward-looking statements contained in this document as a result of new information, future events or otherwise.
DYNATRACE, INC.
CONDENSED CONSOLIDATED STATEMENTS OF OPERATIONS
(Unaudited – In thousands, except per share data)
| | | | | | | | | | | | | | | | | | | | | | | |
| Three Months Ended
September 30, | | Six Months Ended September 30, |
| 2022 | | 2021 | | 2022 | | 2021 |
| Revenue: | | | | | | | |
| Subscription | $ | 261,306 | | | $ | 212,601 | | | $ | 510,864 | | | $ | 409,121 | |
| License | — | | | — | | | — | | | 50 | |
| Service | 18,020 | | | 13,753 | | | 35,735 | | | 26,923 | |
| Total revenue | 279,326 | | | 226,354 | | | 546,599 | | | 436,094 | |
| Cost of revenue: | | | | | | | |
| Cost of subscription | 35,764 | | | 27,135 | | | 68,502 | | | 52,117 | |
| Cost of service | 16,052 | | | 10,668 | | | 31,220 | | | 20,689 | |
| Amortization of acquired technology | 3,888 | | | 3,864 | | | 7,780 | | | 7,694 | |
| Total cost of revenue | 55,704 | | | 41,667 | | | 107,502 | | | 80,500 | |
| Gross profit | 223,622 | | | 184,687 | | | 439,097 | | | 355,594 | |
| | | | | | | |
| Operating expenses: | | | | | | | |
| Research and development | 51,907 | | | 37,908 | | | 100,389 | | | 72,633 | |
| Sales and marketing | 104,669 | | | 86,301 | | | 209,684 | | | 166,783 | |
| General and administrative | 40,074 | | | 31,689 | | | 76,395 | | | 58,611 | |
| Amortization of other intangibles | 6,573 | | | 7,539 | | | 13,146 | | | 15,079 | |
| Restructuring and other | — | | | (1) | | | (10) | | | 25 | |
| Total operating expenses | 203,223 | | | 163,436 | | | 399,604 | | | 313,131 | |
| Income from operations | 20,399 | | | 21,251 | | | 39,493 | | | 42,463 | |
| Interest expense, net | (513) | | | (2,651) | | | (2,688) | | | (5,508) | |
| Other (expense) income, net | (1,214) | | | (1,299) | | | (3,464) | | | 12 | |
| Income before income taxes | 18,672 | | | 17,301 | | | 33,341 | | | 36,967 | |
Income tax (expense) benefit | (8,146) | | | 6,340 | | | (20,701) | | | (32) | |
| Net income | $ | 10,526 | | | $ | 23,641 | | | $ | 12,640 | | | $ | 36,935 | |
| Net income per share: | | | | | | | |
| Basic | $ | 0.04 | | | $ | 0.08 | | | $ | 0.04 | | | $ | 0.13 | |
| Diluted | $ | 0.04 | | | $ | 0.08 | | | $ | 0.04 | | | $ | 0.13 | |
| Weighted average shares outstanding: | | | | | | | |
| Basic | 287,190 | | | 283,923 | | | 286,699 | | | 283,295 | |
| Diluted | 290,601 | | | 291,177 | | | 290,433 | | | 290,254 | |
UNAUDITED SHARE-BASED COMPENSATION
| | | | | | | | | | | | | | | | | | | | | | | |
| Three Months Ended
September 30, | | Six Months Ended September 30, |
| 2022 | | 2021 | | 2022 | | 2021 |
| Cost of revenue | $ | 5,235 | | | $ | 3,485 | | | $ | 9,125 | | | $ | 6,137 | |
| Research and development | 10,997 | | | 5,456 | | | 18,282 | | | 9,423 | |
| Sales and marketing | 13,938 | | | 9,612 | | | 24,014 | | | 17,220 | |
| General and administrative | 10,484 | | | 7,022 | | | 17,928 | | | 12,047 | |
| Total share-based compensation | $ | 40,654 | | | $ | 25,575 | | | $ | 69,349 | | | $ | 44,827 | |
DYNATRACE, INC.
CONDENSED CONSOLIDATED BALANCE SHEETS
(In thousands, except share data)
| | | | | | | | | | | |
| September 30, 2022 | | March 31, 2022 |
| (unaudited) | | |
| Assets | | | |
| Current assets: | | | |
| Cash and cash equivalents | $ | 563,430 | | | $ | 462,967 | |
| Accounts receivable, net | 185,728 | | | 350,666 | |
| Deferred commissions, current | 62,861 | | | 62,601 | |
| Prepaid expenses and other current assets | 39,259 | | | 72,188 | |
| Total current assets | 851,278 | | | 948,422 | |
| Property and equipment, net | 45,717 | | | 45,271 | |
| Operating lease right-of-use assets, net | 61,374 | | | 58,849 | |
| Goodwill | 1,279,535 | | | 1,281,876 | |
| Other intangible assets, net | 84,380 | | | 105,736 | |
| Deferred tax assets, net | 24,958 | | | 28,106 | |
| Deferred commissions, non-current | 60,292 | | | 63,435 | |
| Other assets | 14,451 | | | 9,615 | |
| Total assets | $ | 2,421,985 | | | $ | 2,541,310 | |
| | | |
| Liabilities and shareholders' equity | | | |
| Current liabilities: | | | |
| Accounts payable | $ | 4,587 | | | $ | 22,715 | |
| Accrued expenses, current | 129,976 | | | 141,556 | |
| | | |
| Deferred revenue, current | 561,474 | | | 688,554 | |
| Operating lease liabilities, current | 12,876 | | | 12,774 | |
| Total current liabilities | 708,913 | | | 865,599 | |
| Deferred revenue, non-current | 16,950 | | | 25,783 | |
| Accrued expenses, non-current | 25,243 | | | 19,409 | |
| Operating lease liabilities, non-current | 54,255 | | | 52,070 | |
| Deferred tax liabilities | — | | | 85 | |
| Long-term debt, net | 214,947 | | | 273,918 | |
| Total liabilities | 1,020,308 | | | 1,236,864 | |
| | | |
| Shareholders' equity: | | | |
Common shares, $0.001 par value, 600,000,000 shares authorized, 287,812,653 and 286,053,276 shares issued and outstanding at September 30, 2022 and March 31, 2022, respectively | 288 | | | 286 | |
| Additional paid-in capital | 1,874,488 | | | 1,792,197 | |
| Accumulated deficit | (448,708) | | | (461,348) | |
| Accumulated other comprehensive loss | (24,391) | | | (26,689) | |
| Total shareholders' equity | 1,401,677 | | | 1,304,446 | |
| Total liabilities and shareholders' equity | $ | 2,421,985 | | | $ | 2,541,310 | |
DYNATRACE, INC.
CONDENSED CONSOLIDATED STATEMENTS OF CASH FLOWS
(Unaudited – In thousands)
| | | | | | | | | | | |
| Six Months Ended
September 30, |
| 2022 | | 2021 |
| Cash flows from operating activities: | | | |
| Net income | $ | 12,640 | | | $ | 36,935 | |
Adjustments to reconcile net income to cash provided by operations: | | | |
Depreciation | 5,746 | | | 5,049 | |
Amortization | 21,068 | | | 23,057 | |
Share-based compensation | 69,349 | | | 44,827 | |
| | | |
Other | 4,484 | | | 1,010 | |
Net change in operating assets and liabilities: | | | |
Accounts receivable | 153,512 | | | 92,314 | |
Deferred commissions | (3,618) | | | (6,347) | |
Prepaid expenses and other assets | 25,128 | | | (16,456) | |
Accounts payable and accrued expenses | (14,428) | | | (9,118) | |
Operating leases, net | 44 | | | 401 | |
Deferred revenue | (101,429) | | | (69,904) | |
Net cash provided by operating activities | 172,496 | | | 101,768 | |
| | | |
| Cash flows from investing activities: | | | |
Purchase of property and equipment | (11,237) | | | (7,612) | |
| | | |
| Acquisition of businesses, net of cash acquired | — | | | (13,004) | |
Net cash used in investing activities | (11,237) | | | (20,616) | |
| | | |
| Cash flows from financing activities: | | | |
Repayment of term loans | (60,000) | | | (60,000) | |
Proceeds from employee stock purchase plan | 8,627 | | | 6,593 | |
| Proceeds from exercise of stock options | 4,332 | | | 18,339 | |
Equity repurchases | (15) | | | (30) | |
Net cash used in financing activities | (47,056) | | | (35,098) | |
| | | |
| Effect of exchange rates on cash and cash equivalents | (13,740) | | | (697) | |
| | | |
| Net increase in cash and cash equivalents | 100,463 | | | 45,357 | |
| | | |
| Cash and cash equivalents, beginning of period | 462,967 | | | 324,962 | |
| Cash and cash equivalents, end of period | $ | 563,430 | | | $ | 370,319 | |
| | | |
| | | |
| | | |
| | | |
DYNATRACE, INC.
GAAP to Non-GAAP Reconciliations
(Unaudited - In thousands, except percentages)
| | | | | | | | | | | | | | | | | | | | | | | | | | | | | | | | | | | |
| Three Months Ended September 30, 2022 |
| GAAP | | Share-based compensation | | Employer payroll taxes on employee stock transactions | | Amortization of other intangibles | | Restructuring & other | | Non-GAAP |
| Non-GAAP operating income: |
| | | | | | | | | | | |
| Cost of revenue | $ | 55,704 | | | $ | (5,235) | | | $ | (128) | | | $ | (3,888) | | | $ | (30) | | | $ | 46,423 | |
| Gross profit | 223,622 | | | 5,235 | | | 128 | | | 3,888 | | | 30 | | | 232,903 | |
| Gross margin | 80 | % | | | | | | | | | | 83 | % |
| Research and development | 51,907 | | | (10,997) | | | (381) | | | — | | | — | | | 40,529 | |
| Sales and marketing | 104,669 | | | (13,938) | | | (300) | | | — | | | — | | | 90,431 | |
| General and administrative | 40,074 | | | (10,484) | | | (231) | | | — | | | (304) | | | 29,055 | |
| Amortization of other intangibles | 6,573 | | | — | | | — | | | (6,573) | | | — | | | — | |
| Restructuring and other | — | | | — | | | — | | | — | | | — | | | — | |
| Operating income | $ | 20,399 | | | $ | 40,654 | | | $ | 1,040 | | | $ | 10,461 | | | $ | 334 | | | $ | 72,888 | |
| Operating margin | 7 | % | | | | | | | | | | 26 | % |
| | | | | | | | | | | | | | | | | | | | | | | | | | | | | | | | | | | |
| Three Months Ended September 30, 2021 |
| GAAP | | Share-based compensation | | Employer payroll taxes on employee stock transactions | | Amortization of other intangibles | | Restructuring & other | | Non-GAAP |
| Non-GAAP operating income: |
| | | | | | | | | | | |
| Cost of revenue | $ | 41,667 | | | $ | (3,485) | | | $ | (452) | | | $ | (3,864) | | | $ | — | | | $ | 33,866 | |
| Gross profit | 184,687 | | | 3,485 | | | 452 | | | 3,864 | | | — | | | 192,488 | |
| Gross margin | 82 | % | | | | | | | | | | 85 | % |
| Research and development | 37,908 | | | (5,456) | | | (501) | | | — | | | — | | | 31,951 | |
| Sales and marketing | 86,301 | | | (9,612) | | | (785) | | | — | | | — | | | 75,904 | |
| General and administrative | 31,689 | | | (7,022) | | | (253) | | | — | | | (1,249) | | | 23,165 | |
| Amortization of other intangibles | 7,539 | | | — | | | — | | | (7,539) | | | — | | | — | |
| Restructuring and other | (1) | | | — | | | — | | | — | | | 1 | | | — | |
| Operating income | $ | 21,251 | | | $ | 25,575 | | | $ | 1,991 | | | $ | 11,403 | | | $ | 1,248 | | | $ | 61,468 | |
| Operating margin | 9 | % | | | | | | | | | | 27 | % |
DYNATRACE, INC.
GAAP to Non-GAAP Reconciliations
(Unaudited - In thousands, except per share data)
| | | | | | | | | | | |
| Three Months Ended September 30, |
| 2022 | | 2021 |
| Non-GAAP net income: | | | |
| Net income | $ | 10,526 | | | $ | 23,641 | |
| Income tax expense (benefit) | 8,146 | | | (6,340) | |
| Non-GAAP effective cash tax | (7,967) | | | (7,113) | |
| Interest expense, net | 513 | | | 2,651 | |
| Cash paid for interest, net | (467) | | | (2,190) | |
| Share-based compensation | 40,654 | | | 25,575 | |
| Employer payroll taxes on employee stock transactions | 1,040 | | | 1,991 | |
| Amortization of other intangibles | 6,573 | | | 7,539 | |
| Amortization of acquired technology | 3,888 | | | 3,864 | |
| Transaction, restructuring, and other | 334 | | | 1,248 | |
| Loss on currency translation | 1,214 | | | 1,299 | |
| Non-GAAP net income | $ | 64,454 | | | $ | 52,165 | |
| | | |
| Share count: | | | |
| Weighted-average shares outstanding - basic | 287,190 | | | 283,923 | |
| Weighted-average shares outstanding - diluted | 290,601 | | | 291,177 | |
| | | |
| Shares used in non-GAAP per share calculations: | | | |
| Weighted-average shares outstanding - basic | 287,190 | | | 283,923 | |
| Weighted-average shares outstanding - diluted | 290,601 | | | 291,177 | |
| | | |
| Net income per share: | | | |
| Net income per share - basic | $ | 0.04 | | | $ | 0.08 | |
| Net income per share - diluted | $ | 0.04 | | | $ | 0.08 | |
| Non-GAAP net income per share - basic | $ | 0.22 | | | $ | 0.18 | |
| Non-GAAP net income per share - diluted | $ | 0.22 | | | $ | 0.18 | |
| | | | | | | | | | | |
| Three Months Ended September 30, |
| 2022 | | 2021 |
| Free Cash Flow ("FCF"): | | | |
| Net cash provided by operating activities | $ | 29,398 | | | $ | 18,296 | |
| Purchase of property and equipment | (4,331) | | | (4,658) | |
| FCF | $ | 25,067 | | | $ | 13,638 | |
DYNATRACE, INC.
GAAP to Non-GAAP Reconciliations
(Unaudited - In thousands, except percentages)
| | | | | | | | | | | | | | | | | | | | | | | | | | | | | | | | | | | | | |
| Six Months Ended September 30, 2022 |
| GAAP | | Share-based compensation | | Employer payroll taxes on employee stock transactions | | | | Amortization of other intangibles | | Restructuring & other | | Non-GAAP |
| Non-GAAP operating income: |
| | | | | | | | | | | | | |
| Cost of revenue | $ | 107,502 | | | $ | (9,125) | | | $ | (412) | | | | | $ | (7,780) | | | $ | (380) | | | $ | 89,805 | |
| Gross profit | 439,097 | | | 9,125 | | | 412 | | | | | 7,780 | | | 380 | | | 456,794 | |
| Gross margin | 80 | % | | | | | | | | | | | | 84 | % |
| Research and development | 100,389 | | | (18,282) | | | (930) | | | | | — | | | — | | | 81,177 | |
| Sales and marketing | 209,684 | | | (24,014) | | | (898) | | | | | — | | | — | | | 184,772 | |
| General and administrative | 76,395 | | | (17,928) | | | (442) | | | | | — | | | (383) | | | 57,642 | |
| Amortization of other intangibles | 13,146 | | | — | | | — | | | | | (13,146) | | | — | | | — | |
| Restructuring and other | (10) | | | — | | | — | | | | | — | | | 10 | | | — | |
| Operating income | $ | 39,493 | | | $ | 69,349 | | | $ | 2,682 | | | | | $ | 20,926 | | | $ | 753 | | | $ | 133,203 | |
| Operating margin | 7 | % | | | | | | | | | | | | 24 | % |
| | | | | | | | | | | | | | | | | | | | | | | | | | | | | | | | | | | | | |
| Six Months Ended September 30, 2021 |
| GAAP | | Share-based compensation | | Employer payroll taxes on employee stock transactions | | | | Amortization of other intangibles | | Restructuring & other | | Non-GAAP |
| Non-GAAP operating income: |
| | | | | | | | | | | | | |
| Cost of revenue | $ | 80,500 | | | $ | (6,137) | | | $ | (767) | | | | | $ | (7,694) | | | $ | — | | | $ | 65,902 | |
| Gross profit | 355,594 | | | 6,137 | | | 767 | | | | | 7,694 | | | — | | | 370,192 | |
| Gross margin | 82 | % | | | | | | | | | | | | 85 | % |
| Research and development | 72,633 | | | (9,423) | | | (1,127) | | | | | — | | | — | | | 62,083 | |
| Sales and marketing | 166,783 | | | (17,220) | | | (1,370) | | | | | — | | | — | | | 148,193 | |
| General and administrative | 58,611 | | | (12,047) | | | (454) | | | | | — | | | (1,202) | | | 44,908 | |
| Amortization of other intangibles | 15,079 | | | — | | | — | | | | | (15,079) | | | — | | | — | |
| Restructuring and other | 25 | | | — | | | — | | | | | — | | | (25) | | | — | |
| Operating income | $ | 42,463 | | | $ | 44,827 | | | $ | 3,718 | | | | | $ | 22,773 | | | $ | 1,227 | | | $ | 115,008 | |
| Operating margin | 10 | % | | | | | | | | | | | | 26 | % |
DYNATRACE, INC.
GAAP to Non-GAAP Reconciliations
(Unaudited - In thousands, except per share data)
| | | | | | | | | | | |
| Six Months Ended September 30, |
| 2022 | | 2021 |
| Non-GAAP net income: | | | |
| Net income | $ | 12,640 | | | $ | 36,935 | |
| Income tax expense | 20,701 | | | 32 | |
| Non-GAAP effective cash tax | (14,374) | | | (13,254) | |
| Interest expense, net | 2,688 | | | 5,508 | |
| Cash paid for interest, net | (2,533) | | | (4,560) | |
| Share-based compensation | 69,349 | | | 44,827 | |
| Employer payroll taxes on employee stock transactions | 2,682 | | | 3,718 | |
| Amortization of other intangibles | 13,146 | | | 15,079 | |
| Amortization of acquired technology | 7,780 | | | 7,694 | |
| Transaction, restructuring, and other | 753 | | | 1,227 | |
| | | |
| Loss (gain) on currency translation | 3,464 | | | (12) | |
| Non-GAAP net income | $ | 116,296 | | | $ | 97,194 | |
| | | |
| Share count: | | | |
| Weighted-average shares outstanding - basic | 286,699 | | | 283,295 | |
| Weighted-average shares outstanding - diluted | 290,433 | | | 290,254 | |
| | | |
| Shares used in non-GAAP per share calculations: | | | |
| Weighted-average shares outstanding - basic | 286,699 | | | 283,295 | |
| Weighted-average shares outstanding - diluted | 290,433 | | | 290,254 | |
| | | |
| Net income per share: | | | |
| Net income per share - basic | $ | 0.04 | | | $ | 0.13 | |
| Net income per share - diluted | $ | 0.04 | | | $ | 0.13 | |
| Non-GAAP net income per share - basic | $ | 0.41 | | | $ | 0.34 | |
| Non-GAAP net income per share - diluted | $ | 0.40 | | | $ | 0.33 | |
| | | | | | | | | | | |
| Six Months Ended September 30, |
| 2022 | | 2021 |
| Free Cash Flow ("FCF"): | | | |
Net cash provided by operating activities | $ | 172,496 | | | $ | 101,768 | |
| Purchase of property and equipment | (11,237) | | | (7,612) | |
| FCF | $ | 161,259 | | | $ | 94,156 | |
Contacts
Investor Contact:
Noelle Faris
VP, Investor Relations
Media Relations:
Jerome Stewart
VP, Communications