DT Midstream Reports Strong Second Quarter 2026 Results
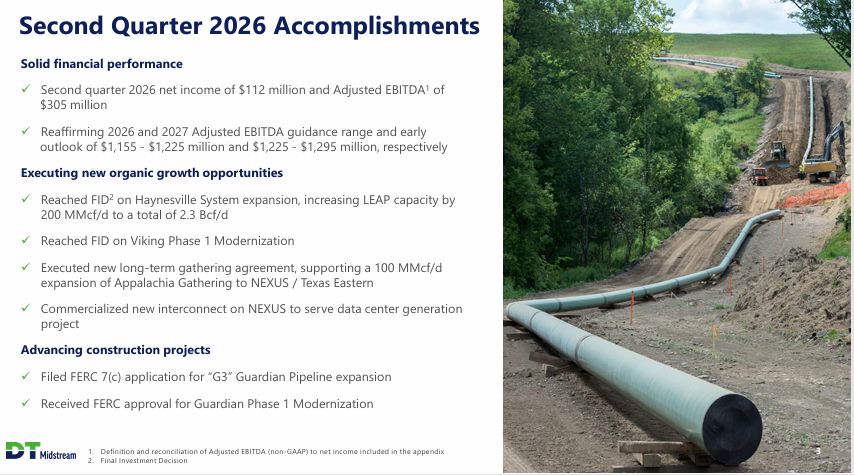
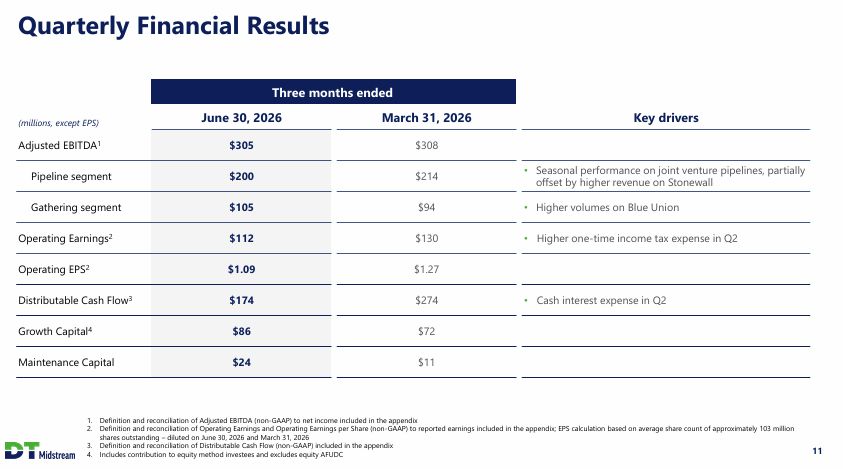
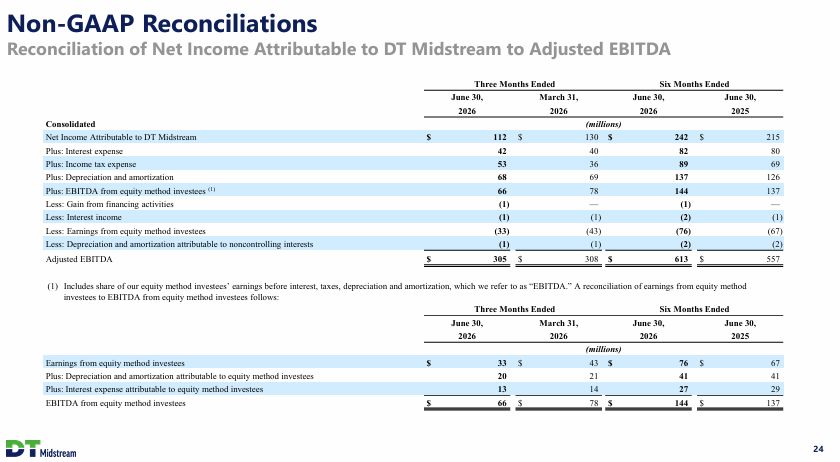
DETROIT, July 30, 2026 – DT Midstream, Inc. (NYSE: DTM) today announced second quarter 2026 reported net income of $112 million, or $1.09 per diluted share and Operating Earnings of $112 million, or $1.09 per
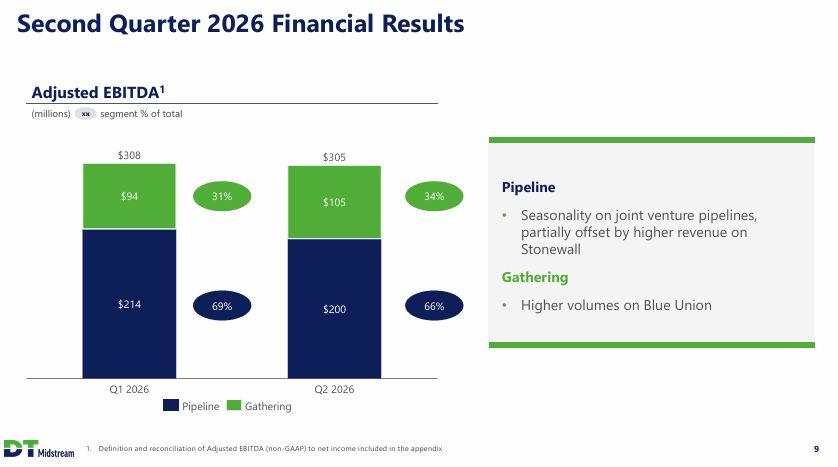
diluted share. Adjusted EBITDA for the quarter was $305 million.
Reconciliations of Operating Earnings and Adjusted EBITDA (non-GAAP measures) to reported net income are included at the end of this news release.
The company also announced that the DT Midstream Board of Directors declared a $0.88 per share dividend on its common stock payable October 15, 2026 to stockholders of
record at the close of business September 21, 2026.
“We delivered another strong quarter, with the business progressing in line with our full-year plan,” said David Slater, Executive Chairman and CEO. “We continue to advance
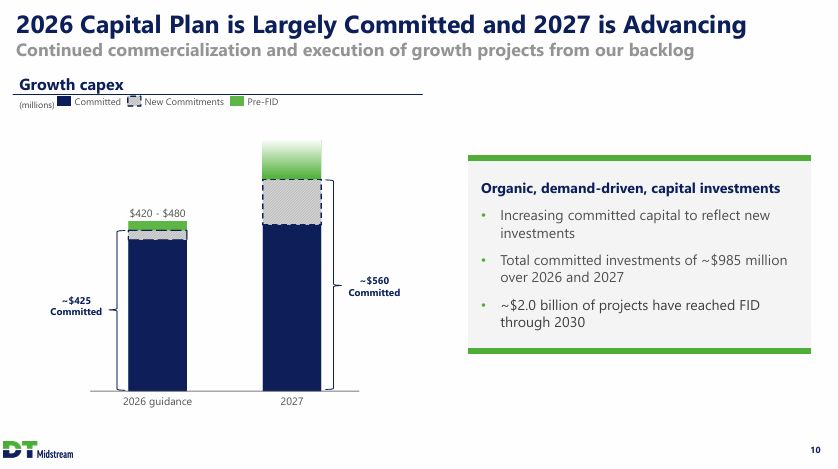
our organic growth backlog, with $2 billion of projects now commercialized.”
Slater noted the following significant business updates:
|
• |
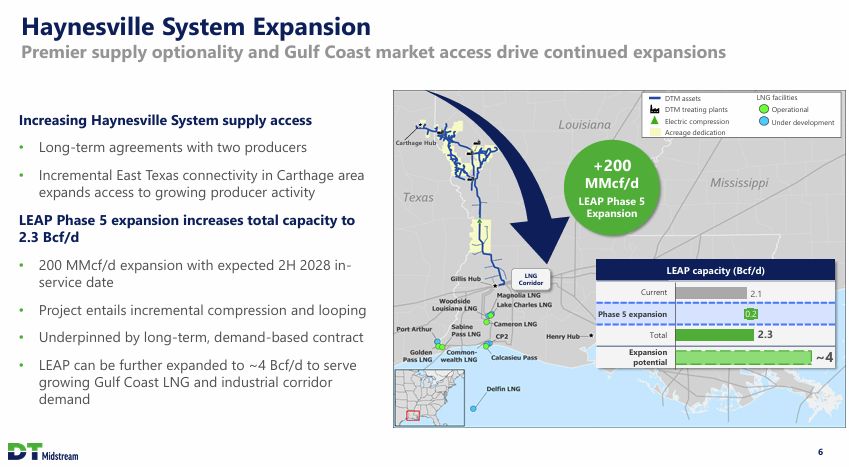
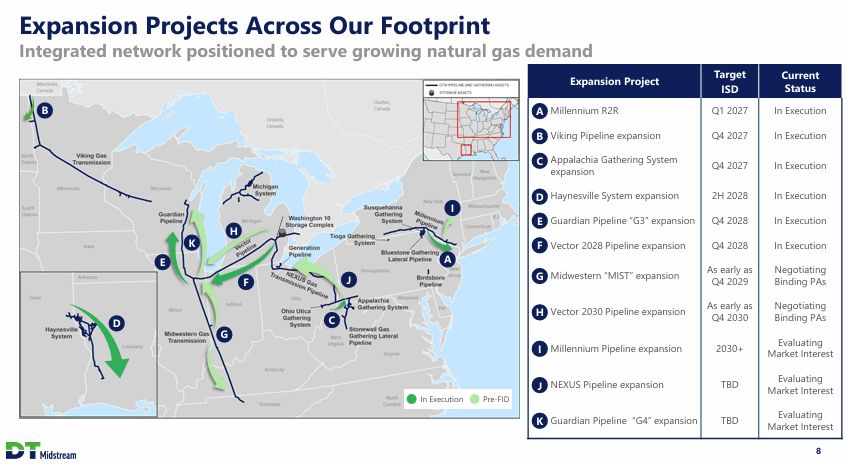
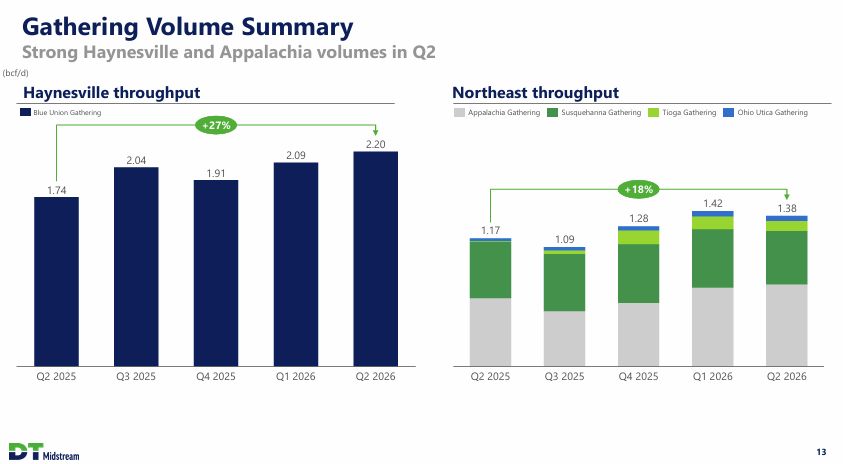
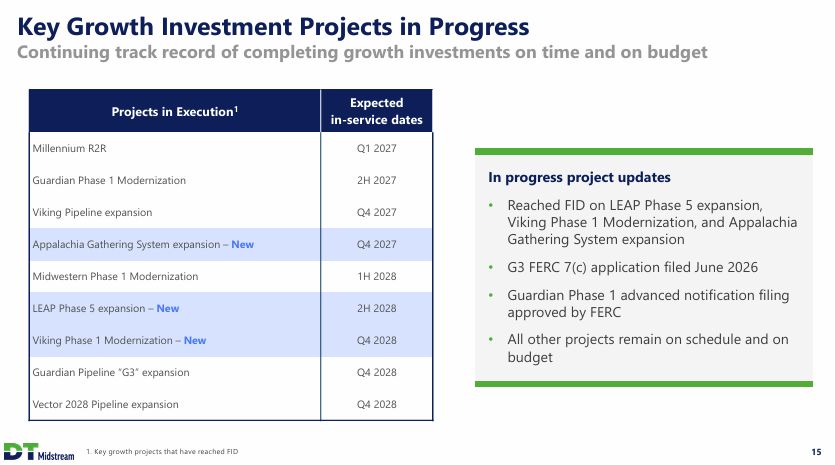
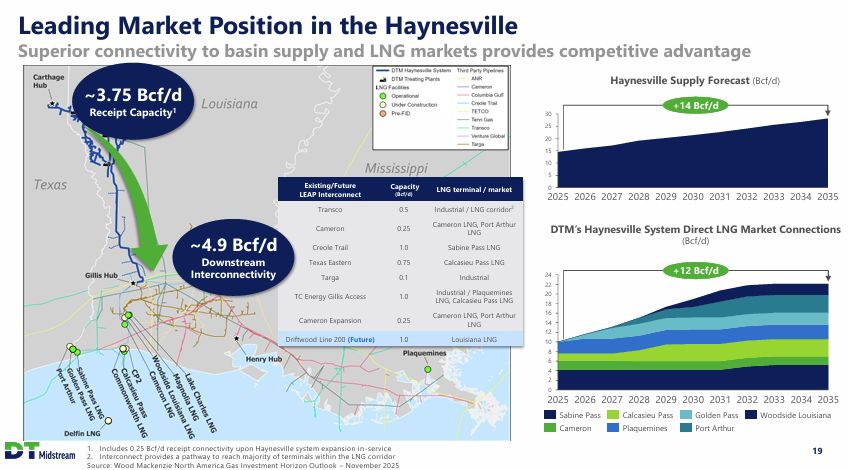
Executed new long-term contracts supporting a Haynesville system expansion, including Phase 5 of LEAP, which will add 200 MMcf/d of capacity
|
|
• |
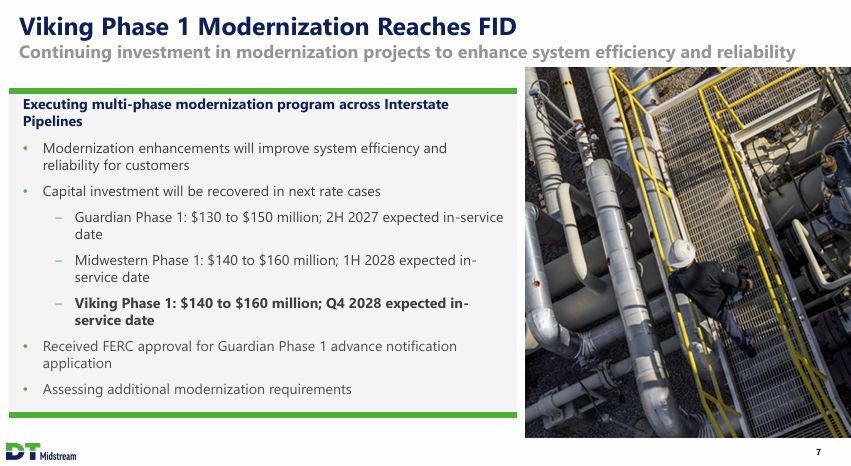
Reached a final investment decision on the first phase of Viking Gas Transmission modernization
|
|
• |
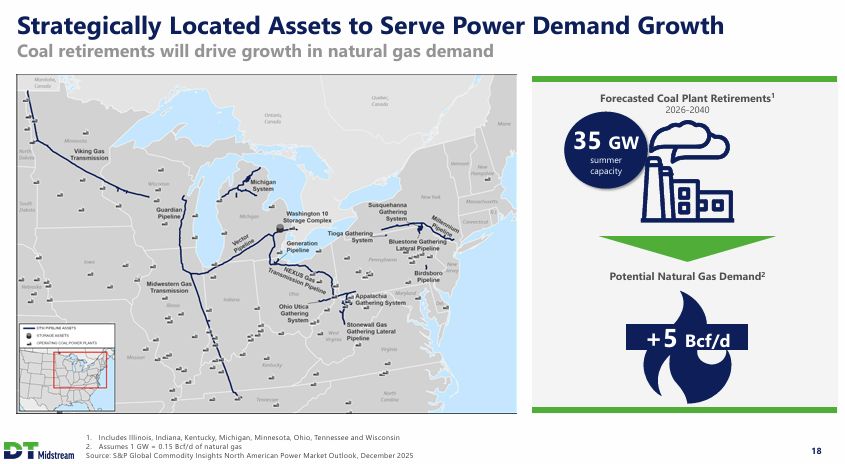
Filed the FERC 7(c) application for the Guardian Pipeline “G3” expansion project in late June
|
“Our second quarter performance keeps us firmly on track to meet our financial goals for 2026 and we are reaffirming our 2026 Adjusted EBITDA guidance of $1.155 to $1.225
billion and our 2027 Adjusted EBITDA early outlook range of $1.225 to $1.295 billion,” said Jeff Jewell, Executive Vice President and CFO.
The company has scheduled a conference call to discuss results for 9:00 a.m. ET (8:00 a.m. CT) today. Investors, the news media and the public may listen to a live
internet broadcast of the call at this link. The participant toll-free telephone dial-in number in the U.S. and Canada is 888.660.6232, and the toll number is 929.203.0890; the conference
ID is 1318681. International access numbers are available here. The webcast will be archived on the DT Midstream website at investor.dtmidstream.com.
# # #
About DT Midstream
DT Midstream (NYSE: DTM) is an owner, operator and developer of natural gas interstate and intrastate pipelines, storage and gathering systems, compression, treatment and
surface facilities. The company transports clean natural gas for utilities, power plants, marketers, large industrial customers and energy producers across the Southern, Northeastern and Midwestern United States and Canada. The Detroit-based company
offers a comprehensive, wellhead-to-market array of services, including natural gas transportation, storage and gathering. For more information, please visit the DT Midstream website at www.dtmidstream.com.
Why DT Midstream Uses Operating Earnings, Adjusted EBITDA and Distributable Cash Flow
Use of Operating Earnings Information – Operating Earnings exclude non-recurring items, certain mark-to-market adjustments and discontinued operations. DT Midstream
management believes that Operating Earnings provide a more meaningful representation of the company’s earnings from ongoing operations and uses Operating Earnings as the primary performance measurement for external communications with analysts and
investors. Internally, DT Midstream uses Operating Earnings to measure performance against budget and to report to the Board of Directors.
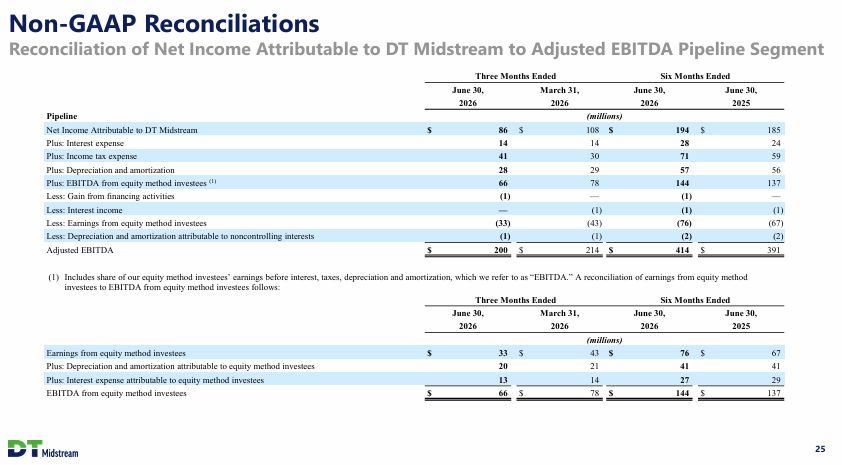
Adjusted EBITDA is defined as GAAP net income attributable to DT Midstream before expenses for interest, taxes, depreciation and amortization, and gains or losses from
financing activities, further adjusted to include the proportional share of net income from equity method investees (excluding interest, taxes, depreciation and amortization), and to exclude certain items the company considers non-routine. DT
Midstream believes Adjusted EBITDA is useful to the company and external users of DT Midstream’s financial statements in understanding operating results and the ongoing performance of the underlying business because it allows management and investors
to have a better understanding of actual operating performance unaffected by the impact of interest, taxes, depreciation, amortization and non-routine charges noted in the table below. We believe the presentation of Adjusted EBITDA is meaningful to
investors because it is frequently used by analysts, investors and other interested parties in the midstream industry to evaluate a company’s operating performance without regard to items excluded from the calculation of such measure, which can vary
substantially from company to company depending on accounting methods, book value of assets, capital structure and the method by which assets were acquired, among other factors. DT Midstream uses Adjusted EBITDA to assess the company’s performance by
reportable segment and as a basis for strategic planning and forecasting.
Distributable Cash Flow (DCF) is calculated by deducting earnings from equity method investees, depreciation and amortization attributable to noncontrolling interests, cash
interest expense, maintenance capital investment (as defined below), and cash taxes from, and adding interest expense, income tax expense, depreciation and amortization, and dividends and distributions from equity method investees to, Net Income
Attributable to DT Midstream, further adjusted for certain items we consider non-routine and other non-cash items. Maintenance capital investment is defined as the total capital expenditures used to maintain or preserve assets or fulfill contractual
obligations that do not generate incremental earnings. We believe DCF is a meaningful performance measurement because it is useful to us and external users of our financial statements in estimating the ability of our assets to generate cash earnings
after servicing our debt, paying cash taxes and making maintenance capital investments, which could be used for discretionary purposes such as common stock dividends, retirement of debt or expansion capital expenditures.
Adjusted EBITDA and DCF are not measures calculated in accordance with GAAP and should be viewed as a supplement to and not a substitute for the results of operations
presented in accordance with GAAP. There are significant limitations to using Adjusted EBITDA and DCF as a measure of performance, including the inability to analyze the effect of certain recurring and non-recurring items that materially affect our
net income or loss. Additionally, because Adjusted EBITDA and DCF exclude some, but not all, items that affect net income and are defined differently by different companies in our industry, Adjusted EBITDA and DCF do not intend to represent net
income attributable to DT Midstream, the most comparable GAAP measure, as an indicator of operating performance and are not necessarily comparable to similarly titled measures reported by other companies.
In this release, DT Midstream provides 2026 and 2027 Adjusted EBITDA guidance. The reconciliation
of net income to Adjusted EBITDA as projected for full-year 2026 and 2027 is not provided. DT Midstream does not forecast net income as it cannot, without unreasonable
efforts, estimate or predict with certainty the components of net income. These components, net of tax, may include, but are not limited to, impairments of assets and other charges, divestiture costs, acquisition costs, or changes in accounting
principles. All of these components could significantly impact such financial measures. At this time, DT Midstream is not able to estimate the aggregate impact, if any, of these items on future period reported earnings. Accordingly, DT Midstream is
not able to provide a corresponding GAAP equivalent for Adjusted EBITDA.
Forward-looking Statements
This release contains statements which, to the extent they are not statements of historical or present fact, constitute “forward-looking statements” under the securities
laws. These forward-looking statements are intended to provide management’s current expectations or plans for our future operating and financial performance, business prospects, outcomes of regulatory proceedings, market conditions, and other
matters, based on what we believe to be reasonable assumptions and on information currently available to us.
Forward-looking statements can be identified by the use of words such as “believe,” “expect,” “expectations,” “plans,” “strategy,” “prospects,” “estimate,” “project,”
“target,” “anticipate,” “will,” “would,” “could,” “should,” “see,” “guidance,” “outlook,” “confident,” “may,” “continue,” “intend,” “goal,” “potential,” and other words of similar meaning. The absence of such words, expressions or statements,
however, does not mean that the statements are not forward-looking. In particular, express or implied statements relating to future earnings, cash flow, results of operations, uses of cash, tax rates and other measures of financial performance,
future actions, conditions or events, potential future plans, strategies or transactions of DT Midstream, and other statements that are not historical facts, are forward-looking statements.
Forward-looking statements are not guarantees of future results and conditions, but rather are subject to numerous assumptions, risks, and uncertainties that may cause
actual future results to be materially different from those contemplated, projected, estimated, or budgeted. Many factors may impact forward-looking statements of DT Midstream including, but not limited to, the following: changes in general economic
conditions, including increases in interest rates and associated Federal Reserve policies, a potential economic recession, and the impact of inflation on our business; industry changes, including the impact of consolidations, alternative energy
sources, technological advances, infrastructure constraints and changes in competition; changes in global trade policies and tariffs; global and domestic supply chain disruptions; actions taken by third-party operators, producers, processors,
transporters and gatherers; changes in expected production from Expand Energy and other third parties in our areas of operation; demand for natural gas gathering, transmission, storage, transportation, sand mining, and water services; the
availability and price of natural gas to the consumer compared to the price of alternative and competing fuels; our ability to successfully and timely implement our business plan; our ability to complete organic growth projects on time and on budget;
our ability to finance, complete, or successfully integrate acquisitions; our ability to realize the anticipated benefits from acquisitions and our ability to manage the risks associated with acquisition activity; the price and availability of debt
and equity financing; restrictions in our existing and any future credit facilities and indentures; the effectiveness of our information technology and operational technology systems and practices to detect and defend against evolving cyber attacks
on United States critical infrastructure; changing laws regarding cybersecurity and data privacy, and any cybersecurity threat or event; operating hazards, environmental risks, and other risks incidental to gathering, storing and transporting natural
gas; geologic and reservoir risks and considerations; natural disasters, adverse weather conditions, casualty losses and other matters beyond our control; the impact of outbreaks of illnesses, epidemics and pandemics, and any related economic
effects; the impacts of geopolitical events, including the conflicts in Ukraine and the Middle East; labor relations and markets, including the ability to attract, hire and retain key employee and contract personnel; large customer defaults; changes
in tax status, as well as changes in tax rates and regulations; the effects and associated cost of compliance with existing and future laws and governmental regulations, such as the Inflation Reduction Act and the One Big Beautiful Bill Act; changes
in environmental laws, regulations or enforcement policies, including laws and regulations relating to pipeline safety, climate change and greenhouse gas emissions; changes in laws and regulations or enforcement policies, including those relating to
construction and operation of new interstate gas pipelines, ratemaking to which our pipelines may be subject, or other non-environmental laws and regulations; our ability to qualify for federal income tax credits; our ability to develop low carbon
business opportunities and deploy greenhouse gas reducing technologies; changes in insurance markets impacting costs and the level and types of coverage available; the timing and extent of changes in commodity prices; the success of our risk
management strategies; the suspension, reduction or termination of our customers’ obligations under our commercial agreements; disruptions due to equipment interruption or failure at our facilities, or third-party facilities on which our business is
dependent; the effects of future litigation; and the risks described in our Annual Report on Form 10-K for the year ended December 31, 2025 and our reports and registration statements filed from time to time with the SEC.
The above list of factors is not exhaustive. New factors emerge from time to time. We cannot predict what factors may arise or how such factors may cause actual results to
vary materially from those stated in forward-looking statements, see the discussion under the section entitled “Risk Factors” in our Annual Report for the year ended December 31, 2025, filed with the SEC on Form 10-K and any other reports filed with
the SEC. Given the uncertainties and risk factors that could cause our actual results to differ materially from those contained in any forward-looking statement, you should not place undue reliance on any forward-looking statements.
Any forward-looking statements speak only as of the date on which such statements are made. We are under no obligation to, and expressly disclaim any obligation to, update
or alter our forward-looking statements, whether as a result of new information, subsequent events or otherwise.
Investor Relations
Todd Lohrmann, DT Midstream, 313.774.2424
DT Midstream, Inc.
Reconciliation of Reported to Operating Earnings (non-GAAP, unaudited)
| |
|
Three Months Ended
|
|
| |
|
June 30,
|
|
|
March 31,
|
|
| |
|
2026
|
|
|
2026
|
|
| |
|
Reported
Earnings
|
|
|
Pre-tax Adjustments
|
|
|
Income
Taxes (1)
|
|
|
Operating Earnings
|
|
|
Reported
Earnings
|
|
|
Pre-tax Adjustments
|
|
|
Income
Taxes (1)
|
|
|
Operating Earnings
|
|
| |
|
(millions)
|
|
|
Adjustments
|
|
|
|
|
$
|
—
|
|
|
$
|
—
|
|
|
|
|
|
|
|
|
$
|
—
|
|
|
$
|
—
|
|
|
|
|
|
Net Income Attributable to DT Midstream
|
|
$
|
112
|
|
|
$
|
—
|
|
|
$
|
—
|
|
|
$
|
112
|
|
|
$
|
130
|
|
|
$
|
—
|
|
|
$
|
—
|
|
|
$
|
130
|
|
| |
|
Six Months Ended
|
|
| |
|
June 30,
|
|
|
June 30,
|
|
| |
|
2026 |
|
|
2025 |
|
| |
|
Reported
Earnings
|
|
|
Pre-tax Adjustments
|
|
|
Income
Taxes (1)
|
|
|
Operating Earnings
|
|
|
Reported
Earnings
|
|
|
Pre-tax Adjustments
|
|
|
Income
Taxes (1)
|
|
|
Operating Earnings
|
|
| |
|
(millions)
|
|
|
Adjustments
|
|
|
|
|
|
$
|
—
|
|
|
$
|
—
|
|
|
|
|
|
|
|
|
|
|
|
—
|
|
|
|
—
|
|
|
|
|
|
|
Net Income Attributable to DT Midstream
|
|
$
|
242
|
|
|
$
|
—
|
|
|
$
|
—
|
|
|
$
|
242
|
|
|
$
|
215
|
|
|
$
|
—
|
|
|
$
|
—
|
|
|
$
|
215
|
|
| |
(1) |
Excluding tax related adjustments, the amount of income taxes was calculated based on a combined federal and state income tax rate, considering the applicable jurisdictions of the respective segments
and deductibility of specific operating adjustments
|
DT Midstream, Inc.
Reconciliation of Reported to Operating Earnings per diluted share (1) (non-GAAP, unaudited)
| |
|
Three Months Ended
|
|
| |
|
June 30,
|
|
|
March 31,
|
|
| |
|
2026
|
|
|
2026
|
|
| |
|
Reported
Earnings
|
|
|
Pre-tax Adjustments
|
|
|
Income
Taxes (2)
|
|
|
Operating Earnings
|
|
|
Reported
Earnings
|
|
|
Pre-tax Adjustments
|
|
|
Income
Taxes (2)
|
|
|
Operating Earnings
|
|
| |
|
(per share)
|
|
|
Adjustments
|
|
|
|
|
$
|
—
|
|
|
$
|
—
|
|
|
|
|
|
|
|
|
$
|
—
|
|
|
$
|
—
|
|
|
|
|
|
Net Income Attributable to DT Midstream
|
|
$
|
1.09
|
|
|
$
|
—
|
|
|
$
|
—
|
|
|
$
|
1.09
|
|
|
$
|
1.27
|
|
|
$
|
—
|
|
|
$
|
—
|
|
|
$
|
1.27
|
|
| |
|
Six Months Ended
|
|
| |
|
June 30,
|
|
|
June 30,
|
|
| |
|
2026 |
|
|
2025 |
|
| |
|
Reported
Earnings
|
|
|
Pre-tax Adjustments
|
|
|
Income
Taxes (2)
|
|
|
Operating Earnings
|
|
|
Reported
Earnings
|
|
|
Pre-tax Adjustments
|
|
|
Income
Taxes (2)
|
|
|
Operating Earnings
|
|
| |
|
(per share)
|
|
|
Adjustments
|
|
|
|
|
|
$
|
—
|
|
|
$
|
—
|
|
|
|
|
|
|
|
|
|
|
$
|
—
|
|
|
$
|
—
|
|
|
|
|
|
|
Net Income Attributable to DT Midstream
|
|
$
|
2.36
|
|
|
$
|
—
|
|
|
$
|
—
|
|
|
$
|
2.36
|
|
|
$
|
2.10
|
|
|
$
|
—
|
|
|
$
|
—
|
|
|
$
|
2.10
|
|
|
(1) |
Per share amounts are divided by Weighted Average Common Shares Outstanding — Diluted, as noted on the Consolidated Statements of Operations
|
|
(2) |
Excluding tax related adjustments, the amount of income taxes was calculated based on a combined federal and state income tax rate, considering the applicable jurisdictions of the respective segments
and deductibility of specific operating adjustments
|
DT Midstream, Inc.
Reconciliation of Net Income Attributable to DT Midstream to Adjusted EBITDA (non-GAAP, unaudited)
| |
|
Three Months Ended
|
|
|
Six Months Ended
|
|
| |
|
June 30,
|
|
|
March 31,
|
|
|
June 30,
|
|
|
June 30,
|
|
| |
|
2026
|
|
|
2026
|
|
|
2026
|
|
|
2025
|
|
|
Consolidated
|
|
(millions)
|
|
|
Net Income Attributable to DT Midstream
|
|
$
|
112
|
|
|
$
|
130
|
|
|
$
|
242
|
|
|
$
|
215
|
|
|
Plus: Interest expense
|
|
|
42
|
|
|
|
40
|
|
|
|
82
|
|
|
|
80
|
|
|
Plus: Income tax expense
|
|
|
53
|
|
|
|
36
|
|
|
|
89
|
|
|
|
69
|
|
|
Plus: Depreciation and amortization
|
|
|
68
|
|
|
|
69
|
|
|
|
137
|
|
|
|
126
|
|
|
Plus: EBITDA from equity method investees (1)
|
|
|
66
|
|
|
|
78
|
|
|
|
144
|
|
|
|
137
|
|
|
Less: Gain from financing activities
|
|
|
(1
|
)
|
|
|
—
|
|
|
|
(1
|
)
|
|
|
—
|
|
|
Less: Interest income
|
|
|
(1
|
)
|
|
|
(1
|
)
|
|
|
(2
|
)
|
|
|
(1
|
)
|
|
Less: Earnings from equity method investees
|
|
|
(33
|
)
|
|
|
(43
|
)
|
|
|
(76
|
)
|
|
|
(67
|
)
|
|
Less: Depreciation and amortization attributable to noncontrolling interests
|
|
|
(1
|
)
|
|
|
(1
|
)
|
|
|
(2
|
)
|
|
|
(2
|
)
|
|
Adjusted EBITDA
|
|
$
|
305
|
|
|
$
|
308
|
|
|
$
|
613
|
|
|
$
|
557
|
|
|
(1) |
Includes share of our equity method investees’ earnings before interest, taxes, depreciation and amortization, which we refer to as “EBITDA.” A reconciliation of earnings from equity method investees
to EBITDA from equity method investees follows:
|
| |
|
Three Months Ended
|
|
|
Six Months Ended
|
|
| |
|
June 30,
|
|
|
March 31,
|
|
|
June 30,
|
|
|
June 30,
|
|
| |
|
2026
|
|
|
2026
|
|
|
2026
|
|
|
2025
|
|
| |
|
(millions)
|
|
|
Earnings from equity method investees
|
|
$
|
33
|
|
|
$
|
43
|
|
|
$
|
76
|
|
|
$
|
67
|
|
|
Plus: Depreciation and amortization attributable to equity method investees
|
|
|
20
|
|
|
|
21
|
|
|
|
41
|
|
|
|
41
|
|
|
Plus: Interest expense attributable to equity method investees
|
|
|
13
|
|
|
|
14
|
|
|
|
27
|
|
|
|
29
|
|
|
EBITDA from equity method investees
|
|
$
|
66
|
|
|
$
|
78
|
|
|
$
|
144
|
|
|
$
|
137
|
|
DT Midstream, Inc.
Reconciliation of Net Income Attributable to DT Midstream to Adjusted EBITDA
Pipeline Segment (non-GAAP, unaudited)
| |
|
Three Months Ended
|
|
|
Six Months Ended
|
|
| |
|
June 30,
|
|
|
March 31,
|
|
|
June 30,
|
|
|
June 30,
|
|
| |
|
2026
|
|
|
2026
|
|
|
2026
|
|
|
2025
|
|
|
Pipeline
|
|
(millions)
|
|
|
Net Income Attributable to DT Midstream
|
|
$
|
86
|
|
|
$
|
108
|
|
|
$
|
194
|
|
|
$
|
185
|
|
|
Plus: Interest expense
|
|
|
14
|
|
|
|
14
|
|
|
|
28
|
|
|
|
24
|
|
|
Plus: Income tax expense
|
|
|
41
|
|
|
|
30
|
|
|
|
71
|
|
|
|
59
|
|
|
Plus: Depreciation and amortization
|
|
|
28
|
|
|
|
29
|
|
|
|
57
|
|
|
|
56
|
|
|
Plus: EBITDA from equity method investees (1)
|
|
|
66
|
|
|
|
78
|
|
|
|
144
|
|
|
|
137
|
|
|
Less: Gain from financing activities
|
|
|
(1
|
)
|
|
|
—
|
|
|
|
(1
|
)
|
|
|
—
|
|
|
Less: Interest income
|
|
|
—
|
|
|
|
(1
|
)
|
|
|
(1
|
)
|
|
|
(1
|
)
|
|
Less: Earnings from equity method investees
|
|
|
(33
|
)
|
|
|
(43
|
)
|
|
|
(76
|
)
|
|
|
(67
|
)
|
|
Less: Depreciation and amortization attributable to noncontrolling interests
|
|
|
(1
|
)
|
|
|
(1
|
)
|
|
|
(2
|
)
|
|
|
(2
|
)
|
|
Adjusted EBITDA
|
|
$
|
200
|
|
|
$
|
214
|
|
|
$
|
414
|
|
|
$
|
391
|
|
|
(1) |
Includes share of our equity method investees’ earnings before interest, taxes, depreciation and amortization, which we refer to as “EBITDA.” A reconciliation of earnings from equity method investees
to EBITDA from equity method investees follows:
|
| |
|
Three Months Ended
|
|
|
Six Months Ended
|
|
| |
|
June 30,
|
|
|
March 31,
|
|
|
June 30,
|
|
|
June 30,
|
|
| |
|
2026
|
|
|
2026
|
|
|
2026
|
|
|
2025
|
|
| |
|
(millions)
|
|
|
Earnings from equity method investees
|
|
$
|
33
|
|
|
$
|
43
|
|
|
$
|
76
|
|
|
$
|
67
|
|
|
Plus: Depreciation and amortization attributable to equity method investees
|
|
|
20
|
|
|
|
21
|
|
|
|
41
|
|
|
|
41
|
|
|
Plus: Interest expense attributable to equity method investees
|
|
|
13
|
|
|
|
14
|
|
|
|
27
|
|
|
|
29
|
|
|
EBITDA from equity method investees
|
|
$
|
66
|
|
|
$
|
78
|
|
|
$
|
144
|
|
|
$
|
137
|
|
DT Midstream, Inc.
Reconciliation of Net Income Attributable to DT Midstream to Adjusted EBITDA
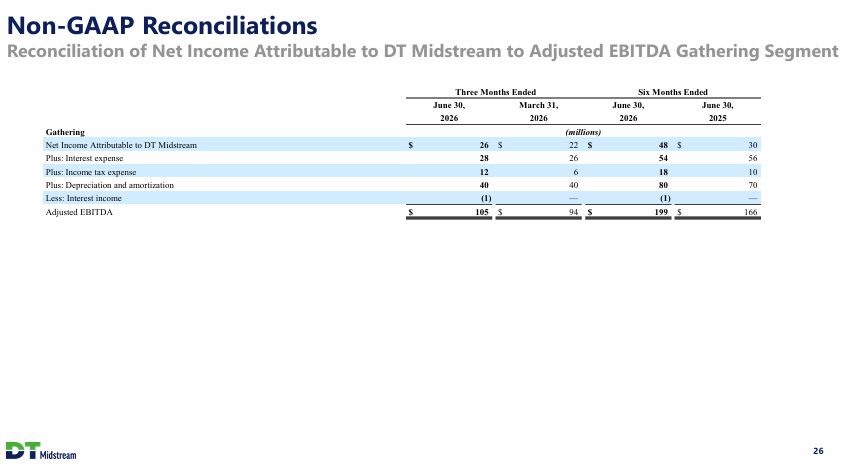
Gathering Segment (non-GAAP, unaudited)
|
|
|
Three Months Ended
|
|
|
Six Months Ended
|
|
|
|
|
June 30,
|
|
|
March 31,
|
|
|
June 30,
|
|
|
June 30,
|
|
|
|
|
2026
|
|
|
2026
|
|
|
2026
|
|
|
2025
|
|
|
Gathering
|
|
(millions)
|
|
|
Net Income Attributable to DT Midstream
|
|
$
|
26
|
|
|
$
|
22
|
|
|
$
|
48
|
|
|
$
|
30
|
|
|
Plus: Interest expense
|
|
|
28
|
|
|
|
26
|
|
|
|
54
|
|
|
|
56
|
|
|
Plus: Income tax expense
|
|
|
12
|
|
|
|
6
|
|
|
|
18
|
|
|
|
10
|
|
|
Plus: Depreciation and amortization
|
|
|
40
|
|
|
|
40
|
|
|
|
80
|
|
|
|
70
|
|
|
Less: Interest income
|
|
|
(1
|
)
|
|
|
—
|
|
|
|
(1
|
)
|
|
|
—
|
|
|
Adjusted EBITDA
|
|
$
|
105
|
|
|
$
|
94
|
|
|
$
|
199
|
|
|
$
|
166
|
|
DT Midstream, Inc.
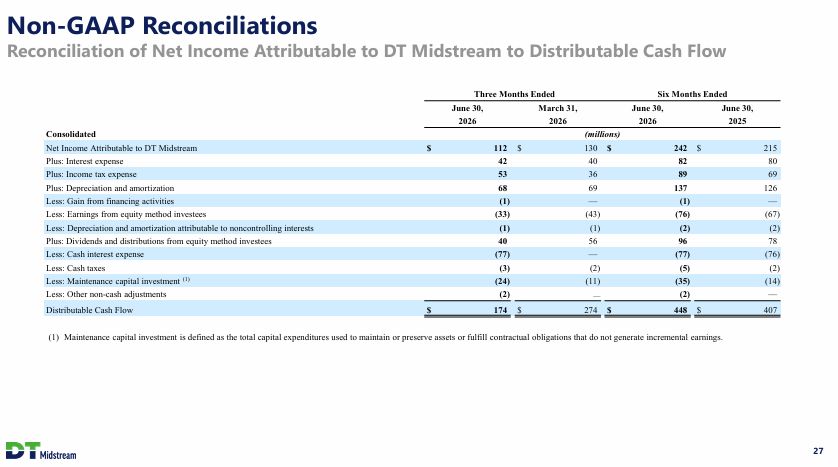
Reconciliation of Net Income Attributable to DT Midstream to Distributable Cash Flow (non-GAAP, unaudited)
|
|
|
Three Months Ended
|
|
|
Six Months Ended
|
|
|
|
|
June 30,
|
|
|
March 31,
|
|
|
June 30,
|
|
|
June 30,
|
|
|
|
|
2026
|
|
|
2026
|
|
|
2026
|
|
|
2025
|
|
|
Consolidated
|
|
(millions)
|
|
|
Net Income Attributable to DT Midstream
|
|
$
|
112
|
|
|
$
|
130
|
|
|
$
|
242
|
|
|
$
|
215
|
|
|
Plus: Interest expense
|
|
|
42
|
|
|
|
40
|
|
|
|
82
|
|
|
|
80
|
|
|
Plus: Income tax expense
|
|
|
53
|
|
|
|
36
|
|
|
|
89
|
|
|
|
69
|
|
|
Plus: Depreciation and amortization
|
|
|
68
|
|
|
|
69
|
|
|
|
137
|
|
|
|
126
|
|
|
Less: Gain from financing activities
|
|
|
(1
|
)
|
|
|
—
|
|
|
|
(1
|
)
|
|
|
—
|
|
|
Less: Earnings from equity method investees
|
|
|
(33
|
)
|
|
|
(43
|
)
|
|
|
(76
|
)
|
|
|
(67
|
)
|
|
Less: Depreciation and amortization attributable to noncontrolling interests
|
|
|
(1
|
)
|
|
|
(1
|
)
|
|
|
(2
|
)
|
|
|
(2
|
)
|
|
Plus: Dividends and distributions from equity method investees
|
|
|
40
|
|
|
|
56
|
|
|
|
96
|
|
|
|
78
|
|
|
Less: Cash interest expense
|
|
|
(77
|
)
|
|
|
—
|
|
|
|
(77
|
)
|
|
|
(76
|
)
|
|
Less: Cash taxes
|
|
|
(3
|
)
|
|
|
(2
|
)
|
|
|
(5
|
)
|
|
|
(2
|
)
|
|
Less: Maintenance capital investment (1)
|
|
|
(24
|
)
|
|
|
(11
|
)
|
|
|
(35
|
)
|
|
|
(14
|
)
|
|
Less: Other non-cash adjustments
|
|
|
(2
|
)
|
|
|
—
|
|
|
|
(2
|
)
|
|
|
—
|
|
|
Distributable Cash Flow
|
|
$
|
174
|
|
|
$
|
274
|
|
|
$
|
448
|
|
|
$
|
407
|
|
|
(1) |
Maintenance capital investment is defined as the total capital expenditures used to maintain or preserve assets or fulfill contractual obligations that do not generate incremental earnings.
|
# # #