8-K
DEVON ENERGY CORP/DE DE OK false 0001090012 0001090012 2020-02-18 2020-02-18


UNITED STATES

SECURITIES AND EXCHANGE COMMISSION

WASHINGTON, D.C. 20549


FORM 8-K


CURRENT REPORT

Pursuant to Section 13 or 15(d)

of The Securities Exchange Act of 1934

Date of Report (Date of earliest event reported): February 18, 2020


Devon Energy Corporation

(Exact name of registrant as specified in its charter)


DELAWARE


001-32318


73-1567067

(State or other jurisdiction

of incorporation)


(Commission

File Number)


(IRS Employer

Identification No.)

333 W. SHERIDAN AVE.,

OKLAHOMA CITY, OKLAHOMA


73102-5015

(Address of principal executive offices)


(Zip Code)

Registrant’s telephone number, including area code: (405) 235-3611

Not Applicable

(Former name or former address, if changed since last report)


Check the appropriate box below if the Form 8-K filing is intended to simultaneously satisfy the filing obligation of the registrant under any of the following provisions:

Written communications pursuant to Rule 425 under the Securities Act (17 CFR 230.425)

Soliciting material pursuant to Rule 14a-12 under the Exchange Act (17 CFR 240.14a-12)

Pre-commencement communications pursuant to Rule 14d-2(b) under the Exchange Act (17 CFR 240.14d-2(b))

Pre-commencement communications pursuant to Rule 13e-4(c) under the Exchange Act (17 CFR 240.13e-4(c))

Securities registered pursuant to Section 12(b) of the Act:

Title of each class


Trading

Symbol(s)


Name of each exchange

on which registered

Common Stock, par value $0.10 per share


DVN


The New York Stock Exchange

Indicate by check mark whether the registrant is an emerging growth company as defined in Rule 405 of the Securities Act of 1933 (§ 230.405 of this chapter) or Rule 12b-2 of the Securities Exchange Act of 1934 (§ 240.12b-2 of this chapter).

Emerging growth company  

If an emerging growth company, indicate by check mark if the registrant has elected not to use the extended transition period for complying with any new or revised financial accounting standards provided pursuant to Section 13(a) of the Exchange Act.  


Item 2.02 Results of Operations and Financial Condition.

On February 18, 2020, Devon Energy Corporation (the “Company”) announced its financial and operational results for the quarter and year ended December 31, 2019. In connection with this announcement, the Company provided an earnings release, its operations report for the fourth quarter of 2019 and certain supplemental financial information (including guidance and hedging information). Copies of these documents are furnished as Exhibits 99.1, 99.2 and 99.3, respectively, to this report and will be available on the Company’s website at www.devonenergy.com.

The information contained in this report and the exhibits hereto shall not be deemed to be “filed” for purposes of Section 18 of the Securities Exchange Act of 1934, as amended (the “Exchange Act”), and shall not be incorporated by reference into any filings made by the Company under the Securities Act of 1933, as amended, or the Exchange Act, except as may be expressly set forth by specific reference in such filing.

Item 9.01 Financial Statements and Exhibits.

(d) Exhibits

Exhibit
No.


Description of Exhibits


99.1


Earnings release, dated February 18, 2020.


99.2


Fourth quarter 2019 operations report.


99.3


Supplemental financial information (including guidance and hedging information).


104


Cover Page Interactive Data File (embedded within the Inline XBRL document).


SIGNATURES

Pursuant to the requirements of the Securities Exchange Act of 1934, the registrant has duly caused this report to be signed on its behalf by the undersigned hereunto duly authorized.

DEVON ENERGY CORPORATION


By:


/s/ Jeffrey L. Ritenour


Jeffrey L. Ritenour


Executive Vice President and Chief Financial Officer

Date: February 18, 2020

Exhibit 99.1


Devon Energy Corporation

333 West Sheridan Avenue

  Oklahoma City, OK 73102-5015


LOGO

NEWS RELEASE

Devon Energy Reports Fourth-Quarter and Full-Year 2019 Financial and Operational Results

OKLAHOMA CITY – Feb. 18, 2020 – Devon Energy Corp. (NYSE: DVN) today reported operational and financial results for the fourth-quarter and full-year 2019. Supplemental financial tables for the fourth-quarter and full-year results along with 2020 guidance are available on the company’s website at www.devonenergy.com.

Highlights


Fourth-quarter oil production increases 28 percent year over year, exceeding guidance


Efficiencies drive upstream capital expenditures 6 percent below midpoint


Operating cash flow expands year over year to $579 million


Free cash flow generation accelerated to $171 million in the fourth quarter


Board of directors approved a 22 percent increase to the quarterly dividend


Lowering 2020 capital spending outlook; raising oil growth rate expectations

“Devon’s transformation to a U.S. oil business is now complete and the operating performance we achieved in 2019 showcases the world-class capabilities of our highly focused asset portfolio,” said Dave Hager, president and CEO. “A consistent theme throughout 2019 was the steady improvement in well productivity and capital efficiency that drove oil production above guidance for four consecutive quarters while keeping our total capital investment below forecast. In addition to the strong operating performance, we made substantial progress building per-share value through our industry leading share-repurchase program and we have built a strong balance sheet by reducing debt by more than 75 percent from peak levels a few years ago.

“With the positive business momentum established across our asset portfolio, we are raising per-share growth expectations in 2020,” said Hager. “Based on our success in the Delaware Basin, we now expect operational efficiencies to drive Devon’s oil growth rates higher with lower capital requirements. This improved operating outlook supports our announcement today to increase the dividend by 22 percent and our new $1 billion share repurchase program.”

Fourth-Quarter 2019 Operating Results

Total net production from Devon’s retained assets averaged 340,000 oil-equivalent barrels (Boe) per day during the fourth quarter. Oil production averaged 160,000 barrels per day, a 28 percent increase from the same period a year ago. This result exceeded the company’s midpoint guidance by 3,000 barrels per day due to strong well productivity and timing of completions in the Delaware Basin.

In addition to the strong production performance, Devon maintained discipline with its capital programs. The company’s upstream capital spending in the fourth quarter was $373 million, or 6 percent below midpoint guidance. This positive variance was attributable to efficiency gains attained across the company’s Delaware Basin and Powder River assets.

The company’s upstream revenue, excluding commodity derivatives, totaled $1.0 billion in the fourth quarter. This represents a 13 percent increase in revenue compared to the third quarter of 2019. The increase in upstream revenue resulted from growth in higher-value oil production and improved commodity price realizations for all products produced.


1


Devon’s lease operating expense (LOE) totaled $251 million in the fourth quarter. Including costs reclassified to discontinued operations, LOE rates declined 17 percent compared to the year-ago quarter. This improvement was attributable to low-cost production growth in the Delaware Basin and the divestiture of higher-cost Canadian assets. These improvements to the cost structure were partially offset by $11 million of expenses related to a well-control event and one-time non-operated transportation adjustments in the quarter.

The company continued its substantial progress improving its general and administrative (G&A) cost structure. Including expenses reclassified to discontinued operations, the company’s G&A costs improved 21 percent year-over-year in the fourth quarter to $119 million. With a steady cadence of cost reductions captured throughout the year, Devon exited 2019 with approximately $240 million of annualized run-rate savings compared to 2018.

Financial Highlights

Devon maintains an investment-grade balance sheet and excellent liquidity. The company exited the fourth quarter with $1.8 billion of cash (inclusive of restricted cash) and an undrawn credit facility of $3 billion. At year-end, Devon’s total debt outstanding was $4.3 billion, which equates to net debt of $2.5 billion. Further bolstering the company’s financial flexibility is the benefit of no outstanding debt maturities occurring until late 2025.

In the fourth quarter, Devon entered into an agreement to sell its Barnett Shale assets for $770 million. With this transaction, combined with the exit from Canada early in the year, Devon has now completed its transformation to a U.S. oil growth business. Together, these divestitures will generate more than $3 billion of proceeds at accretive multiples to Devon’s valuation.

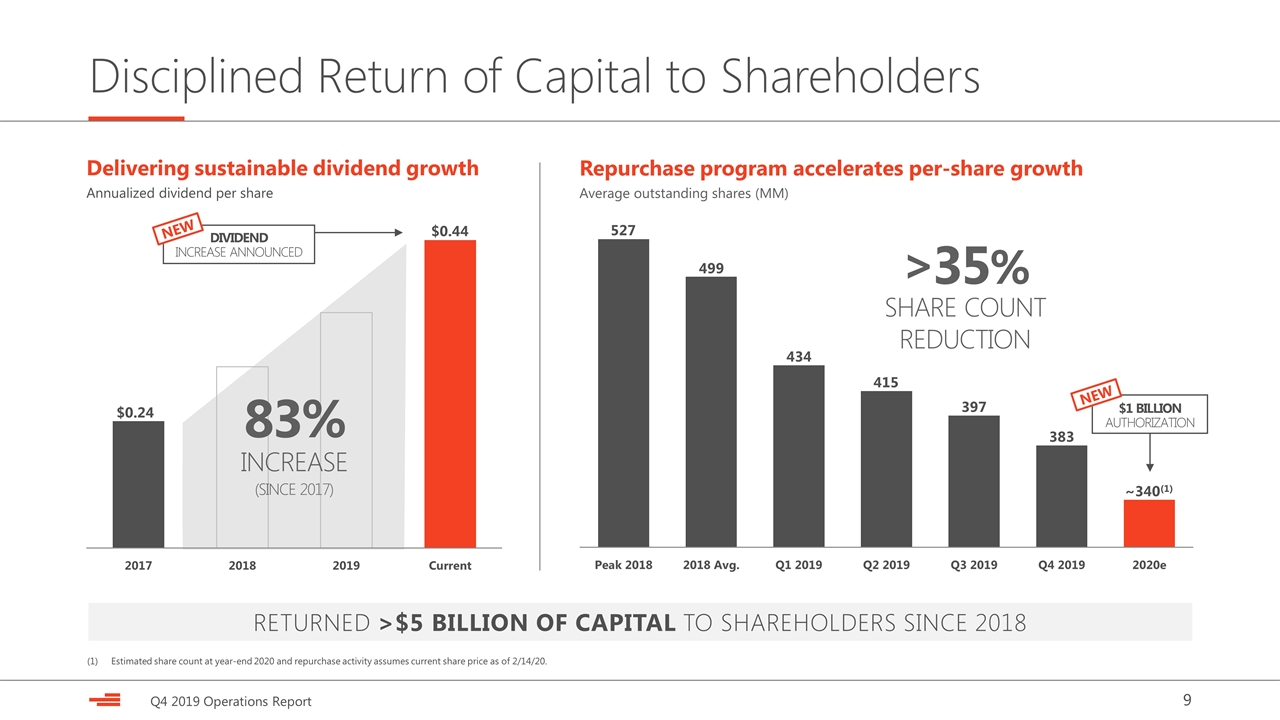
Given the company’s generation of excess cash flow, Devon has committed to return industry-leading amounts of cash to its shareholder base. To date, the company has repurchased 147 million shares, or approximately 28 percent of outstanding shares since 2018, at a total cost of $4.8 billion. In the fourth quarter, Devon’s board of directors authorized a new $1 billion share-repurchase program and the company expects to be an active acquirer of its shares in the upcoming year.

The company is also rewarding shareholders with its quarterly common stock dividend. In a separate release issued today, Devon announced that its board of directors approved a 22 percent increase to its quarterly common stock dividend to $0.11 per share, compared to the prior rate of $0.09 per share. The new quarterly dividend rate is effective in the second quarter of 2020.

Fourth-Quarter Earnings and Cash-Flow Results

Devon’s operating cash flow from continuing operations totaled $579 million in the fourth quarter. This level of cash flow funded all capital requirements and generated $171 million of free cash flow in the quarter.

In the fourth quarter the company reported a net loss of $642 million, or $1.70 per diluted share. The quarterly loss was attributable to a $748 million non-cash impairment charge related to the divestiture of the Barnett Shale. Adjusting for this charge and other items analysts typically exclude from estimates, Devon’s core earnings were $0.33 per diluted share.


2


Asset-Level Overview

Key operational highlights from Devon’s retained assets are covered below. For more detailed results and commentary regarding Devon’s operations and outlook, please refer to the company’s fourth-quarter 2019 operations report at www.devonenergy.com.

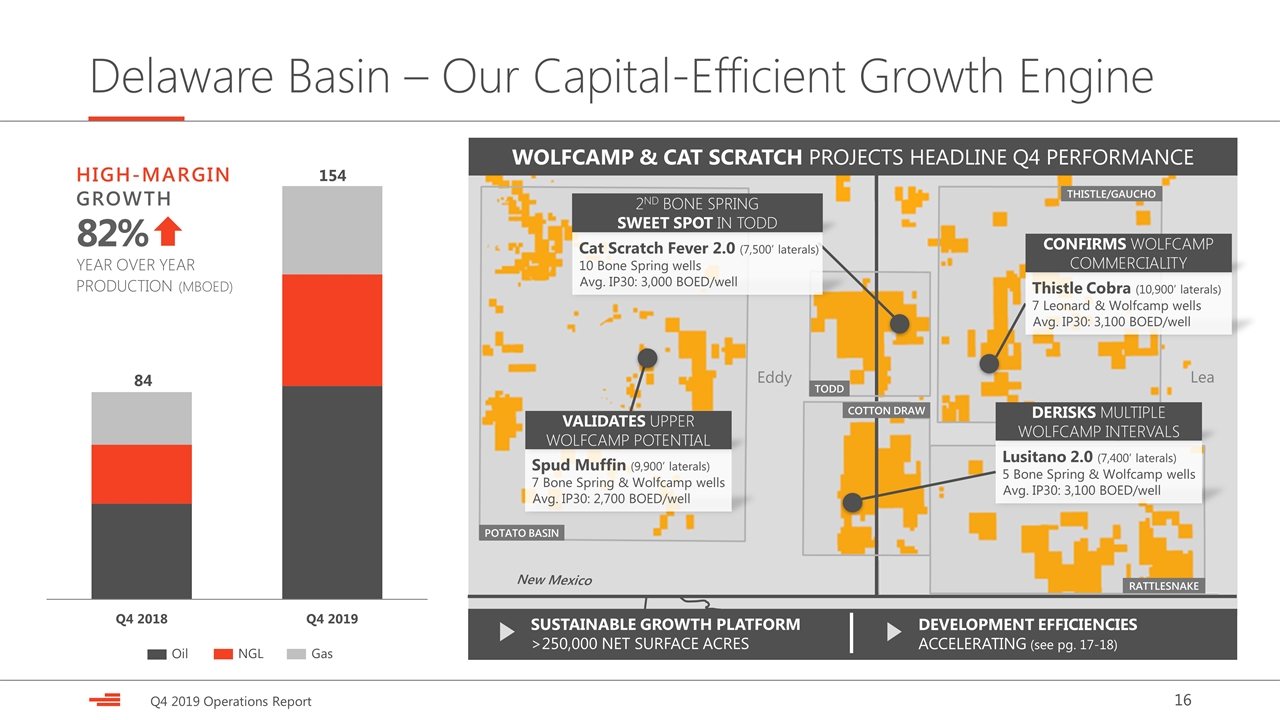
Delaware Basin: Net production averaged 154,000 Boe per day, an 82 percent increase compared to the fourth-quarter 2018. The strong production growth was driven by 36 high-impact wells diversified across the Wolfcamp, Bone Spring and Leonard Shale targets. This activity averaged 30-day production rates of 2,800 Boe per day (70 percent oil), at an average completed well cost of $7.5 million. Key projects that contributed to the strong volume growth in the quarter were the company’s Cat Scratch Fever 2.0 project and three Wolfcamp projects that helped further confirm the commerciality of multiple target intervals across the basin.

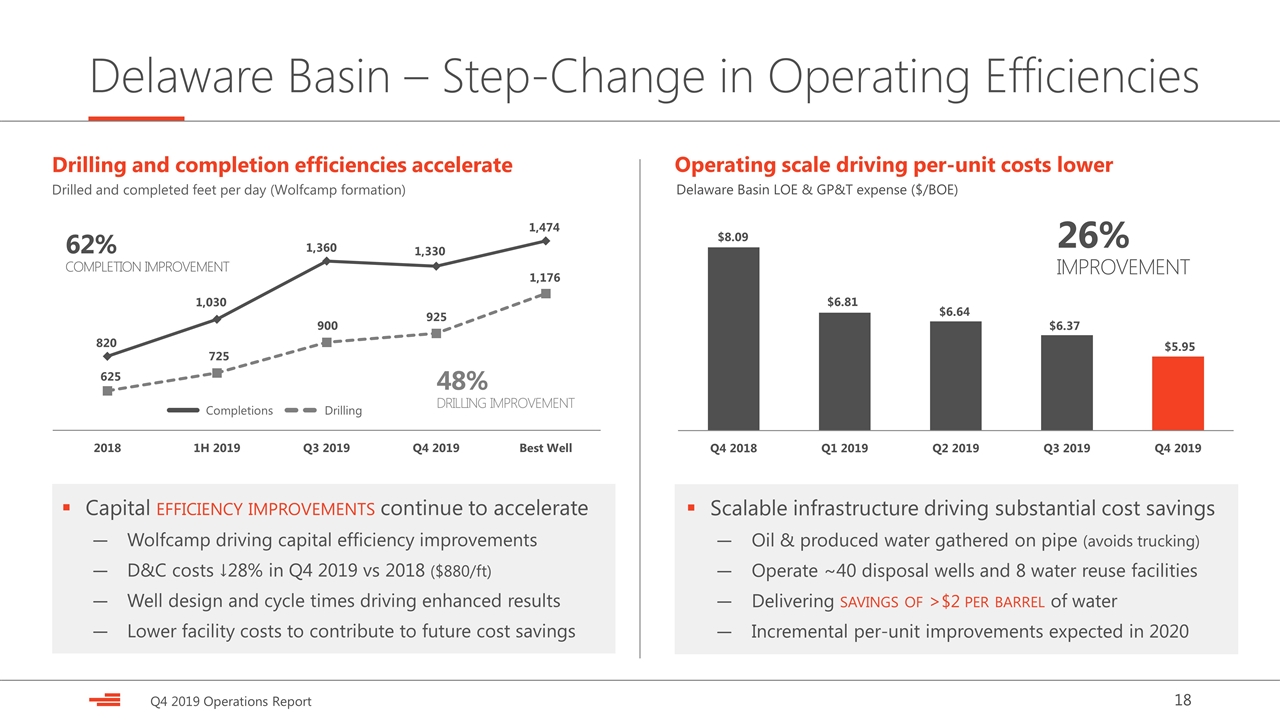
Another important operational highlight in the fourth quarter was the capital efficiency gains achieved by the company’s Wolfcamp program. Due to improvements in well design and cycle times, drilled and completed feet per day metrics in the Wolfcamp improved 48 percent and 62 percent year-over-year, respectively. These improvements in the quarter drove down Wolfcamp capital costs to $880 per foot, which represents a 28 percent reduction in cost compared to the 2018 average. The company expects this positive operational trend to continue in 2020.

Powder River Basin: Net production averaged 27,000 Boe per day in the quarter, of which 74 percent was light oil. This represents a 54 percent increase in production compared to the year-ago period. Fourth-quarter volume growth was driven by 19 new wells averaging 30-day rates of 1,300 Boe per day, at an average completed well cost of $5.5 million.

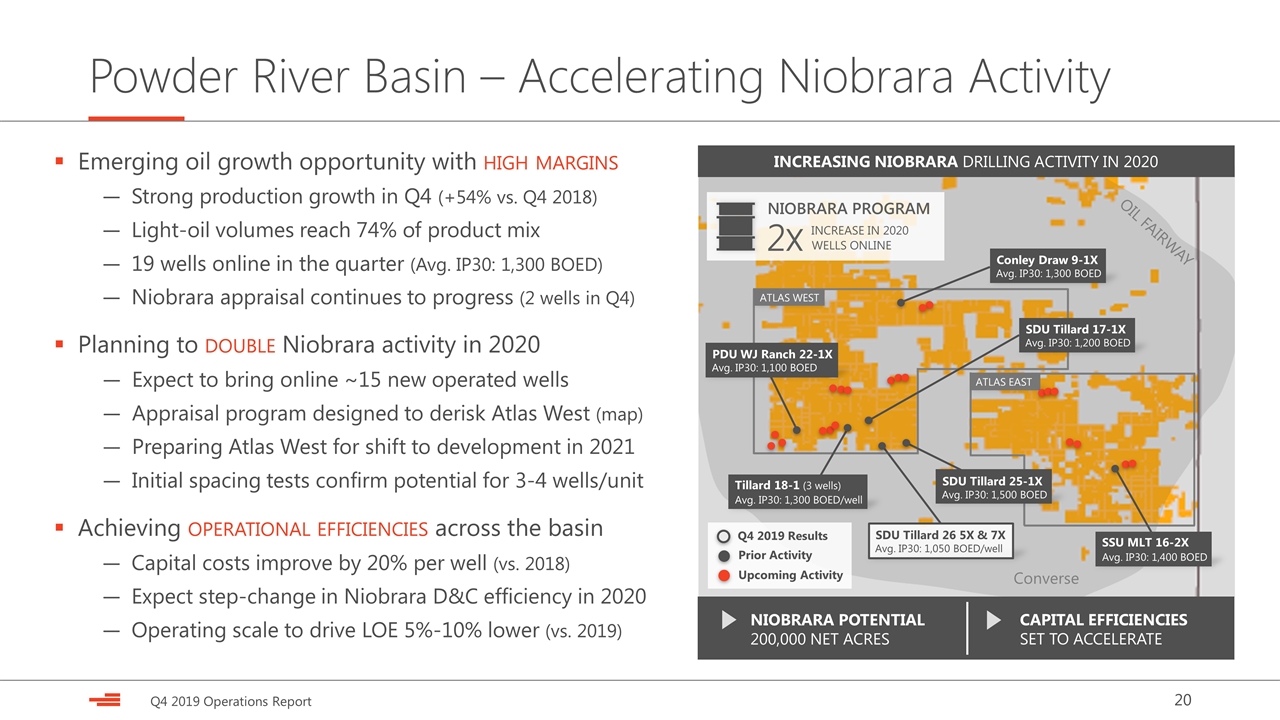
The capital program was highlighted by appraisal work in the emerging Niobrara oil play, where over the past two years the company has commenced production on 11 wells across its 200,000 net acre position. During the year, Devon’s Niobrara wells achieved 30-day rates as high as 1,500 Boe per day, with oil representing more than 85 percent of the product mix. Given this success, Devon plans to double its Niobrara drilling activity in 2020 in an attempt to ready a portion of the field for development in 2021.

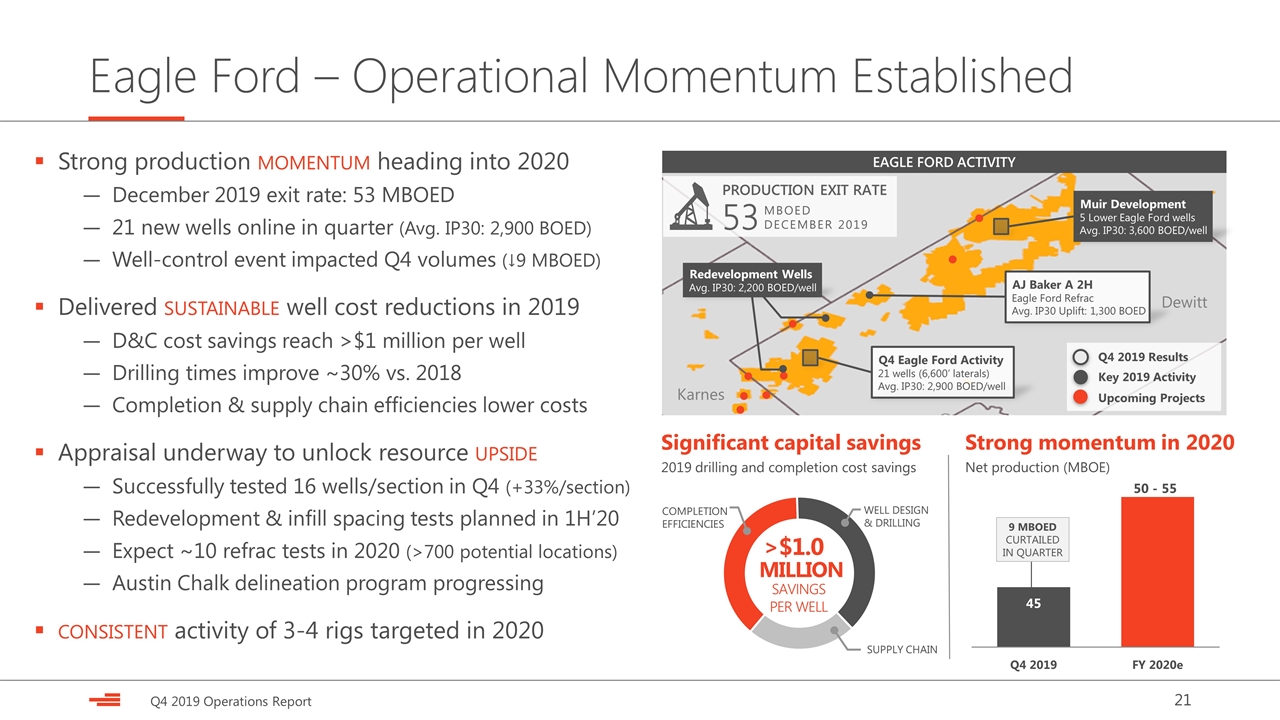
Eagle Ford: Fourth-quarter net production averaged 45,000 Boe per day. Production was below the company’s guidance range due to a well-control event that curtailed volumes by 9,000 Boe per day. This event was resolved during the quarter, permitting Devon to bring online 21 new wells that achieved peak 30-day rates of 2,900 Boe per day. With operational momentum re-established in the Eagle Ford, the company exited December with production reaching 53,000 Boe per day.

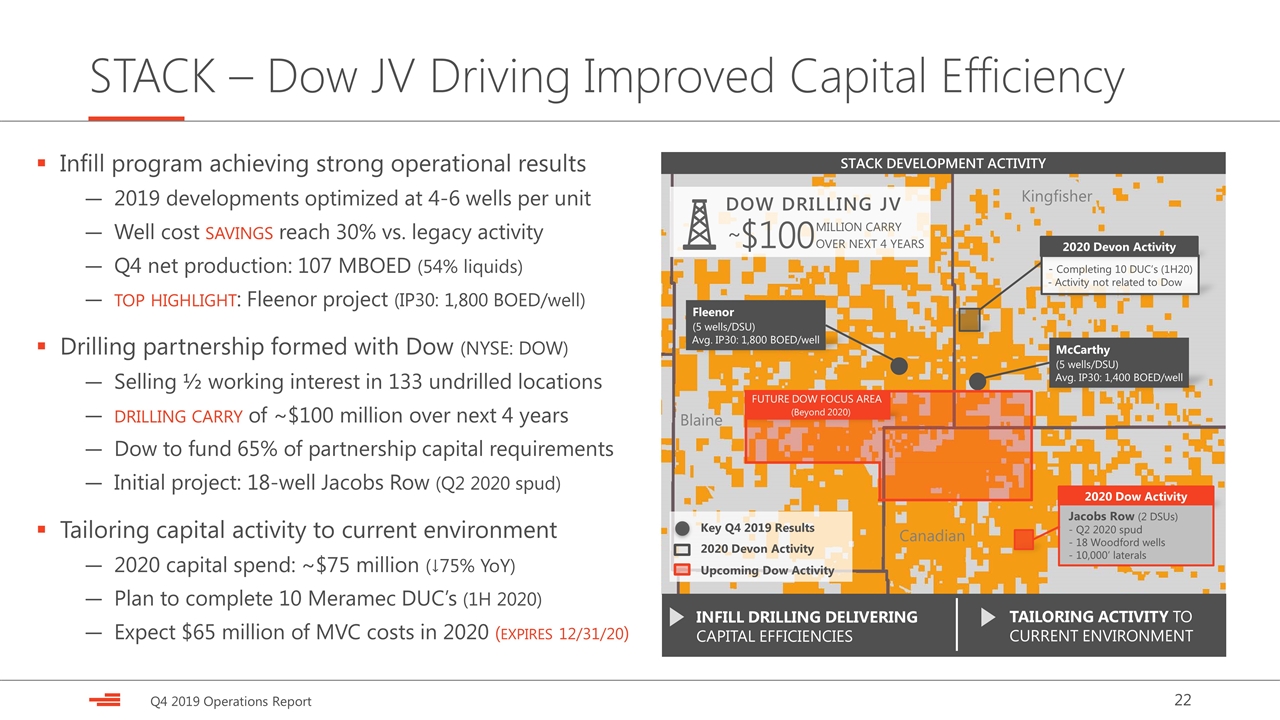
STACK: Net production averaged 107,000 Boe per day in the fourth quarter. To enhance returns and maintain operational continuity in the STACK, Devon recently formed a drilling partnership with Dow to develop a portion of the company’s acreage. Under the agreement, Devon will monetize half of its working interest in 133 undrilled locations in exchange for a $100 million drilling carry over the next four years. The drilling carry allows STACK projects to compete for capital allocation within Devon’s portfolio, and the partnership will begin drilling its initial development project in the second quarter of 2020.


3


2019 Proved Reserves

Devon’s estimated proved reserves were 757 million Boe at year-end 2019, with proved undeveloped reserves accounting for only 22 percent of the total. The company’s drilling programs successfully added 160 million Boe of reserves through extensions and discoveries in 2019. The capital costs incurred to deliver these reserve additions totaled $1.8 billion, equating to an attractive finding and development cost of $11 per Boe.

Updated 2020 Outlook – Higher Oil Growth for Less Capital Investment

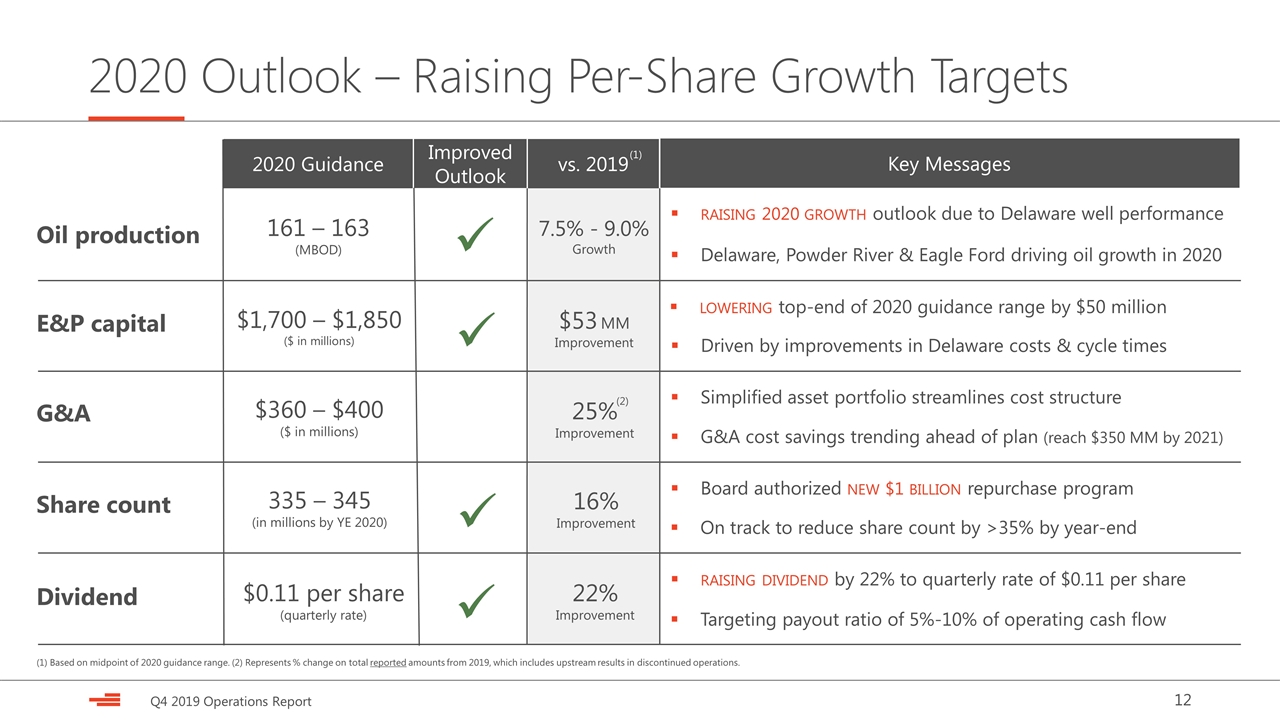
Led by the exceptionally strong well performance Devon is experiencing in the Delaware Basin, the company is now raising its full-year 2020 oil growth rate to range of 7.5 percent to 9 percent compared to 2019 (on a retained asset basis). In the first-quarter 2020, oil production is projected to average in the range of 158,000 to 163,000 barrels per day.

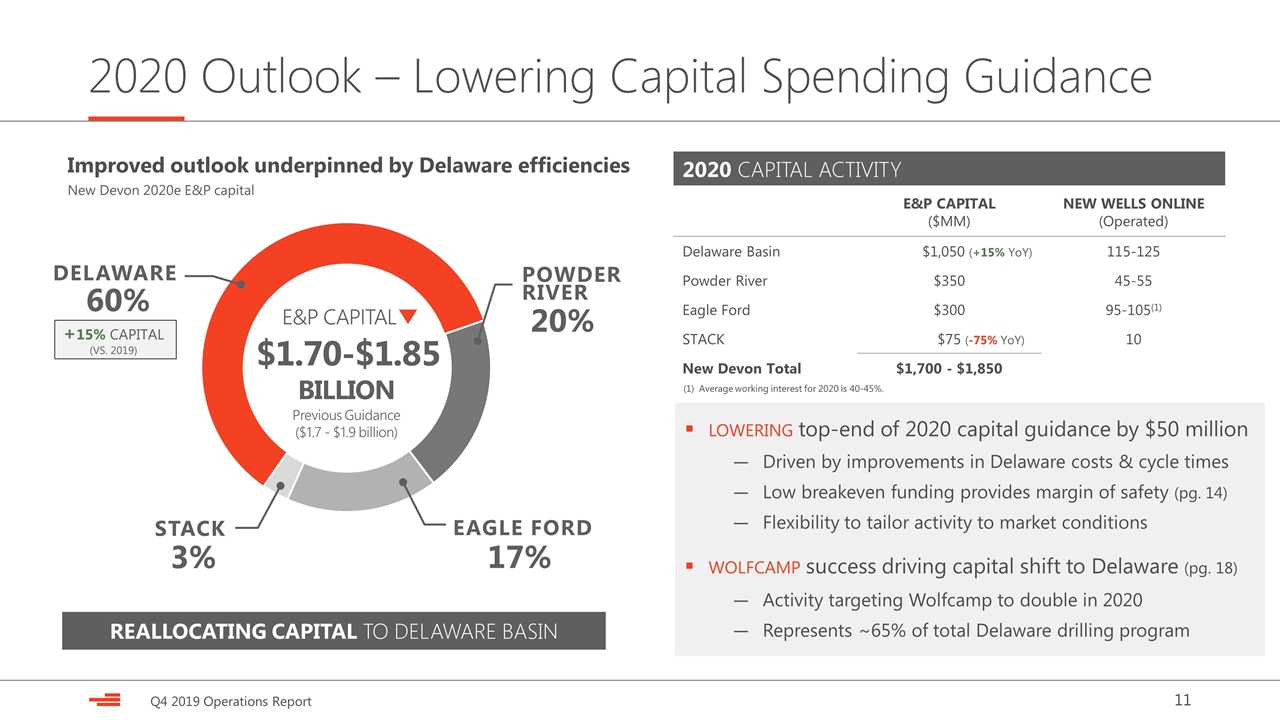
Importantly, Devon expects to deliver this improved oil growth outlook with less capital than previously projected. The company is now lowering the top end of its upstream capital guidance by $50 million to a range of $1.7 billion to $1.85 billion in 2020. Furthermore, the capital efficiency of this investment in 2020 is expected to be enhanced by reallocation of capital to the Delaware Basin from the STACK play. The company now projects that capital spending in the Delaware Basin will increase by approximately 15 percent year-over-year and account for approximately 60 percent of Devon’s total capital investment in 2020.

Another noteworthy guidance item for 2020 is the company’s full-year G&A outlook that is expected to decline to a range of $360 million to $400 million. Including costs reclassified as discontinued operations, this represents an improvement of more than 20 percent compared to 2019. With this outlook, Devon remains on track to meet or exceed its stated goal of reducing total G&A expense to a level of $350 million by the end of 2021.

LOE rates are expected to increase to a range of $8.00 to $8.20 per Boe in 2020. This increase is entirely driven by $65 million of minimum volume commitment payments in the STACK. These commitments expire at the end of 2020.

Environmental, Social & Governance

Devon strives to deliver results that balance economic growth, environmental stewardship, strong governance and social responsibility. For access to Devon’s sustainability report, please visit www.devonenergy.com/sustainability. This report highlights the company’s commitment to operating a responsible, safe and ethical business while providing transparent reporting to all stakeholders.

Conference Call Webcast and Supplemental Earnings Materials

Also provided with today’s release is the company’s detailed operations report that is available on the company’s website at www.devonenergy.com. The company’s fourth-quarter conference call will be held at 10 a.m. Central (11 a.m. Eastern) on Wednesday, Feb. 19, 2020, and will serve primarily as a forum for analyst and investor questions and answers.

Non-GAAP Disclosures

This release includes non-GAAP (generally accepted accounting principles) financial measures. Such non-GAAP measures are not alternatives to GAAP measures, and you should not consider these non-GAAP measures in isolation or as a substitute for analysis of results as reported under GAAP. Reconciliations of these non-GAAP measures and other disclosures are provided within the supplemental financial tables that are available on the company’s website at www.devonenergy.com and in our related Form 10-K.


4


About Devon Energy

Devon Energy is a leading independent energy company engaged in finding and producing oil and natural gas. Based in Oklahoma City and included in the S&P 500, Devon operates in several of the most prolific oil and natural gas plays in the U.S. with an emphasis on achieving strong corporate-level returns and capital-efficient cash-flow growth. For more information, please visit www.devonenergy.com and see our related Form 10-K.

Forward-Looking Statements

This press release includes “forward-looking statements” as defined by the Securities and Exchange Commission (the “SEC”). Such statements include those concerning strategic plans, our expectations and objectives for future operations, as well as other future events or conditions, and are often identified by use of the words and phrases “expects,” “believes,” “will,” “would,” “could,” “continue,” “may,” “aims,” “likely to be,” “intends,” “forecasts,” “projections,” “estimates,” “plans,” “expectations,” “targets,” “opportunities,” “potential,” “anticipates,” “outlook” and other similar terminology. All statements, other than statements of historical facts, included in this press release that address activities, events or developments that Devon expects, believes or anticipates will or may occur in the future are forward-looking statements. Such statements are subject to a number of assumptions, risks and uncertainties, many of which are beyond our control. Consequently, actual future results could differ materially from our expectations due to a number of factors, including, but not limited to: the volatility of oil, gas and NGL prices; uncertainties inherent in estimating oil, gas and NGL reserves; the extent to which we are successful in acquiring and discovering additional reserves; the uncertainties, costs and risks involved in our operations, including as a result of employee misconduct; regulatory restrictions, compliance costs and other risks relating to governmental regulation, including with respect to environmental matters; risks related to regulatory, social and market efforts to address climate change; risks related to our hedging activities; counterparty credit risks; risks relating to our indebtedness; cyberattack risks; our limited control over third parties who operate some of our oil and gas properties; midstream capacity constraints and potential interruptions in production; the extent to which insurance covers any losses we may experience; competition for assets, materials, people and capital; risks related to investors attempting to effect change; our ability to successfully complete mergers, acquisitions and divestitures; and any of the other risks and uncertainties discussed in our Form 10-K and other filings with the SEC. All subsequent written and oral forward-looking statements attributable to Devon, or persons acting on its behalf, are expressly qualified in their entirety by the cautionary statements above. We assume no duty to update or revise our forward-looking statements based on new information, future events or otherwise.


Investor Contacts    Media Contact

Scott Coody, 405-552-4735


John Porretto, 405-228-7506

Chris Carr, 405-228-2496


5

Slide 1

February 18, 2020 Q4 2019 Operations Report Exhibit 99.2


Slide 2

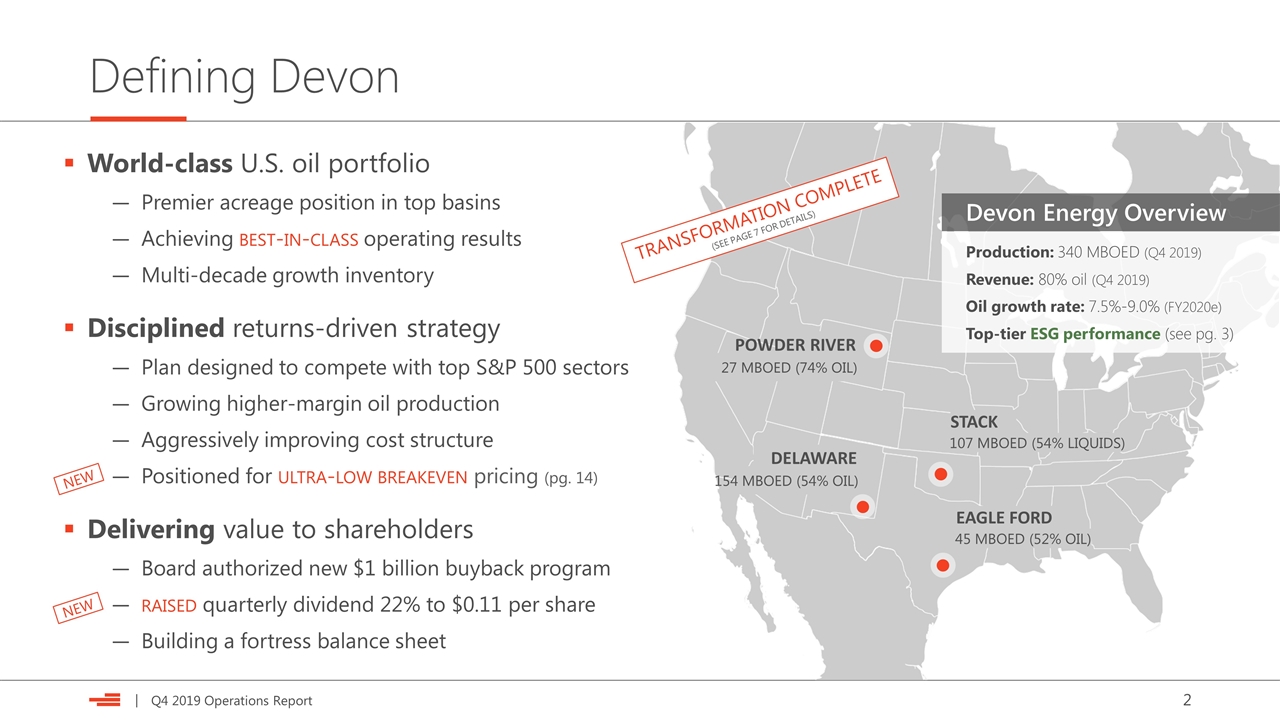
Defining Devon World-class U.S. oil portfolio Premier acreage position in top basins Achieving best-in-class operating results Multi-decade growth inventory Disciplined returns-driven strategy Plan designed to compete with top S&P 500 sectors Growing higher-margin oil production Aggressively improving cost structure Positioned for ultra-low breakeven pricing (pg. 14) Delivering value to shareholders Board authorized new $1 billion buyback program raised quarterly dividend 22% to $0.11 per share Building a fortress balance sheet 27 MBOED (74% OIL) STACK 107 MBOED (54% LIQUIDS) POWDER RIVER EAGLE FORD 45 MBOED (52% OIL) 154 MBOED (54% OIL) DELAWARE Production: 340 MBOED (Q4 2019) Revenue: 80% oil (Q4 2019) Oil growth rate: 7.5%-9.0% (FY2020e) Top-tier ESG performance (see pg. 3) Devon Energy Overview NEW TRANSFORMATION COMPLETE (SEE PAGE 7 FOR DETAILS) NEW


Slide 3

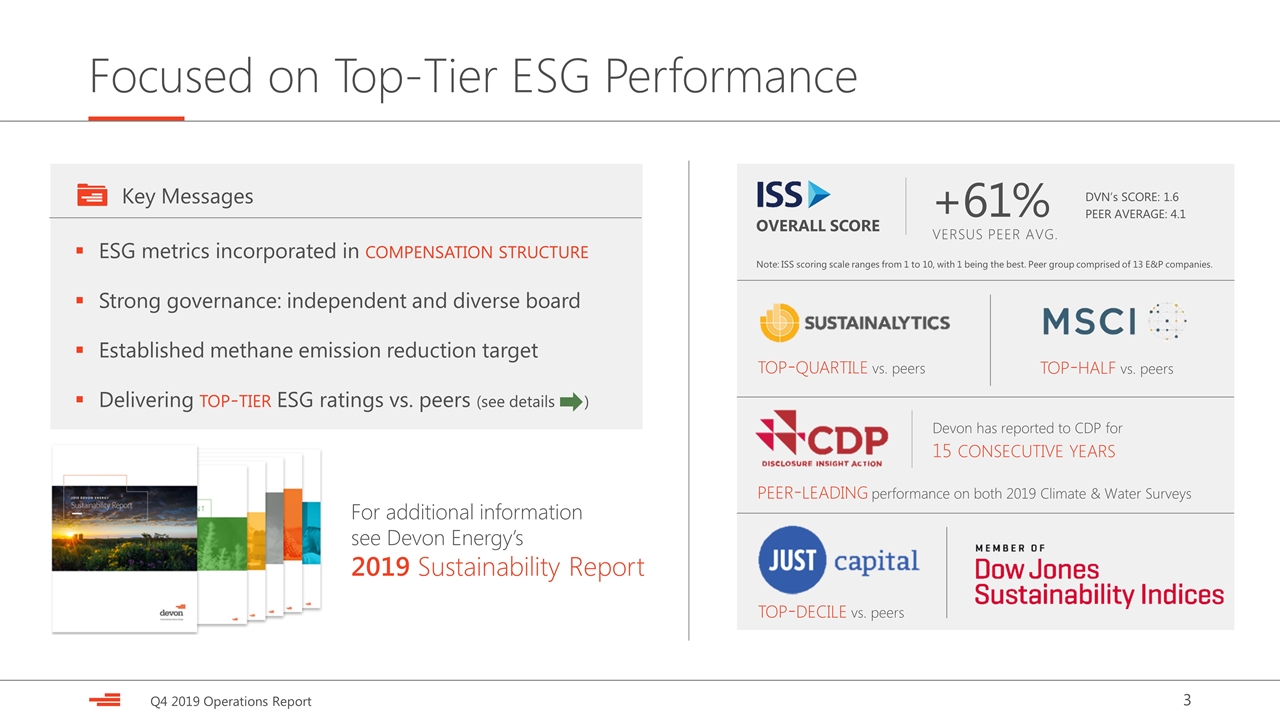
Focused on Top-Tier ESG Performance ESG metrics incorporated in compensation structure Strong governance: independent and diverse board Established methane emission reduction target Delivering top-tier ESG ratings vs. peers (see details ) Key Messages top-quartile vs. peers OVERALL SCORE DVN’s SCORE: 1.6 PEER AVERAGE: 4.1 +61% VERSUS PEER AVG. Note: ISS scoring scale ranges from 1 to 10, with 1 being the best. Peer group comprised of 13 E&P companies. For additional information see Devon Energy’s 2019 Sustainability Report top-half vs. peers Devon has reported to CDP for 15 consecutive years peer-leading performance on both 2019 Climate & Water Surveys top-decile vs. peers


Slide 4

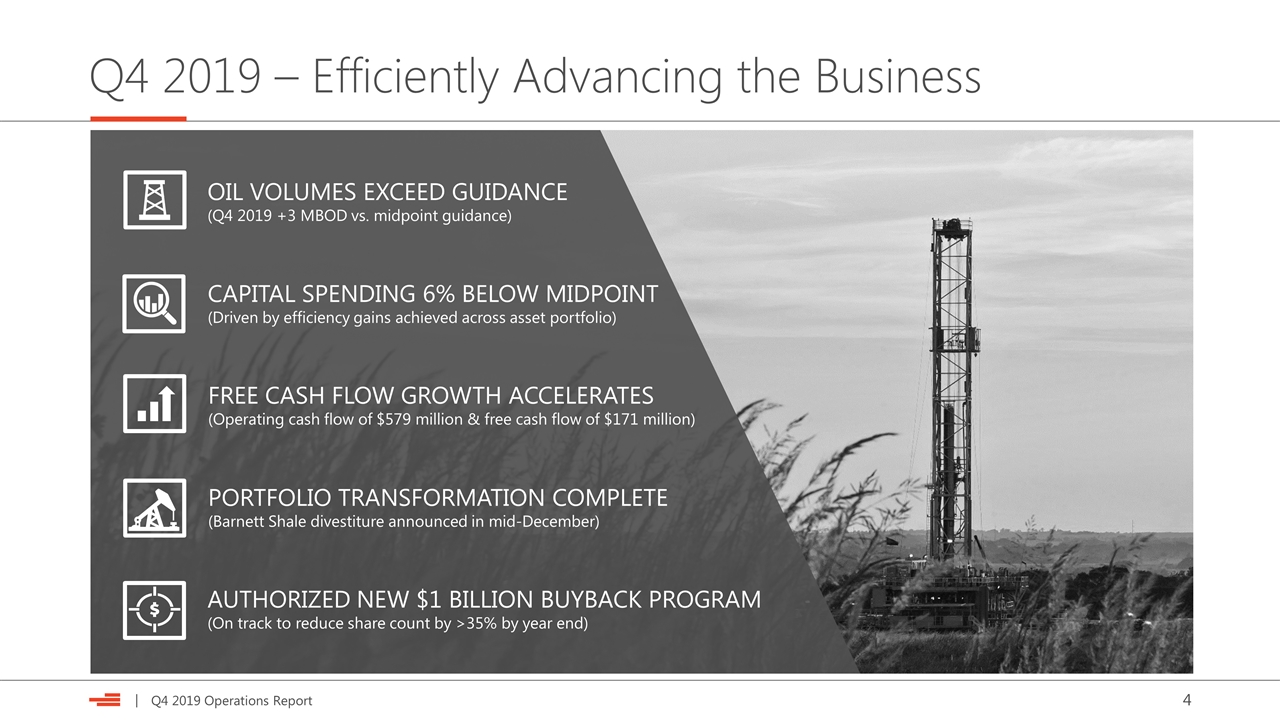
Q4 2019 – Efficiently Advancing the Business OIL VOLUMES EXCEED GUIDANCE (Q4 2019 +3 MBOD vs. midpoint guidance) CAPITAL SPENDING 6% BELOW MIDPOINT (Driven by efficiency gains achieved across asset portfolio) AUTHORIZED NEW $1 BILLION BUYBACK PROGRAM (On track to reduce share count by >35% by year end) FREE CASH FLOW GROWTH ACCELERATES (Operating cash flow of $579 million & free cash flow of $171 million) PORTFOLIO TRANSFORMATION COMPLETE (Barnett Shale divestiture announced in mid-December)


Slide 5

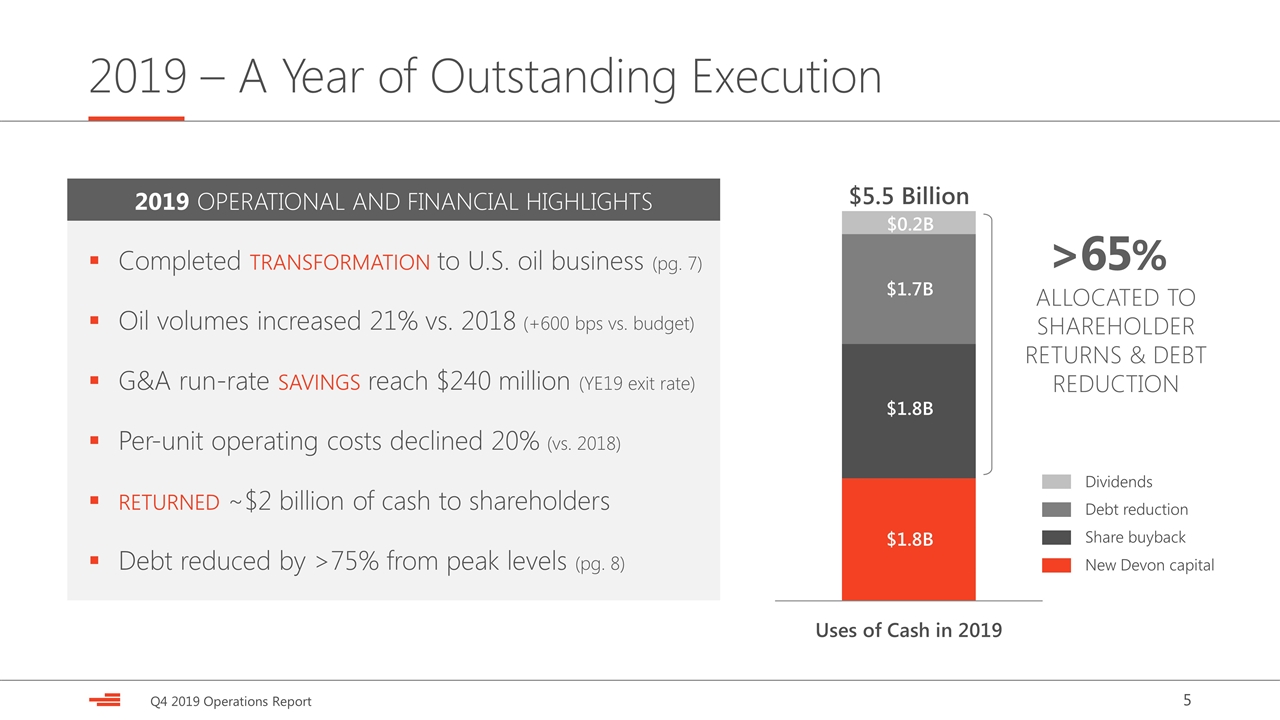
2019 – A Year of Outstanding Execution Completed transformation to U.S. oil business (pg. 7) Oil volumes increased 21% vs. 2018 (+600 bps vs. budget) G&A run-rate savings reach $240 million (YE19 exit rate) Per-unit operating costs declined 20% (vs. 2018) returned ~$2 billion of cash to shareholders Debt reduced by >75% from peak levels (pg. 8) 2019 OPERATIONAL AND FINANCIAL HIGHLIGHTS Share buyback New Devon capital Debt reduction Dividends ALLOCATED TO SHAREHOLDER RETURNS & DEBT REDUCTION >65% $5.5 Billion $1.8B $1.8B $1.7B $0.2B


Slide 6

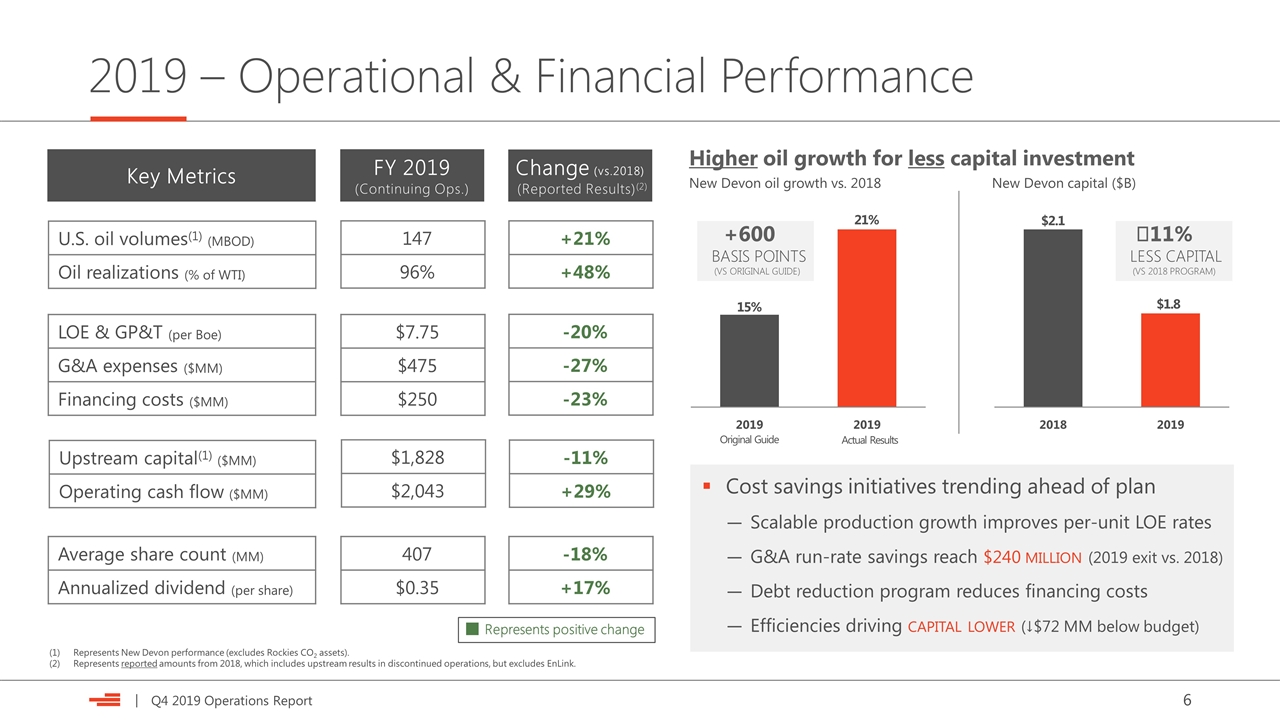
2019 – Operational & Financial Performance LOE & GP&T (per Boe) G&A expenses ($MM) Financing costs ($MM) Upstream capital(1) ($MM) Operating cash flow ($MM) Average share count (MM) Annualized dividend (per share) $7.75 $475 $250 $1,828 $2,043 407 $0.35 -20% -27% -23% -18% +17% U.S. oil volumes(1) (MBOD) Oil realizations (% of WTI) 147 96% +21% +48% Represents New Devon performance (excludes Rockies CO2 assets). Represents reported amounts from 2018, which includes upstream results in discontinued operations, but excludes EnLink. Higher oil growth for less capital investment New Devon oil growth vs. 2018 21% 15% FY 2019 (Continuing Ops.) Change (vs.2018) (Reported Results)(2) Key Metrics -11% +29% Cost savings initiatives trending ahead of plan Scalable production growth improves per-unit LOE rates G&A run-rate savings reach $240 million (2019 exit vs. 2018) Debt reduction program reduces financing costs Efficiencies driving capital lower (↓$72 MM below budget) +600 BASIS POINTS (VS ORIGINAL GUIDE) New Devon capital ($B) $2.1 $1.8 Actual Results Original Guide ↆ11% LESS CAPITAL (VS 2018 PROGRAM) Represents positive change


Slide 7

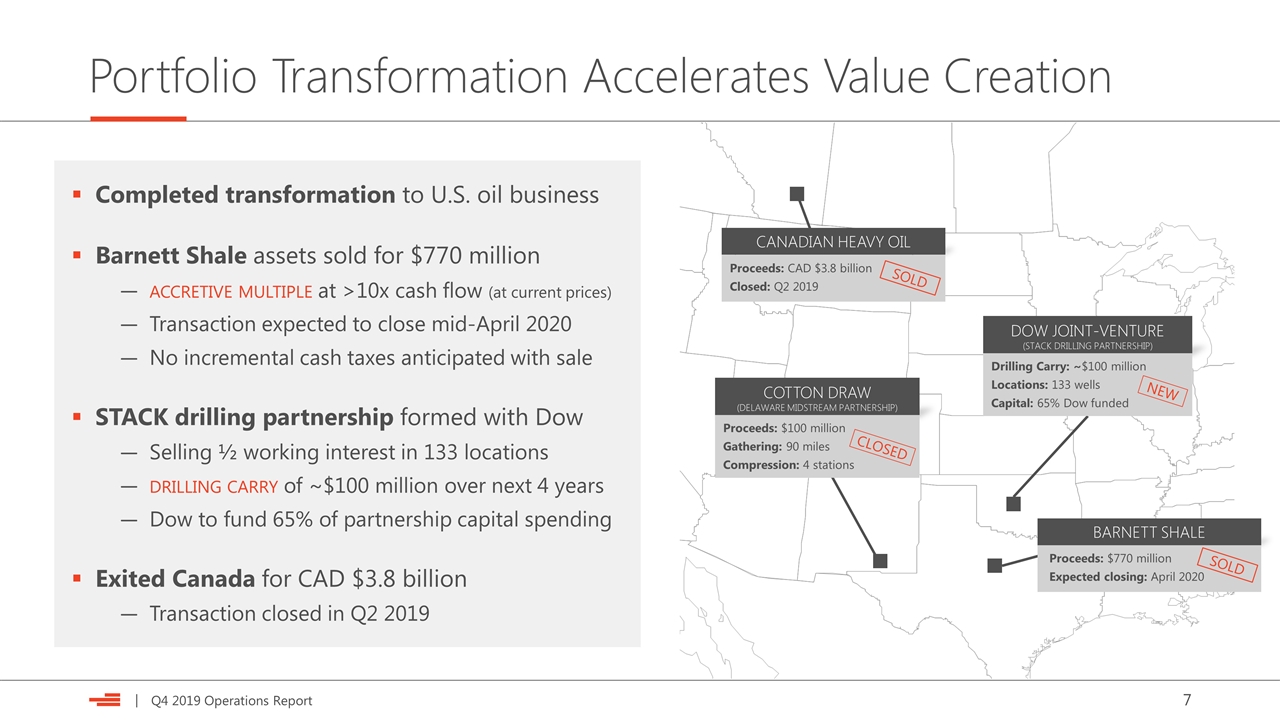
Portfolio Transformation Accelerates Value Creation Cotton draw (DELAWARE Midstream partnership) Proceeds: $100 million Gathering: 90 miles Compression: 4 stations CANADIAN HEAVY OIL Proceeds: CAD $3.8 billion Closed: Q2 2019 DOW JOINT-VENTURE (STACK DRILLING partnership) Drilling Carry: ~$100 million Locations: 133 wells Capital: 65% Dow funded NEW SOLD CLOSED BARNETT SHALE Proceeds: $770 million Expected closing: April 2020 SOLD Completed transformation to U.S. oil business Barnett Shale assets sold for $770 million accretive multiple at >10x cash flow (at current prices) Transaction expected to close mid-April 2020 No incremental cash taxes anticipated with sale STACK drilling partnership formed with Dow Selling ½ working interest in 133 locations drilling carry of ~$100 million over next 4 years Dow to fund 65% of partnership capital spending Exited Canada for CAD $3.8 billion Transaction closed in Q2 2019


Slide 8

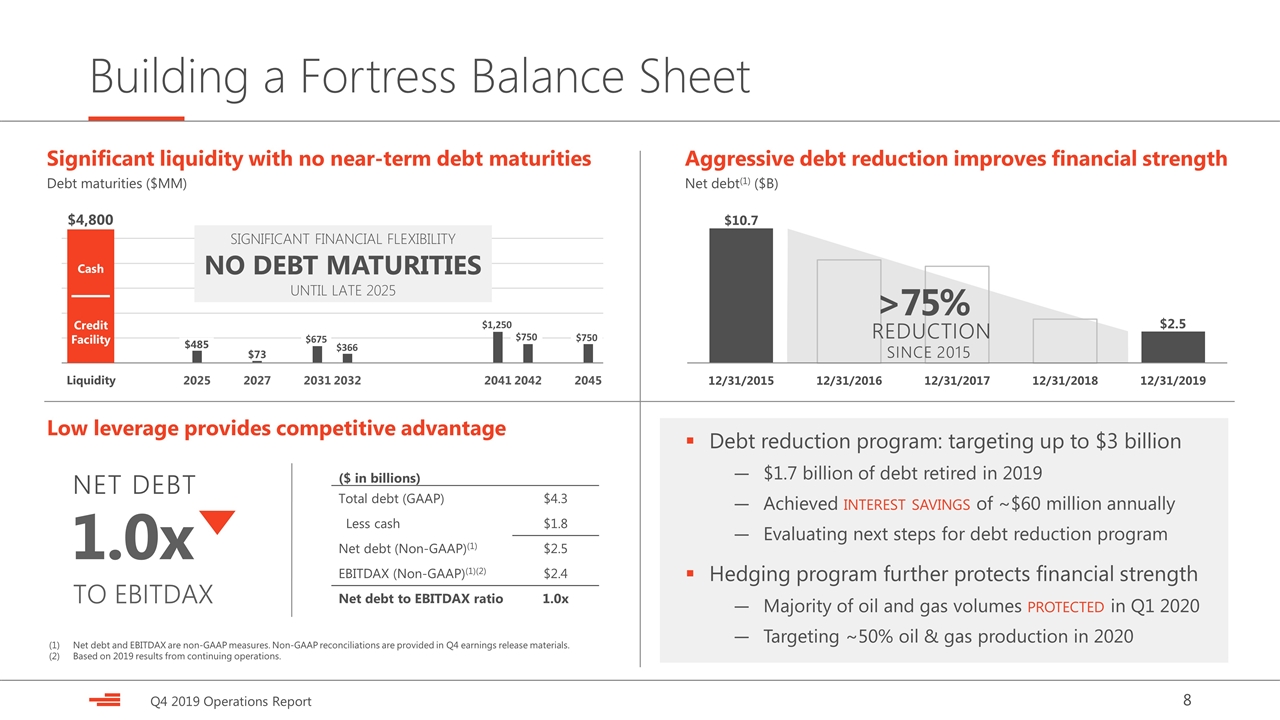
Building a Fortress Balance Sheet Aggressive debt reduction improves financial strength Net debt(1) ($B) ($ in billions) Total debt (GAAP) $4.3 Less cash $1.8 Net debt (Non-GAAP)(1) $2.5 EBITDAX (Non-GAAP)(1)(2) $2.4 Net debt to EBITDAX ratio 1.0x Low leverage provides competitive advantage $485 $73 Significant liquidity with no near-term debt maturities Debt maturities ($MM) $4,800 1.0x NET DEBT TO EBITDAX Liquidity NO DEBT MATURITIES SIGNIFICANT FINANCIAL FLEXIBILITY UNTIL LATE 2025 Cash Credit Facility Debt reduction program: targeting up to $3 billion $1.7 billion of debt retired in 2019 Achieved interest savings of ~$60 million annually Evaluating next steps for debt reduction program Hedging program further protects financial strength Majority of oil and gas volumes protected in Q1 2020 Targeting ~50% oil & gas production in 2020 Net debt and EBITDAX are non-GAAP measures. Non-GAAP reconciliations are provided in Q4 earnings release materials. Based on 2019 results from continuing operations. $10.7 $2.5 >75% SINCE 2015 REDUCTION


Slide 9

Disciplined Return of Capital to Shareholders 527 499 434 Delivering sustainable dividend growth Annualized dividend per share $0.44 $0.24 83% INCREASE (SINCE 2017) RETURNED >$5 BILLION OF CAPITAL TO SHAREHOLDERS SINCE 2018 415 397 383 ~340(1) Estimated share count at year-end 2020 and repurchase activity assumes current share price as of 2/14/20. 35% SHARE COUNT REDUCTION > DIVIDEND INCREASE ANNOUNCED $1 BILLION AUTHORIZATION Repurchase program accelerates per-share growth Average outstanding shares (MM) NEW NEW


Slide 10

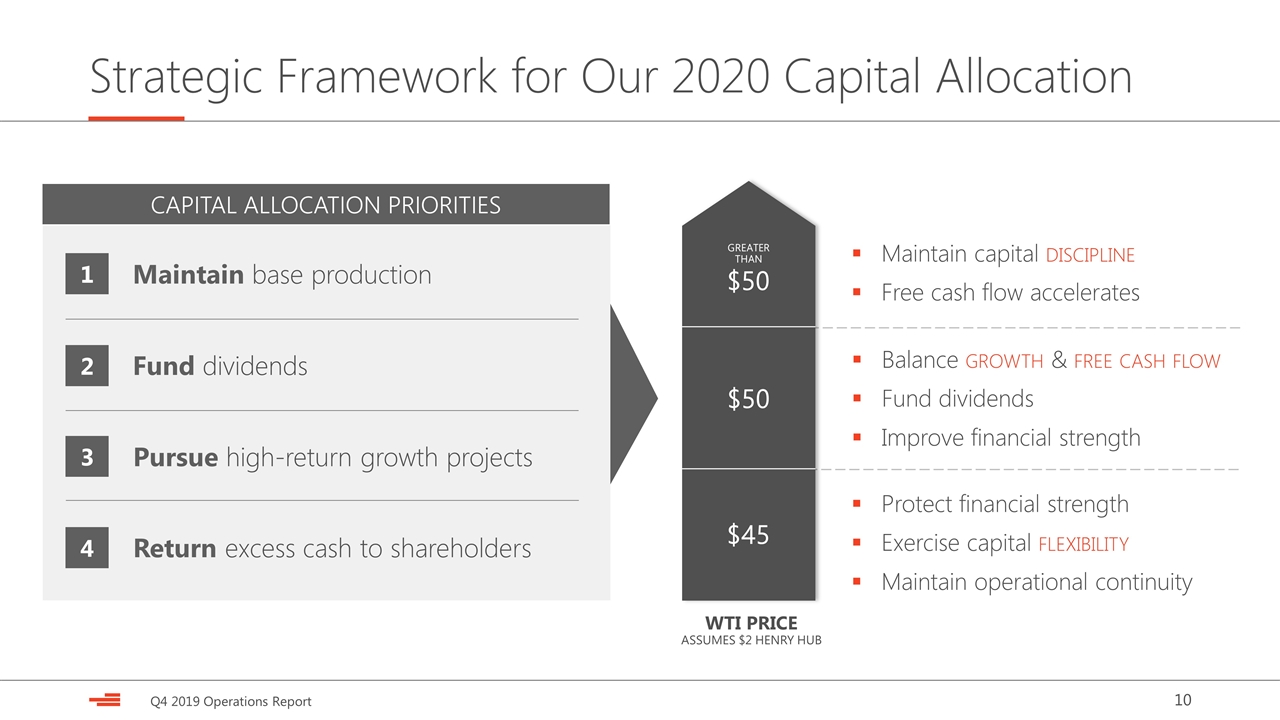
Strategic Framework for Our 2020 Capital Allocation CAPITAL ALLOCATION PRIORITIES Maintain base production Pursue high-return growth projects Return excess cash to shareholders Fund dividends 1 2 3 4 Maintain capital discipline Free cash flow accelerates GREATER THAN $50 $50 $45 Protect financial strength Exercise capital flexibility Maintain operational continuity Balance growth & free cash flow Fund dividends Improve financial strength WTI PRICE ASSUMES $2 HENRY HUB


Slide 11

2020 CAPITAL ACTIVITY E&P CAPITAL ($MM) NEW WELLS ONLINE (Operated) Delaware Basin $1,050 (+15% YoY) 115-125 Powder River $350 45-55 Eagle Ford $300 95-105(1) STACK $75 (-75% YoY) 10 New Devon Total $1,700 - $1,850 lowering top-end of 2020 capital guidance by $50 million Driven by improvements in Delaware costs & cycle times Low breakeven funding provides margin of safety (pg. 14) Flexibility to tailor activity to market conditions wolfcamp success driving capital shift to Delaware (pg. 18) Activity targeting Wolfcamp to double in 2020 Represents ~65% of total Delaware drilling program 2020 Outlook – Lowering Capital Spending Guidance Improved outlook underpinned by Delaware efficiencies New Devon 2020e E&P capital 60% DELAWARE 17% EAGLE FORD 20% POWDER RIVER 3% STACK REALLOCATING CAPITAL TO DELAWARE BASIN +15% CAPITAL (VS. 2019) $1.70-$1.85 E&P CAPITAL BILLION Previous Guidance ($1.7 - $1.9 billion) (1) Average working interest for 2020 is 40-45%.


Slide 12

2020 Outlook – Raising Per-Share Growth Targets lowering top-end of 2020 guidance range by $50 million G&A cost savings trending ahead of plan (reach $350 MM by 2021) Board authorized new $1 billion repurchase program E&P capital G&A Share count Simplified asset portfolio streamlines cost structure Driven by improvements in Delaware costs & cycle times Delaware, Powder River & Eagle Ford driving oil growth in 2020 raising 2020 growth outlook due to Delaware well performance Oil production raising dividend by 22% to quarterly rate of $0.11 per share Dividend Targeting payout ratio of 5%-10% of operating cash flow 2020 Guidance 161 – 163 (MBOD) $1,700 – $1,850 ($ in millions) $360 – $400 ($ in millions) vs. 2019 Key Messages (1) Based on midpoint of 2020 guidance range. (2) Represents % change on total reported amounts from 2019, which includes upstream results in discontinued operations. $53 MM Improvement 25% Improvement 16% Improvement On track to reduce share count by >35% by year-end 7.5% - 9.0% Growth (1) 335 – 345 (in millions by YE 2020) Improved Outlook ü ü $0.11 per share (quarterly rate) ü 22% Improvement ü (2)


Slide 13

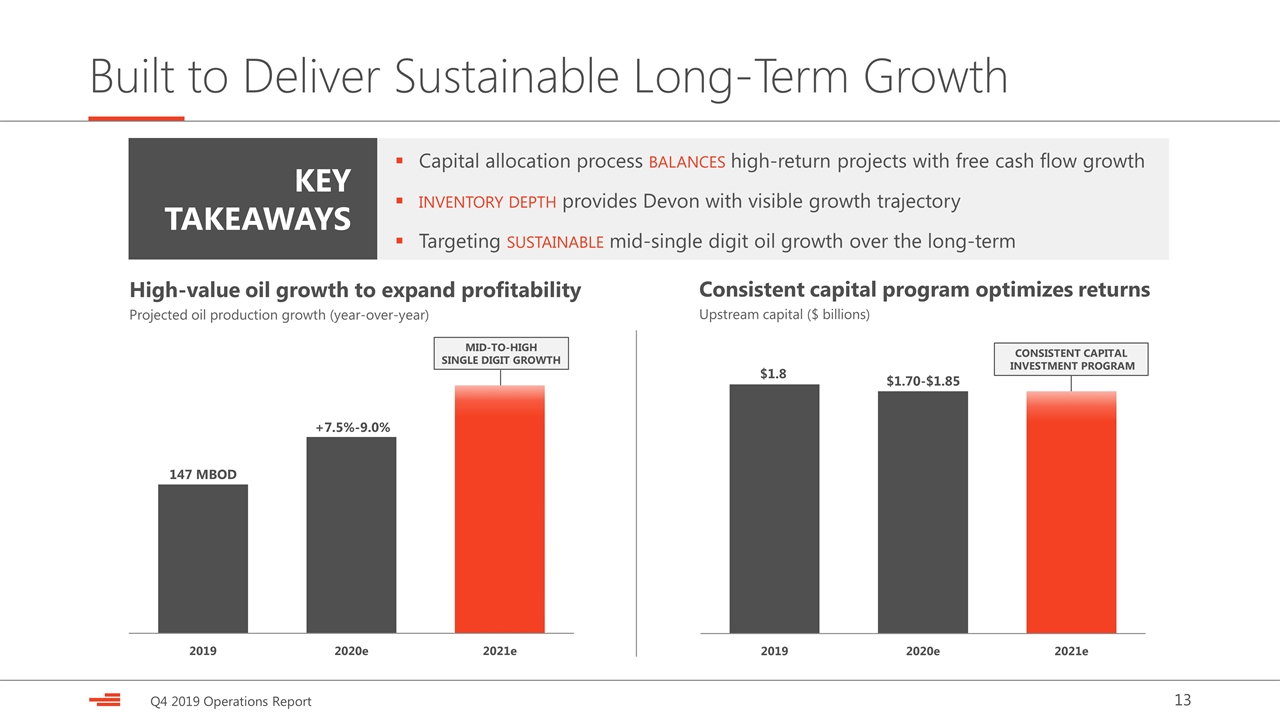
Consistent capital program optimizes returns Upstream capital ($ billions) High-value oil growth to expand profitability Projected oil production growth (year-over-year) Built to Deliver Sustainable Long-Term Growth +7.5%-9.0% $1.8 $1.70-$1.85 KEY TAKEAWAYS Capital allocation process balances high-return projects with free cash flow growth inventory depth provides Devon with visible growth trajectory Targeting sustainable mid-single digit oil growth over the long-term CONSISTENT CAPITAL INVESTMENT PROGRAM MID-TO-HIGH SINGLE DIGIT GROWTH


Slide 14

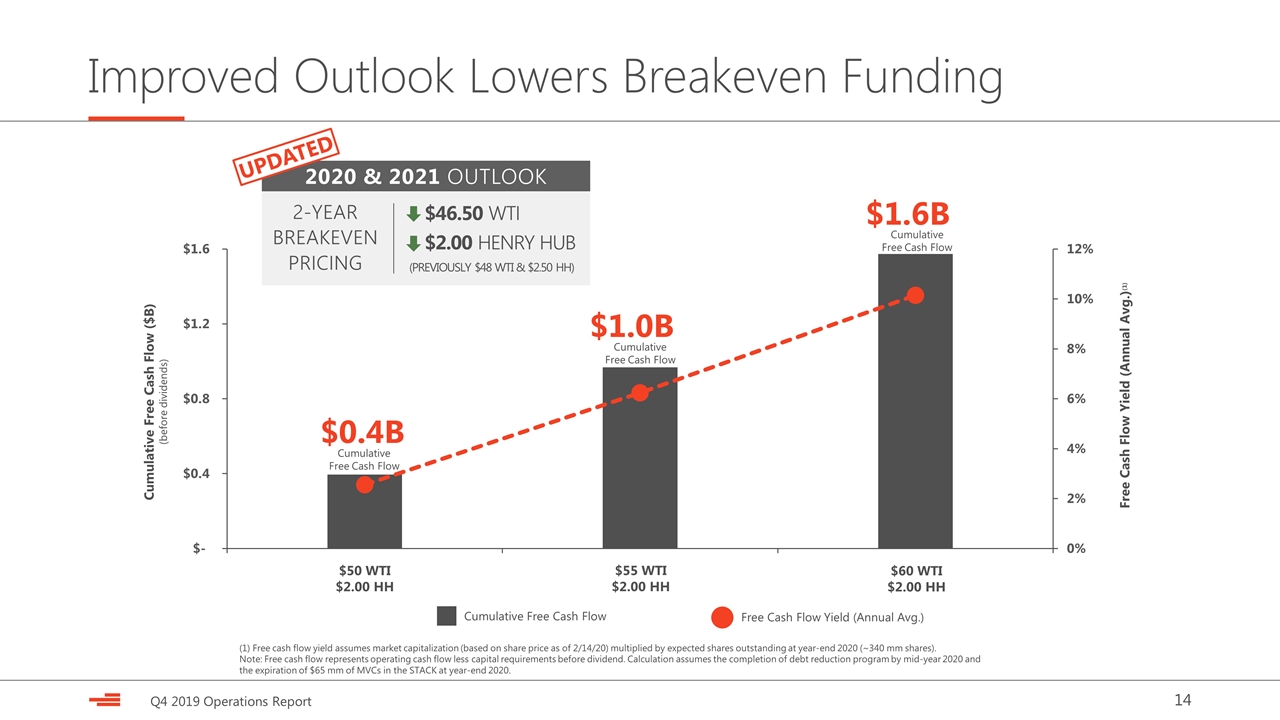
Improved Outlook Lowers Breakeven Funding $1.6B Cumulative Free Cash Flow ($B) (before dividends) $1.0B Free Cash Flow Yield (Annual Avg.)(1) Cumulative Free Cash Flow Free Cash Flow Yield (Annual Avg.) $0.4B Cumulative Free Cash Flow Cumulative Free Cash Flow Cumulative Free Cash Flow (1) Free cash flow yield assumes market capitalization (based on share price as of 2/14/20) multiplied by expected shares outstanding at year-end 2020 (~340 mm shares). Note: Free cash flow represents operating cash flow less capital requirements before dividend. Calculation assumes the completion of debt reduction program by mid-year 2020 and the expiration of $65 mm of MVCs in the STACK at year-end 2020. $50 WTI $2.00 HH $55 WTI $2.00 HH $60 WTI $2.00 HH 2020 & 2021 OUTLOOK UPDATED $46.50 WTI $2.00 HENRY HUB 2-YEAR BREAKEVEN PRICING (PREVIOUSLY $48 WTI & $2.50 HH)


Slide 15

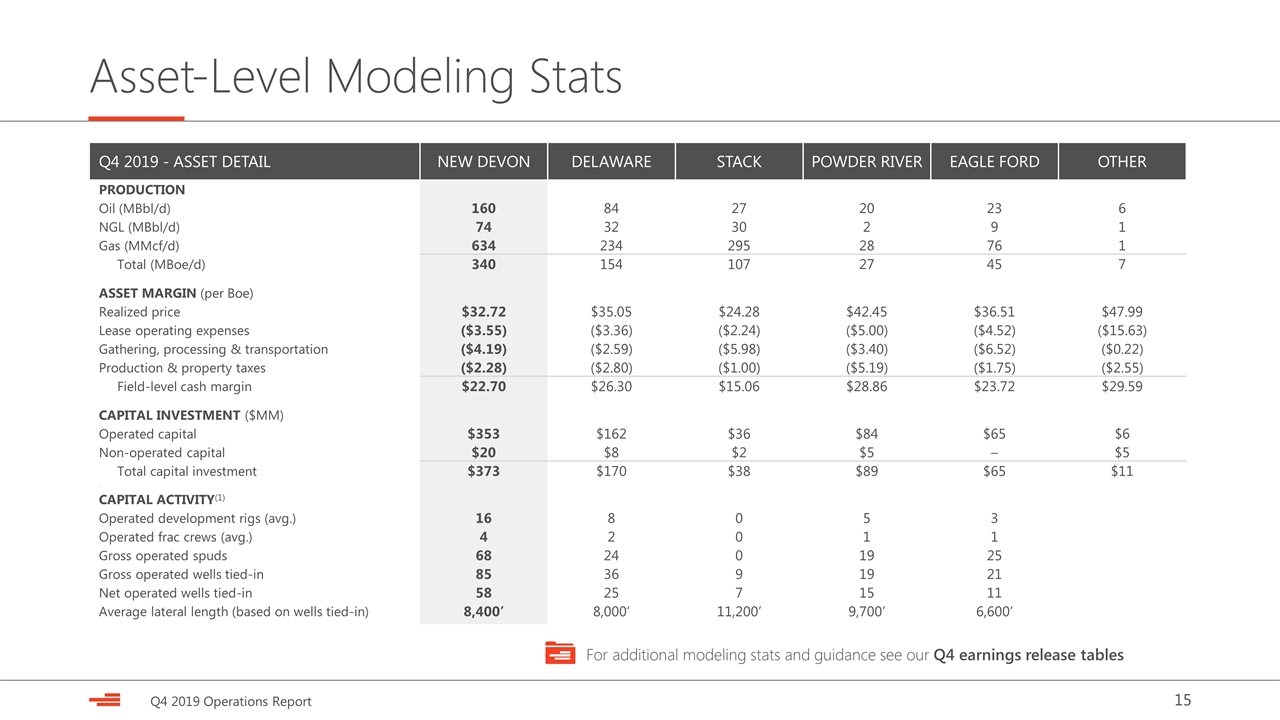
Q4 2019 - ASSET DETAIL NEW DEVON DELAWARE STACK POWDER RIVER EAGLE FORD OTHER PRODUCTION Oil (MBbl/d) 160 84 27 20 23 6 NGL (MBbl/d) 74 32 30 2 9 1 Gas (MMcf/d) 634 234 295 28 76 1 Total (MBoe/d) 340 154 107 27 45 7 ASSET MARGIN (per Boe) Realized price $32.72 $35.05 $24.28 $42.45 $36.51 $47.99 Lease operating expenses ($3.55) ($3.36) ($2.24) ($5.00) ($4.52) ($15.63) Gathering, processing & transportation ($4.19) ($2.59) ($5.98) ($3.40) ($6.52) ($0.22) Production & property taxes ($2.28) ($2.80) ($1.00) ($5.19) ($1.75) ($2.55) Field-level cash margin $22.70 $26.30 $15.06 $28.86 $23.72 $29.59 CAPITAL INVESTMENT ($MM) Operated capital $353 $162 $36 $84 $65 $6 Non-operated capital $20 $8 $2 $5 – $5 Total capital investment $373 $170 $38 $89 $65 $11 . CAPITAL ACTIVITY(1) Operated development rigs (avg.) 16 8 0 5 3 Operated frac crews (avg.) 4 2 0 1 1 Gross operated spuds 68 24 0 19 25 Gross operated wells tied-in 85 36 9 19 21 Net operated wells tied-in 58 25 7 15 11 Average lateral length (based on wells tied-in) 8,400’ 8,000’ 11,200’ 9,700’ 6,600’ Asset-Level Modeling Stats For additional modeling stats and guidance see our Q4 earnings release tables


Slide 16

Delaware Basin – Our Capital-Efficient Growth Engine Eddy New Mexico Lea POTATO BASIN THISTLE/GAUCHO RATTLESNAKE COTTON DRAW TODD Lusitano 2.0 (7,400’ laterals) 5 Bone Spring & Wolfcamp wells Avg. IP30: 3,100 BOED/well Cat Scratch Fever 2.0 (7,500’ laterals) 10 Bone Spring wells Avg. IP30: 3,000 BOED/well DERISKS MULTIPLE WOLFCAMP INTERVALS Thistle Cobra (10,900’ laterals) 7 Leonard & Wolfcamp wells Avg. IP30: 3,100 BOED/well CONFIRMS WOLFCAMP COMMERCIALITY 2ND BONE SPRING SWEET SPOT IN TODD Gas NGL Oil Spud Muffin (9,900’ laterals) 7 Bone Spring & Wolfcamp wells Avg. IP30: 2,700 BOED/well WOLFCAMP & CAT SCRATCH PROJECTS HEADLINE Q4 PERFORMANCE VALIDATES upper WOLFCAMP potential SUSTAINABLE GROWTH PLATFORM >250,000 NET SURFACE ACRES DEVELOPMENT EFFICIENCIES ACCELERATING (see pg. 17-18) HIGH-MARGIN GROWTH 82% PRODUCTION (MBOED) YEAR OVER YEAR


Slide 17

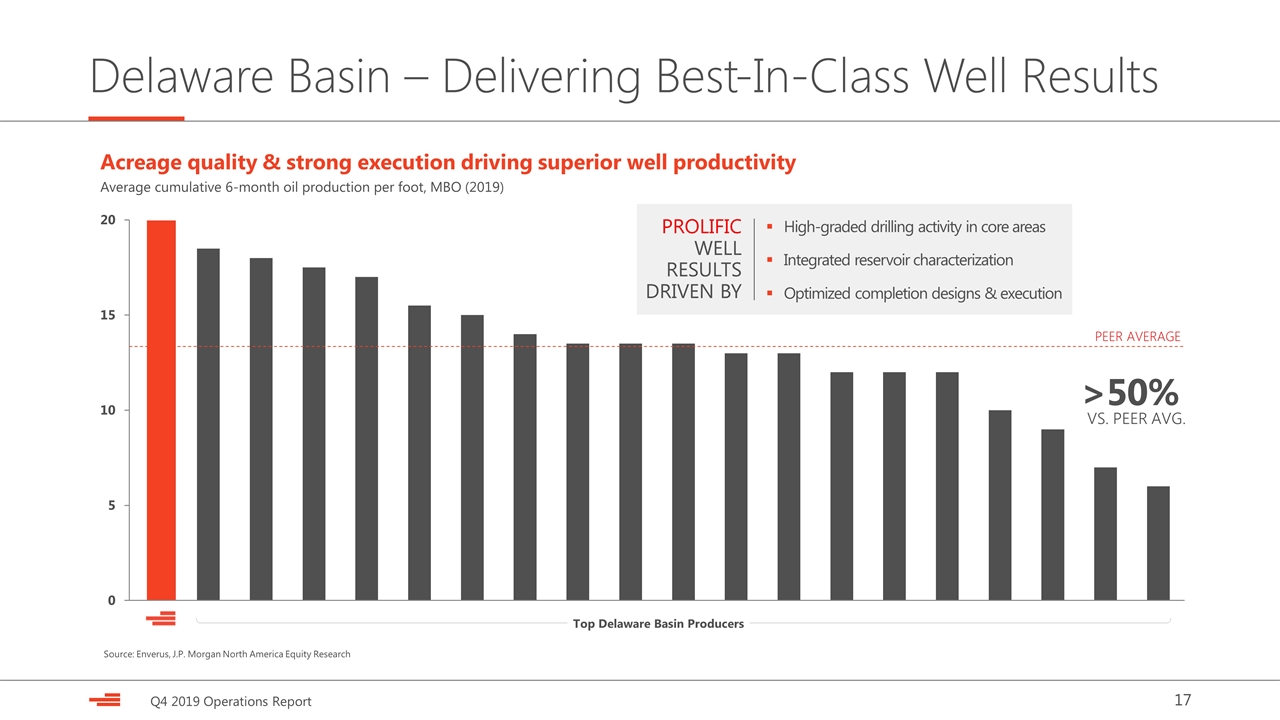
Delaware Basin – Delivering Best-In-Class Well Results PEER AVERAGE Source: Enverus, J.P. Morgan North America Equity Research Acreage quality & strong execution driving superior well productivity Average cumulative 6-month oil production per foot, MBO (2019) PROLIFIC WELL RESULTS DRIVEN BY >50% VS. PEER AVG. High-graded drilling activity in core areas Integrated reservoir characterization Optimized completion designs & execution Top Delaware Basin Producers


Slide 18

Delaware Basin – Step-Change in Operating Efficiencies Drilling and completion efficiencies accelerate Drilled and completed feet per day (Wolfcamp formation) 62% COMPLETION IMPROVEMENT Drilling Completions 48% DRILLING IMPROVEMENT 925 900 625 1,176 Operating scale driving per-unit costs lower Delaware Basin LOE & GP&T expense ($/BOE) 26% IMPROVEMENT Scalable infrastructure driving substantial cost savings Oil & produced water gathered on pipe (avoids trucking) Operate ~40 disposal wells and 8 water reuse facilities Delivering savings of >$2 per barrel of water Incremental per-unit improvements expected in 2020 725 Capital efficiency improvements continue to accelerate Wolfcamp driving capital efficiency improvements D&C costs ↓28% in Q4 2019 vs 2018 ($880/ft) Well design and cycle times driving enhanced results Lower facility costs to contribute to future cost savings


Slide 19

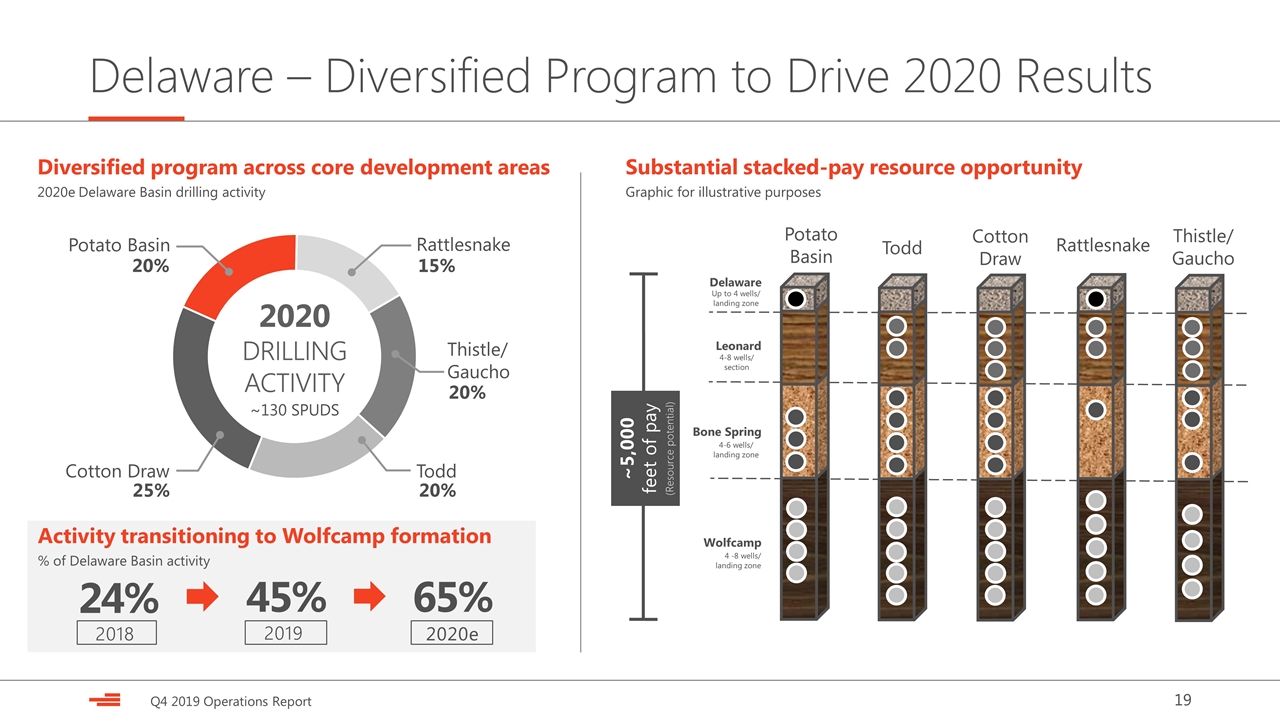
Delaware – Diversified Program to Drive 2020 Results Diversified program across core development areas 2020e Delaware Basin drilling activity Potato Basin Rattlesnake Thistle/ Gaucho Cotton Draw Todd 2020 DRILLING ACTIVITY 20% 25% 15% 20% 20% ~130 SPUDS Substantial stacked-pay resource opportunity Graphic for illustrative purposes Delaware Leonard Bone Spring Wolfcamp Thistle/ Gaucho Cotton Draw Todd Potato Basin Rattlesnake ~5,000 feet of pay (Resource potential) 4-8 wells/ section 4-6 wells/ landing zone 4 -8 wells/ landing zone Up to 4 wells/ landing zone Activity transitioning to Wolfcamp formation % of Delaware Basin activity 24% 45% 65% 2018 2019 2020e


Slide 20

Powder River Basin – Accelerating Niobrara Activity Emerging oil growth opportunity with high margins Strong production growth in Q4 (+54% vs. Q4 2018) Light-oil volumes reach 74% of product mix 19 wells online in the quarter (Avg. IP30: 1,300 BOED) Niobrara appraisal continues to progress (2 wells in Q4) Planning to double Niobrara activity in 2020 Expect to bring online ~15 new operated wells Appraisal program designed to derisk Atlas West (map) Preparing Atlas West for shift to development in 2021 Initial spacing tests confirm potential for 3-4 wells/unit Achieving operational efficiencies across the basin Capital costs improve by 20% per well (vs. 2018) Expect step-change in Niobrara D&C efficiency in 2020 Operating scale to drive LOE 5%-10% lower (vs. 2019) STACKED PAY POSITION IN OIL FAIRWAY NIOBRARA POTENTIAL 200,000 NET ACRES CAPITAL EFFICIENCIES SET TO ACCELERATE INCREASING NIOBRARA DRILLING ACTIVITY IN 2020 Converse OIL FAIRWAY Conley Draw 9-1X Avg. IP30: 1,300 BOED SDU Tillard 17-1X Avg. IP30: 1,200 BOED ATLAS WEST ATLAS EAST Q4 2019 Results Prior Activity Upcoming Activity NIOBRARA PROGRAM 2x INCREASE IN 2020 WELLS ONLINE SSU MLT 16-2X Avg. IP30: 1,400 BOED SDU Tillard 26 5X & 7X Avg. IP30: 1,050 BOED/well SDU Tillard 25-1X Avg. IP30: 1,500 BOED Tillard 18-1 (3 wells) Avg. IP30: 1,300 BOED/well PDU WJ Ranch 22-1X Avg. IP30: 1,100 BOED


Slide 21

Eagle Ford – Operational Momentum Established Strong production momentum heading into 2020 December 2019 exit rate: 53 MBOED 21 new wells online in quarter (Avg. IP30: 2,900 BOED) Well-control event impacted Q4 volumes (↓9 MBOED) Delivered sustainable well cost reductions in 2019 D&C cost savings reach >$1 million per well Drilling times improve ~30% vs. 2018 Completion & supply chain efficiencies lower costs Appraisal underway to unlock resource upside Successfully tested 16 wells/section in Q4 (+33%/section) Redevelopment & infill spacing tests planned in 1H’20 Expect ~10 refrac tests in 2020 (>700 potential locations) Austin Chalk delineation program progressing consistent activity of 3-4 rigs targeted in 2020 Strong momentum in 2020 Net production (MBOE) Significant capital savings 2019 drilling and completion cost savings $1.0 SAVINGS PER WELL MILLION WELL DESIGN & DRILLING COMPLETION EFFICIENCIES > SUPPLY CHAIN EAGLE FORD ACTIVITY Dewitt Karnes Q4 Eagle Ford Activity 21 wells (6,600’ laterals) Avg. IP30: 2,900 BOED/well Key 2019 Activity Upcoming Projects PRODUCTION EXIT RATE 53 MBOED DECEMBER 2019 Redevelopment Wells Avg. IP30: 2,200 BOED/well Muir Development 5 Lower Eagle Ford wells Avg. IP30: 3,600 BOED/well Q4 2019 Results AJ Baker A 2H Eagle Ford Refrac Avg. IP30 Uplift: 1,300 BOED


Slide 22

STACK – Dow JV Driving Improved Capital Efficiency Infill program achieving strong operational results 2019 developments optimized at 4-6 wells per unit Well cost savings reach 30% vs. legacy activity Q4 net production: 107 MBOED (54% liquids) top highlight: Fleenor project (IP30: 1,800 BOED/well) Drilling partnership formed with Dow (NYSE: DOW) Selling ½ working interest in 133 undrilled locations drilling carry of ~$100 million over next 4 years Dow to fund 65% of partnership capital requirements Initial project: 18-well Jacobs Row (Q2 2020 spud) Tailoring capital activity to current environment 2020 capital spend: ~$75 million (↓75% YoY) Plan to complete 10 Meramec DUC’s (1H 2020) Expect $65 million of MVC costs in 2020 (expires 12/31/20) STACK DEVELOPMENT ACTIVITY Blaine Canadian McCarthy (5 wells/DSU) Avg. IP30: 1,400 BOED/well Kingfisher 2020 Devon Activity Key Q4 2019 Results Fleenor (5 wells/DSU) Avg. IP30: 1,800 BOED/well Upcoming Dow Activity INFILL DRILLING DELIVERING CAPITAL EFFICIENCIES TAILORING ACTIVITY TO CURRENT ENVIRONMENT 2020 Dow Activity Jacobs Row (2 DSUs) - Q2 2020 spud - 18 Woodford wells - 10,000’ laterals FUTURE DOW FOCUS AREA (Beyond 2020) - Completing 10 DUC’s (1H20) - Activity not related to Dow 2020 Devon Activity DOW DRILLING JV ~ MILLION CARRY OVER NEXT 4 YEARS $100


Slide 23

Investor Contacts & Notices Investor Relations Contacts Scott CoodyChris Carr VP, Investor RelationsManager, Investor Relations 405-552-4735405-228-2496 Email: [email protected] Forward-Looking Statements This presentation includes “forward-looking statements” as defined by the Securities and Exchange Commission (the “SEC”). Such statements include those concerning strategic plans, our expectations and objectives for future operations, as well as other future events or conditions, and are often identified by use of the words and phrases “expects,” “believes,” “will,” “would,” “could,” “continue,” “may,” “aims,” “likely to be,” “intends,” “forecasts,” “projections,” “estimates,” “plans,” “expectations,” “targets,” “opportunities,” “potential,” “anticipates,” “outlook” and other similar terminology. All statements, other than statements of historical facts, included in this presentation that address activities, events or developments that Devon expects, believes or anticipates will or may occur in the future are forward-looking statements. Such statements are subject to a number of assumptions, risks and uncertainties, many of which are beyond our control. Consequently, actual future results could differ materially from our expectations due to a number of factors, including, but not limited to: the volatility of oil, gas and NGL prices; uncertainties inherent in estimating oil, gas and NGL Investor Notices reserves; the extent to which we are successful in acquiring and discovering additional reserves; the uncertainties, costs and risks involved in our operations, including as a result of employee misconduct; regulatory restrictions, compliance costs and other risks relating to governmental regulation, including with respect to environmental matters; risks related to regulatory, social and market efforts to address climate change;  risks related to our hedging activities; counterparty credit risks; risks relating to our indebtedness; cyberattack risks; our limited control over third parties who operate some of our oil and gas properties; midstream capacity constraints and potential interruptions in production; the extent to which insurance covers any losses we may experience; competition for assets, materials, people and capital; risks related to investors attempting to effect change; our ability to successfully complete mergers, acquisitions and divestitures; and any of the other risks and uncertainties discussed in our Form 10-K and other filings with the SEC.  All subsequent written and oral forward-looking statements attributable to Devon, or persons acting on its behalf, are expressly qualified in their entirety by the cautionary statements above. We assume no duty to update or revise our forward-looking statements based on new information, future events or otherwise. Use of Non-GAAP Information This presentation may include non-GAAP financial measures. Such non-GAAP measures are not alternatives to GAAP measures, and you should not consider these non-GAAP measures in isolation or as a substitute for analysis of our results as reported under GAAP. For additional disclosure regarding such non-GAAP measures, including reconciliations to their most directly comparable GAAP measure, please refer to Devon’s fourth-quarter 2019 earnings materials at www.devonenergy.com and 2019 Form 10-K filed with the SEC. Cautionary Note to Investors The SEC permits oil and gas companies, in their filings with the SEC, to disclose only proved, probable and possible reserves that meet the SEC's definitions for such terms, and price and cost sensitivities for such reserves, and prohibits disclosure of resources that do not constitute such reserves. This presentation may contain certain terms, such as high-return inventory, potential locations, risked and unrisked locations, estimated ultimate recovery (EUR), exploration target size and other similar terms. These estimates are by their nature more speculative than estimates of proved, probable and possible reserves and accordingly are subject to substantially greater risk of being actually realized. Investors are urged to consider closely the disclosure in our Form 10-K, available at www.devonenergy.com or the SEC’s website.

Exhibit 99.3


LOGO

SUPPLEMENTAL TABLES

FOURTH-QUARTER AND FULL-YEAR 2019


TABLE OF CONTENTS:    PAGE:  

Income Statement

     2  

Cash Flow Statement

     3  

Balance Sheet

     4  

Production by Asset

     5  

Capital, Costs Incurred and Reserves Reconciliation

     6  

Well Activity by Asset

     7  

Realized Price by Asset

     8  

Per-Unit Cash Margin by Asset

     9  

Non-GAAP Core Earnings

     10  

Non-GAAP EBITDAX, Net Debt and Free Cash Flow

     11  


CONSOLIDATED STATEMENTS OF EARNINGS

            
(in millions, except per share amounts)    2019     2018  
     Quarter 4     Quarter 3     Quarter 2     Quarter 1     Full Year     Quarter 4  

Upstream revenues (1)

   $ 919     $ 1,046     $ 1,076     $ 314     $ 3,355     $ 2,416  

Marketing and midstream revenues

     670       700       730       765       2,865       1,114  


Total revenues

     1,589       1,746       1,806       1,079       6,220       3,530  


Production expenses (2)

     324       294       296       283       1,197       295  

Exploration expenses

     29       18       7       4       58       24  

Marketing and midstream expenses

     665       684       713       750       2,812       1,105  

Depreciation, depletion and amortization

     382       381       374       360       1,497       318  

Asset dispositions

     —         (1     (2     (45     (48     (242

General and administrative expenses

     119       107       114       135       475       136  

Financing costs, net

     64       60       66       60       250       59  

Restructuring and transaction costs

     11       10       12       51       84       6  

Other expenses

     16       3       7       (22     4       30  


Total expenses

     1,610       1,556       1,587       1,576       6,329       1,731  


Earnings (loss) from continuing operations before income taxes

     (21     190       219       (497     (109     1,799  

Income tax expense (benefit)

     (33     54       68       (119     (30     421  


Net earnings (loss) from continuing operations

     12       136       151       (378     (79     1,378  

Net earnings (loss) from discontinued operations, net of taxes

     (652     (27     344       61       (274     (229


Net earnings (loss)

     (640     109       495       (317     (353     1,149  

Net earnings attributable to noncontrolling interests

     2       —         —         —         2       —    


Net earnings (loss) attributable to Devon

   $ (642   $ 109     $ 495     $ (317   $ (355   $ 1,149  


Basic net earnings (loss) per share:


Continuing operations

   $ 0.03     $ 0.34     $ 0.37     $ (0.89   $ (0.21   $ 3.00  

Discontinued operations

     (1.73     (0.07     0.83       0.15       (0.68     (0.50


Basic net earnings (loss) per share

   $ (1.70   $ 0.27     $ 1.20     $ (0.74   $ (0.89   $ 2.50  


Diluted net earnings (loss) per share:


Continuing operations

   $ 0.03     $ 0.34     $ 0.37     $ (0.89   $ (0.21   $ 2.98  

Discontinued operations

     (1.73     (0.07     0.82       0.15       (0.68     (0.50


Diluted net earnings (loss) per share

   $ (1.70   $ 0.27     $ 1.19     $ (0.74   $ (0.89   $ 2.48  


Weighted average common shares outstanding:


Basic

     383       397       415       434       407       459  

Diluted

     385       399       417       434       407       462  


(1) UPSTREAM REVENUES               
(in millions)    2019     2018  
     Quarter 4     Quarter 3      Quarter 2      Quarter 1     Full Year     Quarter 4  

Oil, gas and NGL sales

   $ 1,035     $ 919      $ 936      $ 919     $ 3,809     $ 983  

Derivative cash settlements

     42       71        23        34       170       (16

Derivative valuation changes

     (158     56        117        (639     (624     1,449  


Upstream revenues

   $ 919     $ 1,046      $ 1,076      $ 314     $ 3,355     $ 2,416  


(2) PRODUCTION EXPENSES                  
(in millions)    2019      2018  
     Quarter 4      Quarter 3      Quarter 2      Quarter 1      Full Year      Quarter 4  

Lease operating expense

   $ 120      $ 118      $ 114      $ 110      $ 462      $ 125  

Gathering, processing & transportation

     131        112        111        109        463        105  

Production taxes

     69        58        64        60        251        61  

Property taxes

     4        6        7        4        21        4  


Production expenses

   $ 324      $ 294      $ 296      $ 283      $ 1,197      $ 295  


2


CONSOLIDATED STATEMENTS OF CASH FLOWS

(in millions)


   2019  
     Quarter 4     Quarter 3     Quarter 2     Quarter 1     Full Year  

Cash flows from operating activities:


Net earnings (loss)

   $ (640   $ 109     $ 495     $ (317   $ (353

Reconciliation of net earnings (loss) to net cash from operating activities:


Net (earnings) loss from discontinued operations, net of income taxes

     652       27       (344     (61     274  

Depreciation, depletion and amortization

     382       381       374       360       1,497  

Leasehold impairments

     3       13       1       1       18  

Accretion on discounted liabilities

     8       8       8       9       33  

Total (gains) losses on commodity derivatives

     116       (127     (140     605       454  

Cash settlements on commodity derivatives

     41       71       23       31       166  

Gains on asset dispositions

     —         (1     (2     (45     (48

Deferred income tax expense (benefit)

     (27     52       65       (115     (25

Share-based compensation

     24       24       23       44       115  

Other

     2       2       4       (14     (6

Changes in assets and liabilities, net

     18       36       (75     (61     (82


Net cash from operating activities - continuing operations

     579       595       432       437       2,043  


Cash flows from investing activities:


Capital expenditures

     (408     (526     (486     (490     (1,910

Acquisitions of property and equipment

     (3     (5     (13     (10     (31

Divestitures of property and equipment

     43       9       28       310       390  


Net cash from investing activities - continuing operations

     (368     (522     (471     (190     (1,551


Cash flows from financing activities:


Repayments of long-term debt

     —         —         —         (162     (162

Repurchases of common stock

     (103     (560     (187     (999     (1,849

Dividends paid on common stock

     (34     (35     (37     (34     (140

Contributions from noncontrolling interests

     116       —         —         —         116  

Shares exchanged for tax withholdings and other

     (3     (1     (3     (19     (26


Net cash from financing activities - continuing operations

     (24     (596     (227     (1,214     (2,061


Net change in cash, cash equivalents and restricted cash of continuing operations

     187       (523     (266     (967     (1,569


Cash flows from discontinued operations:


Operating activities

     (8     (95     190       (59     28  

Investing activities

     —         (5     2,536       (59     2,472  

Financing activities

     —         (1,571     —         (7     (1,578

Effect of exchange rate changes on cash

     9       (3     38       1       45  


Net change in cash, cash equivalents and restricted cash of discontinued operations

     1       (1,674     2,764       (124     967  


Net change in cash, cash equivalents and restricted cash

     188       (2,197     2,498       (1,091     (602

Cash, cash equivalents and restricted cash at beginning of period

     1,656       3,853       1,355       2,446       2,446  


Cash, cash equivalents and restricted cash at end of period

   $ 1,844     $ 1,656     $ 3,853     $ 1,355     $ 1,844  


Reconciliation of cash, cash equivalents and restricted cash:


Cash and cash equivalents

   $ 1,464     $ 1,375     $ 3,470     $ 1,327     $ 1,464  

Cash restricted for discontinued operations

     380       280       370       —         380  

Restricted cash included in other current assets

     —         1       13       28       —    


Total cash, cash equivalents and restricted cash

   $ 1,844     $ 1,656     $ 3,853     $ 1,355     $ 1,844  


3


CONSOLIDATED BALANCE SHEETS

(in millions)


   December 31,     December 31,  
     2019     2018  

Current assets:


Cash and cash equivalents

   $ 1,464     $ 2,414  

Cash restricted for discontinued operations

     380       —    

Accounts receivable

     832       812  

Current assets associated with discontinued operations

     896       331  

Other current assets

     279       880  


Total current assets

     3,851       4,437  

Oil and gas property and equipment, based on successful efforts accounting, net

     7,558       7,430  

Other property and equipment, net

     1,035       1,032  


Total property and equipment, net

     8,593       8,462  

Goodwill

     753       753  

Right-of-use assets

     243       —    

Other long-term assets

     196       276  

Long-term assets associated with discontinued operations

     81       5,638  


Total assets

   $ 13,717     $ 19,566  


Current liabilities:


Accounts payable

   $ 428     $ 530  

Revenues and royalties payable

     730       722  

Short-term debt

     —         162  

Current liabilities associated with discontinued operations

     459       492  

Other current liabilities

     310       320  


Total current liabilities

     1,927       2,226  


Long-term debt

     4,294       4,292  

Lease liabilities

     244       —    

Asset retirement obligations

     380       468  

Other long-term liabilities

     426       411  

Long-term liabilities associated with discontinued operations

     185       2,454  

Deferred income taxes

     341       529  

Stockholders’ equity:


Common stock

     38       45  

Additional paid-in capital

     2,735       4,486  

Retained earnings

     3,148       3,650  

Accumulated other comprehensive earnings (loss)

     (119     1,027  

Treasury stock, at cost, 1.0 million shares in 2018

     —         (22


Total stockholders’ equity attributable to Devon

     5,802       9,186  

Noncontrolling interests

     118       —    


Total equity

     5,920       9,186  


Total liabilities and equity

   $ 13,717     $ 19,566  


Common shares outstanding

     382       450  


4


PRODUCTION TREND


     2019      2018  
     Quarter 4      Quarter 3      Quarter 2      Quarter 1      Quarter 4  

Oil (MBbls/d)


Delaware Basin

     84        70        67        60        45  

STACK

     27        32        31        32        31  

Powder River Basin

     20        18        15        15        13  

Eagle Ford

     23        22        23        25        30  

Other

     6        6        6        6        6  


New Devon

     160        148        142        138        125  

Divest assets

     3        3        2        3        7  


Total

     163        151        144        141        132  


Natural gas liquids (MBbls/d)


Delaware Basin

     32        28        27        23        18  

STACK

     30        37        40        35        37  

Powder River Basin

     2        2        2        2        2  

Eagle Ford

     9        11        12        12        15  

Other

     1        1        1        1        1  


New Devon

     74        79        82        73        73  

Divest assets

     —          —          —          1        1  


Total

     74        79        82        74        74  


Gas (MMcf/d)


Delaware Basin

     234        167        158        146        127  

STACK

     295        317        313        333        343  

Powder River Basin

     28        28        22        18        20  

Eagle Ford

     76        75        81        83        95  

Other

     1        1        1        1        2  


New Devon

     634        588        575        581        587  

Divest assets

     3        3        3        7        14  


Total

     637        591        578        588        601  


Total oil equivalent (MBoe/d)


Delaware Basin

     154        127        120        107        84  

STACK

     107        121        124        123        126  

Powder River Basin

     27        25        21        21        18  

Eagle Ford

     45        45        49        50        61  

Other

     7        7        7        7        6  


New Devon

     340        325        321        308        295  

Divest assets

     3        3        3        5        11  


Total

     343        328        324        313        306  


     2019      2018  
     Quarter 4      Quarter  3      Quarter 2      Quarter  1      Quarter  4  

Barnett divest assets (discontinued operations)


Oil (MBbls/d)

     —          —          1        1        1  

Natural gas liquids (MBbls/d)

     30        30        30        30        31  

Gas (MMcf/d)

     408        414        420        432        443  

Total oil equivalent (MBoe/d)

     98        100        100        103        105  


5


CAPITAL EXPENDITURES

(in millions)


   2019      2018  
     Quarter 4      Quarter 3      Quarter 2      Quarter 1      Quarter 4  

Delaware Basin

   $ 170      $ 262      $ 235      $ 240      $ 253  

STACK

     38        67        94        112        195  

Powder River Basin

     89        89        87        48        56  

Eagle Ford

     65        90        53        48        32  

Other

     11        11        9        9        6  


New Devon upstream capital

     373        519        478        457        542  

Divest assets upstream capital - US

     1        1        3        3        3  


Total upstream capital

     374        520        481        460        545  

Land and other acquisitions

     3        12        14        7        35  

Other

     14        30        22        6        6  


Total capital

   $ 391      $ 562      $ 517      $ 473      $ 586  


COSTS INCURRED

(in millions)


     Year Ended December 31,  
     2019      2018  

Property acquisition costs:


Proved properties

   $ —        $ 2  

Unproved properties

     35        70  

Exploration costs

     312        679  

Development costs

     1,499        1,505  


Costs incurred

   $ 1,846      $ 2,256  


RESERVES RECONCILIATION


     Oil
(MMBbls)
     Gas
(Bcf)
     NGL
(MMBbls)
     Total
(MMBoe)
 

As of December 31, 2018:


Proved developed

     196        1,427        166        600  

Proved undeveloped

     100        375        61        223  


Total Proved

     296        1,802        227        823  


Revisions due to prices

     (7      (86      (6      (28

Revisions other than price

     (13      (50      (9      (31

Extensions and discoveries

     76        269        39        160  

Purchase of reserves

     3        7        1        6  

Production

     (55      (219      (28      (119

Sale of reserves

     (24      (102      (13      (54


As of December 31, 2019:


Proved developed

     198        1,344        167        589  

Proved undeveloped

     78        277        44        168  


Total Proved

     276        1,621        211        757  


6


GROSS OPERATED SPUDS


     2019      2018  
      Quarter 4       Quarter 3      Quarter 2      Quarter 1      Quarter 4  

Delaware Basin

     24        38        23        39        31  

STACK

     —          4        16        18        17  

Powder River Basin

     19        14        17        9        12  

Eagle Ford

     25        18        31        12        5  


New Devon

     68        74        87        78        65  


GROSS OPERATED WELLS TIED-IN


     2019      2018  
      Quarter 4       Quarter 3      Quarter 2      Quarter 1      Quarter 4  

Delaware Basin

     36        34        28        25        27  

STACK

     9        16        21        29        25  

Powder River Basin

     19        18        6        3        8  

Eagle Ford

     21        —          9        18        10  


New Devon

     85        68        64        75        70  


NET OPERATED WELLS TIED-IN


     2019      2018  
      Quarter 4       Quarter 3      Quarter 2      Quarter 1      Quarter 4  

Delaware Basin

     25        30        24        18        21  

STACK

     7        7        14        20        18  

Powder River Basin

     15        6        12        2        6  

Eagle Ford

     11        —          4        9        5  


New Devon

     58        43        54        49        50  


AVERAGE LATERAL LENGTH

(based on wells tied-in)


     2019      2018  
     Quarter 4      Quarter 3      Quarter 2      Quarter 1      Quarter 4  

Delaware Basin

     8,000’        9,700’        7,500’        8,500’        8,800’  

STACK

     11,200’        9,600’        9,000’        9,000’        8,400’  

Powder River Basin

     9,700’        9,500’        9,500’        10,000’        9,500’  

Eagle Ford

     6,600’        N/A        6,000’        6,000’        6,500’  


New Devon

     8,400’        9,600’        8,000’        8,000’        8,400’  


7


BENCHMARK PRICES

(average prices)


     2019      2018  
     Quarter 4      Quarter 3      Quarter 2      Quarter 1      Quarter 4  

Oil ($/Bbl) - West Texas Intermediate (Cushing)

   $ 57.02      $ 56.34      $ 59.85      $ 54.88      $ 58.80  

Natural Gas ($/Mcf) - Henry Hub

   $ 2.50      $ 2.23      $ 2.64      $ 3.15      $ 3.65  

NGL ($/Bbl) - Mont Belvieu Blended

   $ 18.69      $ 16.18      $ 19.05      $ 22.94      $ 26.30   

REALIZED PRICES


     2019     2018  
     Quarter 4      Quarter 3      Quarter 2     Quarter 1     Quarter 4  

Oil (Per Bbl)


Delaware Basin

   $      56.23      $ 53.85      $ 55.54     $ 49.48     $ 49.04  

STACK

     55.71        54.47        57.67       52.82       58.83  

Powder River Basin

     52.02        52.50        56.79       49.21       55.62  

Eagle Ford

     55.11        57.77        61.60       59.45       65.46  

Other

     56.52        54.57        56.12       48.77       48.09  


New Devon

     55.46        54.43        57.17       51.99       56.08  

U.S. divest assets

     52.21        52.79        53.01       45.60       49.94  


Realized price without hedges

     55.41        54.40        57.11       51.83       55.77  

Cash settlements

     1.48        2.18        (0.41     3.65       0.79  


Realized price, including cash settlements

   $ 56.89      $ 56.58      $ 56.70     $ 55.48     $ 56.56  


Natural gas liquids (Per Bbl)


Delaware Basin

   $ 13.30      $ 10.27      $ 13.77     $ 17.64     $ 21.24  

STACK

     17.47        12.61        15.55       18.43       22.57  

Powder River Basin

     17.36        15.01        17.74       19.64       22.76  

Eagle Ford

     18.84        13.77        15.84       19.77       23.90  

Other

     14.49        12.79        9.80       11.94       16.26  


New Devon

     15.81        12.02        15.00       18.33       22.42  

U.S. divest assets

     N/M        12.50        20.40       21.36       17.12  


Realized price without hedges

     15.79        12.02        15.00       18.36       22.32  

Cash settlements

     1.75        2.55        1.40       0.67       0.25  


Realized price, including cash settlements

   $ 17.54      $ 14.57      $ 16.40     $ 19.03     $ 22.57  


Gas (Per Mcf)


Delaware Basin

   $ 1.22      $ 0.90      $ (0.05   $ 1.84     $ 1.68  

STACK

     1.81        1.54        1.74       2.76       2.94  

Powder River Basin

     2.51        1.96        2.16       2.92       3.85  

Eagle Ford

     2.52        2.26        2.56       3.39       3.82  

Other

     0.88        0.99        0.21       1.10       1.28  


New Devon

     1.71        1.47        1.37       2.62       2.84  

U.S. divest assets

     N/M        2.56        2.33       2.30       2.01  


Realized price without hedges

     1.70        1.47        1.38       2.62       2.82  

Cash settlements

     0.13        0.41        0.34       (0.31     (0.49


Realized price, including cash settlements

   $ 1.83      $ 1.88      $ 1.72     $ 2.31     $ 2.33  


Total oil equivalent (Per Boe)


Delaware Basin

   $ 35.05      $ 33.48      $ 33.94     $ 33.92     $ 33.30  

STACK

     24.28        22.07        23.96       26.65       29.40  

Powder River Basin

     42.45        41.20        45.44       41.69       46.27  

Eagle Ford

     36.51        35.10        37.50       39.41       44.20  

Other

     47.99        46.41        47.43       42.03       41.53  


New Devon

     32.72        30.32        31.68       32.60       34.85  

U.S. divest assets

     43.20        45.35        44.71       35.49       36.82  


Realized price without hedges

     32.82        30.47        31.79       32.65       34.92  

Cash settlements

     1.32        2.34        0.79       1.22       (0.56


Realized price, including cash settlements

   $ 34.14      $ 32.81      $ 32.58     $ 33.87     $ 34.36  


8


BENCHMARK PRICES

(average prices)

                                                                                                             
     2019      2018  
     Quarter 4      Quarter 3      Quarter 2      Quarter 1      Quarter 4  

Oil ($/Bbl) - West Texas Intermediate (Cushing)

   $ 57.02      $ 56.34      $ 59.85      $ 54.88      $ 58.80  

Natural Gas ($/Mcf) - Henry Hub

   $ 2.50      $ 2.23      $ 2.64      $ 3.15      $ 3.65  

NGL ($/Bbl) - Mont Belvieu Blended

   $ 18.69      $ 16.18      $ 19.05      $ 22.94      $ 26.30  

FIELD-LEVEL CASH MARGIN (per Boe)


     2019     2018  
     Quarter 4     Quarter 3     Quarter 2     Quarter 1     Quarter 4  

Delaware Basin


Realized price

   $ 35.05     $ 33.48     $ 33.94     $ 33.92     $ 33.30  

Lease operating expenses

     (3.36     (4.17     (4.33     (4.58     (6.03

Gathering, processing & transportation

     (2.59     (2.20     (2.31     (2.23     (2.06

Production & property taxes

     (2.80     (2.69     (2.84     (2.72     (2.73


Field-level cash margin

   $ 26.30     $ 24.42     $ 24.46     $ 24.39     $ 22.48  


STACK


Realized price

   $ 24.28     $ 22.07     $ 23.96     $ 26.65     $ 29.40  

Lease operating expenses

     (2.24     (2.08     (1.84     (1.87     (1.84

Gathering, processing & transportation

     (5.98     (5.05     (5.10     (5.18     (4.62

Production & property taxes

     (1.00     (0.86     (1.25     (1.33     (1.30


Field-level cash margin

   $ 15.06     $ 14.08     $ 15.77     $ 18.27     $ 21.64  


Powder River Basin


Realized price

   $ 42.45     $ 41.20     $ 45.44     $ 41.69     $ 46.27  

Lease operating expenses

     (5.00     (7.28     (6.95     (8.00     (6.58

Gathering, processing & transportation

     (3.40     (2.07     (1.71     (1.70     (1.89

Production & property taxes

     (5.19     (4.73     (4.99     (4.97     (5.39


Field-level cash margin

   $ 28.86     $ 27.12     $ 31.79     $ 27.02     $ 32.41  


Eagle Ford


Realized price

   $ 36.51     $ 35.10     $ 37.50     $ 39.41     $ 44.20  

Lease operating expenses

     (4.52     (3.20     (2.85     (2.81     (2.69

Gathering, processing & transportation

     (6.52     (5.93     (5.59     (5.84     (5.72

Production & property taxes

     (1.75     (1.95     (2.43     (2.23     (2.44


Field-level cash margin

   $ 23.72     $ 24.02     $ 26.63     $ 28.53     $ 33.35  


Other


Realized price

   $ 47.99     $ 46.41     $ 47.43     $ 42.03     $ 41.53  

Lease operating expenses

     (15.63     (15.06     (20.34     (17.05     (17.29

Gathering, processing & transportation

     (0.22     (0.29     (0.09     (0.31     (0.22

Production & property taxes

     (2.55     (3.30     (4.33     (3.28     (3.73


Field-level cash margin

   $ 29.59     $ 27.76     $ 22.67     $ 21.39     $ 20.29  


New Devon - Total


Realized price

   $ 32.72     $ 30.32     $ 31.68     $ 32.60     $ 34.85  

Lease operating expenses

     (3.55     (3.73     (3.66     (3.72     (3.85

Gathering, processing & transportation

     (4.19     (3.74     (3.80     (3.92     (3.85

Production & property taxes

     (2.28     (2.06     (2.34     (2.25     (2.25


Field-level cash margin

   $ 22.70     $ 20.79     $ 21.88     $ 22.71     $ 24.90  


9


NON-GAAP FINANCIAL MEASURES

This press release includes non-GAAP financial measures. These non-GAAP measures are not alternatives to GAAP measures, and you should not consider these non-GAAP measures in isolation or as a substitute for analysis of our results as reported under GAAP. Below is additional disclosure regarding each of the non-GAAP measures used in this press release, including reconciliations to their most directly comparable GAAP measure.

CORE EARNINGS

Devon’s reported net earnings include items of income and expense that are typically excluded by securities analysts in their published estimates of the company’s financial results. Accordingly, the company also uses the measures of core earnings and core earnings per share attributable to Devon. Devon believes these non-GAAP measures facilitate comparisons of its performance to earnings estimates published by securities analysts. Devon also believes these non-GAAP measures can facilitate comparisons of its performance between periods and to the performance of its peers. The following table summarizes the effects of these items on fourth-quarter 2019 earnings.


     Quarter Ended December 31, 2019  
(in millions, except per share amounts)    Before-tax      After-tax      After
Noncontrolling
Interests
     Per Diluted
Share
 

Continuing Operations


Net earnings (GAAP)

   $ (21    $ 12      $ 10      $ 0.03  

Adjustments:


Asset and exploration impairments

     3        3        3        0.01  

Deferred tax asset valuation allowance

     —          (2      (2      (0.01

Fair value changes in financial instruments

     159        121        121        0.31  

Restructuring and transaction costs

     11        8        8        0.02  


Core earnings (Non-GAAP)

   $ 152      $ 142      $ 140      $ 0.36  


Discontinued Operations


Net loss (GAAP)

   $ (724    $ (652    $ (652    $ (1.73

Adjustments:


Asset dispositions

     —          54        54        0.14  

Asset and exploration impairments

     748        586        586        1.55  

Deferred tax asset valuation allowance

     —          1        1        0.01  

Foreign currency and other

     (5      (4      (4      (0.01

Restructuring and transaction costs

     4        3        3        0.01  


Core loss (Non-GAAP)

   $ 23      $ (12    $ (12    $ (0.03


Total


Net loss (GAAP)

   $ (745    $ (640    $ (642    $ (1.70

Adjustments:


Continuing Operations

     173        130        130        0.33  

Discontinued Operations

     747        640        640        1.70  


Core earnings (Non-GAAP)

   $ 175      $ 130      $ 128      $ 0.33  


10


EBITDAX

Devon believes EBITDAX provides information useful in assessing operating and financial performance across periods. Devon computes EBITDAX as net earnings from continuing operations before income tax expense; financing costs, net; exploration expenses; depreciation, depletion and amortization; asset impairments; asset disposition gains and losses; non-cash share-based compensation; non-cash valuation changes for derivatives and financial instruments; restructuring and transaction costs; accretion on discounted liabilities; and other items not related to normal operations. EBITDAX as defined by Devon may not be comparable to similarly titled measures used by other companies and should be considered in conjunction with net earnings from continuing operations.


(in millions)    Q4’19     Q3’19     Q2’19     Q1’19     2019  

Net earnings (loss) (GAAP)

   $ (640   $ 109     $ 495     $ (317   $ (353

Net (earnings) loss from discontinued operations, net of tax

     652       27       (344     (61     274  

Financing costs, net

     64       60       66       60       250  

Income tax expense (benefit)

     (33     54       68       (119     (30

Exploration expenses

     29       18       7       4       58  

Depreciation, depletion and amortization

     382       381       374       360       1,497  

Asset dispositions

     —         (1     (2     (45     (48

Share-based compensation

     19       20       21       23       83  

Derivative and financial instrument non-cash valuation changes

     159       (57     (117     638       623  

Restructuring and transaction costs

     11       10       12       51       84  

Accretion on discounted liabilities and other

     14       5       8       (22     5  


EBITDAX (Non-GAAP)

   $ 657     $ 626     $ 588     $ 572     $ 2,443  


NET DEBT

Devon defines net debt as debt less cash, cash equivalents and cash restricted for discontinued operations. Devon believes that netting these sources of cash against debt provides a clearer picture of the future demands on cash from Devon to repay debt.


(in millions)    December 31,
2019
     December 31,
2015
 

Total debt (GAAP)

   $ 4,294      $ 13,032  

Less:


Cash and cash equivalents

     (1,464      (2,310

Cash restricted for discontinued operations

     (380      —    


Net debt (Non-GAAP)

   $ 2,450      $ 10,722  


FREE CASH FLOW

Devon defines free cash flow as total operating cash flow less capital expenditures. Devon believes that free cash flow provides a useful measure of available cash generated by operating activities for other investing and financing activities.


(in millions)    Quarter Ended
December 31, 2019
 

Total operating cash flow (GAAP)

   $ 579  

Less capital expenditures:


Capital expenditures

     (408


Free cash flow (Non-GAAP)

   $ 171  


11


LOGO

GUIDANCE

FIRST-QUARTER AND FULL-YEAR 2020

PRODUCTION GUIDANCE


     Quarter 1      Full Year  
     Low      High      Low      High  

Oil (MBbls/d)

     158        163        161        163  

Natural gas liquids (MBbls/d)

     72        76        72        76  

Gas (MMcf/d)

     590        620        570        600  


Total oil equivalent (MBoe/d)

     328        342        328        339  


PRICE REALIZATIONS GUIDANCE


     Quarter 1     Full Year  
     Low     High     Low     High  

Oil - % of WTI

     95     100     95     100

NGL - realized price

   $ 13.00     $ 15.00     $ 13.00     $ 15.00  

Natural gas - % of Henry Hub

     55     65     50     70

OTHER GUIDANCE ITEMS


     Quarter 1     Full Year  
($ millions, except Boe and %)    Low     High     Low     High  

Marketing & midstream operating profit

   $ (5   $ 5     $ (10   $ 10  

LOE & GP&T per BOE(1)

   $ 8.10 (1)    $ 8.30 (1)    $ 8.00 (1)    $ 8.20 (1) 

Production & property taxes as % of upstream sales

     7.8     8.0     7.8     8.0

Exploration expenses

   $ 5     $ 10     $ 15     $ 25  

Depreciation, depletion and amortization

   $ 400     $ 425     $ 1,600     $ 1,700  

General & administrative expenses

   $ 110     $ 120     $ 360     $ 400  

Financing costs, net

   $ 60     $ 70     $ 250     $ 270  

Other expenses

   $ 10     $ 20     $ 40     $ 50  

Current income tax rate from continuing operations

     0     0     0     0

Deferred income tax rate from continuing operations

     20     30     20     30


Total income tax rate from continuing operations

     20     30     20     30


 (1)

In the first quarter 2020 and full-year 2020, Devon expects to incur approximately $15 million and $65 million of minimum volume commitments related to its STACK asset. These commitments are expected to impact GP&T rates by approximately $0.55 per Boe in 2020. These commitments will expire at the end of 2020.


 Note: In the first quarter of 2020, Devon expects to pay approximately $200 million for income taxes and other minor expenses related to its divested  Canadian operations. These payments will be represented in discontinued operations.


CAPITAL EXPENDITURES GUIDANCE

           
     Quarter 1      Full Year  

(in millions)

     Low        High        Low        High  


Upstream capital

   $ 420      $ 470      $ 1,700      $ 1,850  

Other

     5        10        20        30  


Total

   $ 425      $ 480      $ 1,720      $ 1,880  


1


Oil Commodity Hedges


Price Swaps


Price Collars


Period


Volume (Bbls/d)

   Weighted
Average Price
($/Bbl)
    

Volume

(Bbls/d)

   Weighted
Average Floor
Price ($/Bbl)
     Weighted
Average Ceiling
Price ($/Bbl)
 

Q1-Q4 2020

   14,750    $ 58.34      52,500    $ 51.69      $ 61.74  

Q1-Q4 2021

   1,750    $ 55.04      7,500    $ 50.07      $ 60.07  

Oil Basis Swaps


Period


Index

   Volume (Bbls/d)      Weighted Average
Differential to WTI
($/Bbl)
 

Q1-Q4 2020

   Argus MEH      10,000      $ 3.38  

Q1-Q4 2020

   Midland Sweet      3,000      $ 1.11  

Q1-Q4 2020

   NYMEX Roll      52,000      $ 0.37  

Q1-Q4 2021

   Midland Sweet      1,000      $ 1.25  

Natural Gas Commodity Hedges - Henry Hub


Price Swaps

     Price Collars  

Period


Volume (MMBtu/d)

   Weighted
Average Price
($/MMBtu)
     Volume
(MMBtu/d)
   Weighted
Average Floor
Price
($/MMBtu)
     Weighted
Average Ceiling
Price
($/MMBtu)
 

Q1-Q4 2020

   81,600    $ 2.77      50,250    $ 2.63      $ 2.96  

Q1-Q4 2021

   —        —        7,500    $ 2.08      $ 2.58  

Natural Gas Basis Swaps


Period


Index

   Volume (MMBtu/d)      Weighted Average
Differential to Henry
Hub ($/MMBtu)
 

Q1-Q4 2020

   Panhandle Eastern Pipe Line      30,000      $ (0.47

Q1-Q4 2020

   El Paso Natural Gas      45,000      $ (0.70

Q1-Q4 2020

   Houston Ship Channel      18,352      $ (0.01

NGL Commodity Hedges


          Price Swaps  

Period


Product

       Volume (Bbls/d)              Weighted Average    
Price ($/Bbl)
 

Q1-Q4 2020

   Natural Gasoline      1,000      $ 44.84  

Q1-Q4 2020

   Normal Butane      1,500      $ 23.56  

Q1-Q4 2020

   Propane      4,500      $ 25.18  

Devon’s oil derivatives settle against the average of the prompt month NYMEX West Texas Intermediate futures price. Devon’s natural gas derivatives settle against the Inside FERC first of the month Henry Hub index. Devon’s NGL derivatives settle against the average of the prompt month OPIS Mont Belvieu, Texas index. Commodity hedge positions are shown as of February 6, 2020.


2