|
|
|
|

|
|
Exhibit 99.1 |
|
|
Devon Energy Corporation
333 West Sheridan Avenue
Oklahoma City, OK 73102-5015 |
|
|
|
|
|
|
|
NEWS RELEASE
Devon Energy Reports First-Quarter 2020 Financial and Operational Results
OKLAHOMA CITY – May 5, 2020 – Devon Energy Corp. (NYSE: DVN) today reported operational and financial results for the first-quarter 2020. Supplemental financial tables for first-quarter results along with updated 2020 guidance are available on the company’s website at www.devonenergy.com.
First-Quarter Highlights
|
|
• |
Efficiencies drove upstream capital expenditures 12 percent below midpoint guidance |
|
|
• |
First-quarter oil production exceeded guidance by 3,000 barrels per day |
|
|
• |
Operating cash flow increased 21 percent year-over-year to $529 million |
|
|
• |
Free cash flow generation reached $104 million |
|
|
• |
Maintained strong financial position with $4.7 billion of liquidity, no near-term debt maturities |
Updated 2020 Outlook
|
|
• |
Capital investment reduced 45 percent from original plan to $1 billion |
|
|
• |
Oil production expected to be essentially flat compared to 2019 |
|
|
• |
Guidance assumes 10,000 barrels per day of oil curtailments in the second quarter |
|
|
• |
Hedges protect approximately 90 percent of oil volumes at $42 per barrel |
|
|
• |
Full-year cost outlook improved by $250 million, includes executive pay reductions |
|
|
• |
Barnett Shale asset sale process on track to close by year-end |
“These are truly extraordinary times, as we cope with the impact of a global crisis that has touched all our lives, and I want to thank everyone in our communities working to keep people safe,” said Dave Hager, president and CEO. “At Devon, our top priority, as always, is ensuring the health and safety of our employees, and I want to acknowledge our team’s tireless efforts as they remain keenly focused on executing our business plan.
“Importantly, due to our recently completed portfolio transformation, Devon has entered these difficult times with the benefit of a strong balance sheet, excellent liquidity and top-tier assets,” Hager said. “In this uncertain environment, our top strategic priority is to preserve our financial strength, and our decisive actions to date have accomplished exactly that. Our swift response to recalibrate drilling and completion activity and lower operating costs ensures that we can fund all our 2020 capital requirements within cash flow. We are confident that we will emerge from this downturn a strong company, and we are well positioned to take full advantage of our high-quality portfolio when commodity prices normalize.”
First-Quarter 2020 Operating Results
Net production from retained assets averaged 348,000 oil-equivalent barrels (Boe) per day during the first quarter. Oil production averaged 163,000 barrels per day, a 15 percent increase from the same period a year ago. This result exceeded the company’s midpoint guidance by 3,000 barrels per day due to strong operating results in the Delaware Basin.
1
Capital spending in the first quarter was $391 million, or 12 percent below midpoint guidance. This positive variance was attributable to efficiency gains achieved by the company’s Wolfcamp program in the Delaware Basin.
Upstream revenue, excluding derivative valuation changes, totaled $908 million in the first quarter. This represents a 5 percent decrease in revenue compared to the first quarter of 2019 due to lower commodity prices.
Production expense averaged $10.02 per Boe in the first quarter. Including costs reclassified to discontinued operations, production costs declined 6 percent compared to the year-ago quarter. This improved result was driven by lower lease operating expenses across Devon’s retained U.S. asset portfolio and the divestiture of higher-cost assets.
Corporate costs also declined during the quarter. General and administrative (G&A) expenses totaled $102 million in the first quarter. Including costs reclassified to discontinued operations, Devon’s G&A expense improved 33 percent year-over-year, driven by reduced personnel expense. Financing costs (including discontinued operations) were reduced $8 million year-over-year due to the company’s ongoing debt-reduction program.
Additional items that improved the company’s cost structure in the first quarter were a $47 million credit to other expenses resulting from a prior-period severance tax refund and a $96 million income tax benefit resulting from recent tax legislation.
Asset-Level Overview
Key operational highlights from Devon’s retained assets are covered below. For more detailed results and commentary regarding Devon’s operations and outlook, please refer to the company’s first-quarter 2020 earnings presentation at www.devonenergy.com.
Delaware Basin: Net production averaged 162,000 Boe per day, a 51 percent increase compared to the first-quarter 2019. First-quarter volume growth was driven by 32 new wells averaging 30-day rates of 2,500 Boe per day (67 percent oil). Completed well costs in the Wolfcamp formation during the first quarter averaged $705 per foot, a 42 percent improvement compared to the 2018 average. The company also continued to improve its field-level operating costs, with production expense declining 11 percent year-over-year to $8.47 per Boe.
Powder River Basin: Net production averaged 29,000 Boe per day, of which 74 percent was light oil. In the quarter, Devon brought online 14 new wells at an average completed well cost of $6.4 million. The capital program was highlighted by appraisal work in the emerging Niobrara oil play. The Tillard 36-4X, targeting the Niobrara B interval, positively responded to increased stimulation and a slower flowback approach to deliver an average 90-day rate of 1,200 Boe per day (85 percent oil).
Eagle Ford: First-quarter net production averaged 50,000 Boe per day. The company brought online 30 wells in the quarter, with completed well costs averaging $6.4 million. This activity was highlighted by a 4-well redevelopment spacing test targeting the Upper Eagle Ford interval. This 4-well test attained average 30-day rates of 2,000 Boe per day per well (60 percent oil) and confirmed spacing potential of up to 12 wells per section in the Upper Eagle Ford.
Anadarko Basin: Net production averaged 98,000 Boe per day. The company’s operational focus during the quarter was concentrated on optimizing base production and reducing controllable downtime across the field. New well activity in the quarter was limited to 4 operated wells targeting the Meramec formation in Kingfisher County. These development wells averaged 30-day rates of 1,200 Boe per day.
2
Financial Highlights
Devon’s financial position continues to remain exceptionally strong with excellent liquidity and low leverage. The company exited the first quarter with $1.7 billion of cash (inclusive of restricted cash) and an undrawn credit facility of $3 billion. At the end of the quarter, Devon had an outstanding debt balance of $4.3 billion with no outstanding debt maturities occurring until late 2025.
Further enhancing liquidity was the company’s amended Barnett Shale purchase and sale agreement. Under the revised terms announced last month, Devon has agreed to sell its Barnett Shale assets for up to $830 million of total proceeds, consisting of $570 million in cash at closing and contingent payments of up to $260 million. As part of the amendment, Devon received an increased deposit of $170 million, and the scheduled closing date for the transaction was extended from April 15, 2020, to Dec. 31, 2020.
Devon’s financial strength is also enhanced by its attractive hedge position, where approximately 90 percent of expected oil production is protected for the remainder of 2020. These contracts, based off the West Texas Intermediate (WTI) oil benchmark, provide an average protected floor price of $42 per barrel.
The company invested $38 million to repurchase 2.2 million shares of its common stock in the first quarter. Devon has suspended its share repurchase program to preserve liquidity in light of the COVID-19 pandemic.
First-Quarter Earnings and Cash-Flow Results
Devon’s operating cash flow from continuing operations totaled $529 million in the first quarter, a 21 percent increase compared to the same period a year ago. This level of cash flow funded all capital requirements and generated $104 million of free cash flow in the quarter.
The company reported a net loss of $1.8 billion, or $4.82 per diluted share in the first quarter. The quarterly loss was attributable to $2.8 billion of non-cash impairment charges due to asset evaluations associated with current business conditions. Adjusting for this charge and other items analysts typically exclude from estimates, Devon’s core earnings were $48 million, or $0.13 per diluted share.
Updated Guidance
As previously announced on March 30, 2020, Devon has elected to reduce its capital expenditures by $800 million for the full-year 2020. The revised capital outlook of approximately $1 billion represents a reduction of nearly 45 percent compared to the company’s original 2020 capital budget. For the second quarter of 2020, Devon expects to invest approximately $200 million to $250 million of capital.
With this revised capital program, the company expects second-quarter oil production to average 145,000 to 155,000 barrels per day. Included within the company’s second-quarter production outlook is the election to curtail 10,000 barrels per day due to low commodity prices. Given the ongoing price volatility, curtailment decisions are expected to be made on a month-to-month basis. For the full-year, Devon expects oil production to be essentially flat compared to 2019.
The company is lowering its 2020 expense outlook by $250 million to $1.65 billion. The improved cost structure is driven by expectations of lower production costs across Devon’s portfolio coupled with reductions in G&A expenses. The reduction in G&A includes an expected decrease in executive cash compensation of approximately 40 percent compared to 2019.
Detailed forward-looking guidance for the second quarter and updated full-year 2020 are available on the company’s website at www.devonenergy.com.
3
Environmental, Social & Governance
Devon strives to deliver results that balance economic growth, environmental stewardship, strong governance and social responsibility. For access to Devon’s sustainability report, please visit www.devonenergy.com/sustainability. This report highlights the company’s commitment to operating a responsible, safe and ethical business while providing transparent reporting to all stakeholders.
Conference Call Webcast and Supplemental Earnings Materials
Also provided with today’s release is the company’s detailed earnings presentation that is available on the company’s website at www.devonenergy.com. The company’s first-quarter conference call will be held at 9 a.m. Central (10 a.m. Eastern) on Wednesday, May 6, 2020, and will serve primarily as a forum for analyst and investor questions and answers.
Non-GAAP Disclosures
This release includes non-GAAP (generally accepted accounting principles) financial measures. Such non-GAAP measures are not alternatives to GAAP measures, and you should not consider these non-GAAP measures in isolation or as a substitute for analysis of results as reported under GAAP. Reconciliations of these non-GAAP measures and other disclosures are provided within the supplemental financial tables that are available on the company’s website at www.devonenergy.com and in our related Form 10-Q.
About Devon Energy
Devon Energy is a leading independent energy company engaged in finding and producing oil and natural gas. Based in Oklahoma City and included in the S&P 500, Devon operates in several of the most prolific oil and natural gas plays in the U.S. with an emphasis on achieving strong corporate-level returns and capital-efficient cash-flow growth. For more information, please visit www.devonenergy.com and see our related Form 10-K.
Forward-Looking Statements
This press release includes “forward-looking statements” as defined by the SEC. Such statements include those concerning strategic plans, our expectations and objectives for future operations, as well as other future events or conditions, and are often identified by use of the words and phrases such as “expects,” “believes,” “will,” “would,” “could,” “continue,” “may,” “aims,” “likely to be,” “intends,” “forecasts,” “projections,” “estimates,” “plans,” “expectations,” “targets,” “opportunities,” “potential,” “anticipates,” “outlook” and other similar terminology. All statements, other than statements of historical facts, included in this press release that address activities, events or developments that Devon expects, believes or anticipates will or may occur in the future are forward-looking statements. Such statements are subject to a number of assumptions, risks and uncertainties, many of which are beyond our control. Consequently, actual future results could differ materially from our expectations due to a number of factors, including, but not limited to those, identified below.
The COVID-19 pandemic and its related repercussions have created significant volatility, uncertainty and turmoil in the global economy and our industry. This turmoil has included an unprecedented supply-and-demand imbalance for oil and other commodities, resulting in a swift and material decline in commodity prices in early 2020. Our future actual results could differ materially from the forward-looking statements in this press release due to the COVID-19 pandemic and related impacts, including, by, among other things: contributing to a sustained or further deterioration in commodity prices; causing takeaway capacity constraints for production, resulting in further production shut-ins and additional downward pressure on impacted regional pricing differentials; limiting our ability to access sources of capital due to disruptions in financial markets; increasing the risk of a downgrade from credit rating agencies; exacerbating counterparty credit risks and the risk of supply chain interruptions; and increasing the risk of operational disruptions due to social distancing measures and other changes to business practices.
4
In addition to the risks associated with the COVID-19 pandemic and its related impacts, our actual future results could differ materially from our expectations due to other factors, including, among other things: the volatility of oil, gas and NGL prices; uncertainties inherent in estimating oil, gas and NGL reserves; the extent to which we are successful in acquiring and discovering additional reserves; the uncertainties, costs and risks involved in our operations, including as a result of employee misconduct; regulatory restrictions, compliance costs and other risks relating to governmental regulation, including with respect to environmental matters; risks related to regulatory, social and market efforts to address climate change; risks related to our hedging activities; counterparty credit risks; risks relating to our indebtedness; cyberattack risks; our limited control over third parties who operate some of our oil and gas properties; midstream capacity constraints and potential interruptions in production; the extent to which insurance covers any losses we may experience; competition for assets, materials, people and capital; risks related to investors attempting to effect change; our ability to successfully complete mergers, acquisitions and divestitures; and any of the other risks and uncertainties discussed in our 2019 Annual Report on Form 10-K, our first-quarter 2020 Form 10-Q and our other filings with the SEC.
All subsequent written and oral forward-looking statements attributable to Devon, or persons acting on its behalf, are expressly qualified in their entirety by the cautionary statements above. We assume no duty to update or revise our forward-looking statements based on new information, future events or otherwise.
|
|
|
Investor Contacts |
Media Contact |
|
Scott Coody, 405-552-4735 |
John Porretto, 405-228-7506 |
|
Chris Carr, 405-228-2496 |
|
May 5, 2020 Q1 2020 Earnings Presentation Exhibit 99.2
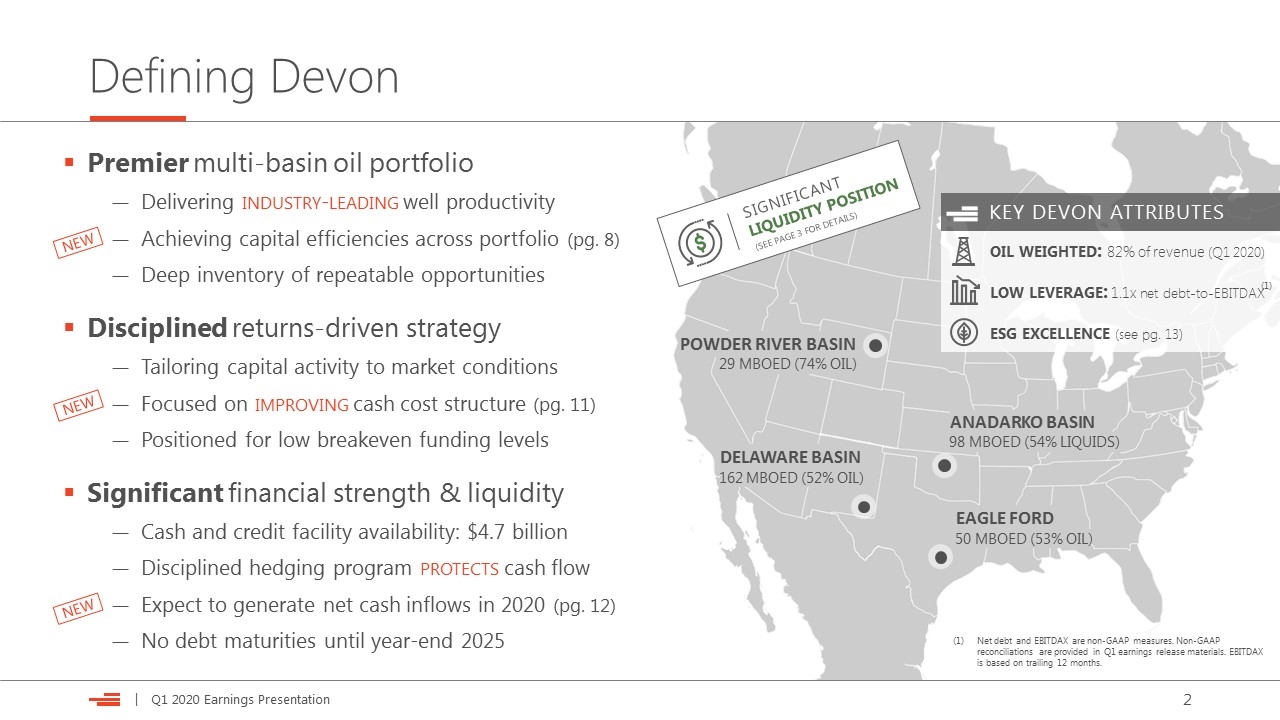
Defining Devon Premier multi-basin oil portfolio Delivering industry-leading well productivity Achieving capital efficiencies across portfolio (pg. 8) Deep inventory of repeatable opportunities Disciplined returns-driven strategy Tailoring capital activity to market conditions Focused on improving cash cost structure (pg. 11) Positioned for low breakeven funding levels Significant financial strength & liquidity Cash and credit facility availability: $4.7 billion Disciplined hedging program protects cash flow Expect to generate net cash inflows in 2020 (pg. 12) No debt maturities until year-end 2025 29 MBOED (74% OIL) POWDER RIVER BASIN 162 MBOED (52% OIL) ANADARKO BASIN 98 MBOED (54% LIQUIDS) EAGLE FORD 50 MBOED (53% OIL) Net debt and EBITDAX are non-GAAP measures. Non-GAAP reconciliations are provided in Q1 earnings release materials. EBITDAX is based on trailing 12 months. DELAWARE BASIN oil weighted: 82% of revenue (Q1 2020) low leverage: 1.1x net debt-to-EBITDAX esg excellence (see pg. 13) SIGNIFICANT LIQUIDITY POSITION (SEE PAGE 3 FOR DETAILS) KEY DEVON ATTRIBUTES NEW NEW (1) NEW
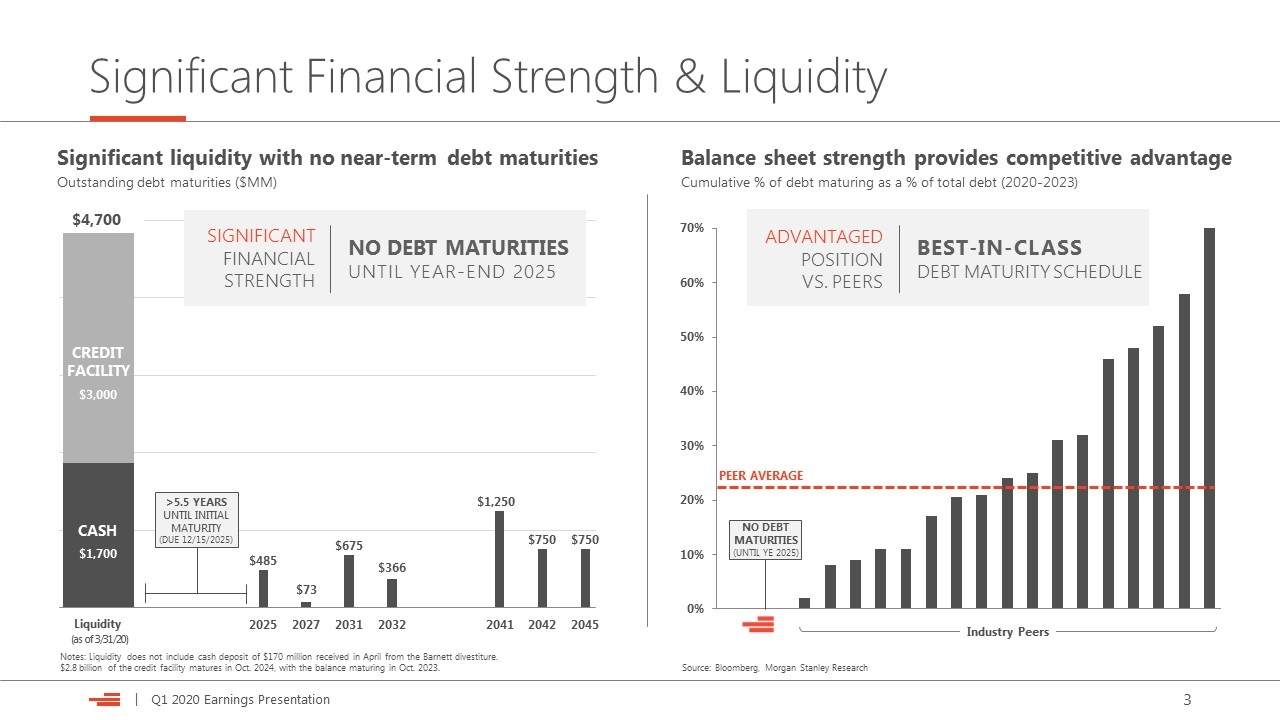
Significant Financial Strength & Liquidity $73 Significant liquidity with no near-term debt maturities Outstanding debt maturities ($MM) $4,700 Liquidity PEER AVERAGE Source: Bloomberg, Morgan Stanley Research Balance sheet strength provides competitive advantage Cumulative % of debt maturing as a % of total debt (2020-2023) Industry Peers BEST-IN-CLASS DEBT MATURITY SCHEDULE ADVANTAGED POSITION VS. PEERS NO DEBT MATURITIES (UNTIL YE 2025) NO DEBT MATURITIES UNTIL YEAR-END 2025 SIGNIFICANT FINANCIAL STRENGTH CREDIT FACILITY $3,000 $1,700 CASH $485 >5.5 YEARS UNTIL INITIAL MATURITY (DUE 12/15/2025) (as of 3/31/20) Notes: Liquidity does not include cash deposit of $170 million received in April from the Barnett divestiture. $2.8 billion of the credit facility matures in Oct. 2024, with the balance maturing in Oct. 2023.
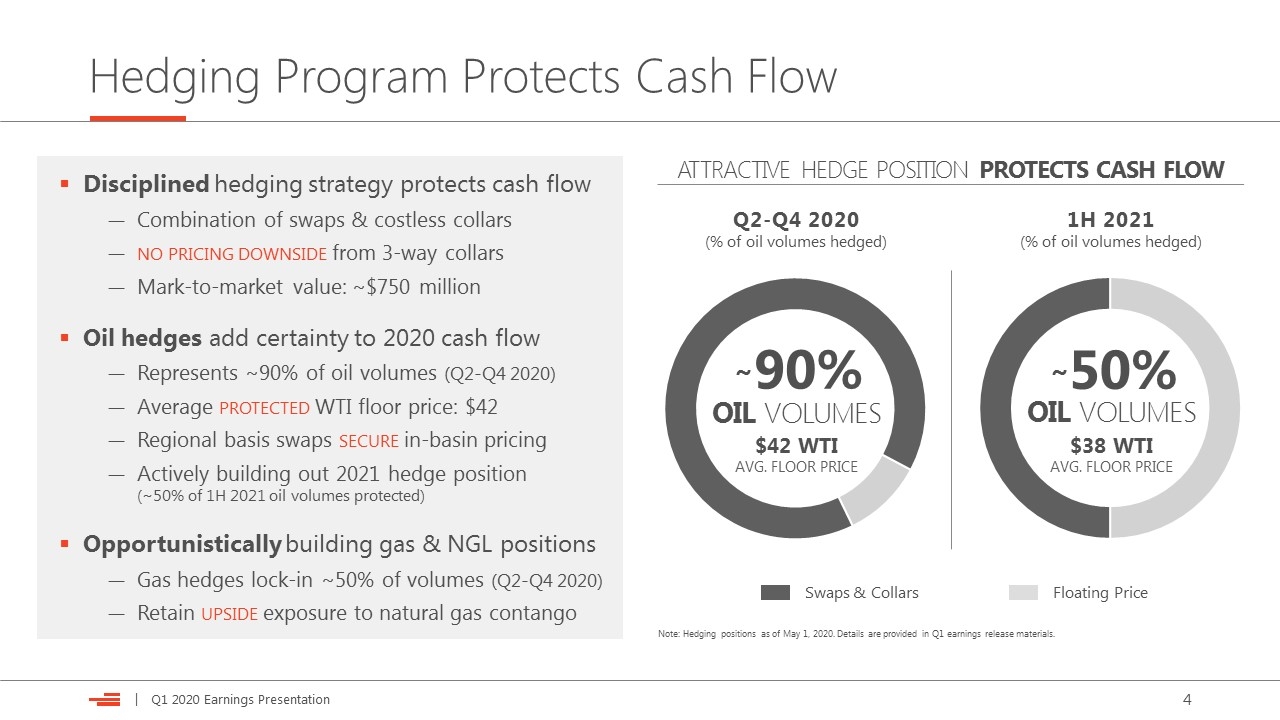
Hedging Program Protects Cash Flow 90% $42 WTI AVG. FLOOR PRICE Swaps & Collars Floating Price OIL VOLUMES Q2-Q4 2020 (% of oil volumes hedged) ATTRACTIVE HEDGE POSITION PROTECTS CASH FLOW Disciplined hedging strategy protects cash flow Combination of swaps & costless collars no pricing downside from 3-way collars Mark-to-market value: ~$750 million Oil hedges add certainty to 2020 cash flow Represents ~90% of oil volumes (Q2-Q4 2020) Average protected WTI floor price: $42 Regional basis swaps secure in-basin pricing Actively building out 2021 hedge position (~50% of 1H 2021 oil volumes protected) Opportunistically building gas & NGL positions Gas hedges lock-in ~50% of volumes (Q2-Q4 2020) Retain upside exposure to natural gas contango 1H 2021 (% of oil volumes hedged) ~ Note: Hedging positions as of May 1, 2020. Details are provided in Q1 earnings release materials. 50% $38 WTI AVG. FLOOR PRICE OIL VOLUMES ~
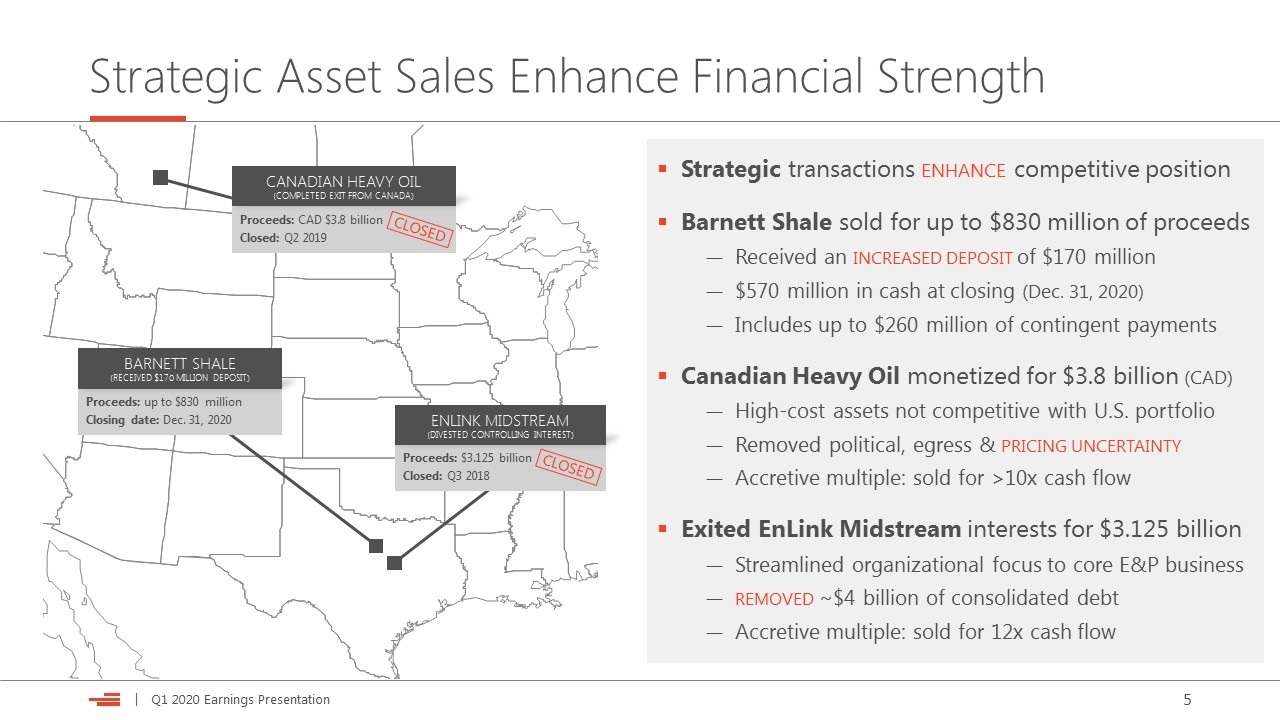
Strategic Asset Sales Enhance Financial Strength Strategic transactions enhance competitive position Barnett Shale sold for up to $830 million of proceeds Received an increased deposit of $170 million $570 million in cash at closing (Dec. 31, 2020) Includes up to $260 million of contingent payments Canadian Heavy Oil monetized for $3.8 billion (CAD) High-cost assets not competitive with U.S. portfolio Removed political, egress & pricing uncertainty Accretive multiple: sold for >10x cash flow Exited EnLink Midstream interests for $3.125 billion Streamlined organizational focus to core E&P business removed ~$4 billion of consolidated debt Accretive multiple: sold for 12x cash flow Proceeds: CAD $3.8 billion Closed: Q2 2019 Proceeds: up to $830 million Closing date: Dec. 31, 2020 Proceeds: $3.125 billion Closed: Q3 2018 BARNETT SHALE (RECEIVED $170 MILLION DEPOSIT) CLOSED ENLINK MIDSTREAM (DIVESTED CONTROLLING INTEREST) CANADIAN HEAVY OIL (COMPLETED EXIT FROM CANADA) CLOSED
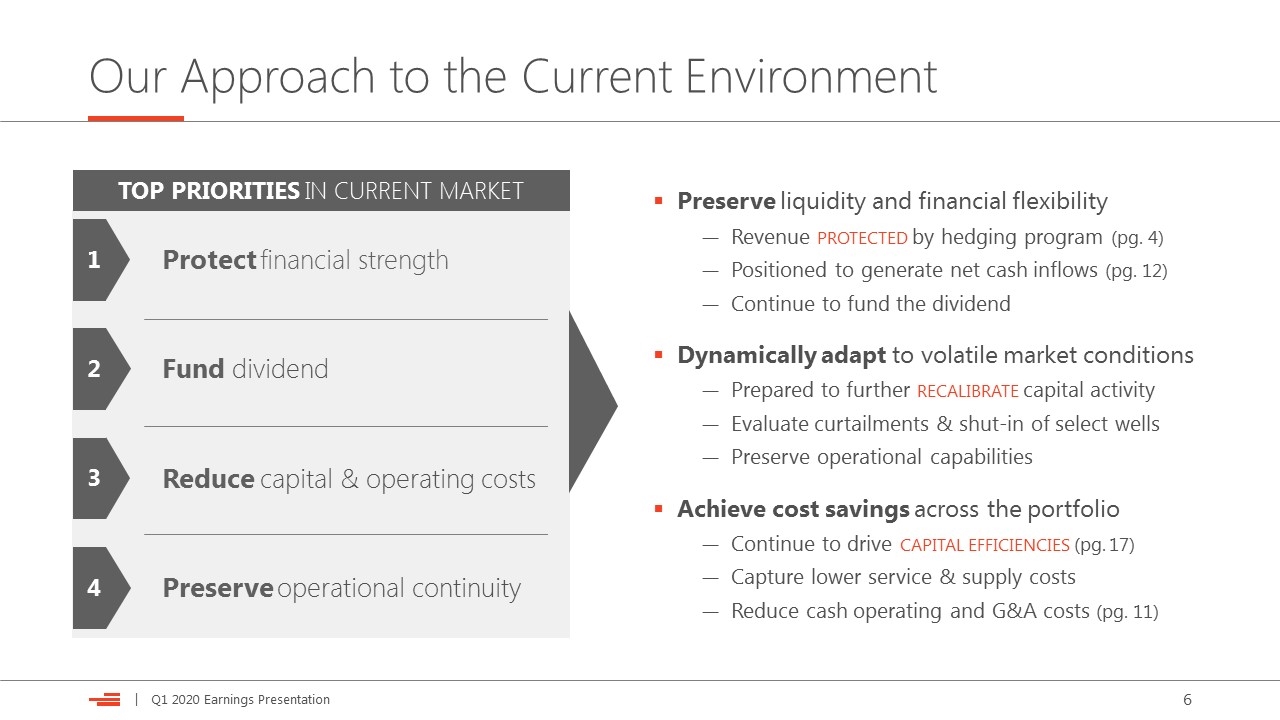
Our Approach to the Current Environment 1 2 3 4 TOP PRIORITIES IN CURRENT MARKET Protect financial strength Reduce capital & operating costs Preserve operational continuity Fund dividend 1 2 3 4 Preserve liquidity and financial flexibility Revenue protected by hedging program (pg. 4) Positioned to generate net cash inflows (pg. 12) Continue to fund the dividend Dynamically adapt to volatile market conditions Prepared to further recalibrate capital activity Evaluate curtailments & shut-in of select wells Preserve operational capabilities Achieve cost savings across the portfolio Continue to drive capital efficiencies (pg. 17) Capture lower service & supply costs Reduce cash operating and G&A costs (pg. 11)
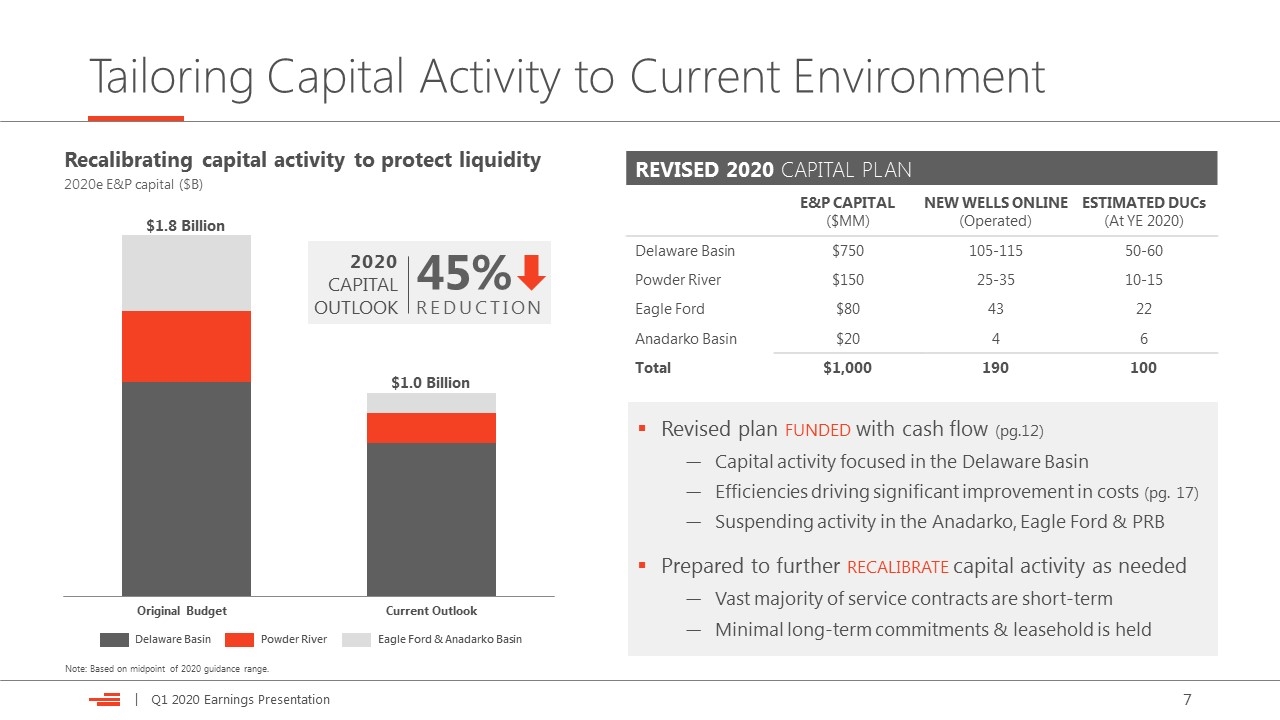
Tailoring Capital Activity to Current Environment REVISED 2020 CAPITAL PLAN E&P CAPITAL ($MM) NEW WELLS ONLINE (Operated) ESTIMATED DUCs (At YE 2020) Delaware Basin $750 105-115 50-60 Powder River $150 25-35 10-15 Eagle Ford $80 43 22 Anadarko Basin $20 4 6 Total $1,000 190 100 Revised plan funded with cash flow (pg.12) Capital activity focused in the Delaware Basin Efficiencies driving significant improvement in costs (pg. 17) Suspending activity in the Anadarko, Eagle Ford & PRB Prepared to further recalibrate capital activity as needed Vast majority of service contracts are short-term Minimal long-term commitments & leasehold is held Recalibrating capital activity to protect liquidity 2020e E&P capital ($B) 2020 CAPITAL OUTLOOK 45% REDUCTION Note: Based on midpoint of 2020 guidance range. Delaware Basin Powder River Eagle Ford & Anadarko Basin $1.0 Billion $1.8 Billion Original Budget Current Outlook
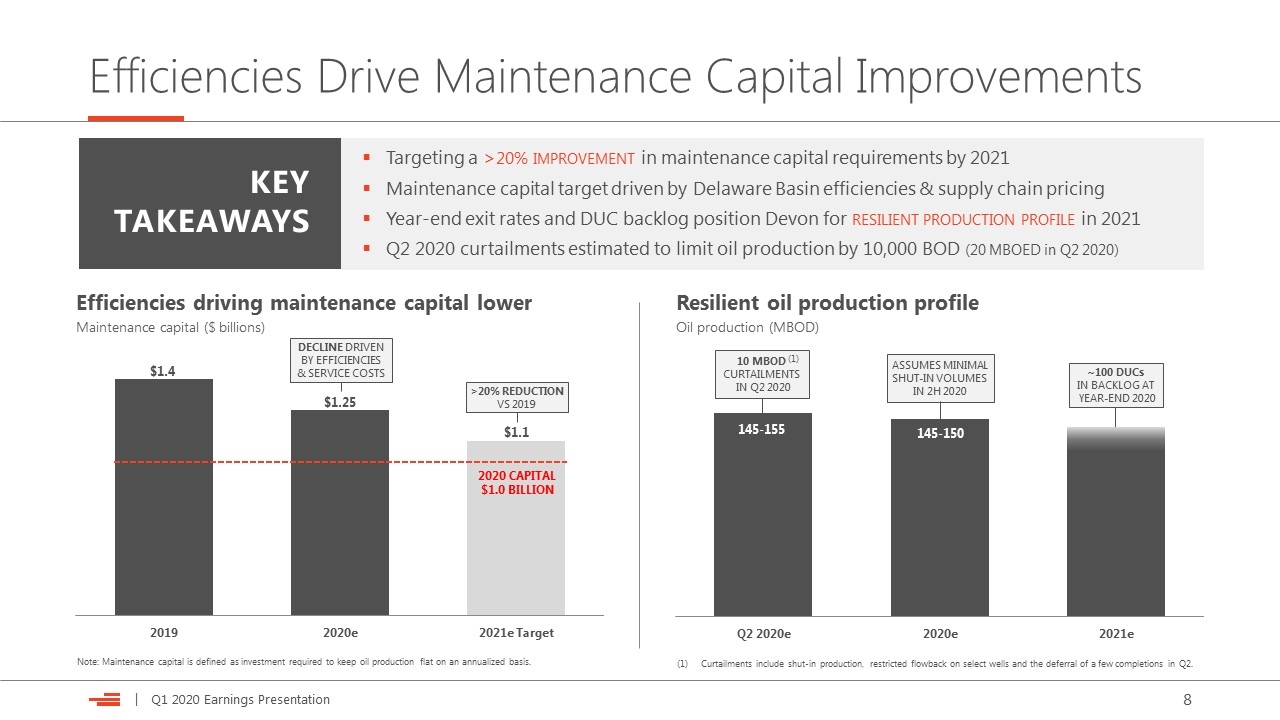
Efficiencies Drive Maintenance Capital Improvements 145-150 ~100 DUCs IN BACKLOG AT YEAR-END 2020 KEY TAKEAWAYS Efficiencies driving maintenance capital lower Maintenance capital ($ billions) DECLINE DRIVEN BY EFFICIENCIES & SERVICE COSTS Note: Maintenance capital is defined as investment required to keep oil production flat on an annualized basis. 2020 CAPITAL $1.0 BILLION $1.4 $1.1 $1.25 Resilient oil production profile Oil production (MBOD) Targeting a >20% improvement in maintenance capital requirements by 2021 Maintenance capital target driven by Delaware Basin efficiencies & supply chain pricing Year-end exit rates and DUC backlog position Devon for resilient production profile in 2021 Q2 2020 curtailments estimated to limit oil production by 10,000 BOD (20 MBOED in Q2 2020) Curtailments include shut-in production, restricted flowback on select wells and the deferral of a few completions in Q2. 145-155 10 MBOD CURTAILMENTS IN Q2 2020 (1) ASSUMES MINIMAL SHUT-IN VOLUMES IN 2H 2020 >20% REDUCTION VS 2019
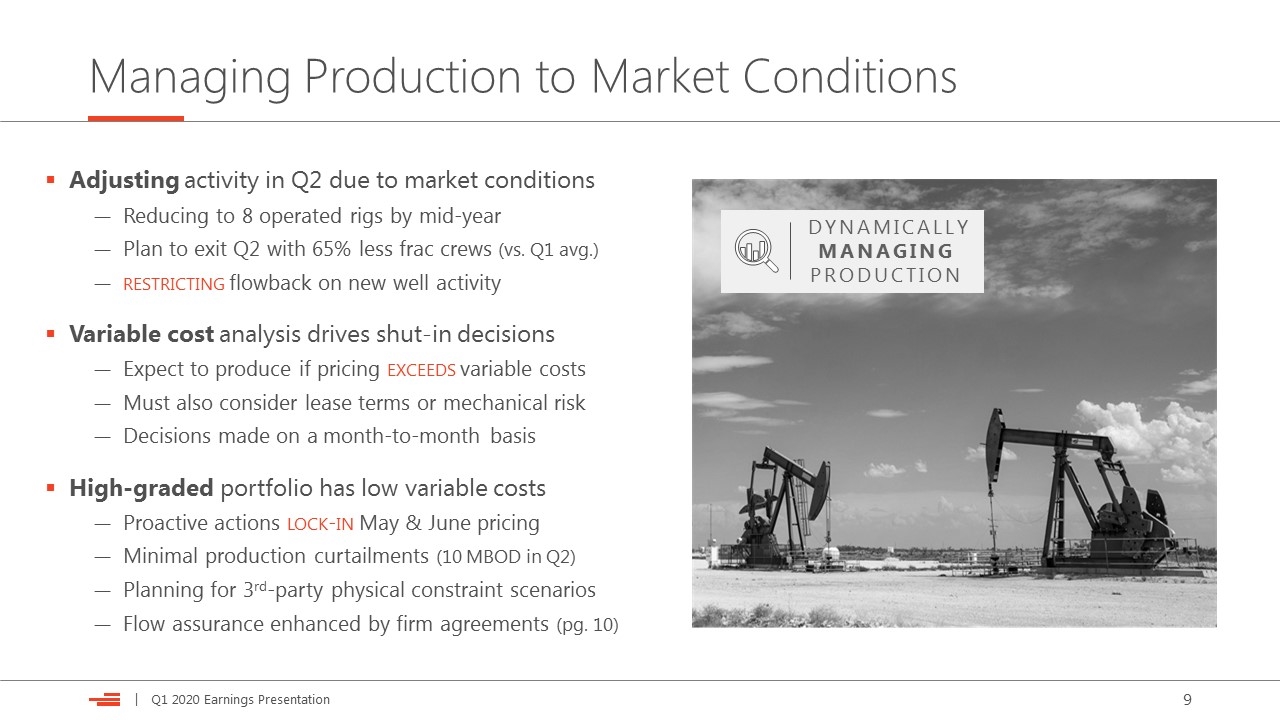
Managing Production to Market Conditions Adjusting activity in Q2 due to market conditions Reducing to 8 operated rigs by mid-year Plan to exit Q2 with 65% less frac crews (vs. Q1 avg.) restricting flowback on new well activity Variable cost analysis drives shut-in decisions Expect to produce if pricing exceeds variable costs Must also consider lease terms or mechanical risk Decisions made on a month-to-month basis High-graded portfolio has low variable costs Proactive actions lock-in May & June pricing Minimal production curtailments (10 MBOD in Q2) Planning for 3rd-party physical constraint scenarios Flow assurance enhanced by firm agreements (pg. 10) DYNAMICALLY MANAGING PRODUCTION
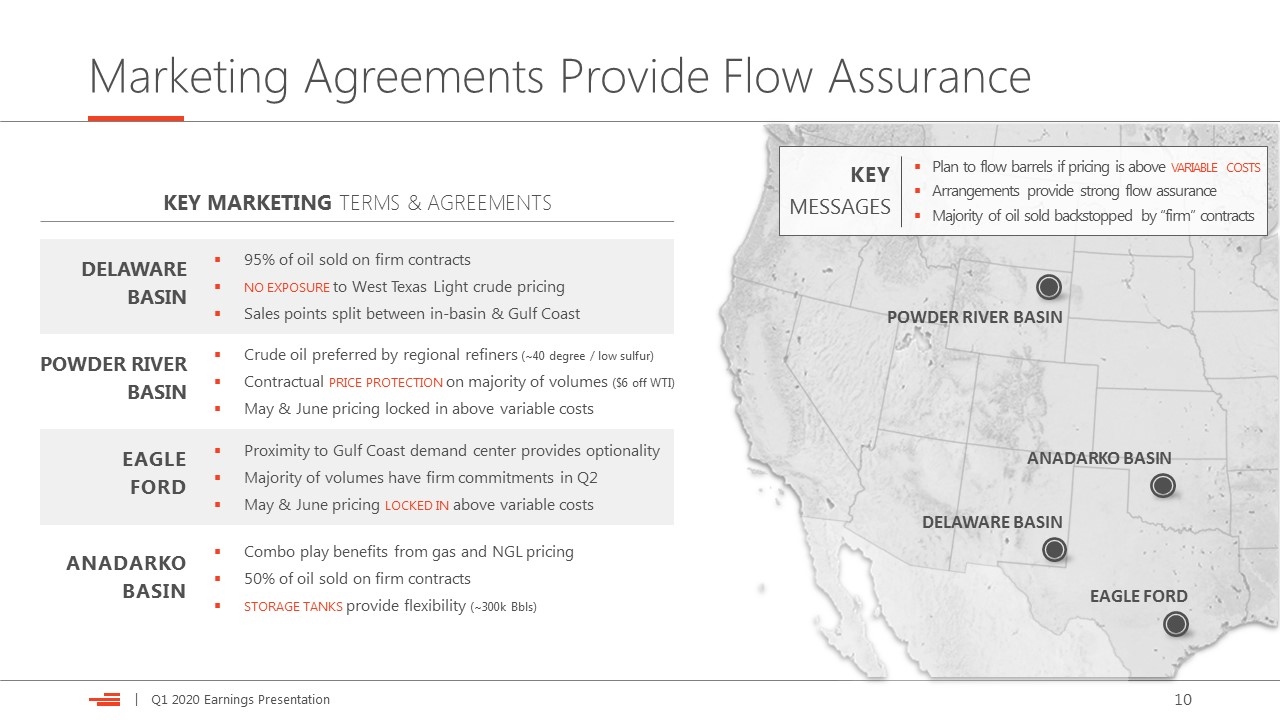
Marketing Agreements Provide Flow Assurance POWDER RIVER BASIN ANADARKO BASIN EAGLE FORD DELAWARE BASIN 95% of oil sold on firm contracts no exposure to West Texas Light crude pricing Sales points split between in-basin & Gulf Coast POWDER RIVER BASIN EAGLE FORD ANADARKO BASIN KEY MARKETING TERMS & AGREEMENTS DELAWARE BASIN Crude oil preferred by regional refiners (~40 degree / low sulfur) Contractual price protection on majority of volumes ($6 off WTI) May & June pricing locked in above variable costs Proximity to Gulf Coast demand center provides optionality Majority of volumes have firm commitments in Q2 May & June pricing locked in above variable costs Combo play benefits from gas and NGL pricing 50% of oil sold on firm contracts storage tanks provide flexibility (~300k Bbls) KEY MESSAGES Plan to flow barrels if pricing is above variable costs Arrangements provide strong flow assurance Majority of oil sold backstopped by “firm” contracts
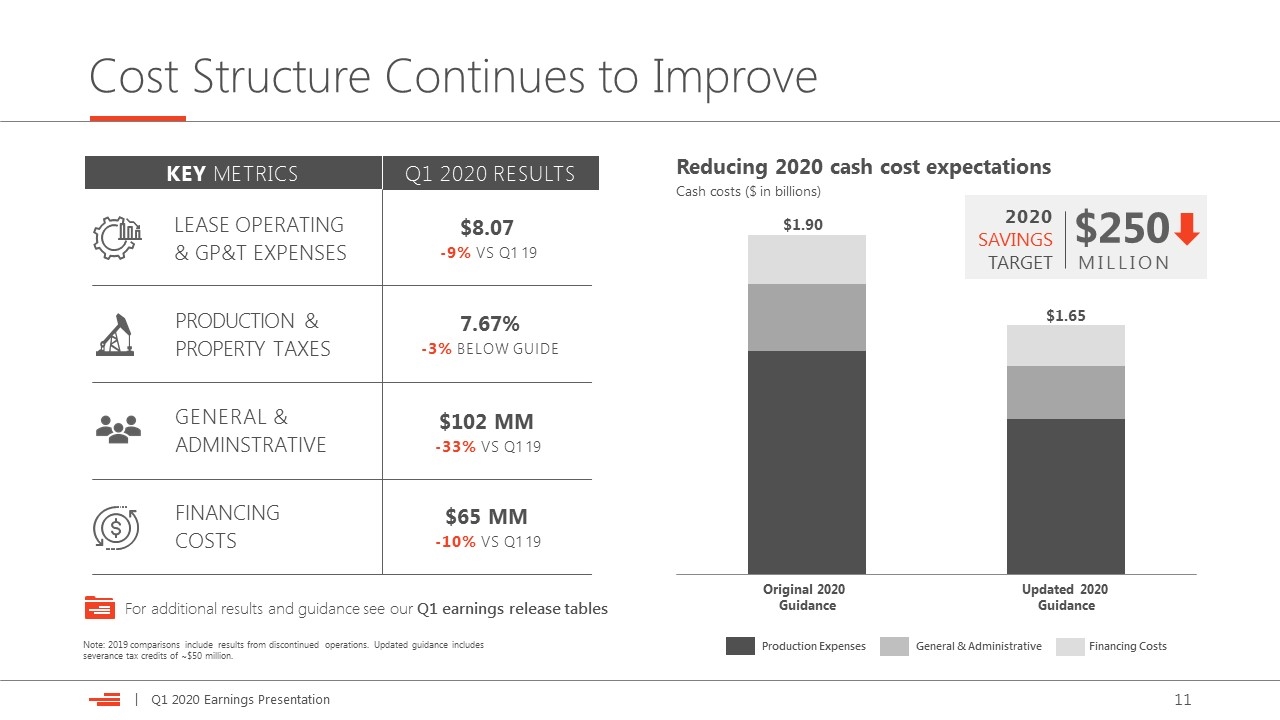
Cost Structure Continues to Improve Production Expenses General & Administrative Financing Costs $1.90 $1.65 LEASE OPERATING & GP&T EXPENSES $8.07 -9% VS Q1 19 KEY METRICS Q1 2020 RESULTS PRODUCTION & PROPERTY TAXES FINANCING COSTS GENERAL & ADMINSTRATIVE 7.67% -3% BELOW GUIDE $102 MM -33% VS Q1 19 $65 MM -10% VS Q1 19 Note: 2019 comparisons include results from discontinued operations. Updated guidance includes severance tax credits of ~$50 million. Original 2020 Guidance Updated 2020 Guidance Reducing 2020 cash cost expectations Cash costs ($ in billions) For additional results and guidance see our Q1 earnings release tables $250 MILLION 2020 SAVINGS TARGET
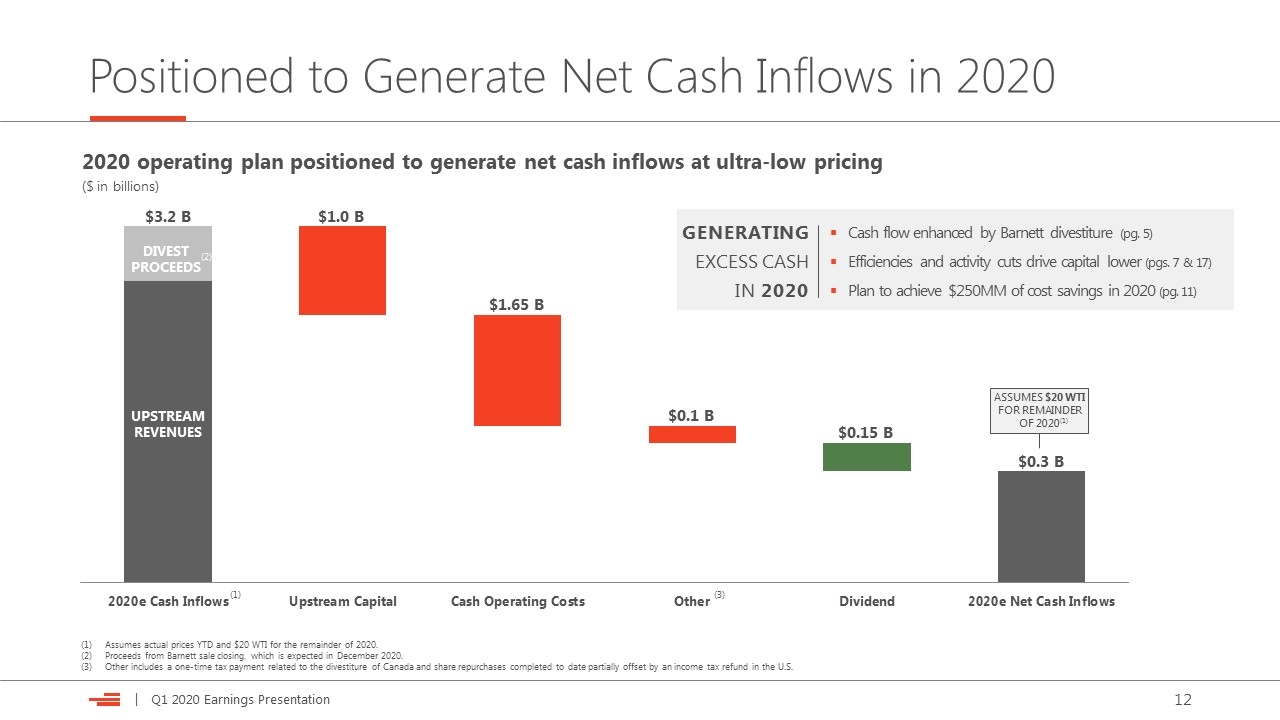
Positioned to Generate Net Cash Inflows in 2020 2020 operating plan positioned to generate net cash inflows at ultra-low pricing ($ in billions) Assumes actual prices YTD and $20 WTI for the remainder of 2020. Proceeds from Barnett sale closing, which is expected in December 2020. Other includes a one-time tax payment related to the divestiture of Canada and share repurchases completed to date partially offset by an income tax refund in the U.S. $1.0 B $3.2 B $1.65 B $0.1 B $0.3 B UPSTREAM REVENUES DIVEST PROCEEDS (1) GENERATING EXCESS CASH IN 2020 Cash flow enhanced by Barnett divestiture (pg. 5) Efficiencies and activity cuts drive capital lower (pgs. 7 & 17) Plan to achieve $250MM of cost savings in 2020 (pg. 11) $0.15 B (3) (2) ASSUMES $20 WTI FOR REMAINDER OF 2020 (1)
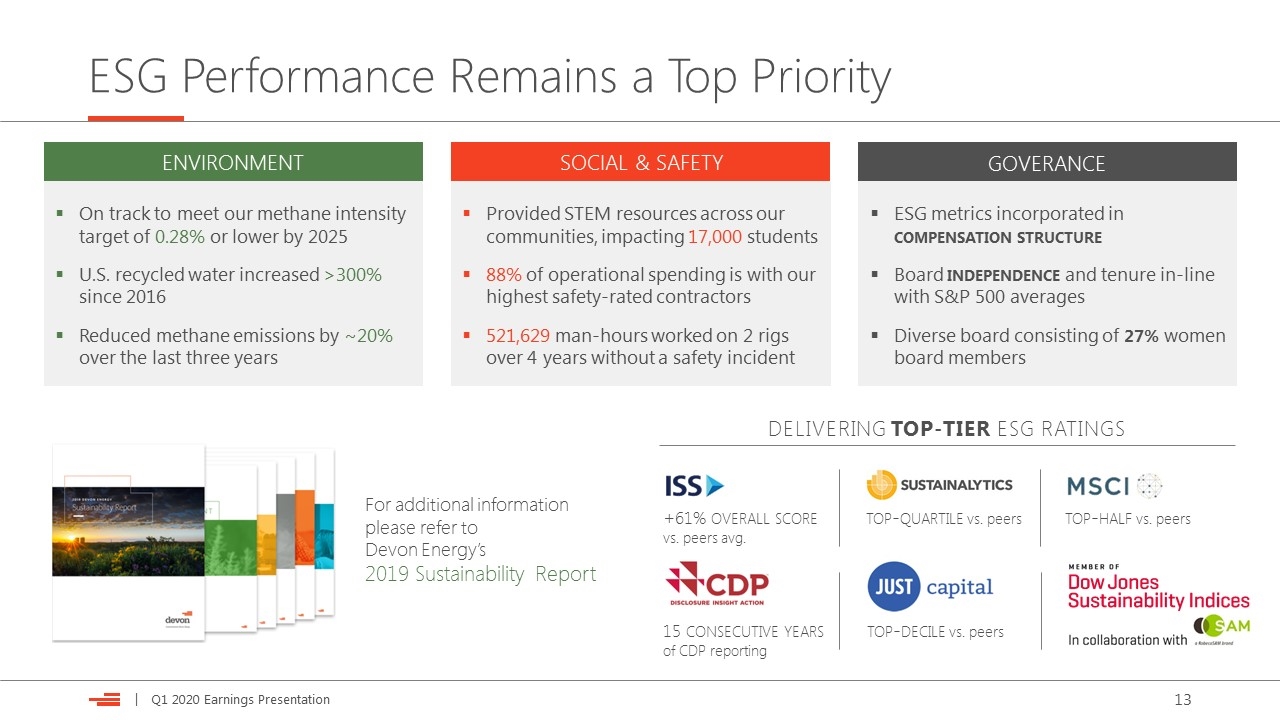
ESG Performance Remains a Top Priority top-quartile vs. peers top-half vs. peers 15 consecutive years of CDP reporting top-decile vs. peers ENVIRONMENT SOCIAL & SAFETY GOVERANCE On track to meet our methane intensity target of 0.28% or lower by 2025 U.S. recycled water increased >300% since 2016 Reduced methane emissions by ~20% over the last three years Provided STEM resources across our communities, impacting 17,000 students 88% of operational spending is with our highest safety-rated contractors 521,629 man-hours worked on 2 rigs over 4 years without a safety incident ESG metrics incorporated in compensation structure Board independence and tenure in-line with S&P 500 averages Diverse board consisting of 27% women board members For additional information please refer to Devon Energy’s 2019 Sustainability Report +61% overall score vs. peers avg. DELIVERING TOP-TIER ESG RATINGS
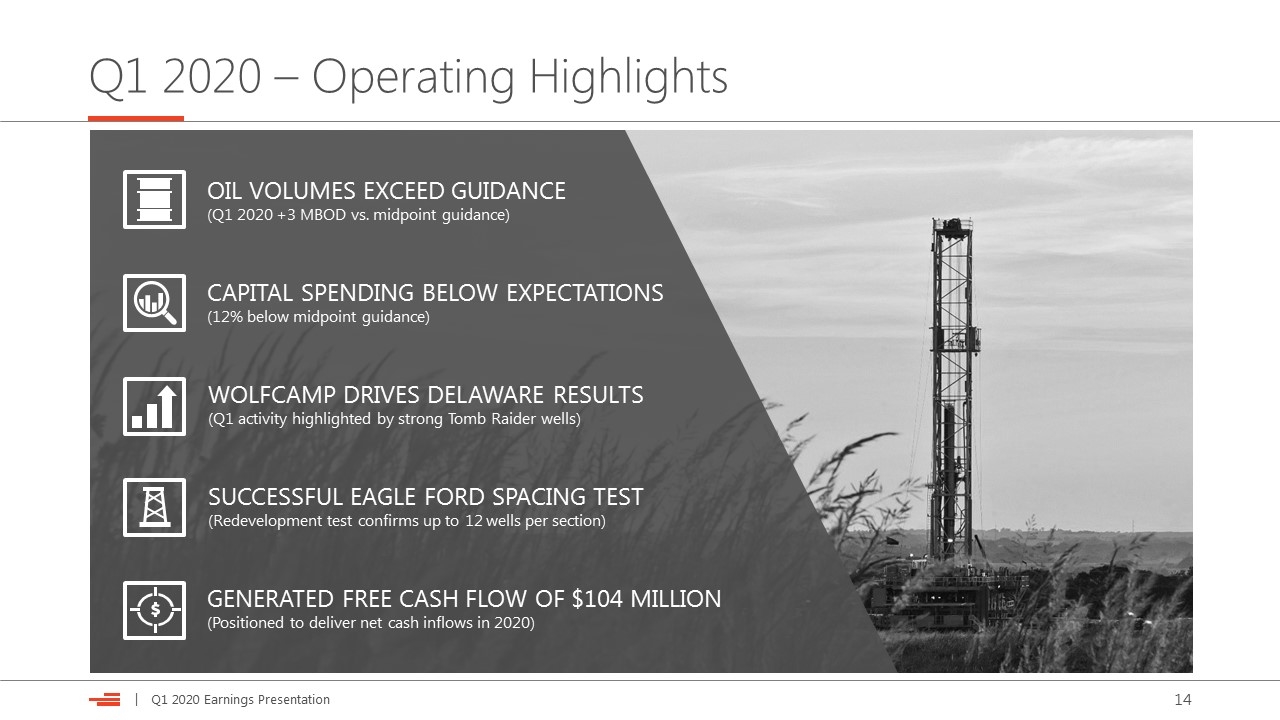
Q1 2020 – Operating Highlights OIL VOLUMES EXCEED GUIDANCE (Q1 2020 +3 MBOD vs. midpoint guidance) CAPITAL SPENDING BELOW EXPECTATIONS (12% below midpoint guidance) GENERATED FREE CASH FLOW OF $104 MILLION (Positioned to deliver net cash inflows in 2020) WOLFCAMP DRIVES DELAWARE RESULTS (Q1 activity highlighted by strong Tomb Raider wells) SUCCESSFUL EAGLE FORD SPACING TEST (Redevelopment test confirms up to 12 wells per section)
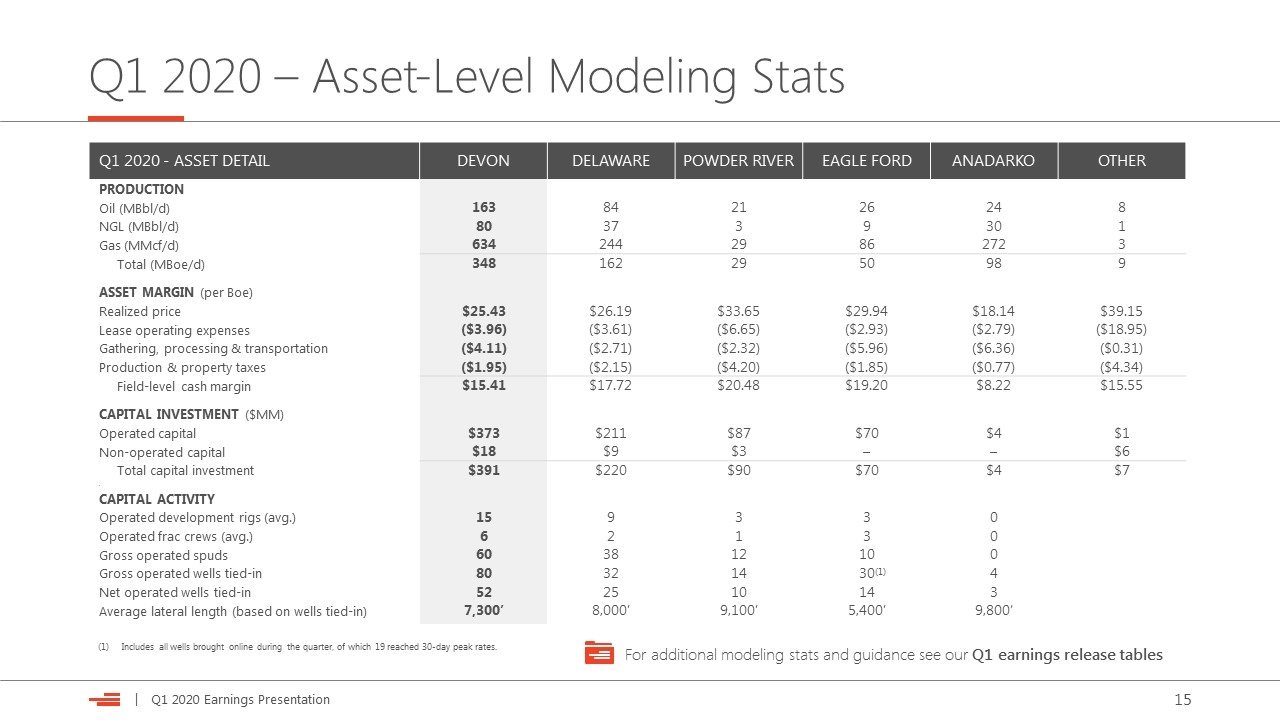
Q1 2020 - ASSET DETAIL DEVON DELAWARE POWDER RIVER EAGLE FORD ANADARKO OTHER PRODUCTION Oil (MBbl/d) 163 84 21 26 24 8 NGL (MBbl/d) 80 37 3 9 30 1 Gas (MMcf/d) 634 244 29 86 272 3 Total (MBoe/d) 348 162 29 50 98 9 ASSET MARGIN (per Boe) Realized price $25.43 $26.19 $33.65 $29.94 $18.14 $39.15 Lease operating expenses ($3.96) ($3.61) ($6.65) ($2.93) ($2.79) ($18.95) Gathering, processing & transportation ($4.11) ($2.71) ($2.32) ($5.96) ($6.36) ($0.31) Production & property taxes ($1.95) ($2.15) ($4.20) ($1.85) ($0.77) ($4.34) Field-level cash margin $15.41 $17.72 $20.48 $19.20 $8.22 $15.55 CAPITAL INVESTMENT ($MM) Operated capital $373 $211 $87 $70 $4 $1 Non-operated capital $18 $9 $3 – – $6 Total capital investment $391 $220 $90 $70 $4 $7 . CAPITAL ACTIVITY Operated development rigs (avg.) 15 9 3 3 0 Operated frac crews (avg.) 6 2 1 3 0 Gross operated spuds 60 38 12 10 0 Gross operated wells tied-in 80 32 14 30(1) 4 Net operated wells tied-in 52 25 10 14 3 Average lateral length (based on wells tied-in) 7,300’ 8,000’ 9,100’ 5,400’ 9,800’ Q1 2020 – Asset-Level Modeling Stats For additional modeling stats and guidance see our Q1 earnings release tables Includes all wells brought online during the quarter, of which 19 reached 30-day peak rates.
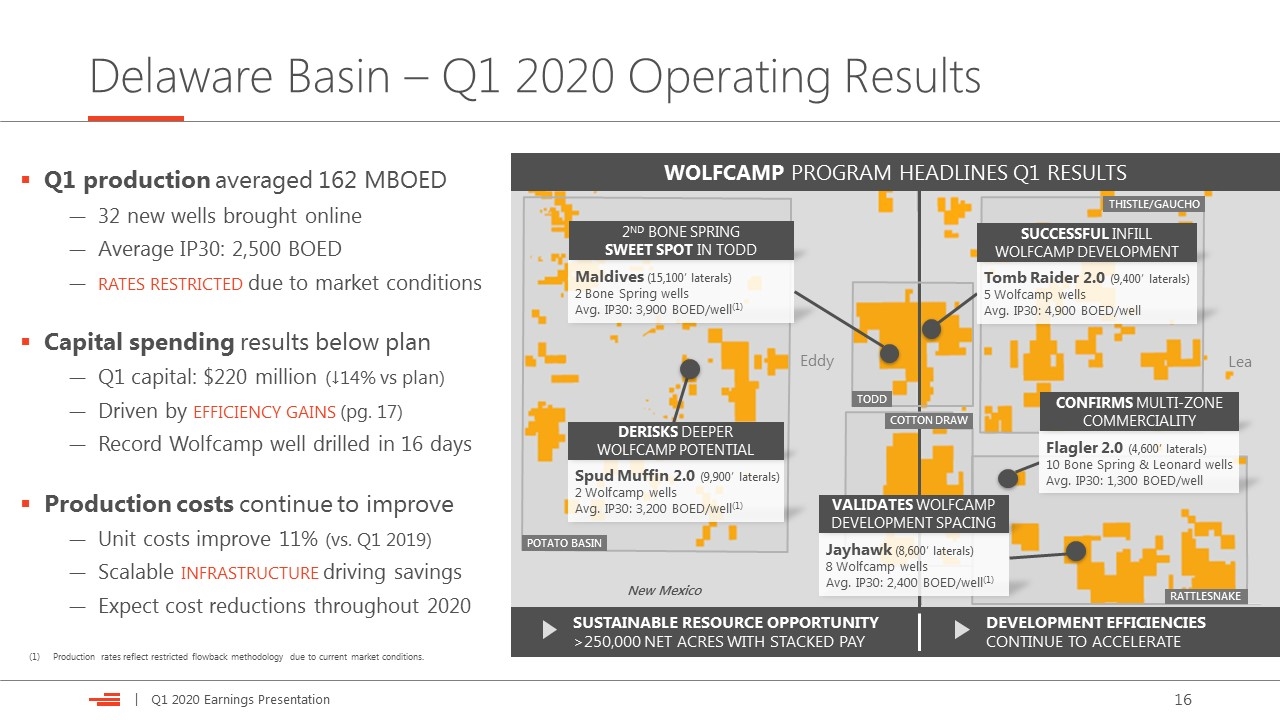
Delaware Basin – Q1 2020 Operating Results Eddy New Mexico Lea POTATO BASIN THISTLE/GAUCHO RATTLESNAKE COTTON DRAW TODD Spud Muffin 2.0 (9,900’ laterals) 2 Wolfcamp wells Avg. IP30: 3,200 BOED/well(1) WOLFCAMP PROGRAM HEADLINES Q1 RESULTS SUSTAINABLE RESOURCE OPPORTUNITY >250,000 NET ACRES WITH STACKED PAY DEVELOPMENT EFFICIENCIES CONTINUE TO ACCELERATE Q1 production averaged 162 MBOED 32 new wells brought online Average IP30: 2,500 BOED rates restricted due to market conditions Capital spending results below plan Q1 capital: $220 million (↓14% vs plan) Driven by efficiency gains (pg. 17) Record Wolfcamp well drilled in 16 days Production costs continue to improve Unit costs improve 11% (vs. Q1 2019) Scalable infrastructure driving savings Expect cost reductions throughout 2020 Production rates reflect restricted flowback methodology due to current market conditions. Maldives (15,100’ laterals) 2 Bone Spring wells Avg. IP30: 3,900 BOED/well(1) 2nd bone SPRING SWEET SPOT IN TODD derisks deeper WOLFCAMP potential Jayhawk (8,600’ laterals) 8 Wolfcamp wells Avg. IP30: 2,400 BOED/well(1) validates WOLFCAMP development spacing Flagler 2.0 (4,600’ laterals) 10 Bone Spring & Leonard wells Avg. IP30: 1,300 BOED/well confirms multi-zone commerciality Tomb Raider 2.0 (9,400’ laterals) 5 Wolfcamp wells Avg. IP30: 4,900 BOED/well Successful infill WOLFCAMP development
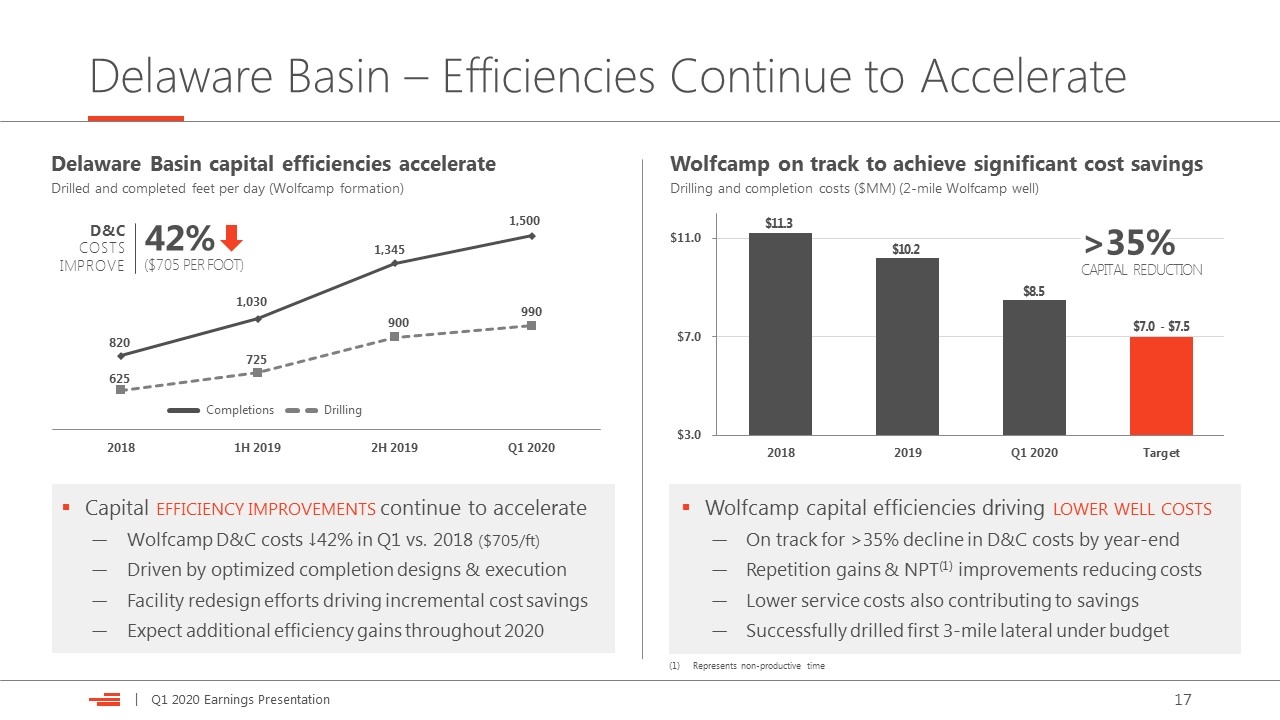
Delaware Basin – Efficiencies Continue to Accelerate Delaware Basin capital efficiencies accelerate Drilled and completed feet per day (Wolfcamp formation) Drilling Completions 990 900 625 Wolfcamp capital efficiencies driving lower well costs On track for >35% decline in D&C costs by year-end Repetition gains & NPT(1) improvements reducing costs Lower service costs also contributing to savings Successfully drilled first 3-mile lateral under budget 725 Capital efficiency improvements continue to accelerate Wolfcamp D&C costs ↓42% in Q1 vs. 2018 ($705/ft) Driven by optimized completion designs & execution Facility redesign efforts driving incremental cost savings Expect additional efficiency gains throughout 2020 Wolfcamp on track to achieve significant cost savings Drilling and completion costs ($MM) (2-mile Wolfcamp well) $7.0 - $7.5 >35% CAPITAL REDUCTION $8.5 $10.2 $11.3 Represents non-productive time D&C COSTS IMPROVE 42% ($705 PER FOOT)
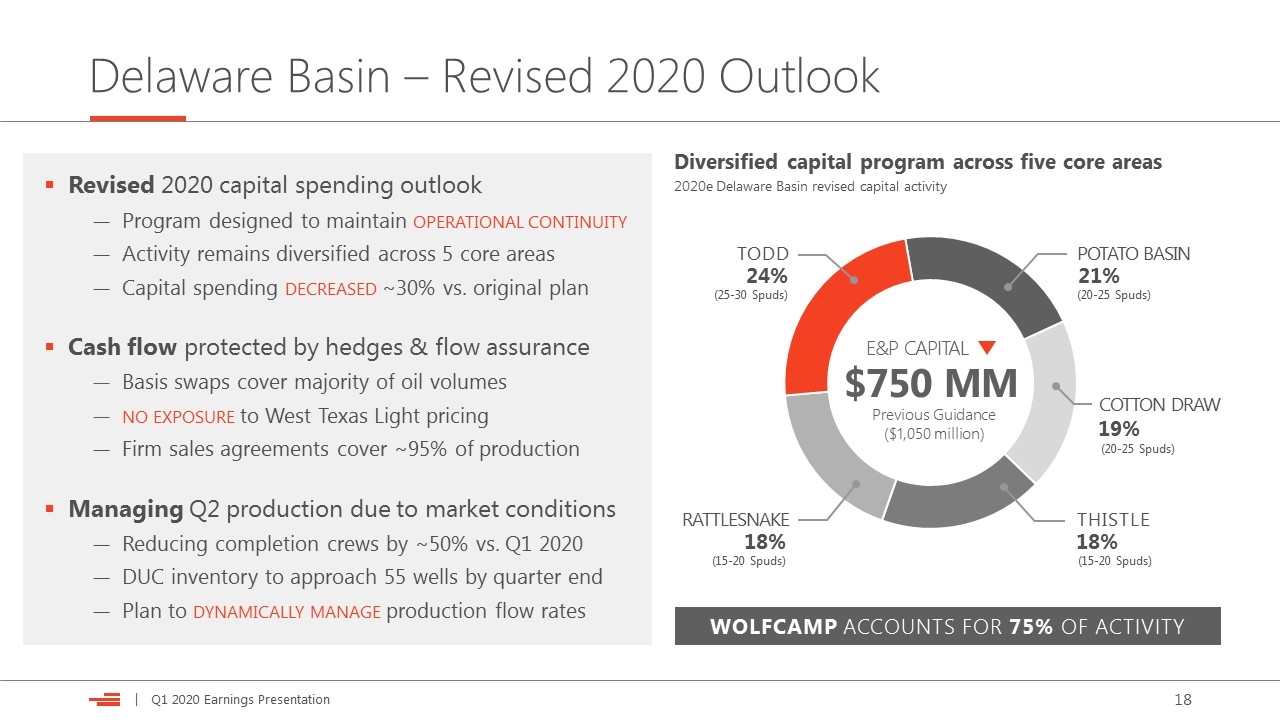
Delaware Basin – Revised 2020 Outlook COTTON DRAW THISTLE RATTLESNAKE POTATO BASIN TODD 19% 21% 18% 18% 24% WOLFCAMP ACCOUNTS FOR 75% OF ACTIVITY $750 MM E&P CAPITAL Previous Guidance ($1,050 million) Diversified capital program across five core areas 2020e Delaware Basin revised capital activity (20-25 Spuds) (25-30 Spuds) (20-25 Spuds) (15-20 Spuds) (15-20 Spuds) Revised 2020 capital spending outlook Program designed to maintain operational continuity Activity remains diversified across 5 core areas Capital spending decreased ~30% vs. original plan Cash flow protected by hedges & flow assurance Basis swaps cover majority of oil volumes no exposure to West Texas Light pricing Firm sales agreements cover ~95% of production Managing Q2 production due to market conditions Reducing completion crews by ~50% vs. Q1 2020 DUC inventory to approach 55 wells by quarter end Plan to dynamically manage production flow rates
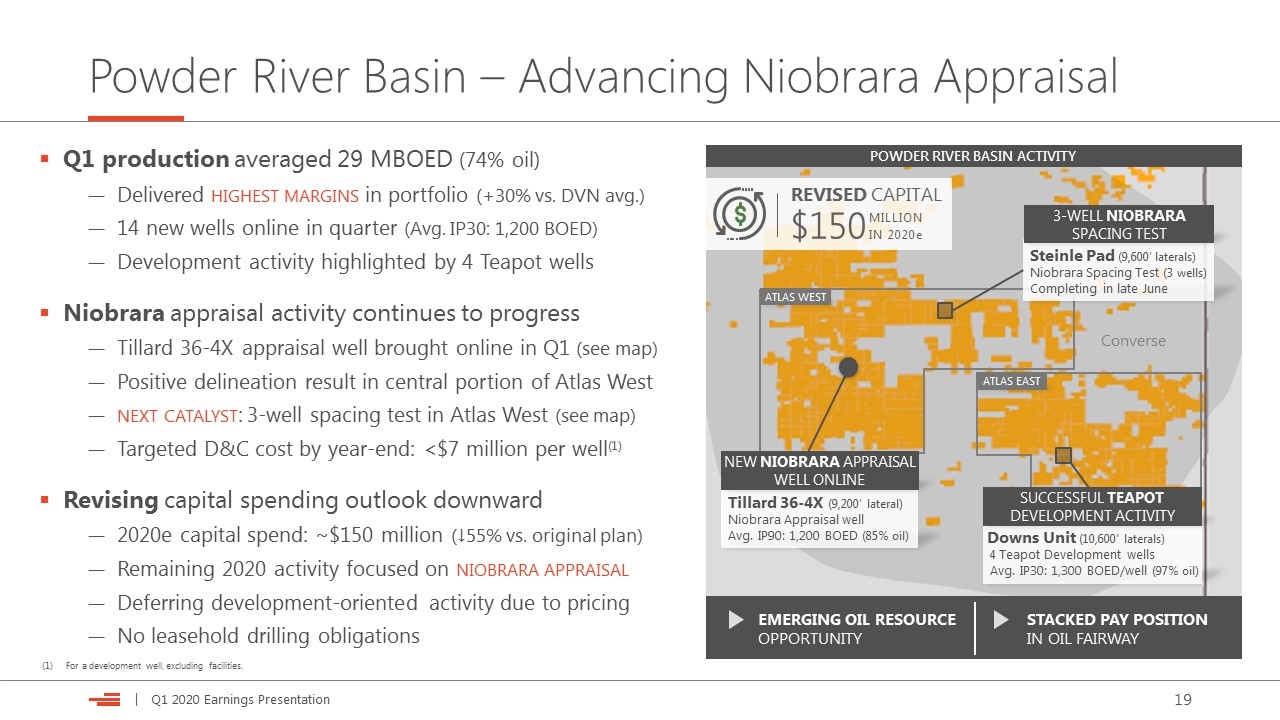
Q1 production averaged 29 MBOED (74% oil) Delivered highest margins in portfolio (+30% vs. DVN avg.) 14 new wells online in quarter (Avg. IP30: 1,200 BOED) Development activity highlighted by 4 Teapot wells Niobrara appraisal activity continues to progress Tillard 36-4X appraisal well brought online in Q1 (see map) Positive delineation result in central portion of Atlas West next catalyst: 3-well spacing test in Atlas West (see map) Targeted D&C cost by year-end: <$7 million per well(1) Revising capital spending outlook downward 2020e capital spend: ~$150 million (↓55% vs. original plan) Remaining 2020 activity focused on niobrara appraisal Deferring development-oriented activity due to pricing No leasehold drilling obligations Powder River Basin – Advancing Niobrara Appraisal STACKED PAY POSITION IN OIL FAIRWAY EMERGING OIL RESOURCE OPPORTUNITY STACKED PAY POSITION IN OIL FAIRWAY POWDER RIVER BASIN ACTIVITY Converse ATLAS WEST ATLAS EAST Tillard 36-4X (9,200’ lateral) Niobrara Appraisal well Avg. IP90: 1,200 BOED (85% oil) Steinle Pad (9,600’ laterals) Niobrara Spacing Test (3 wells) Completing in late June Downs Unit (10,600’ laterals) 4 Teapot Development wells Avg. IP30: 1,300 BOED/well (97% oil) REVISED CAPITAL MILLION IN 2020e $150 NEW NIOBRARA APPRAISAL WELL ONLINE SUCCESSFUL TEAPOT DEVELOPMENT ACTIVITY For a development well, excluding facilities. 3-WELL NIOBRAra SPACING TEST
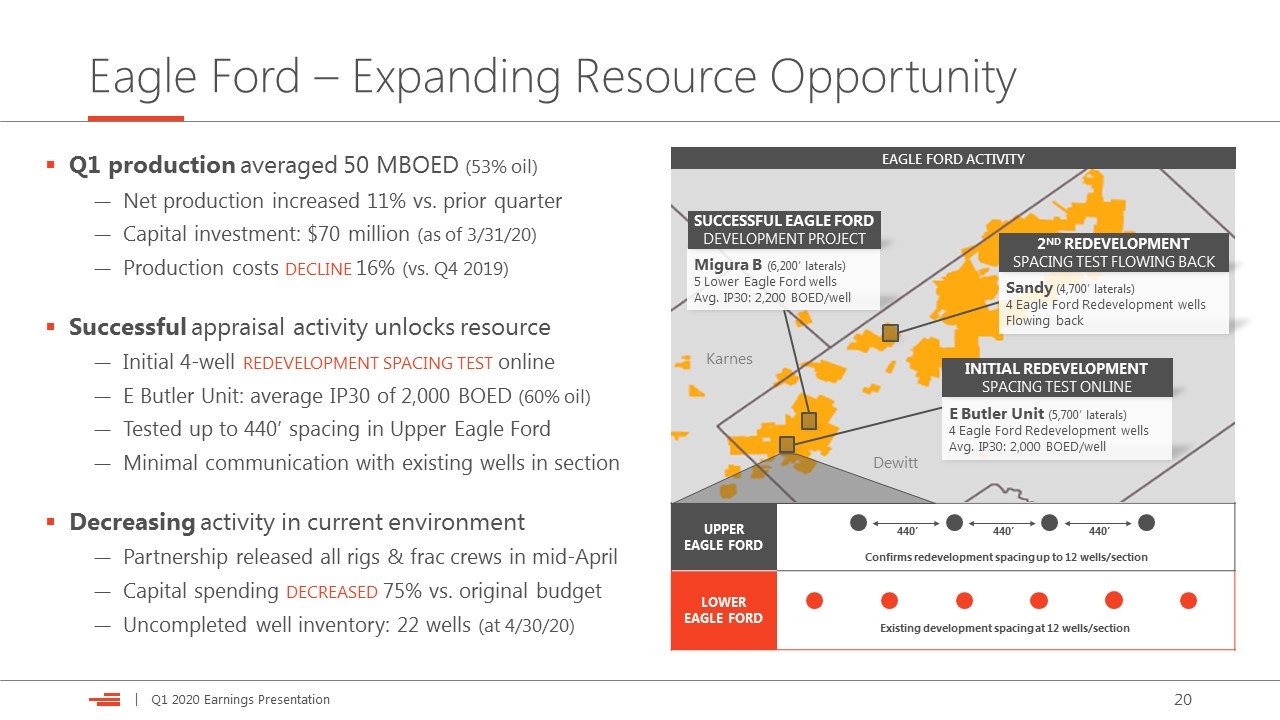
Eagle Ford – Expanding Resource Opportunity Q1 production averaged 50 MBOED (53% oil) Net production increased 11% vs. prior quarter Capital investment: $70 million (as of 3/31/20) Production costs decline 16% (vs. Q4 2019) Successful appraisal activity unlocks resource Initial 4-well redevelopment spacing test online E Butler Unit: average IP30 of 2,000 BOED (60% oil) Tested up to 440’ spacing in Upper Eagle Ford Minimal communication with existing wells in section Decreasing activity in current environment Partnership released all rigs & frac crews in mid-April Capital spending decreased 75% vs. original budget Uncompleted well inventory: 22 wells (at 4/30/20) EAGLE FORD ACTIVITY Dewitt Karnes E Butler Unit (5,700’ laterals) 4 Eagle Ford Redevelopment wells Avg. IP30: 2,000 BOED/well UPPER EAGLE FORD LOWER EAGLE FORD 440’ Confirms redevelopment spacing up to 12 wells/section Existing development spacing at 12 wells/section Sandy (4,700’ laterals) 4 Eagle Ford Redevelopment wells Flowing back 440’ 440’ Migura B (6,200’ laterals) 5 Lower Eagle Ford wells Avg. IP30: 2,200 BOED/well SUCCESSFUL Eagle FORD DEVELOPMENT project 2nd redevelopment spacing test flowing back Initial REDEVELOPMENT SPACING TEST online
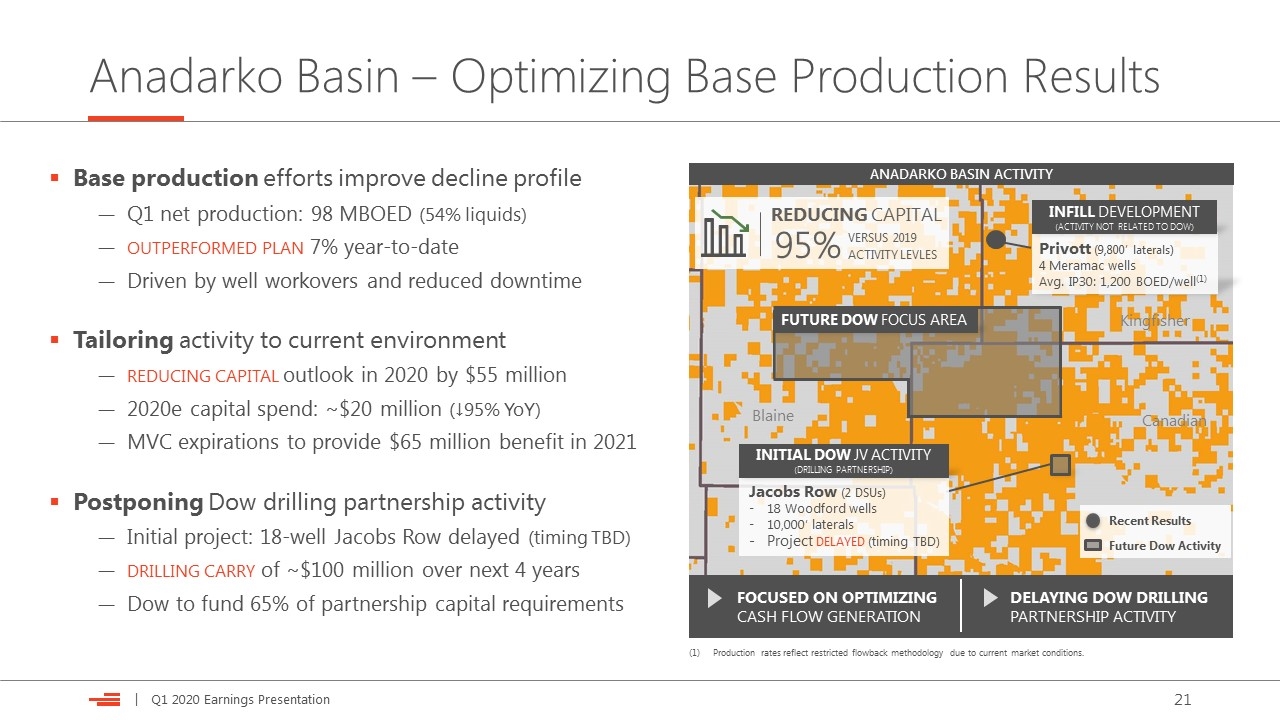
Anadarko Basin – Optimizing Base Production Results Base production efforts improve decline profile Q1 net production: 98 MBOED (54% liquids) outperformed plan 7% year-to-date Driven by well workovers and reduced downtime Tailoring activity to current environment reducing capital outlook in 2020 by $55 million 2020e capital spend: ~$20 million (↓95% YoY) MVC expirations to provide $65 million benefit in 2021 Postponing Dow drilling partnership activity Initial project: 18-well Jacobs Row delayed (timing TBD) drilling carry of ~$100 million over next 4 years Dow to fund 65% of partnership capital requirements ANADARKO BASIN ACTIVITY Blaine Canadian Kingfisher Future Dow Activity DELAYING DOW DRILLING PARTNERSHIP ACTIVITY FUTURE DOW FOCUS AREA Jacobs Row (2 DSUs) 18 Woodford wells 10,000’ laterals Project delayed (timing TBD) Recent Results Privott (9,800’ laterals) 4 Meramac wells Avg. IP30: 1,200 BOED/well(1) REDUCING CAPITAL VERSUS 2019 ACTIVITY LEVLES 95% INFILL DEVELOPMENT (ACTIVITY NOT RELATED TO DOW) INITIAL DOW JV ACTIVITY (DRILLING partnership) FOCUSED ON OPTIMIZING CASH FLOW GENERATION Production rates reflect restricted flowback methodology due to current market conditions.
Investor Contacts & Notices Investor Relations Contacts Scott CoodyChris Carr VP, Investor RelationsManager, Investor Relations 405-552-4735405-228-2496 Email: [email protected] Forward-Looking Statements This presentation includes “forward-looking statements” as defined by the SEC. Such statements include those concerning strategic plans, our expectations and objectives for future operations, as well as other future events or conditions, and are often identified by use of the words and phrases such as “expects,” “believes,” “will,” “would,” “could,” “continue,” “may,” “aims,” “likely to be,” “intends,” “forecasts,” “projections,” “estimates,” “plans,” “expectations,” “targets,” “opportunities,” “potential,” “anticipates,” “outlook” and other similar terminology. All statements, other than statements of historical facts, included in this presentation that address activities, events or developments that Devon expects, believes or anticipates will or may occur in the future are forward-looking statements. Such statements are subject to a number of assumptions, risks and uncertainties, many of which are beyond our control. Consequently, actual future results could differ materially from our expectations due to a number of factors, including, but not limited to those, identified below. The COVID-19 pandemic and its related repercussions have created significant volatility, uncertainty and turmoil in the global economy and our industry. This turmoil has included an unprecedented supply-and-demand imbalance for oil and other commodities, resulting in a swift and material decline in commodity prices in early 2020. Our future actual results could Investor Notices differ materially from the forward-looking statements in this presentation due to the COVID-19 pandemic and related impacts, including, by, among other things: contributing to a sustained or further deterioration in commodity prices; causing takeaway capacity constraints for production, resulting in further production shut-ins and additional downward pressure on impacted regional pricing differentials; limiting our ability to access sources of capital due to disruptions in financial markets; increasing the risk of a downgrade from credit rating agencies; exacerbating counterparty credit risks and the risk of supply chain interruptions; and increasing the risk of operational disruptions due to social distancing measures and other changes to business practices. In addition to the risks associated with the COVID-19 pandemic and its related impacts, our actual future results could differ materially from our expectations due to other factors, including, among other things: the volatility of oil, gas and NGL prices; uncertainties inherent in estimating oil, gas and NGL reserves; the extent to which we are successful in acquiring and discovering additional reserves; the uncertainties, costs and risks involved in our operations, including as a result of employee misconduct; regulatory restrictions, compliance costs and other risks relating to governmental regulation, including with respect to environmental matters; risks related to regulatory, social and market efforts to address climate change; risks related to our hedging activities; counterparty credit risks; risks relating to our indebtedness; cyberattack risks; our limited control over third parties who operate some of our oil and gas properties; midstream capacity constraints and potential interruptions in production; the extent to which insurance covers any losses we may experience; competition for assets, materials, people and capital; risks related to investors attempting to effect change; our ability to successfully complete mergers, acquisitions and divestitures; and any of the other risks and uncertainties discussed in our 2019 Annual Report on Form 10-K, our first-quarter 2020 Form 10-Q and our other filings with the SEC. All subsequent written and oral forward-looking statements attributable to Devon, or persons acting on its behalf, are expressly qualified in their entirety by the cautionary statements above. We assume no duty to update or revise our forward-looking statements based on new information, future events or otherwise. Use of Non-GAAP Information This presentation may include non-GAAP financial measures. Such non-GAAP measures are not alternatives to GAAP measures, and you should not consider these non-GAAP measures in isolation or as a substitute for analysis of our results as reported under GAAP. For additional disclosure regarding such non-GAAP measures, including reconciliations to their most directly comparable GAAP measure, please refer to Devon’s first-quarter 2020 earnings materials at www.devonenergy.com and Form 10-Q filed with the SEC. Cautionary Note to Investors The SEC permits oil and gas companies, in their filings with the SEC, to disclose only proved, probable and possible reserves that meet the SEC's definitions for such terms, and price and cost sensitivities for such reserves, and prohibits disclosure of resources that do not constitute such reserves. This presentation may contain certain terms, such as high-return inventory, potential locations, risked and unrisked locations, estimated ultimate recovery (EUR), exploration target size and other similar terms. These estimates are by their nature more speculative than estimates of proved, probable and possible reserves and accordingly are subject to substantially greater risk of being actually realized. Investors are urged to consider closely the disclosure in our Form 10-K, available at www.devonenergy.com or the SEC’s website.
|
|
|
|

|
|
Exhibit 99.3 |
|
|
|
|
|
|
|
|
|
|
Devon Energy First-Quarter 2020
Supplemental Tables
|
|
|
TABLE OF CONTENTS: |
PAGE: |
|
Income Statement |
2 |
|
Cash Flow Statement |
3 |
|
Balance Sheet |
4 |
|
Production by Asset |
5 |
|
Capital and Well Activity by Asset |
6 |
|
Realized Price by Asset |
7 |
|
Per-Unit Cash Margin by Asset |
8 |
|
Non-GAAP Core Earnings |
9 |
|
Non-GAAP EBITDAX, Net Debt, Net Debt-to-EBITDAX and Free Cash Flow |
10 |
|
CONSOLIDATED STATEMENTS OF EARNINGS |
|
|
|
|
|
|
|
|
|
|
|
|
|
|
|
|
|
|
|
|
|
|
(in millions, except per share amounts) |
|
2020 |
|
|
2019 |
|
|
|
|
|
Quarter 1 |
|
|
Quarter 4 |
|
|
Quarter 3 |
|
|
Quarter 2 |
|
|
Quarter 1 |
|
|
|
Upstream revenues (1) |
|
$ |
1,527 |
|
|
$ |
919 |
|
|
$ |
1,046 |
|
|
$ |
1,076 |
|
|
$ |
314 |
|
|
|
Marketing and midstream revenues |
|
|
560 |
|
|
|
670 |
|
|
|
700 |
|
|
|
730 |
|
|
|
765 |
|
|
|
Total revenues |
|
|
2,087 |
|
|
|
1,589 |
|
|
|
1,746 |
|
|
|
1,806 |
|
|
|
1,079 |
|
|
|
Production expenses (2) |
|
|
318 |
|
|
|
324 |
|
|
|
294 |
|
|
|
296 |
|
|
|
283 |
|
|
|
Exploration expenses |
|
|
112 |
|
|
|
29 |
|
|
|
18 |
|
|
|
7 |
|
|
|
4 |
|
|
|
Marketing and midstream expenses |
|
|
578 |
|
|
|
665 |
|
|
|
684 |
|
|
|
713 |
|
|
|
750 |
|
|
|
Depreciation, depletion and amortization |
|
|
401 |
|
|
|
382 |
|
|
|
381 |
|
|
|
374 |
|
|
|
360 |
|
|
|
Asset impairments |
|
|
2,666 |
|
|
|
- |
|
|
|
- |
|
|
|
- |
|
|
|
- |
|
|
|
Asset dispositions |
|
|
- |
|
|
|
- |
|
|
|
(1 |
) |
|
|
(2 |
) |
|
|
(45 |
) |
|
|
General and administrative expenses |
|
|
102 |
|
|
|
119 |
|
|
|
107 |
|
|
|
114 |
|
|
|
135 |
|
|
|
Financing costs, net |
|
|
65 |
|
|
|
64 |
|
|
|
60 |
|
|
|
66 |
|
|
|
60 |
|
|
|
Restructuring and transaction costs |
|
|
- |
|
|
|
11 |
|
|
|
10 |
|
|
|
12 |
|
|
|
51 |
|
|
|
Other expenses |
|
|
(48 |
) |
|
|
16 |
|
|
|
3 |
|
|
|
7 |
|
|
|
(22 |
) |
|
|
Total expenses |
|
|
4,194 |
|
|
|
1,610 |
|
|
|
1,556 |
|
|
|
1,587 |
|
|
|
1,576 |
|
|
|
Earnings (loss) from continuing operations before income taxes |
|
|
(2,107 |
) |
|
|
(21 |
) |
|
|
190 |
|
|
|
219 |
|
|
|
(497 |
) |
|
|
Income tax expense (benefit) |
|
|
(417 |
) |
|
|
(33 |
) |
|
|
54 |
|
|
|
68 |
|
|
|
(119 |
) |
|
|
Net earnings (loss) from continuing operations |
|
|
(1,690 |
) |
|
|
12 |
|
|
|
136 |
|
|
|
151 |
|
|
|
(378 |
) |
|
|
Net earnings (loss) from discontinued operations, net of taxes |
|
|
(125 |
) |
|
|
(652 |
) |
|
|
(27 |
) |
|
|
344 |
|
|
|
61 |
|
|
|
Net earnings (loss) |
|
|
(1,815 |
) |
|
|
(640 |
) |
|
|
109 |
|
|
|
495 |
|
|
|
(317 |
) |
|
|
Net earnings attributable to noncontrolling interests |
|
|
1 |
|
|
|
2 |
|
|
|
— |
|
|
|
— |
|
|
|
— |
|
|
|
Net earnings (loss) attributable to Devon |
|
$ |
(1,816 |
) |
|
$ |
(642 |
) |
|
$ |
109 |
|
|
$ |
495 |
|
|
$ |
(317 |
) |
|
|
|
|
|
|
|
|
|
|
|
|
|
|
|
|
|
|
|
|
|
|
|
|
|
Basic net earnings (loss) per share: |
|
|
|
|
|
|
|
|
|
|
|
|
|
|
|
|
|
|
|
|
|
|
Continuing operations |
|
$ |
(4.48 |
) |
|
$ |
0.03 |
|
|
$ |
0.34 |
|
|
$ |
0.37 |
|
|
$ |
(0.89 |
) |
|
|
Discontinued operations |
|
|
(0.34 |
) |
|
|
(1.73 |
) |
|
|
(0.07 |
) |
|
|
0.83 |
|
|
|
0.15 |
|
|
|
Basic net earnings (loss) per share |
|
$ |
(4.82 |
) |
|
$ |
(1.70 |
) |
|
$ |
0.27 |
|
|
$ |
1.20 |
|
|
$ |
(0.74 |
) |
|
|
Diluted net earnings (loss) per share: |
|
|
|
|
|
|
|
|
|
|
|
|
|
|
|
|
|
|
|
|
|
|
Continuing operations |
|
$ |
(4.48 |
) |
|
$ |
0.03 |
|
|
$ |
0.34 |
|
|
$ |
0.37 |
|
|
$ |
(0.89 |
) |
|
|
Discontinued operations |
|
|
(0.34 |
) |
|
|
(1.73 |
) |
|
|
(0.07 |
) |
|
|
0.82 |
|
|
|
0.15 |
|
|
|
Diluted net earnings (loss) per share |
|
$ |
(4.82 |
) |
|
$ |
(1.70 |
) |
|
$ |
0.27 |
|
|
$ |
1.19 |
|
|
$ |
(0.74 |
) |
|
|
|
|
|
|
|
|
|
|
|
|
|
|
|
|
|
|
|
|
|
|
|
|
|
Weighted average common shares outstanding: |
|
|
|
|
|
|
|
|
|
|
|
|
|
|
|
|
|
|
|
|
|
|
Basic |
|
|
383 |
|
|
|
383 |
|
|
|
397 |
|
|
|
415 |
|
|
|
434 |
|
|
|
Diluted |
|
|
383 |
|
|
|
385 |
|
|
|
399 |
|
|
|
417 |
|
|
|
434 |
|
|
|
(1) UPSTREAM REVENUES |
|
|
|
|
|
|
|
|
|
|
|
|
|
|
|
|
|
|
|
|
|
|
(in millions) |
|
2020 |
|
|
2019 |
|
|
|
|
|
Quarter 1 |
|
|
Quarter 4 |
|
|
Quarter 3 |
|
|
Quarter 2 |
|
|
Quarter 1 |
|
|
|
Oil, gas and NGL sales |
|
$ |
807 |
|
|
$ |
1,035 |
|
|
$ |
919 |
|
|
$ |
936 |
|
|
$ |
919 |
|
|
|
Derivative cash settlements |
|
|
101 |
|
|
|
42 |
|
|
|
71 |
|
|
|
23 |
|
|
|
34 |
|
|
|
Derivative valuation changes |
|
|
619 |
|
|
|
(158 |
) |
|
|
56 |
|
|
|
117 |
|
|
|
(639 |
) |
|
|
Upstream revenues |
|
$ |
1,527 |
|
|
$ |
919 |
|
|
$ |
1,046 |
|
|
$ |
1,076 |
|
|
$ |
314 |
|
|
|
(2) PRODUCTION EXPENSES |
|
|
|
|
|
|
|
|
|
|
|
|
|
|
|
|
|
|
|
|
|
|
(in millions) |
|
2020 |
|
|
2019 |
|
|
|
|
|
Quarter 1 |
|
|
Quarter 4 |
|
|
Quarter 3 |
|
|
Quarter 2 |
|
|
Quarter 1 |
|
|
|
Lease operating expense |
|
$ |
126 |
|
|
$ |
120 |
|
|
$ |
118 |
|
|
$ |
114 |
|
|
$ |
110 |
|
|
|
Gathering, processing & transportation |
|
|
130 |
|
|
|
131 |
|
|
|
112 |
|
|
|
111 |
|
|
|
109 |
|
|
|
Production taxes |
|
|
56 |
|
|
|
69 |
|
|
|
58 |
|
|
|
64 |
|
|
|
60 |
|
|
|
Property taxes |
|
|
6 |
|
|
|
4 |
|
|
|
6 |
|
|
|
7 |
|
|
|
4 |
|
|
|
Production expenses |
|
$ |
318 |
|
|
$ |
324 |
|
|
$ |
294 |
|
|
$ |
296 |
|
|
$ |
283 |
|
|
2
|
CONSOLIDATED STATEMENTS OF CASH FLOWS |
|
|
|
|
|
|
|
|
|
|
|
|
|
|
|
|
|
|
|
|
|
(in millions) |
|
2020 |
|
|
2019 |
|
|
|
|
Quarter 1 |
|
|
Quarter 4 |
|
|
Quarter 3 |
|
|
Quarter 2 |
|
|
Quarter 1 |
|
|
Cash flows from operating activities: |
|
|
|
|
|
|
|
|
|
|
|
|
|
|
|
|
|
|
|
|
|
Net earnings (loss) |
|
$ |
(1,815 |
) |
|
$ |
(640 |
) |
|
$ |
109 |
|
|
$ |
495 |
|
|
$ |
(317 |
) |
|
Adjustments to reconcile net earnings (loss) to net cash from operating
activities: |
|
|
|
|
|
|
|
|
|
|
|
|
|
|
|
|
|
|
|
|
|
Net (earnings) loss from discontinued operations, net of income taxes |
|
|
125 |
|
|
|
652 |
|
|
|
27 |
|
|
|
(344 |
) |
|
|
(61 |
) |
|
Depreciation, depletion and amortization |
|
|
401 |
|
|
|
382 |
|
|
|
381 |
|
|
|
374 |
|
|
|
360 |
|
|
Asset impairments |
|
|
2,666 |
|
|
|
— |
|
|
|
— |
|
|
|
— |
|
|
|
— |
|
|
Leasehold impairments |
|
|
110 |
|
|
|
3 |
|
|
|
13 |
|
|
|
1 |
|
|
|
1 |
|
|
Accretion on discounted liabilities |
|
|
8 |
|
|
|
8 |
|
|
|
8 |
|
|
|
8 |
|
|
|
9 |
|
|
Total (gains) losses on commodity derivatives |
|
|
(720 |
) |
|
|
116 |
|
|
|
(127 |
) |
|
|
(140 |
) |
|
|
605 |
|
|
Cash settlements on commodity derivatives |
|
|
101 |
|
|
|
41 |
|
|
|
71 |
|
|
|
23 |
|
|
|
31 |
|
|
Gains on asset dispositions |
|
|
— |
|
|
|
— |
|
|
|
(1 |
) |
|
|
(2 |
) |
|
|
(45 |
) |
|
Deferred income tax expense (benefit) |
|
|
(311 |
) |
|
|
(27 |
) |
|
|
52 |
|
|
|
65 |
|
|
|
(115 |
) |
|
Share-based compensation |
|
|
20 |
|
|
|
24 |
|
|
|
24 |
|
|
|
23 |
|
|
|
44 |
|
|
Other |
|
|
— |
|
|
|
2 |
|
|
|
2 |
|
|
|
4 |
|
|
|
(14 |
) |
|
Changes in assets and liabilities, net |
|
|
(56 |
) |
|
|
18 |
|
|
|
36 |
|
|
|
(75 |
) |
|
|
(61 |
) |
|
Net cash from operating activities - continuing operations |
|
|
529 |
|
|
|
579 |
|
|
|
595 |
|
|
|
432 |
|
|
|
437 |
|
|
Cash flows from investing activities: |
|
|
|
|
|
|
|
|
|
|
|
|
|
|
|
|
|
|
|
|
|
Capital expenditures |
|
|
(425 |
) |
|
|
(408 |
) |
|
|
(526 |
) |
|
|
(486 |
) |
|
|
(490 |
) |
|
Acquisitions of property and equipment |
|
|
(4 |
) |
|
|
(3 |
) |
|
|
(5 |
) |
|
|
(13 |
) |
|
|
(10 |
) |
|
Divestitures of property and equipment |
|
|
25 |
|
|
|
43 |
|
|
|
9 |
|
|
|
28 |
|
|
|
310 |
|
|
Net cash from investing activities - continuing operations |
|
|
(404 |
) |
|
|
(368 |
) |
|
|
(522 |
) |
|
|
(471 |
) |
|
|
(190 |
) |
|
Cash flows from financing activities: |
|
|
|
|
|
|
|
|
|
|
|
|
|
|
|
|
|
|
|
|
|
Repayments of long-term debt |
|
|
— |
|
|
|
— |
|
|
|
— |
|
|
|
— |
|
|
|
(162 |
) |
|
Repurchases of common stock |
|
|
(38 |
) |
|
|
(103 |
) |
|
|
(560 |
) |
|
|
(187 |
) |
|
|
(999 |
) |
|
Dividends paid on common stock |
|
|
(34 |
) |
|
|
(34 |
) |
|
|
(35 |
) |
|
|
(37 |
) |
|
|
(34 |
) |
|
Contributions from noncontrolling interests |
|
|
5 |
|
|
|
116 |
|
|
|
— |
|
|
|
— |
|
|
|
— |
|
|
Distributions to noncontrolling interest |
|
|
(3 |
) |
|
|
— |
|
|
|
— |
|
|
|
— |
|
|
|
— |
|
|
Shares exchanged for tax withholdings and other |
|
|
(17 |
) |
|
|
(3 |
) |
|
|
(1 |
) |
|
|
(3 |
) |
|
|
(19 |
) |
|
Net cash from financing activities - continuing operations |
|
|
(87 |
) |
|
|
(24 |
) |
|
|
(596 |
) |
|
|
(227 |
) |
|
|
(1,214 |
) |
|
Net change in cash, cash equivalents and restricted cash of continuing
operations |
|
|
38 |
|
|
|
187 |
|
|
|
(523 |
) |
|
|
(266 |
) |
|
|
(967 |
) |
|
Cash flows from discontinued operations: |
|
|
|
|
|
|
|
|
|
|
|
|
|
|
|
|
|
|
|
|
|
Operating activities (1) |
|
|
(131 |
) |
|
|
(8 |
) |
|
|
(95 |
) |
|
|
190 |
|
|
|
(59 |
) |
|
Investing activities |
|
|
(1 |
) |
|
|
— |
|
|
|
(5 |
) |
|
|
2,536 |
|
|
|
(59 |
) |
|
Financing activities |
|
|
— |
|
|
|
— |
|
|
|
(1,571 |
) |
|
|
— |
|
|
|
(7 |
) |
|
Effect of exchange rate changes on cash |
|
|
(23 |
) |
|
|
9 |
|
|
|
(3 |
) |
|
|
38 |
|
|
|
1 |
|
|
Net change in cash, cash equivalents and restricted cash of discontinued
operations |
|
|
(155 |
) |
|
|
1 |
|
|
|
(1,674 |
) |
|
|
2,764 |
|
|
|
(124 |
) |
|
Net change in cash, cash equivalents and restricted cash |
|
|
(117 |
) |
|
|
188 |
|
|
|
(2,197 |
) |
|
|
2,498 |
|
|
|
(1,091 |
) |
|
Cash, cash equivalents and restricted cash at beginning of period |
|
|
1,844 |
|
|
|
1,656 |
|
|
|
3,853 |
|
|
|
1,355 |
|
|
|
2,446 |
|
|
Cash, cash equivalents and restricted cash at end of period |
|
$ |
1,727 |
|
|
$ |
1,844 |
|
|
$ |
1,656 |
|
|
$ |
3,853 |
|
|
$ |
1,355 |
|
|
|
|
|
|
|
|
|
|
|
|
|
|
|
|
|
|
|
|
|
|
|
|
Reconciliation of cash, cash equivalents and restricted cash: |
|
|
|
|
|
|
|
|
|
|
|
|
|
|
|
|
|
|
|
|
|
Cash and cash equivalents |
|
$ |
1,527 |
|
|
$ |
1,464 |
|
|
$ |
1,375 |
|
|
$ |
3,470 |
|
|
$ |
1,327 |
|
|
Cash restricted for discontinued operations |
|
|
200 |
|
|
|
380 |
|
|
|
280 |
|
|
|
370 |
|
|
|
— |
|
|
Restricted cash included in other current assets |
|
|
— |
|
|
|
— |
|
|
|
1 |
|
|
|
13 |
|
|
|
28 |
|
|
Total cash, cash equivalents and restricted cash |
|
$ |
1,727 |
|
|
$ |
1,844 |
|
|
$ |
1,656 |
|
|
$ |
3,853 |
|
|
$ |
1,355 |
|
(1) In the first quarter of 2020, operating cash flow from discontinued operations was impacted by a one-time tax payment of approximately $150 million related to the divestiture of the company’s Canadian operations.
3
|
CONSOLIDATED BALANCE SHEETS |
|
|
|
|
|
|
|
|
(in millions) |
March 31, |
|
|
December 31, |
|
|
|
2020 |
|
|
2019 |
|
|
Current assets: |
|
|
|
|
|
|
|
|
Cash and cash equivalents |
$ |
1,527 |
|
|
$ |
1,464 |
|
|
Cash restricted for discontinued operations |
|
200 |
|
|
|
380 |
|
|
Accounts receivable |
|
594 |
|
|
|
832 |
|
|
Current assets associated with discontinued operations |
|
736 |
|
|
|
896 |
|
|
Other current assets |
|
998 |
|
|
|
279 |
|
|
Total current assets |
|
4,055 |
|
|
|
3,851 |
|
|
Oil and gas property and equipment, based on successful efforts accounting, net |
|
4,756 |
|
|
|
7,558 |
|
|
Other property and equipment, net |
|
1,024 |
|
|
|
1,035 |
|
|
Total property and equipment, net |
|
5,780 |
|
|
|
8,593 |
|
|
Goodwill |
|
753 |
|
|
|
753 |
|
|
Right-of-use assets |
|
237 |
|
|
|
243 |
|
|
Other long-term assets |
|
245 |
|
|
|
196 |
|
|
Long-term assets associated with discontinued operations |
|
74 |
|
|
|
81 |
|
|
Total assets |
$ |
11,144 |
|
|
$ |
13,717 |
|
|
|
|
|
|
|
|
|
|
|
Current liabilities: |
|
|
|
|
|
|
|
|
Accounts payable |
$ |
444 |
|
|
$ |
428 |
|
|
Revenues and royalties payable |
|
617 |
|
|
|
730 |
|
|
Current liabilities associated with discontinued operations |
|
294 |
|
|
|
459 |
|
|
Other current liabilities |
|
199 |
|
|
|
310 |
|
|
Total current liabilities |
|
1,554 |
|
|
|
1,927 |
|
|
Long-term debt |
|
4,295 |
|
|
|
4,294 |
|
|
Lease liabilities |
|
245 |
|
|
|
244 |
|
|
Asset retirement obligations |
|
386 |
|
|
|
380 |
|
|
Other long-term liabilities |
|
461 |
|
|
|
426 |
|
|
Long-term liabilities associated with discontinued operations |
|
163 |
|
|
|
185 |
|
|
Deferred income taxes |
|
— |
|
|
|
341 |
|
|
Stockholders' equity: |
|
|
|
|
|
|
|
|
Common stock |
|
38 |
|
|
|
38 |
|
|
Additional paid-in capital |
|
2,701 |
|
|
|
2,735 |
|
|
Retained earnings |
|
1,298 |
|
|
|
3,148 |
|
|
Accumulated other comprehensive loss |
|
(118 |
) |
|
|
(119 |
) |
|
Total stockholders’ equity attributable to Devon |
|
3,919 |
|
|
|
5,802 |
|
|
Noncontrolling interests |
|
121 |
|
|
|
118 |
|
|
Total equity |
|
4,040 |
|
|
|
5,920 |
|
|
Total liabilities and equity |
$ |
11,144 |
|
|
$ |
13,717 |
|
|
|
|
|
|
|
|
|
|
|
Common shares outstanding |
|
383 |
|
|
|
382 |
|
4
|
PRODUCTION TREND |
|
|
|
|
|
|
|
|
|
|
|
|
|
|
|
|
|
|
|
|
|
|
|
2020 |
|
|
2019 |
|
|
|
|
Quarter 1 |
|
|
Quarter 4 |
|
|
Quarter 3 |
|
|
Quarter 2 |
|
|
Quarter 1 |
|
|
Oil (MBbls/d) |
|
|
|
|
|
|
|
|
|
|
|
|
|
|
|
|
|
|
|
|
|
Delaware Basin |
|
|
84 |
|
|
|
84 |
|
|
|
70 |
|
|
|
67 |
|
|
|
60 |
|
|
Powder River Basin |
|
|
21 |
|
|
|
20 |
|
|
|
18 |
|
|
|
15 |
|
|
|
15 |
|
|
Eagle Ford |
|
|
26 |
|
|
|
23 |
|
|
|
22 |
|
|
|
23 |
|
|
|
25 |
|
|
Anadarko Basin |
|
|
24 |
|
|
|
27 |
|
|
|
32 |
|
|
|
31 |
|
|
|
32 |
|
|
Other |
|
|
8 |
|
|
|
9 |
|
|
|
9 |
|
|
|
8 |
|
|
|
9 |
|
|
Total |
|
|
163 |
|
|
|
163 |
|
|
|
151 |
|
|
|
144 |
|
|
|
141 |
|
|
Natural gas liquids (MBbls/d) |
|
|
|
|
|
|
|
|
|
|
|
|
|
|
|
|
|
|
|
|
|
Delaware Basin |
|
|
37 |
|
|
|
32 |
|
|
|
28 |
|
|
|
27 |
|
|
|
23 |
|
|
Powder River Basin |
|
|
3 |
|
|
|
2 |
|
|
|
2 |
|
|
|
2 |
|
|
|
2 |
|
|
Eagle Ford |
|
|
9 |
|
|
|
9 |
|
|
|
11 |
|
|
|
12 |
|
|
|
12 |
|
|
Anadarko Basin |
|
|
30 |
|
|
|
30 |
|
|
|
37 |
|
|
|
40 |
|
|
|
35 |
|
|
Other |
|
|
1 |
|
|
|
1 |
|
|
|
1 |
|
|
|
1 |
|
|
|
2 |
|
|
Total |
|
|
80 |
|
|
|
74 |
|
|
|
79 |
|
|
|
82 |
|
|
|
74 |
|
|
Gas (MMcf/d) |
|
|
|
|
|
|
|
|
|
|
|
|
|
|
|
|
|
|
|
|
|
Delaware Basin |
|
|
244 |
|
|
|
234 |
|
|
|
167 |
|
|
|
158 |
|
|
|
146 |
|
|
Powder River Basin |
|
|
29 |
|
|
|
28 |
|
|
|
28 |
|
|
|
22 |
|
|
|
18 |
|
|
Eagle Ford |
|
|
86 |
|
|
|
76 |
|
|
|
75 |
|
|
|
81 |
|
|
|
83 |
|
|
Anadarko Basin |
|
|
272 |
|
|
|
295 |
|
|
|
317 |
|
|
|
313 |
|
|
|
333 |
|
|
Other |
|
|
3 |
|
|
|
4 |
|
|
|
4 |
|
|
|
4 |
|
|
|
8 |
|
|
Total |
|
|
634 |
|
|
|
637 |
|
|
|
591 |
|
|
|
578 |
|
|
|
588 |
|
|
Total oil equivalent (MBoe/d) |
|
|
|
|
|
|
|
|
|
|
|
|
|
|
|
|
|
|
|
|
|
Delaware Basin |
|
|
162 |
|
|
|
154 |
|
|
|
127 |
|
|
|
120 |
|
|
|
107 |
|
|
Powder River Basin |
|
|
29 |
|
|
|
27 |
|
|
|
25 |
|
|
|
21 |
|
|
|
21 |
|
|
Eagle Ford |
|
|
50 |
|
|
|
45 |
|
|
|
45 |
|
|
|
49 |
|
|
|
50 |
|
|
Anadarko Basin |
|
|
98 |
|
|
|
107 |
|
|
|
121 |
|
|
|
124 |
|
|
|
123 |
|
|
Other |
|
|
9 |
|
|
|
10 |
|
|
|
10 |
|
|
|
10 |
|
|
|
12 |
|
|
Total |
|
|
348 |
|
|
|
343 |
|
|
|
328 |
|
|
|
324 |
|
|
|
313 |
|
|
|
|
|
|
|
|
|
|
|
|
|
|
|
|
|
|
|
|
|
|
|
|
|
|
|
|
|
|
|
|
|
|
|
|
|
|
|
|
|
|
|
|
|
|
|
|
2020 |
|
|
2019 |
|
|
|
|
Quarter 1 |
|
|
Quarter 4 |
|
|
Quarter 3 |
|
|
Quarter 2 |
|
|
Quarter 1 |
|
|
Barnett divest assets (discontinued operations) |
|
|
|
|
|
|
|
|
|
|
|
|
|
|
|
|
|
|
|
|
|
Oil (MBbls/d) |
|
|
— |
|
|
|
— |
|
|
|
— |
|
|
|
1 |
|
|
|
1 |
|
|
Natural gas liquids (MBbls/d) |
|
|
31 |
|
|
|
30 |
|
|
|
30 |
|
|
|
30 |
|
|
|
30 |
|
|
Gas (MMcf/d) |
|
|
408 |
|
|
|
408 |
|
|
|
414 |
|
|
|
420 |
|
|
|
432 |
|
|
Total oil equivalent (MBoe/d) |
|
|
99 |
|
|
|
98 |
|
|
|
100 |
|
|
|
100 |
|
|
|
103 |
|
5
|
UPSTREAM CAPITAL EXPENDITURES |
|
|
|
|
|
|
|
|
|
|
|
|
|
|
|
|
|
|
|
|
|
(in millions) |
|
2020 |
|
|
2019 |
|
|
|
|
Quarter 1 |
|
|
Quarter 4 |
|
|
Quarter 3 |
|
|
Quarter 2 |
|
|
Quarter 1 |
|
|
Delaware Basin |
|
$ |
220 |
|
|
$ |
170 |
|
|
$ |
262 |
|
|
$ |
235 |
|
|
$ |
240 |
|
|
Powder River Basin |
|
|
90 |
|
|
|
89 |
|
|
|
89 |
|
|
|
87 |
|
|
|
48 |
|
|
Eagle Ford |
|
|
70 |
|
|
|
65 |
|
|
|
90 |
|
|
|
53 |
|
|
|
48 |
|
|
Anadarko Basin |
|
|
4 |
|
|
|
38 |
|
|
|
67 |
|
|
|
94 |
|
|
|
112 |
|
|
Other |
|
|
7 |
|
|
|
12 |
|
|
|
12 |
|
|
|
12 |
|
|
|
12 |
|
|
Total upstream capital |
|
$ |
391 |
|
|
$ |
374 |
|
|
$ |
520 |
|
|
$ |
481 |
|
|
$ |
460 |
|
|
GROSS OPERATED SPUDS |
|
|
|
|
|
|
|
|
|
|
|
|
|
|
|
|
|
|
|
|
|
|
|
2020 |
|
|
2019 |
|
|
|
|
Quarter 1 |
|
|
Quarter 4 |
|
|
Quarter 3 |
|
|
Quarter 2 |
|
|
Quarter 1 |
|
|
Delaware Basin |
|
|
38 |
|
|
|
24 |
|
|
|
38 |
|
|
|
23 |
|
|
|
39 |
|
|
Powder River Basin |
|
|
12 |
|
|
|
19 |
|
|
|
14 |
|
|
|
17 |
|
|
|
9 |
|
|
Eagle Ford |
|
|
10 |
|
|
|
25 |
|
|
|
18 |
|
|
|
31 |
|
|
|
12 |
|
|
Anadarko Basin |
|
|
— |
|
|
|
— |
|
|
|
4 |
|
|
|
16 |
|
|
|
18 |
|
|
Total |
|
|
60 |
|
|
|
68 |
|
|
|
74 |
|
|
|
87 |
|
|
|
78 |
|
|
GROSS OPERATED WELLS TIED-IN |
|
|
|
|
|
|
|
|
|
|
|
|
|
|
|
|
|
|
|
|
|
|
|
2020 |
|
|
2019 |
|
|
|
|
Quarter 1 |
|
|
Quarter 4 |
|
|
Quarter 3 |
|
|
Quarter 2 |
|
|
Quarter 1 |
|
|
Delaware Basin |
|
|
32 |
|
|
|
36 |
|
|
|
34 |
|
|
|
28 |
|
|
|
25 |
|
|
Powder River Basin |
|
|
14 |
|
|
|
19 |
|
|
|
18 |
|
|
|
6 |
|
|
|
3 |
|
|
Eagle Ford |
|
|
30 |
|
|
|
21 |
|
|
|
— |
|
|
|
9 |
|
|
|
18 |
|
|
Anadarko Basin |
|
|
4 |
|
|
|
9 |
|
|
|
16 |
|
|
|
21 |
|
|
|
29 |
|
|
Total |
|
|
80 |
|
|
|
85 |
|
|
|
68 |
|
|
|
64 |
|
|
|
75 |
|
|
NET OPERATED WELLS TIED-IN |
|
|
|
|
|
|
|
|
|
|
|
|
|
|
|
|
|
|
|
|
|
|
|
2020 |
|
|
2019 |
|
|
|
|
Quarter 1 |
|
|
Quarter 4 |
|
|
Quarter 3 |
|
|
Quarter 2 |
|
|
Quarter 1 |
|
|
Delaware Basin |
|
|
25 |
|
|
|
25 |
|
|
|
30 |
|
|
|
24 |
|
|
|
18 |
|
|
Powder River Basin |
|
|
10 |
|
|
|
15 |
|
|
|
13 |
|
|
|
5 |
|
|
|
2 |
|
|
Eagle Ford |
|
|
14 |
|
|
|
11 |
|
|
|
— |
|
|
|
4 |
|
|
|
9 |
|
|
Anadarko Basin |
|
|
3 |
|
|
|
7 |
|
|
|
7 |
|
|
|
14 |
|
|
|
20 |
|
|
Total |
|
|
52 |
|
|
|
58 |
|
|
|
43 |
|
|
|
54 |
|
|
|
49 |
|
|
AVERAGE LATERAL LENGTH |
|
|
|
|
|
|
|
|
|
|
|
(based on wells tied-in) |
|
2020 |
|
2019 |
|
|
|
Quarter 1 |
|
Quarter 4 |
|
Quarter 3 |
|
Quarter 2 |
|
Quarter 1 |
|
Delaware Basin |
|
8,000' |
|
8,000' |
|
9,700' |
|
7,500' |
|
8,500' |
|
Powder River Basin |
|
9,100' |
|
9,700' |
|
9,500' |
|
9,500' |
|
10,000' |
|
Eagle Ford |
|
5,400' |
|
6,600' |
|
N/A |
|
6,000' |
|
6,000' |
|
Anadarko Basin |
|
9,800' |
|
11,200' |
|
9,600' |
|
9,000' |
|
9,000' |
|
Total |
|
7,300' |
|
8,400' |
|
9,600' |
|
8,000' |
|
8,000' |
6
|
BENCHMARK PRICES |
|
|
|
|
|
|
|
|
|
|
|
|
|
|
|
|
|
|
|
|
|
(average prices) |
|
2020 |
|
|
2019 |
|
|
|
|
Quarter 1 |
|
|
Quarter 4 |
|
|
Quarter 3 |
|
|
Quarter 2 |
|
|
Quarter 1 |
|
|
Oil ($/Bbl) - West Texas Intermediate (Cushing) |
|
$ |
46.44 |
|
|
$ |
57.02 |
|
|
$ |
56.34 |
|
|
$ |
59.85 |
|
|
$ |
54.88 |
|
|
Natural Gas ($/Mcf) - Henry Hub |
|
$ |
1.95 |
|
|
$ |
2.50 |
|
|
$ |
2.23 |
|
|
$ |
2.64 |
|
|
$ |
3.15 |
|
|
NGL ($/Bbl) - Mont Belvieu Blended |
|
$ |
14.39 |
|
|
$ |
18.69 |
|
|
$ |
16.18 |
|
|
$ |
19.05 |
|
|
$ |
22.94 |
|
|
|
|
|
|
|
|
|
|
|
|
|
|
|
|
|
|
|
|
|
|
|
|
REALIZED PRICES |
|
|
|
|
|
|
|
|
|
|
|
|
|
|
|
|
|
|
|
|
|
|
|
2020 |
|
|
2019 |
|
|
|
|
Quarter 1 |
|
|
Quarter 4 |
|
|
Quarter 3 |
|
|
Quarter 2 |
|
|
Quarter 1 |
|
|
Oil (Per Bbl) |
|
|
|
|
|
|
|
|
|
|
|
|
|
|
|
|
|
|
|
|
|
Delaware Basin |
|
$ |
45.18 |
|
|
$ |
56.23 |
|
|
$ |
53.85 |
|
|
$ |
55.54 |
|
|
$ |
49.48 |
|
|
Powder River Basin |
|
|
41.14 |
|
|
|
52.02 |
|
|
|
52.50 |
|
|
|
56.79 |
|
|
|
49.21 |
|
|
Eagle Ford |
|
|
44.90 |
|
|
|
55.11 |
|
|
|
57.77 |
|
|
|
61.60 |
|
|
|
59.45 |
|
|
Anadarko Basin |
|
|
45.32 |
|
|
|
55.71 |
|
|
|
54.47 |
|
|
|
57.67 |
|
|
|
52.82 |
|
|
Other |
|
|
44.53 |
|
|
|
55.14 |
|
|
|
54.02 |
|
|
|
55.31 |
|
|
|
47.60 |
|
|
Realized price without hedges |
|
|
44.59 |
|
|
|
55.41 |
|
|
|
54.40 |
|
|
|
57.11 |
|
|
|
51.83 |
|
|
Cash settlements |
|
|
5.14 |
|
|
|
1.48 |
|
|
|
2.18 |
|
|
|
(0.41 |
) |
|
|
3.65 |
|
|
Realized price, including cash settlements |
|
$ |
49.73 |
|
|
$ |
56.89 |
|
|
$ |
56.58 |
|
|
$ |
56.70 |
|
|
$ |
55.48 |
|
|
Natural gas liquids (Per Bbl) |
|
|
|
|
|
|
|
|
|
|
|
|
|
|
|
|
|
|
|
|
|
Delaware Basin |
|
$ |
8.36 |
|
|
$ |
13.30 |
|
|
$ |
10.27 |
|
|
$ |
13.77 |
|
|
$ |
17.64 |
|
|
Powder River Basin |
|
|
15.86 |
|
|
|
17.36 |
|
|
|
15.01 |
|
|
|
17.74 |
|
|
|
19.64 |
|
|
Eagle Ford |
|
|
14.77 |
|
|
|
18.84 |
|
|
|
13.77 |
|
|
|
15.84 |
|
|
|
19.77 |
|
|
Anadarko Basin |
|
|
10.90 |
|
|
|
17.47 |
|
|
|
12.61 |
|
|
|
15.55 |
|
|
|
18.43 |
|
|
Other |
|
|
15.82 |
|
|
|
13.62 |
|
|
|
12.76 |
|
|
|
10.69 |
|
|
|
15.43 |
|
|
Realized price without hedges |
|
|
10.40 |
|
|
|
15.79 |
|
|
|
12.02 |
|
|
|
15.00 |
|
|
|
18.36 |
|
|
Cash settlements |
|
|
0.61 |
|
|
|
1.75 |
|
|
|
2.55 |
|
|
|
1.40 |
|
|
|
0.67 |
|
|
Realized price, including cash settlements |
|
$ |
11.01 |
|
|
$ |
17.54 |
|
|
$ |
14.57 |
|
|
$ |
16.40 |
|
|
$ |
19.03 |
|
|
Gas (Per Mcf) |
|
|
|
|
|
|
|
|
|
|
|
|
|
|
|
|
|
|
|
|
|
Delaware Basin |
|
$ |
0.58 |
|
|
$ |
1.22 |
|
|
$ |
0.90 |
|
|
$ |
(0.05 |
) |
|
$ |
1.84 |
|
|
Powder River Basin |
|
|
1.71 |
|
|
|
2.51 |
|
|
|
1.96 |
|
|
|
2.16 |
|
|
|
2.92 |
|
|
Eagle Ford |
|
|
2.05 |
|
|
|
2.52 |
|
|
|
2.26 |
|
|
|
2.56 |
|
|
|
3.39 |
|
|
Anadarko Basin |
|
|
1.45 |
|
|
|
1.81 |
|
|
|
1.54 |
|
|
|
1.74 |
|
|
|
2.76 |
|
|
Other |
|
|
1.69 |
|
|
|
0.43 |
|
|
|
2.18 |
|
|
|
1.72 |
|
|
|
2.12 |
|
|
Realized price without hedges |
|
|
1.21 |
|
|
|
1.70 |
|
|
|
1.47 |
|
|
|
1.38 |
|
|
|
2.62 |
|
|
Cash settlements |
|
|
0.36 |
|
|
|
0.13 |
|
|
|
0.41 |
|
|
|
0.34 |
|
|
|
(0.31 |
) |
|
Realized price, including cash settlements |
|
$ |
1.57 |
|
|
$ |
1.83 |
|
|
$ |
1.88 |
|
|
$ |
1.72 |
|
|
$ |
2.31 |
|
|
Total oil equivalent (Per Boe) |
|
|
|
|
|
|
|
|
|
|
|
|
|
|
|
|
|
|
|
|
|
Delaware Basin |
|
$ |
26.19 |
|
|
$ |
35.05 |
|
|
$ |
33.48 |
|
|
$ |
33.94 |
|
|
$ |
33.92 |
|
|
Powder River Basin |
|
|
33.65 |
|
|
|
42.45 |
|
|
|
41.20 |
|
|
|
45.44 |
|
|
|
41.69 |
|
|
Eagle Ford |
|
|
29.94 |
|
|
|
36.51 |
|
|
|
35.10 |
|
|
|
37.50 |
|
|
|
39.41 |
|
|
Anadarko Basin |
|
|
18.14 |
|
|
|
24.28 |
|
|
|
22.07 |
|
|
|
23.96 |
|
|
|
26.65 |
|
|
Other |
|
|
39.15 |
|
|
|
46.49 |
|
|
|
46.08 |
|
|
|
46.70 |
|
|
|
39.27 |
|
|
Realized price without hedges |
|
|
25.43 |
|
|
|
32.82 |
|
|
|
30.47 |
|
|
|
31.79 |
|
|
|
32.65 |
|
|
Cash settlements |
|
|
3.20 |
|
|
|
1.32 |
|
|
|
2.34 |
|
|
|
0.79 |
|
|
|
1.22 |
|
|
Realized price, including cash settlements |
|
$ |
28.63 |
|
|
$ |
34.14 |
|
|
$ |
32.81 |
|
|
$ |
32.58 |
|
|
$ |
33.87 |
|
7
|
BENCHMARK PRICES |
|
|
|
|
|
|
|
|
|
|
|
|
|
|
|
|
|
|
|
|
|
(average prices) |
|
2020 |
|
|
2019 |
|
|
|
|
Quarter 1 |
|
|
Quarter 4 |
|
|
Quarter 3 |
|
|
Quarter 2 |
|
|
Quarter 1 |
|
|
Oil ($/Bbl) - West Texas Intermediate (Cushing) |
|
$ |
46.44 |
|
|
$ |
57.02 |
|
|
$ |
56.34 |
|
|
$ |
59.85 |
|
|
$ |
54.88 |
|
|
Natural Gas ($/Mcf) - Henry Hub |
|
$ |
1.95 |
|
|
$ |
2.50 |
|
|
$ |
2.23 |
|
|
$ |
2.64 |
|
|
$ |
3.15 |
|
|
NGL ($/Bbl) - Mont Belvieu Blended |
|
$ |
14.39 |
|
|
$ |
18.69 |
|
|
$ |
16.18 |
|
|
$ |
19.05 |
|
|
$ |
22.94 |
|
|
|
|
|
|
|
|
|
|
|
|
|
|
|
|
|
|
|
|
|
|
|
|
FIELD-LEVEL CASH MARGIN (per Boe) |
|
|
|
|
|
|
|
|
|
|
|
|
|
|
|
|
|
|
|
|
|
|
|
2020 |
|
|
2019 |
|
|
|
|
Quarter 1 |
|
|
Quarter 4 |
|
|
Quarter 3 |
|
|
Quarter 2 |
|
|
Quarter 1 |
|
|
Delaware Basin |
|
|
|
|
|
|
|
|
|
|
|
|
|
|
|
|
|
|
|
|
|
Realized price |
|
$ |
26.19 |
|
|
$ |
35.05 |
|
|
$ |
33.48 |
|
|
$ |
33.94 |
|
|
$ |
33.92 |
|
|
Lease operating expenses |
|
|
(3.61 |
) |
|
|
(3.36 |
) |
|
|
(4.17 |
) |
|
|
(4.33 |
) |
|
|
(4.58 |
) |
|
Gathering, processing & transportation |
|
|
(2.71 |
) |
|
|
(2.59 |
) |
|
|
(2.20 |
) |
|
|
(2.31 |
) |
|
|
(2.23 |
) |
|
Production & property taxes |
|
|
(2.15 |
) |
|
|
(2.80 |
) |
|
|
(2.69 |
) |
|
|
(2.84 |
) |
|
|
(2.72 |
) |
|
Field-level cash margin |
|
$ |
17.72 |
|
|
$ |
26.30 |
|
|
$ |
24.42 |
|
|
$ |
24.46 |
|
|
$ |
24.39 |
|
|
Powder River Basin |
|
|
|
|
|
|
|
|
|
|
|
|
|
|
|
|
|
|
|
|
|
Realized price |
|
$ |
33.65 |
|
|
$ |
42.45 |
|
|
$ |
41.20 |
|
|
$ |
45.44 |
|
|
$ |
41.69 |
|
|
Lease operating expenses |
|
|
(6.65 |
) |
|
|
(5.00 |
) |
|
|
(7.28 |
) |
|
|
(6.95 |
) |
|
|
(8.00 |
) |
|
Gathering, processing & transportation |
|
|
(2.32 |
) |
|
|
(3.40 |
) |
|
|
(2.07 |
) |
|
|
(1.71 |
) |
|
|
(1.70 |
) |
|
Production & property taxes |
|
|
(4.20 |
) |
|
|
(5.19 |
) |
|
|
(4.73 |
) |
|
|
(4.99 |
) |
|
|
(4.97 |
) |
|
Field-level cash margin |
|
$ |
20.48 |
|
|
$ |
28.86 |
|
|
$ |
27.12 |
|
|
$ |
31.79 |
|
|
$ |
27.02 |
|
|
Eagle Ford |
|
|
|
|
|
|
|
|
|
|
|
|
|
|
|
|
|
|
|
|
|
Realized price |
|
$ |
29.94 |
|
|
$ |
36.51 |
|
|
$ |
35.10 |
|
|
$ |
37.50 |
|
|
$ |
39.41 |
|
|
Lease operating expenses |
|
|
(2.93 |
) |
|
|
(4.52 |
) |
|
|
(3.20 |
) |
|
|
(2.85 |
) |
|
|
(2.81 |
) |
|
Gathering, processing & transportation |
|
|
(5.96 |
) |
|
|
(6.52 |
) |
|
|
(5.93 |
) |
|
|
(5.59 |
) |
|
|
(5.84 |
) |
|
Production & property taxes |
|
|
(1.85 |
) |
|
|
(1.75 |
) |
|
|
(1.95 |
) |
|
|
(2.43 |
) |
|
|
(2.23 |
) |
|
Field-level cash margin |
|
$ |
19.20 |
|
|
$ |
23.72 |
|
|
$ |
24.02 |
|
|
$ |
26.63 |
|
|
$ |
28.53 |
|
|
Anadarko Basin |
|
|
|
|
|
|
|
|
|
|
|
|
|
|
|
|
|
|
|
|
|
Realized price |
|
$ |
18.14 |
|
|
$ |
24.28 |
|
|
$ |
22.07 |
|
|
$ |
23.96 |
|
|
$ |
26.65 |
|
|
Lease operating expenses |
|
|
(2.79 |
) |
|
|
(2.24 |
) |
|
|
(2.08 |
) |
|
|
(1.84 |
) |
|
|
(1.87 |
) |
|
Gathering, processing & transportation |
|
|
(6.36 |
) |
|
|
(5.98 |
) |
|
|
(5.05 |
) |
|
|
(5.10 |
) |
|
|
(5.18 |
) |
|
Production & property taxes |
|
|
(0.77 |
) |
|
|
(1.00 |
) |
|
|
(0.86 |
) |
|
|
(1.25 |
) |
|
|
(1.33 |
) |
|
Field-level cash margin |
|
$ |
8.22 |
|
|
$ |
15.06 |
|
|
$ |
14.08 |
|
|
$ |
15.77 |
|
|
$ |
18.27 |
|
|
Other |
|
|
|
|
|
|
|
|
|
|
|
|
|
|
|
|
|
|
|
|
|
Realized price |
|
$ |
39.15 |
|
|
$ |
46.49 |
|
|
$ |
46.08 |
|
|
$ |
46.70 |
|
|
$ |
39.27 |
|
|
Lease operating expenses |
|
|
(18.95 |
) |
|
|
(20.04 |
) |
|
|
(17.22 |
) |
|
|
(22.29 |
) |
|
|
(17.42 |
) |
|
Gathering, processing & transportation |
|
|
(0.31 |
) |
|
|
(0.34 |
) |
|
|
(0.45 |
) |
|
|
(0.22 |
) |
|
|
(0.29 |
) |
|
Production & property taxes |
|
|
(4.34 |
) |
|
|
(3.78 |
) |
|
|
(4.50 |
) |
|
|
(5.26 |
) |
|
|
(3.99 |
) |
|
Field-level cash margin |
|
$ |
15.55 |
|
|
$ |
22.33 |
|
|
$ |
23.91 |
|
|
$ |
18.93 |
|
|
$ |
17.57 |
|
|
Devon - Total |
|
|
|
|
|
|
|
|
|
|
|
|
|
|
|
|
|
|
|
|
|
Realized price |
|
$ |
25.43 |
|
|
$ |
32.82 |
|
|
$ |
30.47 |
|
|
$ |
31.79 |
|
|
$ |
32.65 |
|
|
Lease operating expenses |
|
|
(3.96 |
) |
|
|
(3.79 |
) |
|
|
(3.90 |
) |
|
|
(3.85 |
) |
|
|
(3.95 |
) |
|
Gathering, processing & transportation |
|
|
(4.11 |
) |
|
|
(4.16 |
) |
|
|
(3.71 |
) |
|
|
(3.78 |
) |
|
|
(3.86 |
) |
|
Production & property taxes |
|
|
(1.95 |
) |
|
|
(2.32 |
) |
|
|
(2.13 |
) |
|
|
(2.38 |
) |
|
|
(2.30 |
) |
|
Field-level cash margin |
|
$ |
15.41 |
|
|
$ |
22.55 |
|
|
$ |
20.73 |
|
|
$ |
21.78 |
|
|
$ |
22.54 |
|
8
NON-GAAP FINANCIAL MEASURES
(all monetary values in millions, except per share amounts)
This press release includes non-GAAP financial measures. These non-GAAP measures are not alternatives to GAAP measures, and you should not consider these non-GAAP measures in isolation or as a substitute for analysis of our results as reported under GAAP. Below is additional disclosure regarding each of the non-GAAP measures used in this press release, including reconciliations to their most directly comparable GAAP measure.
CORE EARNINGS
Devon’s reported net earnings include items of income and expense that are typically excluded by securities analysts in their published estimates of the company’s financial results. Accordingly, the company also uses the measures of core earnings and core earnings per share attributable to Devon. Devon believes these non-GAAP measures facilitate comparisons of its performance to earnings estimates published by securities analysts. Devon also believes these non-GAAP measures can facilitate comparisons of its performance between periods and to the performance of its peers. The following table summarizes the effects of these items on first-quarter 2020 earnings.
|
|
|
Quarter Ended March 31, 2020 |
|
|
|
|
Before-tax |
|
|
After-tax |
|
|
After Noncontrolling Interests |
|
|
Per Diluted Share |
|
|
Continuing Operations |
|
|
|
|
|
|
|
|
|
|
|
|
|
|
|
|
|
Loss (GAAP) |
|
$ |
(2,107 |
) |
|
$ |
(1,690 |
) |
|
$ |
(1,691 |
) |
|
$ |
(4.48 |
) |
|
Adjustments: |
|
|
|
|
|
|
|
|
|
|
|
|
|
|
|
|
|
Asset and exploration impairments |
|
|
2,776 |
|
|
|
2,146 |
|
|
|
2,146 |
|
|
|
5.66 |
|
|
Deferred tax asset valuation allowance |
|
|
— |
|
|
|
108 |
|
|
|
108 |
|
|
|
0.28 |
|
|
Fair value changes in financial instruments |
|
|
(619 |
) |
|
|
(479 |
) |
|
|
(479 |
) |
|
|
(1.24 |
) |
|
Change in tax legislation |
|
|
— |
|
|
|
(62 |
) |
|
|
(62 |
) |
|
|
(0.16 |
) |
|
Core earnings (Non-GAAP) |
|
$ |
50 |
|
|
$ |
23 |
|
|
$ |
22 |
|
|
$ |
0.06 |
|
|
|
|
|
|
|
|
|
|
|
|
|
|
|
|
|
|
|
|
Discontinued Operations |
|
|
|
|
|
|
|
|
|
|
|
|
|
|
|
|
|
Loss (GAAP) |
|
$ |
(157 |
) |
|
$ |
(125 |
) |
|
$ |
(125 |
) |
|
$ |
(0.34 |
) |
|
Adjustments: |
|
|
|
|
|
|
|
|
|
|
|
|
|
|
|
|
|
Asset impairments |
|
|
179 |
|
|
|
141 |
|
|
|
141 |
|
|
|
0.38 |
|
|
Fair value changes in foreign currency and other |
|
|
10 |
|
|
|
10 |
|
|
|
10 |
|
|
|
0.03 |
|
|
Core earnings (Non-GAAP) |
|
$ |
32 |
|
|
$ |
26 |
|
|
$ |
26 |
|
|
$ |
0.07 |
|
|
|
|
|
|
|
|
|
|
|
|
|
|
|
|
|
|
|
|
Total |
|
|
|
|
|
|
|
|
|
|
|
|
|
|
|
|
|
Loss (GAAP) |
|
$ |
(2,264 |
) |
|
$ |
(1,815 |
) |
|
$ |
(1,816 |
) |
|
$ |
(4.82 |
) |
|
Adjustments: |
|
|
|
|
|
|
|
|
|
|
|
|
|
|
|
|
|
Continuing Operations |
|
|
2,157 |
|
|
|
1,713 |
|
|
|
1,713 |
|
|
|
4.54 |
|
|
Discontinued Operations |
|
|
189 |
|
|
|
151 |
|
|
|
151 |
|
|
|
0.41 |
|
|
Core earnings (Non-GAAP) |
|
$ |
82 |
|
|
$ |
49 |
|
|
$ |
48 |
|
|
$ |
0.13 |
|
9
EBITDAX
Devon believes EBITDAX provides information useful in assessing operating and financial performance across periods. Devon computes EBITDAX as net earnings from continuing operations before income tax expense; financing costs, net; exploration expenses; depreciation, depletion and amortization; asset impairments; asset disposition gains and losses; non-cash share-based compensation; non-cash valuation changes for derivatives and financial instruments; restructuring and transaction costs; accretion on discounted liabilities; and other items not related to normal operations. EBITDAX as defined by Devon may not be comparable to similarly titled measures used by other companies and should be considered in conjunction with net earnings from continuing operations.
|
|
Q1 '20 |
|
|
Q4'19 |
|
|
Q3'19 |
|
|
Q2'19 |
|
|
TTM |
|
|
Q1'19 |
|
|
|
Net earnings (loss) (GAAP) |
$ |
(1,815 |
) |
|
$ |
(640 |
) |
|
$ |
109 |
|
|
$ |
495 |
|
|
$ |
(1,851 |
) |
|
$ |
(317 |
) |
|
|
Net (earnings) loss from discontinued operations, net of tax |
|
125 |
|
|
|
652 |
|
|
|
27 |
|
|
|
(344 |
) |
|
|
460 |
|
|
|
(61 |
) |
|
|
Financing costs, net |
|
65 |
|
|
|
64 |
|
|
|
60 |
|
|
|
66 |
|
|
|
255 |
|
|
|
60 |
|
|
|
Income tax expense (benefit) |
|
(417 |
) |
|
|
(33 |
) |
|
|
54 |
|
|
|
68 |
|
|
|
(328 |
) |
|
|
(119 |
) |
|
|
Exploration expenses |
|
112 |
|
|
|
29 |
|
|
|
18 |
|
|
|
7 |
|
|
|
166 |
|
|
|
4 |
|
|
|
Depreciation, depletion and amortization |
|
401 |
|
|
|
382 |
|
|
|
381 |
|
|
|
374 |
|
|
|
1,538 |
|
|
|
360 |
|
|
|
Asset impairments |
|
2,666 |
|
|
|
- |
|
|
|
- |
|
|
|
- |
|
|
|
2,666 |
|
|
|
- |
|
|
|
Asset dispositions |
|
- |
|
|
|
- |
|
|
|
(1 |
) |
|
|
(2 |
) |
|
|
(3 |
) |
|
|
(45 |
) |
|
|
Share-based compensation |
|
20 |
|
|
|
19 |
|
|
|
20 |
|
|
|
21 |
|
|
|
80 |
|
|
|
23 |
|
|
|
Derivative and financial instrument non-cash valuation changes |
|
(619 |
) |
|
|
159 |
|
|
|
(57 |
) |
|
|
(117 |
) |
|
|
(634 |
) |
|
|
638 |
|
|
|
Restructuring and transaction costs |
|
- |
|
|
|
11 |
|
|
|
10 |
|
|
|
12 |
|
|
|
33 |
|
|
|
51 |
|
|
|
Accretion on discounted liabilities and other |
|
(48 |
) |
|
|
14 |
|
|
|
5 |
|
|
|
8 |
|
|
|
(21 |
) |
|
|
(22 |
) |
|
|
EBITDAX (Non-GAAP) |
$ |
490 |
|
|
$ |
657 |
|
|
$ |
626 |
|
|
$ |
588 |
|
|
$ |
2,361 |
|
|
$ |
572 |
|
|
NET DEBT
Devon defines net debt as debt less cash, cash equivalents and cash restricted for discontinued operations. Devon believes that netting these sources of cash against debt provides a clearer picture of the future demands on cash from Devon to repay debt.
|
|
|
March 31,
2020 |
|
|
Total debt (GAAP) |
|
$ |
4,295 |
|
|
Less: |
|
|
|
|
|
Cash and cash equivalents |
|
|
(1,527 |
) |
|
Cash restricted for discontinued operations |
|
|
(200 |
) |
|
Net debt (Non-GAAP) |
|
$ |
2,568 |
|
NET DEBT-TO-EBITDAX
Devon defines as net debt divided by trailing twelve months EBITDAX.
|
|
|
March 31,
2020 |
|
|
Net debt (Non-GAAP) |
|
$ |
2,568 |
|
|
EBITDAX (trailing 12 months) (Non-GAAP) |
|
|
2,361 |
|
|
Net debt-to-EBITDAX (Non-GAAP) |
|
|
1.1 |
|
FREE CASH FLOW
Devon defines free cash flow as total operating cash flow less capital expenditures. Devon believes that free cash flow provides a useful measure of available cash generated by operating activities for other investing and financing activities.
|
|
|
Quarter Ended
March 31, 2020 |
|
|
Total operating cash flow (GAAP) |
|
$ |
529 |
|
|
Less capital expenditures: |
|
|
|
|
|
Capital expenditures |
|
|
(425 |
) |
|
Free cash flow (Non-GAAP) |
|
$ |
104 |
|
1

GUIDANCE
SECOND-QUARTER AND FULL-YEAR 2020
|
PRODUCTION GUIDANCE |
|
|
|
|
|
|
|
|
|
|
|
|
|
|
|
|
|
|
|
Quarter 2(1) |
|
|
Full Year |
|
|
|
|
Low |
|
|
High |
|
|
Low |
|
|
High |
|
|
Oil (MBbls/d) |
|
|
145 |
|
|
|
155 |
|
|
|
145 |
|
|
|
150 |
|
|
Natural gas liquids (MBbls/d) |
|
|
60 |
|
|
|
70 |
|
|
|
68 |
|
|
|
72 |
|
|
Gas (MMcf/d) |
|
|
580 |
|
|
|
620 |
|
|
|
550 |
|
|
|
580 |
|
|
Total oil equivalent (MBoe/d) |
|
|
302 |
|
|
|
328 |
|
|
|
300 |
|
|
|
319 |
|
(1) For the second quarter of 2020, Devon assumes 10 MBbls/d of oil production curtailments (~20 MBoe/d). Curtailments include shut-in production, restricted flowback on select wells and the deferral of a few completions.
|
CAPITAL EXPENDITURES GUIDANCE |
|
|
|
|
|
|
|
|
|
|
|
|
|
|
|
|
|
|
|
Quarter 2 |
|
|
Full Year |
|
|
(in millions) |
|
Low |
|
|
High |
|
|
Low |
|
|
High |
|
|
Total upstream capital |
|
$ |
200 |
|
|
$ |
250 |
|
|
$ |
950 |
|
|
$ |
1,050 |
|
|
OTHER GUIDANCE ITEMS |
|
|
|
|
|
|
|
|
|
|
|
|
|
|
|
|
|
|
|
Quarter 2 |
|
|
Full Year |
|
|
($ millions, except Boe and %) |
|
Low |
|
|
High |
|
|
Low |
|
|
High |
|
|
Marketing & midstream operating profit |
|
$ |
(5) |
|
|
$ |
5 |
|
|
$ |
(25) |
|
|
$ |
(15) |
|
|
LOE & GP&T per BOE(2) |
|
$ |
7.90 |
(2) |
|
$ |
8.10(2) |
|
|
$ |
8.10(2) |
|
|
$ |
8.30(2) |
|
|
Production & property taxes as % of upstream sales |
|
|
7.9% |
|
|
|
8.1% |
|
|
|
7.8% |
|
|
|
8.0% |
|
|
Exploration expenses |
|
$ |
5 |
|
|
$ |
10 |
|
|
$ |
5 |
|
|
$ |
15 |
|
|
Depreciation, depletion and amortization |
|
$ |
290 |
|
|
$ |
330 |
|
|
$ |
1,225 |
|
|
$ |
1,325 |
|
|
General & administrative expenses |
|
$ |
90 |
|
|
$ |
100 |
|
|
$ |
350 |
|
|
$ |
370 |
|
|
Financing costs, net |
|
$ |
60 |
|
|
$ |
70 |
|
|
$ |
260 |
|
|
$ |
270 |
|
|
Other expenses(3) |
|
$ |
10 |
|
|
$ |
20 |
|
|
$ |
— |
(3) |
|
$ |
20 |
(3) |
|
Current income tax rate from continuing operations |
|
|
0 |
% |
|
|
0 |
% |
|
|
0 |
% |
|
|
0 |
% |
|
Deferred income tax rate from continuing operations |
|
|
20 |
% |
|
|
30 |
% |
|
|
20 |
% |
|
|
30 |
% |
|
Total income tax rate from continuing operations |
|
|
20 |
% |
|
|
30 |
% |
|
|
20 |
% |
|
|
30 |
% |
(2) In the second quarter 2020 and full-year 2020, Devon expects to incur approximately $15 million and $65 million of minimum volume commitments related to the Anadarko Basin. These commitments are expected to impact GP&T rates by approximately $0.55 per Boe in 2020. These commitments will expire at the end of 2020.
(3) Full-year estimate includes $47 million severance tax credit recorded in the first quarter.
2
|
Oil Commodity Hedges |
|
|
|
|
|
|
|
|
|
|
|
|
|
|
|
|
|
|
|
|
|
|
|
Price Swaps |
|
|
Price Collars |
|
|
Period |
|
Volume (Bbls/d) |
|
|
Weighted Average Price ($/Bbl) |
|
|
Volume (Bbls/d) |
|
|
Weighted Average Floor Price ($/Bbl) |
|
|
Weighted Average Ceiling Price ($/Bbl) |
|
|
Q2-Q4 2020 |
|
|
82,207 |
|
|
$ |
36.87 |
|
|
|
50,449 |
|
|
$ |
51.11 |
|
|
$ |
61.14 |
|
|
Q1-Q4 2021 |
|
|
23,558 |
|
|
$ |
35.69 |
|
|
|
15,964 |
|
|
$ |
41.24 |
|
|
$ |
51.24 |
|
|
|
|
|
|
|
|
|
|
|
|
|
|
|
|
|
|
|
|
|
|
|
|
Oil Basis Swaps |
|
|
|
|
|
|
|
|
|
|
|
Period |
|
Index |
|
Volume (Bbls/d) |
|
|
Weighted Average Differential to WTI ($/Bbl) |
|
|
Q2-Q4 2020 |
|
Argus MEH |
|
|
50,916 |
|
|
$ |
0.45 |
|
|
Q2-Q4 2020 |
|
Midland Sweet |
|
|
31,782 |
|
|
$ |
(1.23) |
|
|
Q2-Q4 2020 |
|
NYMEX Roll |
|
|
52,676 |
|
|
$ |
0.38 |
|
|
Q1-Q4 2021 |
|
Midland Sweet |
|
|
7,000 |
|
|
$ |
1.27 |
|
|
Natural Gas Commodity Hedges - Henry Hub |
|
|
|
|
|
|
|
|
|
|
|
|
|
|
|
|
|
|
|
|
Price Swaps |
|
|
Price Collars |
|
|
Period |
|
Volume (MMBtu/d) |
|
|
Weighted Average Price ($/MMBtu) |
|
|
Volume (MMBtu/d) |
|
|
Weighted Average Floor Price ($/MMBtu) |
|
|
Weighted Average Ceiling Price ($/MMBtu) |
|
|
Q2-Q4 2020 |
|
|
70,414 |
|
|
$ |
2.75 |
|
|
|
193,164 |
|
|
$ |
1.95 |
|
|
$ |
2.42 |
|
|
Q1-Q4 2021 |
|
|
11,219 |
|
|
$ |
2.71 |
|
|
|
66,096 |
|
|
$ |
2.25 |
|
|
$ |
2.75 |
|
|
Natural Gas Basis Swaps |
|
|
|
|
|
|
|
|
|
Period |
|
Index |
|
Volume (MMBtu/d) |
|
|
Weighted Average Differential to Henry Hub ($/MMBtu) |
|
|
Q2-Q4 2020 |
|
Panhandle Eastern Pipe Line |
|
|
30,000 |
|
|
$ |
(0.47 |
) |
|
Q2-Q4 2020 |
|
El Paso Natural Gas |
|
|
65,000 |
|
|
$ |
(0.78 |
) |
|
Q2-Q4 2020 |
|
Houston Ship Channel |
|
|
30,000 |
|
|
$ |
(0.02 |
) |
|
Q1-Q4 2021 |
|
El Paso Natural Gas |
|
|
35,000 |
|
|
$ |
(0.92 |
) |
|
NGL Commodity Hedges |
|
|
|
|
|
|
|
|
|
|
|
|
|
Price Swaps |
|
|
Period |
|
Product |
|
Volume (Bbls/d) |
|
|
Weighted Average Price ($/Bbl) |
|
|
Q2-Q4 2020 |
|
Ethane |
|
|
9,982 |
|
|
$ |
5.62 |
|
|
Q2-Q4 2020 |
|
Natural Gasoline |
|
|
1,000 |
|
|
$ |
44.84 |
|
|
Q2-Q4 2020 |
|
Normal Butane |
|
|
1,500 |
|
|
$ |
23.56 |
|
|
Q2-Q4 2020 |
|
Propane |
|
|
4,500 |
|
|
$ |
25.18 |
|
Devon’s oil derivatives settle against the average of the prompt month NYMEX West Texas Intermediate futures price. Devon’s natural gas derivatives settle against the Inside FERC first of the month Henry Hub index. Devon’s NGL derivatives settle against the average of the prompt month OPIS Mont Belvieu, Texas index. Commodity hedge positions are shown as of May 1, 2020.