
ebc-20210129
0001810546FALSE00018105462021-01-282021-01-28

UNITED STATES
SECURITIES AND EXCHANGE COMMISSION
WASHINGTON, D.C. 20549
 
FORM 8-K
CURRENT REPORT
PURSUANT TO SECTION 13 OR 15(D)
OF THE SECURITIES EXCHANGE ACT OF 1934
Date of Report (Date of Earliest Event Reported): January 29, 2021
EASTERN BANKSHARES, INC.
(Exact Name of Registrant as Specified in Charter)
 
Massachusetts 001-39610 84-4199750
(State or Other Jurisdiction
of Incorporation or Organization)
 (Commission
File Number)
 (I.R.S. Employer
Identification No.)
265 Franklin Street 02110
Boston,MA
(Address of Principal Executive Offices) (Zip Code)
Registrant’s telephone number, including area code: (800) 327-8376
Not Applicable
(Former name or former address, if changed since last report)
Check the appropriate box below if the Form 8-K filing is intended to simultaneously satisfy the filing obligation of the Registrant under any of the following provisions:
Written communications pursuant to Rule 425 under the Securities Act (17 CFR 230.425)
Soliciting material pursuant to Rule 14a-12 under the Exchange Act (17 CFR 240.14a-12)
Pre-commencement communications pursuant to Rule 14d-2(b) under the Exchange Act (17 CFR 240.14d-2(b))
Pre-commencement communications pursuant to Rule 13e-4(c) under the Exchange Act (17 CFR 240.13e-4(c))
Securities registered pursuant to Section 12(b) of the Act:
Title of each class  Trading
Symbol(s)
  Name of each exchange
on which registered
Common Stock  EBC  Nasdaq Global Select Market
Indicate by check mark whether the Registrant is an emerging growth company as defined in Rule 405 of the Securities Act of 1933 (§230.405 of this chapter) or Rule 12b-2 of the Securities Exchange Act of 1934 (§240.12b-2 of this chapter).
Emerging growth company  
If an emerging growth company, indicate by check mark if the Registrant has elected not to use the extended transition period for complying with any new or revised financial accounting standards provided pursuant to Section 13(a) of the Exchange Act.  


Item 2.02    Results of Operations and Financial Condition.

On January 28, 2021, Eastern Bankshares, Inc., a Massachusetts corporation (the “Company”) and the holding company for Eastern Bank, issued a press release announcing its earnings for the quarter ended December 31, 2020. Additionally, the Company announced the approval by its Board of Directors of a regular quarterly cash dividend of $0.06 per share payable on March 15, 2021 to stockholders of record on March 3, 2021. A copy of the press release is furnished herewith as Exhibit 99.1 and is incorporated herein by reference.

Item 7.01    Regulation FD Disclosure.

In connection with the press release announcing the Company's earnings for the quarter ended December 31, 2020, the Company posted an investor presentation in the “Presentations” section of the Company’s investor relations website at investor.easternbank.com. A copy of the presentation is furnished herewith as Exhibit 99.2 and is incorporated herein by reference.

Item 8.01    Other Events.

Additionally, on January 28, 2021, the Company announced that its annual meeting of shareholders will be held on Monday, May 17, 2021 at 12:00 P.M. Eastern Time. The annual meeting will be held at the Company's offices at 265 Franklin Street, Boston, Massachusetts and over the internet in a virtual meeting format. The date for determining the Company’s shareholders of record for the annual meeting is Monday, March 12, 2021. A copy of the press release is furnished herewith as Exhibit 99.1 and is incorporated herein by reference.

Item 9.01    Financial Statements and Exhibits.
(d)Exhibits
ExhibitDescription
99.1
99.2
104Cover Page Interactive Data File (embedded within the Inline XBRL document)


SIGNATURES
Pursuant to the requirements of the Securities Exchange Act of 1934, as amended, the Registrant has duly caused this report to be signed on its behalf by the undersigned, hereunto duly authorized.
EASTERN BANKSHARES, INC.
DATE: January 29, 2021
By: /s/ James B. Fitzgerald
 James B. Fitzgerald
 Chief Financial Officer


Exhibit 99.1
Eastern Bankshares, Inc. Reports Fourth Quarter 2020 Financial Results
Company Initiates Quarterly Cash Dividend

BOSTON, January 28, 2021 (BUSINESS WIRE)-- Eastern Bankshares, Inc. (the “Company,” or together with its affiliates and subsidiaries, “Eastern”) (NASDAQ Global Select Market: EBC), the stock holding company of Eastern Bank, today announced 2020 fourth quarter financial results and the initiation of a quarterly cash dividend.

Concurrent with its mutual-to-stock conversion and as described in the prospectus for its initial public offering (“IPO”), the Company made a one-time donation of 7.5 million shares of common stock to the Eastern Bank Charitable Foundation (“EBCF”) at a total market value of $91.3 million. This contribution resulted in a net loss of $44.1 million for the fourth quarter of 2020, or $0.26 per share, compared to net income of $28.5 million reported for the prior quarter. Operating net income* was $31.6 million for the quarter, or $0.18 per share, for the fourth quarter of 2020, compared to $32.3 million reported for the prior quarter.

“We are very pleased with our operating results for the fourth quarter as well as our dividend initiation, and thank our colleagues for their outstanding efforts,” said Bob Rivers, Chief Executive Officer and Chair of the Board of Eastern Bankshares, Inc. and Eastern Bank. “We are thrilled to have completed our stock offering and to be trading publicly, which are major steps forward in building upon our more than 202-year history of providing competitive financial products and services and an outstanding customer experience. As I reflect on the year, I’m especially proud of the 8,800 Paycheck Protection Program (“PPP”) loans totaling $1.1 billion that we delivered to businesses in need, the third most among lenders in Massachusetts. This is all being accomplished during the COVID-19 pandemic which has had, and continues to have, an adverse effect on our customers, colleagues and the markets in which we operate. We continue to carefully monitor and adapt to it, while keeping the safety and well-being of our colleagues and customers a priority.”

“The transformative, one-time donation of $91.3 million of stock to the Eastern Bank Charitable Foundation, a condition of the stock offering, positions our Foundation to continue to support the communities we serve and address society’s most vexing challenges in a meaningful way,” added Rivers.

The Company also announced the initiation of a quarterly cash dividend of $0.06 per share as part of its capital management strategy.

Rivers continued, “Given our Company’s current strength and our history of generating strong cash flows, we believe that we can both invest in the business and return capital to shareholders. Our initiation of a quarterly dividend demonstrates our confidence in our ability to drive growth and effectively deploy capital while delivering value to our shareholders.”


SELECTED FINANCIAL HIGHLIGHTS

Net loss was $44.1 million, or $0.26 per share, for the fourth quarter due to the stock contribution to the EBCF.
Operating net income* was $31.6 million, or $0.18 per share, for the fourth quarter.
Book value and tangible book value per share* were $18.36 and $16.34, respectively, at December 31, 2020.
At December 31, 2020, $332.7 million in loan balances remained under modified payment terms due to the COVID-19 pandemic, down from $701.2 million at September 30, 2020. Provision for credit losses was $900 thousand in the fourth quarter compared to $700 thousand in the prior quarter.


BALANCE SHEET

Total assets were $16.0 billion at December 31, 2020, representing an increase of $503.6 million or 3% from September 30, 2020.

Available-for-sale securities increased $976.2 million, or 44% on a consecutive quarter basis, to $3.2 billion, as excess liquidity was deployed into U.S. Agency securities. Cash and equivalents declined to $2.1 billion from $2.3 billion, a $274.0 million quarter over quarter decline.
Total loans were $9.7 billion, representing a decrease of $213.7 million or 2% from the prior quarter as paydowns outpaced new originations. The main contributing factor was the forgiveness or paydown of PPP loans which totaled $97.4 million for the fourth quarter, reducing total PPP loans to $1.0 billion.
Deposits totaled $12.2 billion representing a decrease of $1.2 billion, or 9%, from September 30, 2020. The decline in deposits resulted primarily from the use of funds on deposit by certain deposit holders to satisfy their stock subscription orders during the Company’s IPO in the fourth quarter.
1


Shareholders’ equity was $3.4 billion, representing an increase of $1.7 billion or 100% from the prior quarter. The increase was attributable to the capital raised during the Company’s mutual-to-stock conversion and IPO completed on October 14, 2020.
As previously disclosed, the Company converted its defined benefit plan to a cash balance defined benefit plan during the period which resulted in a $54.9 million after-tax increase to other comprehensive income and shareholders’ equity.
At December 31, 2020, book value per share was $18.36 and tangible book value per share* was $16.34. Please refer to Appendix H for a quarter over quarter comparison of equity accounts.

NET INTEREST INCOME

Net interest income was $103.6 million for the fourth quarter, compared to $98.7 million in the prior quarter, representing an increase of $4.9 million. Included in net interest income in the fourth quarter was a favorable $3.8 million nonrecurring item. Also included in net interest income was $4.1 million and $6.1 million of SBA PPP fee accretion net of deferred cost amortization in the third and fourth quarters, respectively. The increase in PPP fee recognition on a consecutive quarter basis was attributable to an increase in PPP loan forgiveness rates in the fourth quarter. Between September 30 and December 31, 2020, $97.4 million in PPP loans were forgiven through the SBA or otherwise paid down.

The net interest margin on a fully tax equivalent (FTE) basis* was 2.84% for the fourth quarter, representing a 20 basis points decrease from the prior quarter primarily due to the Company’s excess liquidity.

Please refer to Appendix E for a four-quarter trend analysis of the adjusted core margin*.

NONINTEREST INCOME

Noninterest income was $49.6 million for the fourth quarter, compared to $47.7 million for the prior quarter, representing an increase of $1.9 million.

Insurance commissions increased $0.6 million to $22.4 million in the fourth quarter, compared to $21.9 million in the prior quarter and included a $1.2 million nonrecurring item.
Service charges on deposit accounts increased $1.0 million on a consecutive quarter basis to $6.0 million, primarily driven by higher account analysis service charges.
Loan-level interest rate swap revenue was $2.5 million in the fourth quarter, compared to $1.3 million in the prior quarter, representing an increase of $1.2 million primarily driven by an increase in the fair value of these interest rate swap transactions.
Income on securities held in rabbi trust accounts was $5.5 million in the fourth quarter compared to $3.8 million in the prior quarter, an increase of $1.7 million as strong equity market gains continued in the fourth quarter.
Mortgage origination activity was strong in the fourth quarter with the gain on sale of loans totaling $3.3 million, up $1.1 million from the prior quarter. This was mostly offset by a $3.1 million reduction in the gain/loss on commitments to sell mortgage loans which is recorded in other income.

Please refer to Appendix B for a reconciliation of operating revenues and expenses.

NONINTEREST EXPENSE

Noninterest expense was $199.2 million for the fourth quarter representing an increase of $89.4 million, or 81%, from the prior quarter noninterest expense of $109.8 million. Fourth quarter noninterest expense included costs associated with the Company’s mutual-to-stock conversion. Excluding expenses related to the mutual-to-stock conversion and certain other non-operating items, noninterest expense on an operating basis* for the third and fourth quarters was $100.8 million and $101.8 million, respectively.

Charitable contributions expense in the fourth quarter included $91.3 million in expense from the donation of shares of the Company to the EBCF in connection with the Company’s mutual-to-stock conversion and IPO. The Company established a $12.0 million deferred tax valuation allowance in connection with the contribution.
Salaries and benefits were $70.3 million in the fourth quarter, representing an increase of $3.7 million from the prior quarter primarily due to employee stock ownership plan (“ESOP”) contribution expense of $2.4 million and higher defined contribution supplemental employee retirement plan expense associated with the mark-to-market increase in rabbi trust accounts of $1.4 million noted above.
Other noninterest expense declined from $12.6 million in the prior quarter to $6.2 million in the fourth quarter, a decline of $6.4 million. The Company recorded impairment charges on tax credit investments of $7.6 million and $3.2 million in the third and fourth quarter, respectively. Included in other noninterest expense are components of
2


the Company’s pension expense which were $1.3 million lower in the fourth quarter compared to the prior quarter. However, this was offset by an increase in pension service cost which is included in salary and benefit expense.

Please refer to Appendix B for a reconciliation of operating revenues and expenses.

ASSET QUALITY

The allowance for credit losses was $113.0 million at December 31, 2020, or 1.16% of total loans, compared to $115.4 million or 1.16% of total loans at September 30, 2020. The Company recorded a fourth quarter provision for credit losses of $0.9 million, compared to $0.7 million in the prior quarter. The Company followed the incurred loss allowance GAAP accounting model at December 31, 2020 and all preceding periods.

Non-performing loans totaled $43.3 million at December 31, 2020 compared to $44.8 million at the end of the prior quarter. The consecutive quarter decline was driven by reduction in nonperforming residential mortgage loans of $0.7 million, a reduction in nonperforming consumer loans of $0.6 million, and a reduction in nonperforming commercial loans of $0.3 million. During the fourth quarter of 2020, the Company recorded total net charge-offs of $3.3 million, or 0.13% of average total loans on an annualized basis compared to $1.9 million and 0.08% in the prior quarter, respectively.

Through June 30, 2020, approximately $946.0 million of loans had been modified due to COVID-19. Loans were modified on full or partial payment deferral pursuant to the criteria established in federal requirements for COVID-19-related loan relief. Most modifications were for a term of six months. At December 31, 2020, approximately $332.7 million in COVID-19 modified loans remained under modified payment terms, down from $701.2 million at September 30, 2020.

Please refer to Appendix F and Appendix G for detail on the Company’s lending exposure to industries which management believes are most likely to experience adverse effects of the COVID-19 pandemic, as well as a detailed breakout on COVID-19 related loan modifications.

CONFERENCE CALL INFORMATION

A conference call and webcast covering Eastern’s fourth quarter 2020 earnings will be held on Friday, January 29, 2021 at 9:00 a.m. Eastern Time. To register for the conference call, please visit the Company’s Investor Relations website at investor.easternbank.com. After registration, a confirmation will be sent through email, including dial in details and unique conference call codes to access the call. Participants are encouraged to register for the conference call at least one day in advance, although registration will be available through the conclusion of the call. The conference call will be simultaneously webcast. Participants may join the webcast on the Company’s Investor Relations website. A replay of the webcast will be made available on demand on this site.

DIVIDEND INITIATED

The Company’s Board of Directors declared a quarterly cash dividend of $0.06 per common share, payable on March 15, 2021, to shareholders of record as of the close of business on March 3, 2021. The Company expects to continue paying quarterly dividends, the declaration, timing and amounts of which remain subject to the discretion of the Company’s Board of Directors.

ANNOUNCEMENT OF THE 2021 ANNUAL MEETING OF SHAREHOLDERS

The Company’s Board of Directors has set the date and time for its 2021 annual meeting of shareholders to be 12:00 p.m. Eastern Time on Monday, May 17, 2021. The annual meeting will be held at the Company’s offices at 265 Franklin Street, Boston, Massachusetts and over the Internet in a virtual meeting format. The record date for shareholders entitled to vote at the meeting will be Monday, March 12, 2021. Shareholders of record will receive additional details and instructions for meeting participation in the proxy materials that will be made available to them in early April.

ABOUT EASTERN BANKSHARES, INC.

Eastern Bankshares, Inc. (NASDAQ Global Select Market: EBC) is the stock holding company for Eastern Bank. Founded in 1818, Boston-based Eastern Bank has more than 110 locations serving communities in eastern Massachusetts, southern and coastal New Hampshire, and Rhode Island, and as of December 31, 2020, Eastern Bank had approximately $16.0 billion in total assets. Eastern provides banking, investment and insurance products and services for consumers and businesses of all sizes, including through its Eastern Wealth Management division and its Eastern Insurance Group
3


subsidiary. Eastern takes pride in its outspoken advocacy and community support that has exceeded $140 million in charitable giving since 1999. An inclusive company, Eastern employs 1,800+ deeply committed professionals who value relationships with their customers, colleagues, and communities. For investor information, visit investor.easternbank.com.

CONTACT

Investor Contact

Jillian Belliveau
Eastern Bankshares, Inc.
[email protected]
781-598-7920

Media Contact

Andrea Goodman
Eastern Bank
[email protected]
781-598-7847

NON-GAAP FINANCIAL MEASURES

*Denotes a non-GAAP financial measure used in this press release.

A non-GAAP financial measure is defined as a numerical measure of the Company’s historical or future financial performance, financial position or cash flows that excludes (or includes) amounts, or is subject to adjustments that have the effect of excluding (or including) amounts that are included in the most directly comparable measure calculated and presented in accordance with accounting principles generally accepted in the United States (“GAAP”) in the Company’s statement of income, balance sheet or statement of cash flows (or equivalent statements).

The Company presents non-GAAP financial measures, which management uses to evaluate the Company’s performance, and which exclude the effects of certain transactions that management believes are unrelated to its core business and are therefore not necessarily indicative of its current performance or financial position. Management believes excluding these items facilitates greater visibility for investors into the Company’s core businesses as well as underlying trends that may, to some extent, be obscured by inclusion of such items in the corresponding GAAP financial measures.

There are items in the Company’s financial statements that impact its financial results, but which management believes are unrelated to the Company’s core business. Accordingly, the Company presents noninterest income on an operating basis, total operating revenue, noninterest expense on an operating basis, operating net income, operating earnings per share, operating return on average assets, operating return on average shareholders’ equity, the operating efficiency ratio, and the ratio of noninterest income to total revenue on an operating basis. Each of these figures excludes the impact of such applicable items because management believes such exclusion can provide greater visibility into the Company’s core business and underlying trends. Such items that management does not consider to be core to the Company’s business include (i) income and expenses from investments held in rabbi trusts, (ii) gains and losses on sales of securities available for sale, net, (iii) gains and losses on the sale of other assets, (iv) rabbi trust employee benefits, (v) impairment charges on tax credit investments and associated tax credit benefits, (vi) expenses indirectly associated with the Company’s IPO, (vii) other real estate owned gains, (viii) merger and acquisition expenses, and (ix) the stock donation to the EBCF in connection with the Company’s mutual-to-stock conversion and IPO. The Company does not provide an outlook for its total noninterest expense because it contains expense components, such as expense associated with rabbi trust accounts, which is market-driven, over which the Company cannot exercise control. Accordingly a reconciliation of the Company’s outlook for its noninterest expense on an operating basis to an outlook for total noninterest expense cannot be made available without unreasonable effort.

Management also presents the Company’s core net interest margin which excludes the impact of items management determines as being one-time in nature or not indicative of its core operating results. Such items include the impact of excess liquidity in the form of excess cash volume, PPP loans originated in response to the COVID-19 pandemic, and material purchase accounting adjustments. Similarly, management presents certain asset quality metrics excluding PPP loans which it does not consider to be part of the Company’s core portfolios. These metrics include the ratio of total
4


nonperforming loans to total loans excluding PPP loans, the ratio of the allowance for loan losses to total loans excluding PPP loans, and the ratio of annualized net charge-offs to average total loans excluding PPP loans. The Company anticipates that the vast majority of its PPP loans outstanding at December 31, 2020 will be forgiven during 2021, and to the extent not forgiven, a PPP loan is intended to be 100% guaranteed by the SBA.

Management also presents tangible assets, tangible shareholders’ equity, tangible book value per share, and the ratio of tangible shareholders’ equity to tangible assets, each of which excludes the impact of goodwill and other intangible assets, as management believes these financial measures provide investors with the ability to further assess the Company’s performance, identify trends in its core business and provide a comparison of its capital adequacy to other companies. The Company included the tangible ratios because management believes that investors may find it useful to have access to the same analytical tools used by management to assess performance and identify trends.

These non-GAAP financial measures presented in this press release should not be considered an alternative or substitute for financial results or measures determined in accordance with GAAP or as an indication of the Company’s cash flows from operating activities, a measure of its liquidity position or an indication of funds available for its cash needs. An item which management considers to be non-core and excludes when computing these non-GAAP measures can be of substantial importance to the Company’s results for any particular period. In addition, management’s methodology for calculating non-GAAP financial measures may differ from the methodologies employed by other banking companies to calculate the same or similar performance measures, and accordingly, the Company’s reported non-GAAP financial measures may not be comparable to the same or similar performance measures reported by other banking companies. Please refer to Appendices A-E for a reconciliations of the Company's GAAP financial measures to the non-GAAP financial measures in this press release.


FORWARD-LOOKING STATEMENTS

This press release contains “forward-looking statements” within the meaning of section 27A of the Securities Act of 1933, as amended, and section 21E of the Securities Exchange Act of 1934, as amended. Forward-looking statements include statements regarding anticipated future events and can be identified by the fact that they do not relate strictly to historical or current facts. You can identify these statements from the use of the words “may,” “will,” “should,” “could,” “would,” “plan,” “potential,” “estimate,” “project,” “believe,” “intend,” “anticipate,” “expect,” “target” and similar expressions. Forward-looking statements, by their nature, are subject to risks and uncertainties. There are many factors that could cause actual results to differ materially from expected results described in the forward-looking statements.

Certain factors that could cause actual results to differ materially from expected results include developments in the Company’s market relating to the COVID-19 pandemic, including the severity and duration of the associated economic slowdown, adverse developments in the level and direction of loan delinquencies and charge-offs and changes in estimates of the adequacy of the allowance for loan losses, increased competitive pressures, changes in the interest rate environment, general economic conditions or conditions within the securities markets, and legislative and regulatory changes that could adversely affect the business in which the Company and its subsidiary Eastern Bank are engaged. For further discussion of such factors, please see the Company’s most recent reports on Forms S-1 and 10-Q filed with the U.S. Securities and Exchange Commission (the “SEC”) and available on the SEC’s website at www.sec.gov.

Further, given its ongoing and dynamic nature, it is difficult to predict what continued effects the COVID-19 pandemic will have on the Company's business and results of operations. The COVID-19 pandemic and the related local and national economic disruption may result in a continued decline in demand for the Company's products and services; increased levels of loan delinquencies, problem assets and foreclosures; an increase in the Company's allowance for loan losses; a decline in the value of loan collateral, including real estate; a greater decline in the yield on the Company's interest-earning assets than the decline in the cost of the Company's interest-bearing liabilities; and increased cybersecurity risks, as employees continue to work remotely. Accordingly, you should not place undue reliance on forward-looking statements, which reflect the Company's expectations only as of the date of this document. The Company does not undertake any obligation to update forward-looking statements.

5


EASTERN BANKSHARES, INC. AND SUBSIDIARIES
SELECTED FINANCIAL HIGHLIGHTS

Certain information in this release is presented as reviewed by the Company’s management and includes information derived from the Company’s Consolidated Statements of Income, non-GAAP financial measures, and operational and performance metrics. For information on non-GAAP financial measures, please see the section titled "Non-GAAP Financial Measures."

As of and for the three months ended
(Unaudited, dollars in thousands, except per share amounts)Dec 31, 2020Sep 30, 2020Jun 30, 2020Mar 31, 2020Dec 31, 2019
Earnings data
Net interest income$103,608 $98,742 $98,755 $100,146 $100,921 
Noninterest income49,638 47,709 47,657 33,369 47,277 
Total revenue153,246 146,451 146,412 133,515 148,198 
Noninterest expense199,169 109,817 100,765 95,172 105,619 
Pre-tax, pre-provision (loss) income(45,923)36,634 45,647 38,343 42,579 
Provision for credit losses900 700 8,600 28,600 1,800 
Pre-tax (loss) income(46,823)35,934 37,047 9,743 40,779 
Net (loss) income(44,062)28,505 29,850 8,445 31,238 
Operating net income (non-GAAP)31,612 32,322 27,301 10,858 29,878 
Per-share data
(Loss) earnings per share$(0.26)n.a.n.a.n.a.n.a.
Operating earnings per share (non-GAAP)$0.18 n.a.n.a.n.a.n.a.
Book value per share$18.36 n.a.n.a.n.a.n.a.
Tangible book value per share (non-GAAP)$16.34 n.a.n.a.n.a.n.a.
Profitability
Return on average assets (1)(1.11)%0.80 %0.88 %0.29 %1.08 %
Operating return on average assets (non-GAAP) (1) 0.79 %0.90 %0.81 %0.38 %1.03 %
Return on average shareholders' equity (1)(5.61)%6.65 %7.11 %2.08 %7.69 %
Operating return on average shareholders' equity (non-GAAP) (1)4.02 %7.54 %6.51 %2.67 %7.35 %
Net interest margin (FTE) (1)2.84 %3.04 %3.23 %3.80 %3.83 %
Cost of deposits0.03 %0.06 %0.11 %0.23 %0.26 %
Fee income ratio32.39 %32.58 %32.55 %24.99 %31.90 %
Efficiency ratio129.97 %74.99 %68.82 %71.28 %71.27 %
Operating efficiency ratio (non-GAAP)68.33 %69.95 %68.90 %69.54 %71.10 %
Balance Sheet (end of period)
Total assets$15,964,190 $15,460,594 $13,996,523 $12,343,754 $11,628,775 
Total loans (2)9,706,989 9,911,494 9,979,616 9,080,743 8,981,481 
Total deposits12,155,784 13,332,585 11,846,765 10,309,011 9,551,392 
Total loans / total deposits79.85 %74.34 %84.24 %88.09 %94.03 %
PPP loans (2)$1,007,487 $1,098,883 $1,072,312 $— $— 
Asset quality
Allowance for loan losses (ALLL)$113,031 $115,432 $116,636 $109,138 $82,297 
ALLL / total nonperforming loans (NPLs)261.33 %257.47 %210.55 %222.34 %188.00 %
Total NPLs / total loans0.45 %0.45 %0.56 %0.54 %0.49 %
Total NPLs / total loans (excl. PPP loans) (non-GAAP)0.50 %0.51 %0.62 %0.54 %0.49 %
Net charge-offs (NCOs) / average total loans (1)0.13 %0.08 %0.04 %0.08 %0.11 %
NCOs / average total loans (excl. PPP loans) (non-GAAP) (1)0.15 %0.09 %0.05 %0.08 %0.11 %
Remaining COVID-19 loan modifications (3)$332,682 $701,227 $945,995 $— $— 
Capital adequacy
Shareholders' equity / assets21.47 %11.08 %12.10 %13.47 %13.76 %
Tangible shareholders' equity / tangible assets (non-GAAP)19.58 %8.87 %9.67 %10.74 %10.86 %
(1) Presented on an annualized basis.
(2) Includes unamortized premiums, net of unearned discounts and deferred fees.
(3) See Appendix G: COVID-19 Related Loan Modifications
6


EASTERN BANKSHARES, INC. AND SUBSIDIARIES
CONSOLIDATED BALANCE SHEETS
As ofDec 31, 2020 change from
(Unaudited, dollars in thousands)Dec 31, 2020Sep 30, 2020Dec 31, 2019Sep 30, 2020Dec 31, 2019
ASSETS△ $△ %△ $△ %
Cash and due from banks$116,591 $69,051 $135,503 47,540 69 %(18,912)(14)%
Short-term investments1,937,479 2,259,033 227,099 (321,554)(14)%1,710,380 753 %
Cash and cash equivalents2,054,070 2,328,084 362,602 (274,014)(12)%1,691,468 466 %
Securities held for trading— — 961 — — %(961)(100)%
Available for sale securities3,183,861 2,207,672 1,508,236 976,189 44 %1,675,625 111 %
Total securities3,183,861 2,207,672 1,509,197 976,189 44 %1,674,664 111 %
Loans held for sale1,140 4,649 26 (3,509)(75)%1,114 4285 %
Loans:
Commercial and industrial1,995,016 2,177,216 1,642,184 (182,200)(8)%352,832 21 %
Commercial real estate3,573,630 3,652,312 3,535,441 (78,682)(2)%38,189 %
Commercial construction305,708 297,508 273,774 8,200 %31,934 12 %
Business banking1,339,164 1,251,573 771,498 87,591 %567,666 74 %
Total commercial loans7,213,518 7,378,609 6,222,897 (165,091)(2)%990,621 16 %
Residential real estate1,370,957 1,373,237 1,428,630 (2,280)— %(57,673)(4)%
Consumer home equity868,270 890,771 933,088 (22,501)(3)%(64,818)(7)%
Other consumer277,780 301,624 402,431 (23,844)(8)%(124,651)(31)%
Total Loans9,730,525 9,944,241 8,987,046 (213,716)(2)%743,479 %
Allowance for loan losses(113,031)(115,432)(82,297)2,401 (2)%(30,734)37 %
Unamortized prem./disc. and def. fees(23,536)(32,747)(5,565)9,211 (28)%(17,971)323 %
Net Loans9,593,958 9,796,062 8,899,184 (202,104)(2)%694,774 %
Federal Home Loan Bank stock, at cost8,805 8,805 9,027 — — %(222)(2)%
Premises and equipment49,398 50,539 57,453 (1,141)(2)%(8,055)(14)%
Bank-owned life insurance78,561 78,058 77,546 503 %1,015 %
Goodwill and other intangibles, net376,534 375,632 377,734 902 — %(1,200)— %
Deferred income taxes, net13,229 19,925 28,207 (6,696)(34)%(14,978)(53)%
Prepaid expenses148,680 92,473 61,336 56,207 61 %87,344 142 %
Other assets455,954 498,695 246,463 (42,741)(9)%209,491 85 %
Total Assets15,964,190 15,460,594 11,628,775 503,596 %4,335,415 37 %
LIABILITIES AND SHAREHOLDERS' EQUITY
Deposits:
Demand4,910,794 6,312,479 3,517,447 (1,401,685)(22)%1,393,347 40 %
Interest checking accounts2,380,497 2,207,266 1,814,327 173,231 %566,170 31 %
Savings accounts1,256,736 1,217,898 971,119 38,838 %285,617 29 %
Money market investment3,348,898 3,315,198 2,919,360 33,700 %429,538 15 %
Certificate of deposits258,859 279,744 329,139 (20,885)(7)%(70,280)(21)%
Total deposits12,155,784 13,332,585 9,551,392 (1,176,801)(9)%2,604,392 27 %
Borrowed funds:
Federal funds purchased— — 201,082 — — %(201,082)(100)%
Federal Home Loan Bank advances14,624 14,773 18,964 (149)(1)%(4,340)(23)%
Escrow deposits of borrowers13,425 14,664 15,349 (1,239)(8)%(1,924)(13)%
Total borrowed funds28,049 29,437 235,395 (1,388)(5)%(207,346)(88)%
Other liabilities352,305 385,200 241,835 (32,895)(9)%110,470 46 %
Total Liabilities12,536,138 13,747,222 10,028,622 (1,211,084)(9)%2,507,516 25 %
Shareholders' equity:
Common stock1,868 — — 1,868 — %1,868 — %
Additional paid-in capital 1,854,068 — — 1,854,068 — %1,854,068 — %
Unallocated ESOP common stock(147,725)— — (147,725)— %(147,725)— %
Retained earnings1,665,607 1,709,669 1,644,000 (44,062)(3)%21,607 %
Accumulated other comprehensive income (AOCI), net of tax54,234 3,703 (43,847)50,531 1365 %98,081 (224)%
Total shareholders' equity3,428,052 1,713,372 1,600,153 1,714,680 100 %1,827,899 114 %
Total liabilities and shareholders' equity15,964,190 15,460,594 11,628,775 503,596 %4,335,415 37 %
7


EASTERN BANKSHARES, INC. AND SUBSIDIARIES
CONSOLIDATED STATEMENTS OF INCOME

Three months endedThree months ended Dec 31, 2020 change from three months ended
(Unaudited, dollars in thousands, except share data)Dec 31, 2020Sep 30, 2020Dec 31, 2019Sep 30, 2020Dec 31, 2019
Interest and dividend income:△ $△ %△ $△ %
Interest and fees on loans$93,767 $90,704 $97,364 3,063 %(3,597)(4)%
Taxable interest and dividends on available for sale securities8,493 7,554 7,932 939 12 %561 %
Non-taxable interest and dividends on available for sale securities1,879 1,883 1,951 (4)— %(72)(4)%
Interest on federal funds sold and other short-term investments584 372 720 212 57 %(136)(19)%
Interest and dividends on trading securities— — — — %(6)(100)%
Total interest and dividend income104,723 100,513 107,973 4,210 %(3,250)(3)%
Interest expense:
Interest on deposits1,070 1,727 6,115 (657)(38)%(5,045)(83)%
Interest on borrowings45 44 937 %(892)(95)%
Total interest expense1,115 1,771 7,052 (656)(37)%(5,937)(84)%
Net interest income103,608 98,742 100,921 4,866 %2,687 %
Provision for allowance for credit losses900 700 1,800 200 29 %(900)(50)%
Net interest income after provision for credit losses102,708 98,042 99,121 4,666 %3,587 %
Noninterest income:
Insurance commissions22,437 21,884 20,168 553 %2,269 11 %
Service charges on deposit accounts6,046 5,052 6,853 994 20 %(807)(12)%
Trust and investment advisory fees5,502 5,311 5,058 191 %444 %
Debit card processing fees2,749 2,721 2,666 28 %83 %
Interest rate swap income (losses)2,538 1,319 4,691 1,219 92 %(2,153)(46)%
Income (losses) from investments held in rabbi trusts5,535 3,800 3,164 1,735 46 %2,371 75 %
(Losses) gains on trading securities, net(1)— — (1)— %(1)— %
Gains on sales of mortgage loans held for sale, net3,334 2,219 342 1,115 50 %2,992 875 %
Gains on sales of securities available for sale, net— — — %— %
Other1,495 5,403 4,335 (3,908)(72)%(2,840)(66)%
Total noninterest income49,638 47,709 47,277 1,929 %2,361 %
Noninterest expense:
Salaries and employee benefits70,310 66,593 61,317 3,717 %8,993 15 %
Office occupancy and equipment8,198 8,294 10,592 (96)(1)%(2,394)(23)%
Data processing11,354 11,721 12,806 (367)(3)%(1,452)(11)%
Professional services5,307 5,510 4,750 (203)(4)%557 12 %
Charitable contributions91,288 — 3,040 91,288 — %88,248 2903 %
Marketing2,823 1,943 3,266 880 45 %(443)(14)%
Loan expenses2,025 1,554 1,436 471 30 %589 41 %
FDIC insurance946 938 78 %868 1113 %
Amortization of intangible assets755 699 885 56 %(130)(15)%
Other6,163 12,565 7,449 (6,402)(51)%(1,286)(17)%
Total noninterest expense199,169 109,817 105,619 89,352 81 %93,550 89 %
(Loss) Income before income tax (benefit) expense(46,823)35,934 40,779 (82,757)(230)%(87,602)(215)%
Income tax (benefit) expense(2,761)7,429 9,541 (10,190)(137)%(12,302)(129)%
Net (loss) income(44,062)28,505 31,238 (72,567)(255)%(75,300)(241)%
Share data:
Weighted average common shares outstanding171,812,535 n.a.n.a.
(Loss) earnings per share$(0.26)n.a.n.a.
8


EASTERN BANKSHARES, INC. AND SUBSIDIARIES
CONSOLIDATED STATEMENTS OF INCOME

Twelve months ended
(Unaudited, dollars in thousands, except share data)Dec 31, 2020Dec 31, 2019Change
Interest and dividend income:△ $△ %
Interest and fees on loans$372,152 $402,092 (29,940)(7)%
Taxable interest and dividends on available for sale securities31,825 31,400 425 %
Non-taxable interest and dividends on available for sale securities7,588 8,306 (718)(9)%
Interest on federal funds sold and other short-term investments1,757 2,977 (1,220)(41)%
Interest and dividends on trading securities242 (236)(98)%
Total interest and dividend income413,328 445,017 (31,689)(7)%
Interest expense:
Interest on deposits11,315 27,301 (15,986)(59)%
Interest on borrowings762 6,452 (5,690)(88)%
Total interest expense12,077 33,753 (21,676)(64)%
Net interest income401,251 411,264 (10,013)(2)%
Provision for allowance for credit losses38,800 6,300 32,500 516 %
Net interest income after provision for credit losses362,451 404,964 (42,513)(10)%
Noninterest income:
Insurance commissions94,495 90,587 3,908 %
Service charges on deposit accounts21,560 27,043 (5,483)(20)%
Trust and investment advisory fees21,102 19,653 1,449 %
Debit card processing fees10,277 10,452 (175)(2)%
Interest rate swap (losses) income(1,381)4,362 (5,743)(132)%
Income from investments held in rabbi trusts10,337 9,866 471 %
(Losses) gains on trading securities, net(4)1,297 (1,301)(100)%
Gains on sales of mortgage loans held for sale, net7,066 795 6,271 789 %
Gains on sales of securities available for sale, net288 2,016 (1,728)(86)%
Other14,633 16,228 (1,595)(10)%
Total noninterest income178,373 182,299 (3,926)(2)%
Noninterest expense:
Salaries and employee benefits261,827 252,238 9,589 %
Office occupancy and equipment33,796 36,458 (2,662)(7)%
Data processing45,259 45,939 (680)(1)%
Professional services18,902 15,958 2,944 18 %
Charitable contributions95,272 12,905 82,367 638 %
Marketing8,879 9,619 (740)(8)%
Loan expenses6,727 4,593 2,134 46 %
FDIC insurance3,734 1,878 1,856 99 %
Amortization of intangible assets2,857 3,542 (685)(19)%
Other27,670 29,554 (1,884)(6)%
Total noninterest expense504,923 412,684 92,239 22 %
Income before income tax expense35,901 174,579 (138,678)(79)%
Income tax expense13,163 39,481 (26,318)(67)%
Net income22,738 135,098 (112,360)(83)%
Share data:
Weighted average common shares outstanding171,812,535 n.a.
Earnings per share$0.13 n.a.

9


EASTERN BANKSHARES, INC. AND SUBSIDIARIES
AVERAGE BALANCES, INTEREST, YIELDS AND RATES, AND NET INTEREST MARGIN

As of and for the three months ended
Dec 31, 2020Sep 30, 2020Dec 31, 2019
(Unaudited, dollars in thousands)Avg. BalanceInterestYield / Cost (5)Avg. BalanceInterestYield / Cost (5)Avg. BalanceInterestYield / Cost (5)
Interest-earning assets:
Loans (1):
Commercial$7,265,156 $73,289 4.01 %$7,314,805 $69,127 3.76 %$6,179,761 $70,751 4.54 %
Residential1,367,073 11,641 3.39 %1,390,719 12,269 3.51 %1,438,677 13,368 3.69 %
Consumer1,164,468 9,621 3.29 %1,209,340 10,091 3.32 %1,360,677 14,021 4.09 %
Total loans9,796,697 94,551 3.84 %9,914,864 91,487 3.67 %8,979,115 98,140 4.34 %
Investment securities2,627,679 10,945 1.66 %1,712,928 10,007 2.32 %1,455,386 10,482 2.86 %
Cash and other short-term investments2,291,118 584 0.10 %1,462,047 372 0.10 %173,906 720 1.64 %
Total interest earning assets14,715,494 106,080 2.87 %13,089,839 101,866 3.10 %10,608,407 109,342 4.09 %
Non-interest-earning assets1,123,550 1,139,440 897,539 
Total assets$15,839,044 $14,229,279 $11,505,946 
Interest-bearing liabilities:
Deposits:
Savings$1,232,669 $62 0.02 %$1,187,083 $62 0.02 %$970,019 $53 0.02 %
Interest checking2,282,786 232 0.04 %2,307,972 334 0.06 %1,722,176 727 0.17 %
Money market3,362,335 609 0.07 %3,311,847 1,051 0.13 %2,941,944 4,655 0.63 %
Time deposits267,378 167 0.25 %294,025 280 0.38 %326,741 680 0.83 %
Total interest-bearing deposits7,145,168 1,070 0.06 %7,100,927 1,727 0.10 %5,960,880 6,115 0.41 %
Borrowings25,529 45 0.70 %25,478 44 0.69 %231,668 937 1.60 %
Total interest-bearing liabilities7,170,697 1,115 0.06 %7,126,405 1,771 0.10 %6,192,548 7,052 0.45 %
Demand deposit accounts5,167,221 5,034,474 3,474,922 
Other non-interest-bearing liabilities376,197 362,073 226,909 
Total liabilities12,714,115 12,522,952 9,894,379 
Shareholders' equity3,124,929 1,706,327 1,611,567 
Total liabilities and shareholders' equity$15,839,044 $14,229,279 $11,505,946 
Net interest income - FTE$104,965 $100,095 $102,290 
Net interest rate spread (2)2.81 %3.00 %3.64 %
Net interest-earning assets (3)$7,544,797 $5,963,434 $4,415,859 
Net interest margin - FTE (4)2.84 %3.04 %3.83 %
(1) Non-accrual loans are included in Loans.
(2) Net interest rate spread represents the difference between the weighted average yield on interest-earning assets and the weighted average cost of interest-bearing liabilities.
(3) Net interest-earning assets represent total interest-earning assets less total interest-bearing liabilities.
(4) Net interest margin represents net interest income divided by average total interest-earning assets.
(5) Presented on an annualized basis.
10


EASTERN BANKSHARES, INC. AND SUBSIDIARIES
AVERAGE BALANCES, INTEREST, YIELDS AND RATES, AND NET INTEREST MARGIN

As of and for twelve months ended
Dec 31, 2020Dec 31, 2019
(Unaudited, dollars in thousands)Avg. BalanceInterestYield / CostAvg. BalanceInterestYield / Cost
Interest-earning assets:
Loans (1):
Commercial$7,014,044 $281,816 4.02 %$6,089,410 $291,055 4.78 %
Residential1,400,907 49,767 3.55 %1,439,845 53,736 3.73 %
Consumer1,236,893 43,729 3.54 %1,419,692 60,009 4.23 %
Total loans9,651,844 375,312 3.89 %8,948,947 404,800 4.52 %
Investment securities1,826,121 41,730 2.29 %1,435,719 42,494 2.96 %
Cash and other short-term investments1,288,714 1,758 0.14 %144,856 2,977 2.06 %
Total interest earning assets12,766,679 418,800 3.28 %10,529,522 450,271 4.28 %
Non-interest-earning assets1,097,064 874,588 
Total assets$13,863,743 $11,404,110 
Interest-bearing liabilities:
Deposits:
Savings$1,123,584 $242 0.02 %$991,244 $210 0.02 %
Interest checking2,227,185 2,033 0.09 %1,842,993 3,947 0.21 %
Money market3,212,752 7,492 0.23 %2,769,934 19,150 0.69 %
Time deposits300,381 1,548 0.52 %392,035 3,994 1.02 %
Total interest-bearing deposits6,863,902 11,315 0.16 %5,996,206 27,301 0.46 %
Borrowings72,101 762 1.06 %291,413 6,452 2.21 %
Total interest-bearing liabilities6,936,003 12,077 0.17 %6,287,619 33,753 0.54 %
Demand deposit accounts4,535,066 3,369,375 
Other non-interest-bearing liabilities352,518 203,925 
Total liabilities11,823,587 9,860,919 
Shareholders' equity2,040,156 1,543,191 
Total liabilities and shareholders' equity$13,863,743 $11,404,110 
Net interest income - FTE$406,723 $416,518 
Net interest rate spread (2)3.11 %3.74 %
Net interest-earning assets (3)$5,830,676 $4,241,903 
Net interest margin - FTE (4)3.19 %3.96 %
(1) Non-accrual loans are included in Loans.
(2) Net interest rate spread represents the difference between the weighted average yield on interest-earning assets and the weighted average cost of interest-bearing liabilities.
(3) Net interest-earning assets represent total interest-earning assets less total interest-bearing liabilities.
(4) Net interest margin represents net interest income divided by average total interest-earning assets.

11


EASTERN BANKSHARES, INC. AND SUBSIDIARIES
ASSET QUALITY - NON-PERFORMING ASSETS (1)

As of
Dec 31, 2020Sep 30, 2020Jun 30, 2020Mar 31, 2020Dec 31, 2019
(Unaudited, dollars in thousands)
Non-accrual loans:
Commercial$30,059 $28,968 $31,273 $38,054 $34,093 
Residential6,815 7,419 11,693 5,594 5,598 
Consumer4,131 4,727 9,374 4,085 2,760 
Total non-accrual loans41,005 41,114 52,340 47,733 42,451 
Accruing loans past due 90 days or more:
Commercial1,959 3,384 2,802 1,345 1,315 
Residential279 326 244 — — 
Consumer
Total accruing loans past due 90 days or more2,247 3,719 3,055 1,354 1,324 
Total non-performing loans43,252 44,833 55,395 49,087 43,775 
Other real estate owned— 40 40 40 — 
Other non-performing assets:— — — — — 
Total non-performing assets$43,252 $44,873 $55,435 $49,127 $43,775 
Total accruing troubled debt restructured loans$41,095 $39,881 $40,691 $41,880 $48,623 
Total non-performing loans to total loans0.45 %0.45 %0.56 %0.54 %0.49 %
Total non-performing assets to total assets0.27 %0.29 %0.40 %0.40 %0.38 %
(1) Non-performing assets are comprised of nonperforming loans (“NPLs”), other real estate owned (“OREO”) and non-performing securities. NPLs consist of non-accrual loans and loans that are more than 90 days past due but still accruing interest. OREO consists of real estate properties, which primarily serve as collateral to secure the Company’s loans, that it controls due to foreclosure. These properties are recorded at the lower of cost or fair value less estimated costs to sell on the date the Company obtains control.


12


EASTERN BANKSHARES, INC. AND SUBSIDIARIES
ASSET QUALITY - PROVISION, ALLOWANCE, AND NET CHARGE OFFS

Three months ended
Dec 31, 2020Sep 30, 2020Jun 30, 2020Mar 31, 2020Dec 31, 2019
(Unaudited, dollars in thousands)
Average total loans$9,796,697 $9,914,731 $9,875,110 $9,016,223 $8,979,115 
Allowance for loan losses, beginning of the period$115,432 $116,636 $109,138 $82,297 $83,022 
Charged-off loans:
Commercial and industrial1,603 140 27 — 851 
Commercial real estate— — 24 — — 
Commercial construction— — — — — 
Business banking1,433 1,179 1,198 1,337 1,534 
Residential real estate— — — — — 
Consumer home equity79 22 — 473 14 
Other consumer713 1,077 15 533 541 
Total charged-off loans3,828 2,418 1,264 2,343 2,940 
Recoveries on loans previously charged-off:
Commercial and industrial92 306 58 322 210 
Commercial real estate220 
Commercial construction— — — — — 
Business banking47 91 27 127 112 
Residential real estate43 13 60 17 
Consumer home equity100 31 14 
Other consumer59 39 51 60 66 
Total recoveries527 514 162 584 415 
Net loans charged-off (recoveries):
Commercial and industrial1,511 (166)(31)(322)641 
Commercial real estate(220)(4)19 (1)(2)
Commercial construction— — — — — 
Business banking1,386 1,088 1,171 1,210 1,422 
Residential real estate(9)(43)(13)(60)(17)
Consumer home equity(21)(9)(8)459 
Other consumer654 1,038 (36)473 475 
Total net loans charged-off3,301 1,904 1,102 1,759 2,525 
Provision for loan losses900 700 8,600 28,600 1,800 
Total allowance for loan losses, end of period$113,031 $115,432 $116,636 $109,138 $82,297 
Net charge-offs to average total loans outstanding during this period (1)0.13 %0.08 %0.04 %0.08 %0.11 %
Allowance for loan losses as a percent of total loans1.16 %1.16 %1.17 %1.20 %0.92 %
Allowance for loan losses as a percent of nonperforming loans261.33 %257.47 %210.55 %222.34 %188.00 %
(1) Presented on an annualized basis.
13


APPENDIX A: Reconciliation of Non-GAAP Earnings Metrics

For information on non-GAAP financial measures, please see the section titled "Non-GAAP Financial Measures."
Three Months Ended
(Unaudited, dollars in thousands, except share data)Dec 31, 2020Sep 30, 2020Jun 30, 2020Mar 31, 2020Dec 31, 2019
Net income (GAAP)$(44,062)$28,505 $29,850 $8,445 $31,238 
Add:
Noninterest income components:
(Income) loss from investments held in rabbi trusts(5,535)(3,800)(7,745)6,743 (3,164)
(Gain) loss on sales of securities available for sale, net(3)— (163)(122)— 
(Gain) loss on sale of other assets(49)71 27 (29)(29)
Noninterest expense components:
Rabbi trust employee benefit expense (income)2,838 1,445 3,985 (3,479)1,554 
Impairment charge on tax credit investments3,189 7,590 — — — 
Indirect initial public offering costs (1)    — 549 380 270 — 
(Gain) loss on sale of other real estate owned(61)(546)— — — 
Merger and acquisition expenses90 — — — — 
Stock donation to the Eastern Bank Charitable Foundation91,287 — — — — 
Total impact of non-GAAP adjustments91,756 5,309 (3,516)3,383 (1,639)
Less net tax benefit (expense) associated with non-GAAP adjustment (2)16,082 1,492 (967)970 (279)
Non-GAAP adjustments, net of tax$75,674 $3,817 $(2,549)$2,413 $(1,360)
Operating net income (non-GAAP)$31,612 $32,322 $27,301 $10,858 $29,878 
Weighted average common shares outstanding during the period:
Basic171,812,535 — — — — 
Diluted171,812,535 — — — — 
(Loss) earnings per share, basic$(0.26)n.a.n.a.n.a.n.a.
(Loss) earnings per share, diluted$(0.26)n.a.n.a.n.a.n.a.
Operating earnings per share, basic (non-GAAP)$0.18 n.a.n.a.n.a.n.a.
Operating earnings per share, diluted (non-GAAP)$0.18 n.a.n.a.n.a.n.a.
Return on average assets (3)(1.11)%0.80 %0.88 %0.29 %1.08 %
Add:
(Income) loss from investments held in rabbi trusts (3)(0.14)%(0.11)%(0.23)%0.23%(0.11)%
(Gain) loss on sales of securities available for sale, net (3)—%—%—%—%—%
(Gain) loss on sale of other assets (3)—%—%—%—%—%
Rabbi trust employee benefit expense (income) (3)0.07%0.04%0.12%(0.12)%0.05%
Impairment charge on tax credit investments (3)0.08%0.21%—%—%—%
Indirect initial public offering costs (1) (3)—%0.02%0.01%0.01%—%
(Gain) loss on sale of other real estate owned (3)—%(0.02)%—%—%—%
Merger and acquisition expenses (3)—%—%—%—%—%
Stock donation to the EBCF (3)2.29%—%—%—%—%
Less net tax benefit (expense) associated with non-GAAP adjustment (2) (3)0.40%0.04%(0.03)%0.03%(0.01)%
Operating return on average assets (non-GAAP) (3)0.79 %0.90 %0.81 %0.38 %1.03 %
Return on average shareholders' equity (3)(5.61)%6.65 %7.11 %2.08 %7.69 %
Add:
(Income) loss from investments held in rabbi trusts (3)(0.70)%(0.89)%(1.84)%1.66%(0.78)%
(Gain) loss on sales of securities available for sale, net (3)—%—%(0.04)%(0.03)%—%
(Gain) loss on sale of other assets (3)(0.01)%0.02%0.01%(0.01)%(0.01)%
Rabbi trust employee benefit expense (income) (3)0.36%0.34%0.95%(0.86)%0.38%
Impairment charge on tax credit investments (3)0.41%1.77%—%—%—%
Indirect initial public offering costs (1) (3)—%0.13%0.09%0.07%—%
(Gain) loss on sale of other real estate owned (3)(0.01)%(0.13)%—%—%—%
Merger and acquisition expenses (3)—%—%—%—%—%
Stock donation to the EBCF (3)11.62%—%—%—%—%
Less net tax benefit (expense) associated with non-GAAP adjustment (2) (3)2.05%0.35%(0.23)%0.24%(0.07)%
Operating return on average shareholders' equity (non-GAAP) (3)4.02 %7.54 %6.51 %2.67 %7.35 %
(1) Reflects costs associated with the Company's initial public offering that are indirectly related to the offering and were not recorded as a reduction of capital.
(2) The net tax benefit (expense) associated with these items is determined by assessing whether each item is included or excluded from net taxable income and applying the Company's combined statutory tax rate only to those items included in net taxable income. Additionally, the net tax benefit (expense) for the impairment charge of tax credit investment includes associated tax credit benefits.
(3) Ratios have been annualized.
14


APPENDIX B: Reconciliation of Non-GAAP Operating Revenues and Expenses

For information on non-GAAP financial measures, please see the section titled "Non-GAAP Financial Measures."

Three Months Ended
Dec 31, 2020Sep 30, 2020Jun 30, 2020Mar 31, 2020Dec 31, 2019
(Unaudited, dollars in thousands)
Net interest income (GAAP)$103,608 $98,742 $98,755 $100,146 $100,921 
Add:
Tax-equivalent adjustment (non-GAAP)1,357 1,353 1,378 1,368 1,369 
Fully-taxable equivalent net interest income (non-GAAP)$104,965 $100,095 $100,133 $101,514 $102,290 
Noninterest income (GAAP)$49,638 $47,709 $47,657 $33,369 $47,277 
Less:
Income (loss) from investments held in rabbi trusts5,535 3,800 7,745 (6,743)3,164 
Gain (loss) on sales of securities available for sale, net— 163 122 — 
Gain (loss) on sale of other assets49 (71)(27)29 29 
Noninterest income on an operating basis (non-GAAP)$44,051 $43,980 $39,776 $39,961 $44,084 
Noninterest expense (GAAP)$199,169 $109,817 $100,765 $95,172 $105,619 
Less:
Rabbi trust employee benefit expense (income)2,838 1,445 3,985 (3,479)1,554 
Impairment charge on tax credit investments3,189 7,590 — — — 
Indirect initial public offering costs (1)— 549 380 270 — 
(Gain) loss on sale of other real estate owned(61)(546)— — — 
Merger and acquisition expenses90 — — — — 
Stock donation to the Eastern Bank Charitable Foundation91,287 — — — — 
Noninterest expense on an operating basis (non-GAAP)$101,826 $100,779 $96,400 $98,381 $104,065 
Total revenue (GAAP)$153,246 $146,451 $146,412 $133,515 $148,198 
Total operating revenue (non-GAAP)$149,016 $144,075 $139,909 $141,475 $146,374 
Efficiency ratio (GAAP)129.97 %74.99 %68.82 %71.28 %71.27 %
Operating efficiency ratio (non-GAAP)68.33 %69.95 %68.90 %69.54 %71.10 %
Noninterest income / total revenue (GAAP)32.39 %32.58 %32.55 %24.99 %31.90 %
Noninterest income / total revenue on an operating basis (non-GAAP)29.56 %30.53 %28.43 %28.25 %30.12 %
(1) Reflects costs associated with the Company's initial public offering that are indirectly related to the offering and were not recorded as a reduction of capital.
15


APPENDIX C: Reconciliation of Non-GAAP Capital Metrics

For information on non-GAAP financial measures, please see the section titled "Non-GAAP Financial Measures."

As of
Dec 31, 2020Sep 30, 2020Jun 30, 2020Mar 31, 2020Dec 31, 2019
(Unaudited, dollars in thousands, except share data)
Tangible shareholders' equity:
Total shareholders' equity (GAAP)$3,428,052 $1,713,372 $1,693,630 $1,662,734 $1,600,153 
Less: Goodwill and other intangibles376,534 375,632 376,331 377,033 377,734 
Tangible shareholders' equity (non-GAAP)3,051,518 1,337,740 1,317,299 1,285,701 1,222,419 
Tangible assets:
Total assets (GAAP)15,964,190 15,460,594 13,996,523 12,343,754 11,628,775 
Less: Goodwill and other intangibles376,534 375,632 376,331 377,033 377,734 
Tangible assets (non-GAAP)$15,587,656 $15,084,962 $13,620,192 $11,966,721 $11,251,041 
Shareholders' equity to assets ratio (GAAP)21.5 %11.1 %12.1 %13.5 %13.8 %
Tangible shareholders' equity to tangible assets ratio (non-GAAP)19.6 %8.9 %9.7 %10.7 %10.9 %
Common shares outstanding186,758,154     
Book value per share (GAAP)$18.36 n.a.n.a.n.a.n.a.
Tangible book value per share (non-GAAP)$16.34 n.a.n.a.n.a.n.a.
16


APPENDIX D: Reconciliation of Non-GAAP Credit Metrics

For information on non-GAAP financial measures, please see the section titled "Non-GAAP Financial Measures."

As of
(Unaudited, dollars in thousands)Dec 31, 2020Sep 30, 2020Jun 30, 2020Mar 31, 2020Dec 31, 2019
Total loans excluding PPP loans:
Total loans (GAAP)$9,706,989 $9,911,494 $9,979,616 $9,080,743 $8,981,481 
Less: PPP loans1,007,487 1,098,883 1,072,312 — — 
Total loans excluding PPP loans (non-GAAP)$8,699,502 $8,812,611 $8,907,304 $9,080,743 $8,981,481 
Total nonperforming loans (NPLs) (GAAP)$43,252 $44,833 $55,395 $49,087 $43,775 
Total NPLs / total loans (GAAP)0.45 %0.45 %0.56 %0.54 %0.49 %
Total NPLs / total loans (excl. PPP loans) (non-GAAP)0.50 %0.51 %0.62 %0.54 %0.49 %
Allowance for loan losses (ALLL) (GAAP)$113,031 $115,432 $116,636 $109,138 $82,297 
ALLL / total loans (GAAP)1.16 %1.16 %1.17 %1.20 %0.92 %
ALLL / total loans (excl. PPP loans) (non-GAAP)1.30 %1.31 %1.31 %1.20 %0.92 %
As of and for the three months ended
(Unaudited, dollars in thousands)Dec 31, 2020Sep 30, 2020Jun 30, 2020Mar 31, 2020Dec 31, 2019
Average total loans excluding PPP Loans:
Average total loans (GAAP)$9,796,697 $9,914,731 $9,875,110 $9,016,223 $8,979,115 
Less: Average PPP loans1,076,155 1,091,464 818,665 — — 
Average total loans excluding PPP loans (non-GAAP)$8,720,542 $8,823,267 $9,056,445 $9,016,223 $8,979,115 
Total net loans charged-off (NCOs) (GAAP)$3,301 $1,904 $1,102 $1,759 $2,525 
NCOs / Average total loans (GAAP) (1)0.13 %0.08 %0.04 %0.08 %0.11 %
NCOs / Average total loans (excl. PPP loans) (non-GAAP) (1)0.15 %0.09 %0.05 %0.08 %0.11 %
(1) Presented on an annualized basis
17


Appendix E: Reconciliation of Non-GAAP Core Margin

For information on non-GAAP financial measures, please see the section titled "Non-GAAP Financial Measures."

As of and for the three months ended
Dec 31, 2020Sep 30, 2020
(Unaudited, dollars in thousands)VolumeInterestMargin Impact (1)VolumeInterestMargin Impact (1)
Reported total average interest earnings assets, net interest income, and net interest margin (2)$14,715,494 $104,965 2.84 %$13,089,839 $100,095 3.04 %
Non-GAAP adjustments:
PPP loan volume earning 1%(1,076,155)(2,741)0.14 %(1,091,464)(2,795)0.18 %
SBA PPP loan fee accretion, net of deferred origination cost amortization— (6,102)(0.16)%— (4,125)(0.13)%
Excess cash (3)(1,996,808)(502)0.43 %(1,200,250)(302)0.30 %
Deferred loan fee income adjustment— (3,774)(0.10)%— — — %
Core margin (Non-GAAP) (4)$11,642,531 $91,846 3.14 %$10,798,125 $92,873 3.42 %
Core margin change from prior quarter(0.28)%(0.09)%
Jun 30, 2020Mar 31, 2020
VolumeInterestMargin Impact (1)VolumeInterestMargin Impact (1)
Reported total average interest earnings assets, net interest income, and net interest margin (2)$12,479,343 $100,137 3.23 %$10,757,076 $101,513 3.80 %
Non-GAAP adjustments:
PPP loan volume earning 1%(818,665)(2,175)0.15 %— — — %
SBA PPP loan fee accretion, net of deferred origination cost amortization— (3,655)(0.12)%— — — %
Excess cash (3)(898,745)(223)0.24 %(25,298)(54)0.01 %
Deferred loan fee income adjustment— — — %— — — %
Core margin (Non-GAAP) (4)$10,761,933 $94,084 3.52 %$10,731,778 $101,459 3.80 %
Core margin change from prior quarter(0.29)%
(1) Presented on an annualized basis.
(2) Presented on an fully taxable equivalent basis.
(3) Cash above 2% of average total earning assets at yield of 10, 10, 10, and 86 basis points in quarters four, three, two, and one, respectively.
(4) Core margin is the margin that results from the combined volume and interest adjustments taken together.
18


APPENDIX F: Commercial Loan Portfolio Exposure to High-risk Industries

High-risk industries are those industries that the Company believes will likely experience the most adverse effects of COVID-19.

As of December 31, 2020
Industry
Loan balance (Dollars in thousands)
Balance as a percent of total loansCOVID-19
modification as a percent of loan type
Retail (1)$496,358 5.1 %2.1 %
Restaurants197,388 2.0 %12.7 %
Hotels178,696 1.8 %51.4 %
Construction contractors financing89,466 0.9 %1.0 %
Auto dealerships79,486 0.8 %— %
Other high risk85,132 0.9 %2.7 %
All impacted industries total1,126,526 11.6 %11.6 %
Remaining commercial and business banking6,086,992 62.6 %2.8 %
Total Commercial and business banking7,213,518 74.1 %4.2 %
All Other Loans2,517,007 25.9 %1.3 %
Total$9,730,525 100.0 %3.4 %
(1) The retail segment contains all retail commercial real estate loans and non-essential commercial and industrial retail loans.

APPENDIX G: COVID-19 Related Loan Modifications

Total COVID-19 Modifications as of June 30, 2020Remaining COVID-19 Modifications as of September 30, 2020 (1)Remaining COVID-19 Modifications as of December 31, 2020 (1)
(Dollars in thousands)Total Modifications% of Total Loan BalanceRemaining Modifications% of Total Loan BalanceRemaining Modifications% of Total Loan Balance
Portfolio
Commercial and industrial$157,384 6.9 %$99,630 4.6 %$34,076 1.7 %
Commercial real estate546,002 15.2 %414,233 11.3 %231,794 6.5 %
Commercial construction12,890 4.6 %13,330 4.5 %10,987 3.6 %
Business Banking106,886 8.7 %64,369 5.1 %23,434 1.8 %
Residential real estate92,775 6.6 %95,260 6.9 %26,772 2.0 %
Consumer home equity18,603 2.1 %10,093 1.1 %3,432 0.4 %
Other Consumer11,455 3.4 %4,312 1.4 %2,187 0.8 %
Total$945,995 9.5 %$701,227 7.1 %$332,682 3.4 %
(1) Remaining COVID-19 modifications reflect those loans which underwent a modification and have not yet resumed payment. The Company defines a modified loan to have resumed payment if it is one month past the modification end date and not more than 30 days past due.


19


APPENDIX H: Shareholders’ Equity Roll-forward Analysis

As ofDec 31, 2020 change from
Dec 31, 2020Sep 30, 2020Sep 30, 2020
(Unaudited, dollars in thousands, except per share amounts)△ per share
Common stock$1,868 $— $1,868 $0.01 
Additional paid in capital1,854,068 — 1,854,068 9.93 
Unallocated ESOP common stock(147,725)— (147,725)(0.79)
Retained earnings1,665,607 1,709,669 (44,062)(0.24)
AOCI, net of tax - available for sale securities45,672 43,956 1,716 0.01 
AOCI, net of tax - pension(21,253)(76,164)54,911 0.29 
AOCI, net of tax - cash flow hedge29,815 35,911 (6,096)(0.03)
Total shareholders' equity:$3,428,052 $1,713,372 $1,714,680 $9.18 
Less: Goodwill and other intangibles376,534 375,632 902 — 
Tangible shareholders' equity (non-GAAP)$3,051,518 $1,337,740 $1,713,778 $9.18 
Common shares outstanding186,758,154  
Per share:
Common stock$0.01 n.a.
Additional paid in capital9.93 n.a.
Unallocated ESOP common stock(0.79)n.a.
Retained earnings8.92 n.a.
AOCI, net of tax - available for sale securities0.24 n.a.
AOCI, net of tax - pension(0.11)n.a.
AOCI, net of tax - cash flow hedge0.16 n.a.
Total shareholders' equity:$18.36 n.a.
Less: Goodwill and other intangibles2.02 n.a.
Tangible shareholders' equity (non-GAAP)$16.34 n.a.
20
DO NOT REFRESH Color PaletteComplementary 000 / 000 / 051 Body text 074 / 075 / 076 030 / 152 / 213 185 / 197 / 212 023 / 061 / 110 119 / 139 / 154 255 / 107 / 000109 / 110 / 112 237 / 237 / 238 000 / 139 / 151 137 / 139 / 141 197 / 064 / 044 166 / 168 / 171 103 / 086 / 164 208 / 210 / 211 238 / 184 / 028 Q4 Earnings Presentation January 28 | 2021 Exhibit 99.2
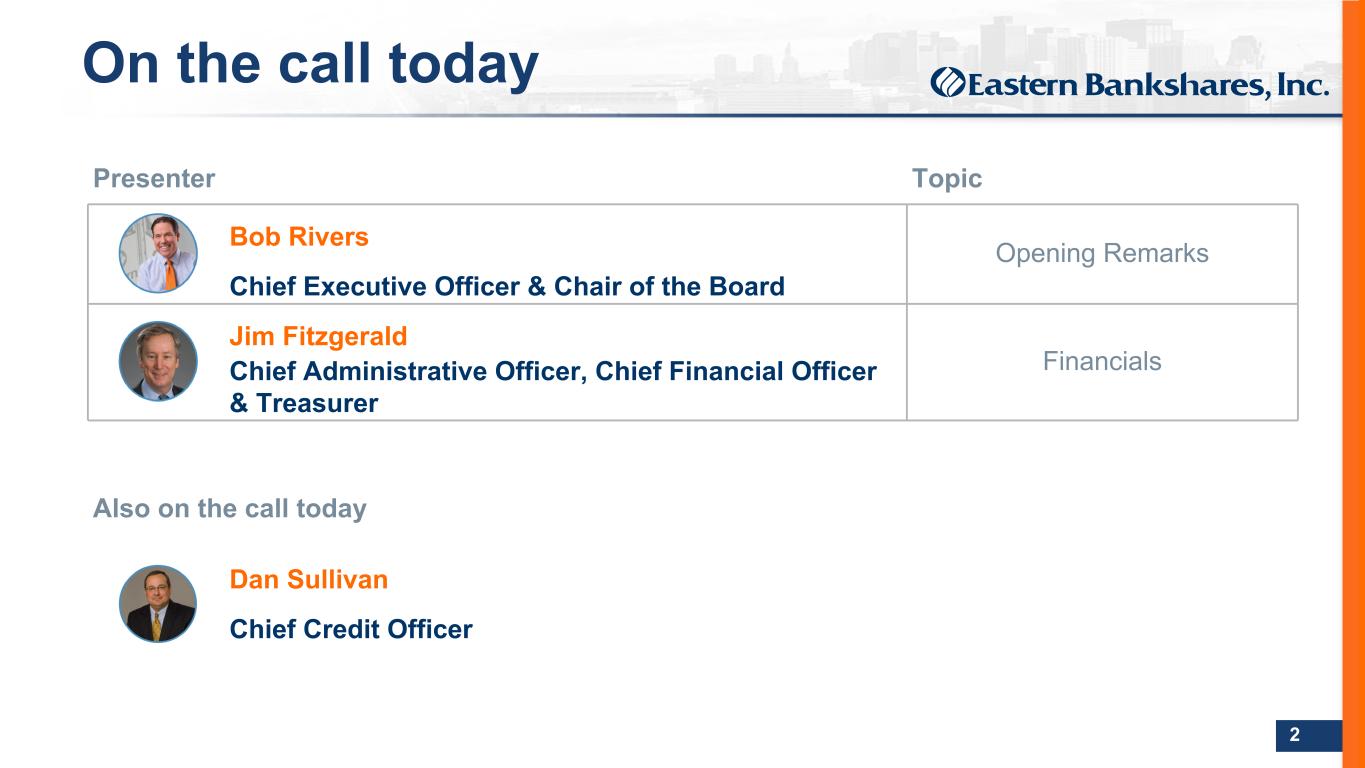

 
DO NOT REFRESH Color PaletteComplementary 000 / 000 / 051 Body text 074 / 075 / 076 030 / 152 / 213 185 / 197 / 212 023 / 061 / 110 119 / 139 / 154 255 / 107 / 000109 / 110 / 112 237 / 237 / 238 000 / 139 / 151 137 / 139 / 141 197 / 064 / 044 166 / 168 / 171 103 / 086 / 164 208 / 210 / 211 238 / 184 / 028 2 On the call today Presenter Topic Bob Rivers Opening Remarks Chief Executive Officer & Chair of the Board Jim Fitzgerald FinancialsChief Administrative Officer, Chief Financial Officer & Treasurer Also on the call today Dan Sullivan Chief Credit Officer

 
DO NOT REFRESH Color PaletteComplementary 000 / 000 / 051 Body text 074 / 075 / 076 030 / 152 / 213 185 / 197 / 212 023 / 061 / 110 119 / 139 / 154 255 / 107 / 000109 / 110 / 112 237 / 237 / 238 000 / 139 / 151 137 / 139 / 141 197 / 064 / 044 166 / 168 / 171 103 / 086 / 164 208 / 210 / 211 238 / 184 / 028 3 Forward-looking statements This presentation contains “forward-looking statements” within the meaning of section 27A of the Securities Act of 1933, as amended, and section 21E of the Securities Exchange Act of 1934, as amended. Forward-looking statements include statements regarding anticipated future events and can be identified by the fact that they do not relate strictly to historical or current facts. You can identify these statements from the use of the words “may,” “will,” “should,” “could,” “would,” “plan,” “potential,” “estimate,” “project,” “believe,” “intend,” “anticipate,” “expect,” “target” and similar expressions. Forward-looking statements, by their nature, are subject to risks and uncertainties. There are many factors that could cause actual results to differ materially from expected results described in the forward-looking statements. Certain factors that could cause actual results to differ materially from expected results include developments in the Company’s market relating to the COVID-19 pandemic, including the severity and duration of the associated economic slowdown, adverse developments in the level and direction of loan delinquencies and charge-offs and changes in estimates of the adequacy of the allowance for loan losses, increased competitive pressures, changes in the interest rate environment, general economic conditions or conditions within the securities markets, and legislative and regulatory changes that could adversely affect the business in which the Company and its subsidiary Eastern Bank are engaged. For further discussion of such factors, please see the Company’s Registration Statement on Form S-1, as amended, and its most recent report on Form 10- Q filed with the U.S. Securities and Exchange Commission (the “SEC”) and available on the SEC’s website at www.sec.gov. Further, given its ongoing and dynamic nature, it is difficult to predict what continued effects the COVID-19 pandemic will have on the Company's business and results of operations. The COVID-19 pandemic and the related local and national economic disruption may result in a continued decline in demand for the Company's products and services; increased levels of loan delinquencies, problem assets and foreclosures; an increase in the Company's allowance for loan losses; a decline in the value of loan collateral, including real estate; a greater decline in the yield on the Company's interest-earning assets than the decline in the cost of the Company's interest-bearing liabilities; and increased cybersecurity risks, as employees continue to work remotely. Accordingly, you should not place undue reliance on forward-looking statements, which reflect the Company's expectations only as of the date of this document. The Company does not undertake any obligation to update forward-looking statements.

 
DO NOT REFRESH Color PaletteComplementary 000 / 000 / 051 Body text 074 / 075 / 076 030 / 152 / 213 185 / 197 / 212 023 / 061 / 110 119 / 139 / 154 255 / 107 / 000109 / 110 / 112 237 / 237 / 238 000 / 139 / 151 137 / 139 / 141 197 / 064 / 044 166 / 168 / 171 103 / 086 / 164 208 / 210 / 211 238 / 184 / 028 4 Non-GAAP financial measures Non-GAAP financial measures used in this presentation are denoted by a footnote. A non-GAAP financial measure is defined as a numerical measure of the Company’s historical or future financial performance, financial position or cash flows that excludes (or includes) amounts, or is subject to adjustments that have the effect of excluding (or including) amounts that are included in the most directly comparable measure calculated and presented in accordance with accounting principles generally accepted in the United States (“GAAP”) in the Company’s statement of income, balance sheet or statement of cash flows (or equivalent statements). The Company presents non-GAAP financial measures, which management uses to evaluate the Company’s performance, and which exclude the effects of certain transactions that management believes are unrelated to its core business and are therefore not necessarily indicative of its current performance or financial position. Management believes excluding these items facilitates greater visibility for investors into the Company’s core businesses as well as underlying trends that may, to some extent, be obscured by inclusion of such items in the corresponding GAAP financial measures. There are items in the Company’s financial statements that impact its financial results, but which management believes are unrelated to the Company’s core business. Accordingly, the Company presents noninterest income on an operating basis, total operating revenue, noninterest expense on an operating basis, operating net income, operating earnings per share, operating return on average assets, operating return on average shareholders’ equity, the operating efficiency ratio, and the ratio of noninterest income to total revenue on an operating basis. Each of these figures excludes the impact of such applicable items because management believes such exclusion can provide greater visibility into the Company’s core business and underlying trends. Such items that management does not consider to be core to the Company’s business include (i) income and expenses from investments held in rabbi trusts, (ii) gains and losses on sales of securities available for sale, net, (iii) gains and losses on the sale of other assets, (iv) rabbi trust employee benefits, (v) impairment charges on tax credit investments and associated tax credit benefits, (vi) expenses indirectly associated with the Company’s IPO, (vii) other real estate owned gains, (viii) merger and acquisition expenses, and (ix) the stock donation to the EBCF in connection with the Company’s mutual-to-stock conversion and IPO. The Company does not provide an outlook for its total noninterest expense because it contains expense components, such as expense associated with rabbi trust accounts, which is market-driven, over which the Company cannot exercise control. Accordingly a reconciliation of the Company’s outlook for its noninterest expense on an operating basis to an outlook for total noninterest expense cannot be made available without unreasonable effort. Management also presents the Company’s core net interest margin which excludes the impact of items management determines as being one-time in nature or not indicative of its core operating results. Such items include the impact of excess liquidity in the form of excess cash volume, PPP loans originated in response to the COVID-19 pandemic, and material purchase accounting adjustments. Similarly, management presents certain asset quality metrics excluding PPP loans which it does not consider to be part of the Company’s core portfolios. These metrics include the ratio of total nonperforming loans to total loans excluding PPP loans, the ratio of the allowance for loan losses to total loans excluding PPP loans, and the ratio of annualized net charge-offs to average total loans excluding PPP loans. The Company anticipates that the vast majority of its PPP loans outstanding at December 31, 2020 will be forgiven during 2021, and to the extent not forgiven, a PPP loan is intended to be 100% guaranteed by the SBA. Management also presents tangible assets, tangible shareholders’ equity, tangible book value per share, and the ratio of tangible shareholders’ equity to tangible assets, each of which excludes the impact of goodwill and other intangible assets, as management believes these financial measures provide investors with the ability to further assess the Company’s performance, identify trends in its core business and provide a comparison of its capital adequacy to other companies. The Company included the tangible ratios because management believes that investors may find it useful to have access to the same analytical tools used by management to assess performance and identify trends. These non-GAAP financial measures presented in this presentation should not be considered an alternative or substitute for financial results or measures determined in accordance with GAAP or as an indication of the Company’s cash flows from operating activities, a measure of its liquidity position or an indication of funds available for its cash needs. An item which management considers to be non-core and excludes when computing these non-GAAP measures can be of substantial importance to the Company’s results for any particular period. In addition, management’s methodology for calculating non- GAAP financial measures may differ from the methodologies employed by other banking companies to calculate the same or similar performance measures, and accordingly, the Company’s reported non- GAAP financial measures may not be comparable to the same or similar performance measures reported by other banking companies. Please refer to Appendices A-E for a reconciliations of the Company's GAAP financial measures to the non-GAAP financial measures in this presentation.
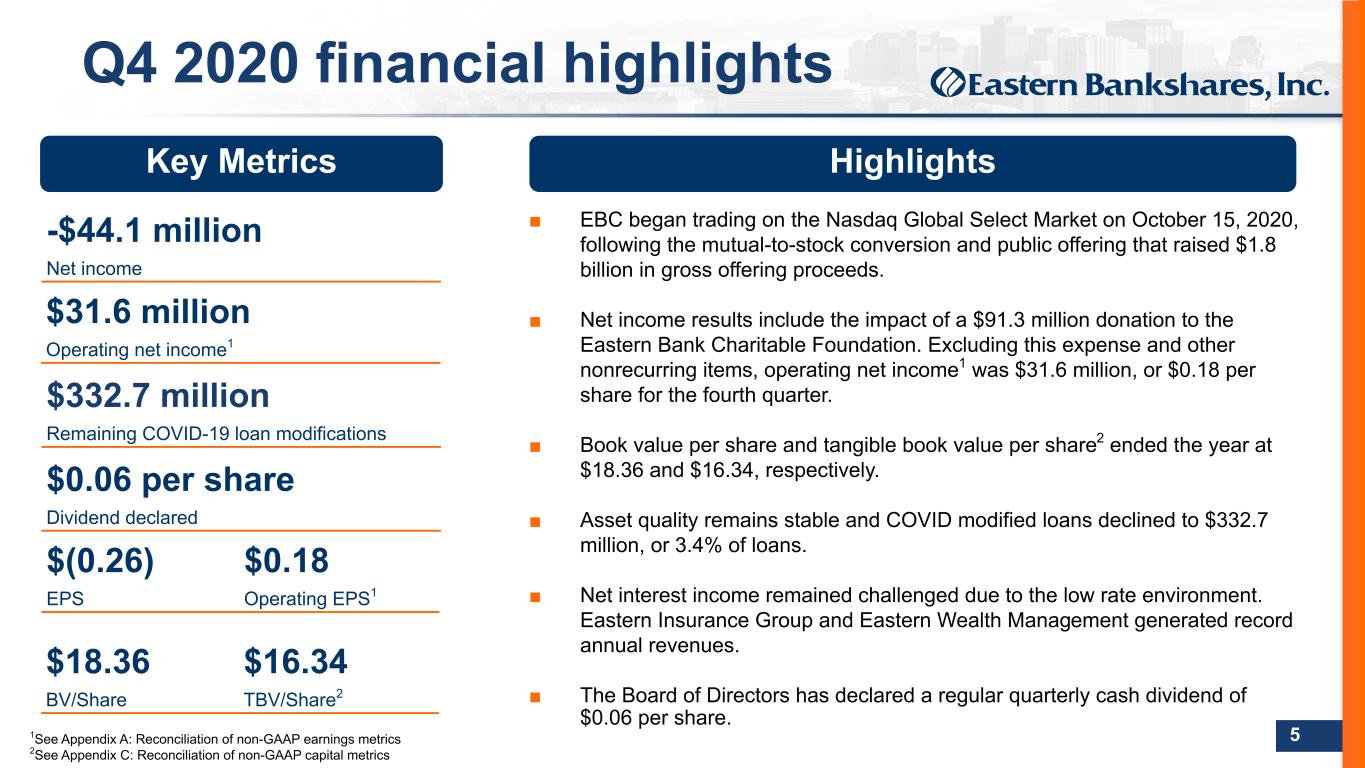

 
DO NOT REFRESH Color PaletteComplementary 000 / 000 / 051 Body text 074 / 075 / 076 030 / 152 / 213 185 / 197 / 212 023 / 061 / 110 119 / 139 / 154 255 / 107 / 000109 / 110 / 112 237 / 237 / 238 000 / 139 / 151 137 / 139 / 141 197 / 064 / 044 166 / 168 / 171 103 / 086 / 164 208 / 210 / 211 238 / 184 / 028 5 Q4 2020 financial highlights ■ EBC began trading on the Nasdaq Global Select Market on October 15, 2020, following the mutual-to-stock conversion and public offering that raised $1.8 billion in gross offering proceeds. ■ Net income results include the impact of a $91.3 million donation to the Eastern Bank Charitable Foundation. Excluding this expense and other nonrecurring items, operating net income1 was $31.6 million, or $0.18 per share for the fourth quarter. ■ Book value per share and tangible book value per share2 ended the year at $18.36 and $16.34, respectively. ■ Asset quality remains stable and COVID modified loans declined to $332.7 million, or 3.4% of loans. ■ Net interest income remained challenged due to the low rate environment. Eastern Insurance Group and Eastern Wealth Management generated record annual revenues. ■ The Board of Directors has declared a regular quarterly cash dividend of $0.06 per share. 1See Appendix A: Reconciliation of non-GAAP earnings metrics 2See Appendix C: Reconciliation of non-GAAP capital metrics Key Metrics Highlights $0.06 per share Dividend declared -$44.1 million Net income $31.6 million Operating net income1 $332.7 million Remaining COVID-19 loan modifications $(0.26) $0.18 EPS Operating EPS1 $18.36 $16.34 BV/Share TBV/Share2
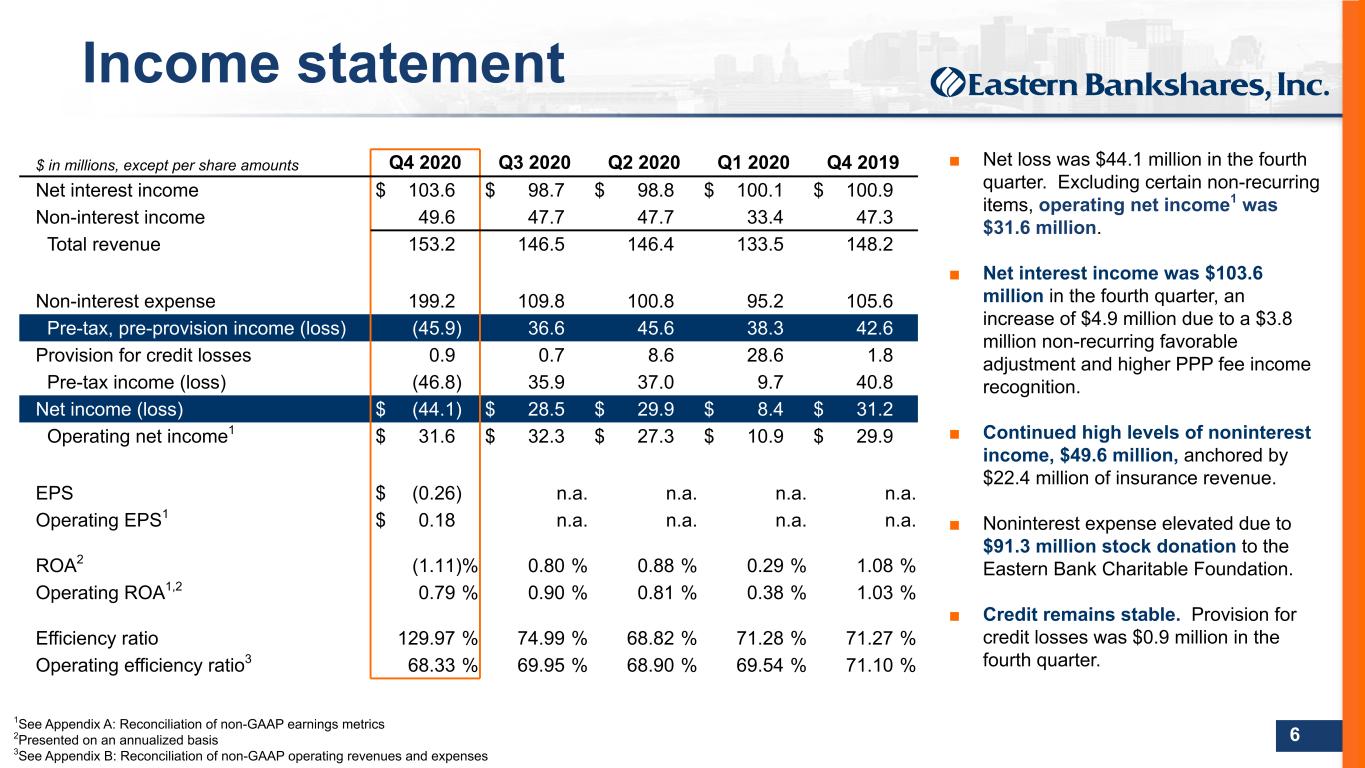

 
DO NOT REFRESH Color PaletteComplementary 000 / 000 / 051 Body text 074 / 075 / 076 030 / 152 / 213 185 / 197 / 212 023 / 061 / 110 119 / 139 / 154 255 / 107 / 000109 / 110 / 112 237 / 237 / 238 000 / 139 / 151 137 / 139 / 141 197 / 064 / 044 166 / 168 / 171 103 / 086 / 164 208 / 210 / 211 238 / 184 / 028 6 ■ Net loss was $44.1 million in the fourth quarter. Excluding certain non-recurring items, operating net income1 was $31.6 million. ■ Net interest income was $103.6 million in the fourth quarter, an increase of $4.9 million due to a $3.8 million non-recurring favorable adjustment and higher PPP fee income recognition. ■ Continued high levels of noninterest income, $49.6 million, anchored by $22.4 million of insurance revenue. ■ Noninterest expense elevated due to $91.3 million stock donation to the Eastern Bank Charitable Foundation. ■ Credit remains stable. Provision for credit losses was $0.9 million in the fourth quarter. $ in millions, except per share amounts Q4 2020 Q3 2020 Q2 2020 Q1 2020 Q4 2019 Net interest income $ 103.6 $ 98.7 $ 98.8 $ 100.1 $ 100.9 Non-interest income 49.6 47.7 47.7 33.4 47.3 Total revenue 153.2 146.5 146.4 133.5 148.2 Non-interest expense 199.2 109.8 100.8 95.2 105.6 Pre-tax, pre-provision income (loss) (45.9) 36.6 45.6 38.3 42.6 Provision for credit losses 0.9 0.7 8.6 28.6 1.8 Pre-tax income (loss) (46.8) 35.9 37.0 9.7 40.8 Net income (loss) $ (44.1) $ 28.5 $ 29.9 $ 8.4 $ 31.2 Operating net income1 $ 31.6 $ 32.3 $ 27.3 $ 10.9 $ 29.9 EPS $ (0.26) n.a. n.a. n.a. n.a. Operating EPS1 $ 0.18 n.a. n.a. n.a. n.a. ROA2 (1.11) % 0.80 % 0.88 % 0.29 % 1.08 % Operating ROA1,2 0.79 % 0.90 % 0.81 % 0.38 % 1.03 % Efficiency ratio 129.97 % 74.99 % 68.82 % 71.28 % 71.27 % Operating efficiency ratio3 68.33 % 69.95 % 68.90 % 69.54 % 71.10 % Income statement 1See Appendix A: Reconciliation of non-GAAP earnings metrics 2Presented on an annualized basis 3See Appendix B: Reconciliation of non-GAAP operating revenues and expenses
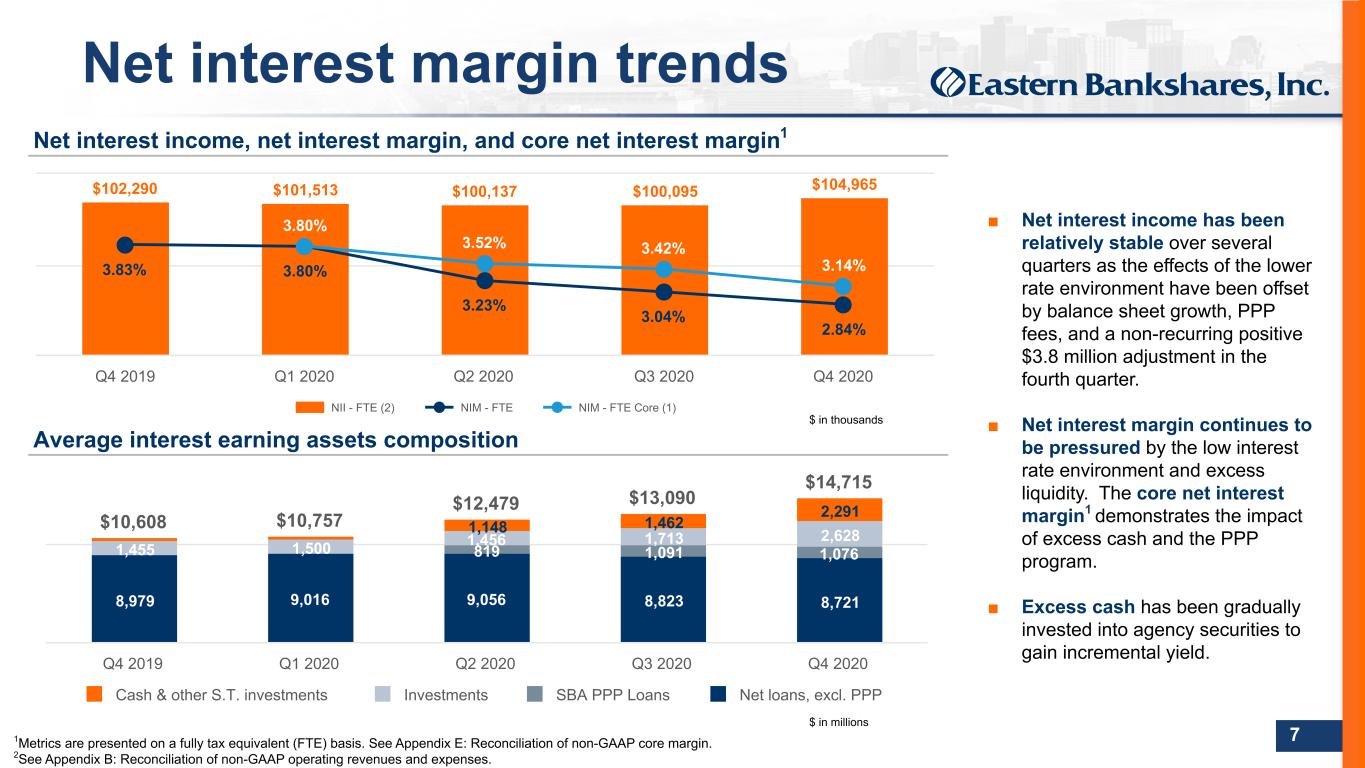

 
DO NOT REFRESH Color PaletteComplementary 000 / 000 / 051 Body text 074 / 075 / 076 030 / 152 / 213 185 / 197 / 212 023 / 061 / 110 119 / 139 / 154 255 / 107 / 000109 / 110 / 112 237 / 237 / 238 000 / 139 / 151 137 / 139 / 141 197 / 064 / 044 166 / 168 / 171 103 / 086 / 164 208 / 210 / 211 238 / 184 / 028 7 Net interest income, net interest margin, and core net interest margin1 Average interest earning assets composition $102,290 $101,513 $100,137 $100,095 $104,965 3.83% 3.80% 3.23% 3.04% 2.84% 3.80% 3.52% 3.42% 3.14% NII - FTE (2) NIM - FTE NIM - FTE Core (1) Q4 2019 Q1 2020 Q2 2020 Q3 2020 Q4 2020 ■ Net interest income has been relatively stable over several quarters as the effects of the lower rate environment have been offset by balance sheet growth, PPP fees, and a non-recurring positive $3.8 million adjustment in the fourth quarter. ■ Net interest margin continues to be pressured by the low interest rate environment and excess liquidity. The core net interest margin1 demonstrates the impact of excess cash and the PPP program. ■ Excess cash has been gradually invested into agency securities to gain incremental yield. Net interest margin trends $10,608 $10,757 $12,479 $13,090 $14,715 8,979 9,016 9,056 8,823 8,721 819 1,091 1,0761,455 1,500 1,456 1,713 2,628 1,148 1,462 2,291 Cash & other S.T. investments Investments SBA PPP Loans Net loans, excl. PPP Q4 2019 Q1 2020 Q2 2020 Q3 2020 Q4 2020 $ in thousands $ in millions 1Metrics are presented on a fully tax equivalent (FTE) basis. See Appendix E: Reconciliation of non-GAAP core margin. 2See Appendix B: Reconciliation of non-GAAP operating revenues and expenses.
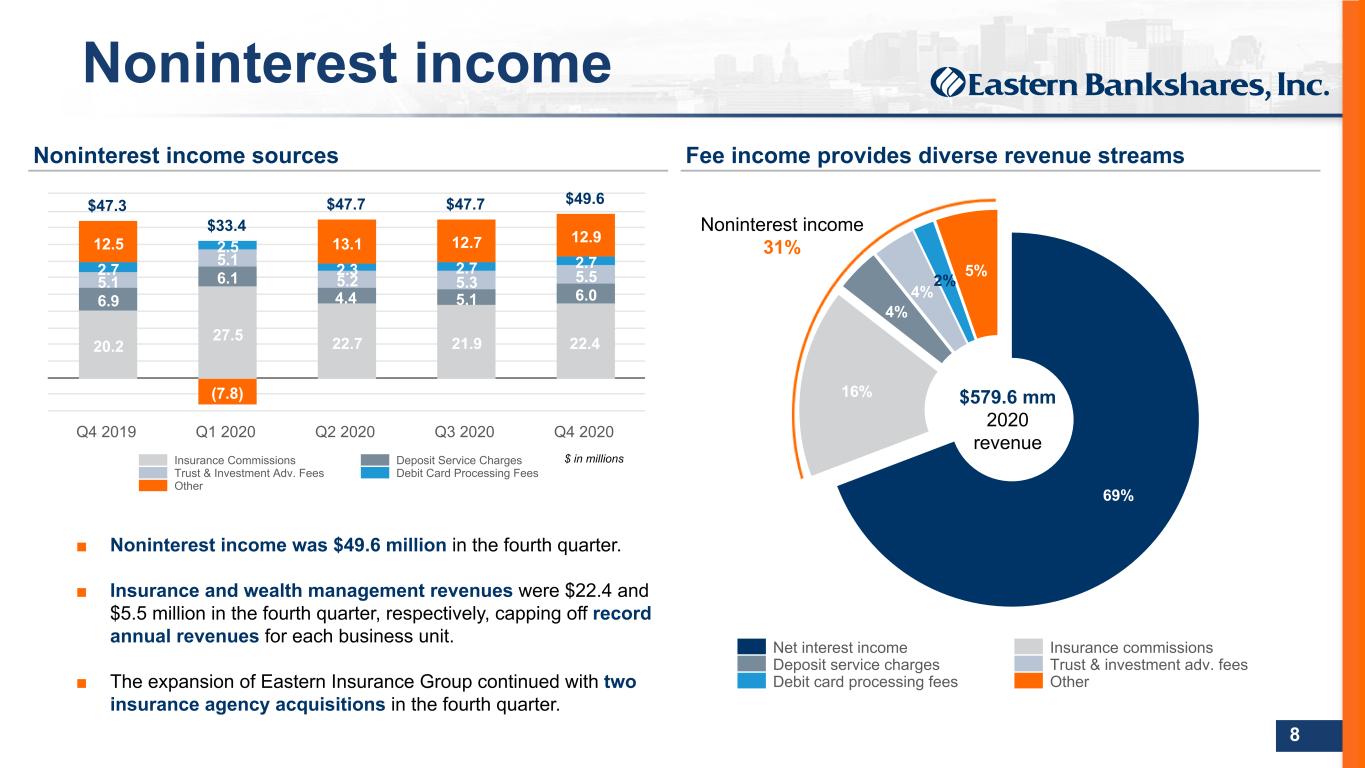

 
DO NOT REFRESH Color PaletteComplementary 000 / 000 / 051 Body text 074 / 075 / 076 030 / 152 / 213 185 / 197 / 212 023 / 061 / 110 119 / 139 / 154 255 / 107 / 000109 / 110 / 112 237 / 237 / 238 000 / 139 / 151 137 / 139 / 141 197 / 064 / 044 166 / 168 / 171 103 / 086 / 164 208 / 210 / 211 238 / 184 / 028 8 Noninterest income ■ Noninterest income was $49.6 million in the fourth quarter. ■ Insurance and wealth management revenues were $22.4 and $5.5 million in the fourth quarter, respectively, capping off record annual revenues for each business unit. ■ The expansion of Eastern Insurance Group continued with two insurance agency acquisitions in the fourth quarter. $47.3 $33.4 $47.7 $47.7 $49.6 20.2 27.5 22.7 21.9 22.4 6.9 6.1 4.4 5.1 6.0 5.1 5.1 5.2 5.3 5.5 2.7 2.5 2.3 2.7 2.7 12.5 (7.8) 13.1 12.7 12.9 Insurance Commissions Deposit Service Charges Trust & Investment Adv. Fees Debit Card Processing Fees Other Q4 2019 Q1 2020 Q2 2020 Q3 2020 Q4 2020 Noninterest income sources Fee income provides diverse revenue streams $ in millions 69% 16% 4% 4% 2% 5% Net interest income Insurance commissions Deposit service charges Trust & investment adv. fees Debit card processing fees Other $579.6 mm 2020 revenue Noninterest income 31%
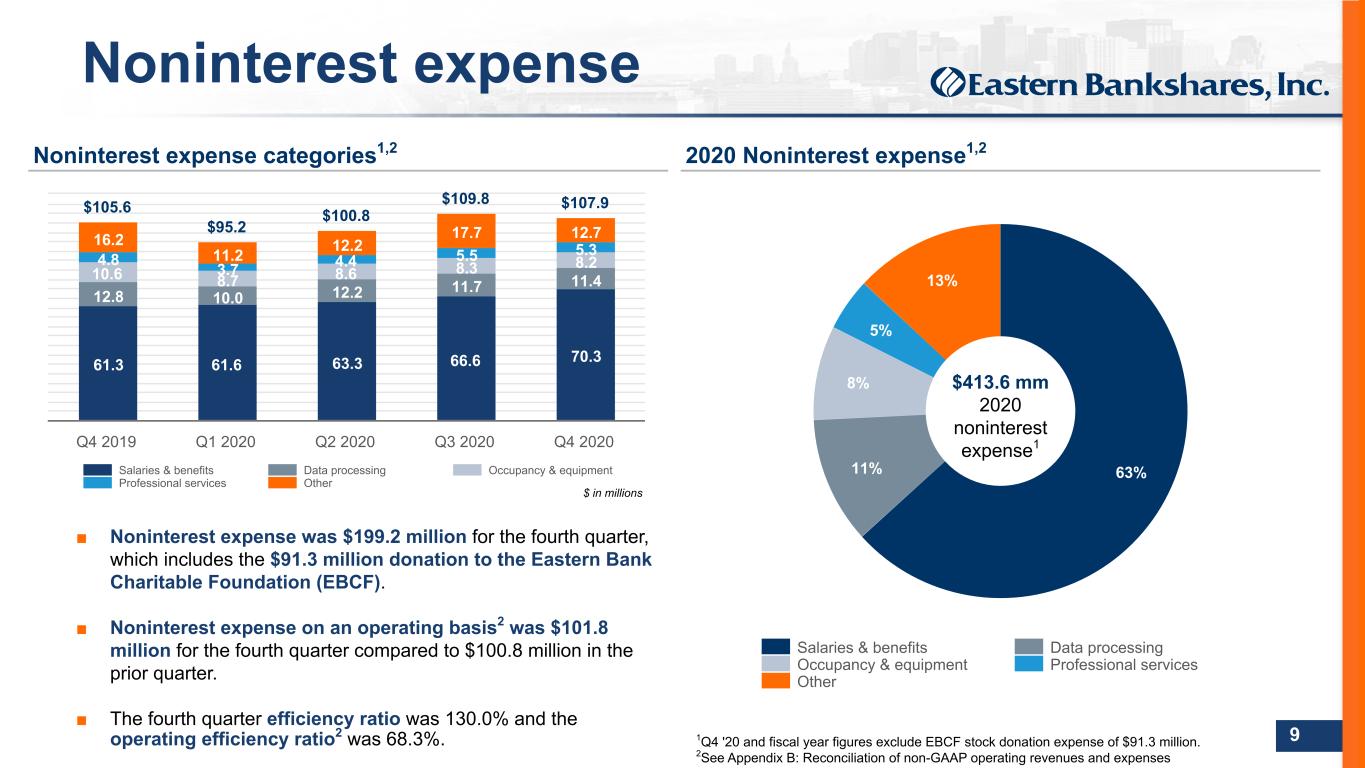

 
DO NOT REFRESH Color PaletteComplementary 000 / 000 / 051 Body text 074 / 075 / 076 030 / 152 / 213 185 / 197 / 212 023 / 061 / 110 119 / 139 / 154 255 / 107 / 000109 / 110 / 112 237 / 237 / 238 000 / 139 / 151 137 / 139 / 141 197 / 064 / 044 166 / 168 / 171 103 / 086 / 164 208 / 210 / 211 238 / 184 / 028 9 Noninterest expense ■ Noninterest expense was $199.2 million for the fourth quarter, which includes the $91.3 million donation to the Eastern Bank Charitable Foundation (EBCF). ■ Noninterest expense on an operating basis2 was $101.8 million for the fourth quarter compared to $100.8 million in the prior quarter. ■ The fourth quarter efficiency ratio was 130.0% and the operating efficiency ratio2 was 68.3%. $105.6 $95.2 $100.8 $109.8 $107.9 61.3 61.6 63.3 66.6 70.3 12.8 10.0 12.2 11.7 11.4 10.6 8.7 8.6 8.3 8.24.8 3.7 4.4 5.5 5.3 16.2 11.2 12.2 17.7 12.7 Salaries & benefits Data processing Occupancy & equipment Professional services Other Q4 2019 Q1 2020 Q2 2020 Q3 2020 Q4 2020 Noninterest expense categories1,2 2020 Noninterest expense1,2 $ in millions 63%11% 8% 5% 13% Salaries & benefits Data processing Occupancy & equipment Professional services Other $413.6 mm 2020 noninterest expense1 1Q4 '20 and fiscal year figures exclude EBCF stock donation expense of $91.3 million. 2See Appendix B: Reconciliation of non-GAAP operating revenues and expenses
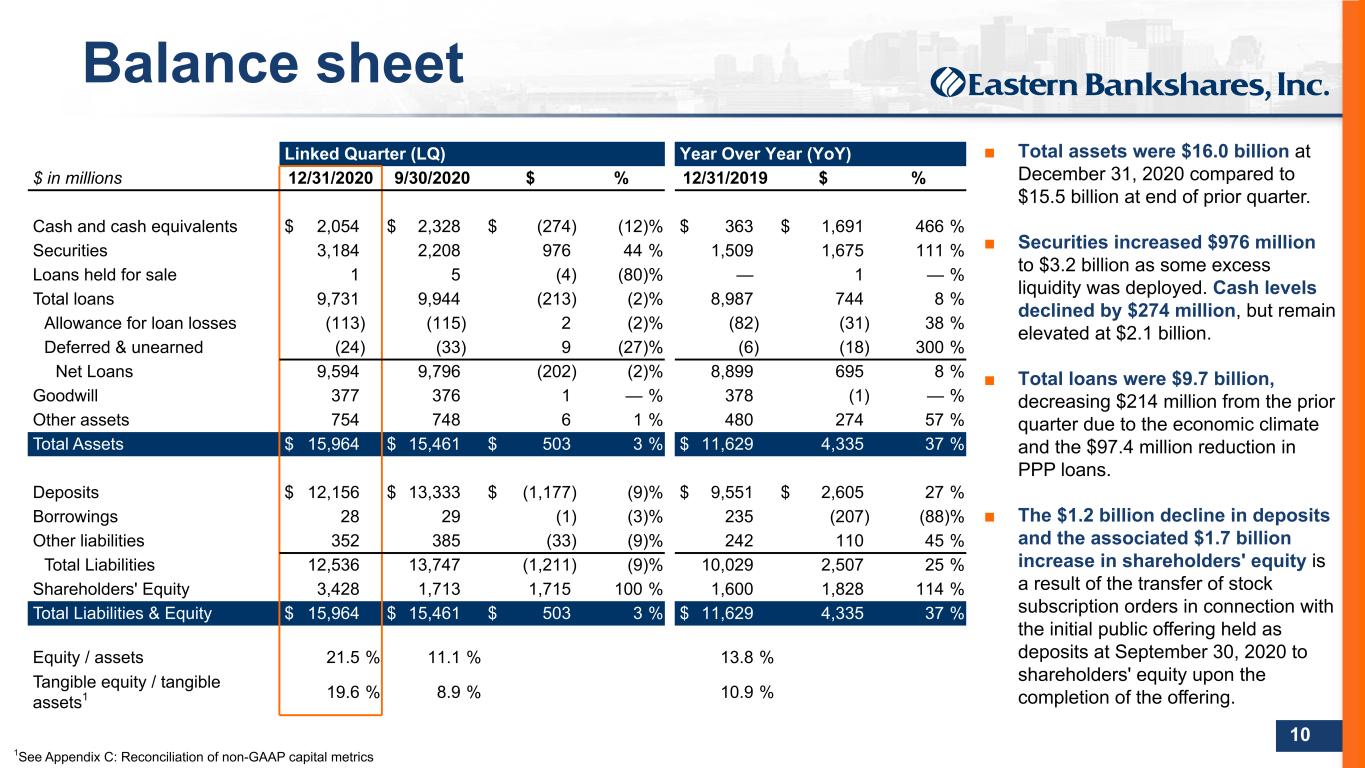

 
DO NOT REFRESH Color PaletteComplementary 000 / 000 / 051 Body text 074 / 075 / 076 030 / 152 / 213 185 / 197 / 212 023 / 061 / 110 119 / 139 / 154 255 / 107 / 000109 / 110 / 112 237 / 237 / 238 000 / 139 / 151 137 / 139 / 141 197 / 064 / 044 166 / 168 / 171 103 / 086 / 164 208 / 210 / 211 238 / 184 / 028 10 Linked Quarter (LQ) Year Over Year (YoY) $ in millions 12/31/2020 9/30/2020 $ % 12/31/2019 $ % Cash and cash equivalents $ 2,054 $ 2,328 $ (274) (12) % $ 363 $ 1,691 466 % Securities 3,184 2,208 976 44 % 1,509 1,675 111 % Loans held for sale 1 5 (4) (80) % — 1 — % Total loans 9,731 9,944 (213) (2) % 8,987 744 8 % Allowance for loan losses (113) (115) 2 (2) % (82) (31) 38 % Deferred & unearned (24) (33) 9 (27) % (6) (18) 300 % Net Loans 9,594 9,796 (202) (2) % 8,899 695 8 % Goodwill 377 376 1 — % 378 (1) — % Other assets 754 748 6 1 % 480 274 57 % Total Assets $ 15,964 $ 15,461 $ 503 3 % $ 11,629 4,335 37 % Deposits $ 12,156 $ 13,333 $ (1,177) (9) % $ 9,551 $ 2,605 27 % Borrowings 28 29 (1) (3) % 235 (207) (88) % Other liabilities 352 385 (33) (9) % 242 110 45 % Total Liabilities 12,536 13,747 (1,211) (9) % 10,029 2,507 25 % Shareholders' Equity 3,428 1,713 1,715 100 % 1,600 1,828 114 % Total Liabilities & Equity $ 15,964 $ 15,461 $ 503 3 % $ 11,629 4,335 37 % Equity / assets 21.5 % 11.1 % 13.8 % Tangible equity / tangible assets1 19.6 % 8.9 % 10.9 % ■ Total assets were $16.0 billion at December 31, 2020 compared to $15.5 billion at end of prior quarter. ■ Securities increased $976 million to $3.2 billion as some excess liquidity was deployed. Cash levels declined by $274 million, but remain elevated at $2.1 billion. ■ Total loans were $9.7 billion, decreasing $214 million from the prior quarter due to the economic climate and the $97.4 million reduction in PPP loans. ■ The $1.2 billion decline in deposits and the associated $1.7 billion increase in shareholders' equity is a result of the transfer of stock subscription orders in connection with the initial public offering held as deposits at September 30, 2020 to shareholders' equity upon the completion of the offering. Balance sheet 1See Appendix C: Reconciliation of non-GAAP capital metrics
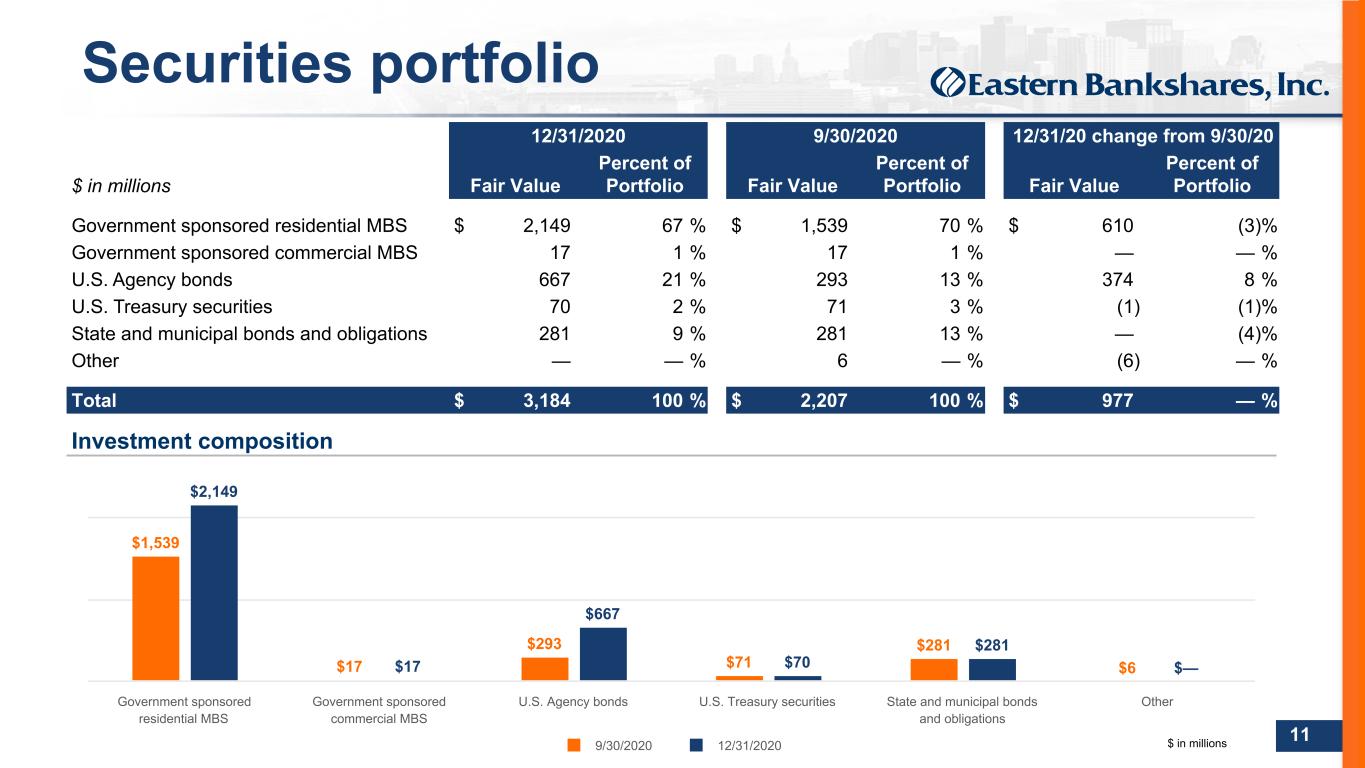

 
DO NOT REFRESH Color PaletteComplementary 000 / 000 / 051 Body text 074 / 075 / 076 030 / 152 / 213 185 / 197 / 212 023 / 061 / 110 119 / 139 / 154 255 / 107 / 000109 / 110 / 112 237 / 237 / 238 000 / 139 / 151 137 / 139 / 141 197 / 064 / 044 166 / 168 / 171 103 / 086 / 164 208 / 210 / 211 238 / 184 / 028 11 Securities portfolio 12/31/2020 9/30/2020 12/31/20 change from 9/30/20 $ in millions Fair Value Percent of Portfolio Fair Value Percent of Portfolio Fair Value Percent of Portfolio Government sponsored residential MBS $ 2,149 67 % $ 1,539 70 % $ 610 (3) % Government sponsored commercial MBS 17 1 % 17 1 % — — % U.S. Agency bonds 667 21 % 293 13 % 374 8 % U.S. Treasury securities 70 2 % 71 3 % (1) (1) % State and municipal bonds and obligations 281 9 % 281 13 % — (4) % Other — — % 6 — % (6) — % Total $ 3,184 100 % $ 2,207 100 % $ 977 — % $1,539 $17 $293 $71 $281 $6 $2,149 $17 $667 $70 $281 $— 9/30/2020 12/31/2020 Government sponsored residential MBS Government sponsored commercial MBS U.S. Agency bonds U.S. Treasury securities State and municipal bonds and obligations Other Investment composition $ in millions
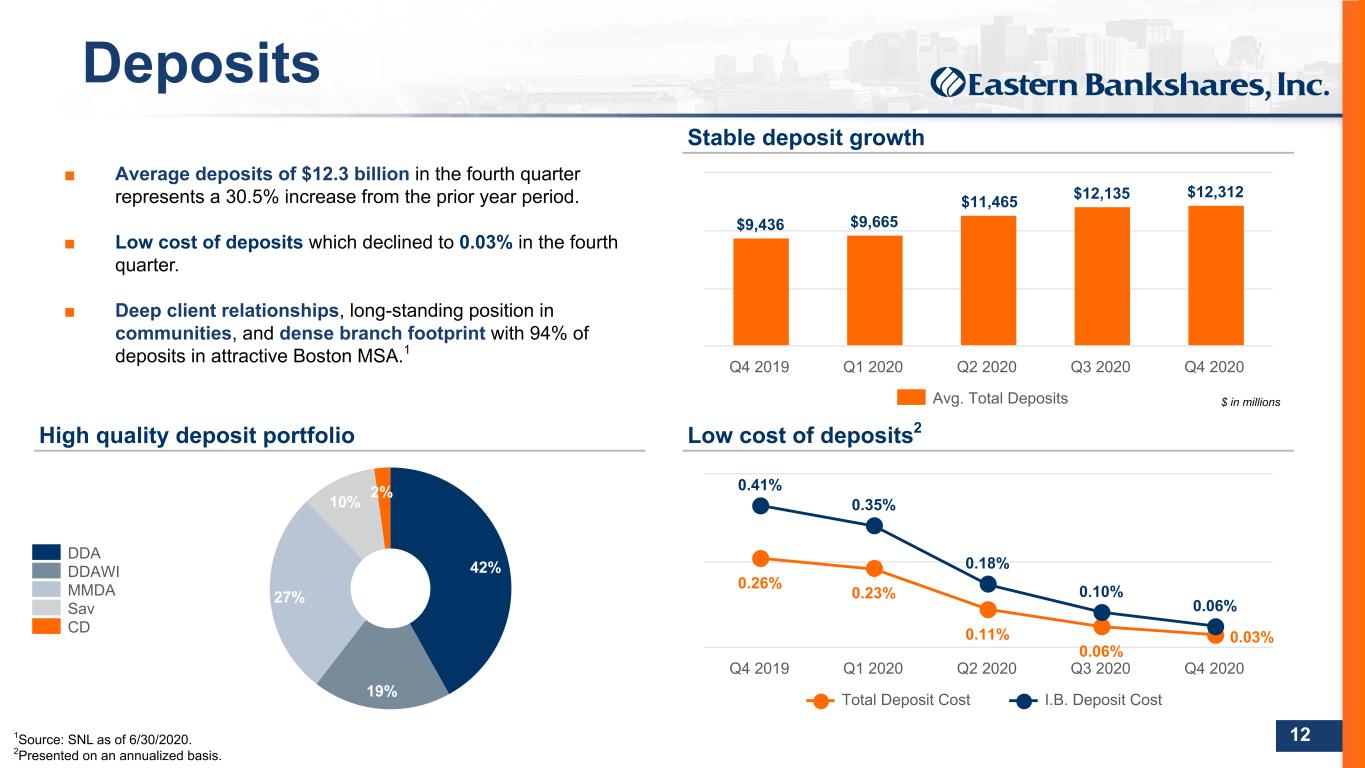

 
DO NOT REFRESH Color PaletteComplementary 000 / 000 / 051 Body text 074 / 075 / 076 030 / 152 / 213 185 / 197 / 212 023 / 061 / 110 119 / 139 / 154 255 / 107 / 000109 / 110 / 112 237 / 237 / 238 000 / 139 / 151 137 / 139 / 141 197 / 064 / 044 166 / 168 / 171 103 / 086 / 164 208 / 210 / 211 238 / 184 / 028 12 ■ Average deposits of $12.3 billion in the fourth quarter represents a 30.5% increase from the prior year period. ■ Low cost of deposits which declined to 0.03% in the fourth quarter. ■ Deep client relationships, long-standing position in communities, and dense branch footprint with 94% of deposits in attractive Boston MSA.1 Stable deposit growth Low cost of deposits2High quality deposit portfolio 42% 19% 27% 10% 2% DDA DDAWI MMDA Sav CD $9,436 $9,665 $11,465 $12,135 $12,312 Avg. Total Deposits Q4 2019 Q1 2020 Q2 2020 Q3 2020 Q4 2020 0.26% 0.23% 0.11% 0.06% 0.03% 0.41% 0.35% 0.18% 0.10% 0.06% Total Deposit Cost I.B. Deposit Cost Q4 2019 Q1 2020 Q2 2020 Q3 2020 Q4 2020 Deposits $ in millions 1Source: SNL as of 6/30/2020. 2Presented on an annualized basis.
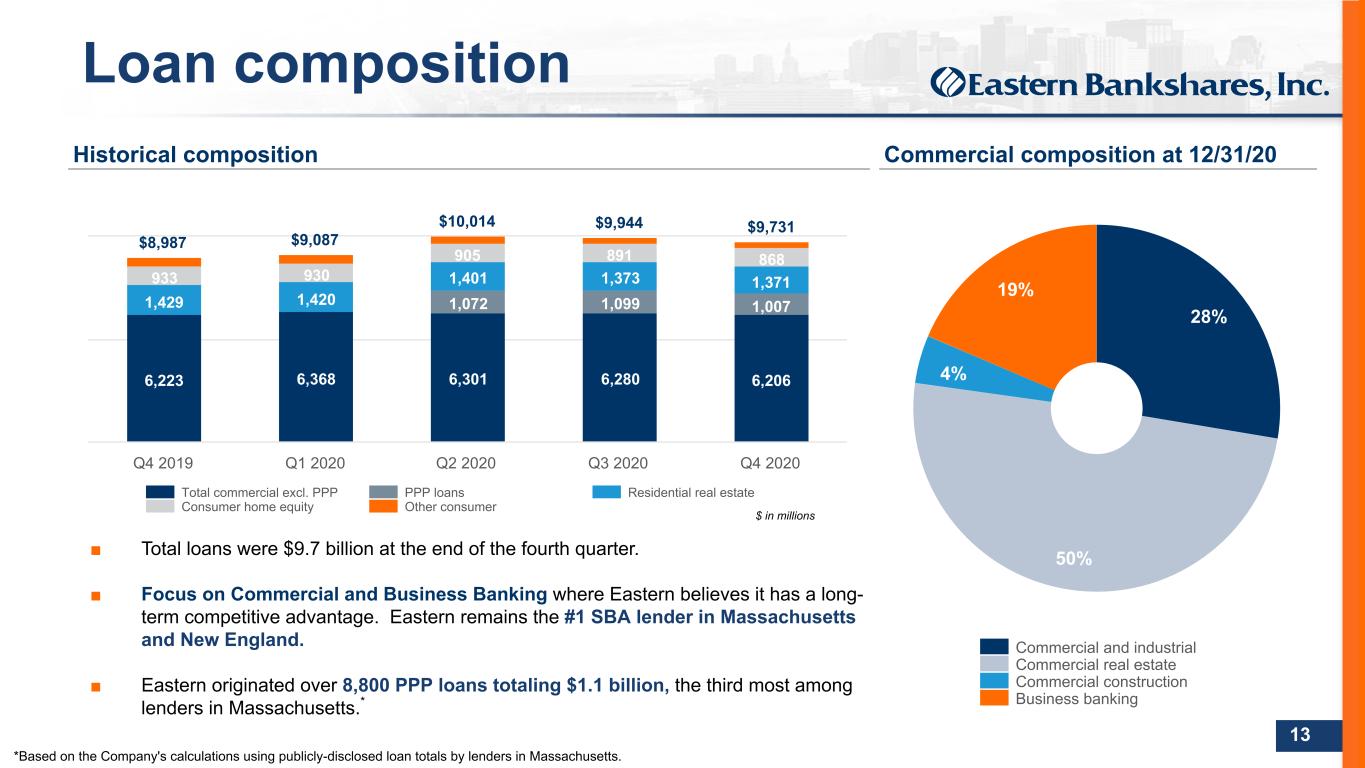

 
DO NOT REFRESH Color PaletteComplementary 000 / 000 / 051 Body text 074 / 075 / 076 030 / 152 / 213 185 / 197 / 212 023 / 061 / 110 119 / 139 / 154 255 / 107 / 000109 / 110 / 112 237 / 237 / 238 000 / 139 / 151 137 / 139 / 141 197 / 064 / 044 166 / 168 / 171 103 / 086 / 164 208 / 210 / 211 238 / 184 / 028 13 28% 50% 4% 19% Commercial and industrial Commercial real estate Commercial construction Business banking ■ Total loans were $9.7 billion at the end of the fourth quarter. ■ Focus on Commercial and Business Banking where Eastern believes it has a long- term competitive advantage. Eastern remains the #1 SBA lender in Massachusetts and New England. ■ Eastern originated over 8,800 PPP loans totaling $1.1 billion, the third most among lenders in Massachusetts.* Loan composition Commercial composition at 12/31/20 $8,987 $9,087 $10,014 $9,944 $9,731 6,223 6,368 6,301 6,280 6,206 1,072 1,099 1,0071,429 1,420 1,401 1,373 1,371933 930 905 891 868 Total commercial excl. PPP PPP loans Residential real estate Consumer home equity Other consumer Q4 2019 Q1 2020 Q2 2020 Q3 2020 Q4 2020 Historical composition $ in millions *Based on the Company's calculations using publicly-disclosed loan totals by lenders in Massachusetts.
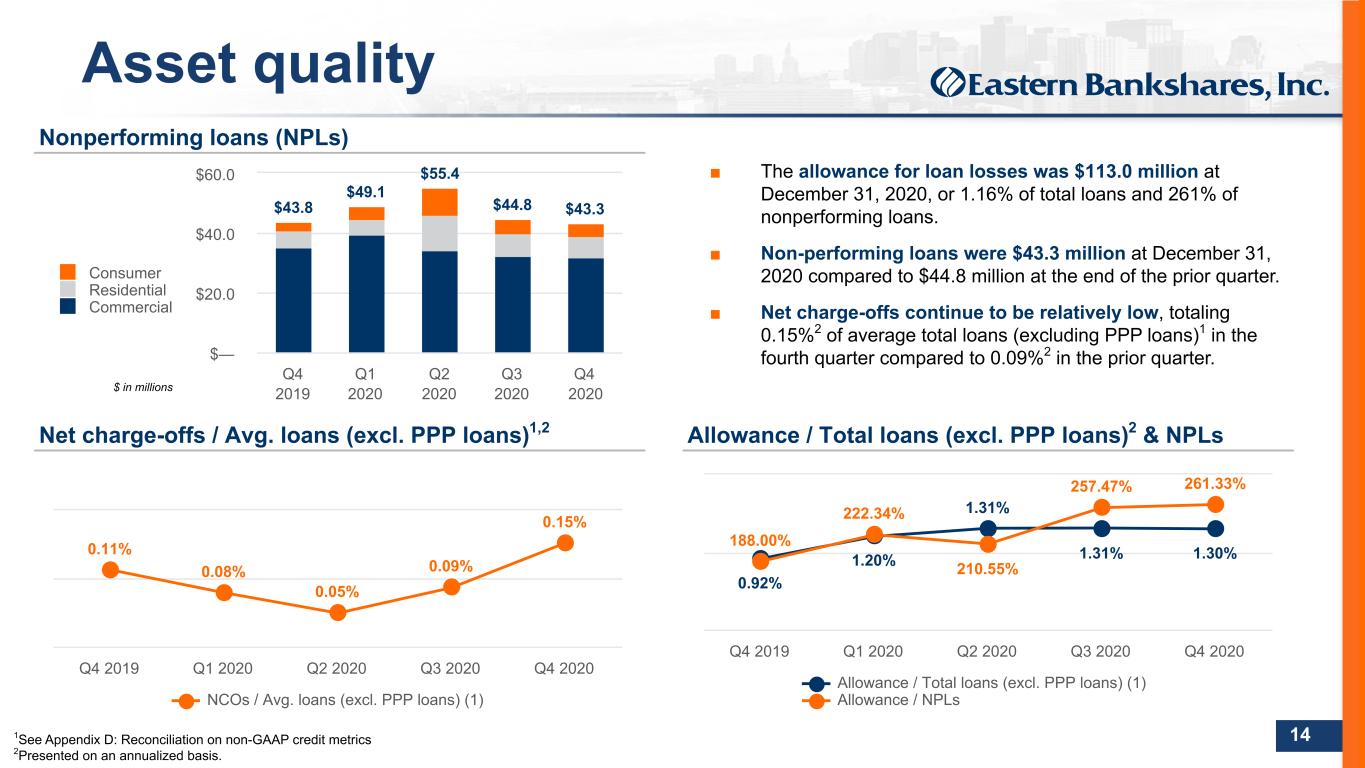

 
DO NOT REFRESH Color PaletteComplementary 000 / 000 / 051 Body text 074 / 075 / 076 030 / 152 / 213 185 / 197 / 212 023 / 061 / 110 119 / 139 / 154 255 / 107 / 000109 / 110 / 112 237 / 237 / 238 000 / 139 / 151 137 / 139 / 141 197 / 064 / 044 166 / 168 / 171 103 / 086 / 164 208 / 210 / 211 238 / 184 / 028 14 Net charge-offs / Avg. loans (excl. PPP loans)1,2 Nonperforming loans (NPLs) Allowance / Total loans (excl. PPP loans)2 & NPLs 0.11% 0.08% 0.05% 0.09% 0.15% NCOs / Avg. loans (excl. PPP loans) (1) Q4 2019 Q1 2020 Q2 2020 Q3 2020 Q4 2020 0.92% 1.20% 1.31% 1.31% 1.30% 188.00% 222.34% 210.55% 257.47% 261.33% Allowance / Total loans (excl. PPP loans) (1) Allowance / NPLs Q4 2019 Q1 2020 Q2 2020 Q3 2020 Q4 2020 $43.8 $49.1 $55.4 $44.8 $43.3 Consumer Residential Commercial Q4 2019 Q1 2020 Q2 2020 Q3 2020 Q4 2020 $— $20.0 $40.0 $60.0 ■ The allowance for loan losses was $113.0 million at December 31, 2020, or 1.16% of total loans and 261% of nonperforming loans. ■ Non-performing loans were $43.3 million at December 31, 2020 compared to $44.8 million at the end of the prior quarter. ■ Net charge-offs continue to be relatively low, totaling 0.15%2 of average total loans (excluding PPP loans)1 in the fourth quarter compared to 0.09%2 in the prior quarter. Asset quality 1See Appendix D: Reconciliation on non-GAAP credit metrics 2Presented on an annualized basis. $ in millions
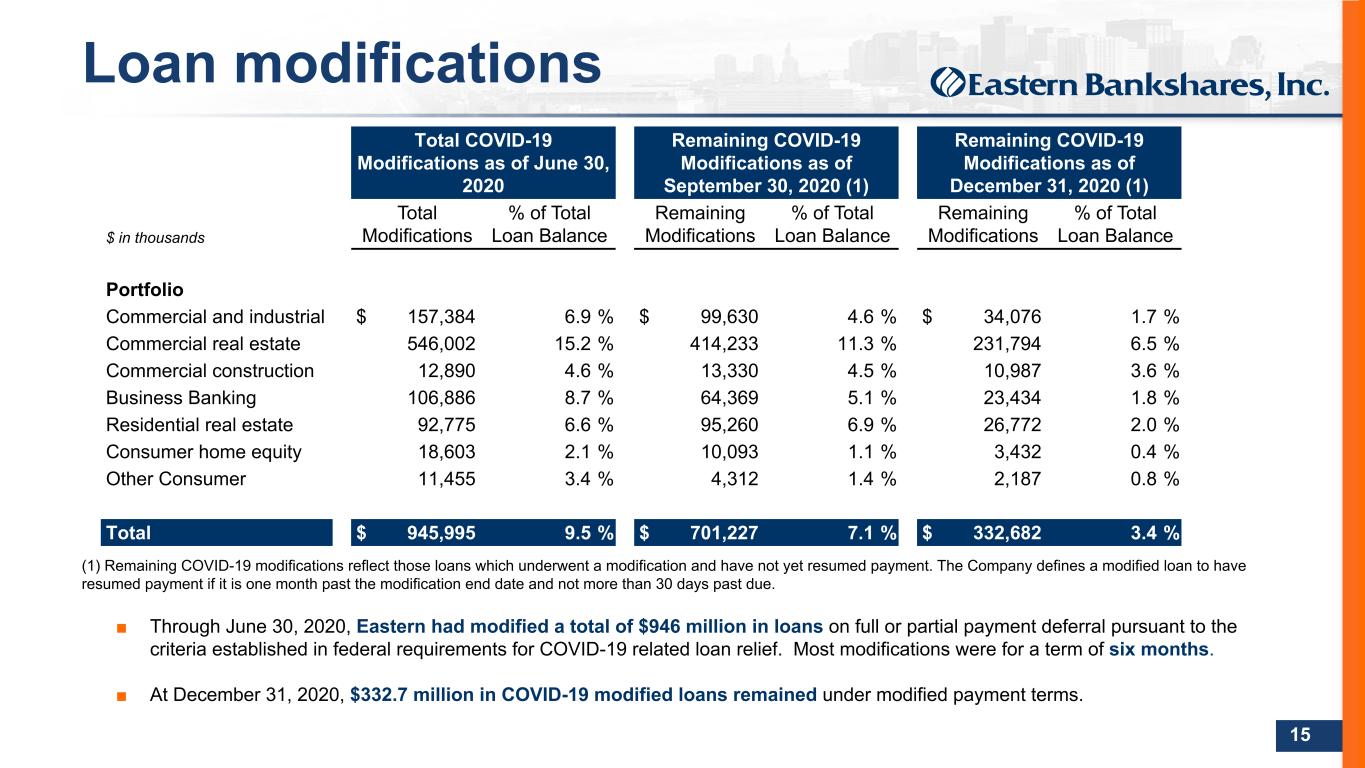

 
DO NOT REFRESH Color PaletteComplementary 000 / 000 / 051 Body text 074 / 075 / 076 030 / 152 / 213 185 / 197 / 212 023 / 061 / 110 119 / 139 / 154 255 / 107 / 000109 / 110 / 112 237 / 237 / 238 000 / 139 / 151 137 / 139 / 141 197 / 064 / 044 166 / 168 / 171 103 / 086 / 164 208 / 210 / 211 238 / 184 / 028 15 Total COVID-19 Modifications as of June 30, 2020 Remaining COVID-19 Modifications as of September 30, 2020 (1) Remaining COVID-19 Modifications as of December 31, 2020 (1) $ in thousands Total Modifications % of Total Loan Balance Remaining Modifications % of Total Loan Balance Remaining Modifications % of Total Loan Balance Portfolio Commercial and industrial $ 157,384 6.9 % $ 99,630 4.6 % $ 34,076 1.7 % Commercial real estate 546,002 15.2 % 414,233 11.3 % 231,794 6.5 % Commercial construction 12,890 4.6 % 13,330 4.5 % 10,987 3.6 % Business Banking 106,886 8.7 % 64,369 5.1 % 23,434 1.8 % Residential real estate 92,775 6.6 % 95,260 6.9 % 26,772 2.0 % Consumer home equity 18,603 2.1 % 10,093 1.1 % 3,432 0.4 % Other Consumer 11,455 3.4 % 4,312 1.4 % 2,187 0.8 % Total $ 945,995 9.5 % $ 701,227 7.1 % $ 332,682 3.4 % (1) Remaining COVID-19 modifications reflect those loans which underwent a modification and have not yet resumed payment. The Company defines a modified loan to have resumed payment if it is one month past the modification end date and not more than 30 days past due. ■ Through June 30, 2020, Eastern had modified a total of $946 million in loans on full or partial payment deferral pursuant to the criteria established in federal requirements for COVID-19 related loan relief. Most modifications were for a term of six months. ■ At December 31, 2020, $332.7 million in COVID-19 modified loans remained under modified payment terms. Loan modifications
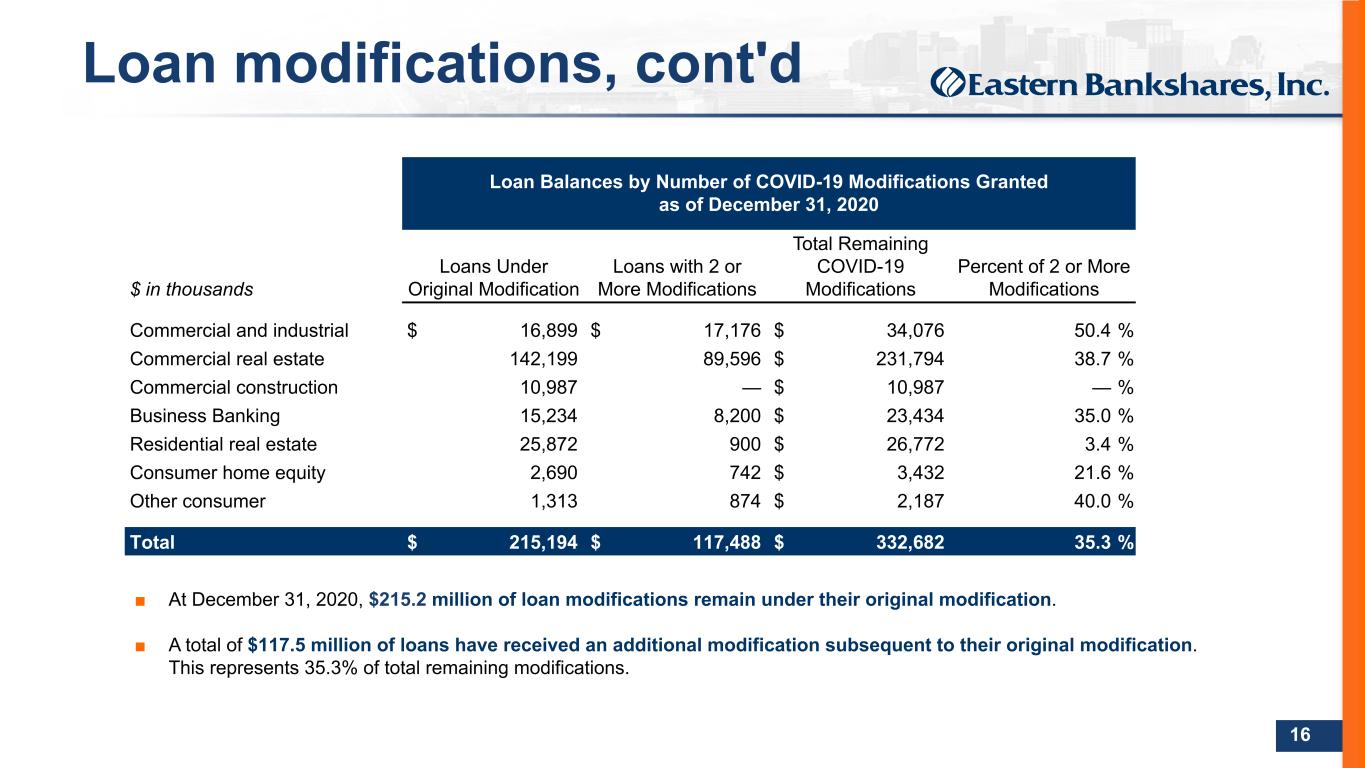

 
DO NOT REFRESH Color PaletteComplementary 000 / 000 / 051 Body text 074 / 075 / 076 030 / 152 / 213 185 / 197 / 212 023 / 061 / 110 119 / 139 / 154 255 / 107 / 000109 / 110 / 112 237 / 237 / 238 000 / 139 / 151 137 / 139 / 141 197 / 064 / 044 166 / 168 / 171 103 / 086 / 164 208 / 210 / 211 238 / 184 / 028 16 Loan modifications, cont'd Loan Balances by Number of COVID-19 Modifications Granted as of December 31, 2020 $ in thousands Loans Under Original Modification Loans with 2 or More Modifications Total Remaining COVID-19 Modifications Percent of 2 or More Modifications Commercial and industrial $ 16,899 $ 17,176 $ 34,076 50.4 % Commercial real estate 142,199 89,596 $ 231,794 38.7 % Commercial construction 10,987 — $ 10,987 — % Business Banking 15,234 8,200 $ 23,434 35.0 % Residential real estate 25,872 900 $ 26,772 3.4 % Consumer home equity 2,690 742 $ 3,432 21.6 % Other consumer 1,313 874 $ 2,187 40.0 % Total $ 215,194 $ 117,488 $ 332,682 35.3 % ■ At December 31, 2020, $215.2 million of loan modifications remain under their original modification. ■ A total of $117.5 million of loans have received an additional modification subsequent to their original modification. This represents 35.3% of total remaining modifications.
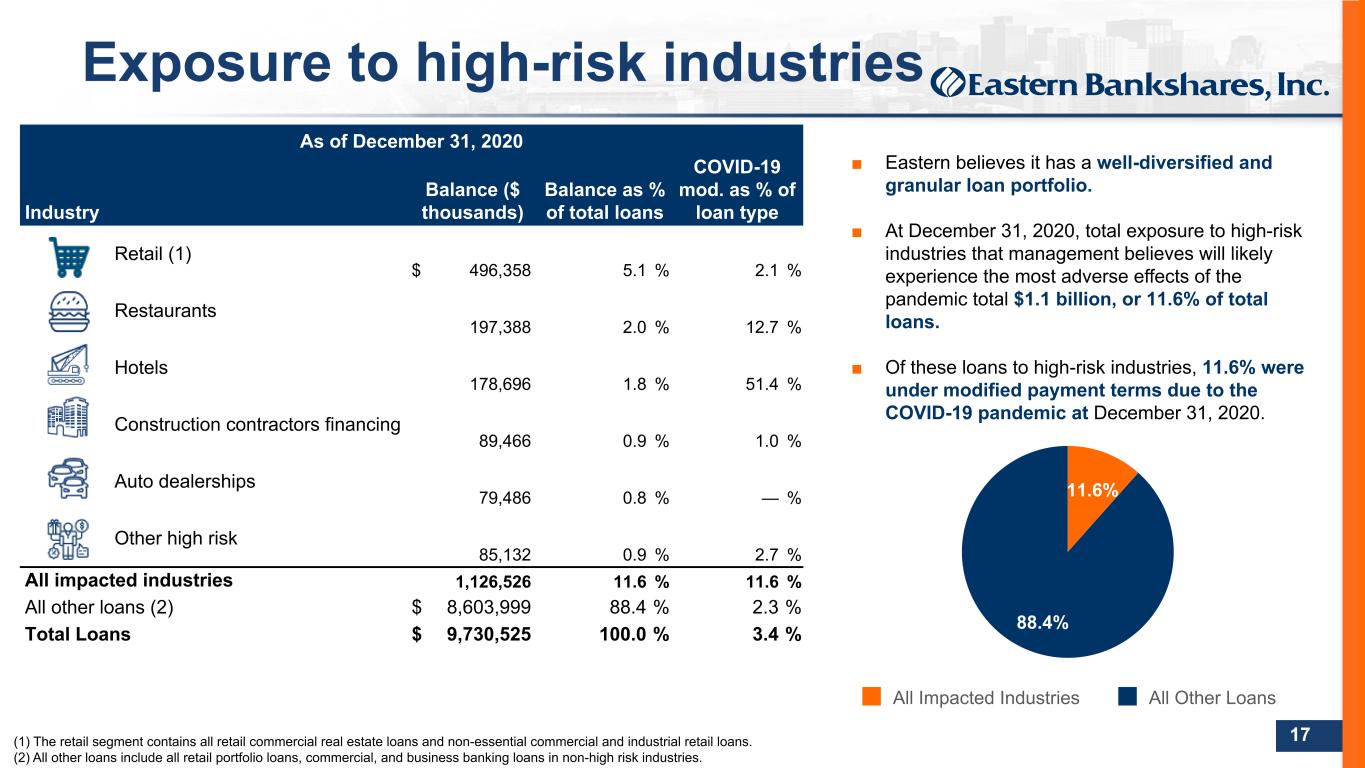

 
DO NOT REFRESH Color PaletteComplementary 000 / 000 / 051 Body text 074 / 075 / 076 030 / 152 / 213 185 / 197 / 212 023 / 061 / 110 119 / 139 / 154 255 / 107 / 000109 / 110 / 112 237 / 237 / 238 000 / 139 / 151 137 / 139 / 141 197 / 064 / 044 166 / 168 / 171 103 / 086 / 164 208 / 210 / 211 238 / 184 / 028 17 As of December 31, 2020 Balance ($ thousands) Balance as % of total loans COVID-19 mod. as % of loan typeIndustry Retail (1) $ 496,358 5.1 % 2.1 % Restaurants 197,388 2.0 % 12.7 % Hotels 178,696 1.8 % 51.4 % Construction contractors financing 89,466 0.9 % 1.0 % Auto dealerships 79,486 0.8 % — % Other high risk 85,132 0.9 % 2.7 % All impacted industries 1,126,526 11.6 % 11.6 % All other loans (2) $ 8,603,999 88.4 % 2.3 % Total Loans $ 9,730,525 100.0 % 3.4 % Exposure to high-risk industries ■ Eastern believes it has a well-diversified and granular loan portfolio. ■ At December 31, 2020, total exposure to high-risk industries that management believes will likely experience the most adverse effects of the pandemic total $1.1 billion, or 11.6% of total loans. ■ Of these loans to high-risk industries, 11.6% were under modified payment terms due to the COVID-19 pandemic at December 31, 2020. 11.6% 88.4% All Impacted Industries All Other Loans (1) The retail segment contains all retail commercial real estate loans and non-essential commercial and industrial retail loans. (2) All other loans include all retail portfolio loans, commercial, and business banking loans in non-high risk industries.
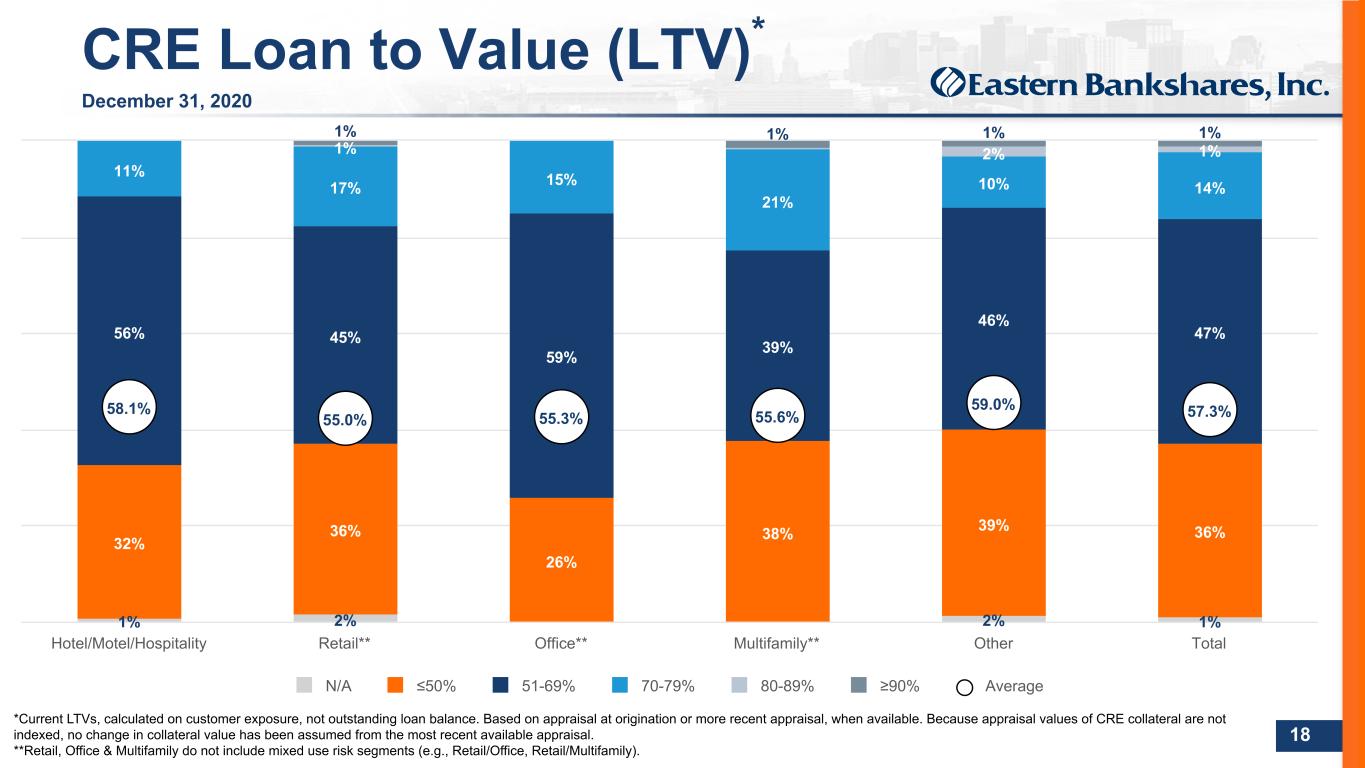

 
DO NOT REFRESH Color PaletteComplementary 000 / 000 / 051 Body text 074 / 075 / 076 030 / 152 / 213 185 / 197 / 212 023 / 061 / 110 119 / 139 / 154 255 / 107 / 000109 / 110 / 112 237 / 237 / 238 000 / 139 / 151 137 / 139 / 141 197 / 064 / 044 166 / 168 / 171 103 / 086 / 164 208 / 210 / 211 238 / 184 / 028 18 1% 2% 2% 1% 32% 36% 26% 38% 39% 36% 56% 45% 59% 39% 46% 47% 11% 17% 15% 21% 10% 14% 1% 2% 1% 1% 1% 1% 1% 58.1% 55.0% 55.3% 55.6% 59.0% 57.3% N/A ≤50% 51-69% 70-79% 80-89% ≥90% Average Hotel/Motel/Hospitality Retail** Office** Multifamily** Other Total CRE Loan to Value (LTV)* December 31, 2020 *Current LTVs, calculated on customer exposure, not outstanding loan balance. Based on appraisal at origination or more recent appraisal, when available. Because appraisal values of CRE collateral are not indexed, no change in collateral value has been assumed from the most recent available appraisal. **Retail, Office & Multifamily do not include mixed use risk segments (e.g., Retail/Office, Retail/Multifamily).


 
DO NOT REFRESH Color PaletteComplementary 000 / 000 / 051 Body text 074 / 075 / 076 030 / 152 / 213 185 / 197 / 212 023 / 061 / 110 119 / 139 / 154 255 / 107 / 000109 / 110 / 112 237 / 237 / 238 000 / 139 / 151 137 / 139 / 141 197 / 064 / 044 166 / 168 / 171 103 / 086 / 164 208 / 210 / 211 238 / 184 / 028 Appendix
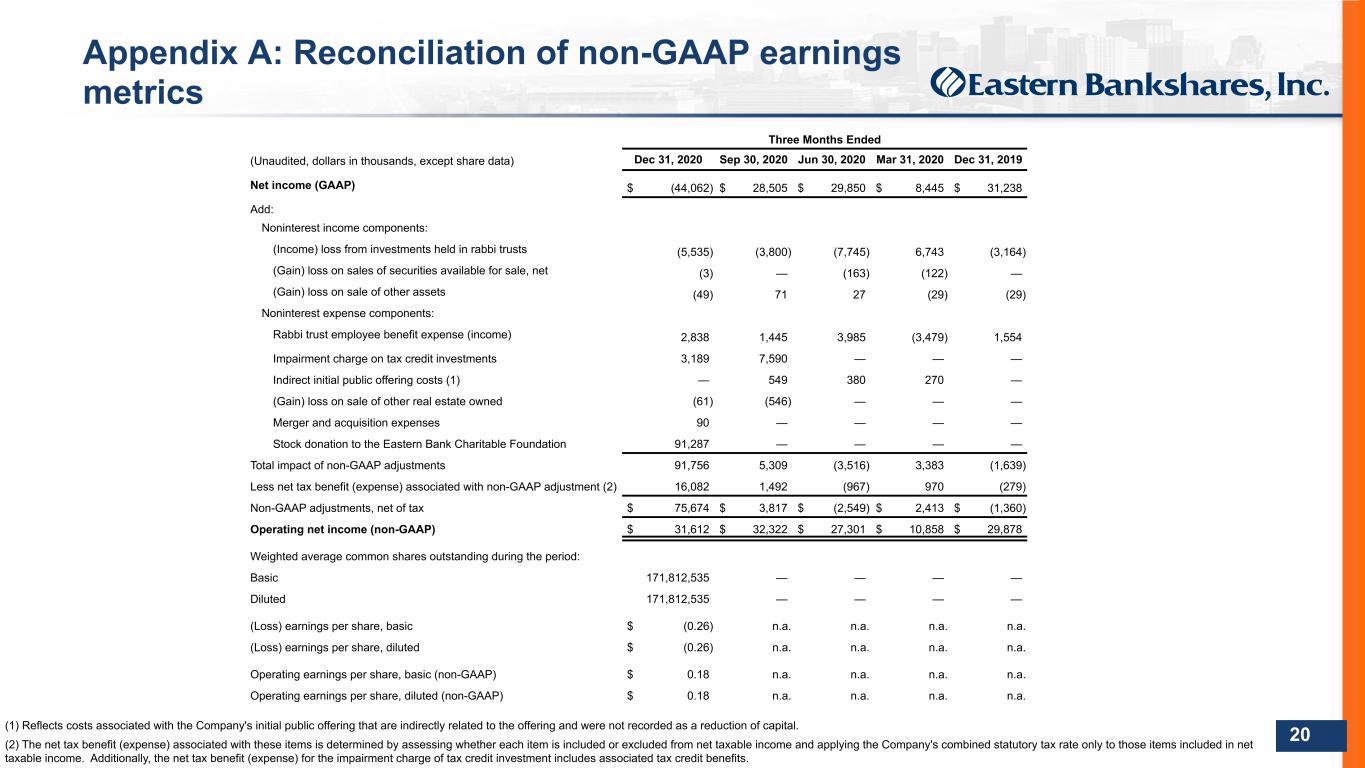

 
DO NOT REFRESH Color PaletteComplementary 000 / 000 / 051 Body text 074 / 075 / 076 030 / 152 / 213 185 / 197 / 212 023 / 061 / 110 119 / 139 / 154 255 / 107 / 000109 / 110 / 112 237 / 237 / 238 000 / 139 / 151 137 / 139 / 141 197 / 064 / 044 166 / 168 / 171 103 / 086 / 164 208 / 210 / 211 238 / 184 / 028 20 Appendix A: Reconciliation of non-GAAP earnings metrics (1) Reflects costs associated with the Company's initial public offering that are indirectly related to the offering and were not recorded as a reduction of capital. (2) The net tax benefit (expense) associated with these items is determined by assessing whether each item is included or excluded from net taxable income and applying the Company's combined statutory tax rate only to those items included in net taxable income. Additionally, the net tax benefit (expense) for the impairment charge of tax credit investment includes associated tax credit benefits. Three Months Ended (Unaudited, dollars in thousands, except share data) Dec 31, 2020 Sep 30, 2020 Jun 30, 2020 Mar 31, 2020 Dec 31, 2019 Net income (GAAP) $ (44,062) $ 28,505 $ 29,850 $ 8,445 $ 31,238 Add: Noninterest income components: (Income) loss from investments held in rabbi trusts (5,535) (3,800) (7,745) 6,743 (3,164) (Gain) loss on sales of securities available for sale, net (3) — (163) (122) — (Gain) loss on sale of other assets (49) 71 27 (29) (29) Noninterest expense components: Rabbi trust employee benefit expense (income) 2,838 1,445 3,985 (3,479) 1,554 Impairment charge on tax credit investments 3,189 7,590 — — — Indirect initial public offering costs (1) — 549 380 270 — (Gain) loss on sale of other real estate owned (61) (546) — — — Merger and acquisition expenses 90 — — — — Stock donation to the Eastern Bank Charitable Foundation 91,287 — — — — Total impact of non-GAAP adjustments 91,756 5,309 (3,516) 3,383 (1,639) Less net tax benefit (expense) associated with non-GAAP adjustment (2) 16,082 1,492 (967) 970 (279) Non-GAAP adjustments, net of tax $ 75,674 $ 3,817 $ (2,549) $ 2,413 $ (1,360) Operating net income (non-GAAP) $ 31,612 $ 32,322 $ 27,301 $ 10,858 $ 29,878 Weighted average common shares outstanding during the period: Basic 171,812,535 — — — — Diluted 171,812,535 — — — — (Loss) earnings per share, basic $ (0.26) n.a. n.a. n.a. n.a. (Loss) earnings per share, diluted $ (0.26) n.a. n.a. n.a. n.a. Operating earnings per share, basic (non-GAAP) $ 0.18 n.a. n.a. n.a. n.a. Operating earnings per share, diluted (non-GAAP) $ 0.18 n.a. n.a. n.a. n.a.
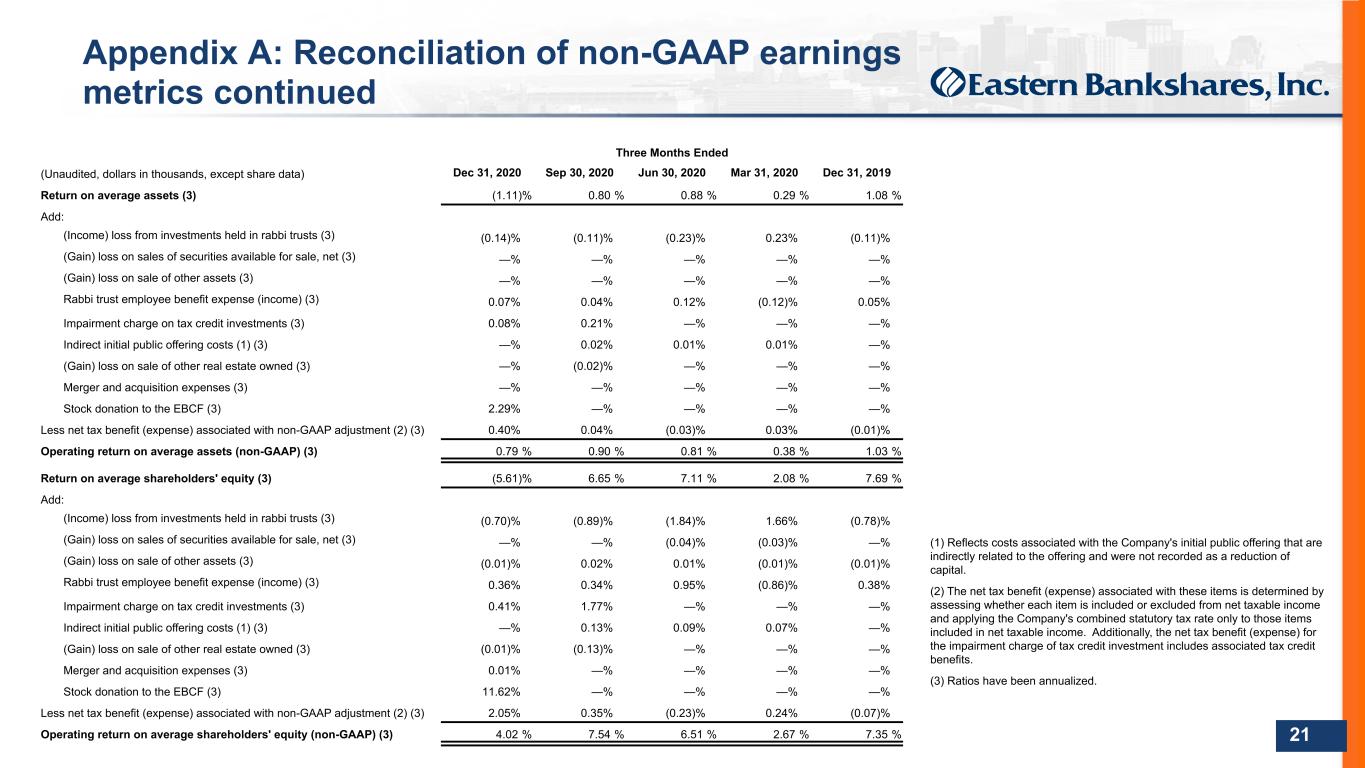

 
DO NOT REFRESH Color PaletteComplementary 000 / 000 / 051 Body text 074 / 075 / 076 030 / 152 / 213 185 / 197 / 212 023 / 061 / 110 119 / 139 / 154 255 / 107 / 000109 / 110 / 112 237 / 237 / 238 000 / 139 / 151 137 / 139 / 141 197 / 064 / 044 166 / 168 / 171 103 / 086 / 164 208 / 210 / 211 238 / 184 / 028 21 Appendix A: Reconciliation of non-GAAP earnings metrics continued Three Months Ended (Unaudited, dollars in thousands, except share data) Dec 31, 2020 Sep 30, 2020 Jun 30, 2020 Mar 31, 2020 Dec 31, 2019 Return on average assets (3) (1.11) % 0.80 % 0.88 % 0.29 % 1.08 % Add: (Income) loss from investments held in rabbi trusts (3) (0.14) % (0.11) % (0.23) % 0.23 % (0.11) % (Gain) loss on sales of securities available for sale, net (3) — % — % — % — % — % (Gain) loss on sale of other assets (3) — % — % — % — % — % Rabbi trust employee benefit expense (income) (3) 0.07 % 0.04 % 0.12 % (0.12) % 0.05 % Impairment charge on tax credit investments (3) 0.08 % 0.21 % — % — % — % Indirect initial public offering costs (1) (3) — % 0.02 % 0.01 % 0.01 % — % (Gain) loss on sale of other real estate owned (3) — % (0.02) % — % — % — % Merger and acquisition expenses (3) — % — % — % — % — % Stock donation to the EBCF (3) 2.29 % — % — % — % — % Less net tax benefit (expense) associated with non-GAAP adjustment (2) (3) 0.40 % 0.04 % (0.03) % 0.03 % (0.01) % Operating return on average assets (non-GAAP) (3) 0.79 % 0.90 % 0.81 % 0.38 % 1.03 % Return on average shareholders' equity (3) (5.61) % 6.65 % 7.11 % 2.08 % 7.69 % Add: (Income) loss from investments held in rabbi trusts (3) (0.70) % (0.89) % (1.84) % 1.66 % (0.78) % (Gain) loss on sales of securities available for sale, net (3) — % — % (0.04) % (0.03) % — % (Gain) loss on sale of other assets (3) (0.01) % 0.02 % 0.01 % (0.01) % (0.01) % Rabbi trust employee benefit expense (income) (3) 0.36 % 0.34 % 0.95 % (0.86) % 0.38 % Impairment charge on tax credit investments (3) 0.41 % 1.77 % — % — % — % Indirect initial public offering costs (1) (3) — % 0.13 % 0.09 % 0.07 % — % (Gain) loss on sale of other real estate owned (3) (0.01) % (0.13) % — % — % — % Merger and acquisition expenses (3) 0.01 % — % — % — % — % Stock donation to the EBCF (3) 11.62 % — % — % — % — % Less net tax benefit (expense) associated with non-GAAP adjustment (2) (3) 2.05 % 0.35 % (0.23) % 0.24 % (0.07) % Operating return on average shareholders' equity (non-GAAP) (3) 4.02 % 7.54 % 6.51 % 2.67 % 7.35 % (1) Reflects costs associated with the Company's initial public offering that are indirectly related to the offering and were not recorded as a reduction of capital. (2) The net tax benefit (expense) associated with these items is determined by assessing whether each item is included or excluded from net taxable income and applying the Company's combined statutory tax rate only to those items included in net taxable income. Additionally, the net tax benefit (expense) for the impairment charge of tax credit investment includes associated tax credit benefits. (3) Ratios have been annualized.
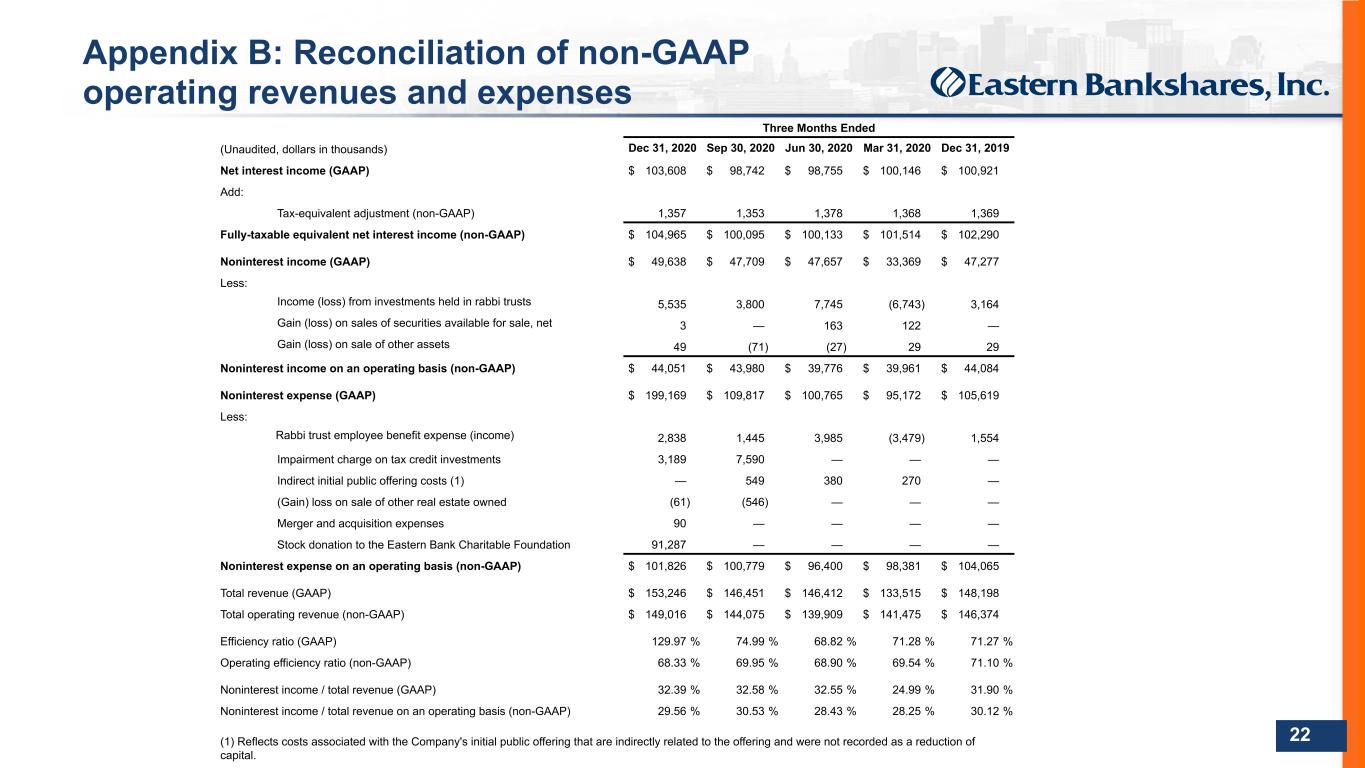

 
DO NOT REFRESH Color PaletteComplementary 000 / 000 / 051 Body text 074 / 075 / 076 030 / 152 / 213 185 / 197 / 212 023 / 061 / 110 119 / 139 / 154 255 / 107 / 000109 / 110 / 112 237 / 237 / 238 000 / 139 / 151 137 / 139 / 141 197 / 064 / 044 166 / 168 / 171 103 / 086 / 164 208 / 210 / 211 238 / 184 / 028 22 Appendix B: Reconciliation of non-GAAP operating revenues and expenses Three Months Ended (Unaudited, dollars in thousands) Dec 31, 2020 Sep 30, 2020 Jun 30, 2020 Mar 31, 2020 Dec 31, 2019 Net interest income (GAAP) $ 103,608 $ 98,742 $ 98,755 $ 100,146 $ 100,921 Add: Tax-equivalent adjustment (non-GAAP) 1,357 1,353 1,378 1,368 1,369 Fully-taxable equivalent net interest income (non-GAAP) $ 104,965 $ 100,095 $ 100,133 $ 101,514 $ 102,290 Noninterest income (GAAP) $ 49,638 $ 47,709 $ 47,657 $ 33,369 $ 47,277 Less: Income (loss) from investments held in rabbi trusts 5,535 3,800 7,745 (6,743) 3,164 Gain (loss) on sales of securities available for sale, net 3 — 163 122 — Gain (loss) on sale of other assets 49 (71) (27) 29 29 Noninterest income on an operating basis (non-GAAP) $ 44,051 $ 43,980 $ 39,776 $ 39,961 $ 44,084 Noninterest expense (GAAP) $ 199,169 $ 109,817 $ 100,765 $ 95,172 $ 105,619 Less: Rabbi trust employee benefit expense (income) 2,838 1,445 3,985 (3,479) 1,554 Impairment charge on tax credit investments 3,189 7,590 — — — Indirect initial public offering costs (1) — 549 380 270 — (Gain) loss on sale of other real estate owned (61) (546) — — — Merger and acquisition expenses 90 — — — — Stock donation to the Eastern Bank Charitable Foundation 91,287 — — — — Noninterest expense on an operating basis (non-GAAP) $ 101,826 $ 100,779 $ 96,400 $ 98,381 $ 104,065 Total revenue (GAAP) $ 153,246 $ 146,451 $ 146,412 $ 133,515 $ 148,198 Total operating revenue (non-GAAP) $ 149,016 $ 144,075 $ 139,909 $ 141,475 $ 146,374 Efficiency ratio (GAAP) 129.97 % 74.99 % 68.82 % 71.28 % 71.27 % Operating efficiency ratio (non-GAAP) 68.33 % 69.95 % 68.90 % 69.54 % 71.10 % Noninterest income / total revenue (GAAP) 32.39 % 32.58 % 32.55 % 24.99 % 31.90 % Noninterest income / total revenue on an operating basis (non-GAAP) 29.56 % 30.53 % 28.43 % 28.25 % 30.12 % (1) Reflects costs associated with the Company's initial public offering that are indirectly related to the offering and were not recorded as a reduction of capital.
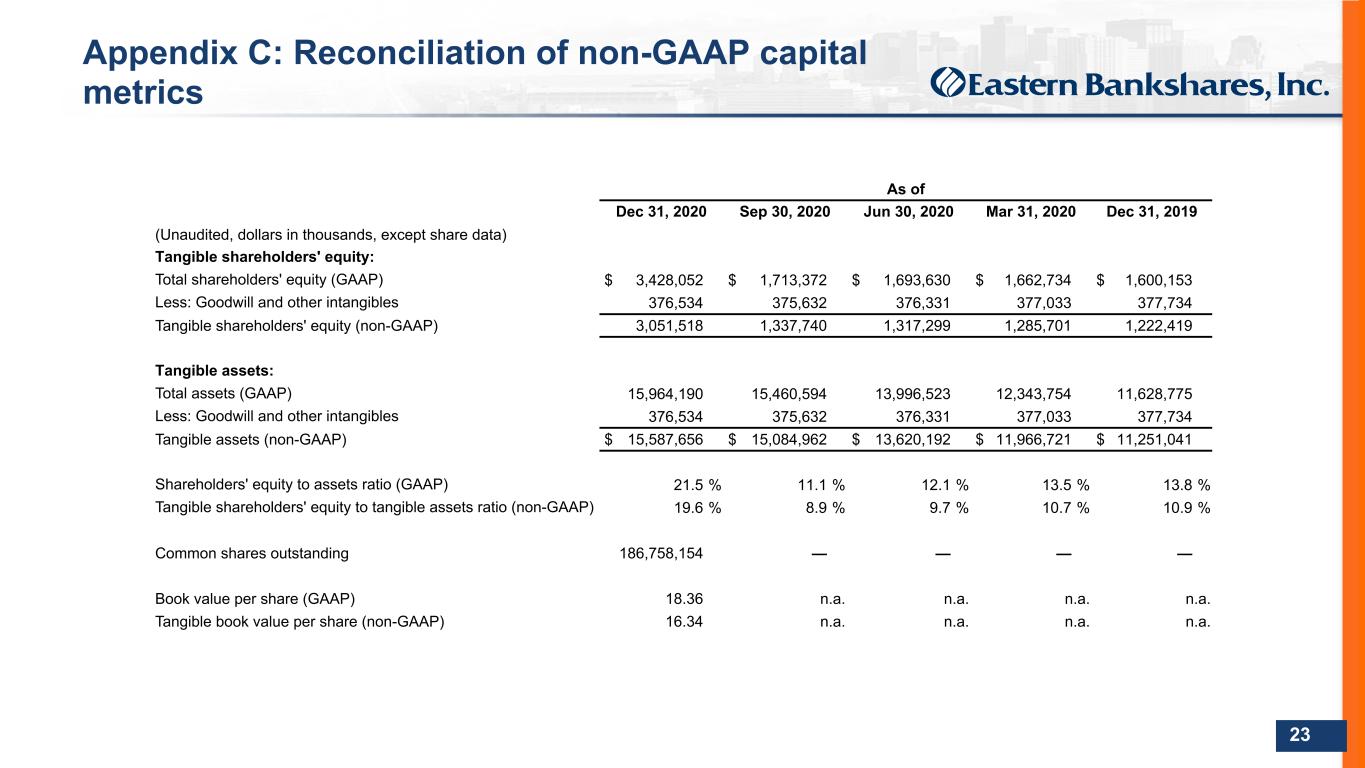

 
DO NOT REFRESH Color PaletteComplementary 000 / 000 / 051 Body text 074 / 075 / 076 030 / 152 / 213 185 / 197 / 212 023 / 061 / 110 119 / 139 / 154 255 / 107 / 000109 / 110 / 112 237 / 237 / 238 000 / 139 / 151 137 / 139 / 141 197 / 064 / 044 166 / 168 / 171 103 / 086 / 164 208 / 210 / 211 238 / 184 / 028 23 Appendix C: Reconciliation of non-GAAP capital metrics As of Dec 31, 2020 Sep 30, 2020 Jun 30, 2020 Mar 31, 2020 Dec 31, 2019 (Unaudited, dollars in thousands, except share data) Tangible shareholders' equity: Total shareholders' equity (GAAP) $ 3,428,052 $ 1,713,372 $ 1,693,630 $ 1,662,734 $ 1,600,153 Less: Goodwill and other intangibles 376,534 375,632 376,331 377,033 377,734 Tangible shareholders' equity (non-GAAP) 3,051,518 1,337,740 1,317,299 1,285,701 1,222,419 Tangible assets: Total assets (GAAP) 15,964,190 15,460,594 13,996,523 12,343,754 11,628,775 Less: Goodwill and other intangibles 376,534 375,632 376,331 377,033 377,734 Tangible assets (non-GAAP) $ 15,587,656 $ 15,084,962 $ 13,620,192 $ 11,966,721 $ 11,251,041 Shareholders' equity to assets ratio (GAAP) 21.5 % 11.1 % 12.1 % 13.5 % 13.8 % Tangible shareholders' equity to tangible assets ratio (non-GAAP) 19.6 % 8.9 % 9.7 % 10.7 % 10.9 % Common shares outstanding 186,758,154 — — — — Book value per share (GAAP) 18.36 n.a. n.a. n.a. n.a. Tangible book value per share (non-GAAP) 16.34 n.a. n.a. n.a. n.a.
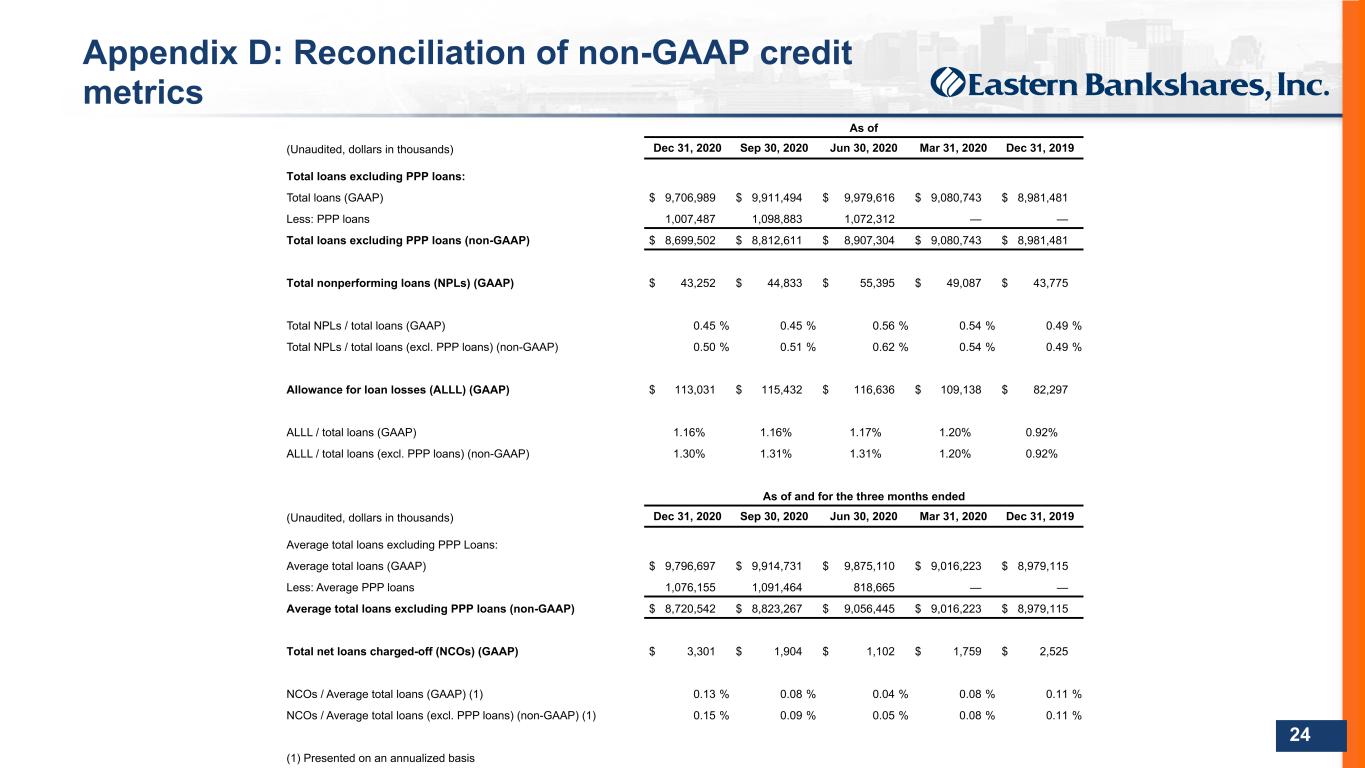

 
DO NOT REFRESH Color PaletteComplementary 000 / 000 / 051 Body text 074 / 075 / 076 030 / 152 / 213 185 / 197 / 212 023 / 061 / 110 119 / 139 / 154 255 / 107 / 000109 / 110 / 112 237 / 237 / 238 000 / 139 / 151 137 / 139 / 141 197 / 064 / 044 166 / 168 / 171 103 / 086 / 164 208 / 210 / 211 238 / 184 / 028 24 Appendix D: Reconciliation of non-GAAP credit metrics As of (Unaudited, dollars in thousands) Dec 31, 2020 Sep 30, 2020 Jun 30, 2020 Mar 31, 2020 Dec 31, 2019 Total loans excluding PPP loans: Total loans (GAAP) $ 9,706,989 $ 9,911,494 $ 9,979,616 $ 9,080,743 $ 8,981,481 Less: PPP loans 1,007,487 1,098,883 1,072,312 — — Total loans excluding PPP loans (non-GAAP) $ 8,699,502 $ 8,812,611 $ 8,907,304 $ 9,080,743 $ 8,981,481 Total nonperforming loans (NPLs) (GAAP) $ 43,252 $ 44,833 $ 55,395 $ 49,087 $ 43,775 Total NPLs / total loans (GAAP) 0.45 % 0.45 % 0.56 % 0.54 % 0.49 % Total NPLs / total loans (excl. PPP loans) (non-GAAP) 0.50 % 0.51 % 0.62 % 0.54 % 0.49 % Allowance for loan losses (ALLL) (GAAP) $ 113,031 $ 115,432 $ 116,636 $ 109,138 $ 82,297 ALLL / total loans (GAAP) 1.16% 1.16% 1.17% 1.20% 0.92% ALLL / total loans (excl. PPP loans) (non-GAAP) 1.30% 1.31% 1.31% 1.20% 0.92% As of and for the three months ended (Unaudited, dollars in thousands) Dec 31, 2020 Sep 30, 2020 Jun 30, 2020 Mar 31, 2020 Dec 31, 2019 Average total loans excluding PPP Loans: Average total loans (GAAP) $ 9,796,697 $ 9,914,731 $ 9,875,110 $ 9,016,223 $ 8,979,115 Less: Average PPP loans 1,076,155 1,091,464 818,665 — — Average total loans excluding PPP loans (non-GAAP) $ 8,720,542 $ 8,823,267 $ 9,056,445 $ 9,016,223 $ 8,979,115 Total net loans charged-off (NCOs) (GAAP) $ 3,301 $ 1,904 $ 1,102 $ 1,759 $ 2,525 NCOs / Average total loans (GAAP) (1) 0.13 % 0.08 % 0.04 % 0.08 % 0.11 % NCOs / Average total loans (excl. PPP loans) (non-GAAP) (1) 0.15 % 0.09 % 0.05 % 0.08 % 0.11 % (1) Presented on an annualized basis
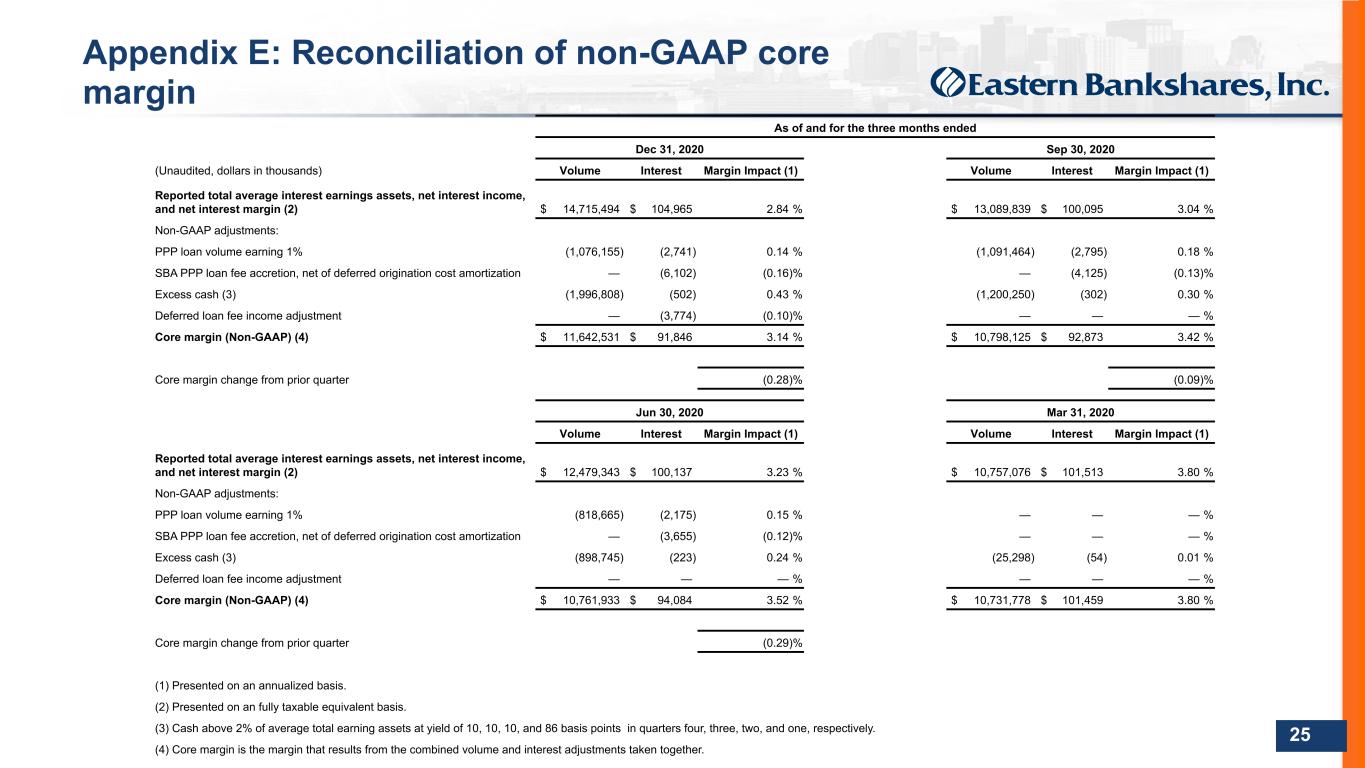

 
DO NOT REFRESH Color PaletteComplementary 000 / 000 / 051 Body text 074 / 075 / 076 030 / 152 / 213 185 / 197 / 212 023 / 061 / 110 119 / 139 / 154 255 / 107 / 000109 / 110 / 112 237 / 237 / 238 000 / 139 / 151 137 / 139 / 141 197 / 064 / 044 166 / 168 / 171 103 / 086 / 164 208 / 210 / 211 238 / 184 / 028 25 Appendix E: Reconciliation of non-GAAP core margin As of and for the three months ended Dec 31, 2020 Sep 30, 2020 (Unaudited, dollars in thousands) Volume Interest Margin Impact (1) Volume Interest Margin Impact (1) Reported total average interest earnings assets, net interest income, and net interest margin (2) $ 14,715,494 $ 104,965 2.84 % $ 13,089,839 $ 100,095 3.04 % Non-GAAP adjustments: PPP loan volume earning 1% (1,076,155) (2,741) 0.14 % (1,091,464) (2,795) 0.18 % SBA PPP loan fee accretion, net of deferred origination cost amortization — (6,102) (0.16) % — (4,125) (0.13) % Excess cash (3) (1,996,808) (502) 0.43 % (1,200,250) (302) 0.30 % Deferred loan fee income adjustment — (3,774) (0.10) % — — — % Core margin (Non-GAAP) (4) $ 11,642,531 $ 91,846 3.14 % $ 10,798,125 $ 92,873 3.42 % Core margin change from prior quarter (0.28) % (0.09) % Jun 30, 2020 Mar 31, 2020 Volume Interest Margin Impact (1) Volume Interest Margin Impact (1) Reported total average interest earnings assets, net interest income, and net interest margin (2) $ 12,479,343 $ 100,137 3.23 % $ 10,757,076 $ 101,513 3.80 % Non-GAAP adjustments: PPP loan volume earning 1% (818,665) (2,175) 0.15 % — — — % SBA PPP loan fee accretion, net of deferred origination cost amortization — (3,655) (0.12) % — — — % Excess cash (3) (898,745) (223) 0.24 % (25,298) (54) 0.01 % Deferred loan fee income adjustment — — — % — — — % Core margin (Non-GAAP) (4) $ 10,761,933 $ 94,084 3.52 % $ 10,731,778 $ 101,459 3.80 % Core margin change from prior quarter (0.29) % (1) Presented on an annualized basis. (2) Presented on an fully taxable equivalent basis. (3) Cash above 2% of average total earning assets at yield of 10, 10, 10, and 86 basis points in quarters four, three, two, and one, respectively. (4) Core margin is the margin that results from the combined volume and interest adjustments taken together.