
DO NOT REFRESH Color PaletteComplementary 000 / 000 / 051 Body text 074 / 075 / 076 030 / 152 / 213 185 / 197 / 212 023 / 061 / 110 119 / 139 / 154 255 / 107 / 000109 / 110 / 112 237 / 237 / 238 000 / 139 / 151 137 / 139 / 141 197 / 064 / 044 166 / 168 / 171 103 / 086 / 164 208 / 210 / 211 238 / 184 / 028 Q1 Earnings Presentation April 29 | 2021 Exhibit 99.2
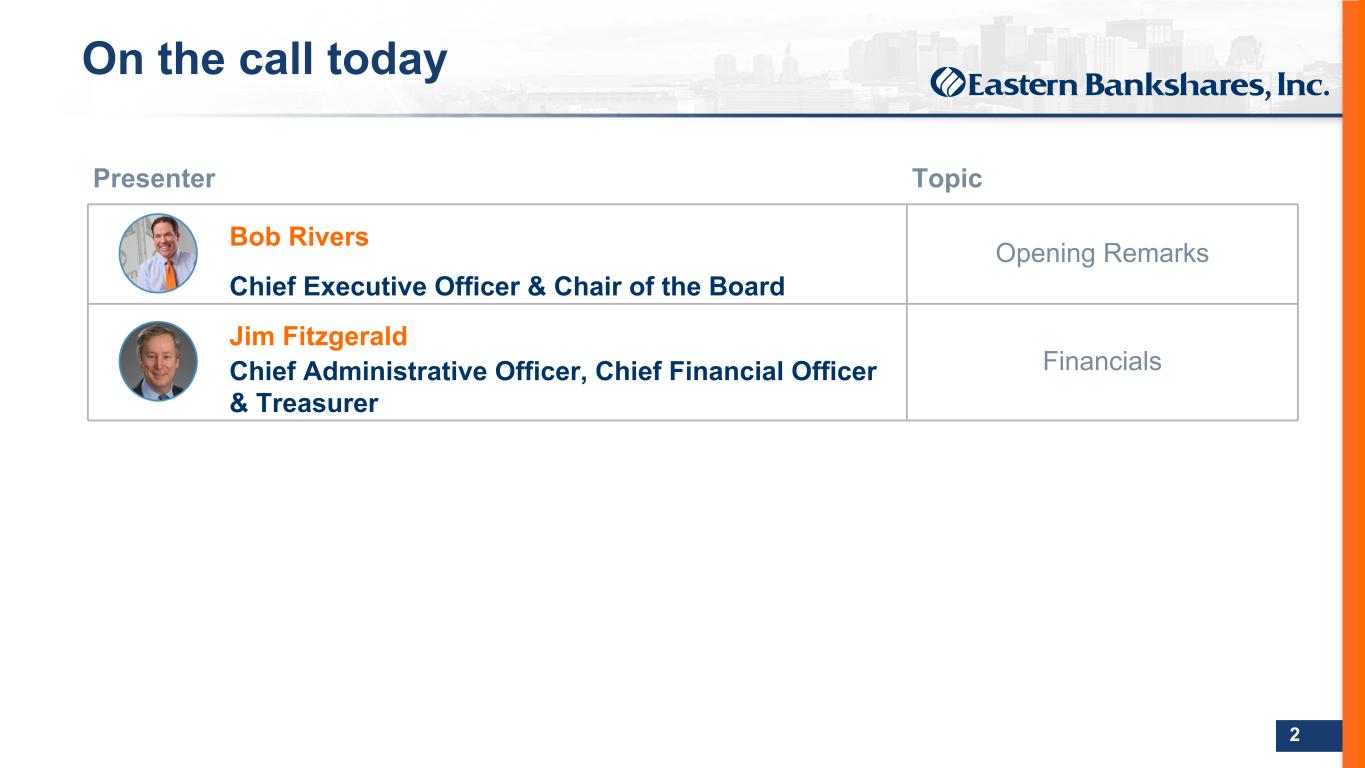
DO NOT REFRESH Color PaletteComplementary 000 / 000 / 051 Body text 074 / 075 / 076 030 / 152 / 213 185 / 197 / 212 023 / 061 / 110 119 / 139 / 154 255 / 107 / 000109 / 110 / 112 237 / 237 / 238 000 / 139 / 151 137 / 139 / 141 197 / 064 / 044 166 / 168 / 171 103 / 086 / 164 208 / 210 / 211 238 / 184 / 028 2 On the call today Presenter Topic Bob Rivers Opening Remarks Chief Executive Officer & Chair of the Board Jim Fitzgerald FinancialsChief Administrative Officer, Chief Financial Officer & Treasurer
DO NOT REFRESH Color PaletteComplementary 000 / 000 / 051 Body text 074 / 075 / 076 030 / 152 / 213 185 / 197 / 212 023 / 061 / 110 119 / 139 / 154 255 / 107 / 000109 / 110 / 112 237 / 237 / 238 000 / 139 / 151 137 / 139 / 141 197 / 064 / 044 166 / 168 / 171 103 / 086 / 164 208 / 210 / 211 238 / 184 / 028 3 Forward-looking statements This presentation contains “forward-looking statements” within the meaning of section 27A of the Securities Act of 1933, as amended, and section 21E of the Securities Exchange Act of 1934, as amended. Forward-looking statements include statements regarding anticipated future events and can be identified by the fact that they do not relate strictly to historical or current facts. You can identify these statements from the use of the words “may,” “will,” “should,” “could,” “would,” “plan,” “potential,” “estimate,” “project,” “believe,” “intend,” “anticipate,” “expect,” “target” and similar expressions. Forward-looking statements, by their nature, are subject to risks and uncertainties. There are many factors that could cause actual results to differ materially from expected results described in the forward-looking statements. Certain factors that could cause actual results to differ materially from expected results include developments in the Company’s market relating to the COVID-19 pandemic, including the severity and duration of the associated economic slowdown, adverse developments in the level and direction of loan delinquencies and charge-offs and changes in estimates of the adequacy of the allowance for loan losses, increased competitive pressures, changes in the interest rate environment, risks associated with its proposed merger with Century Bancorp, Inc., including the possibility that revenue or expense synergies or the other expected benefits of the transaction may not materialize for the Company in the timeframe expected or at all, or may be more costly to achieve; that the transaction may not be timely completed, if at all; that prior to the completion of the transaction or thereafter, the Company’s or Century’s businesses may not perform as expected due to transaction-related uncertainty or other factors; that the Company is unable to successfully implement integration strategies; that required regulatory, shareholder or other approvals are not obtained or other closing conditions are not satisfied in a timely manner or at all; that the timing of completion of the proposed merger is dependent on various factors that cannot be predicted with precision at this point; reputational risks and the reaction of the companies’ customers to the transaction; the inability to implement onboarding plans and other consequences associated with mergers; and diversion of management time on merger-related issues, as well as general economic conditions or conditions within the securities markets, and legislative and regulatory changes that could adversely affect the business in which the Company and its subsidiary Eastern Bank are engaged. For further discussion of such factors, please see the Company’s Annual Report on Form 10-K and subsequent filings filed with the U.S. Securities and Exchange Commission (the “SEC”) which are available on the SEC’s website at www.sec.gov. Further, given the ongoing and dynamic nature of the COVID-19 pandemic, it is difficult to predict what continued effects the COVID-19 pandemic will have on the Company's business and results of operations. The COVID-19 pandemic and the related local and national economic disruption may result in a continued decline in demand for the Company's products and services; increased levels of loan delinquencies, problem assets and foreclosures; an increase in the Company's allowance for loan losses; a decline in the value of loan collateral, including real estate; a greater decline in the yield on the Company's interest-earning assets than the decline in the cost of the Company's interest-bearing liabilities; and increased cybersecurity risks, as employees continue to work remotely. Accordingly, you should not place undue reliance on forward-looking statements, which reflect the Company's expectations only as of the date of this presentation. The Company does not undertake any obligation to update forward-looking statements.
DO NOT REFRESH Color PaletteComplementary 000 / 000 / 051 Body text 074 / 075 / 076 030 / 152 / 213 185 / 197 / 212 023 / 061 / 110 119 / 139 / 154 255 / 107 / 000109 / 110 / 112 237 / 237 / 238 000 / 139 / 151 137 / 139 / 141 197 / 064 / 044 166 / 168 / 171 103 / 086 / 164 208 / 210 / 211 238 / 184 / 028 4 Non-GAAP financial measures used in this presentation are denoted by an asterisk. A non-GAAP financial measure is defined as a numerical measure of the Company’s historical or future financial performance, financial position or cash flows that excludes (or includes) amounts, or is subject to adjustments that have the effect of excluding (or including) amounts that are included in the most directly comparable measure calculated and presented in accordance with accounting principles generally accepted in the United States (“GAAP”) in the Company’s statement of income, balance sheet or statement of cash flows (or equivalent statements). The Company presents non-GAAP financial measures, which management uses to evaluate the Company’s performance, and which exclude the effects of certain transactions that management believes are unrelated to its core business and are therefore not necessarily indicative of its current performance or financial position. Management believes excluding these items facilitates greater visibility for investors into the Company’s core businesses as well as underlying trends that may, to some extent, be obscured by inclusion of such items in the corresponding GAAP financial measures. There are items in the Company’s financial statements that impact its financial results, but which management believes are unrelated to the Company’s core business. Accordingly, the Company presents noninterest income on an operating basis, total operating revenue, noninterest expense on an operating basis, operating net income, operating earnings per share, operating return on average assets, operating return on average shareholders’ equity, the operating efficiency ratio, and the ratio of noninterest income to total revenue on an operating basis. Each of these figures excludes the impact of such applicable items because management believes such exclusion can provide greater visibility into the Company’s core business and underlying trends. Such items that management does not consider to be core to the Company’s business include (i) income and expenses from investments held in rabbi trusts, (ii) gains and losses on sales of securities available for sale, net, (iii) gains and losses on the sale of other assets, (iv) rabbi trust employee benefits, (v) impairment charges on tax credit investments and associated tax credit benefits, (vi) expenses indirectly associated with the Company’s mutual-to-stock conversion and initial public offering ("IPO"), (vii) other real estate owned gains, (viii) merger and acquisition expenses, and (ix) the stock donation to the Eastern Bank Charitable Foundation ("EBCF") in connection with the Company’s mutual-to-stock conversion and IPO. The Company does not provide an outlook for its total noninterest income because it contains components, such as income from investments held in rabbi trusts, which is market-driven, over which the Company cannot exercise control. Accordingly a reconciliation of the Company’s outlook for its noninterest income on an operating basis to an outlook for total noninterest income cannot be made available without unreasonable effort. The Company also does not provide an outlook for its total noninterest expense because it contains expense components, such as expense associated with rabbi trust accounts, which is market-driven, over which the Company cannot exercise control. Accordingly a reconciliation of the Company’s outlook for its noninterest expense on an operating basis to an outlook for total noninterest expense cannot be made available without unreasonable effort. Management also presents the Company’s core net interest margin which excludes the impact of items management determines as being one-time in nature or not indicative of its core operating results. Such items include the impact of excess liquidity in the form of excess cash volume, PPP loans originated in response to the COVID-19 pandemic, and material purchase accounting adjustments. Similarly, management presents certain asset quality metrics excluding PPP loans which it does not consider to be part of the Company’s core portfolios. These metrics include the ratio of total nonperforming loans to total loans excluding PPP loans, the ratio of the allowance for loan losses to total loans excluding PPP loans, and the ratio of annualized net charge-offs to average total loans excluding PPP loans. The Company does not provide an outlook for its ratio of the allowance for loan losses to total loans because it contains components, such as the volume of PPP loans which is market-driven, over which the Company cannot exercise control. Accordingly a reconciliation of the Company’s outlook for its ratio of the allowance for loan losses to total loans to an outlook for its ratio of the allowance for loan losses to total loans excluding PPP loans cannot be made available without unreasonable effort. The Company does not provide an outlook for its ratio of annualized net charge-offs to average total loans because it contains components, such as the volume PPP loans which is market-driven, over which the Company cannot exercise control. Accordingly a reconciliation of the Company’s outlook for its ratio of annualized net charge-offs to average total loans to an outlook for its ratio of annualized net charge-offs to average total loans excluding PPP loans cannot be made available without unreasonable effort. The Company anticipates that the vast majority of its PPP loans outstanding at March 31, 2021 will be forgiven during 2021, and to the extent not forgiven, a PPP loan is intended to be 100% guaranteed by the SBA. Management also presents tangible assets, tangible shareholders’ equity, tangible book value per share, and the ratio of tangible shareholders’ equity to tangible assets, each of which excludes the impact of goodwill and other intangible assets, as management believes these financial measures provide investors with the ability to further assess the Company’s performance, identify trends in its core business and provide a comparison of its capital adequacy to other companies. The Company included the tangible ratios because management believes that investors may find it useful to have access to the same analytical tools used by management to assess performance and identify trends. These non-GAAP financial measures presented in this presentation should not be considered an alternative or substitute for financial results or measures determined in accordance with GAAP or as an indication of the Company’s cash flows from operating activities, a measure of its liquidity position or an indication of funds available for its cash needs. An item which management considers to be non-core and excludes when computing these non-GAAP measures can be of substantial importance to the Company’s results for any particular period. In addition, management’s methodology for calculating non-GAAP financial measures may differ from the methodologies employed by other banking companies to calculate the same or similar performance measures, and accordingly, the Company’s reported non-GAAP financial measures may not be comparable to the same or similar performance measures reported by other banking companies. Please refer to Appendices A-E for a reconciliations of the Company's GAAP financial measures to the non-GAAP financial measures in this presentation. Non-GAAP financial measures
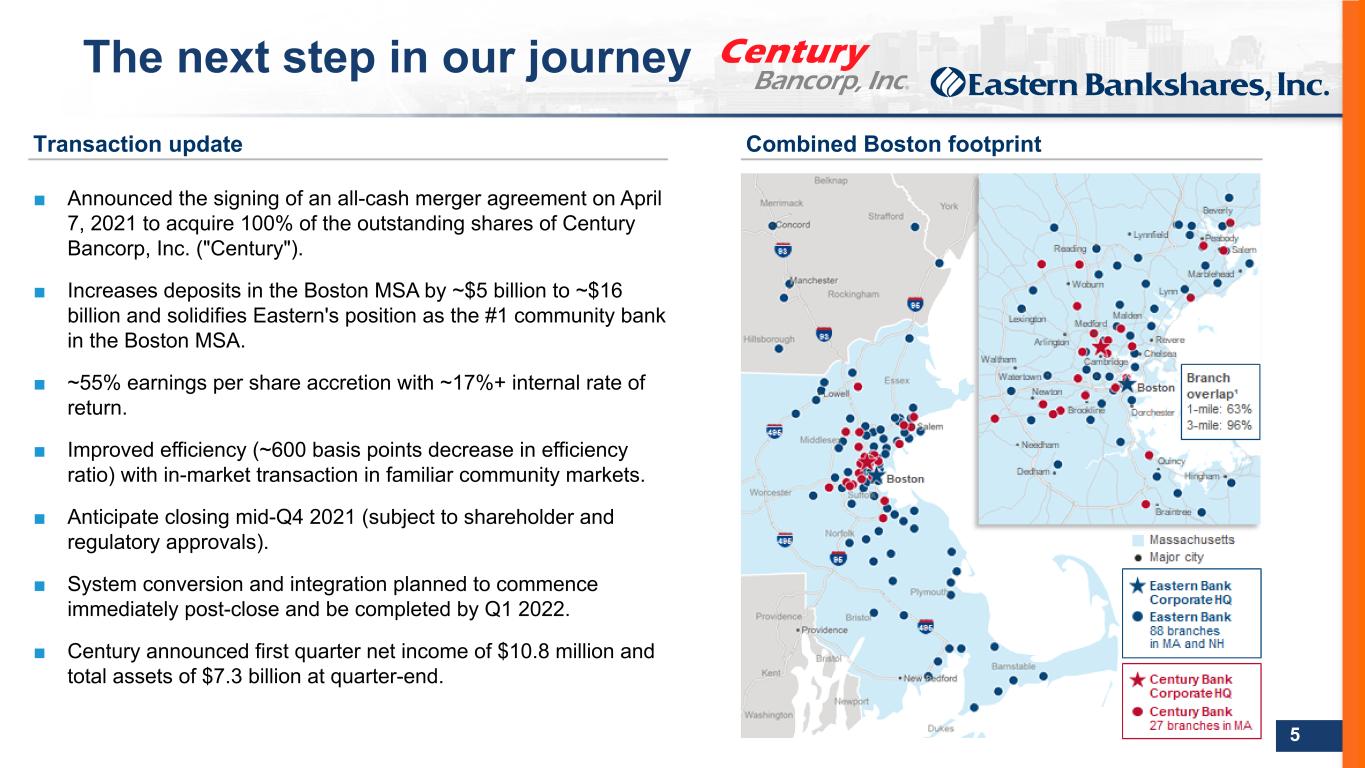
DO NOT REFRESH Color PaletteComplementary 000 / 000 / 051 Body text 074 / 075 / 076 030 / 152 / 213 185 / 197 / 212 023 / 061 / 110 119 / 139 / 154 255 / 107 / 000109 / 110 / 112 237 / 237 / 238 000 / 139 / 151 137 / 139 / 141 197 / 064 / 044 166 / 168 / 171 103 / 086 / 164 208 / 210 / 211 238 / 184 / 028 5 The next step in our journey Transaction update Combined Boston footprint ■ Announced the signing of an all-cash merger agreement on April 7, 2021 to acquire 100% of the outstanding shares of Century Bancorp, Inc. ("Century"). ■ Increases deposits in the Boston MSA by ~$5 billion to ~$16 billion and solidifies Eastern's position as the #1 community bank in the Boston MSA. ■ ~55% earnings per share accretion with ~17%+ internal rate of return. ■ Improved efficiency (~600 basis points decrease in efficiency ratio) with in-market transaction in familiar community markets. ■ Anticipate closing mid-Q4 2021 (subject to shareholder and regulatory approvals). ■ System conversion and integration planned to commence immediately post-close and be completed by Q1 2022. ■ Century announced first quarter net income of $10.8 million and total assets of $7.3 billion at quarter-end.
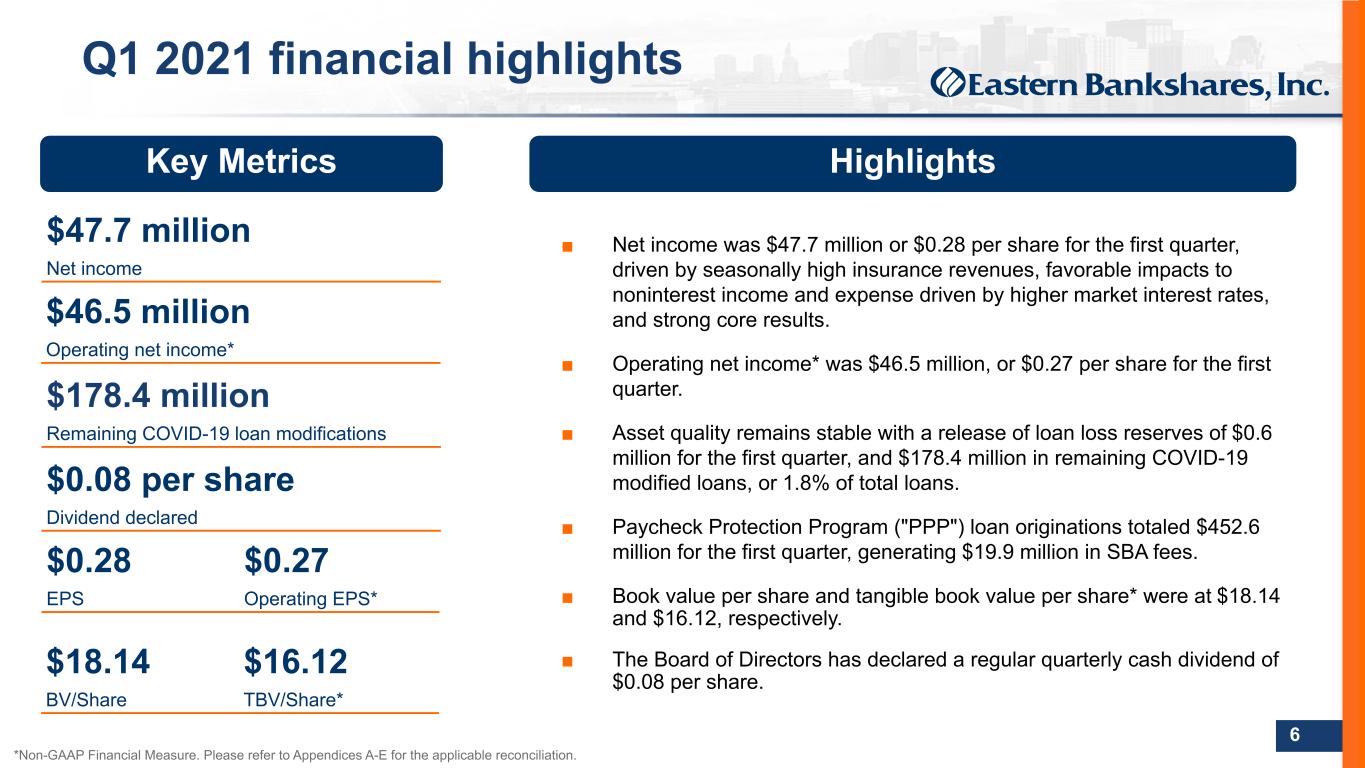
DO NOT REFRESH Color PaletteComplementary 000 / 000 / 051 Body text 074 / 075 / 076 030 / 152 / 213 185 / 197 / 212 023 / 061 / 110 119 / 139 / 154 255 / 107 / 000109 / 110 / 112 237 / 237 / 238 000 / 139 / 151 137 / 139 / 141 197 / 064 / 044 166 / 168 / 171 103 / 086 / 164 208 / 210 / 211 238 / 184 / 028 6 Q1 2021 financial highlights ■ Net income was $47.7 million or $0.28 per share for the first quarter, driven by seasonally high insurance revenues, favorable impacts to noninterest income and expense driven by higher market interest rates, and strong core results. ■ Operating net income* was $46.5 million, or $0.27 per share for the first quarter. ■ Asset quality remains stable with a release of loan loss reserves of $0.6 million for the first quarter, and $178.4 million in remaining COVID-19 modified loans, or 1.8% of total loans. ■ Paycheck Protection Program ("PPP") loan originations totaled $452.6 million for the first quarter, generating $19.9 million in SBA fees. ■ Book value per share and tangible book value per share* were at $18.14 and $16.12, respectively. ■ The Board of Directors has declared a regular quarterly cash dividend of $0.08 per share. *Non-GAAP Financial Measure. Please refer to Appendices A-E for the applicable reconciliation. Key Metrics Highlights $0.08 per share Dividend declared $47.7 million Net income $46.5 million Operating net income* $178.4 million Remaining COVID-19 loan modifications $0.28 $0.27 EPS Operating EPS* $18.14 $16.12 BV/Share TBV/Share*
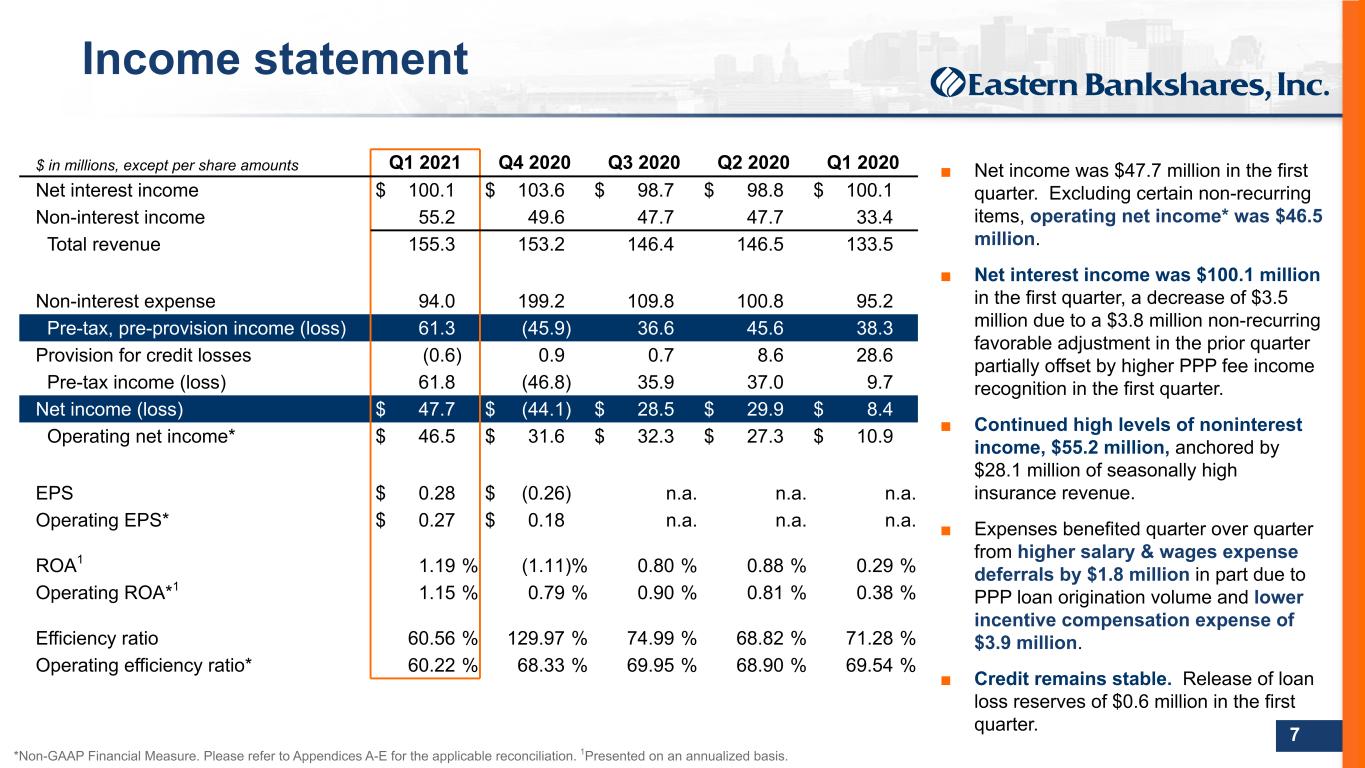
DO NOT REFRESH Color PaletteComplementary 000 / 000 / 051 Body text 074 / 075 / 076 030 / 152 / 213 185 / 197 / 212 023 / 061 / 110 119 / 139 / 154 255 / 107 / 000109 / 110 / 112 237 / 237 / 238 000 / 139 / 151 137 / 139 / 141 197 / 064 / 044 166 / 168 / 171 103 / 086 / 164 208 / 210 / 211 238 / 184 / 028 7 ■ Net income was $47.7 million in the first quarter. Excluding certain non-recurring items, operating net income* was $46.5 million. ■ Net interest income was $100.1 million in the first quarter, a decrease of $3.5 million due to a $3.8 million non-recurring favorable adjustment in the prior quarter partially offset by higher PPP fee income recognition in the first quarter. ■ Continued high levels of noninterest income, $55.2 million, anchored by $28.1 million of seasonally high insurance revenue. ■ Expenses benefited quarter over quarter from higher salary & wages expense deferrals by $1.8 million in part due to PPP loan origination volume and lower incentive compensation expense of $3.9 million. ■ Credit remains stable. Release of loan loss reserves of $0.6 million in the first quarter. $ in millions, except per share amounts Q1 2021 Q4 2020 Q3 2020 Q2 2020 Q1 2020 Net interest income $ 100.1 $ 103.6 $ 98.7 $ 98.8 $ 100.1 Non-interest income 55.2 49.6 47.7 47.7 33.4 Total revenue 155.3 153.2 146.4 146.5 133.5 Non-interest expense 94.0 199.2 109.8 100.8 95.2 Pre-tax, pre-provision income (loss) 61.3 (45.9) 36.6 45.6 38.3 Provision for credit losses (0.6) 0.9 0.7 8.6 28.6 Pre-tax income (loss) 61.8 (46.8) 35.9 37.0 9.7 Net income (loss) $ 47.7 $ (44.1) $ 28.5 $ 29.9 $ 8.4 Operating net income* $ 46.5 $ 31.6 $ 32.3 $ 27.3 $ 10.9 EPS $ 0.28 $ (0.26) n.a. n.a. n.a. Operating EPS* $ 0.27 $ 0.18 n.a. n.a. n.a. ROA1 1.19 % (1.11) % 0.80 % 0.88 % 0.29 % Operating ROA*1 1.15 % 0.79 % 0.90 % 0.81 % 0.38 % Efficiency ratio 60.56 % 129.97 % 74.99 % 68.82 % 71.28 % Operating efficiency ratio* 60.22 % 68.33 % 69.95 % 68.90 % 69.54 % Income statement *Non-GAAP Financial Measure. Please refer to Appendices A-E for the applicable reconciliation. 1Presented on an annualized basis.
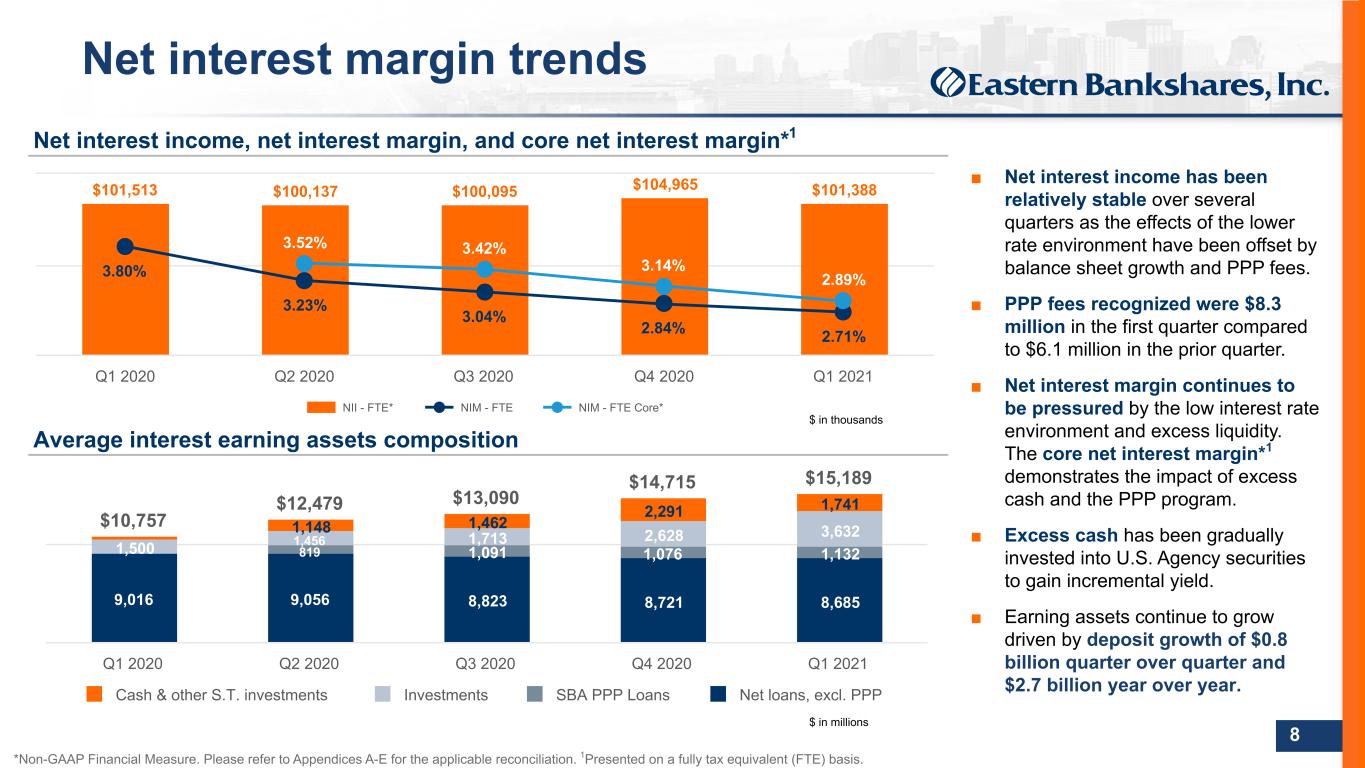
DO NOT REFRESH Color PaletteComplementary 000 / 000 / 051 Body text 074 / 075 / 076 030 / 152 / 213 185 / 197 / 212 023 / 061 / 110 119 / 139 / 154 255 / 107 / 000109 / 110 / 112 237 / 237 / 238 000 / 139 / 151 137 / 139 / 141 197 / 064 / 044 166 / 168 / 171 103 / 086 / 164 208 / 210 / 211 238 / 184 / 028 8 Net interest income, net interest margin, and core net interest margin*1 Average interest earning assets composition $101,513 $100,137 $100,095 $104,965 $101,388 3.80% 3.23% 3.04% 2.84% 2.71% 3.52% 3.42% 3.14% 2.89% NII - FTE* NIM - FTE NIM - FTE Core* Q1 2020 Q2 2020 Q3 2020 Q4 2020 Q1 2021 ■ Net interest income has been relatively stable over several quarters as the effects of the lower rate environment have been offset by balance sheet growth and PPP fees. ■ PPP fees recognized were $8.3 million in the first quarter compared to $6.1 million in the prior quarter. ■ Net interest margin continues to be pressured by the low interest rate environment and excess liquidity. The core net interest margin*1 demonstrates the impact of excess cash and the PPP program. ■ Excess cash has been gradually invested into U.S. Agency securities to gain incremental yield. ■ Earning assets continue to grow driven by deposit growth of $0.8 billion quarter over quarter and $2.7 billion year over year. Net interest margin trends $10,757 $12,479 $13,090 $14,715 $15,189 9,016 9,056 8,823 8,721 8,685 819 1,091 1,076 1,1321,500 1,456 1,713 2,628 3,632 1,148 1,462 2,291 1,741 Cash & other S.T. investments Investments SBA PPP Loans Net loans, excl. PPP Q1 2020 Q2 2020 Q3 2020 Q4 2020 Q1 2021 $ in thousands $ in millions *Non-GAAP Financial Measure. Please refer to Appendices A-E for the applicable reconciliation. 1Presented on a fully tax equivalent (FTE) basis.
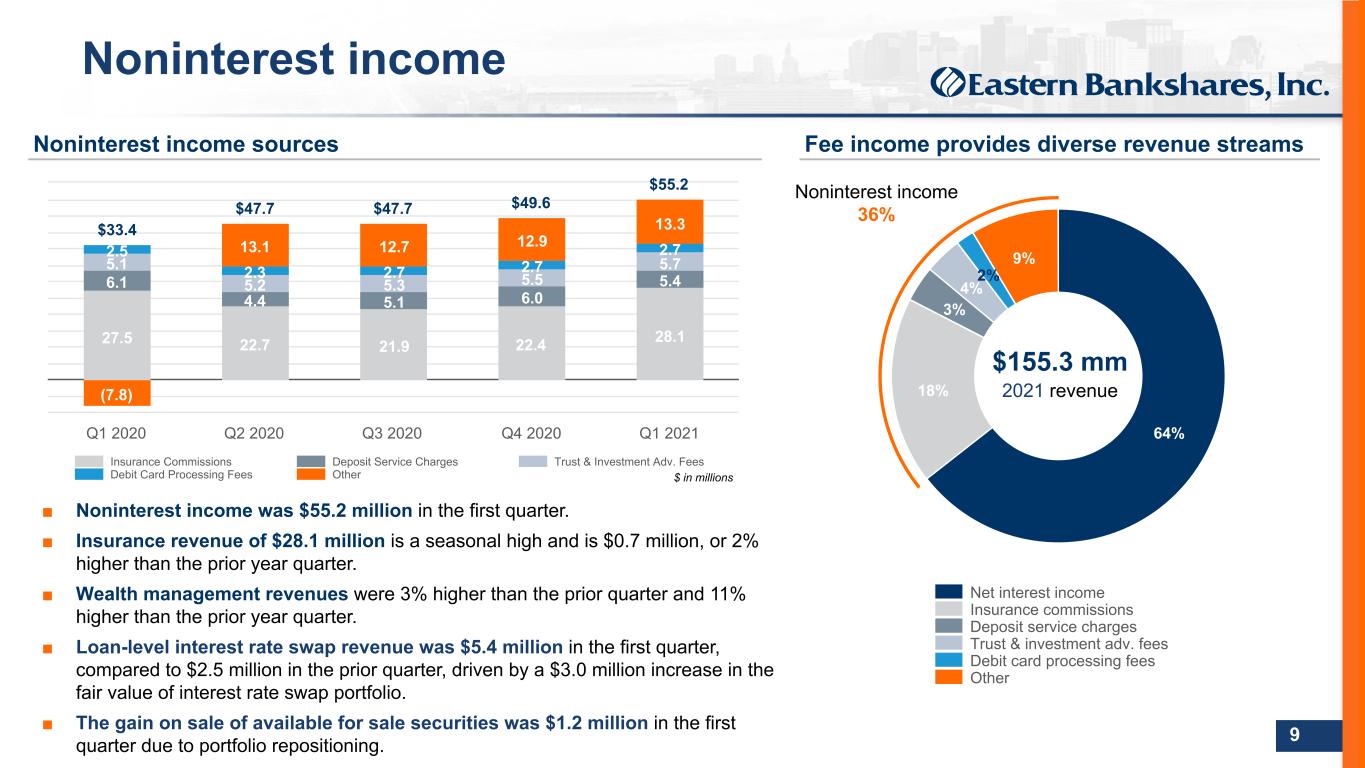
DO NOT REFRESH Color PaletteComplementary 000 / 000 / 051 Body text 074 / 075 / 076 030 / 152 / 213 185 / 197 / 212 023 / 061 / 110 119 / 139 / 154 255 / 107 / 000109 / 110 / 112 237 / 237 / 238 000 / 139 / 151 137 / 139 / 141 197 / 064 / 044 166 / 168 / 171 103 / 086 / 164 208 / 210 / 211 238 / 184 / 028 9 64% 18% 3% 4% 2% 9% Net interest income Insurance commissions Deposit service charges Trust & investment adv. fees Debit card processing fees Other Noninterest income ■ Noninterest income was $55.2 million in the first quarter. ■ Insurance revenue of $28.1 million is a seasonal high and is $0.7 million, or 2% higher than the prior year quarter. ■ Wealth management revenues were 3% higher than the prior quarter and 11% higher than the prior year quarter. ■ Loan-level interest rate swap revenue was $5.4 million in the first quarter, compared to $2.5 million in the prior quarter, driven by a $3.0 million increase in the fair value of interest rate swap portfolio. ■ The gain on sale of available for sale securities was $1.2 million in the first quarter due to portfolio repositioning. $33.4 $47.7 $47.7 $49.6 $55.2 27.5 22.7 21.9 22.4 28.1 6.1 4.4 5.1 6.0 5.4 5.1 5.2 5.3 5.5 5.7 2.5 2.3 2.7 2.7 2.7 (7.8) 13.1 12.7 12.9 13.3 Insurance Commissions Deposit Service Charges Trust & Investment Adv. Fees Debit Card Processing Fees Other Q1 2020 Q2 2020 Q3 2020 Q4 2020 Q1 2021 Noninterest income sources Fee income provides diverse revenue streams $ in millions $155.3 mm 2021 revenue Noninterest income 36%
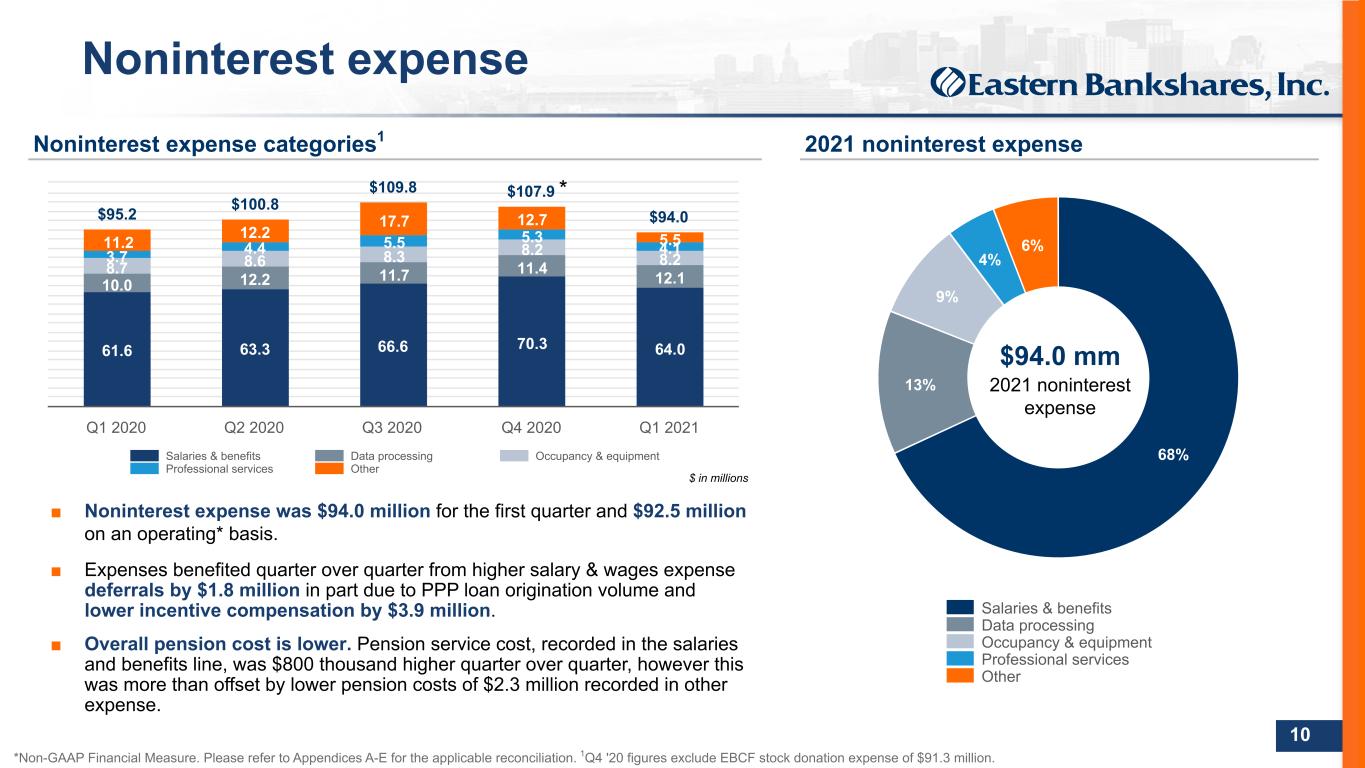
DO NOT REFRESH Color PaletteComplementary 000 / 000 / 051 Body text 074 / 075 / 076 030 / 152 / 213 185 / 197 / 212 023 / 061 / 110 119 / 139 / 154 255 / 107 / 000109 / 110 / 112 237 / 237 / 238 000 / 139 / 151 137 / 139 / 141 197 / 064 / 044 166 / 168 / 171 103 / 086 / 164 208 / 210 / 211 238 / 184 / 028 10 Noninterest expense ■ Noninterest expense was $94.0 million for the first quarter and $92.5 million on an operating* basis. ■ Expenses benefited quarter over quarter from higher salary & wages expense deferrals by $1.8 million in part due to PPP loan origination volume and lower incentive compensation by $3.9 million. ■ Overall pension cost is lower. Pension service cost, recorded in the salaries and benefits line, was $800 thousand higher quarter over quarter, however this was more than offset by lower pension costs of $2.3 million recorded in other expense. $95.2 $100.8 $109.8 $107.9 $94.0 61.6 63.3 66.6 70.3 64.0 10.0 12.2 11.7 11.4 12.1 8.7 8.6 8.3 8.2 8.23.7 4.4 5.5 5.3 4.111.2 12.2 17.7 12.7 5.5 Salaries & benefits Data processing Occupancy & equipment Professional services Other Q1 2020 Q2 2020 Q3 2020 Q4 2020 Q1 2021 Noninterest expense categories1 2021 noninterest expense $ in millions 68% 13% 9% 4% 6% Salaries & benefits Data processing Occupancy & equipment Professional services Other $94.0 mm 2021 noninterest expense *Non-GAAP Financial Measure. Please refer to Appendices A-E for the applicable reconciliation. 1Q4 '20 figures exclude EBCF stock donation expense of $91.3 million. *
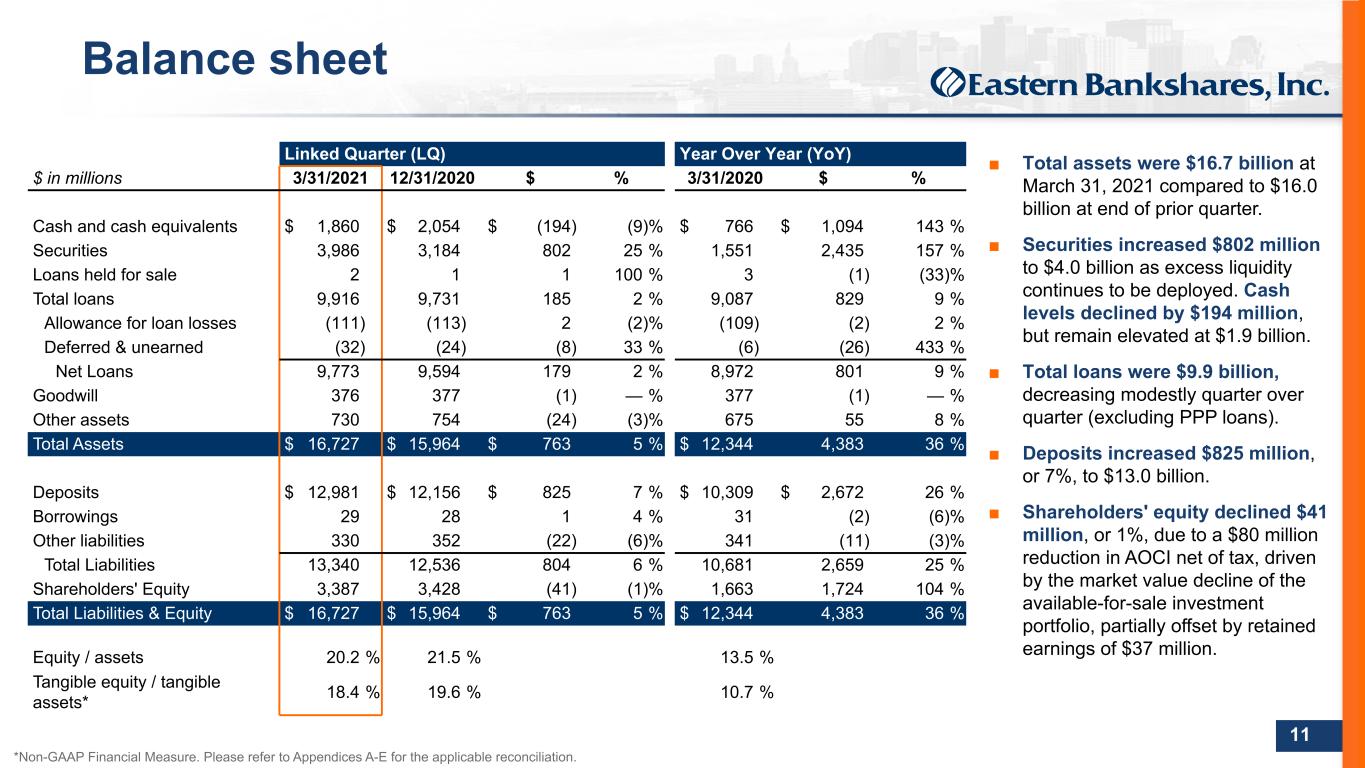
DO NOT REFRESH Color PaletteComplementary 000 / 000 / 051 Body text 074 / 075 / 076 030 / 152 / 213 185 / 197 / 212 023 / 061 / 110 119 / 139 / 154 255 / 107 / 000109 / 110 / 112 237 / 237 / 238 000 / 139 / 151 137 / 139 / 141 197 / 064 / 044 166 / 168 / 171 103 / 086 / 164 208 / 210 / 211 238 / 184 / 028 11 Linked Quarter (LQ) Year Over Year (YoY) $ in millions 3/31/2021 12/31/2020 $ % 3/31/2020 $ % Cash and cash equivalents $ 1,860 $ 2,054 $ (194) (9) % $ 766 $ 1,094 143 % Securities 3,986 3,184 802 25 % 1,551 2,435 157 % Loans held for sale 2 1 1 100 % 3 (1) (33) % Total loans 9,916 9,731 185 2 % 9,087 829 9 % Allowance for loan losses (111) (113) 2 (2) % (109) (2) 2 % Deferred & unearned (32) (24) (8) 33 % (6) (26) 433 % Net Loans 9,773 9,594 179 2 % 8,972 801 9 % Goodwill 376 377 (1) — % 377 (1) — % Other assets 730 754 (24) (3) % 675 55 8 % Total Assets $ 16,727 $ 15,964 $ 763 5 % $ 12,344 4,383 36 % Deposits $ 12,981 $ 12,156 $ 825 7 % $ 10,309 $ 2,672 26 % Borrowings 29 28 1 4 % 31 (2) (6) % Other liabilities 330 352 (22) (6) % 341 (11) (3) % Total Liabilities 13,340 12,536 804 6 % 10,681 2,659 25 % Shareholders' Equity 3,387 3,428 (41) (1) % 1,663 1,724 104 % Total Liabilities & Equity $ 16,727 $ 15,964 $ 763 5 % $ 12,344 4,383 36 % Equity / assets 20.2 % 21.5 % 13.5 % Tangible equity / tangible assets* 18.4 % 19.6 % 10.7 % ■ Total assets were $16.7 billion at March 31, 2021 compared to $16.0 billion at end of prior quarter. ■ Securities increased $802 million to $4.0 billion as excess liquidity continues to be deployed. Cash levels declined by $194 million, but remain elevated at $1.9 billion. ■ Total loans were $9.9 billion, decreasing modestly quarter over quarter (excluding PPP loans). ■ Deposits increased $825 million, or 7%, to $13.0 billion. ■ Shareholders' equity declined $41 million, or 1%, due to a $80 million reduction in AOCI net of tax, driven by the market value decline of the available-for-sale investment portfolio, partially offset by retained earnings of $37 million. Balance sheet *Non-GAAP Financial Measure. Please refer to Appendices A-E for the applicable reconciliation.
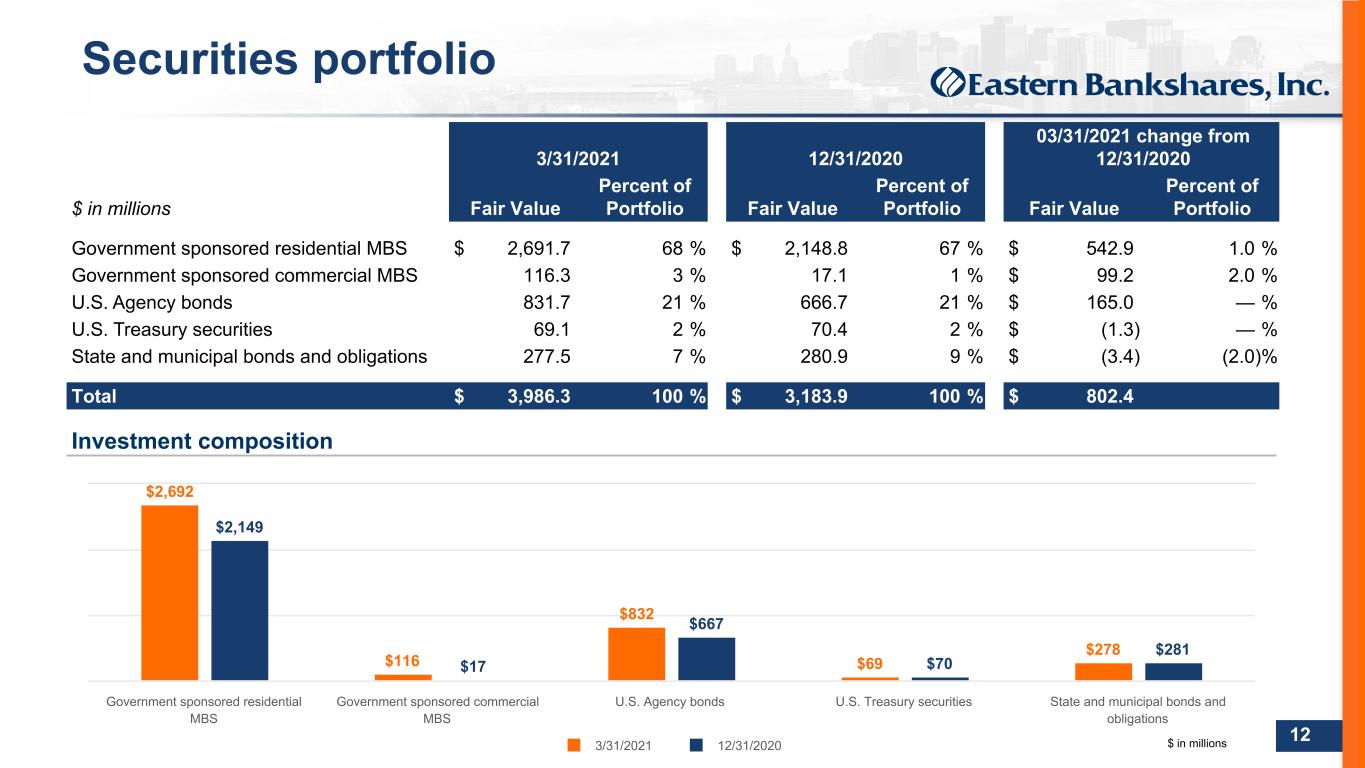
DO NOT REFRESH Color PaletteComplementary 000 / 000 / 051 Body text 074 / 075 / 076 030 / 152 / 213 185 / 197 / 212 023 / 061 / 110 119 / 139 / 154 255 / 107 / 000109 / 110 / 112 237 / 237 / 238 000 / 139 / 151 137 / 139 / 141 197 / 064 / 044 166 / 168 / 171 103 / 086 / 164 208 / 210 / 211 238 / 184 / 028 12 Securities portfolio 3/31/2021 12/31/2020 03/31/2021 change from 12/31/2020 $ in millions Fair Value Percent of Portfolio Fair Value Percent of Portfolio Fair Value Percent of Portfolio Government sponsored residential MBS $ 2,691.7 68 % $ 2,148.8 67 % $ 542.9 1.0 % Government sponsored commercial MBS 116.3 3 % 17.1 1 % $ 99.2 2.0 % U.S. Agency bonds 831.7 21 % 666.7 21 % $ 165.0 — % U.S. Treasury securities 69.1 2 % 70.4 2 % $ (1.3) — % State and municipal bonds and obligations 277.5 7 % 280.9 9 % $ (3.4) (2.0) % Total $ 3,986.3 100 % $ 3,183.9 100 % $ 802.4 $2,692 $116 $832 $69 $278 $2,149 $17 $667 $70 $281 3/31/2021 12/31/2020 Government sponsored residential MBS Government sponsored commercial MBS U.S. Agency bonds U.S. Treasury securities State and municipal bonds and obligations Investment composition $ in millions
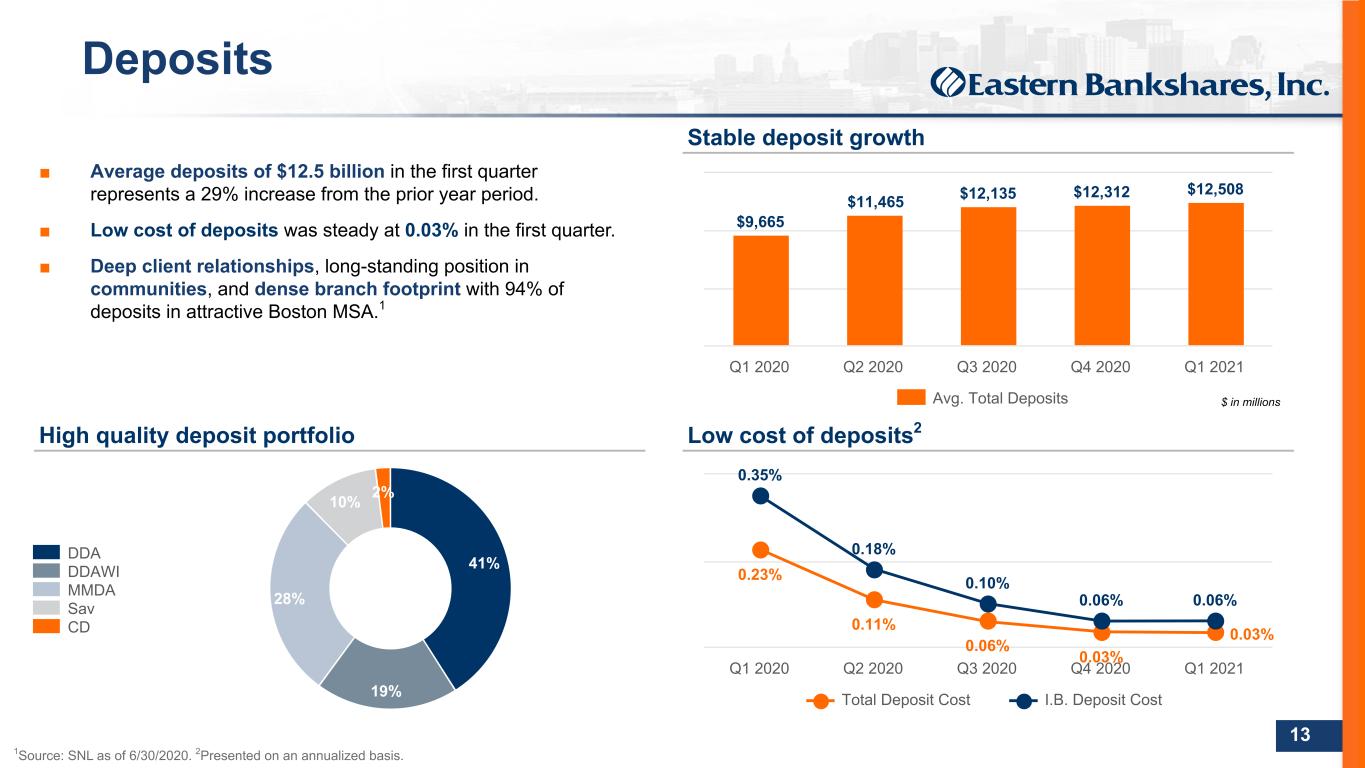
DO NOT REFRESH Color PaletteComplementary 000 / 000 / 051 Body text 074 / 075 / 076 030 / 152 / 213 185 / 197 / 212 023 / 061 / 110 119 / 139 / 154 255 / 107 / 000109 / 110 / 112 237 / 237 / 238 000 / 139 / 151 137 / 139 / 141 197 / 064 / 044 166 / 168 / 171 103 / 086 / 164 208 / 210 / 211 238 / 184 / 028 13 ■ Average deposits of $12.5 billion in the first quarter represents a 29% increase from the prior year period. ■ Low cost of deposits was steady at 0.03% in the first quarter. ■ Deep client relationships, long-standing position in communities, and dense branch footprint with 94% of deposits in attractive Boston MSA.1 Stable deposit growth Low cost of deposits2High quality deposit portfolio 41% 19% 28% 10% 2% DDA DDAWI MMDA Sav CD $9,665 $11,465 $12,135 $12,312 $12,508 Avg. Total Deposits Q1 2020 Q2 2020 Q3 2020 Q4 2020 Q1 2021 0.23% 0.11% 0.06% 0.03% 0.03% 0.35% 0.18% 0.10% 0.06% 0.06% Total Deposit Cost I.B. Deposit Cost Q1 2020 Q2 2020 Q3 2020 Q4 2020 Q1 2021 Deposits $ in millions 1Source: SNL as of 6/30/2020. 2Presented on an annualized basis.
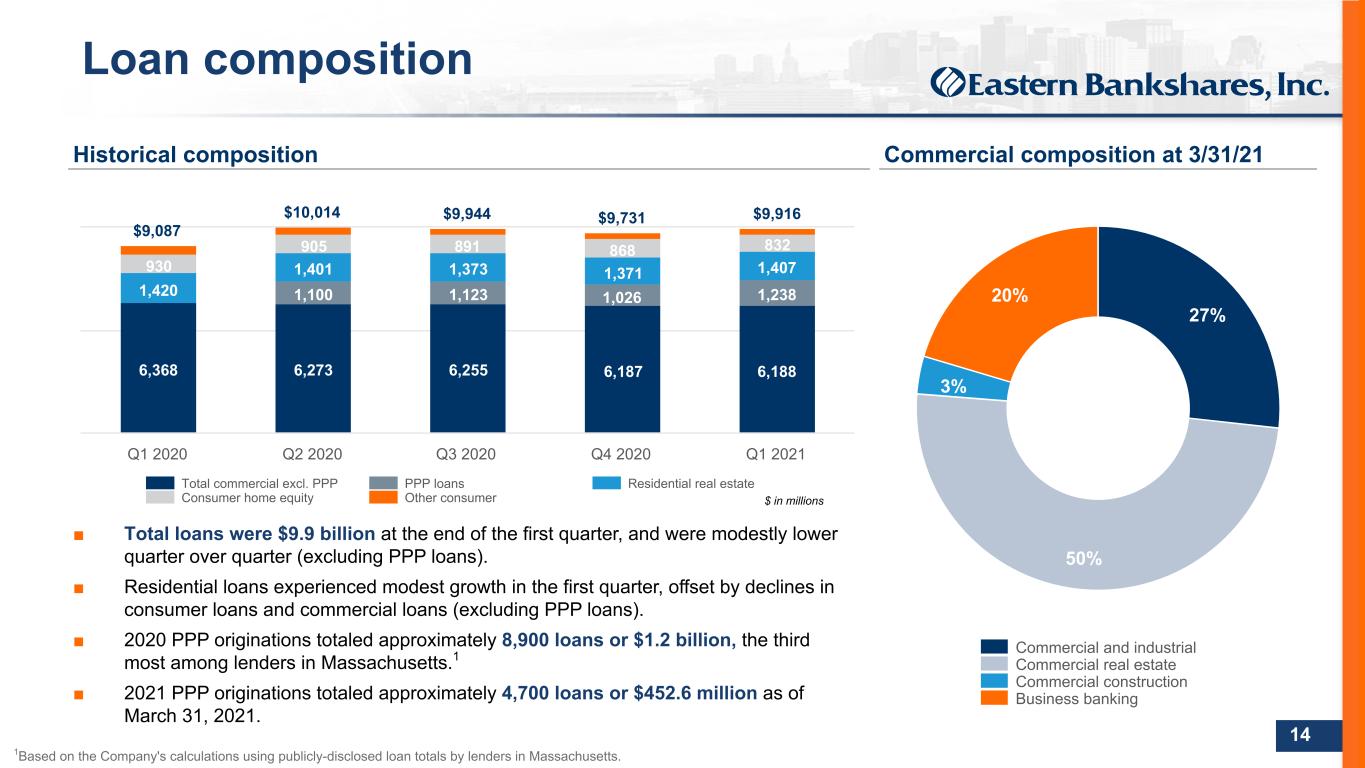
DO NOT REFRESH Color PaletteComplementary 000 / 000 / 051 Body text 074 / 075 / 076 030 / 152 / 213 185 / 197 / 212 023 / 061 / 110 119 / 139 / 154 255 / 107 / 000109 / 110 / 112 237 / 237 / 238 000 / 139 / 151 137 / 139 / 141 197 / 064 / 044 166 / 168 / 171 103 / 086 / 164 208 / 210 / 211 238 / 184 / 028 14 27% 50% 3% 20% Commercial and industrial Commercial real estate Commercial construction Business banking ■ Total loans were $9.9 billion at the end of the first quarter, and were modestly lower quarter over quarter (excluding PPP loans). ■ Residential loans experienced modest growth in the first quarter, offset by declines in consumer loans and commercial loans (excluding PPP loans). ■ 2020 PPP originations totaled approximately 8,900 loans or $1.2 billion, the third most among lenders in Massachusetts.1 ■ 2021 PPP originations totaled approximately 4,700 loans or $452.6 million as of March 31, 2021. Loan composition Commercial composition at 3/31/21 $9,087 $10,014 $9,944 $9,731 $9,916 6,368 6,273 6,255 6,187 6,188 1,100 1,123 1,026 1,2381,420 1,401 1,373 1,371 1,407930 905 891 868 832 Total commercial excl. PPP PPP loans Residential real estate Consumer home equity Other consumer Q1 2020 Q2 2020 Q3 2020 Q4 2020 Q1 2021 Historical composition $ in millions 1Based on the Company's calculations using publicly-disclosed loan totals by lenders in Massachusetts.
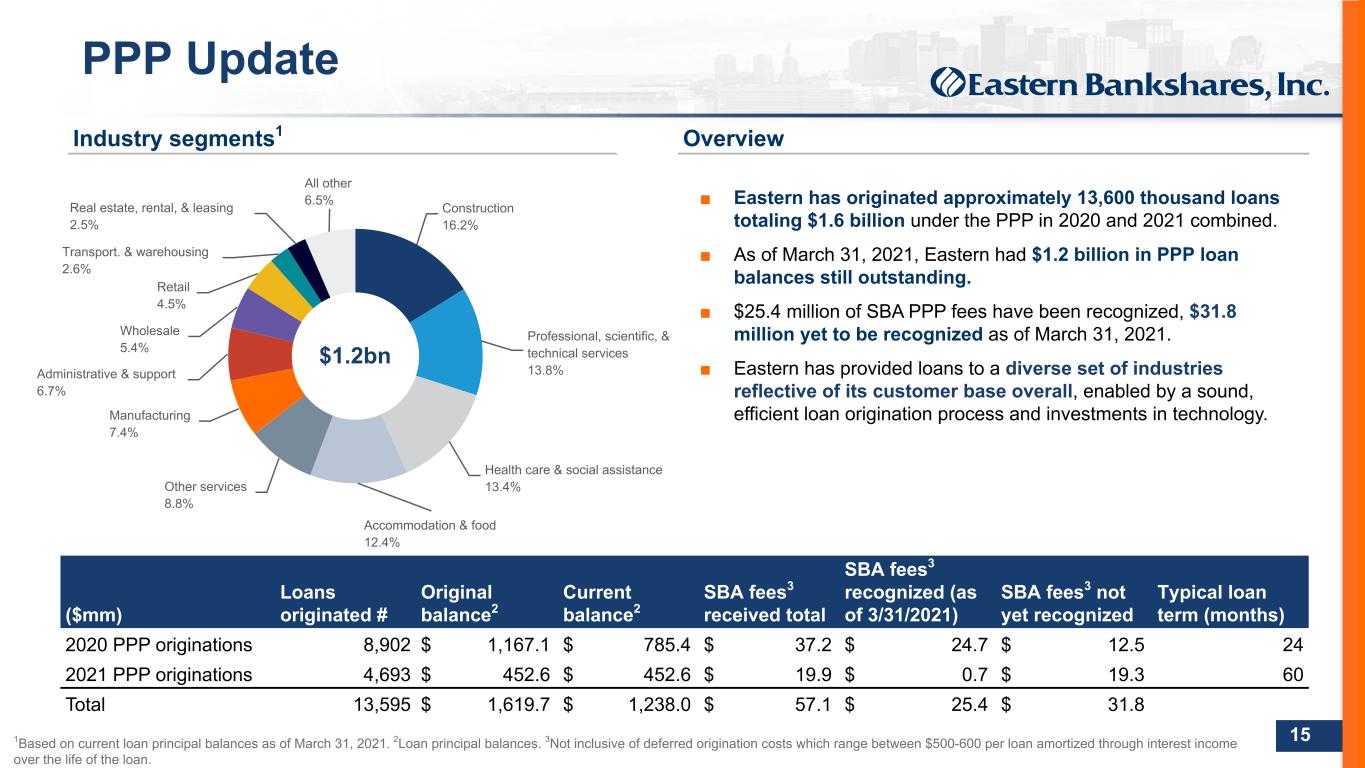
DO NOT REFRESH Color PaletteComplementary 000 / 000 / 051 Body text 074 / 075 / 076 030 / 152 / 213 185 / 197 / 212 023 / 061 / 110 119 / 139 / 154 255 / 107 / 000109 / 110 / 112 237 / 237 / 238 000 / 139 / 151 137 / 139 / 141 197 / 064 / 044 166 / 168 / 171 103 / 086 / 164 208 / 210 / 211 238 / 184 / 028 15 Construction 16.2% Professional, scientific, & technical services 13.8% Health care & social assistance 13.4% Accommodation & food 12.4% Other services 8.8% Manufacturing 7.4% Administrative & support 6.7% Wholesale 5.4% Retail 4.5% Transport. & warehousing 2.6% Real estate, rental, & leasing 2.5% All other 6.5% PPP Update ($mm) Loans originated # Original balance2 Current balance2 SBA fees3 received total SBA fees3 recognized (as of 3/31/2021) SBA fees3 not yet recognized Typical loan term (months) 2020 PPP originations 8,902 $ 1,167.1 $ 785.4 $ 37.2 $ 24.7 $ 12.5 24 2021 PPP originations 4,693 $ 452.6 $ 452.6 $ 19.9 $ 0.7 $ 19.3 60 Total 13,595 $ 1,619.7 $ 1,238.0 $ 57.1 $ 25.4 $ 31.8 Industry segments1 ■ Eastern has originated approximately 13,600 thousand loans totaling $1.6 billion under the PPP in 2020 and 2021 combined. ■ As of March 31, 2021, Eastern had $1.2 billion in PPP loan balances still outstanding. ■ $25.4 million of SBA PPP fees have been recognized, $31.8 million yet to be recognized as of March 31, 2021. ■ Eastern has provided loans to a diverse set of industries reflective of its customer base overall, enabled by a sound, efficient loan origination process and investments in technology. Overview $1.2bn 1Based on current loan principal balances as of March 31, 2021. 2Loan principal balances. 3Not inclusive of deferred origination costs which range between $500-600 per loan amortized through interest income over the life of the loan.
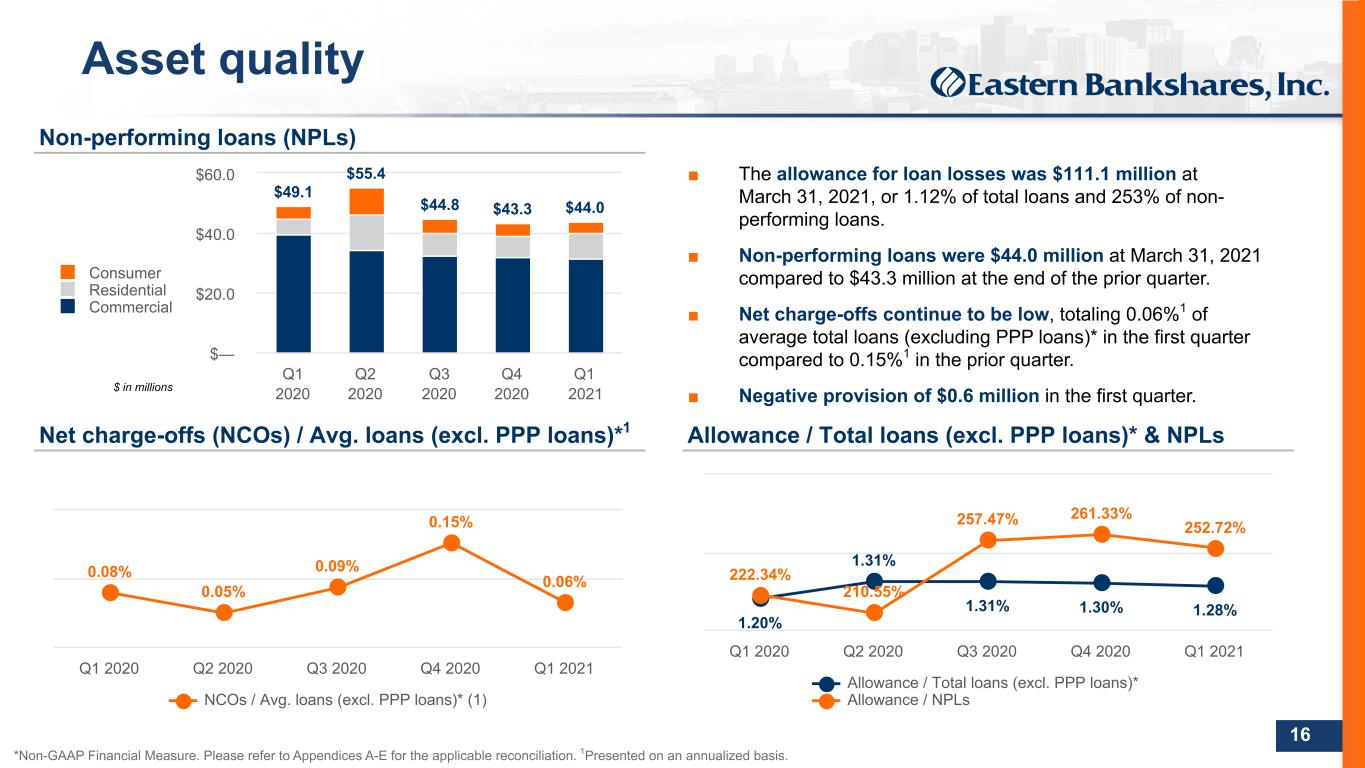
DO NOT REFRESH Color PaletteComplementary 000 / 000 / 051 Body text 074 / 075 / 076 030 / 152 / 213 185 / 197 / 212 023 / 061 / 110 119 / 139 / 154 255 / 107 / 000109 / 110 / 112 237 / 237 / 238 000 / 139 / 151 137 / 139 / 141 197 / 064 / 044 166 / 168 / 171 103 / 086 / 164 208 / 210 / 211 238 / 184 / 028 16 Net charge-offs (NCOs) / Avg. loans (excl. PPP loans)*1 Non-performing loans (NPLs) Allowance / Total loans (excl. PPP loans)* & NPLs 0.08% 0.05% 0.09% 0.15% 0.06% NCOs / Avg. loans (excl. PPP loans)* (1) Q1 2020 Q2 2020 Q3 2020 Q4 2020 Q1 2021 1.20% 1.31% 1.31% 1.30% 1.28% 222.34% 210.55% 257.47% 261.33% 252.72% Allowance / Total loans (excl. PPP loans)* Allowance / NPLs Q1 2020 Q2 2020 Q3 2020 Q4 2020 Q1 2021 $49.1 $55.4 $44.8 $43.3 $44.0 Consumer Residential Commercial Q1 2020 Q2 2020 Q3 2020 Q4 2020 Q1 2021 $— $20.0 $40.0 $60.0 ■ The allowance for loan losses was $111.1 million at March 31, 2021, or 1.12% of total loans and 253% of non- performing loans. ■ Non-performing loans were $44.0 million at March 31, 2021 compared to $43.3 million at the end of the prior quarter. ■ Net charge-offs continue to be low, totaling 0.06%1 of average total loans (excluding PPP loans)* in the first quarter compared to 0.15%1 in the prior quarter. ■ Negative provision of $0.6 million in the first quarter. Asset quality *Non-GAAP Financial Measure. Please refer to Appendices A-E for the applicable reconciliation. 1Presented on an annualized basis. $ in millions
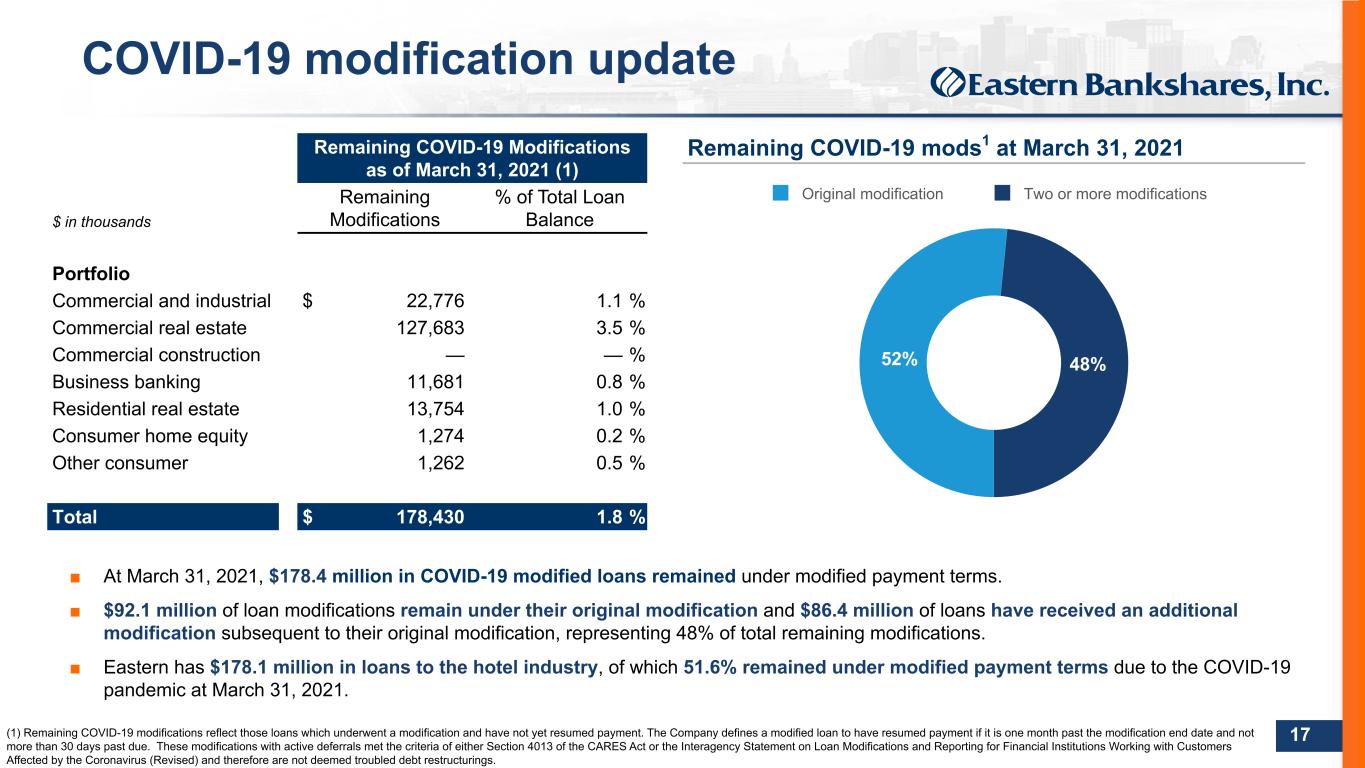
DO NOT REFRESH Color PaletteComplementary 000 / 000 / 051 Body text 074 / 075 / 076 030 / 152 / 213 185 / 197 / 212 023 / 061 / 110 119 / 139 / 154 255 / 107 / 000109 / 110 / 112 237 / 237 / 238 000 / 139 / 151 137 / 139 / 141 197 / 064 / 044 166 / 168 / 171 103 / 086 / 164 208 / 210 / 211 238 / 184 / 028 17 COVID-19 modification update Remaining COVID-19 Modifications as of March 31, 2021 (1) $ in thousands Remaining Modifications % of Total Loan Balance Portfolio Commercial and industrial $ 22,776 1.1 % Commercial real estate 127,683 3.5 % Commercial construction — — % Business banking 11,681 0.8 % Residential real estate 13,754 1.0 % Consumer home equity 1,274 0.2 % Other consumer 1,262 0.5 % Total $ 178,430 1.8 % ■ At March 31, 2021, $178.4 million in COVID-19 modified loans remained under modified payment terms. ■ $92.1 million of loan modifications remain under their original modification and $86.4 million of loans have received an additional modification subsequent to their original modification, representing 48% of total remaining modifications. ■ Eastern has $178.1 million in loans to the hotel industry, of which 51.6% remained under modified payment terms due to the COVID-19 pandemic at March 31, 2021. (1) Remaining COVID-19 modifications reflect those loans which underwent a modification and have not yet resumed payment. The Company defines a modified loan to have resumed payment if it is one month past the modification end date and not more than 30 days past due. These modifications with active deferrals met the criteria of either Section 4013 of the CARES Act or the Interagency Statement on Loan Modifications and Reporting for Financial Institutions Working with Customers Affected by the Coronavirus (Revised) and therefore are not deemed troubled debt restructurings. 52% 48% Original modification Two or more modifications Remaining COVID-19 mods1 at March 31, 2021
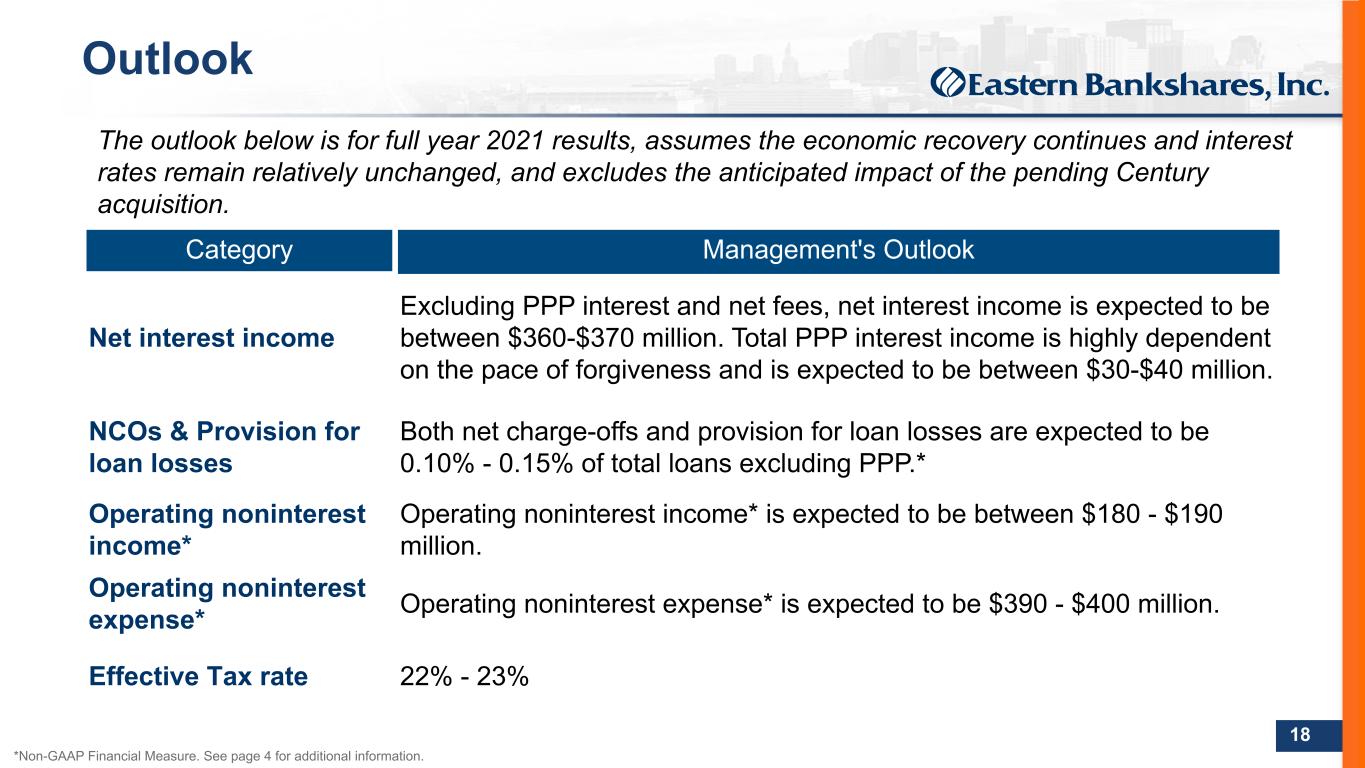
DO NOT REFRESH Color PaletteComplementary 000 / 000 / 051 Body text 074 / 075 / 076 030 / 152 / 213 185 / 197 / 212 023 / 061 / 110 119 / 139 / 154 255 / 107 / 000109 / 110 / 112 237 / 237 / 238 000 / 139 / 151 137 / 139 / 141 197 / 064 / 044 166 / 168 / 171 103 / 086 / 164 208 / 210 / 211 238 / 184 / 028 18 Outlook Category Management's Outlook Net interest income Excluding PPP interest and net fees, net interest income is expected to be between $360-$370 million. Total PPP interest income is highly dependent on the pace of forgiveness and is expected to be between $30-$40 million. NCOs & Provision for loan losses Both net charge-offs and provision for loan losses are expected to be 0.10% - 0.15% of total loans excluding PPP.* Operating noninterest income* Operating noninterest income* is expected to be between $180 - $190 million. Operating noninterest expense* Operating noninterest expense* is expected to be $390 - $400 million. Effective Tax rate 22% - 23% The outlook below is for full year 2021 results, assumes the economic recovery continues and interest rates remain relatively unchanged, and excludes the anticipated impact of the pending Century acquisition. *Non-GAAP Financial Measure. See page 4 for additional information.

DO NOT REFRESH Color PaletteComplementary 000 / 000 / 051 Body text 074 / 075 / 076 030 / 152 / 213 185 / 197 / 212 023 / 061 / 110 119 / 139 / 154 255 / 107 / 000109 / 110 / 112 237 / 237 / 238 000 / 139 / 151 137 / 139 / 141 197 / 064 / 044 166 / 168 / 171 103 / 086 / 164 208 / 210 / 211 238 / 184 / 028 Appendix
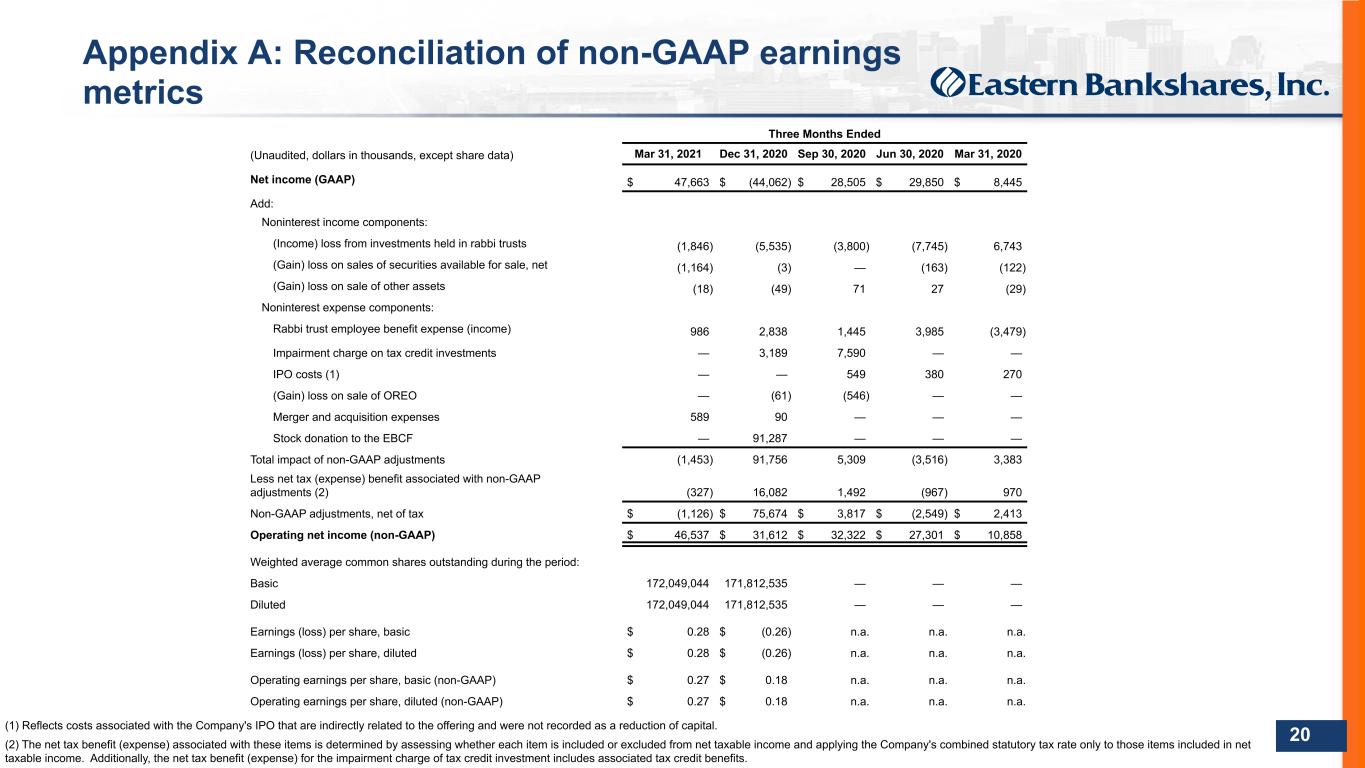
DO NOT REFRESH Color PaletteComplementary 000 / 000 / 051 Body text 074 / 075 / 076 030 / 152 / 213 185 / 197 / 212 023 / 061 / 110 119 / 139 / 154 255 / 107 / 000109 / 110 / 112 237 / 237 / 238 000 / 139 / 151 137 / 139 / 141 197 / 064 / 044 166 / 168 / 171 103 / 086 / 164 208 / 210 / 211 238 / 184 / 028 20 Appendix A: Reconciliation of non-GAAP earnings metrics (1) Reflects costs associated with the Company's IPO that are indirectly related to the offering and were not recorded as a reduction of capital. (2) The net tax benefit (expense) associated with these items is determined by assessing whether each item is included or excluded from net taxable income and applying the Company's combined statutory tax rate only to those items included in net taxable income. Additionally, the net tax benefit (expense) for the impairment charge of tax credit investment includes associated tax credit benefits. Three Months Ended (Unaudited, dollars in thousands, except share data) Mar 31, 2021 Dec 31, 2020 Sep 30, 2020 Jun 30, 2020 Mar 31, 2020 Net income (GAAP) $ 47,663 $ (44,062) $ 28,505 $ 29,850 $ 8,445 Add: Noninterest income components: (Income) loss from investments held in rabbi trusts (1,846) (5,535) (3,800) (7,745) 6,743 (Gain) loss on sales of securities available for sale, net (1,164) (3) — (163) (122) (Gain) loss on sale of other assets (18) (49) 71 27 (29) Noninterest expense components: Rabbi trust employee benefit expense (income) 986 2,838 1,445 3,985 (3,479) Impairment charge on tax credit investments — 3,189 7,590 — — IPO costs (1) — — 549 380 270 (Gain) loss on sale of OREO — (61) (546) — — Merger and acquisition expenses 589 90 — — — Stock donation to the EBCF — 91,287 — — — Total impact of non-GAAP adjustments (1,453) 91,756 5,309 (3,516) 3,383 Less net tax (expense) benefit associated with non-GAAP adjustments (2) (327) 16,082 1,492 (967) 970 Non-GAAP adjustments, net of tax $ (1,126) $ 75,674 $ 3,817 $ (2,549) $ 2,413 Operating net income (non-GAAP) $ 46,537 $ 31,612 $ 32,322 $ 27,301 $ 10,858 Weighted average common shares outstanding during the period: Basic 172,049,044 171,812,535 — — — Diluted 172,049,044 171,812,535 — — — Earnings (loss) per share, basic $ 0.28 $ (0.26) n.a. n.a. n.a. Earnings (loss) per share, diluted $ 0.28 $ (0.26) n.a. n.a. n.a. Operating earnings per share, basic (non-GAAP) $ 0.27 $ 0.18 n.a. n.a. n.a. Operating earnings per share, diluted (non-GAAP) $ 0.27 $ 0.18 n.a. n.a. n.a.
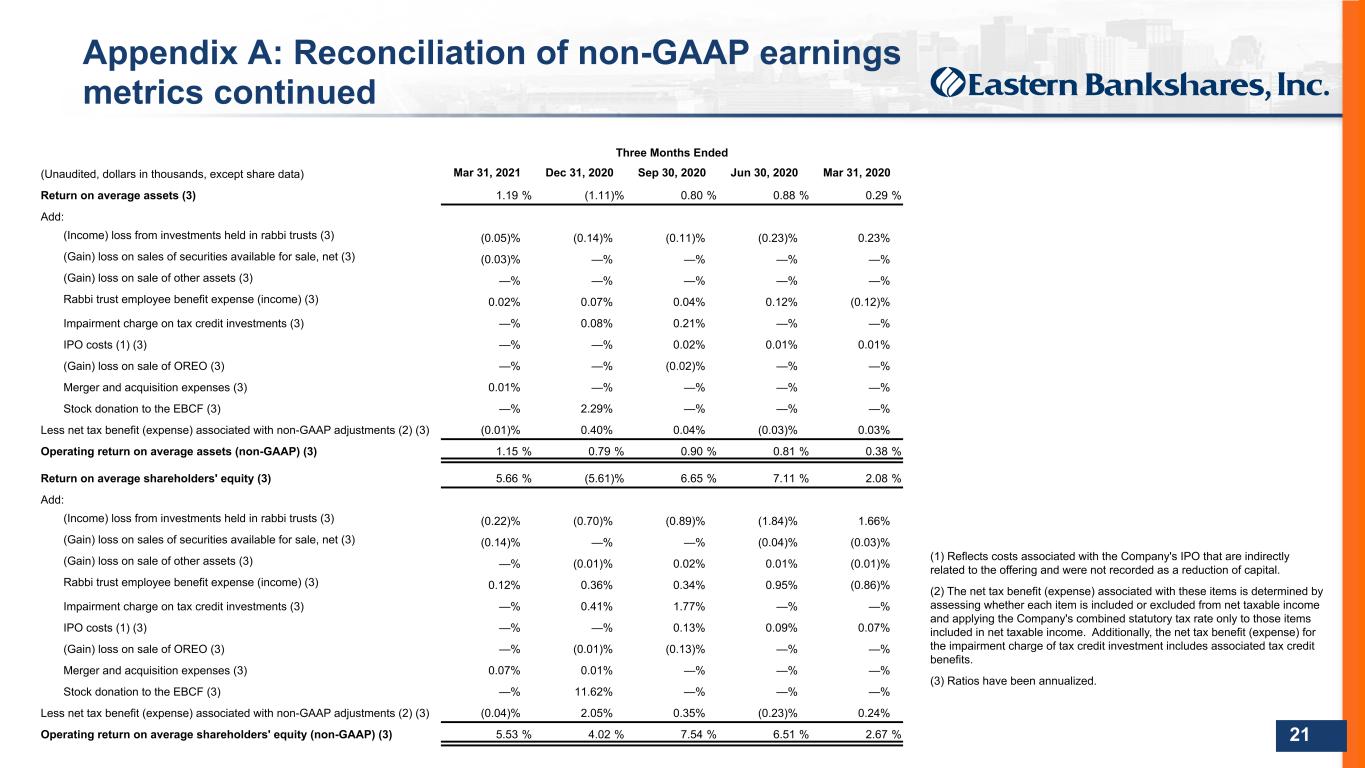
DO NOT REFRESH Color PaletteComplementary 000 / 000 / 051 Body text 074 / 075 / 076 030 / 152 / 213 185 / 197 / 212 023 / 061 / 110 119 / 139 / 154 255 / 107 / 000109 / 110 / 112 237 / 237 / 238 000 / 139 / 151 137 / 139 / 141 197 / 064 / 044 166 / 168 / 171 103 / 086 / 164 208 / 210 / 211 238 / 184 / 028 21 Appendix A: Reconciliation of non-GAAP earnings metrics continued Three Months Ended (Unaudited, dollars in thousands, except share data) Mar 31, 2021 Dec 31, 2020 Sep 30, 2020 Jun 30, 2020 Mar 31, 2020 Return on average assets (3) 1.19 % (1.11) % 0.80 % 0.88 % 0.29 % Add: (Income) loss from investments held in rabbi trusts (3) (0.05) % (0.14) % (0.11) % (0.23) % 0.23 % (Gain) loss on sales of securities available for sale, net (3) (0.03) % — % — % — % — % (Gain) loss on sale of other assets (3) — % — % — % — % — % Rabbi trust employee benefit expense (income) (3) 0.02 % 0.07 % 0.04 % 0.12 % (0.12) % Impairment charge on tax credit investments (3) — % 0.08 % 0.21 % — % — % IPO costs (1) (3) — % — % 0.02 % 0.01 % 0.01 % (Gain) loss on sale of OREO (3) — % — % (0.02) % — % — % Merger and acquisition expenses (3) 0.01 % — % — % — % — % Stock donation to the EBCF (3) — % 2.29 % — % — % — % Less net tax benefit (expense) associated with non-GAAP adjustments (2) (3) (0.01) % 0.40 % 0.04 % (0.03) % 0.03 % Operating return on average assets (non-GAAP) (3) 1.15 % 0.79 % 0.90 % 0.81 % 0.38 % Return on average shareholders' equity (3) 5.66 % (5.61) % 6.65 % 7.11 % 2.08 % Add: (Income) loss from investments held in rabbi trusts (3) (0.22) % (0.70) % (0.89) % (1.84) % 1.66 % (Gain) loss on sales of securities available for sale, net (3) (0.14) % — % — % (0.04) % (0.03) % (Gain) loss on sale of other assets (3) — % (0.01) % 0.02 % 0.01 % (0.01) % Rabbi trust employee benefit expense (income) (3) 0.12 % 0.36 % 0.34 % 0.95 % (0.86) % Impairment charge on tax credit investments (3) — % 0.41 % 1.77 % — % — % IPO costs (1) (3) — % — % 0.13 % 0.09 % 0.07 % (Gain) loss on sale of OREO (3) — % (0.01) % (0.13) % — % — % Merger and acquisition expenses (3) 0.07 % 0.01 % — % — % — % Stock donation to the EBCF (3) — % 11.62 % — % — % — % Less net tax benefit (expense) associated with non-GAAP adjustments (2) (3) (0.04) % 2.05 % 0.35 % (0.23) % 0.24 % Operating return on average shareholders' equity (non-GAAP) (3) 5.53 % 4.02 % 7.54 % 6.51 % 2.67 % (1) Reflects costs associated with the Company's IPO that are indirectly related to the offering and were not recorded as a reduction of capital. (2) The net tax benefit (expense) associated with these items is determined by assessing whether each item is included or excluded from net taxable income and applying the Company's combined statutory tax rate only to those items included in net taxable income. Additionally, the net tax benefit (expense) for the impairment charge of tax credit investment includes associated tax credit benefits. (3) Ratios have been annualized.
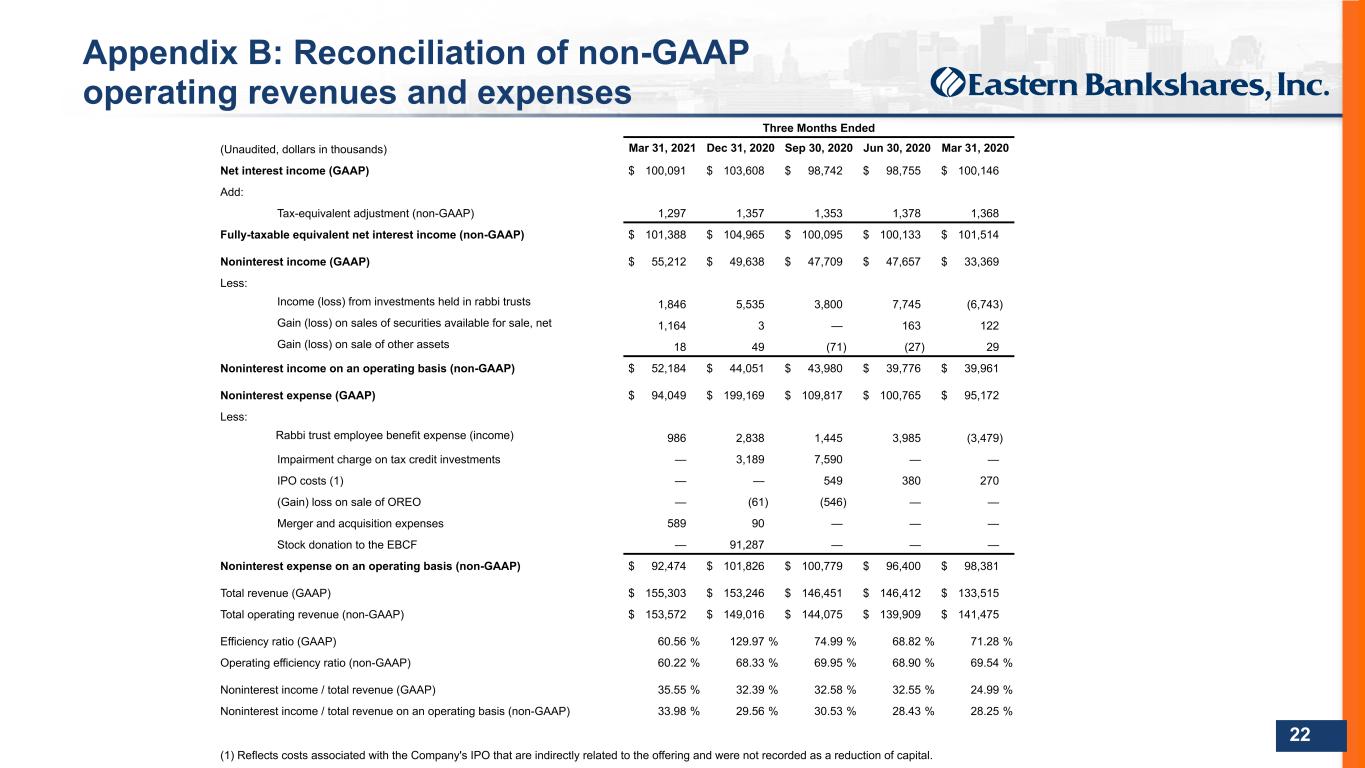
DO NOT REFRESH Color PaletteComplementary 000 / 000 / 051 Body text 074 / 075 / 076 030 / 152 / 213 185 / 197 / 212 023 / 061 / 110 119 / 139 / 154 255 / 107 / 000109 / 110 / 112 237 / 237 / 238 000 / 139 / 151 137 / 139 / 141 197 / 064 / 044 166 / 168 / 171 103 / 086 / 164 208 / 210 / 211 238 / 184 / 028 22 Appendix B: Reconciliation of non-GAAP operating revenues and expenses Three Months Ended (Unaudited, dollars in thousands) Mar 31, 2021 Dec 31, 2020 Sep 30, 2020 Jun 30, 2020 Mar 31, 2020 Net interest income (GAAP) $ 100,091 $ 103,608 $ 98,742 $ 98,755 $ 100,146 Add: Tax-equivalent adjustment (non-GAAP) 1,297 1,357 1,353 1,378 1,368 Fully-taxable equivalent net interest income (non-GAAP) $ 101,388 $ 104,965 $ 100,095 $ 100,133 $ 101,514 Noninterest income (GAAP) $ 55,212 $ 49,638 $ 47,709 $ 47,657 $ 33,369 Less: Income (loss) from investments held in rabbi trusts 1,846 5,535 3,800 7,745 (6,743) Gain (loss) on sales of securities available for sale, net 1,164 3 — 163 122 Gain (loss) on sale of other assets 18 49 (71) (27) 29 Noninterest income on an operating basis (non-GAAP) $ 52,184 $ 44,051 $ 43,980 $ 39,776 $ 39,961 Noninterest expense (GAAP) $ 94,049 $ 199,169 $ 109,817 $ 100,765 $ 95,172 Less: Rabbi trust employee benefit expense (income) 986 2,838 1,445 3,985 (3,479) Impairment charge on tax credit investments — 3,189 7,590 — — IPO costs (1) — — 549 380 270 (Gain) loss on sale of OREO — (61) (546) — — Merger and acquisition expenses 589 90 — — — Stock donation to the EBCF — 91,287 — — — Noninterest expense on an operating basis (non-GAAP) $ 92,474 $ 101,826 $ 100,779 $ 96,400 $ 98,381 Total revenue (GAAP) $ 155,303 $ 153,246 $ 146,451 $ 146,412 $ 133,515 Total operating revenue (non-GAAP) $ 153,572 $ 149,016 $ 144,075 $ 139,909 $ 141,475 Efficiency ratio (GAAP) 60.56 % 129.97 % 74.99 % 68.82 % 71.28 % Operating efficiency ratio (non-GAAP) 60.22 % 68.33 % 69.95 % 68.90 % 69.54 % Noninterest income / total revenue (GAAP) 35.55 % 32.39 % 32.58 % 32.55 % 24.99 % Noninterest income / total revenue on an operating basis (non-GAAP) 33.98 % 29.56 % 30.53 % 28.43 % 28.25 % (1) Reflects costs associated with the Company's IPO that are indirectly related to the offering and were not recorded as a reduction of capital.
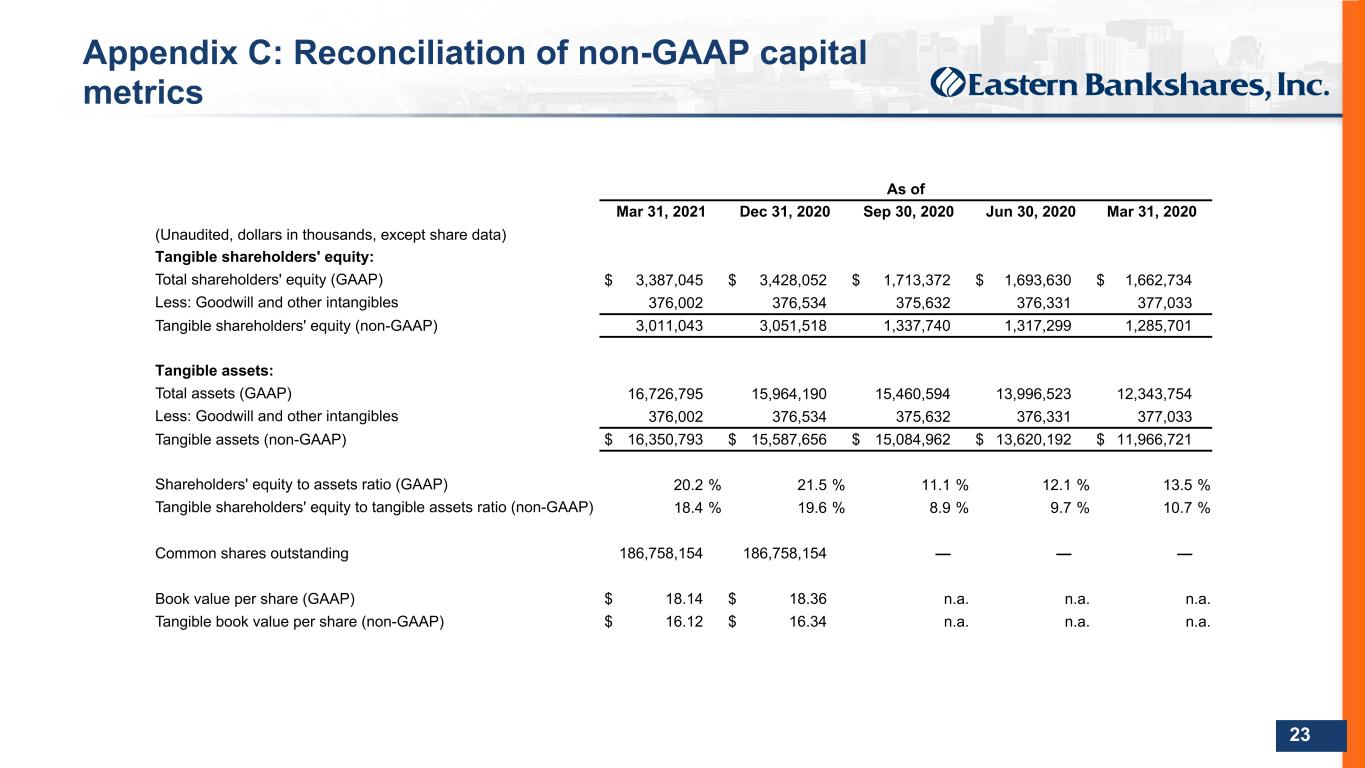
DO NOT REFRESH Color PaletteComplementary 000 / 000 / 051 Body text 074 / 075 / 076 030 / 152 / 213 185 / 197 / 212 023 / 061 / 110 119 / 139 / 154 255 / 107 / 000109 / 110 / 112 237 / 237 / 238 000 / 139 / 151 137 / 139 / 141 197 / 064 / 044 166 / 168 / 171 103 / 086 / 164 208 / 210 / 211 238 / 184 / 028 23 Appendix C: Reconciliation of non-GAAP capital metrics As of Mar 31, 2021 Dec 31, 2020 Sep 30, 2020 Jun 30, 2020 Mar 31, 2020 (Unaudited, dollars in thousands, except share data) Tangible shareholders' equity: Total shareholders' equity (GAAP) $ 3,387,045 $ 3,428,052 $ 1,713,372 $ 1,693,630 $ 1,662,734 Less: Goodwill and other intangibles 376,002 376,534 375,632 376,331 377,033 Tangible shareholders' equity (non-GAAP) 3,011,043 3,051,518 1,337,740 1,317,299 1,285,701 Tangible assets: Total assets (GAAP) 16,726,795 15,964,190 15,460,594 13,996,523 12,343,754 Less: Goodwill and other intangibles 376,002 376,534 375,632 376,331 377,033 Tangible assets (non-GAAP) $ 16,350,793 $ 15,587,656 $ 15,084,962 $ 13,620,192 $ 11,966,721 Shareholders' equity to assets ratio (GAAP) 20.2 % 21.5 % 11.1 % 12.1 % 13.5 % Tangible shareholders' equity to tangible assets ratio (non-GAAP) 18.4 % 19.6 % 8.9 % 9.7 % 10.7 % Common shares outstanding 186,758,154 186,758,154 — — — Book value per share (GAAP) $ 18.14 $ 18.36 n.a. n.a. n.a. Tangible book value per share (non-GAAP) $ 16.12 $ 16.34 n.a. n.a. n.a.
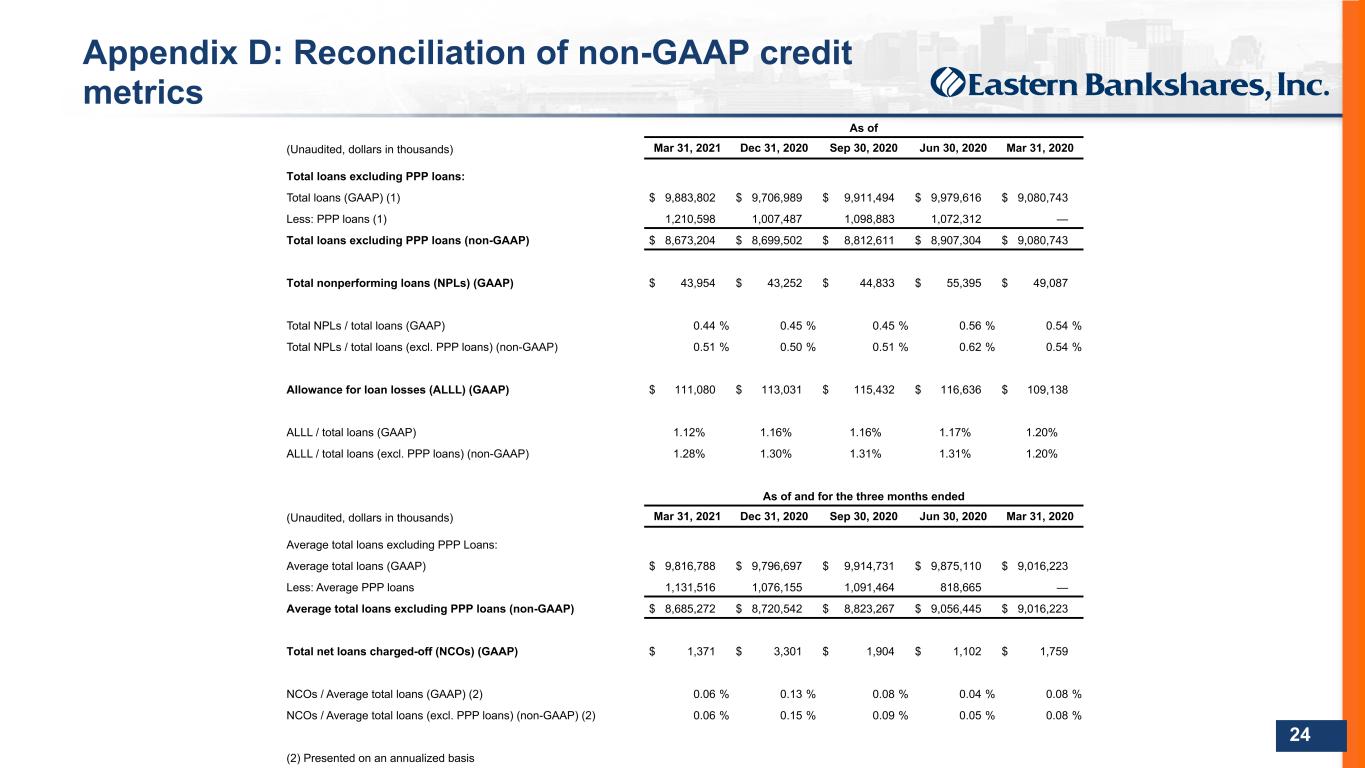
DO NOT REFRESH Color PaletteComplementary 000 / 000 / 051 Body text 074 / 075 / 076 030 / 152 / 213 185 / 197 / 212 023 / 061 / 110 119 / 139 / 154 255 / 107 / 000109 / 110 / 112 237 / 237 / 238 000 / 139 / 151 137 / 139 / 141 197 / 064 / 044 166 / 168 / 171 103 / 086 / 164 208 / 210 / 211 238 / 184 / 028 24 Appendix D: Reconciliation of non-GAAP credit metrics As of (Unaudited, dollars in thousands) Mar 31, 2021 Dec 31, 2020 Sep 30, 2020 Jun 30, 2020 Mar 31, 2020 Total loans excluding PPP loans: Total loans (GAAP) (1) $ 9,883,802 $ 9,706,989 $ 9,911,494 $ 9,979,616 $ 9,080,743 Less: PPP loans (1) 1,210,598 1,007,487 1,098,883 1,072,312 — Total loans excluding PPP loans (non-GAAP) $ 8,673,204 $ 8,699,502 $ 8,812,611 $ 8,907,304 $ 9,080,743 Total nonperforming loans (NPLs) (GAAP) $ 43,954 $ 43,252 $ 44,833 $ 55,395 $ 49,087 Total NPLs / total loans (GAAP) 0.44 % 0.45 % 0.45 % 0.56 % 0.54 % Total NPLs / total loans (excl. PPP loans) (non-GAAP) 0.51 % 0.50 % 0.51 % 0.62 % 0.54 % Allowance for loan losses (ALLL) (GAAP) $ 111,080 $ 113,031 $ 115,432 $ 116,636 $ 109,138 ALLL / total loans (GAAP) 1.12% 1.16% 1.16% 1.17% 1.20% ALLL / total loans (excl. PPP loans) (non-GAAP) 1.28% 1.30% 1.31% 1.31% 1.20% As of and for the three months ended (Unaudited, dollars in thousands) Mar 31, 2021 Dec 31, 2020 Sep 30, 2020 Jun 30, 2020 Mar 31, 2020 Average total loans excluding PPP Loans: Average total loans (GAAP) $ 9,816,788 $ 9,796,697 $ 9,914,731 $ 9,875,110 $ 9,016,223 Less: Average PPP loans 1,131,516 1,076,155 1,091,464 818,665 — Average total loans excluding PPP loans (non-GAAP) $ 8,685,272 $ 8,720,542 $ 8,823,267 $ 9,056,445 $ 9,016,223 Total net loans charged-off (NCOs) (GAAP) $ 1,371 $ 3,301 $ 1,904 $ 1,102 $ 1,759 NCOs / Average total loans (GAAP) (2) 0.06 % 0.13 % 0.08 % 0.04 % 0.08 % NCOs / Average total loans (excl. PPP loans) (non-GAAP) (2) 0.06 % 0.15 % 0.09 % 0.05 % 0.08 % (2) Presented on an annualized basis
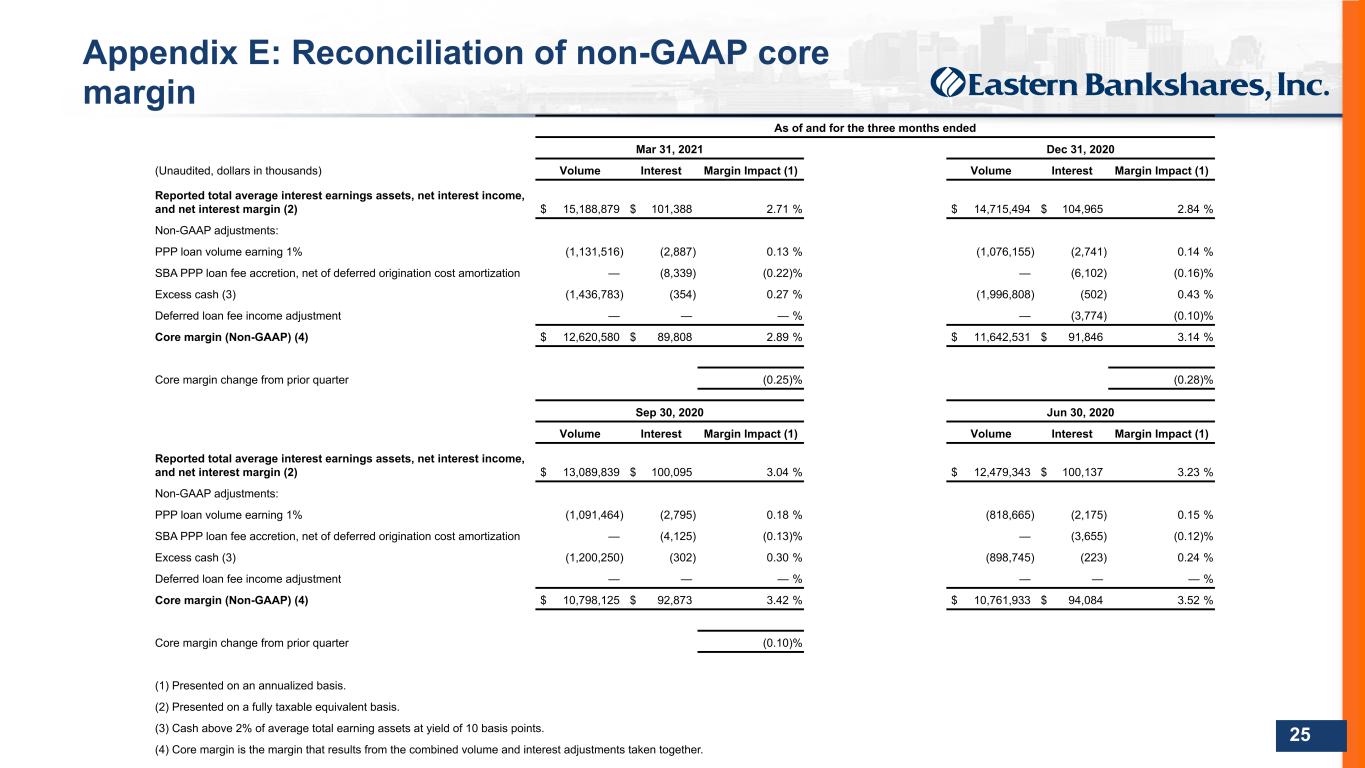
DO NOT REFRESH Color PaletteComplementary 000 / 000 / 051 Body text 074 / 075 / 076 030 / 152 / 213 185 / 197 / 212 023 / 061 / 110 119 / 139 / 154 255 / 107 / 000109 / 110 / 112 237 / 237 / 238 000 / 139 / 151 137 / 139 / 141 197 / 064 / 044 166 / 168 / 171 103 / 086 / 164 208 / 210 / 211 238 / 184 / 028 25 Appendix E: Reconciliation of non-GAAP core margin As of and for the three months ended Mar 31, 2021 Dec 31, 2020 (Unaudited, dollars in thousands) Volume Interest Margin Impact (1) Volume Interest Margin Impact (1) Reported total average interest earnings assets, net interest income, and net interest margin (2) $ 15,188,879 $ 101,388 2.71 % $ 14,715,494 $ 104,965 2.84 % Non-GAAP adjustments: PPP loan volume earning 1% (1,131,516) (2,887) 0.13 % (1,076,155) (2,741) 0.14 % SBA PPP loan fee accretion, net of deferred origination cost amortization — (8,339) (0.22) % — (6,102) (0.16) % Excess cash (3) (1,436,783) (354) 0.27 % (1,996,808) (502) 0.43 % Deferred loan fee income adjustment — — — % — (3,774) (0.10) % Core margin (Non-GAAP) (4) $ 12,620,580 $ 89,808 2.89 % $ 11,642,531 $ 91,846 3.14 % Core margin change from prior quarter (0.25) % (0.28) % Sep 30, 2020 Jun 30, 2020 Volume Interest Margin Impact (1) Volume Interest Margin Impact (1) Reported total average interest earnings assets, net interest income, and net interest margin (2) $ 13,089,839 $ 100,095 3.04 % $ 12,479,343 $ 100,137 3.23 % Non-GAAP adjustments: PPP loan volume earning 1% (1,091,464) (2,795) 0.18 % (818,665) (2,175) 0.15 % SBA PPP loan fee accretion, net of deferred origination cost amortization — (4,125) (0.13) % — (3,655) (0.12) % Excess cash (3) (1,200,250) (302) 0.30 % (898,745) (223) 0.24 % Deferred loan fee income adjustment — — — % — — — % Core margin (Non-GAAP) (4) $ 10,798,125 $ 92,873 3.42 % $ 10,761,933 $ 94,084 3.52 % Core margin change from prior quarter (0.10) % (1) Presented on an annualized basis. (2) Presented on a fully taxable equivalent basis. (3) Cash above 2% of average total earning assets at yield of 10 basis points. (4) Core margin is the margin that results from the combined volume and interest adjustments taken together.