
Biosciences Spin-OffAugust 6, 2015 Daniel J. Abdun-NabiPresident and CEO
Safe Harbor Statement 2 This presentation includes forward-looking statements within the meaning of the Private Securities Litigation Reform Act of 1995. Any statements, other than statements of historical fact, including, without limitation, statements regarding our financial guidance, statements regarding the planned spin-off of our biosciences business, the timing of any such spin-off, the future earnings and performance of Emergent or any of its businesses, including the biodefense and biosciences businesses on a standalone basis if the spin-off is completed, and any other statements containing the words “believes”, “expects”, “anticipates”, “intends”, “plans”, “forecasts”, “estimates” and similar expressions in conjunction with, among other things, discussions of financial performance or financial condition, strategy, product sales, manufacturing capabilities, product development, regulatory approvals or expenditures are forward-looking statements. These forward-looking statements are based on our current intentions, beliefs and expectations regarding future events. We cannot guarantee that any forward-looking statement will be accurate. Investors should realize that if underlying assumptions prove inaccurate or unknown risks or uncertainties materialize, actual results could differ materially from our expectations. Investors are, therefore, cautioned not to place undue reliance on any forward-looking statement. Any forward-looking statement speaks only as of the date of this presentation, and, except as required by law, we do not undertake to update any forward-looking statement to reflect new information, events or circumstances.There are a number of important factors that could cause the company’s actual results to differ materially from those indicated by such forward-looking statements, including whether the planned spin-off of the biosciences business is completed, as expected or at all, and the timing of any such spin-off; whether the conditions to the spin-off can be satisfied; whether the operational, marketing and strategic benefits of the spin-off can be achieved; whether the costs and expenses of the spin-off can be controlled within expectations; appropriations for BioThrax procurement; our ability to perform under our contracts with the U.S. government related to BioThrax, including the timing of deliveries; our ability to obtain new BioThrax sales contracts or modifications to existing contracts; the availability of funding for our U.S. government grants and contracts; our ability to successfully execute our growth strategy and achieve our financial and operational goals; our ability to successfully integrate and develop the products or product candidates, programs, operations and personnel of any entities or businesses that we acquire; our ability to perform under our contract with the U.S. government to develop and obtain regulatory approval for large-scale manufacturing of BioThrax in Building 55, our large-scale vaccine manufacturing facility in Lansing, Michigan; our ability to identify and acquire companies or in-license products or late-stage product candidates that satisfy our selection criteria; our ability to realize synergies and benefits from acquisitions or in-licenses within expected time periods or at all; our ability to selectively enter into collaboration arrangements; our ability to achieve milestones in our out-license and collaboration contracts; our ability to obtain and maintain intellectual property protection for our products and product candidates; our ability and plans to expand our manufacturing facilities and capabilities; our ability and the ability of our contractors and suppliers to maintain compliance with cGMP and other regulatory obligations; the results of regulatory inspections; our ability to meet operating and financial restrictions placed on us and our subsidiaries under our senior secured credit facility; the rate and degree of market acceptance and clinical utility of our products; the success of our ongoing and planned development programs, non-clinical activities and clinical trials of our product candidates; the timing of and our ability to obtain and maintain regulatory approvals for our product candidates; the success of our commercialization, marketing and manufacturing capabilities and strategy; and the accuracy of our estimates regarding future revenues, expenses, capital requirements and needs for additional financing.The foregoing sets forth many, but not all, of the factors that could cause actual results to differ from our expectations in any forward-looking statement. Investors should consider this cautionary statement, as well as the risk factors identified in our periodic reports filed with the SEC, when evaluating our forward-looking statements.

3 Plan to Spin-off Biosciences Business Overview Description Board of Directors has authorized management to pursue a tax-free spin-off of the company’s Biosciences business into a separate, stand-alone publicly-traded company (SpinCo) Outcome Separation is expected to create two independent public companies with distinct strategic plans, growth strategies, and operational and development priorities Emergent BioSolutions (after spin-off) Emergent will remain a global specialty biopharmaceutical company focused on providing specialty products for civilian and military populations that address intentional and naturally emerging public health threats Spin-off Entity (SpinCo) SpinCo will:Advance a portfolio of immuno-oncology therapeutics based on its proprietary ADAPTIR platform technologyReceive a fixed cash contribution from Emergent, ongoing revenues from its existing commercial products, and partnership fundingBe managed by a dedicated and separate management team and board of directors Timing Spin-off is anticipated to be completed in mid-2016

4 Compelling For Both Companies & Shareholders Strategic Business Rationale Enables each company to:Tailor business strategies to best address opportunities within its target marketEnhance business focus and better align resources to achieve strategic prioritiesPursue distinct capital structures and capital allocation strategiesTarget an investor base attracted to its business profile

5 Benefits to Emergent Strategic Business Rationale Establishes Emergent as a “pure play” company, recognized as a leader in the biodefense and emerging infectious diseases fieldsEnhances its financial returns/operating margins Reduces burdens on cash flow associated with oncology R&DEliminates sales, marketing and G&A costs associated with biosciences businessAllows greater flexibility in capital allocation including:Acquisitions that are synergistic with the core business Consideration of stock buybacks / dividends

6 Management team to remain in place: CEO ∙ Daniel Abdun-NabiCFO ∙ Robert Kramer Comprehensive capabilities Flexible technologiesInspected and approved by regulatory agencies from the US, EU, JapanInternational distribution and sales cGMP ManufacturingFill/Finish CMO Services Lan Hatt Cam Win USA-MI Canada USA-MS USA-MD Bay USA-MD A global specialty biopharmaceutical company focused on providing specialty products for civilian and military populations that address intentional and naturally emerging public health threats Chemical, Biological, Radiological, Nuclear, Explosive C B R N E BioThrax® BAT® VIGIV Anthrasil™ RSDL® Emergard™2 Vaccines Therapeutics Diagnostics Devices Detection Market Opportunities:$5.7B USG annually (2011-13)1 for MCMsInternational market potential Emerging Infectious Diseases E I D Clinical Candidates: Manufacturing & Commercial Ops Markets Marketed Products Pipeline Preclinical Candidates: Medical Countermeasure Portfolio Leadership Company Profile Post-spin 1 “Federal Agency Biodefense Funding, FY2013-FY2014” Sell and Watson, Biosecurity and Bioterrorism Vol 11, Num 3, 20132 Emergard is not FDA-approved and not marketed in the U.S.3 Collaboration with GSK, Oxford University, and NIAID4 Pandemic influenza vaccine licensed from VaxInnate MVAtor™ Platform Technologies Recombinant, live, attenuatedviral vector for vaccines Hyperimmunes Purified, antigen-specific immune globulin fragments derived from fractionated plasma Emergard™ Ruggedized, military-grade auto-injector device NuThrax™ PreviThrax™ MVA Ebola3 EV-035 Series VAX161C4

7 Enhanced Financial Performance Emergent Financial Profile Continued Revenue Growth Organic and M&AProduct salesContracts, grants and collaborationsCMO revenue, including the manufacture of products for SpinCo Enhanced Balance Sheet Allows pursuit of optimal capital deployment opportunitiesTargeted R&D aligned with recognized core focus and capabilitiesAcquisitions that are synergistic with the core business Consideration of stock buybacks / dividends Reduced Cost Structure Enhances EBITDAElimination of oncology R&DElimination of selling and marketing expenses for commercial productsElimination of the G&A costs within the bioscience business Reduced cost structure increases EBITDA $40-50M (pro forma estimate based on 2014 results)
8 Benefits to SpinCo Strategic Business Rationale Establishes SpinCo as a “pure play” biopharmaceutical company in the highly attractive field of immuno-oncologyTargets investments and operations in the development of bi-specific therapeutics using the proprietary ADAPTIR platform technologyEnables increased awareness of ADAPTIR’s RTCC mechanism of action, a promising approach within immuno-oncologyProvides greater visibility into its innovative platform technology and product candidates for potential collaborators

9 A biopharmaceutical company focused on novel oncology and hematology therapeutics to meaningfully improve patients’ lives Company Profile SpinCo Product/Candidate Indication Pre-Clinical Clinical Development Stage Marketed Phase I Phase II Phase III IXINITY Hemophilia B WinRho ITP HepaGam B HBV VARIZIG Varicella Otlertuzumab CLL MOR209/ES414 mCRPC ES210 IBD Additional ADAPTIR Candidates Immuno-oncology 5E3 Alzheimer’s Disease Leadership & Headquarters CEO: Marvin WhiteCurrent Emergent DirectorFormer leadership positions include CFO at St. Vincent’s HealthExecutive Director and CFO of Lilly USA,Positions in Corporate Finance at Eli LillyRemaining management team and board of directors to be identified laterHeadquarters located in Seattle, WA ADAPTIR™ Platform Technology Bi-specific oncology immuno-therapeutics Research & Development R&D, Commercial Operations Product development in Seattle, WA Commercial Operations Sales and marketing in Berwyn, PA
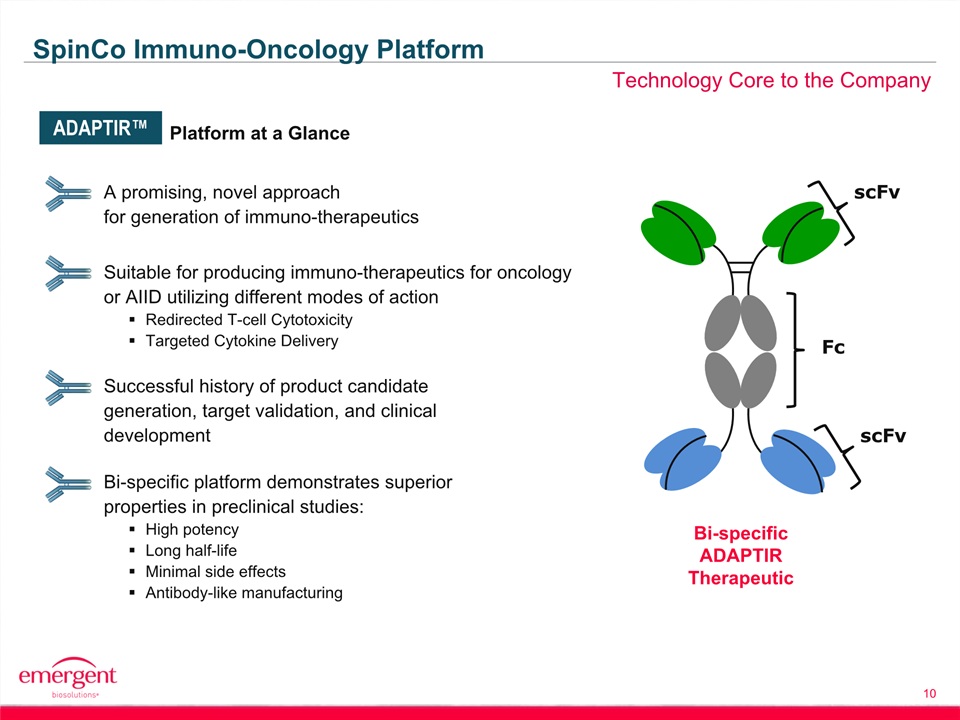
10 Technology Core to the Company SpinCo Immuno-Oncology Platform A promising, novel approachfor generation of immuno-therapeutics Suitable for producing immuno-therapeutics for oncology or AIID utilizing different modes of actionRedirected T-cell CytotoxicityTargeted Cytokine Delivery Successful history of product candidate generation, target validation, and clinical development Bi-specific platform demonstrates superior properties in preclinical studies:High potencyLong half-lifeMinimal side effectsAntibody-like manufacturing Platform at a Glance Fc scFv scFv ADAPTIR™ Bi-specificADAPTIRTherapeutic
11 Fixed cash contribution from Emergent of $50M-$70M R&D investment partially offset by:Growing contribution from IXINITYStable contribution from mature products: WinRho, HepaGam B, VARIZIGFunding from existing MOR209/ES414 partnershipPositioned for future funding to support development programs New collaborations Capital markets Capitalized to Create Value SpinCo Financial Profile

12 Biosciences Business Spin-off Transaction Details Structure Tax-free distribution to Emergent shareholders of common stock of SpinCoStock distribution ratio to be determined Timing Transaction anticipated to be completed in mid-2016 (subject to closing conditions) Naming Corporate name for SpinCo to be announced at later dateEmergent BioSolutions will retain its name Costs Emergent expects to incur transaction-related expenses of $2M to $4M during 2015, which are included in our reaffirmed 2015 financial guidanceAdditional costs expected in 2016 leading up to the spin-off Closing Conditions Receipt of a favorable opinion from outside tax counsel and private letter ruling from the Internal Revenue ServiceExecution of inter-company agreements by Emergent and SpinCoEffectiveness of the Form 10 registration statementFinal approval of the transaction by Emergent’s board of directors

13 Biosciences Business Spin-off Summary Spin-off is expected to create two independent public companies with distinct strategic plans, growth strategies, and operational and development priorities Enables Emergent to establish itself as a “pure play” company in the biodefense and emerging infectious diseases fieldsEnables SpinCo to establish itself as a “pure play” company in the highly attractive immuno-oncology fieldEnables each company to target an investor base attracted to its business profile
Biosciences Spin-OffAugust 6, 2015 Daniel J. Abdun-NabiPresident and CEO