Exhibit 99.1

Enhabit Reports Second Quarter 2024 Financial Results
Company to host a conference call tomorrow, August 7, 2024, at 10 a.m. EDT
DALLAS, TX – August 6, 2024 – Enhabit, Inc. (NYSE: EHAB), a leading home health and hospice care provider, today reported its results of operations for the second quarter ended June 30, 2024.
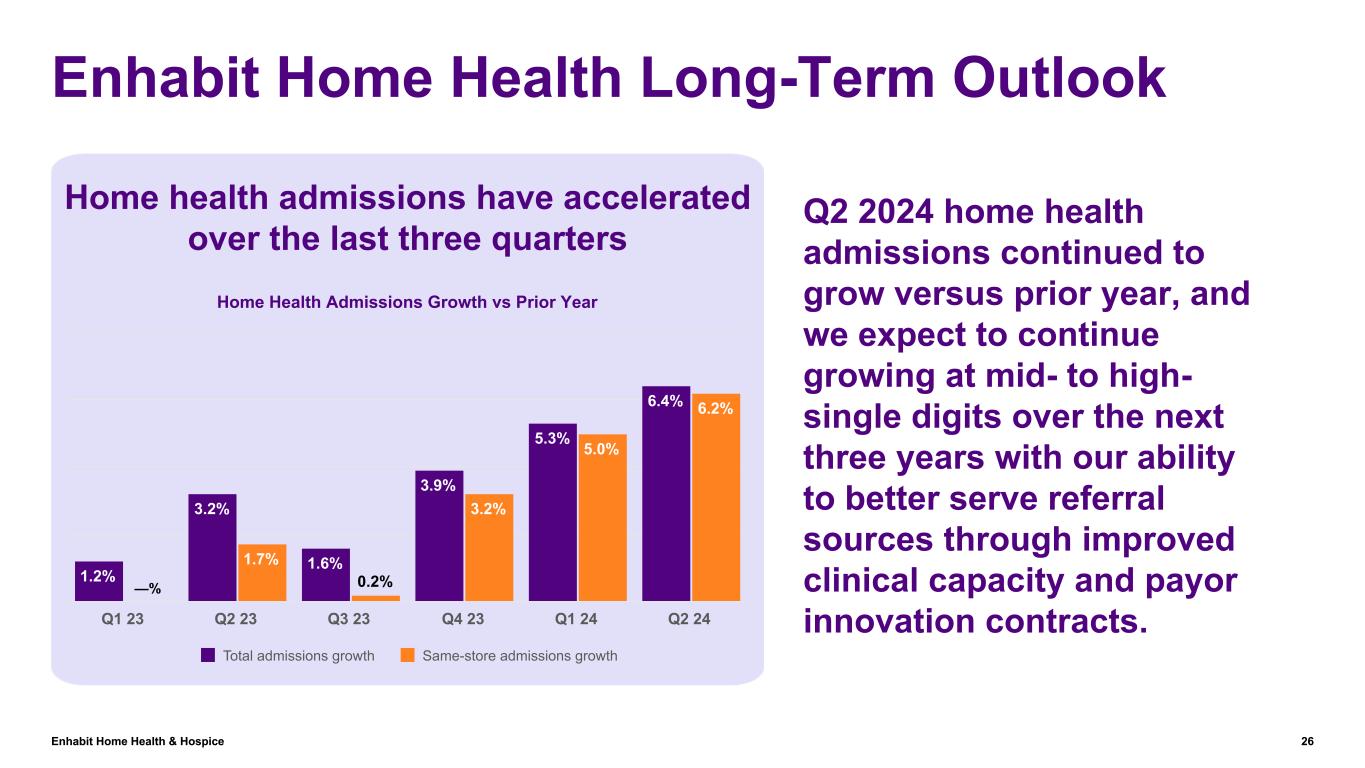
“The second quarter marked our third sequential quarter demonstrating the success of our strategies,” said Enhabit’s President and Chief Executive Officer Barb Jacobsmeyer. “In our home health segment, our total admissions growth of 6.4% was driven by our payor innovation strategy and our focus on improved utilization of our clinical resources. In our hospice segment, we continued to make steady progress in growing our census, with average daily census increasing each month since January 2024. Our focus on recruitment and retention continues to position us for long-term growth, and we remain confident in the long-range growth potential for Enhabit.”
QUARTERLY PERFORMANCE - CONSOLIDATED
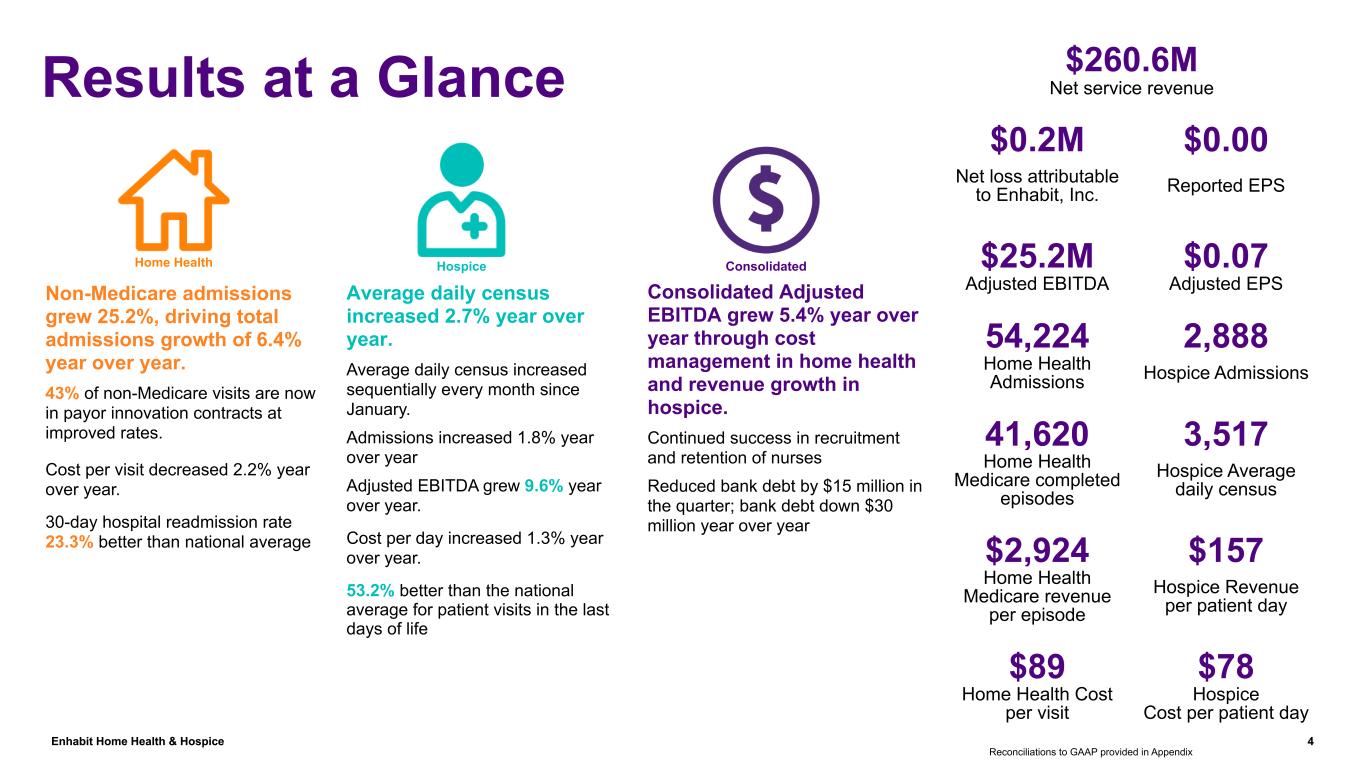
•Net service revenue of $260.6 million
•Net loss attributable to Enhabit, Inc. of $0.2 million
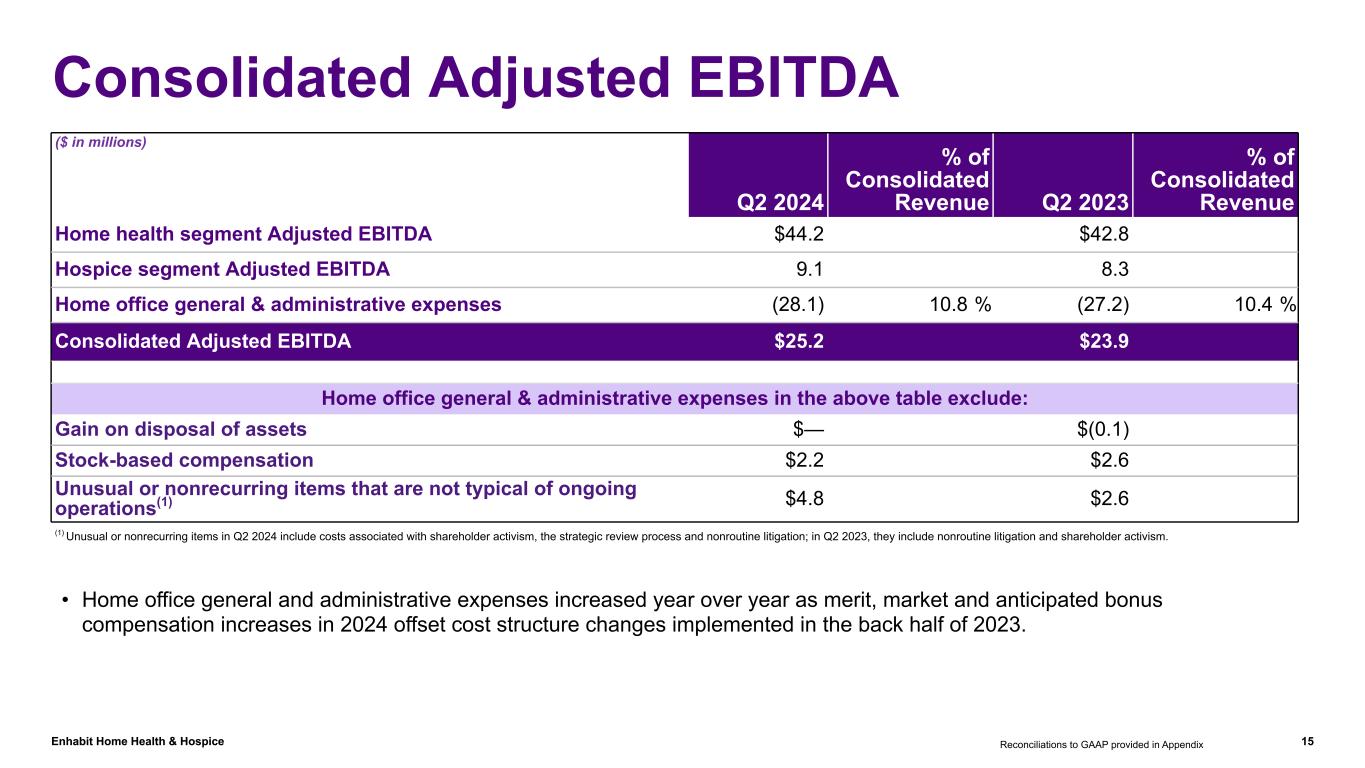
•Adjusted EBITDA of $25.2 million
•Earnings per share of $0.00
•Adjusted earnings per share of $0.07
RECENT COMPANY HIGHLIGHTS
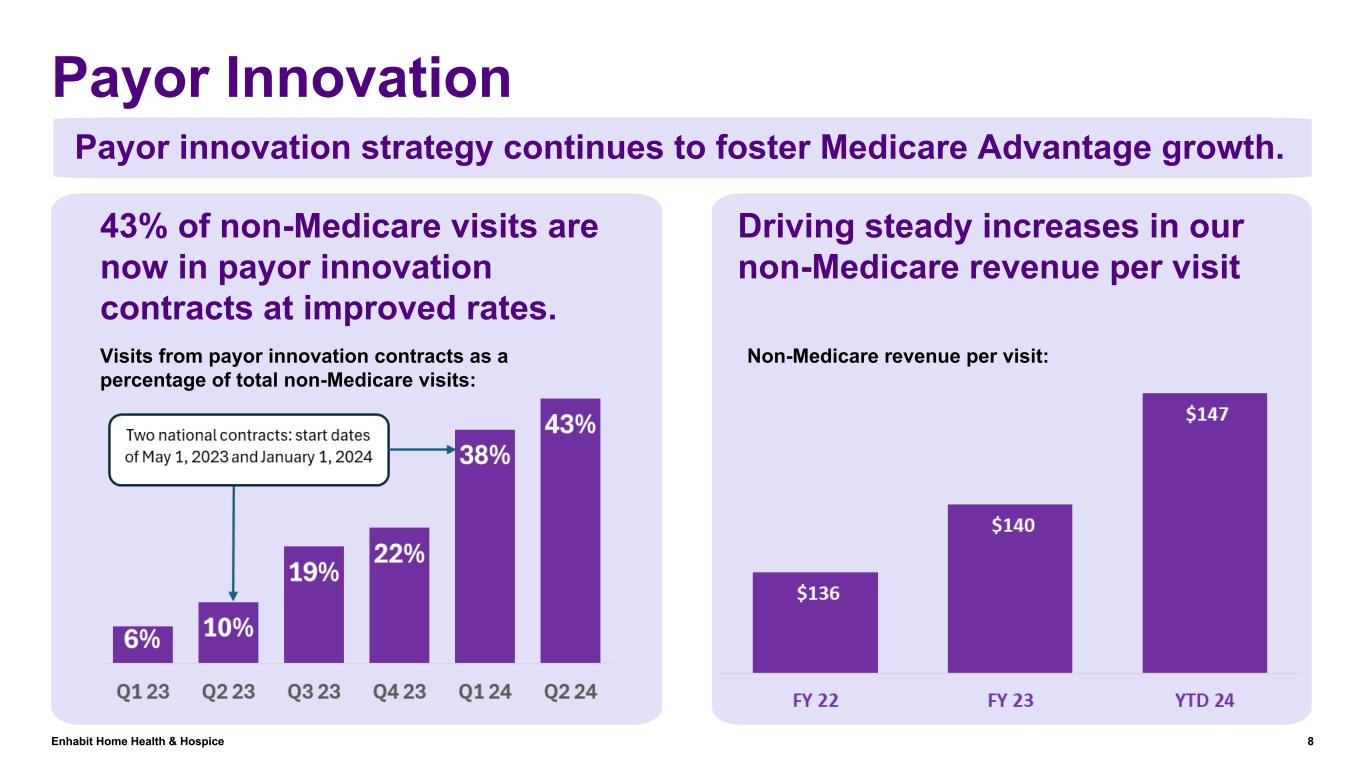
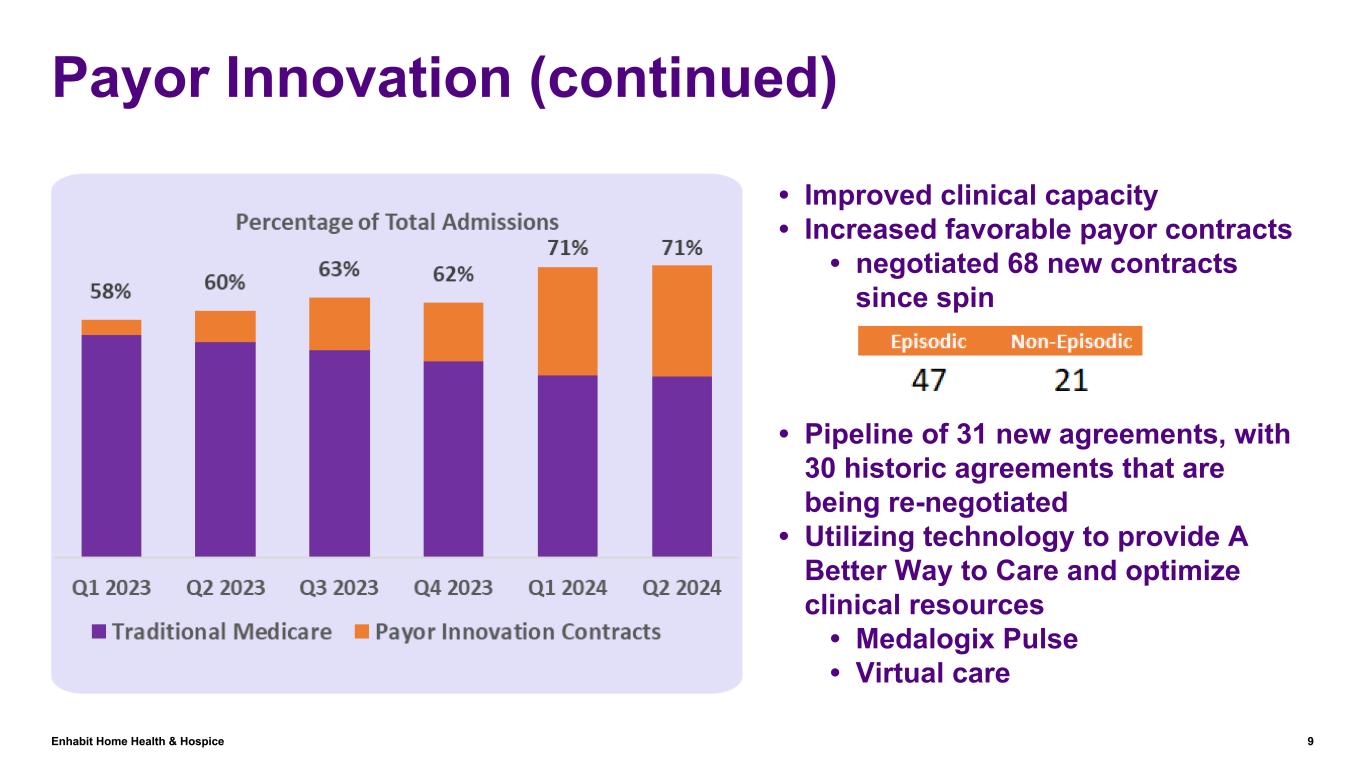
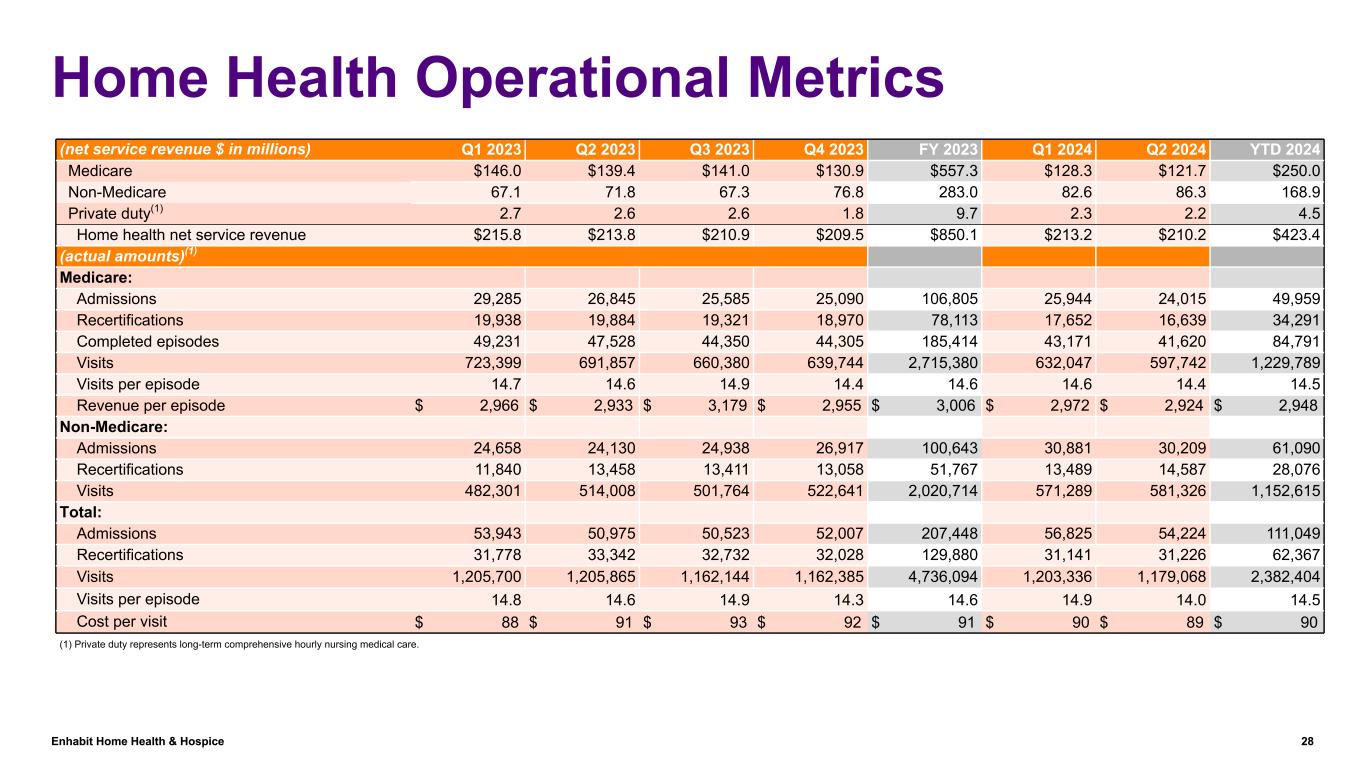
•Non-Medicare admissions grew 25.2%, driving total admission growth of 6.4% year over year
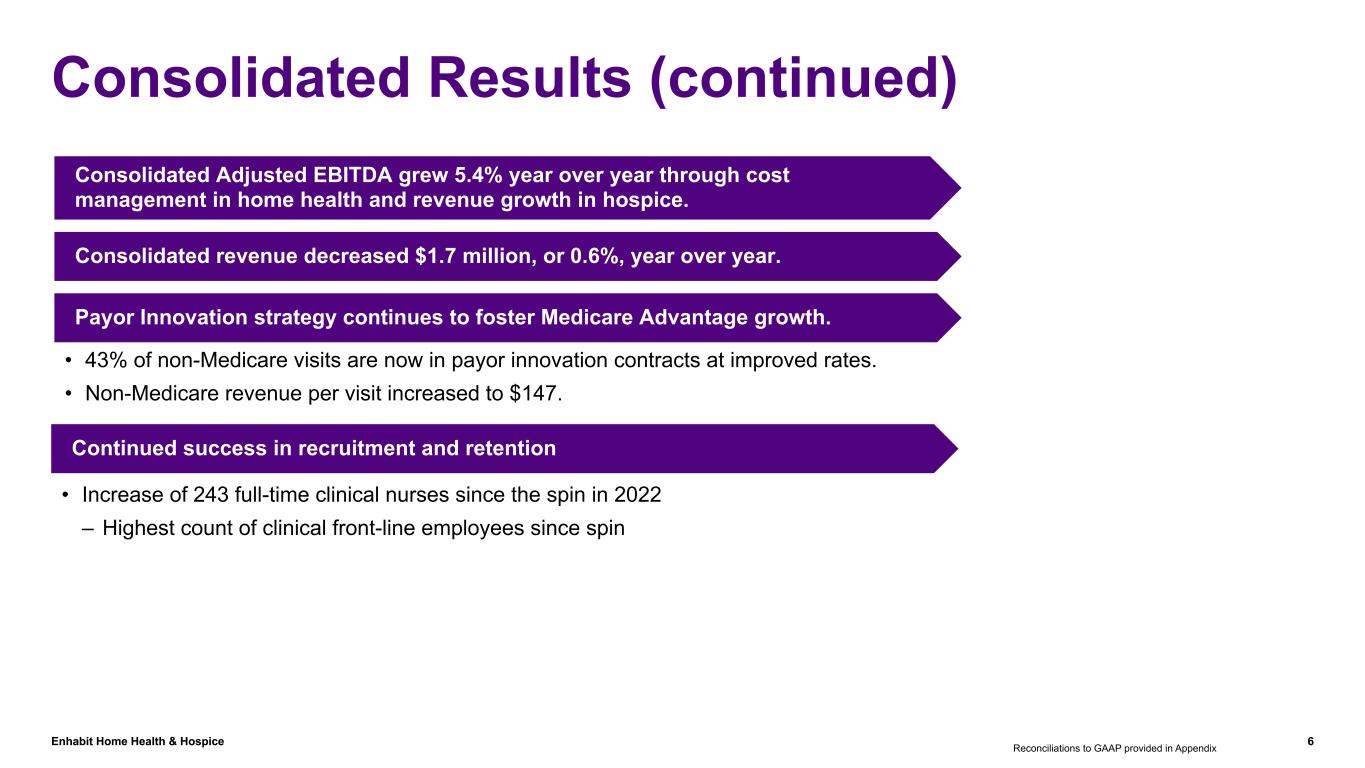
◦43% of non-Medicare visits are now in payor innovation contracts at improved rates
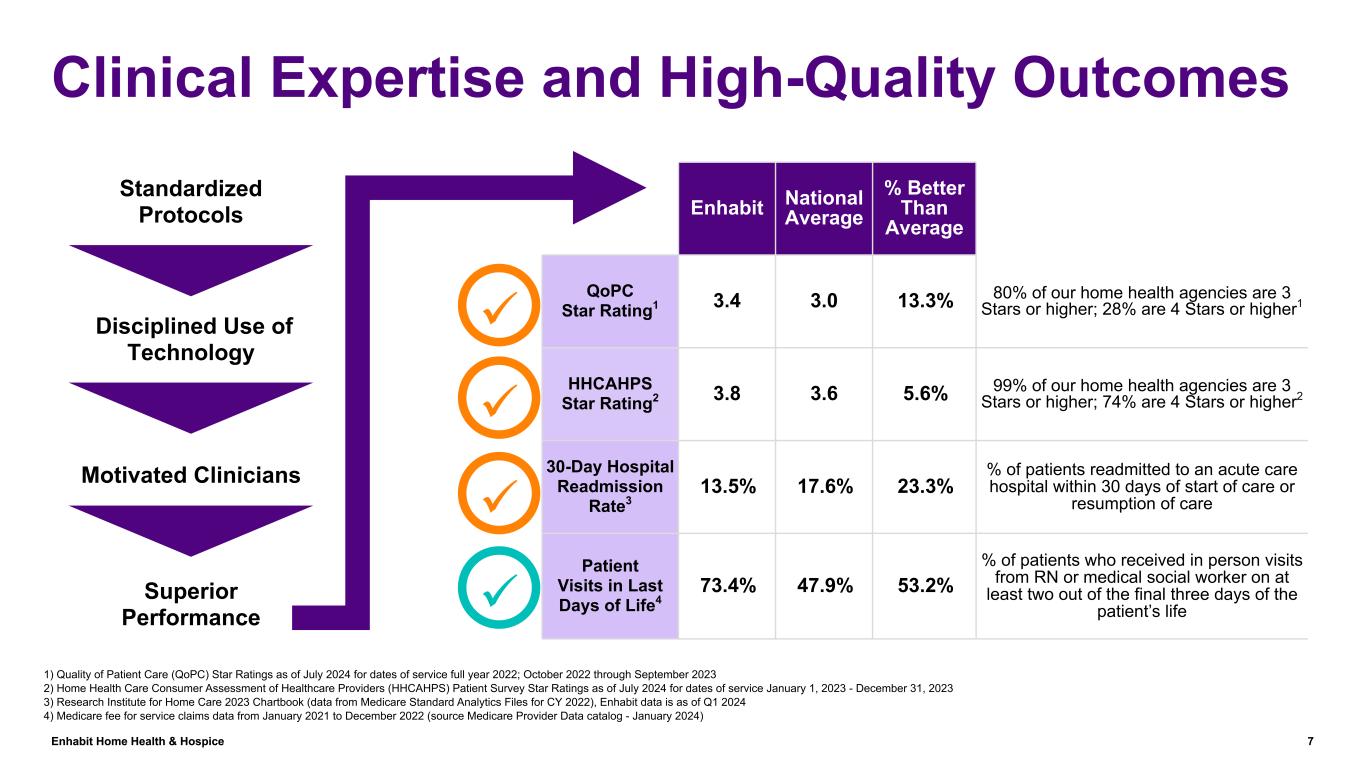
•30-day hospitalization readmission rate in home health is 23.3% better than the national average
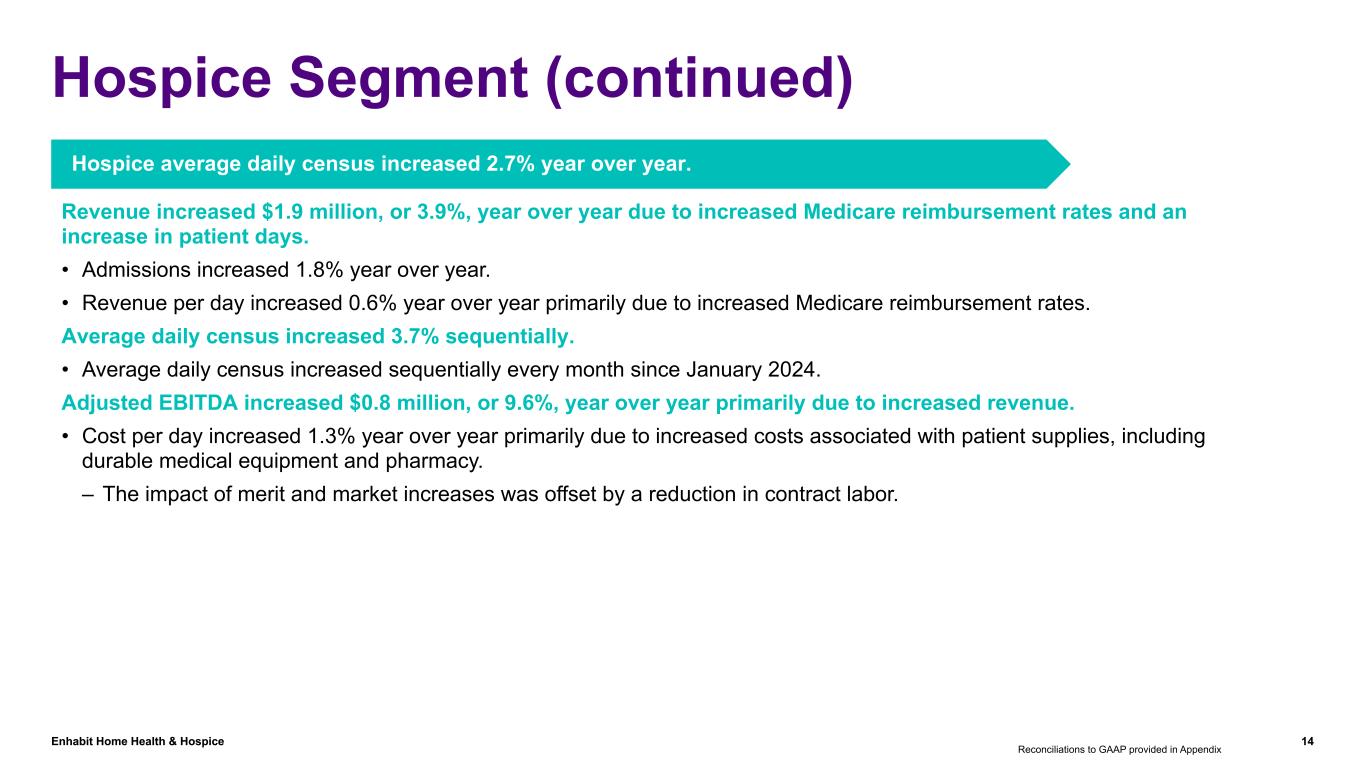
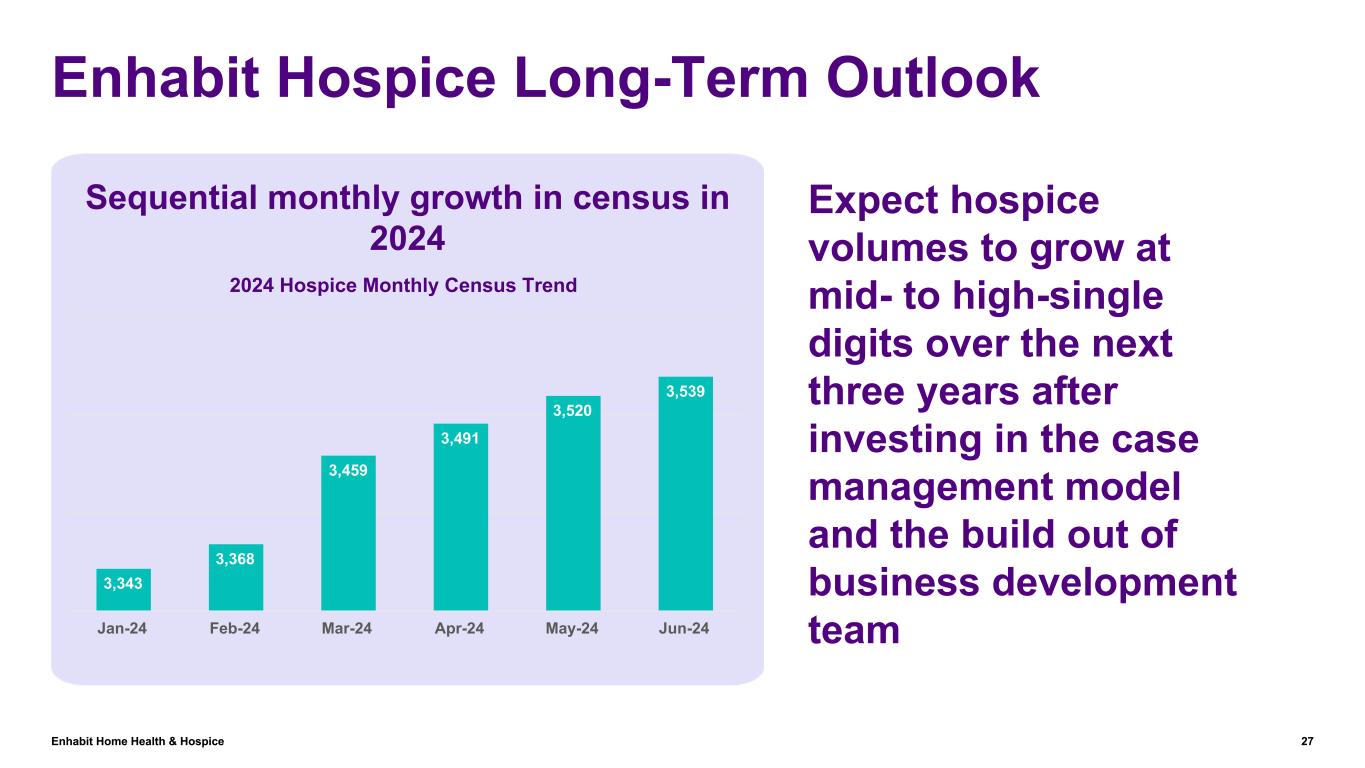
•Hospice average daily census increased 2.7% year over year
◦Average daily census increased sequentially every month since January
•53.2% better than the national average for hospice patient visits in last days of life
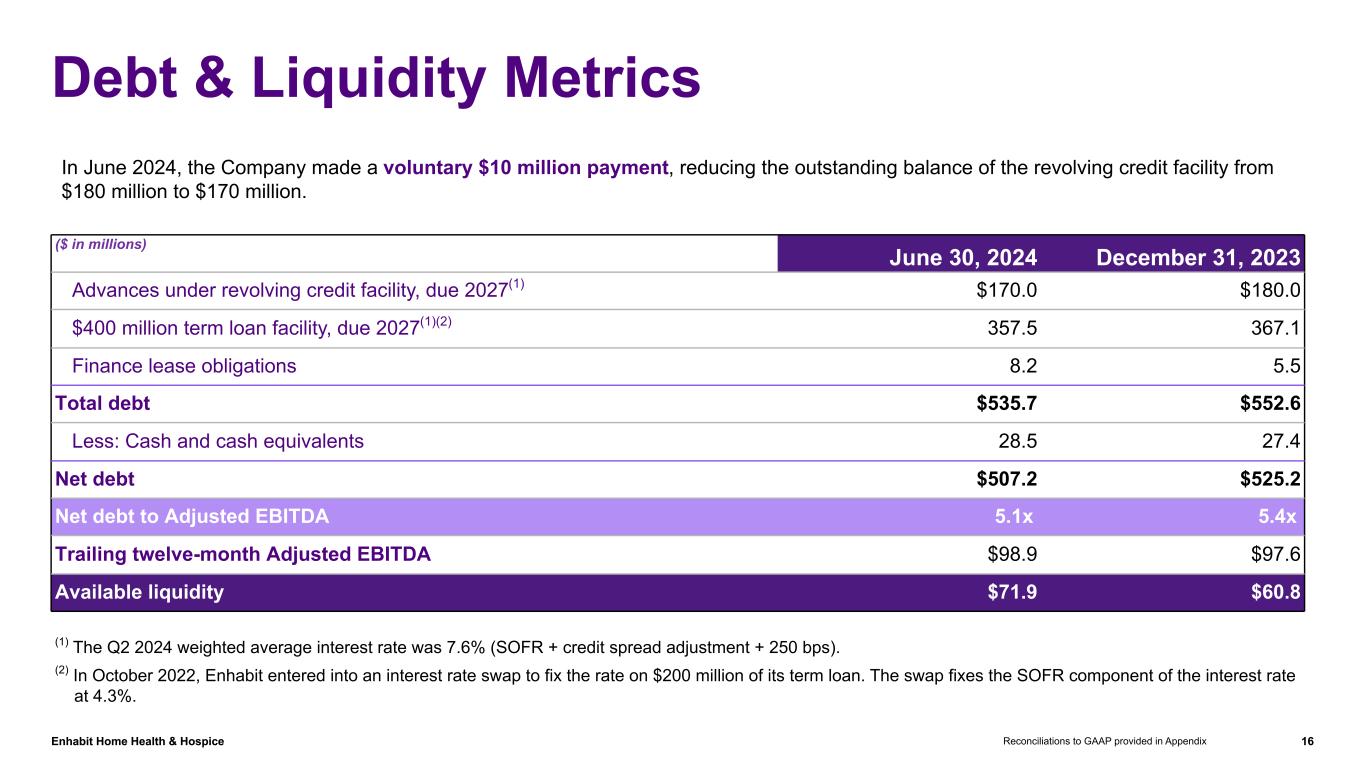
•Reduced bank debt by $15 million in the quarter
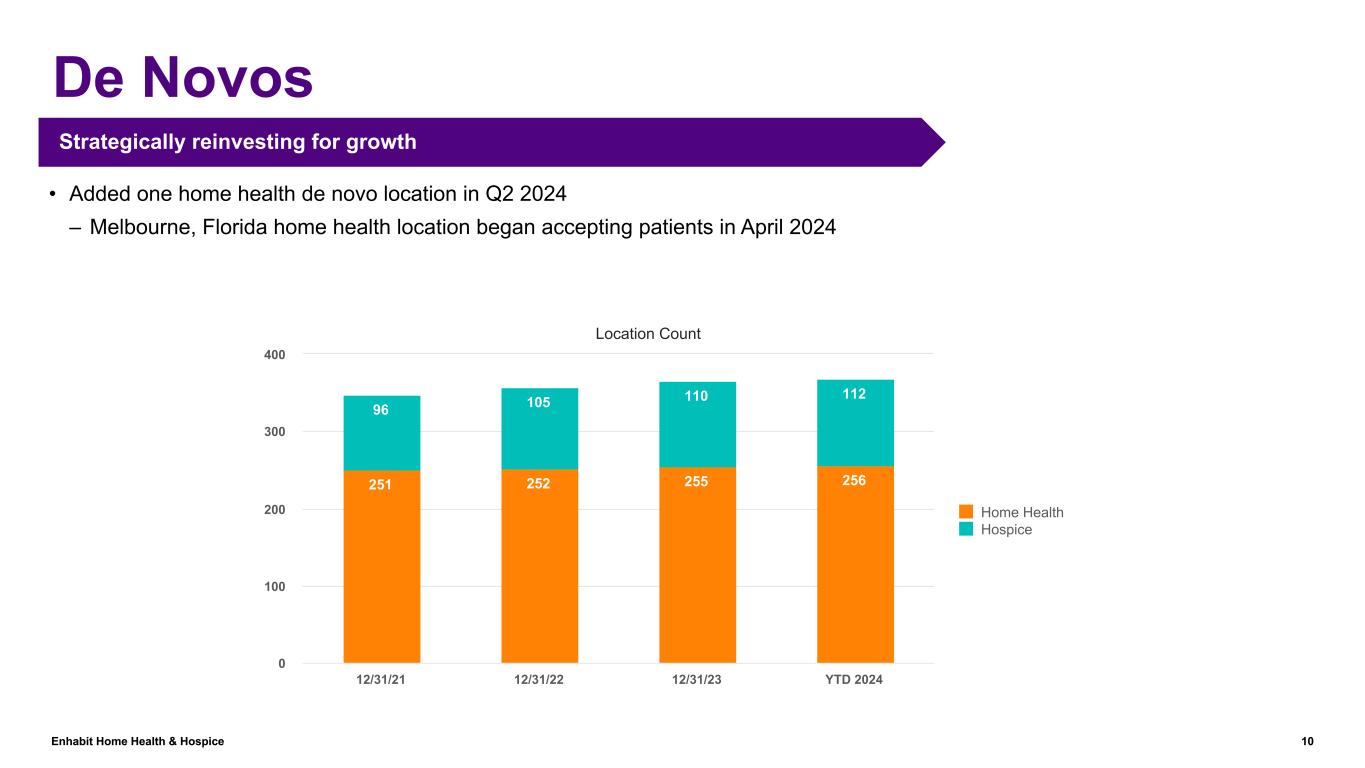
•Opened one home health de novo location in Florida in April
1
FINANCIAL RESULTS
Consolidated
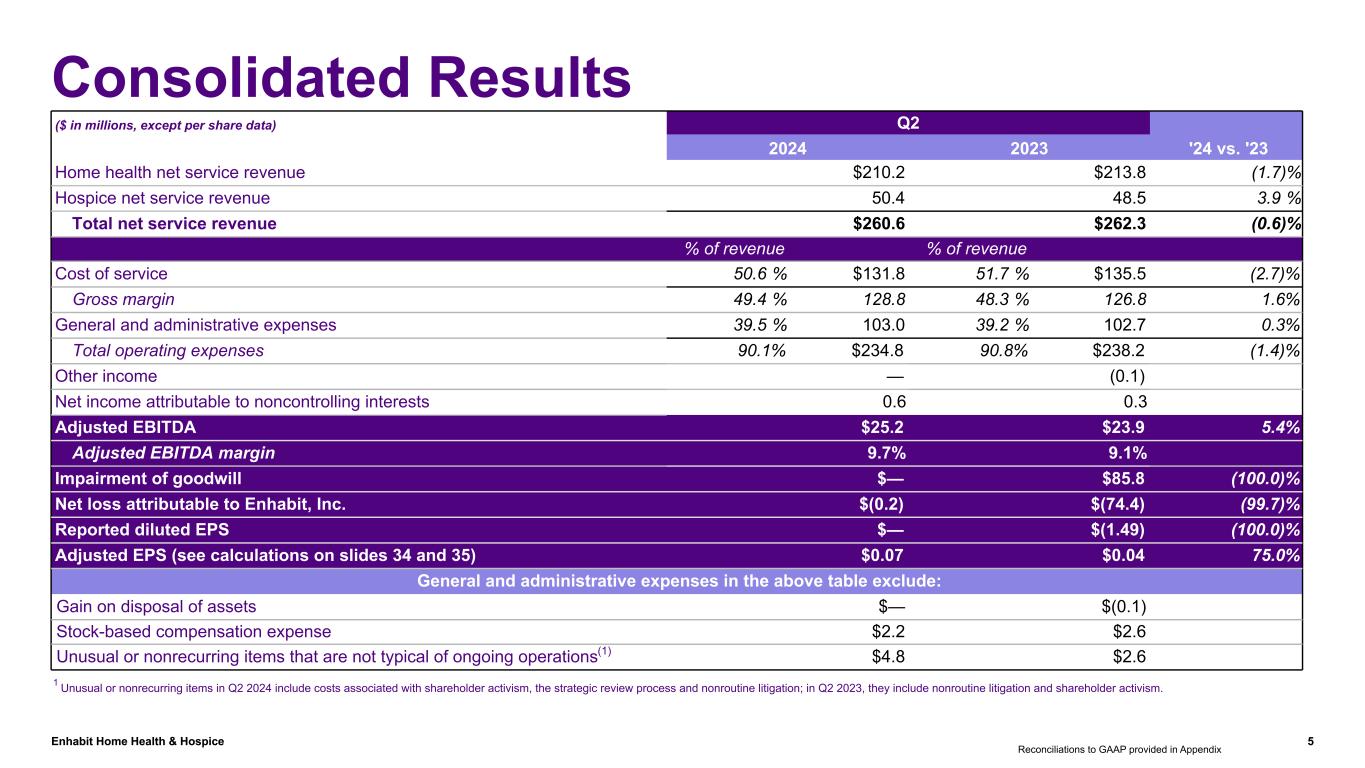
| ($ in millions, except per share data) | Q2 | '24 vs. '23 | ||||||||||||||||||
| 2024 | 2023 | |||||||||||||||||||
| Home health net service revenue | $ | 210.2 | $ | 213.8 | (1.7)% | |||||||||||||||
| Hospice net service revenue | 50.4 | 48.5 | 3.9% | |||||||||||||||||
| Total net service revenue | $ | 260.6 | $ | 262.3 | (0.6)% | |||||||||||||||
| % of revenue | % of revenue | |||||||||||||||||||
| Cost of service | 50.6% | $ | 131.8 | 51.7% | $ | 135.5 | (2.7)% | |||||||||||||
| Gross margin | 49.4% | 128.8 | 48.3% | 126.8 | 1.6% | |||||||||||||||
| General and administrative expenses | 39.5% | 103.0 | 39.2% | 102.7 | 0.3% | |||||||||||||||
| Total operating expenses | 90.1% | $ | 234.8 | 90.8% | $ | 238.2 | (1.4)% | |||||||||||||
| Other income | — | (0.1) | ||||||||||||||||||
| Net income attributable to noncontrolling interests | 0.6 | 0.3 | ||||||||||||||||||
| Adjusted EBITDA | $ | 25.2 | $ | 23.9 | 5.4% | |||||||||||||||
| Adjusted EBITDA margin | 9.7% | 9.1% | ||||||||||||||||||
| Impairment of goodwill | $ | — | $ | 85.8 | (100.0)% | |||||||||||||||
| Net loss attributable to Enhabit, Inc. | $ | (0.2) | $ | (74.4) | (99.7)% | |||||||||||||||
| Reported diluted EPS | $ | — | $ | (1.49) | (100.0)% | |||||||||||||||
Adjusted EPS | $ | 0.07 | $ | 0.04 | 75.0% | |||||||||||||||
Consolidated Adjusted EBITDA grew 5.4% year over year through cost management in home health and revenue growth in hospice.
2
SEGMENT RESULTS
Home Health
| ($ in millions) | Q2 | '24 vs. '23 | ||||||||||||
| 2024 | 2023 | |||||||||||||
| Net service revenue: | ||||||||||||||
| Medicare | $ | 121.7 | $ | 139.4 | (12.7)% | |||||||||
| Non-Medicare | 86.3 | 71.8 | 20.2% | |||||||||||
Private duty(1) | 2.2 | 2.6 | (15.4)% | |||||||||||
| Home health net service revenue | 210.2 | 213.8 | (1.7)% | |||||||||||
| Cost of service | 106.9 | 111.4 | (4.0)% | |||||||||||
| Gross margin | 49.1% | 47.9% | ||||||||||||
| General and administrative expenses | 58.6 | 59.4 | (1.3)% | |||||||||||
| Other income | — | (0.1) | (100.0)% | |||||||||||
| Net income attributable to noncontrolling interests | 0.5 | 0.3 | 66.7% | |||||||||||
| Adjusted EBITDA | $ | 44.2 | $ | 42.8 | 3.3% | |||||||||
| % Adj. EBITDA margin | 21.0% | 20.0% | ||||||||||||
Operational metrics (actual amounts) | ||||||||||||||
| Medicare: | ||||||||||||||
| Admissions | 24,015 | 26,845 | (10.5)% | |||||||||||
| Recertifications | 16,639 | 19,884 | (16.3)% | |||||||||||
| Completed episodes | 41,620 | 47,528 | (12.4)% | |||||||||||
| Visits | 597,742 | 691,857 | (13.6)% | |||||||||||
| Visits per episode | 14.4 | 14.6 | (1.4)% | |||||||||||
| Revenue per episode | $ | 2,924 | $ | 2,933 | (0.3)% | |||||||||
| Non-Medicare: | ||||||||||||||
| Admissions | 30,209 | 24,130 | 25.2% | |||||||||||
| Recertifications | 14,587 | 13,458 | 8.4% | |||||||||||
| Visits | 581,326 | 514,008 | 13.1% | |||||||||||
| Total: | ||||||||||||||
| Admissions | 54,224 | 50,975 | 6.4% | |||||||||||
Same-store total admissions growth | 6.2% | |||||||||||||
| Recertifications | 31,226 | 33,342 | (6.3)% | |||||||||||
Same-store total recertifications growth | (6.5)% | |||||||||||||
| Visits | 1,179,068 | 1,205,865 | (2.2)% | |||||||||||
| Visits per episode | 14.0 | 14.6 | (4.1)% | |||||||||||
| Cost per visit | $ | 89 | $ | 91 | (2.2)% | |||||||||
(1) Private duty represents long-term comprehensive hourly nursing medical care. | ||||||||||||||
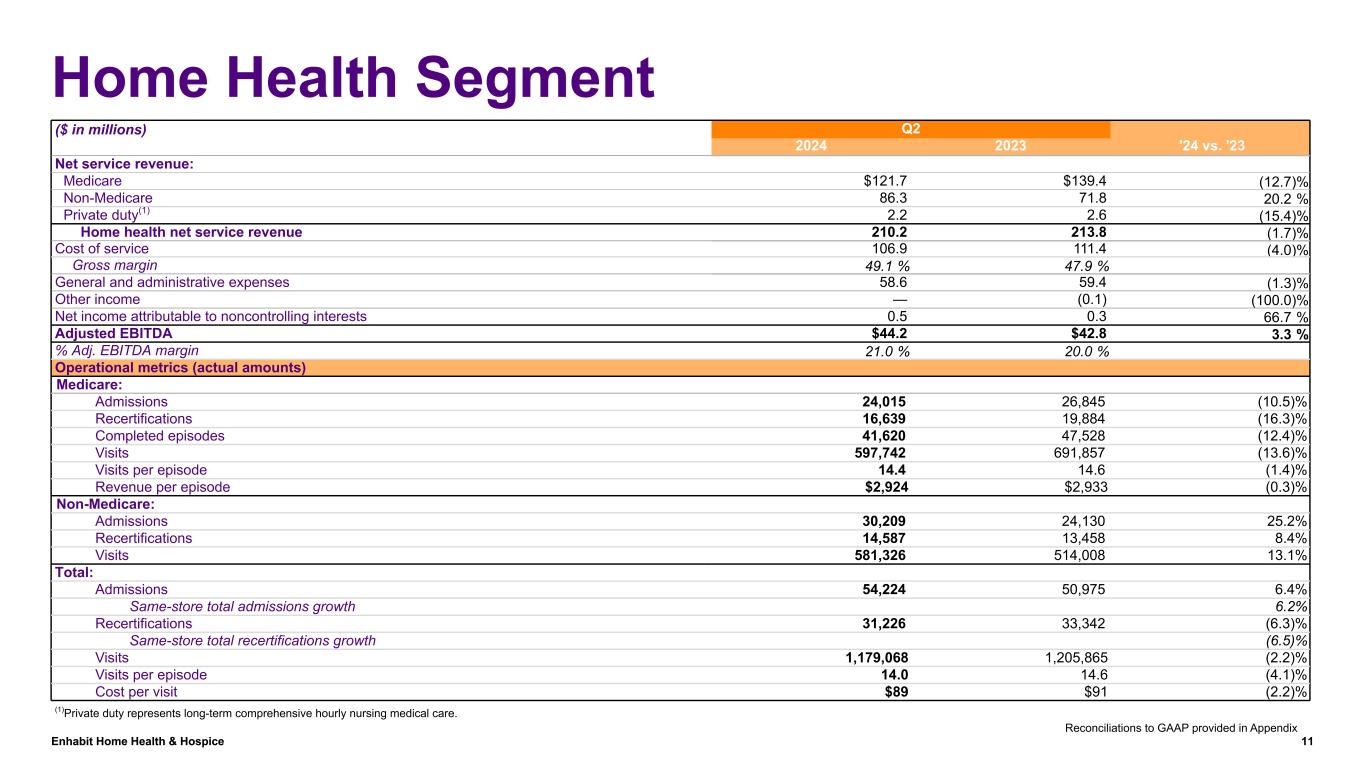
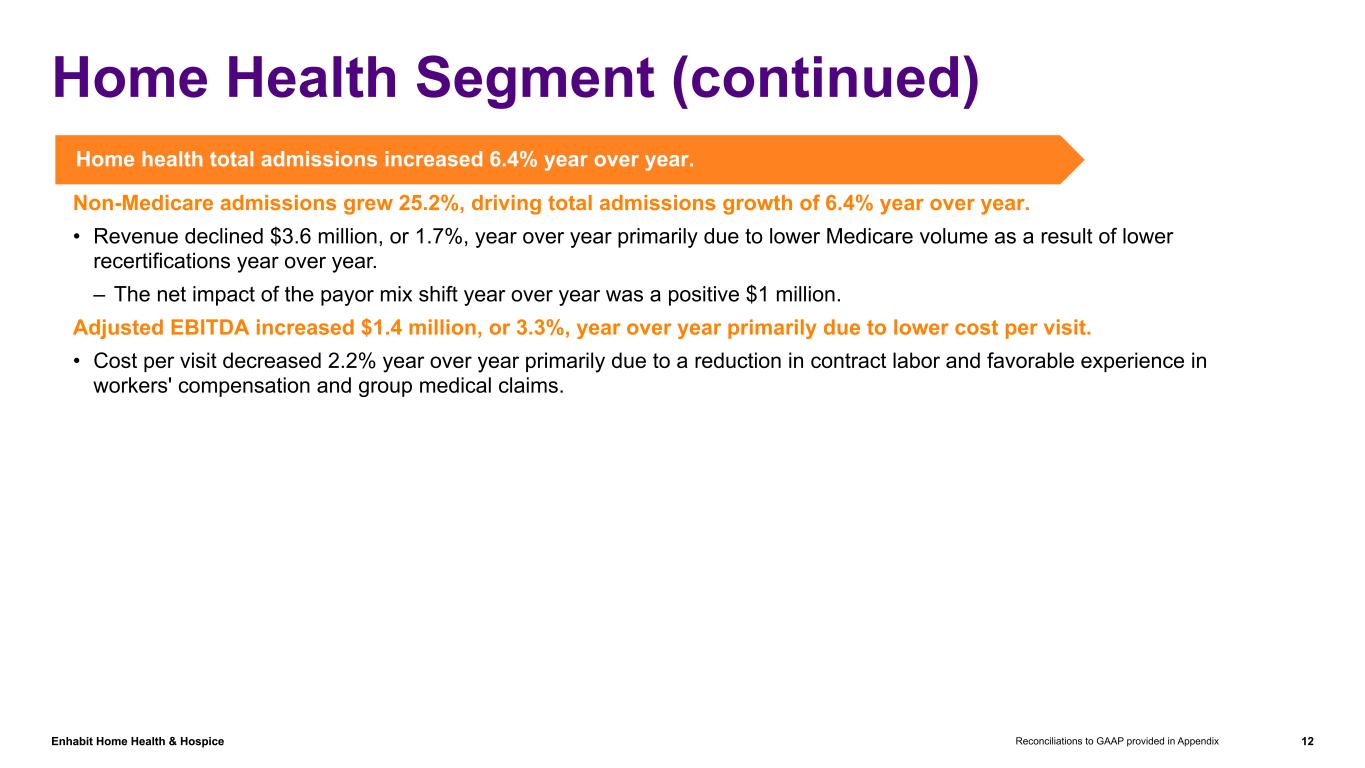
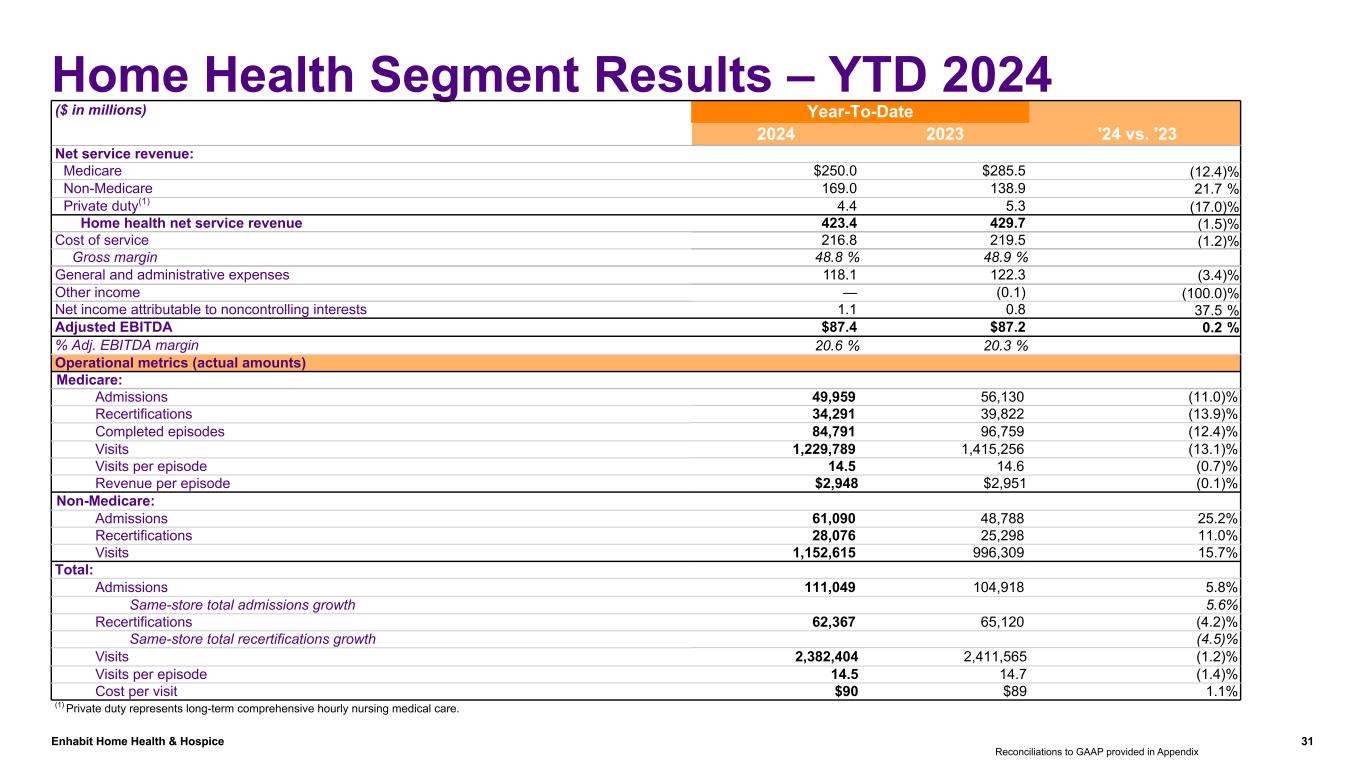
Non-Medicare admissions grew 25.2%, driving total admissions growth of 6.4% year over year. Revenue declined $3.6 million, or 1.7%, year over year primarily due to lower Medicare volume as a result of lower recertifications. The net impact of the payor mix shift year over year was a positive $1 million.
Adjusted EBITDA increased $1.4 million, or 3.3% year over year primarily due to lower cost per visit. Cost per visit decreased 2.2% year over year primarily due to a reduction in contract labor and favorable experience in workers’ compensation and group medical claims.
3
Hospice
| ($ in millions) | Q2 | '24 vs. '23 | ||||||||||||
| 2024 | 2023 | |||||||||||||
| Net service revenue | $ | 50.4 | $ | 48.5 | 3.9% | |||||||||
| Cost of service | 24.9 | 24.1 | 3.3% | |||||||||||
| Gross margin | 50.6% | 50.3% | ||||||||||||
| General and administrative expenses | 16.3 | 16.1 | 1.2% | |||||||||||
| Net income attributable to noncontrolling interests | 0.1 | — | NM | |||||||||||
| Adjusted EBITDA | $ | 9.1 | $ | 8.3 | 9.6% | |||||||||
| % Adj. EBITDA margin | 18.1% | 17.1% | ||||||||||||
Operational metrics (actual amounts) | ||||||||||||||
| Total admissions | 2,888 | 2,837 | 1.8% | |||||||||||
| Same-store total admissions growth | (0.2)% | |||||||||||||
| Patient days | 320,026 | 311,465 | 2.7% | |||||||||||
| Discharged average length of stay | 108 | 108 | —% | |||||||||||
| Average daily census | 3,517 | 3,423 | 2.7% | |||||||||||
| Revenue per patient day | $ | 157 | $ | 156 | 0.6% | |||||||||
| Cost per patient day | $ | 78 | $ | 77 | 1.3% | |||||||||
References in the financial tables to percentage changes that are not meaningful are denoted by “NM”. | ||||||||||||||
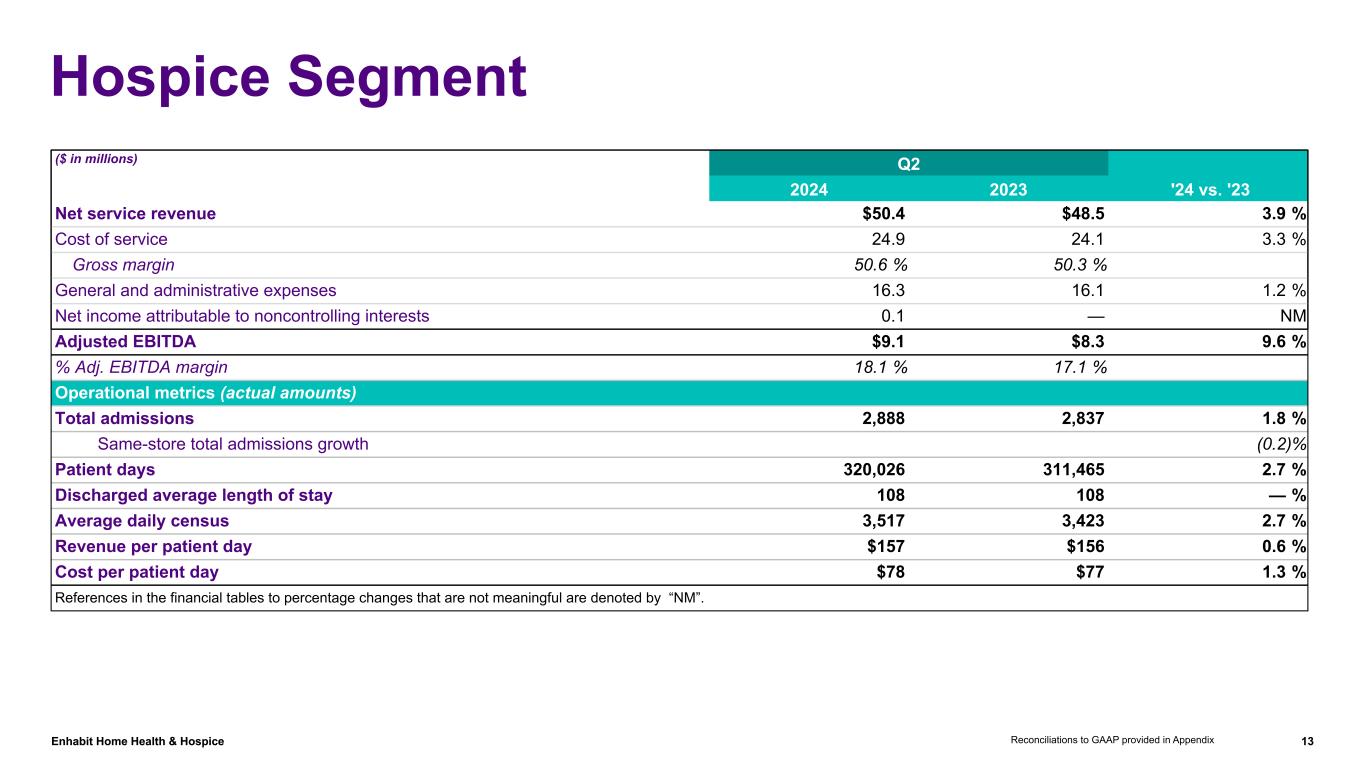
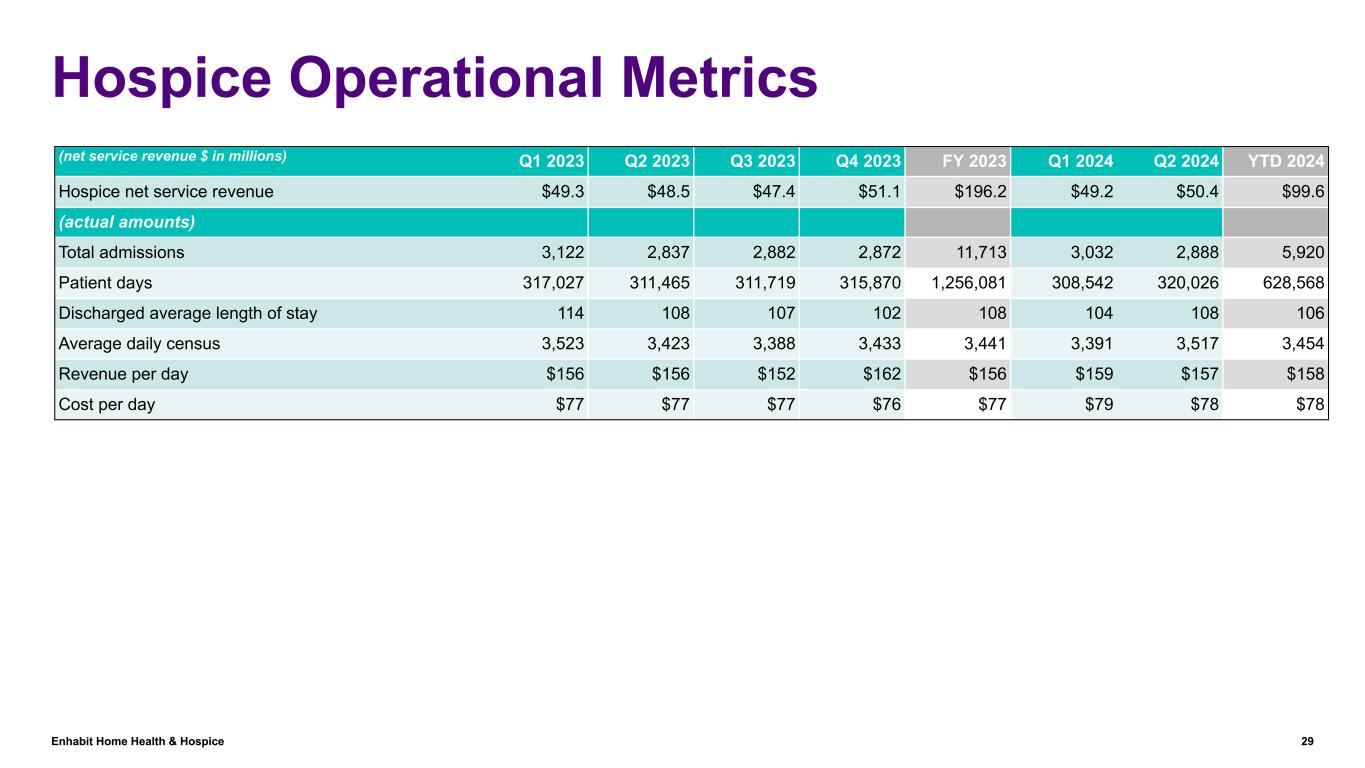
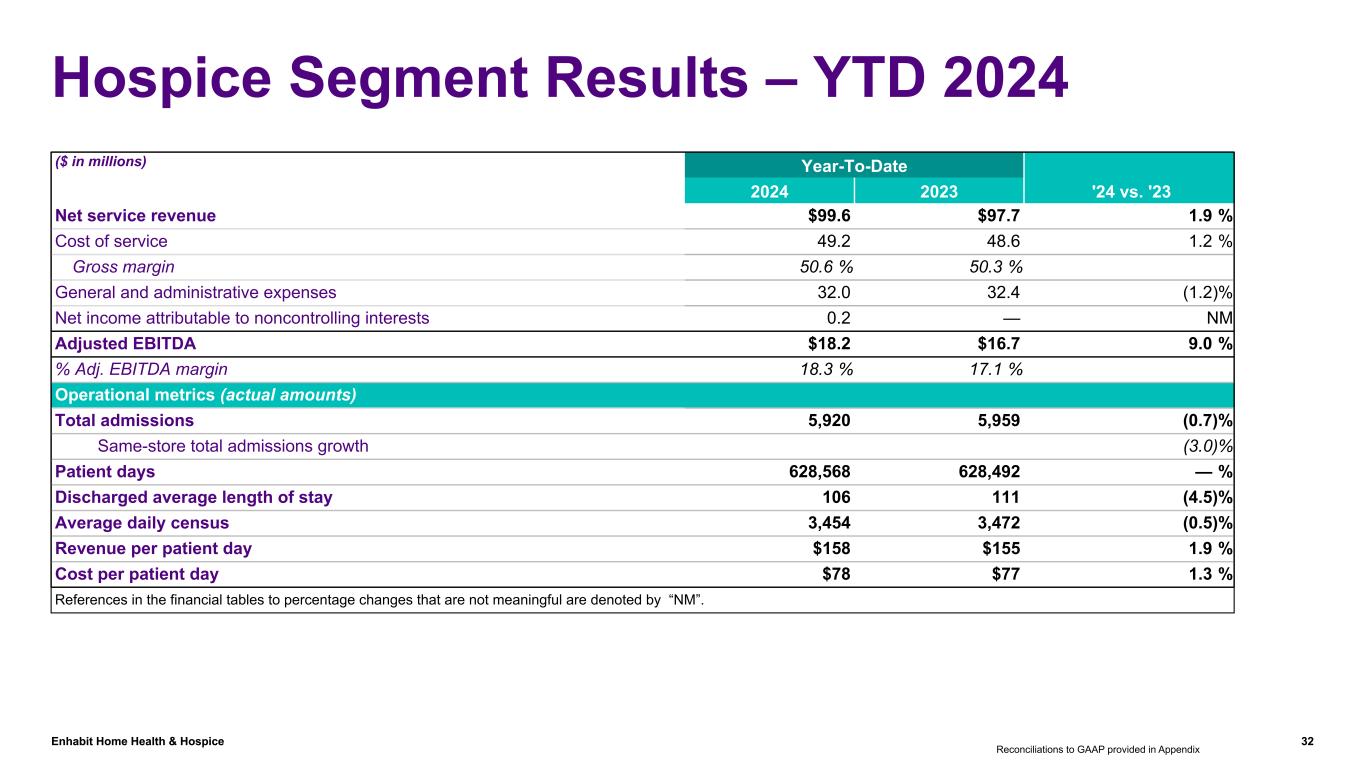
Net service revenue increased $1.9 million, or 3.9%, year over year due to increased Medicare reimbursement rates and an increase in patient days. Average daily census increased 3.7% sequentially and has increased sequentially every month since January 2024. Adjusted EBITDA increased $0.8 million, or 9.6%, year over year primarily due to increased revenue. Cost per day increased 1.3% year over year primarily due to increased costs associated with patient supplies, including durable medical equipment and pharmacy.
GUIDANCE
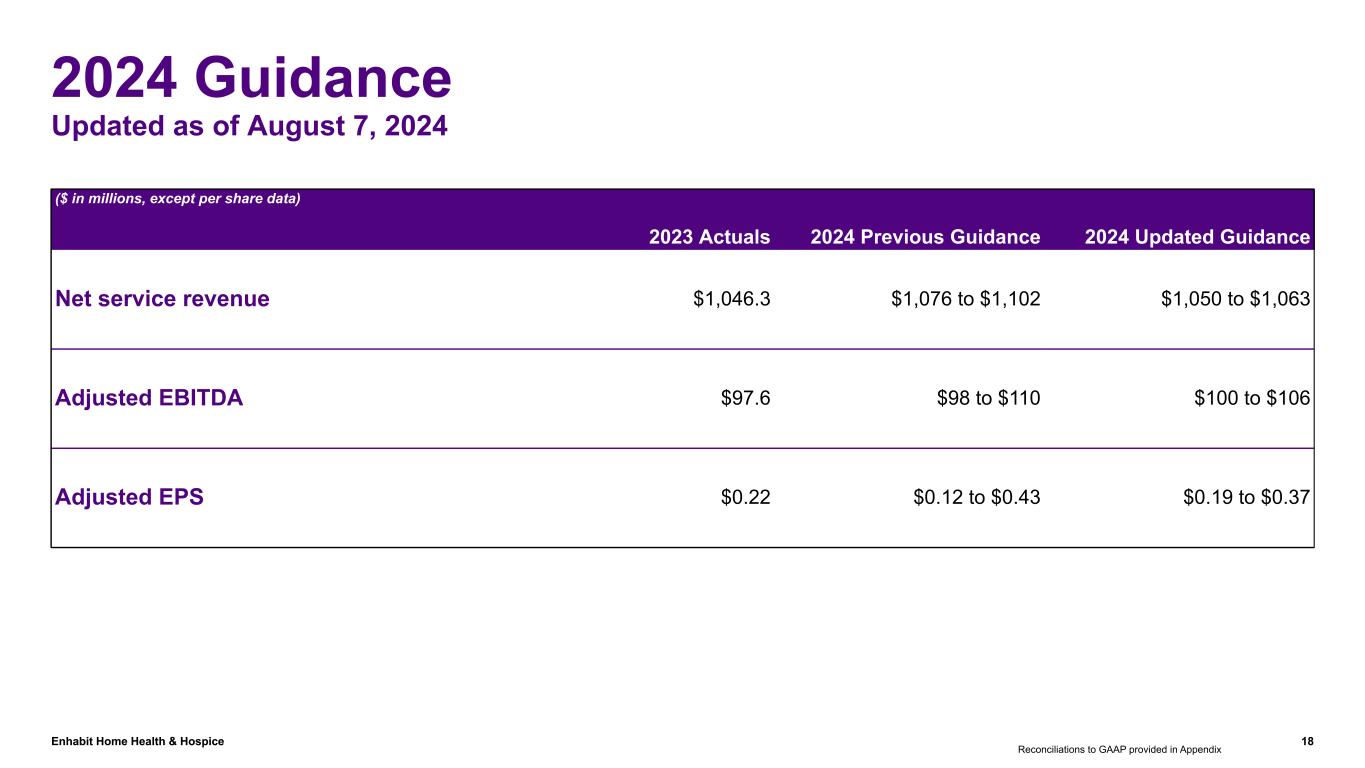
The Company updated its full-year 2024 guidance as follows:
($ in millions, except per share data) | 2024 Previous Guidance | 2024 Updated Guidance | ||||||
Net service revenue | $1,076 to $1,102 | $1,050 to $1,063 | ||||||
Adjusted EBITDA | $98 to $110 | $100 to $106 | ||||||
Adjusted EPS | $0.12 to $0.43 | $0.19 to $0.37 | ||||||
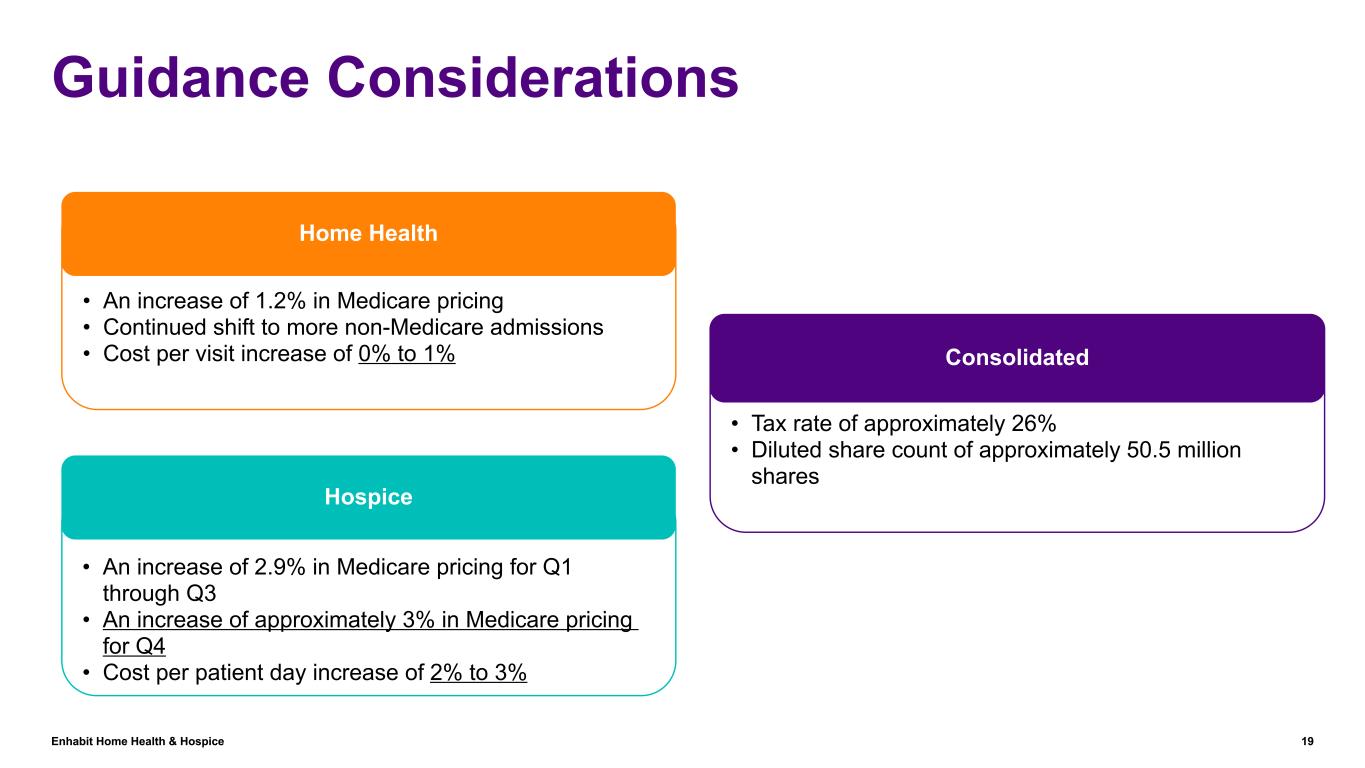
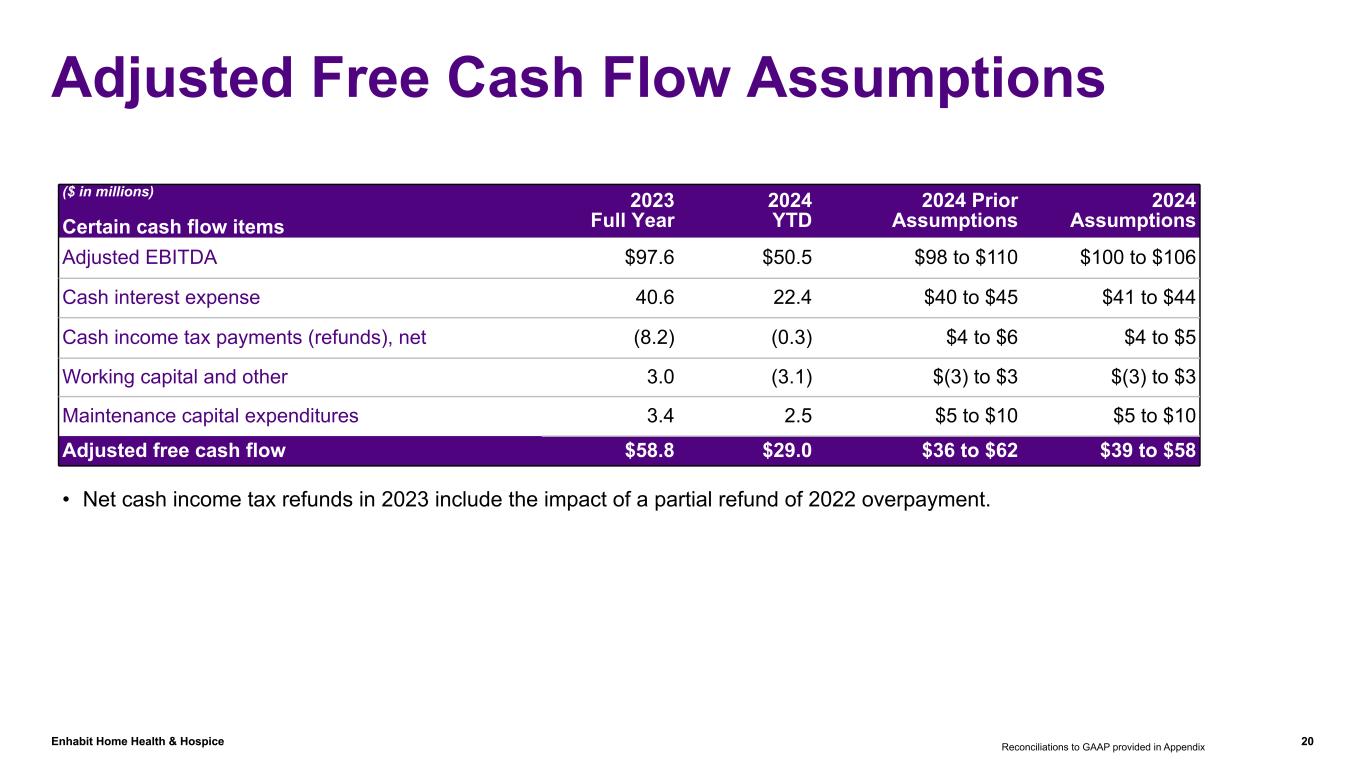
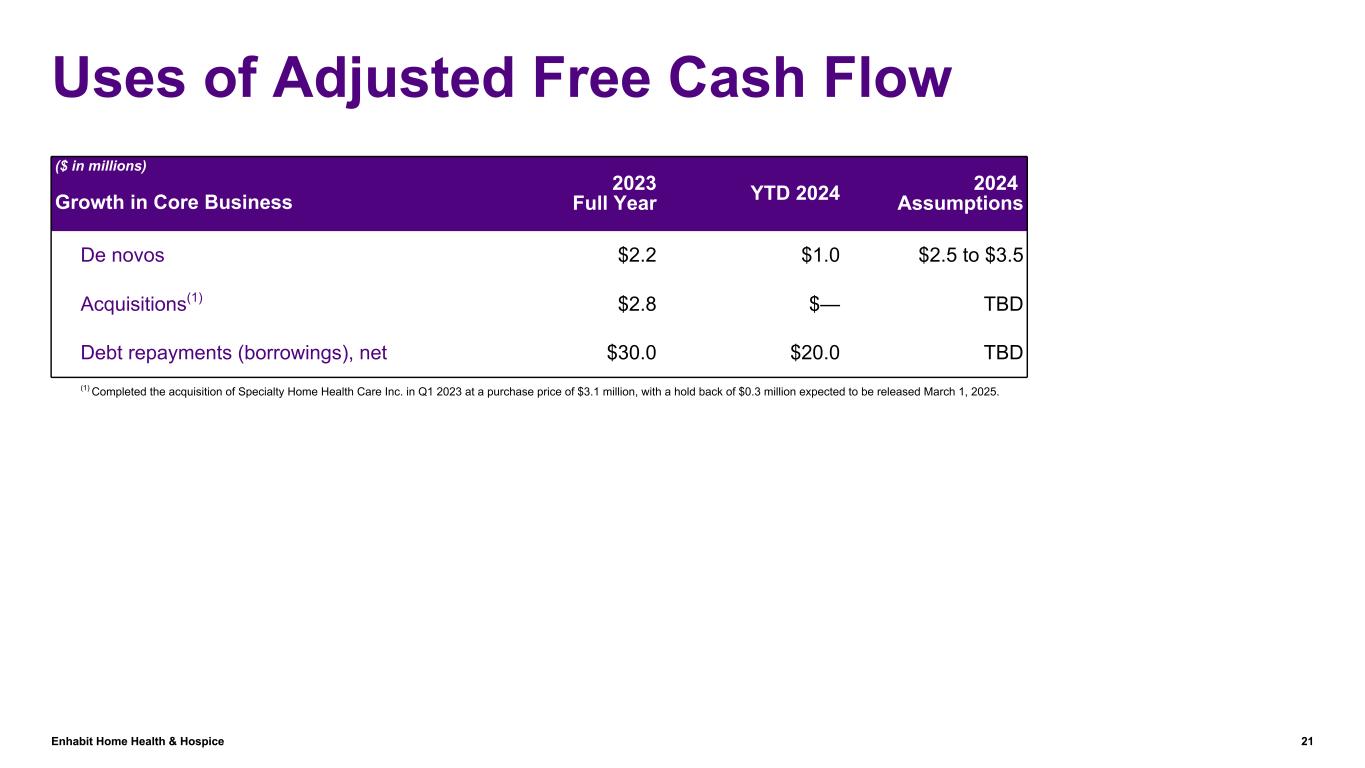
For additional considerations regarding the Company’s 2024 guidance ranges, see the supplemental information posted on the Company’s website at http://investors.ehab.com.
CONFERENCE CALL INFORMATION
The Company will host an investor conference call at 10 a.m. EDT on August 7, 2024 to discuss its results for the second quarter of 2024. To access the live call by phone, dial toll-free (888) 660-6150 or international (929) 203-0843; the conference ID is 5248158. A simultaneous webcast of the call, along with supplemental information, may be accessed by visiting https://events.q4inc.com/attendee/154318091. Following the call, a replay will be available on the Company’s website at http://investors.ehab.com.
4
ABOUT ENHABIT HOME HEALTH & HOSPICE
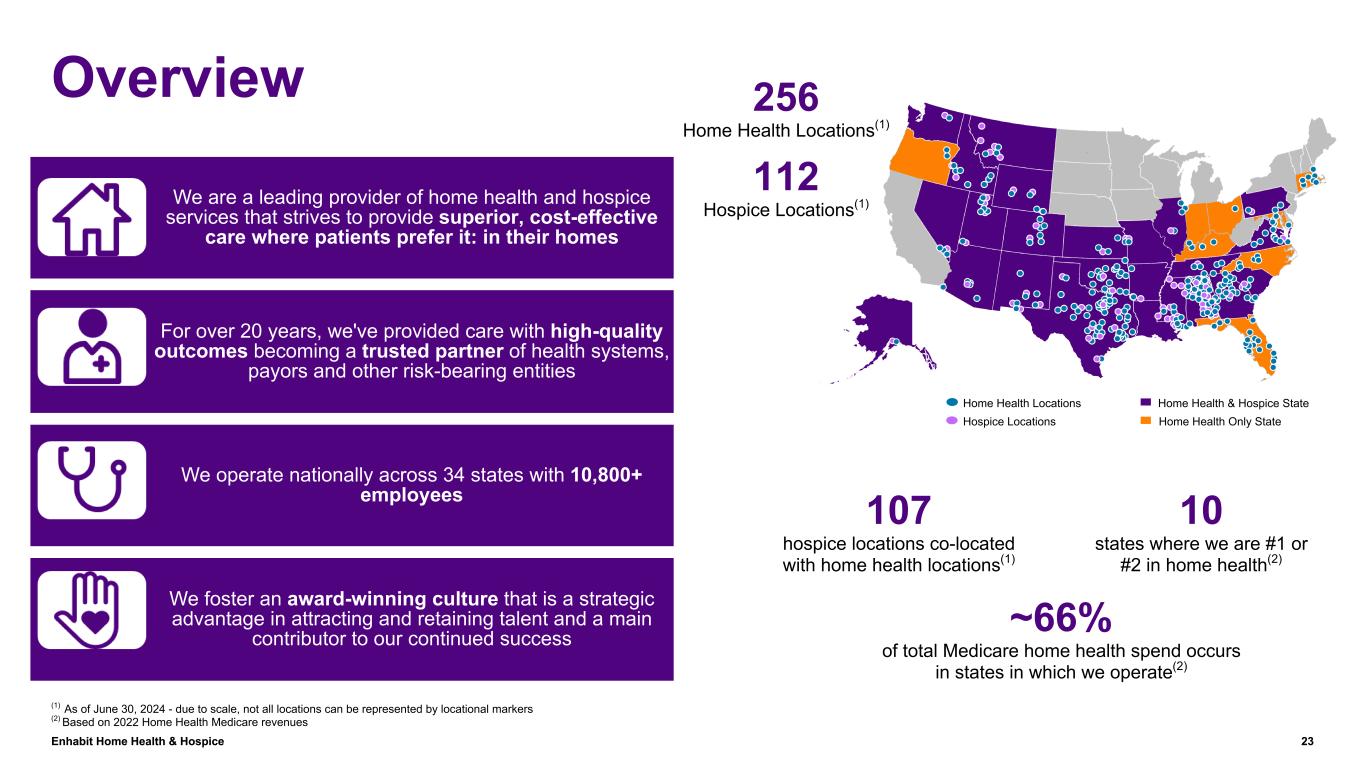
Enhabit Home Health & Hospice (Enhabit, Inc.) is a leading national home health and hospice provider working to expand what's possible for patient care in the home. Enhabit’s team of clinicians supports patients and their families where they are most comfortable, with a nationwide footprint spanning 256 home health locations and 112 hospice locations across 34 states. Enhabit leverages advanced technology and compassionate teams to deliver extraordinary patient care. For more information, visit ehab.com.
OTHER INFORMATION
Note regarding presentation and reconciliation of non-GAAP financial measures
The financial data contained in this press release and supplemental information includes non-GAAP (generally accepted accounting principles (GAAP)) financial measures as defined in Regulation G under the Securities Exchange Act of 1934, including Adjusted EBITDA, Adjusted EBITDA margin, Adjusted EPS, and Adjusted free cash flow. See “Supplemental Non-GAAP Information” for reconciliations of the non-GAAP financial measures to the most directly comparable financial measures calculated and presented in accordance with GAAP. Additionally, our Form 10-Q for the three and six months ended June 30, 2024, provides further information regarding “unusual or nonrecurring items that are not typical of ongoing operations,” a reconciliation item in our Adjusted EBITDA calculation. Such non-GAAP financial measures exclude significant components in understanding and assessing financial performance and should therefore not be considered superior to, as a substitute for or alternative to the GAAP financial measures presented in this press release. The non-GAAP financial measures in the press release may differ from similar measures used by other companies.
The Company is unable to reconcile the guidance for Adjusted EBITDA and Adjusted EPS to their corresponding GAAP measures without unreasonable effort due to the inherent difficulty in predicting, with reasonable certainty, the future impact of items that are outside the control of the Company or otherwise non-indicative of its ongoing operating performance. Accordingly, the Company relies on the exception provided by Item 10(e)(1)(i)(B) of Regulation S-K. Such items include, but are not limited to, gains or losses related to hedging instruments; loss on early extinguishment of debt; adjustments to its income tax provision (such as valuation allowance adjustments and settlements of income tax claims); and items related to corporate and facility restructurings. For the same reasons, the Company is unable to address the probable significance of the unavailable information.
Note regarding presentation of same-store comparisons
The Company uses “same-store” comparisons to explain the changes in certain performance metrics and line items within its financial statements. Same-store comparisons are calculated based on home health and hospice locations open throughout both the full current period and the immediately prior period presented. These comparisons include the financial results of market consolidation transactions in existing markets, as it is difficult to determine, with precision, the incremental impact of these transactions on the Company’s results of operations.
5
Enhabit, Inc. and Subsidiaries
Condensed Consolidated Statements of Income
(Unaudited)
| Three Months Ended June 30, | Six Months Ended June 30, | ||||||||||||||||||||||
| 2024 | 2023 | 2024 | 2023 | ||||||||||||||||||||
| ($ in millions, except per share data) | |||||||||||||||||||||||
| Net service revenue | $ | 260.6 | $ | 262.3 | $ | 523.0 | $ | 527.4 | |||||||||||||||
| Cost of service, excluding depreciation and amortization | 131.8 | 135.5 | 266.0 | 268.1 | |||||||||||||||||||
| General and administrative expenses | 110.0 | 107.8 | 217.5 | 218.3 | |||||||||||||||||||
| Depreciation and amortization | 7.6 | 7.7 | 15.4 | 15.5 | |||||||||||||||||||
| Impairment of goodwill | — | 85.8 | — | 85.8 | |||||||||||||||||||
| Operating income (loss) | 11.2 | (74.5) | 24.1 | (60.3) | |||||||||||||||||||
| Interest expense and amortization of debt discounts and fees | 10.9 | 10.3 | 22.0 | 19.8 | |||||||||||||||||||
| Other income | — | (0.1) | — | (0.1) | |||||||||||||||||||
| Income (loss) before income taxes and noncontrolling interests | 0.3 | (84.7) | 2.1 | (80.0) | |||||||||||||||||||
| Income tax (benefit) expense | (0.1) | (10.6) | 0.8 | (9.1) | |||||||||||||||||||
| Net income (loss) | 0.4 | (74.1) | 1.3 | (70.9) | |||||||||||||||||||
| Less: Net income attributable to noncontrolling interests | 0.6 | 0.3 | 1.3 | 0.8 | |||||||||||||||||||
| Net loss attributable to Enhabit, Inc. | $ | (0.2) | $ | (74.4) | $ | — | $ | (71.7) | |||||||||||||||
| Weighted average common shares outstanding: | |||||||||||||||||||||||
| Basic | 50.1 | 49.8 | 50.1 | 49.8 | |||||||||||||||||||
| Diluted | 50.1 | 49.8 | 50.1 | 49.8 | |||||||||||||||||||
| Loss per common share: | |||||||||||||||||||||||
| Basic loss per share attributable to Enhabit, Inc. common stockholders | $ | — | $ | (1.49) | $ | — | $ | (1.44) | |||||||||||||||
| Diluted loss per share attributable to Enhabit, Inc. common stockholders | $ | — | $ | (1.49) | $ | — | $ | (1.44) | |||||||||||||||
6
Enhabit, Inc. and Subsidiaries
Condensed Consolidated Balance Sheets
(Unaudited)
| June 30, 2024 | December 31, 2023 | ||||||||||
| ($ in millions) | |||||||||||
| Assets | |||||||||||
| Current assets: | |||||||||||
| Cash and cash equivalents | $ | 28.5 | $ | 27.4 | |||||||
| Restricted cash | 1.7 | 2.4 | |||||||||
| Accounts receivable, net of allowances | 166.0 | 164.7 | |||||||||
| Prepaid expenses and other current assets | 10.6 | 15.6 | |||||||||
| Total current assets | 206.8 | 210.1 | |||||||||
| Property and equipment, net | 21.6 | 19.0 | |||||||||
| Operating lease right-of-use assets | 55.0 | 57.5 | |||||||||
| Goodwill | 1,061.7 | 1,061.7 | |||||||||
| Intangible assets, net | 69.0 | 80.0 | |||||||||
| Other long-term assets | 4.9 | 5.3 | |||||||||
| Total assets | $ | 1,419.0 | $ | 1,433.6 | |||||||
| Liabilities and stockholders’ equity | |||||||||||
| Current liabilities: | |||||||||||
| Current portion of long-term debt | $ | 23.0 | $ | 22.5 | |||||||
| Current operating lease liabilities | 11.0 | 11.8 | |||||||||
| Accounts payable | 8.5 | 7.6 | |||||||||
| Accrued payroll | 37.0 | 38.5 | |||||||||
| Refunds due patients and other third-party payors | 10.4 | 8.2 | |||||||||
| Accrued medical insurance | 9.8 | 8.4 | |||||||||
| Other current liabilities | 40.4 | 40.7 | |||||||||
| Total current liabilities | 140.1 | 137.7 | |||||||||
| Long-term debt, net of current portion | 512.7 | 530.1 | |||||||||
| Long-term operating lease liabilities, net of current portion | 44.3 | 45.7 | |||||||||
| Deferred income tax liabilities | 16.4 | 17.1 | |||||||||
| Other long-term liabilities | 0.1 | 1.3 | |||||||||
| Total liabilities | 713.6 | 731.9 | |||||||||
| Redeemable noncontrolling interests | 5.0 | 5.0 | |||||||||
| Stockholders’ equity: | |||||||||||
| Total Enhabit, Inc. stockholders’ equity | 674.3 | 669.7 | |||||||||
| Noncontrolling interests | 26.1 | 27.0 | |||||||||
| Total stockholders’ equity | 700.4 | 696.7 | |||||||||
| Total liabilities and stockholders’ equity | $ | 1,419.0 | $ | 1,433.6 | |||||||
7
Enhabit, Inc. and Subsidiaries
Condensed Consolidated Statements of Cash Flows
(Unaudited)
| Six Months Ended June 30, | |||||||||||
| 2024 | 2023 | ||||||||||
| ($ in millions) | |||||||||||
| Cash flows from operating activities: | |||||||||||
| Net income (loss) | $ | 1.3 | $ | (70.9) | |||||||
| Adjustments to reconcile net income (loss) to net cash provided by operating activities— | |||||||||||
| Depreciation and amortization | 15.4 | 15.5 | |||||||||
| Amortization of debt related costs | 0.7 | 0.5 | |||||||||
| Impairment of goodwill | — | 85.8 | |||||||||
| Stock-based compensation | 4.0 | 4.1 | |||||||||
| Deferred tax benefit | (1.1) | (11.0) | |||||||||
Other | (0.1) | 0.9 | |||||||||
| Changes in assets and liabilities, net of acquisitions— | |||||||||||
| Accounts receivable, net of allowances | (1.3) | 1.9 | |||||||||
| Prepaid expenses and other assets | 5.9 | 19.2 | |||||||||
| Accounts payable | 0.1 | 1.5 | |||||||||
| Accrued payroll | (1.5) | (2.6) | |||||||||
| Other liabilities | 3.5 | (5.7) | |||||||||
| Net cash provided by operating activities | 26.9 | 39.2 | |||||||||
| Cash flows from investing activities: | |||||||||||
| Acquisition of businesses, net of cash acquired | — | (2.8) | |||||||||
| Purchases of property and equipment, including capitalized software costs | (2.5) | (1.7) | |||||||||
| Other | 0.8 | 0.5 | |||||||||
| Net cash used in investing activities | (1.7) | (4.0) | |||||||||
| Cash flows from financing activities: | |||||||||||
| Principal payments on term loan facility | (10.0) | (10.0) | |||||||||
| Principal payments on revolving credit facility | (10.0) | (10.0) | |||||||||
| Distributions paid to noncontrolling interests of consolidated affiliates | (2.2) | (2.5) | |||||||||
| Other | (2.6) | (3.4) | |||||||||
| Net cash used in financing activities | (24.8) | (25.9) | |||||||||
| Increase in cash, cash equivalents, and restricted cash | 0.4 | 9.3 | |||||||||
| Cash, cash equivalents, and restricted cash at beginning of period | 29.8 | 27.2 | |||||||||
| Cash, cash equivalents, and restricted cash at end of period | $ | 30.2 | $ | 36.5 | |||||||
8
Enhabit, Inc. and Subsidiaries
Supplemental Non-GAAP Information
(Unaudited)
| Reconciliation of Diluted Earnings Per Share to Adjusted Earnings Per Share | |||||||||||||||||||||||
| Three Months Ended June 30, | Six Months Ended June 30, | ||||||||||||||||||||||
| 2024 | 2023 | 2024 | 2023 | ||||||||||||||||||||
| Diluted earnings per share, as reported | $ | — | $ | (1.49) | $ | — | $ | (1.44) | |||||||||||||||
| Adjustments, net of tax: | |||||||||||||||||||||||
| Impairment of goodwill | — | 1.50 | — | 1.50 | |||||||||||||||||||
Unusual or nonrecurring items that are not typical of ongoing operations(1) | 0.07 | 0.03 | 0.13 | 0.07 | |||||||||||||||||||
Income tax adjustments(2) | — | — | 0.01 | 0.01 | |||||||||||||||||||
| Adjusted earnings per share | $ | 0.07 | $ | 0.04 | $ | 0.14 | $ | 0.14 | |||||||||||||||
(1) Unusual or nonrecurring items in the three and six months ended June 30, 2024 include costs associated with shareholder activism, the strategic review process and nonroutine litigation; in the three and six months ended June 30, 2023, they include nonroutine litigation and shareholder activism.
(2) Income tax adjustments include the effect of permanent book-tax differences attributable to stock-based compensation.
9
Enhabit, Inc. and Subsidiaries
Supplemental Non-GAAP Information
(Unaudited)
| Reconciliation of Adjusted EBITDA to Adjusted Earnings Per Share | |||||||||||||||||
| Three Months Ended June 30, | |||||||||||||||||
| 2024 | |||||||||||||||||
| Adjustments | |||||||||||||||||
| As Reported | Unusual or Nonrecurring Items That are Not Typical of Ongoing Operations | As Adjusted | |||||||||||||||
| ($ in millions, except per share data) | |||||||||||||||||
Adjusted EBITDA(1) | $ | 25.2 | $ | — | $ | 25.2 | |||||||||||
| Interest expense and amortization of debt discounts and fees | (10.9) | — | (10.9) | ||||||||||||||
| Depreciation and amortization | (7.6) | — | (7.6) | ||||||||||||||
| Stock-based compensation | (2.2) | — | (2.2) | ||||||||||||||
Unusual or nonrecurring items that are not typical of ongoing operations(2) | (4.8) | 4.8 | — | ||||||||||||||
| (Loss) income before income taxes | (0.3) | 4.8 | 4.5 | ||||||||||||||
| Income tax benefit (expense) | 0.1 | (1.3) | (1.2) | ||||||||||||||
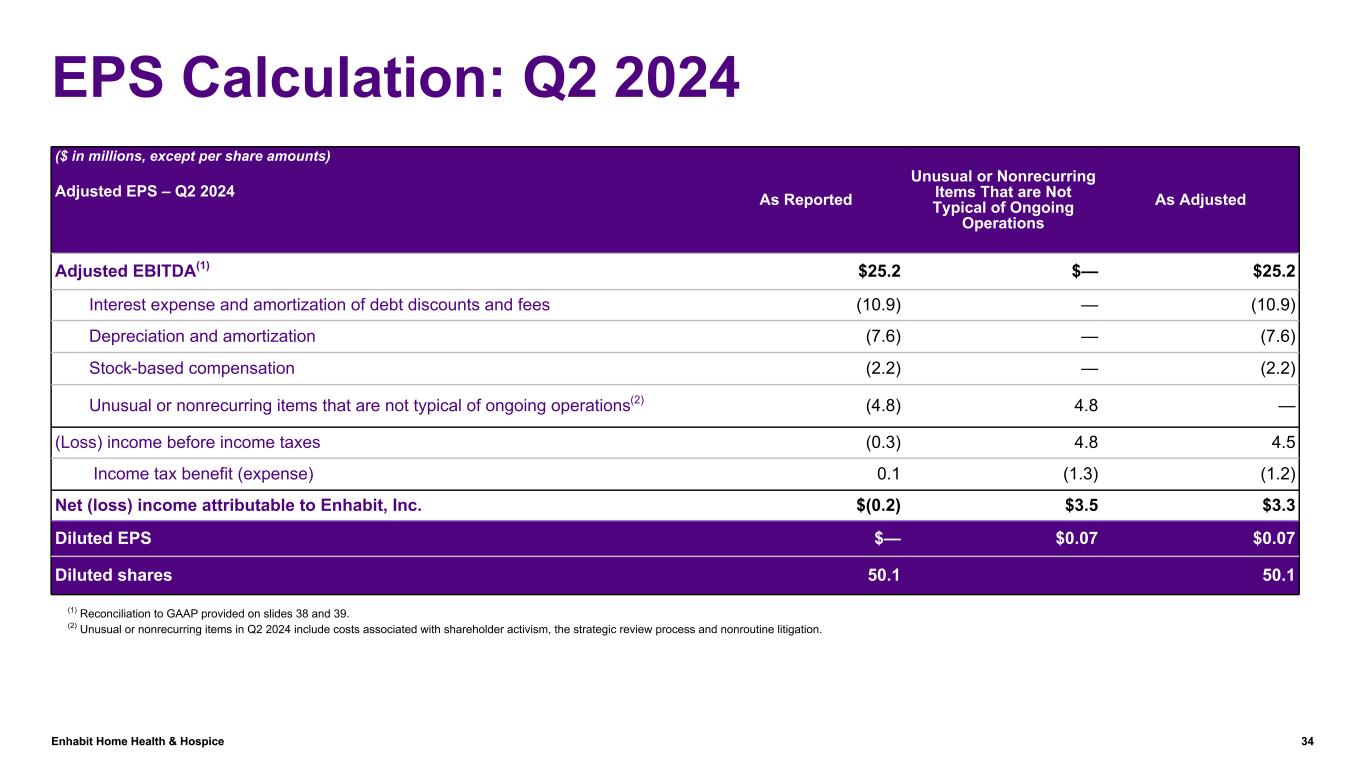
| Net (loss) income attributable to Enhabit, Inc. | $ | (0.2) | $ | 3.5 | $ | 3.3 | |||||||||||
Diluted EPS | $ | — | $ | 0.07 | $ | 0.07 | |||||||||||
| Diluted shares | 50.1 | 50.1 | |||||||||||||||
(1) Reconciliation to GAAP provided below.
(2) Unusual or nonrecurring items in Q2 2024 include costs associated with shareholder activism, the strategic review process and nonroutine litigation.
10
Enhabit, Inc. and Subsidiaries
Supplemental Non-GAAP Information
(Unaudited)
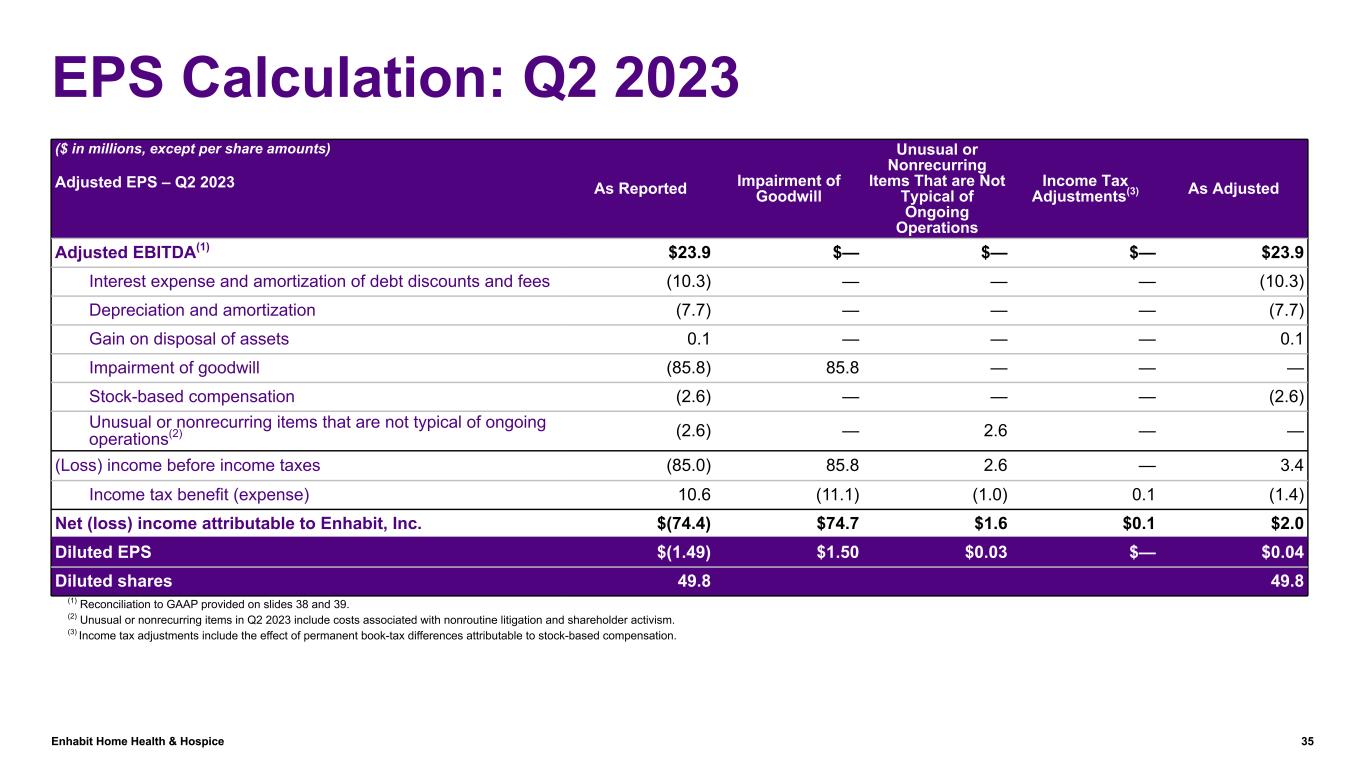
| Reconciliation of Adjusted EBITDA to Adjusted Earnings Per Share | |||||||||||||||||||||||||||||
| Three Months Ended June 30, | |||||||||||||||||||||||||||||
| 2023 | |||||||||||||||||||||||||||||
| Adjustments | |||||||||||||||||||||||||||||
| As Reported | Impairment of Goodwill | Unusual or Nonrecurring Items That are Not Typical of Ongoing Operations | Income Tax Adjustments(3) | As Adjusted | |||||||||||||||||||||||||
| ($ in millions, except per share data) | |||||||||||||||||||||||||||||
Adjusted EBITDA(1) | $ | 23.9 | $ | — | $ | — | $ | — | $ | 23.9 | |||||||||||||||||||
| Interest expense and amortization of debt discounts and fees | (10.3) | — | — | — | (10.3) | ||||||||||||||||||||||||
| Depreciation and amortization | (7.7) | — | — | — | (7.7) | ||||||||||||||||||||||||
| Gain on disposal of assets | 0.1 | — | — | — | 0.1 | ||||||||||||||||||||||||
| Impairment of goodwill | (85.8) | 85.8 | — | — | — | ||||||||||||||||||||||||
| Stock-based compensation | (2.6) | — | — | — | (2.6) | ||||||||||||||||||||||||
Unusual or nonrecurring items that are not typical of ongoing operations(2) | (2.6) | — | 2.6 | — | — | ||||||||||||||||||||||||
| (Loss) income before income taxes | (85.0) | 85.8 | 2.6 | — | 3.4 | ||||||||||||||||||||||||
| Income tax benefit (expense) | 10.6 | (11.1) | (1.0) | 0.1 | (1.4) | ||||||||||||||||||||||||
| Net (loss) income attributable to Enhabit, Inc. | $ | (74.4) | $ | 74.7 | $ | 1.6 | $ | 0.1 | $ | 2.0 | |||||||||||||||||||
Diluted EPS | $ | (1.49) | $ | 1.50 | $ | 0.03 | $ | — | $ | 0.04 | |||||||||||||||||||
| Diluted shares | 49.8 | 49.8 | |||||||||||||||||||||||||||
(1) Reconciliation to GAAP provided below.
(2) Unusual or nonrecurring items in Q2 2023 include costs associated with nonroutine litigation and shareholder activism.
(3) Income tax adjustments include the effect of permanent book-tax differences attributable to stock-based compensation.
11
Enhabit, Inc. and Subsidiaries
Supplemental Non-GAAP Information
(Unaudited)
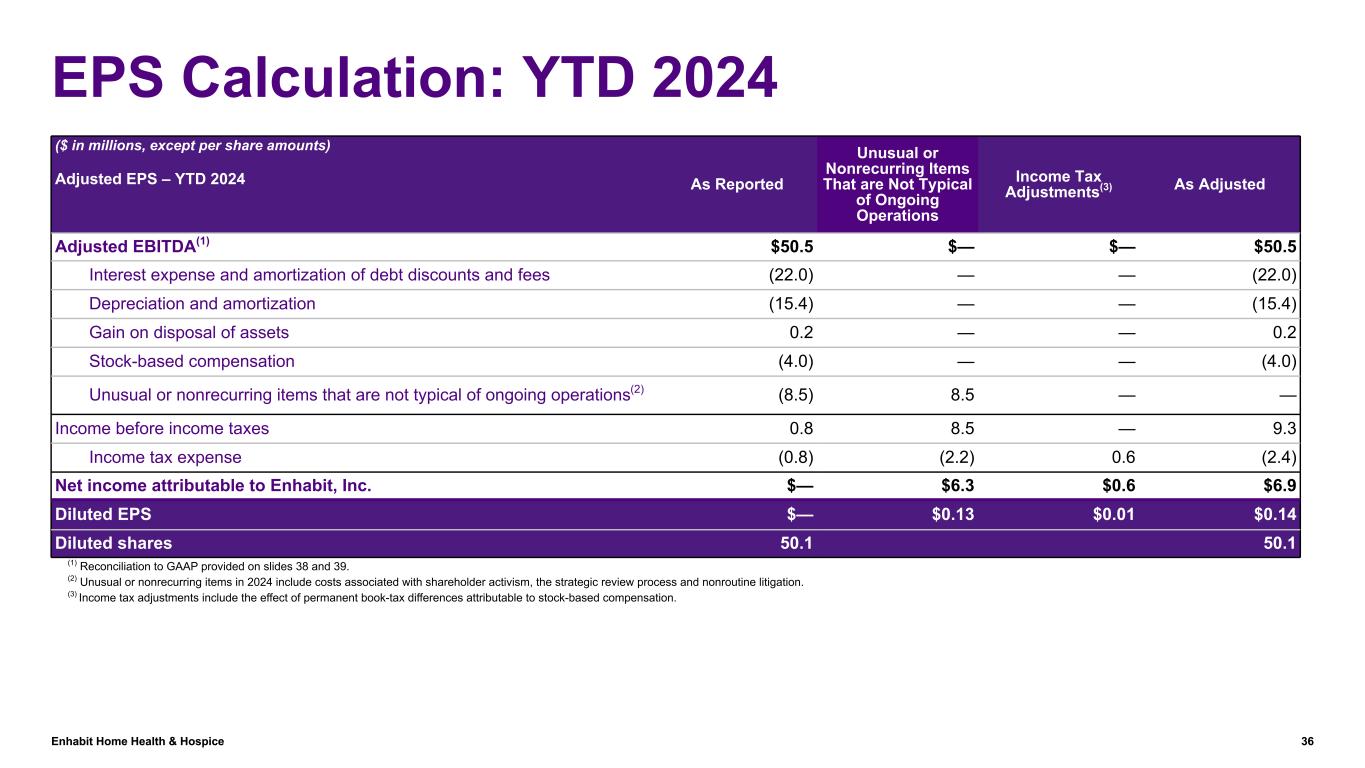
| Reconciliation of Adjusted EBITDA to Adjusted Earnings Per Share | |||||||||||||||||||||||
| Six Months Ended June 30, | |||||||||||||||||||||||
| 2024 | |||||||||||||||||||||||
| Adjustments | |||||||||||||||||||||||
| As Reported | Unusual or Nonrecurring Items That are Not Typical of Ongoing Operations | Income Tax Adjustments(3) | As Adjusted | ||||||||||||||||||||
| ($ in millions, except per share data) | |||||||||||||||||||||||
Adjusted EBITDA(1) | $ | 50.5 | $ | — | $ | — | $ | 50.5 | |||||||||||||||
| Interest expense and amortization of debt discounts and fees | (22.0) | — | — | (22.0) | |||||||||||||||||||
| Depreciation and amortization | (15.4) | — | — | (15.4) | |||||||||||||||||||
| Gain on disposal of assets | 0.2 | — | — | 0.2 | |||||||||||||||||||
| Stock-based compensation | (4.0) | — | — | (4.0) | |||||||||||||||||||
Unusual or nonrecurring items that are not typical of ongoing operations(2) | (8.5) | 8.5 | — | — | |||||||||||||||||||
| Income before income taxes | 0.8 | 8.5 | — | 9.3 | |||||||||||||||||||
| Income tax expense | (0.8) | (2.2) | 0.6 | (2.4) | |||||||||||||||||||
| Net income attributable to Enhabit, Inc. | $ | — | $ | 6.3 | $ | 0.6 | $ | 6.9 | |||||||||||||||
Diluted EPS | $ | — | $ | 0.13 | $ | 0.01 | $ | 0.14 | |||||||||||||||
| Diluted shares | 50.1 | 50.1 | |||||||||||||||||||||
(1) Reconciliation to GAAP provided below.
(2) Unusual or nonrecurring items in 2024 include costs associated with shareholder activism, the strategic review process and nonroutine litigation.
(3) Income tax adjustments include the effect of permanent book-tax differences attributable to stock-based compensation.
12
Enhabit, Inc. and Subsidiaries
Supplemental Non-GAAP Information
(Unaudited)
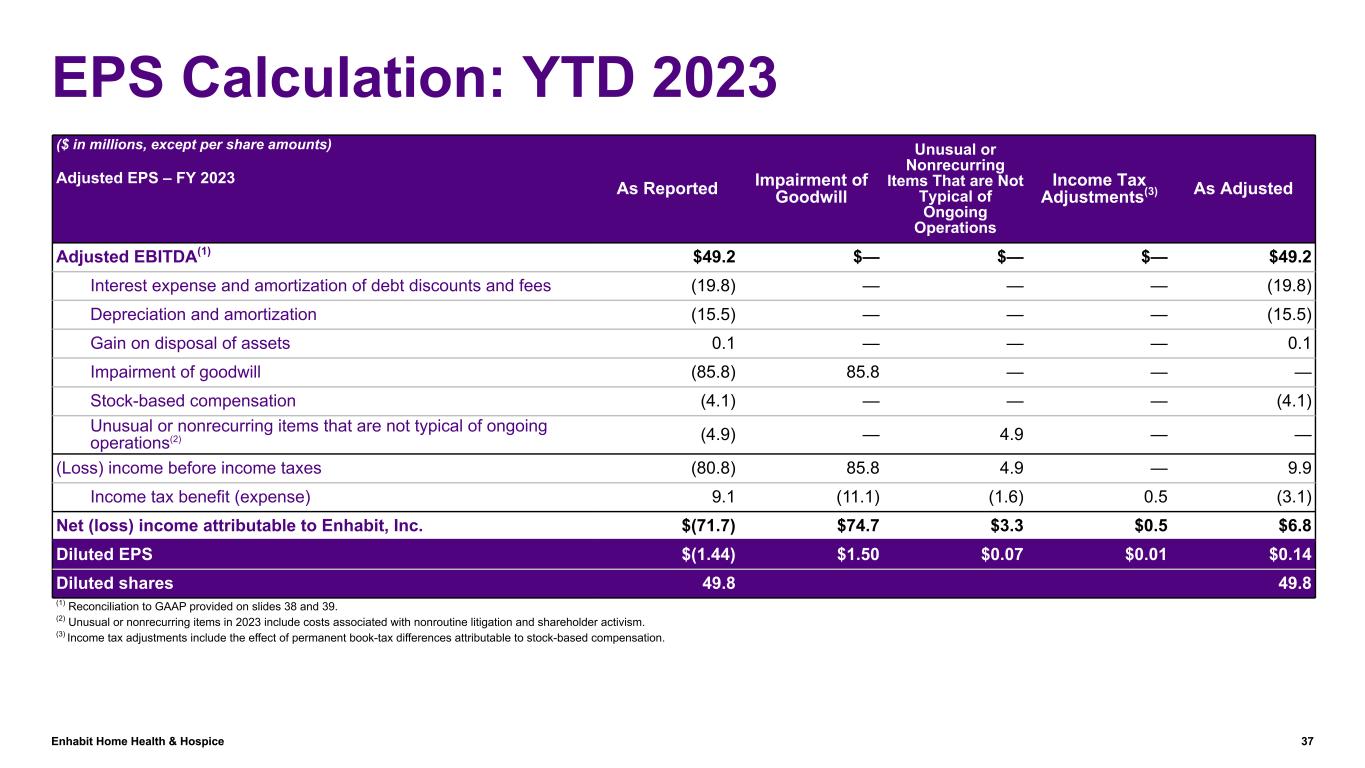
| Reconciliation of Adjusted EBITDA to Adjusted Earnings Per Share | |||||||||||||||||||||||||||||
| Six Months Ended June 30, | |||||||||||||||||||||||||||||
| 2023 | |||||||||||||||||||||||||||||
| Adjustments | |||||||||||||||||||||||||||||
| As Reported | Impairment of Goodwill | Unusual or Nonrecurring Items That are Not Typical of Ongoing Operations | Income Tax Adjustments(3) | As Adjusted | |||||||||||||||||||||||||
| ($ in millions, except per share data) | |||||||||||||||||||||||||||||
Adjusted EBITDA(1) | $ | 49.2 | $ | — | $ | — | $ | — | $ | 49.2 | |||||||||||||||||||
| Interest expense and amortization of debt discounts and fees | (19.8) | — | — | — | (19.8) | ||||||||||||||||||||||||
| Depreciation and amortization | (15.5) | — | — | — | (15.5) | ||||||||||||||||||||||||
| Gain on disposal of assets | 0.1 | — | — | — | 0.1 | ||||||||||||||||||||||||
| Impairment of goodwill | (85.8) | 85.8 | — | — | — | ||||||||||||||||||||||||
| Stock-based compensation | (4.1) | — | — | — | (4.1) | ||||||||||||||||||||||||
Unusual or nonrecurring items that are not typical of ongoing operations(2) | (4.9) | — | 4.9 | — | — | ||||||||||||||||||||||||
| (Loss) income before income taxes | (80.8) | 85.8 | 4.9 | — | 9.9 | ||||||||||||||||||||||||
| Income tax benefit (expense) | 9.1 | (11.1) | (1.6) | 0.5 | (3.1) | ||||||||||||||||||||||||
| Net (loss) income attributable to Enhabit, Inc. | $ | (71.7) | $ | 74.7 | $ | 3.3 | $ | 0.5 | $ | 6.8 | |||||||||||||||||||
Diluted EPS | $ | (1.44) | $ | 1.50 | $ | 0.07 | $ | 0.01 | $ | 0.14 | |||||||||||||||||||
| Diluted shares | 49.8 | 49.8 | |||||||||||||||||||||||||||
(1) Reconciliation to GAAP provided below.
(2) Unusual or nonrecurring items in 2023 include costs associated with nonroutine litigation and shareholder activism.
(3) Income tax adjustments include the effect of permanent book-tax differences attributable to stock-based compensation.
13
Enhabit, Inc. and Subsidiaries
Supplemental Non-GAAP Information
(Unaudited)
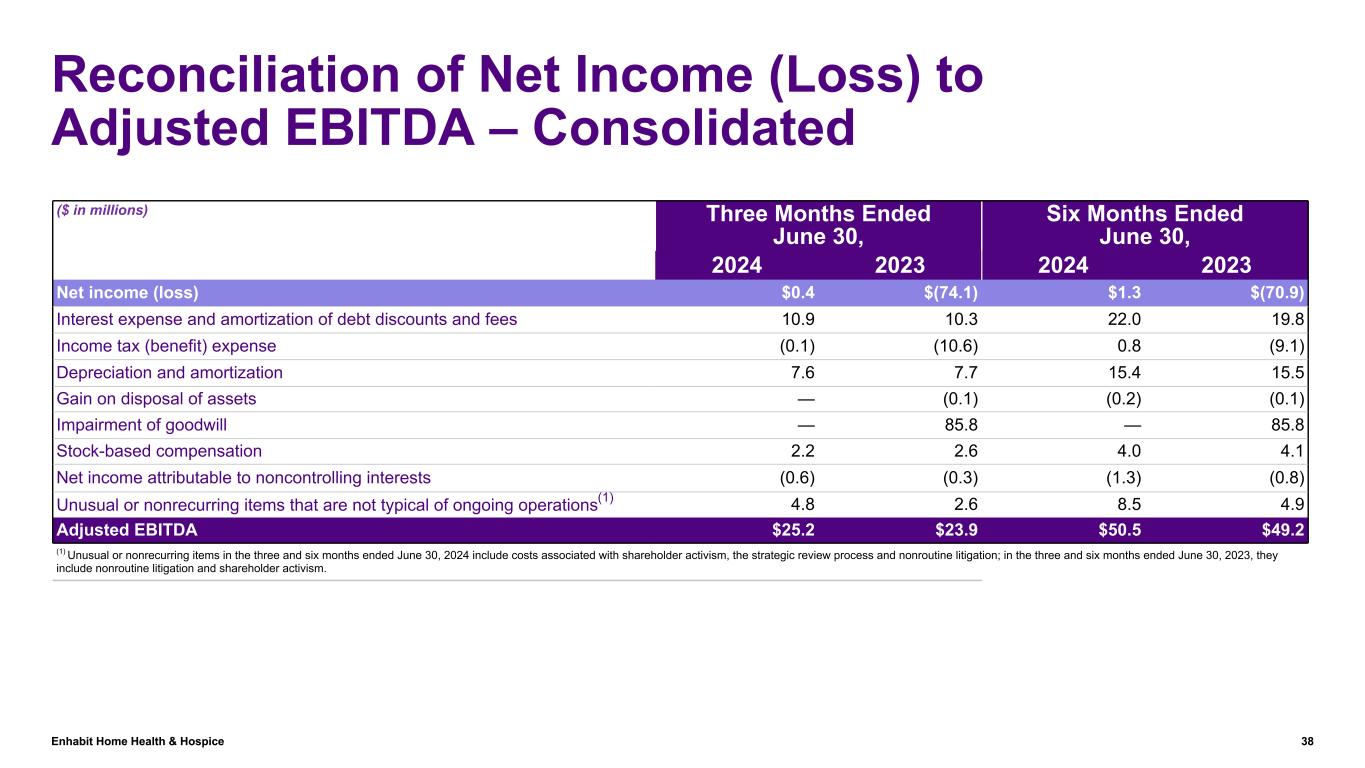
| Reconciliation of Net Income (Loss) to Adjusted EBITDA | |||||||||||||||||||||||
| Three Months Ended June 30, | Six Months Ended June 30, | ||||||||||||||||||||||
| 2024 | 2023 | 2024 | 2023 | ||||||||||||||||||||
| ($ in millions) | |||||||||||||||||||||||
| Net income (loss) | $ | 0.4 | $ | (74.1) | $ | 1.3 | $ | (70.9) | |||||||||||||||
| Interest expense and amortization of debt discounts and fees | 10.9 | 10.3 | 22.0 | 19.8 | |||||||||||||||||||
| Income tax (benefit) expense | (0.1) | (10.6) | 0.8 | (9.1) | |||||||||||||||||||
| Depreciation and amortization | 7.6 | 7.7 | 15.4 | 15.5 | |||||||||||||||||||
| Gain on disposal of assets | — | (0.1) | (0.2) | (0.1) | |||||||||||||||||||
| Impairment of goodwill | — | 85.8 | — | 85.8 | |||||||||||||||||||
| Stock-based compensation | 2.2 | 2.6 | 4.0 | 4.1 | |||||||||||||||||||
| Net income attributable to noncontrolling interests | (0.6) | (0.3) | (1.3) | (0.8) | |||||||||||||||||||
Unusual or nonrecurring items that are not typical of ongoing operations(1) | 4.8 | 2.6 | 8.5 | 4.9 | |||||||||||||||||||
| Adjusted EBITDA | $ | 25.2 | $ | 23.9 | $ | 50.5 | $ | 49.2 | |||||||||||||||
(1) Unusual or nonrecurring items in the three and six months ended June 30, 2024 include costs associated with shareholder activism, the strategic review process and nonroutine litigation; in the three and six months ended June 30, 2023, they include nonroutine litigation and shareholder activism.
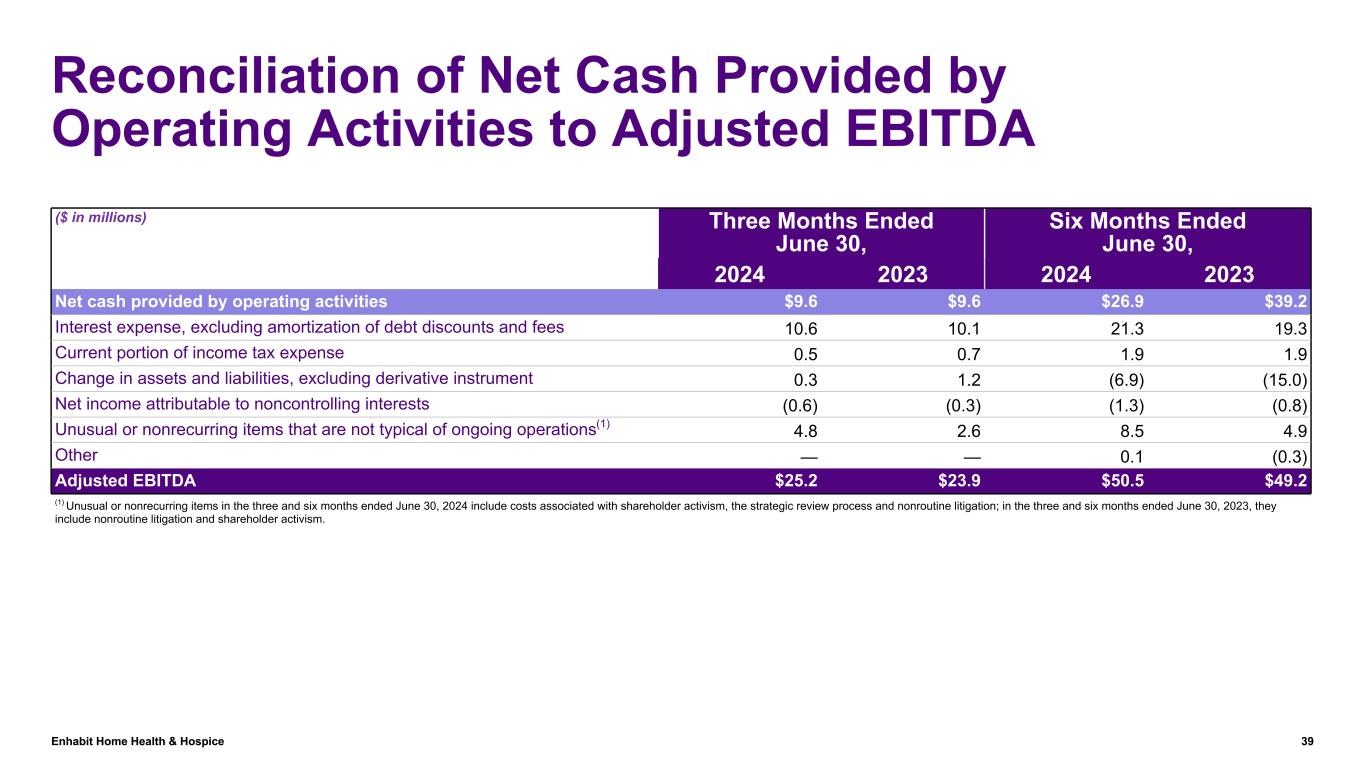
Reconciliation of Net Cash Provided by Operating Activities to Adjusted EBITDA | |||||||||||||||||||||||
| Three Months Ended June 30, | Six Months Ended June 30, | ||||||||||||||||||||||
| 2024 | 2023 | 2024 | 2023 | ||||||||||||||||||||
| ($ in millions) | |||||||||||||||||||||||
| Net cash provided by operating activities | $ | 9.6 | $ | 9.6 | $ | 26.9 | $ | 39.2 | |||||||||||||||
| Interest expense, excluding amortization of debt discounts and fees | 10.6 | 10.1 | 21.3 | 19.3 | |||||||||||||||||||
| Current portion of income tax expense | 0.5 | 0.7 | 1.9 | 1.9 | |||||||||||||||||||
| Change in assets and liabilities, excluding derivative instrument | 0.3 | 1.2 | (6.9) | (15.0) | |||||||||||||||||||
| Net income attributable to noncontrolling interests | (0.6) | (0.3) | (1.3) | (0.8) | |||||||||||||||||||
Unusual or nonrecurring items that are not typical of ongoing operations(1) | 4.8 | 2.6 | 8.5 | 4.9 | |||||||||||||||||||
| Other | — | — | 0.1 | (0.3) | |||||||||||||||||||
| Adjusted EBITDA | $ | 25.2 | $ | 23.9 | $ | 50.5 | $ | 49.2 | |||||||||||||||
(1) Unusual or nonrecurring items in the three and six months ended June 30, 2024 include costs associated with shareholder activism, the strategic review process and nonroutine litigation; in the three and six months ended June 30, 2023, they include nonroutine litigation and shareholder activism.
14
Enhabit, Inc. and Subsidiaries
Supplemental Non-GAAP Information
(Unaudited)
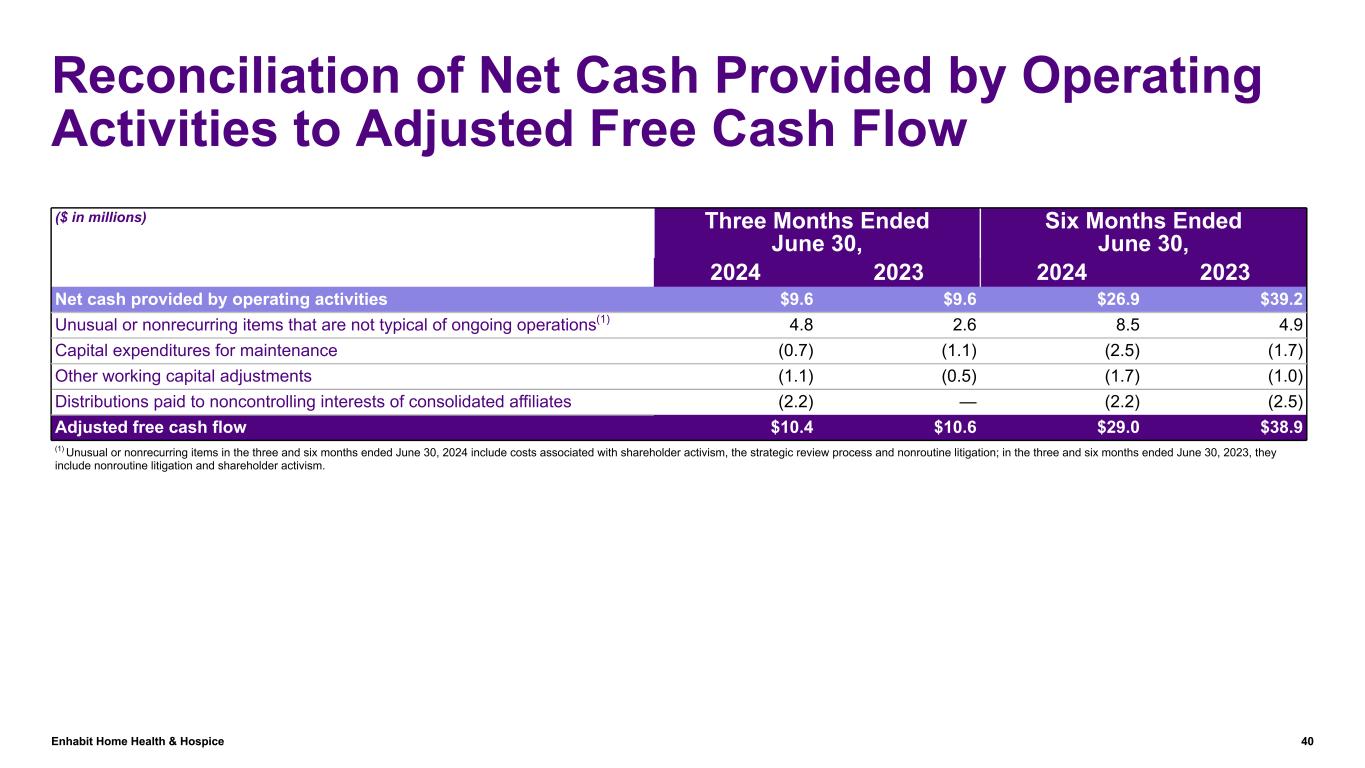
| Reconciliation of Net Cash Provided by Operating Activities to Adjusted Free Cash Flow | |||||||||||||||||||||||
| Three Months Ended June 30, | Six Months Ended June 30, | ||||||||||||||||||||||
| 2024 | 2023 | 2024 | 2023 | ||||||||||||||||||||
| ($ in millions) | |||||||||||||||||||||||
| Net cash provided by operating activities | $ | 9.6 | $ | 9.6 | $ | 26.9 | $ | 39.2 | |||||||||||||||
Unusual or nonrecurring items that are not typical of ongoing operations(1) | 4.8 | 2.6 | 8.5 | 4.9 | |||||||||||||||||||
| Capital expenditures for maintenance | (0.7) | (1.1) | (2.5) | (1.7) | |||||||||||||||||||
| Other working capital adjustments | (1.1) | (0.5) | (1.7) | (1.0) | |||||||||||||||||||
| Distributions paid to noncontrolling interests of consolidated affiliates | (2.2) | — | (2.2) | (2.5) | |||||||||||||||||||
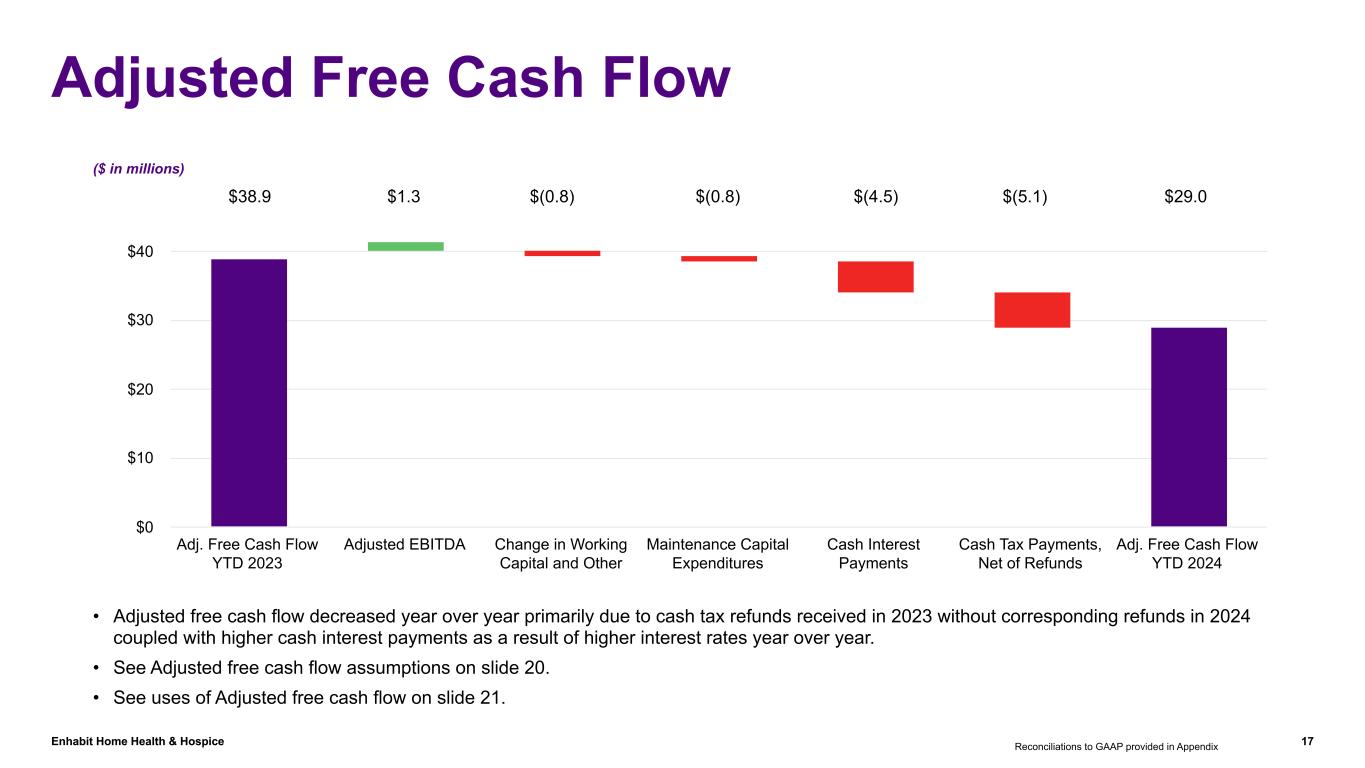
| Adjusted free cash flow | $ | 10.4 | $ | 10.6 | $ | 29.0 | $ | 38.9 | |||||||||||||||
(1) Unusual or nonrecurring items in the three and six months ended June 30, 2024 include costs associated with shareholder activism, the strategic review process and nonroutine litigation; in the three and six months ended June 30, 2023, they include nonroutine litigation and shareholder activism.
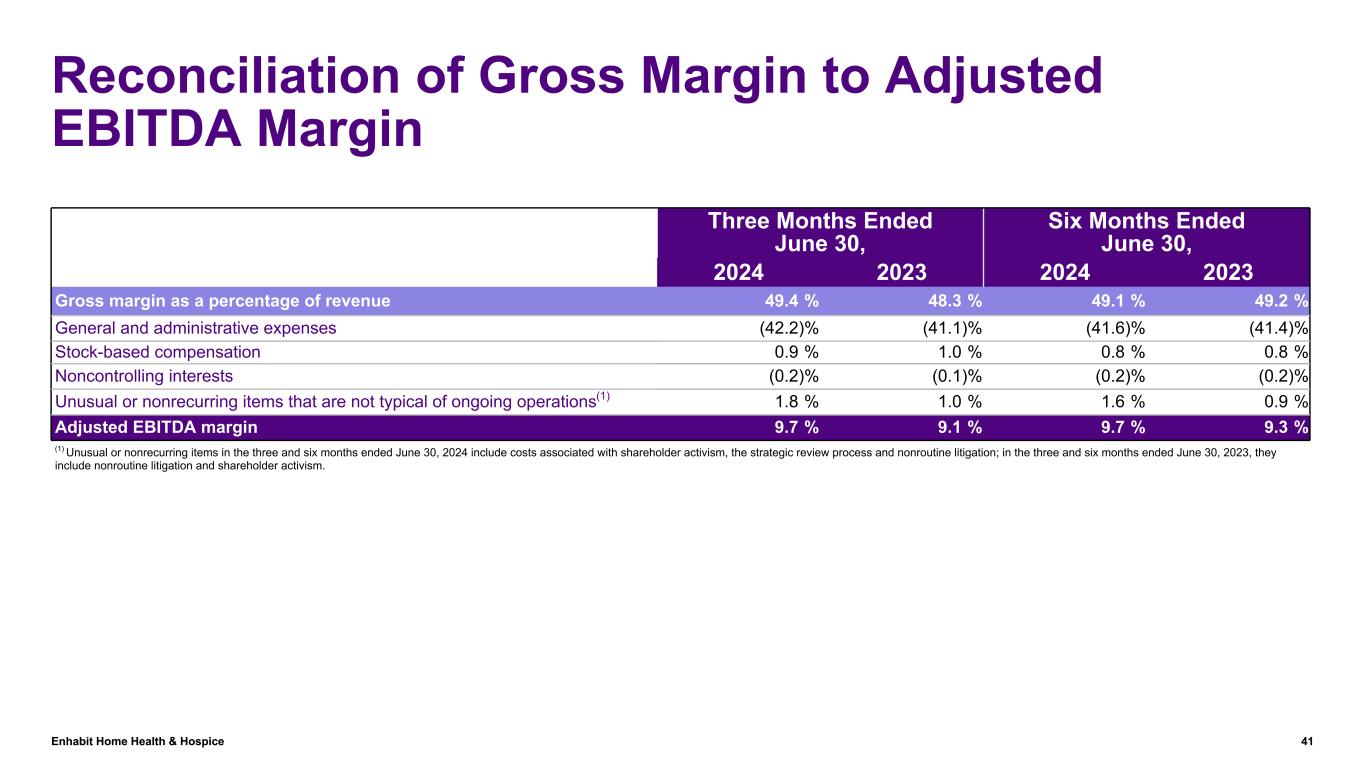
| Reconciliation of Gross Margin to Adjusted EBITDA Margin | |||||||||||||||||||||||
| Three Months Ended June 30, | Six Months Ended June 30, | ||||||||||||||||||||||
| 2024 | 2023 | 2024 | 2023 | ||||||||||||||||||||
| Gross margin as a percentage of revenue | 49.4 | % | 48.3 | % | 49.1 | % | 49.2 | % | |||||||||||||||
| General and administrative expenses | (42.2) | % | (41.1) | % | (41.6) | % | (41.4) | % | |||||||||||||||
| Stock-based compensation | 0.9 | % | 1.0 | % | 0.8 | % | 0.8 | % | |||||||||||||||
| Noncontrolling interests | (0.2) | % | (0.1) | % | (0.2) | % | (0.2) | % | |||||||||||||||
Unusual or nonrecurring items that are not typical of ongoing operations(1) | 1.8 | % | 1.0 | % | 1.6 | % | 0.9 | % | |||||||||||||||
| Adjusted EBITDA margin | 9.7 | % | 9.1 | % | 9.7 | % | 9.3 | % | |||||||||||||||
(1) Unusual or nonrecurring items in the three and six months ended June 30, 2024 include costs associated with shareholder activism, the strategic review process and nonroutine litigation; in the three and six months ended June 30, 2023, they include nonroutine litigation and shareholder activism.
15
FORWARD-LOOKING STATEMENTS
Statements contained in this press release which are not historical facts, such as those relating to future events, projections, financial guidance, legislative or regulatory developments, strategy or growth opportunities, are forward-looking statements within the meaning of the Private Securities Litigation Reform Act of 1995. All such estimates, projections and forward-looking information speak only as of the date hereof, and Enhabit undertakes no duty to publicly update or revise such forward-looking information, whether as a result of new information, future events or otherwise. Such forward-looking statements are necessarily estimates based upon current information and involve a number of risks and uncertainties, many of which are beyond our control. Actual events or results may differ materially from the results anticipated in these forward-looking statements as a result of a variety of factors. While it is impossible to identify all such factors, factors which could cause actual events or results to differ materially from those estimated by the Company include, but are not limited to, our ability to execute on our strategic plans; regulatory and other developments impacting the markets for our services; changes in reimbursement rates; general economic conditions; changes in the episodic versus non-episodic mix of our payors, the case mix of our patients, and payment methodologies; our ability to attract and retain key management personnel and health care professionals; potential disruptions or breaches of our or our vendors’, payors’, and other contract counterparties’ information systems; the outcome of litigation; our ability to successfully complete and integrate de novo locations, acquisitions, investments, and joint ventures; our ability to successfully integrate technology in our operations; and our ability to control costs, particularly labor and employee benefit costs. Additional information regarding risks and factors that could cause actual results to differ materially from those expressed or implied by any forward-looking statement in this press release are described in reports filed with the SEC, including our annual report on Form 10-K and subsequent quarterly reports on Form 10-Q, copies of which are available on the Company’s website at http://investors.ehab.com.
Investor relations contact
Crissy Carlisle
469-860-6061
Media contact
Erin Volbeda
972-338-5141
16