Exhibit 99.1
| Media Contact | April 24, 2025 | ||||
| Polly Manuel, 205 969-4532 | |||||
| [email protected] | |||||
| Investor Relations Contact | |||||
| Mark Miller, 205 970-5860 | |||||
| [email protected] | |||||
Encompass Health reports results for first quarter 2025
Increases full-year guidance
BIRMINGHAM, Ala. - Encompass Health Corporation (NYSE: EHC), the largest owner and operator of inpatient rehabilitation hospitals in the United States, today reported its results of operations for the first quarter ended March 31, 2025.
Summary results
| Growth | |||||||||||||||||||||||
| Q1 2025 | Q1 2024 | Dollars | Percent | ||||||||||||||||||||
| (In Millions, Except Per Share Data) | |||||||||||||||||||||||
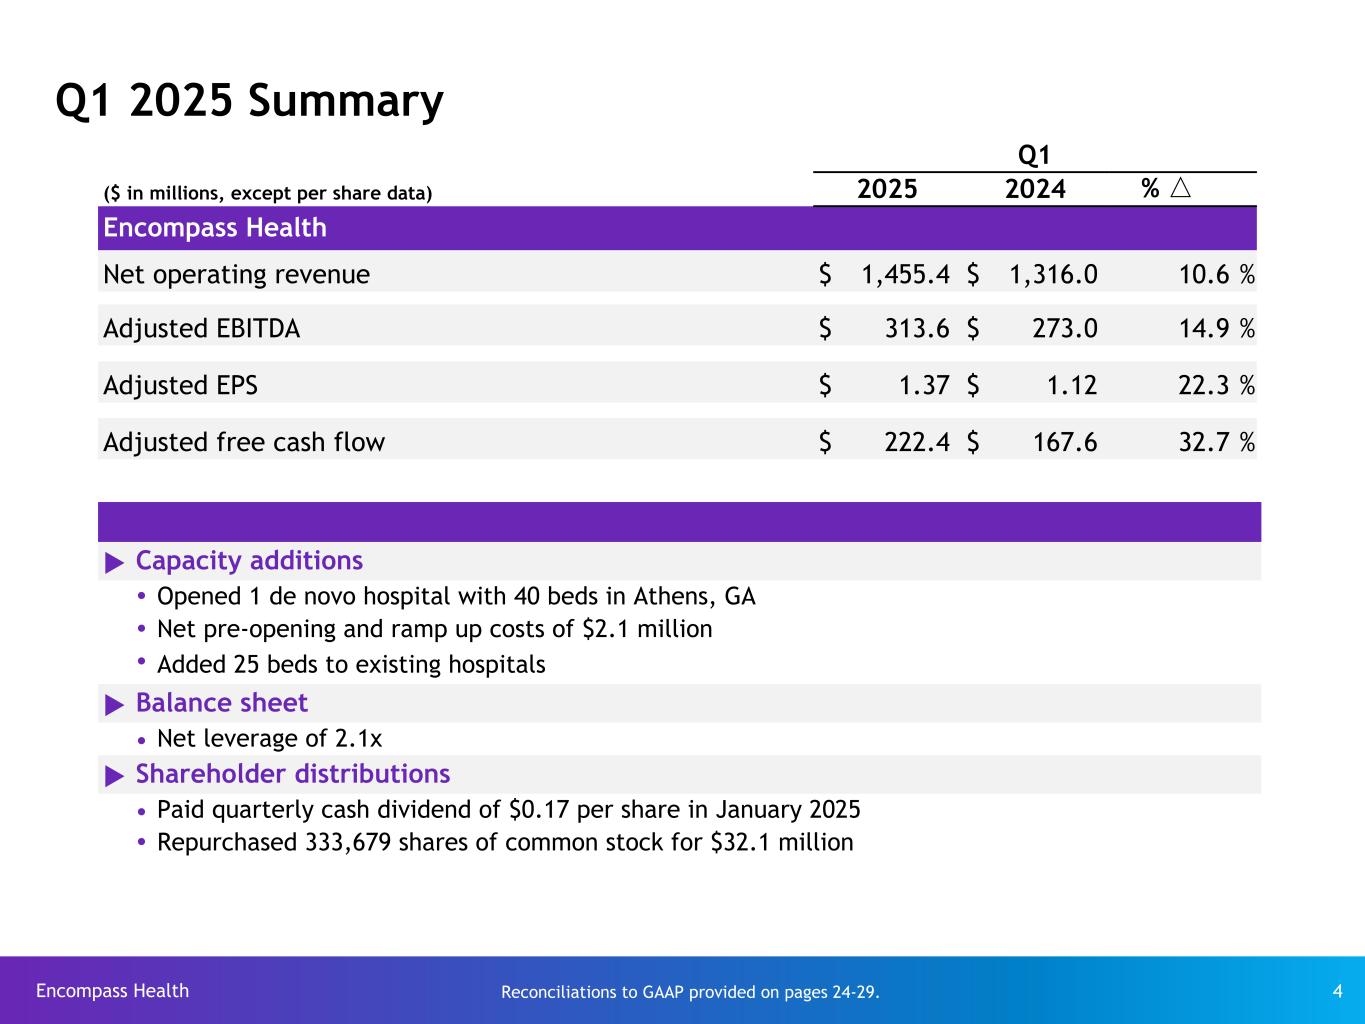
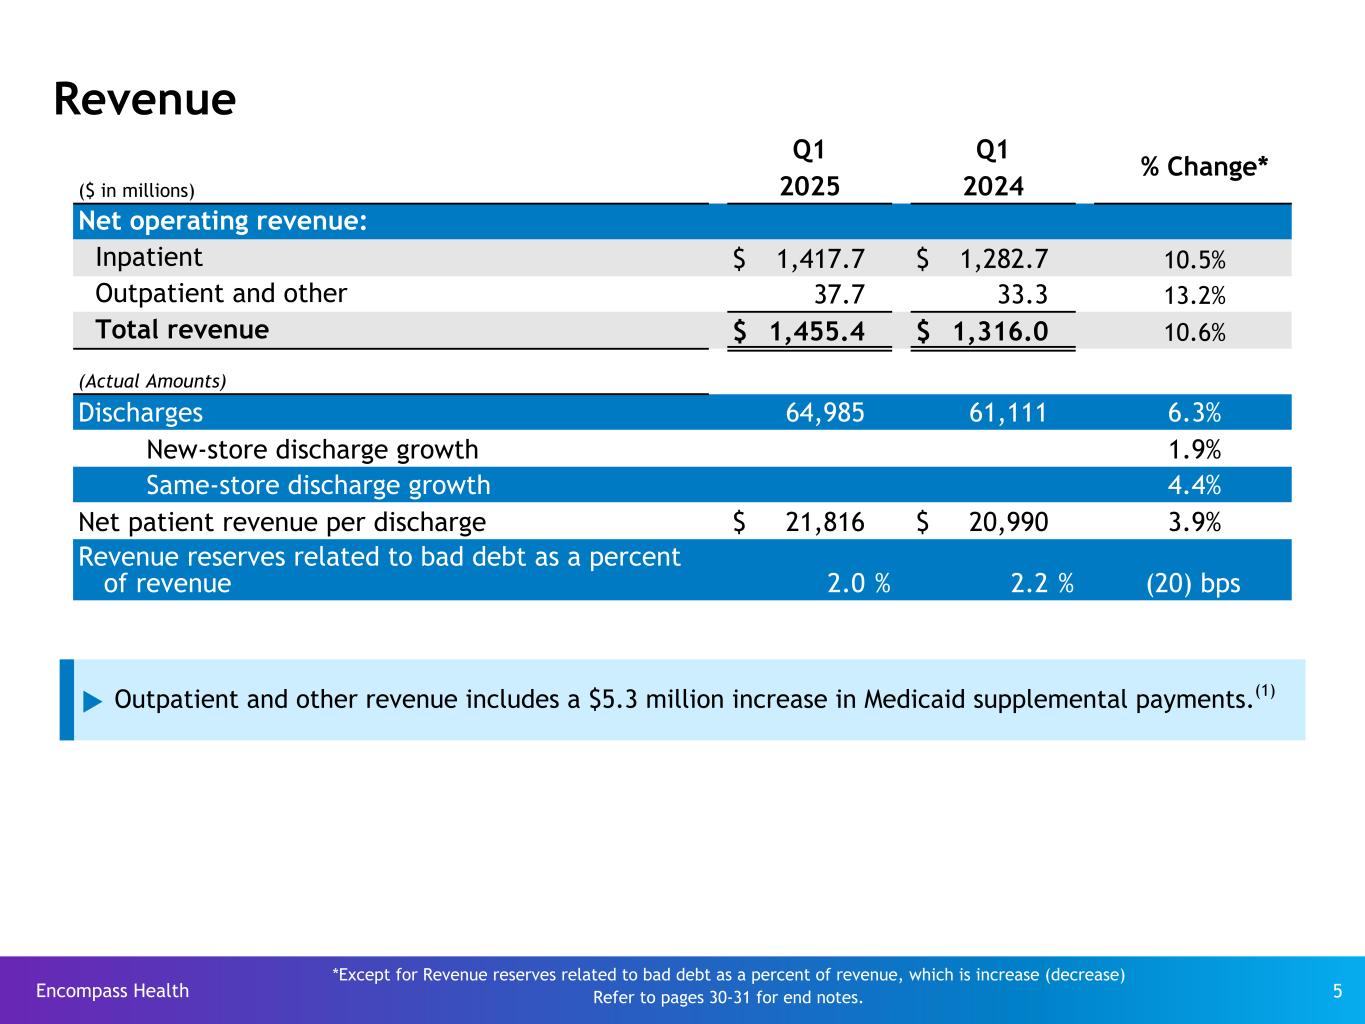
| Net operating revenue | $ | 1,455.4 | $ | 1,316.0 | $ | 139.4 | 10.6 | % | |||||||||||||||
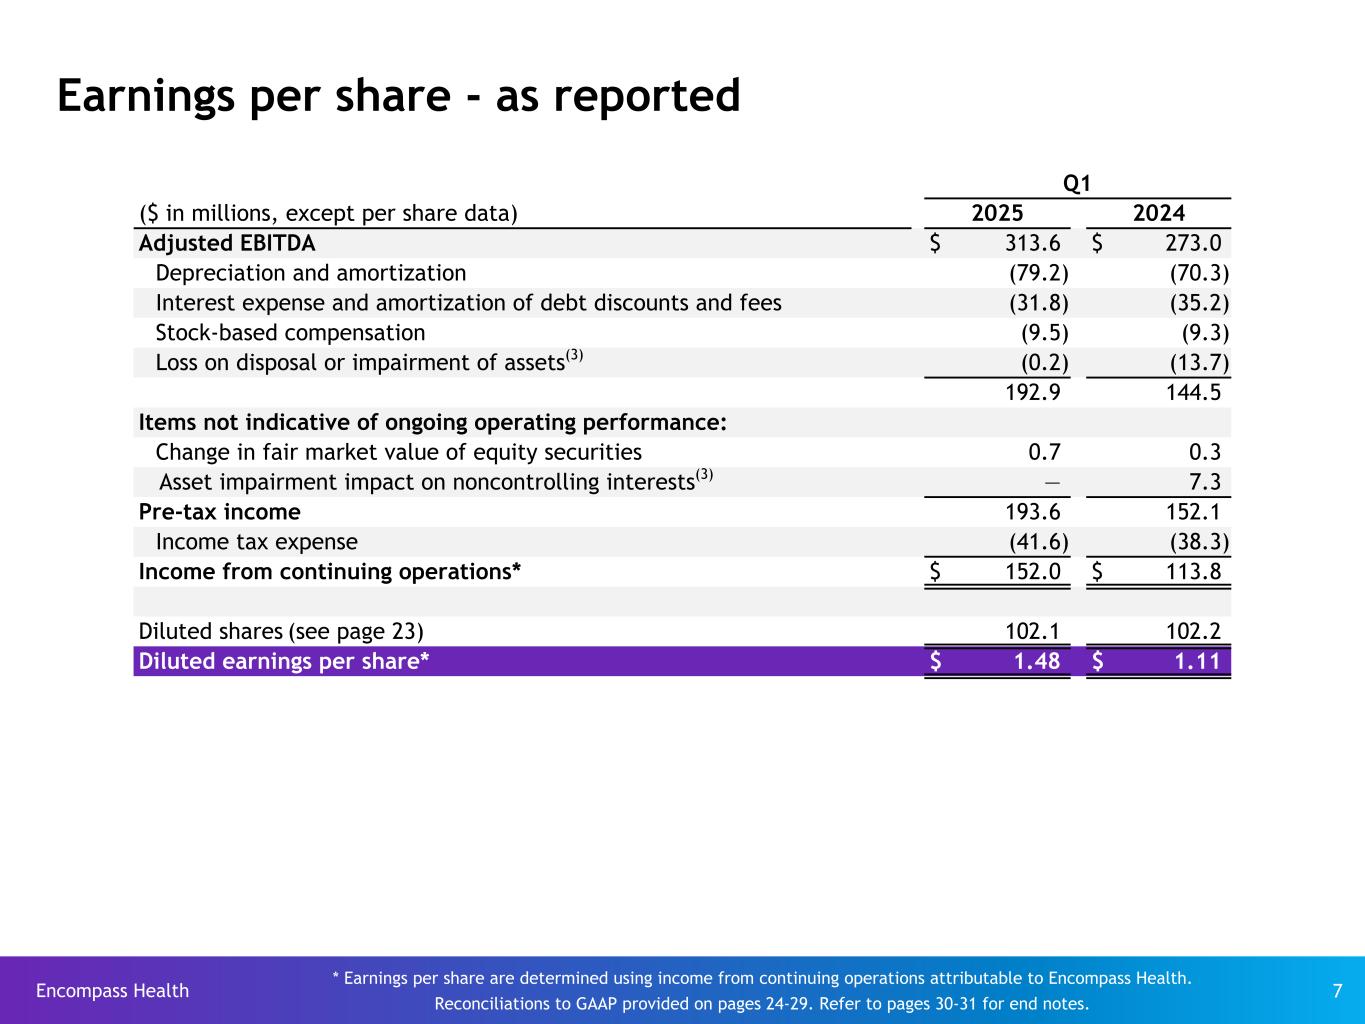
Income from continuing operations attributable to Encompass Health per diluted share | 1.48 | 1.11 | 0.37 | 33.3 | % | ||||||||||||||||||
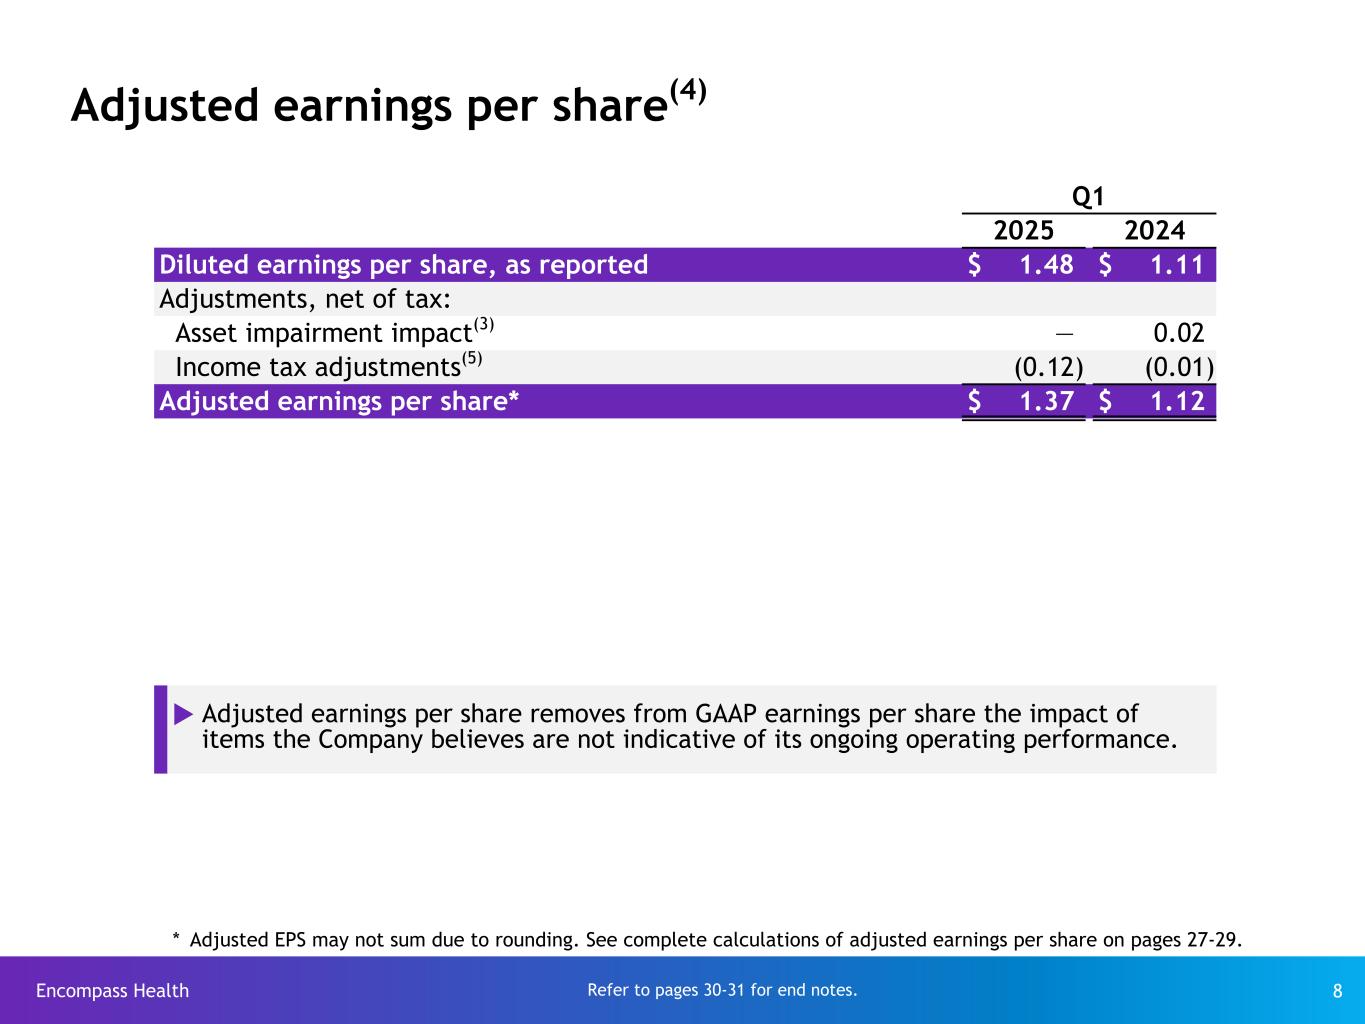
| Adjusted earnings per share | 1.37 | 1.12 | 0.25 | 22.3 | % | ||||||||||||||||||
Cash flows provided by operating activities | 288.6 | 238.8 | 49.8 | 20.9 | % | ||||||||||||||||||
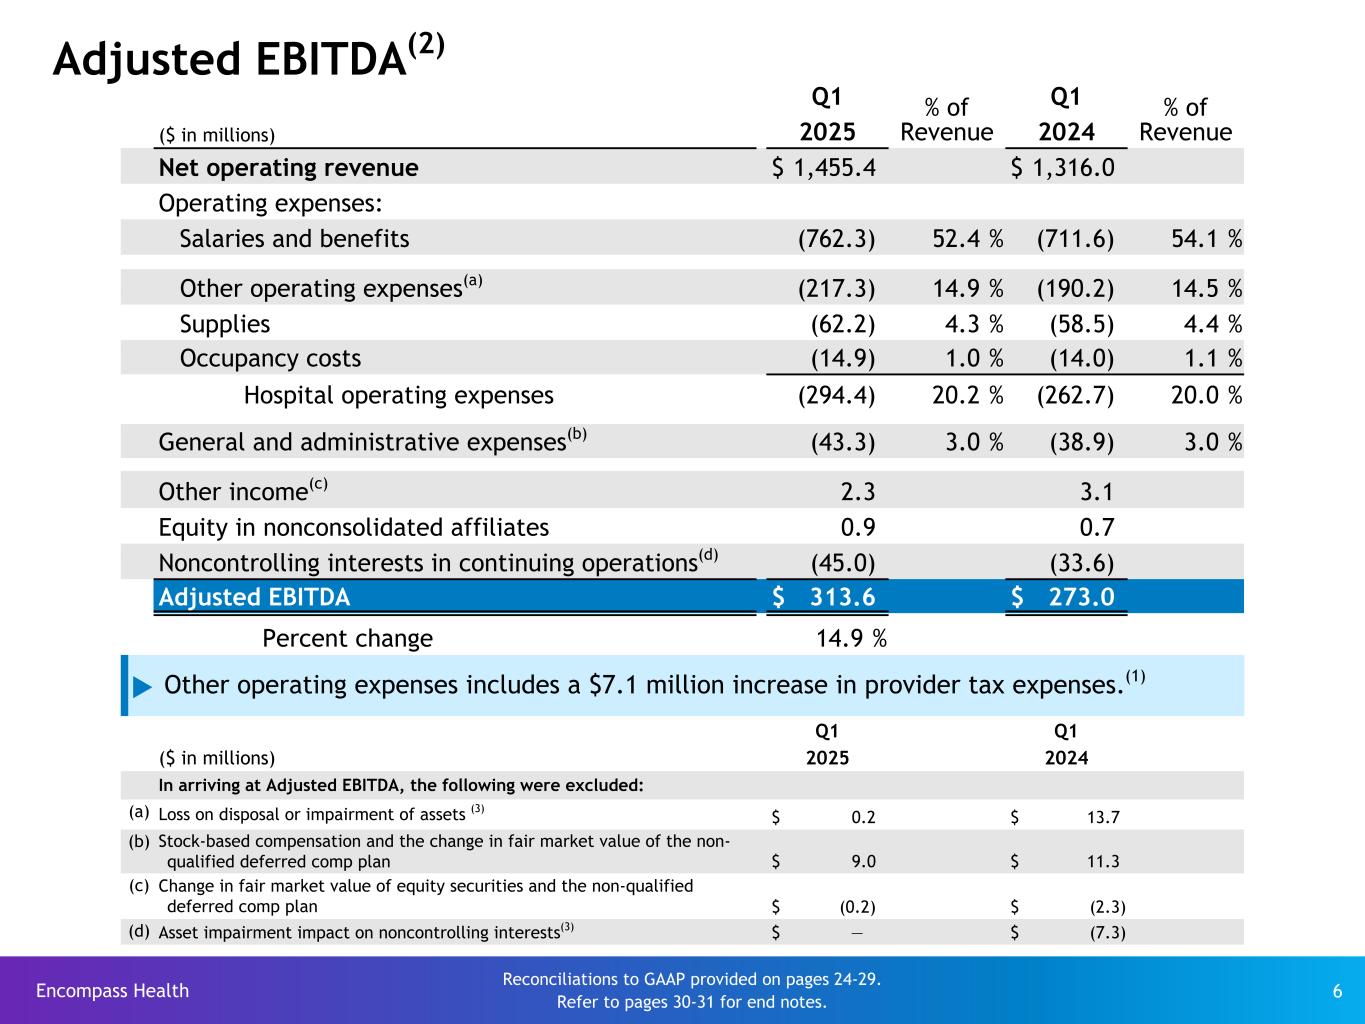
| Adjusted EBITDA | 313.6 | 273.0 | 40.6 | 14.9 | % | ||||||||||||||||||
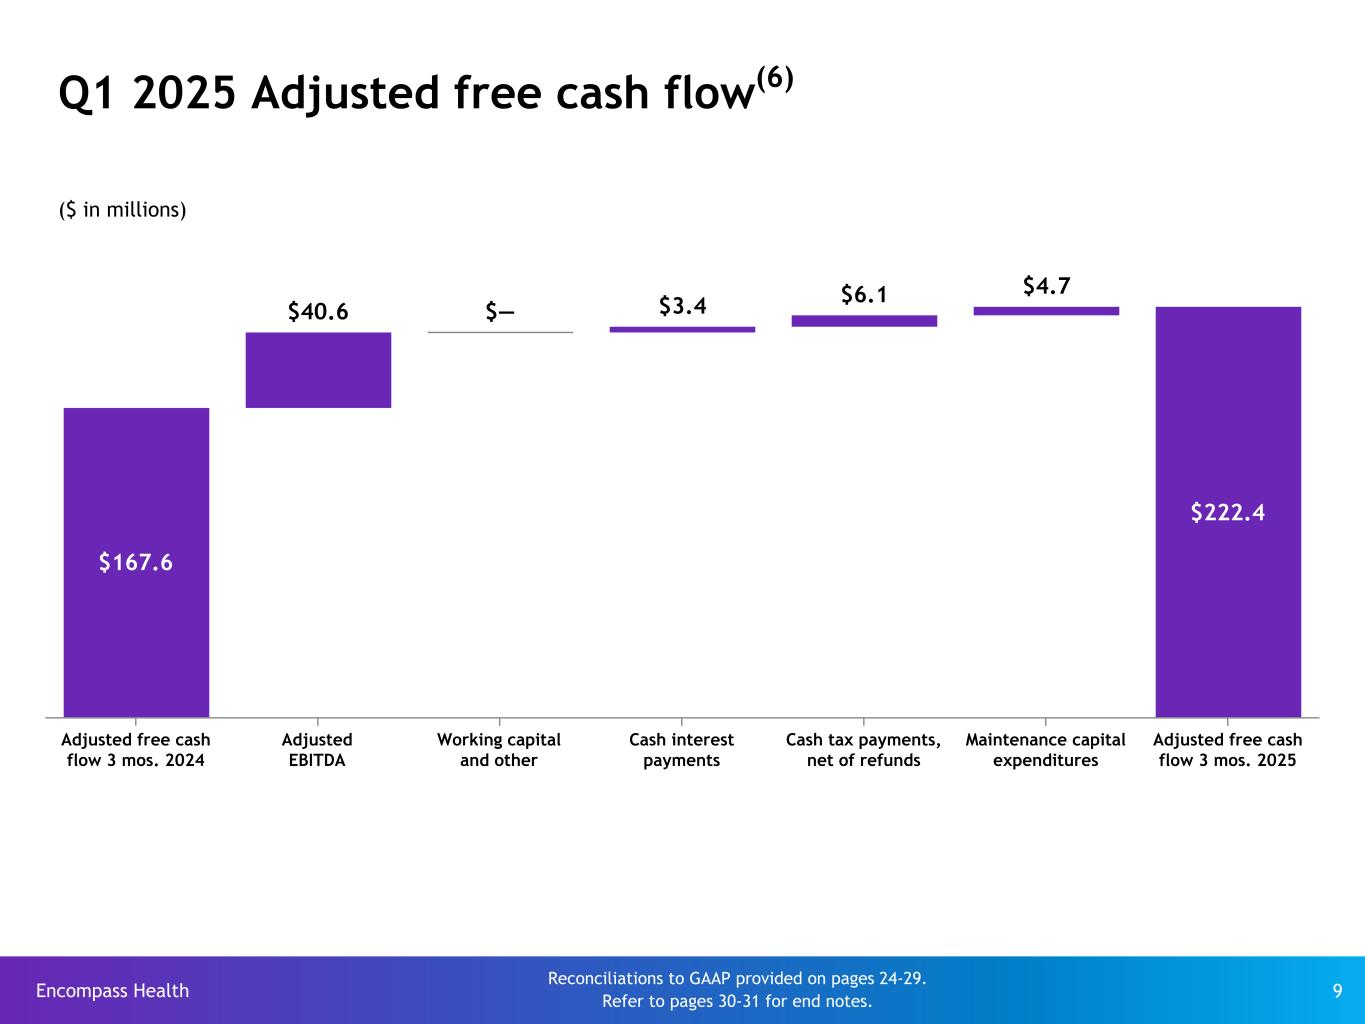
| Adjusted free cash flow | 222.4 | 167.6 | 54.8 | 32.7 | % | ||||||||||||||||||
| (Actual Amounts) | |||||||||||||||||||||||
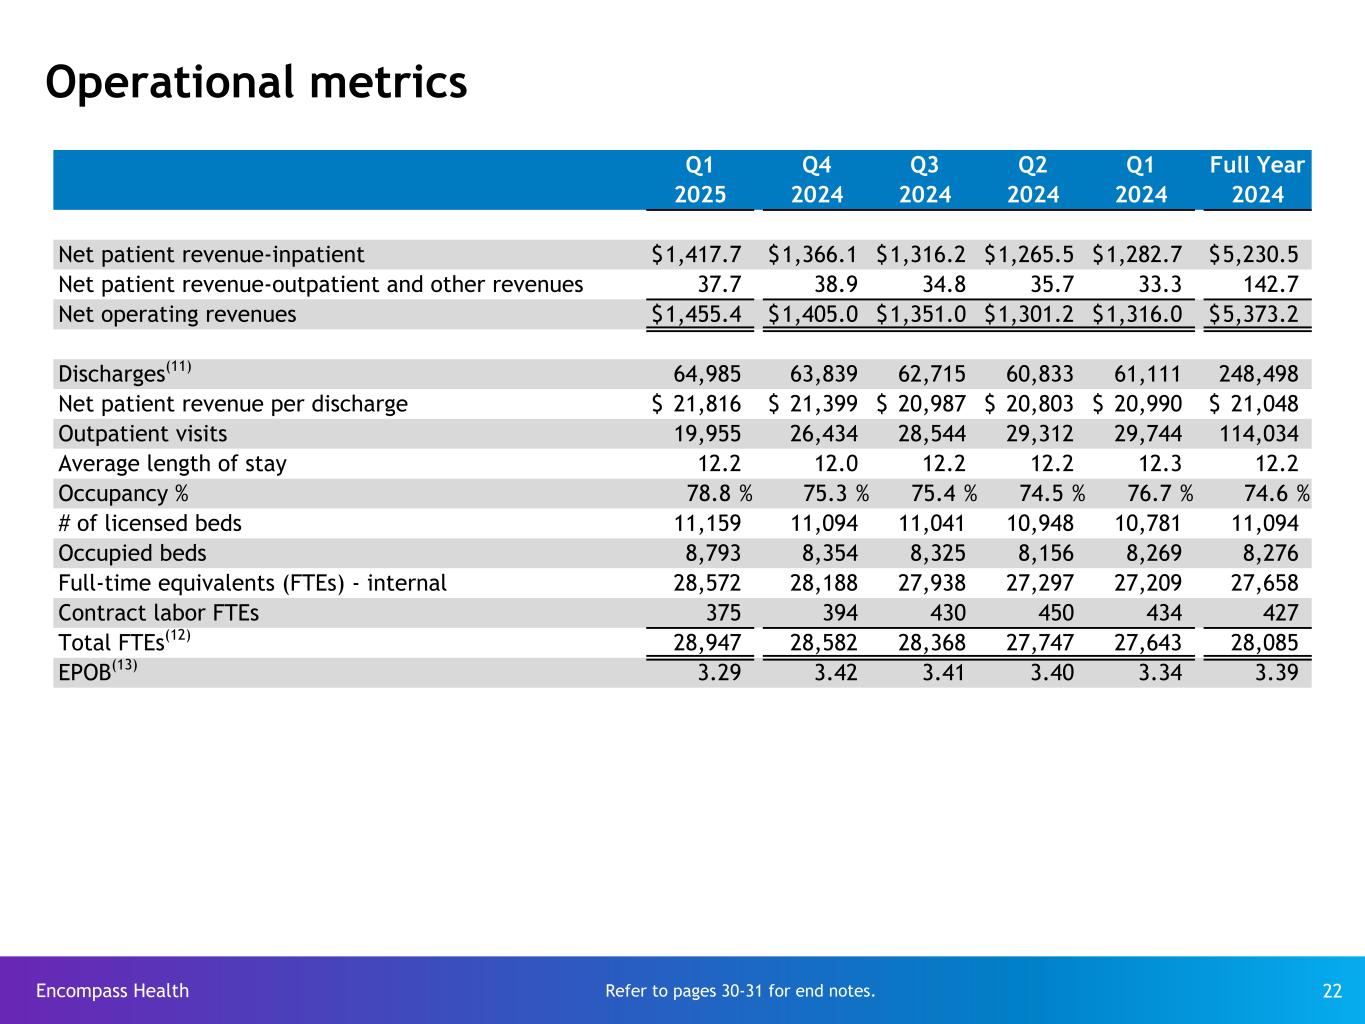
| Discharges | 64,985 | 61,111 | 6.3 | % | |||||||||||||||||||
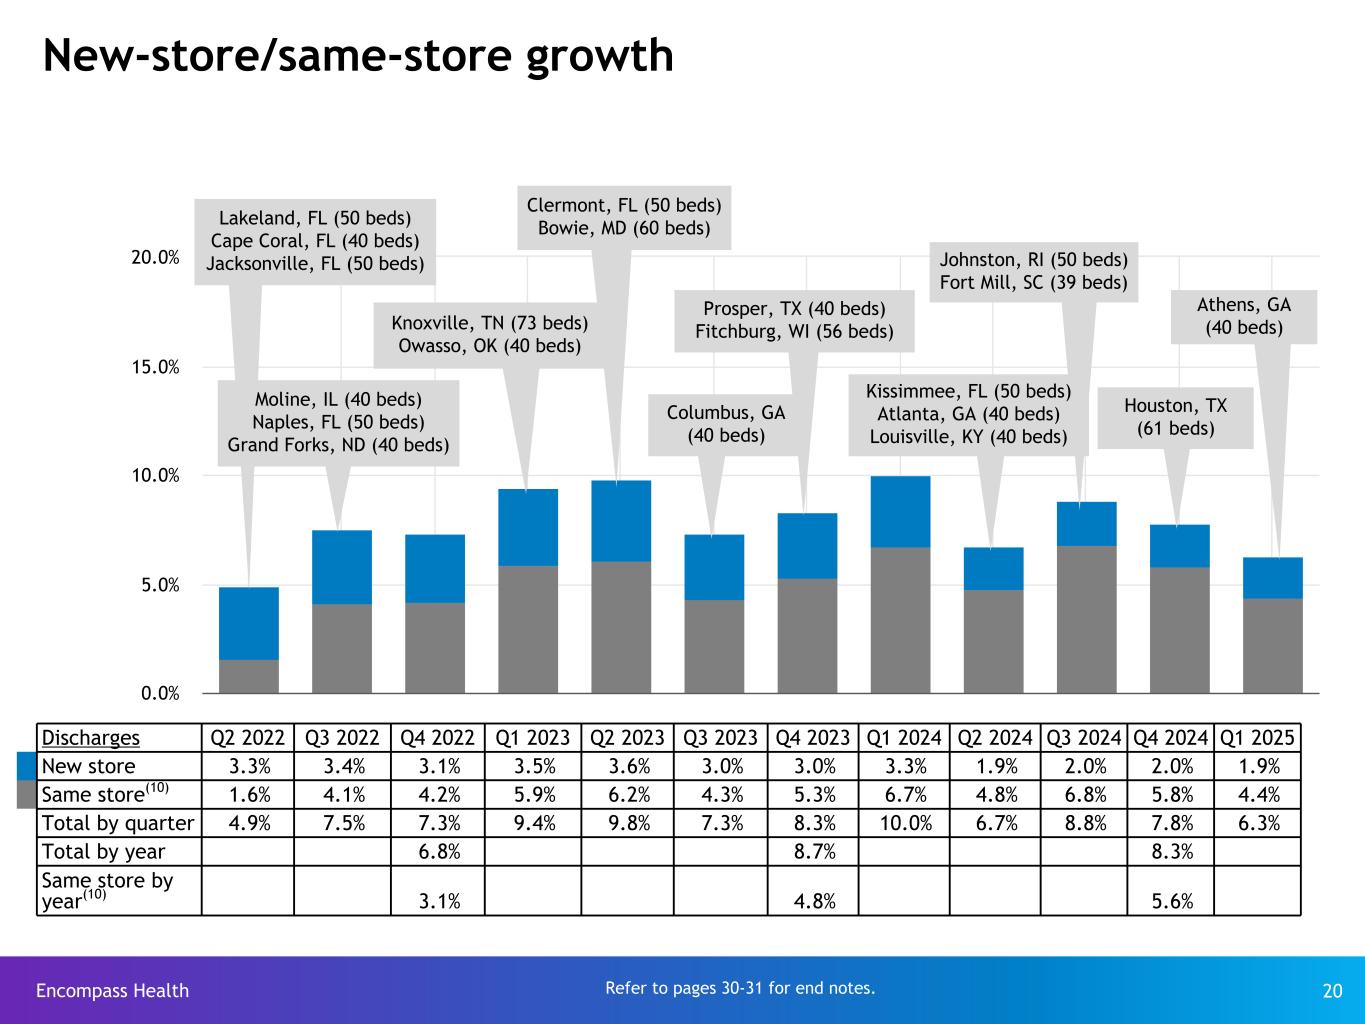
| Same-store discharge growth | 4.4 | % | |||||||||||||||||||||
| Net patient revenue per discharge | $ | 21,816 | $ | 20,990 | 3.9 | % | |||||||||||||||||
See attached supplemental information for calculations of non-GAAP measures and reconciliations to their most comparable GAAP measure.
•Revenue growth of 10.6% resulted from increased discharges and pricing. Total discharges grew 6.3%, inclusive of same-store growth of 4.4%. Net patient revenue per discharge grew 3.9%.
•Cash flows provided by operating activities increased 20.9% to $288.6 million, primarily due to an increase in net income.
•Adjusted EBITDA increased 14.9% from increased revenue and expense leverage.
1 | ||||||||
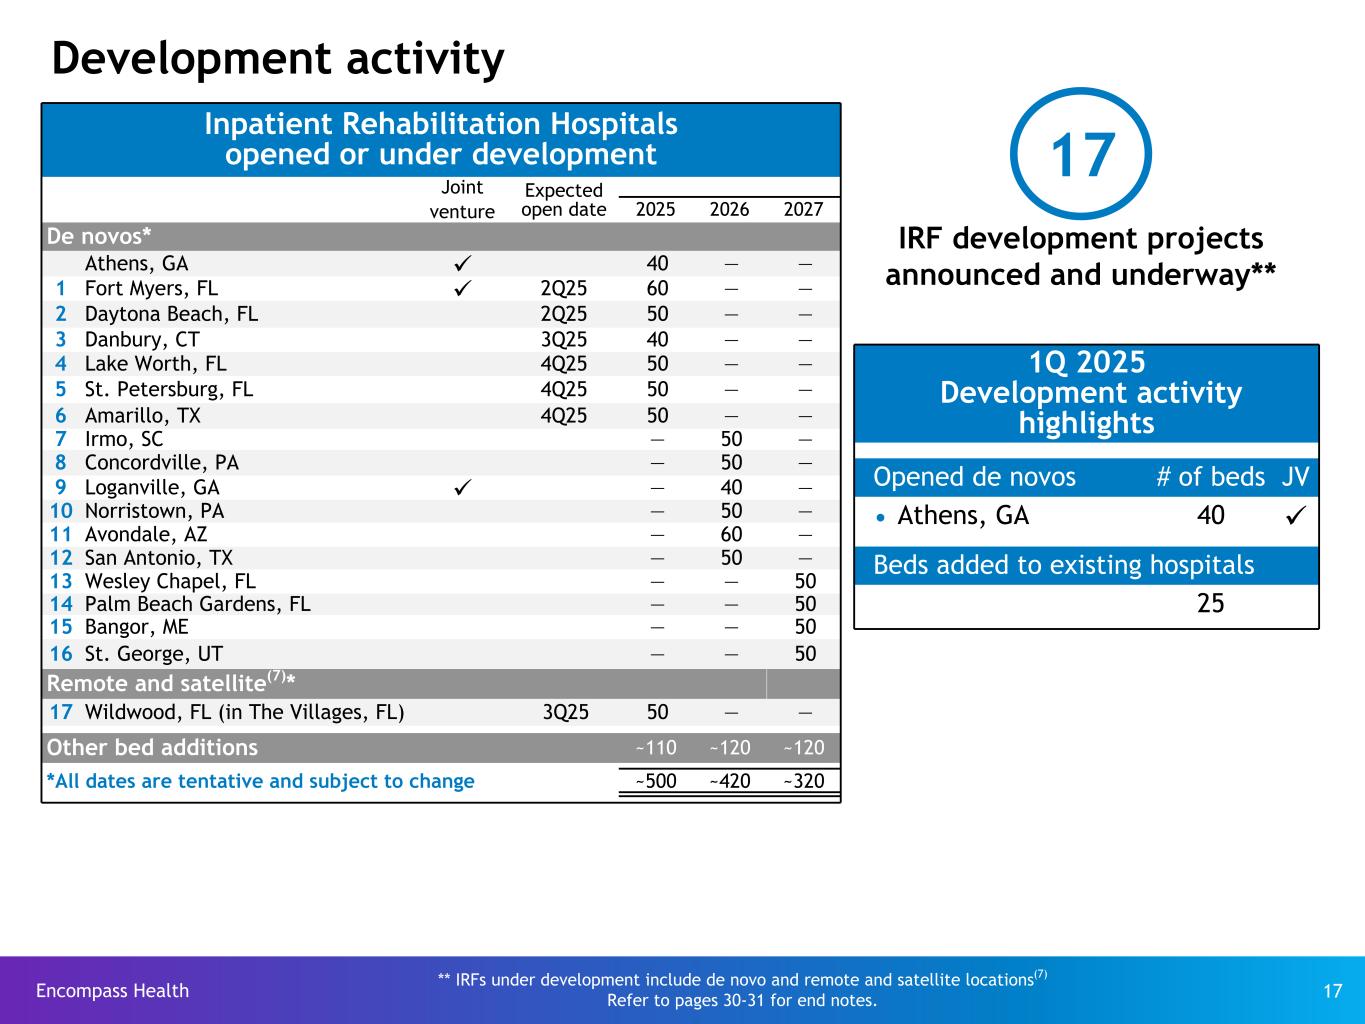
“We are very pleased with our first quarter performance, which drove a 10.6% increase in revenue and a 14.9% increase in Adjusted EBITDA,” said President and Chief Executive Officer of Encompass Health Mark Tarr. “During the quarter, we further increased our capacity, opening one new 40-bed hospital and adding 25 beds to existing hospitals. Our value proposition and operating strategy continue to be validated and we remain highly optimistic about the long-term prospects of our business.”
2025 Guidance
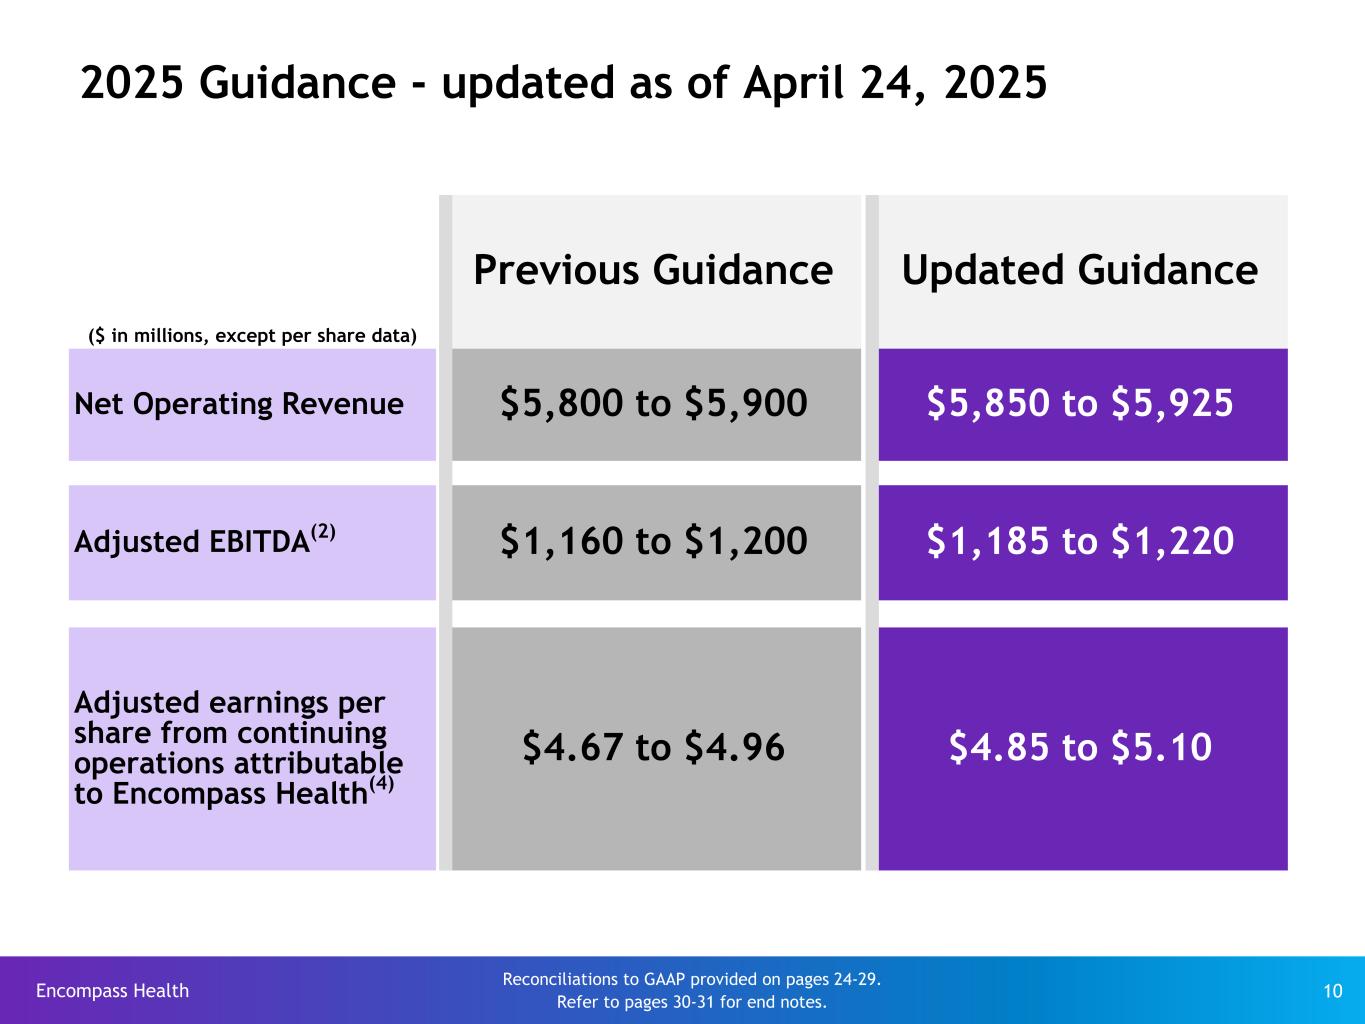
The Company increased its full-year guidance as follows:
| Full-Year 2025 Guidance | |||||||||||
| Previous Guidance | Updated Guidance | ||||||||||
| (In Millions, Except Per Share Data) | |||||||||||
| Net operating revenue | $5,800 to $5,900 | $5,850 to $5,925 | |||||||||
| Adjusted EBITDA | $1,160 to $1,200 | $1,185 to $1,220 | |||||||||
| Adjusted earnings per share from continuing operations attributable to Encompass Health | $4.67 to $4.96 | $4.85 to $5.10 | |||||||||
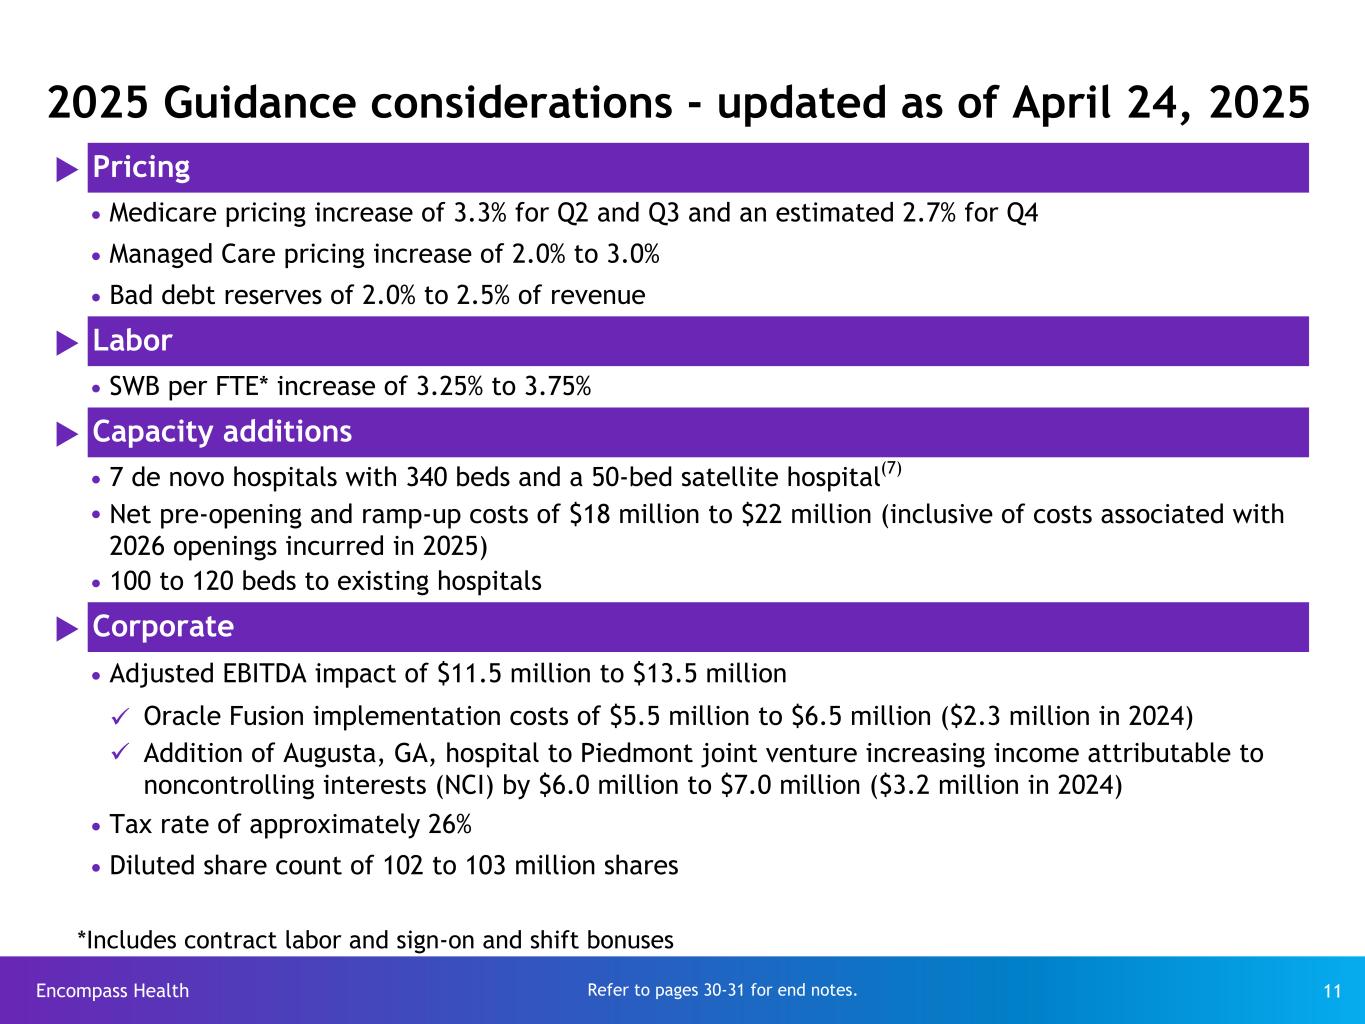
For considerations regarding the Company’s 2025 guidance, see the supplemental information posted on the Company’s website at http://investor.encompasshealth.com. See also the “Other information” section below for an explanation of why the Company does not provide guidance for comparable GAAP measures for Adjusted EBITDA and adjusted earnings per share.
Earnings conference call and webcast
The Company will host an investor conference call at 9:00 a.m. Eastern Time on Friday, April 25, 2025 to discuss its results for the first quarter of 2025. For reference during the call, the Company will post certain supplemental information at http://investor.encompasshealth.com.
The conference call may be accessed by dialing 800 245-3047 and giving the conference ID EHCQ125. International callers should dial 203 518-9765 and give the same conference ID. Please call approximately ten minutes before the start of the call to ensure you are connected. The conference call will also be webcast live and will be available for on-line replay at http://investor.encompasshealth.com by clicking on an available link.
About Encompass Health
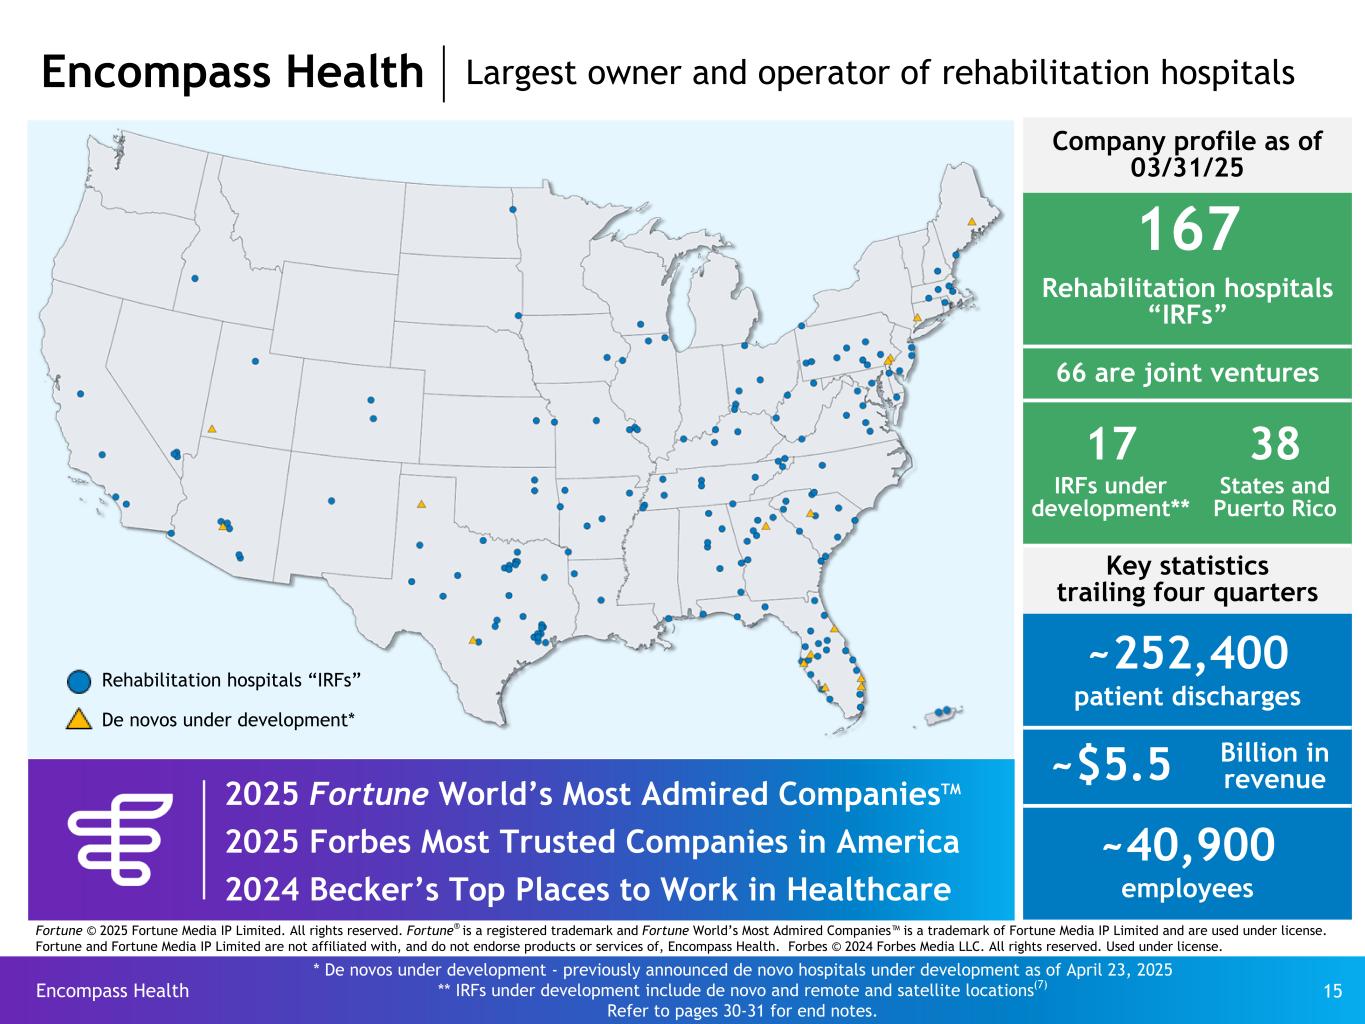
Encompass Health (NYSE: EHC) is the largest owner and operator of inpatient rehabilitation hospitals in the United States. With a national footprint that includes 167 hospitals in 38 states and Puerto Rico, the Company provides high-quality, compassionate rehabilitative care for patients recovering from a major injury or illness, using advanced technology and innovative treatments to maximize recovery. Encompass Health is ranked as one of Fortune's World’s Most Admired CompaniesTM, Becker’s Hospital Review’s 150 Top Places to Work in Healthcare and Forbes’ Most Trusted Companies in America.1 For more information, visit encompasshealth.com, or follow us on our newsroom, X, Instagram and Facebook.
1 Fortune © 2025 Fortune Media IP Limited. All rights reserved. Fortune® is a registered trademark and Fortune World’s Most Admired Companies™ is a trademark of Fortune Media IP Limited and are used under license. Fortune and Fortune Media IP Limited are not affiliated with, and do not endorse products or services of, Encompass Health. Forbes © 2024 Forbes Media LLC. All rights reserved. Used under license.
2 | ||||||||
Other information
The information in this press release is summarized and should be read in conjunction with the Company’s Quarterly Report on Form 10-Q for the quarter ended March 31, 2025 (the “March 2025 Form 10-Q”), when filed, as well as the Company’s Current Report on Form 8-K filed on April 24, 2025 (the “Q1 Earnings Form 8-K”), to which this press release is attached as Exhibit 99.1. In addition, the Company will post supplemental information today on its website at http://investor.encompasshealth.com for reference during its April 25, 2025 earnings call.
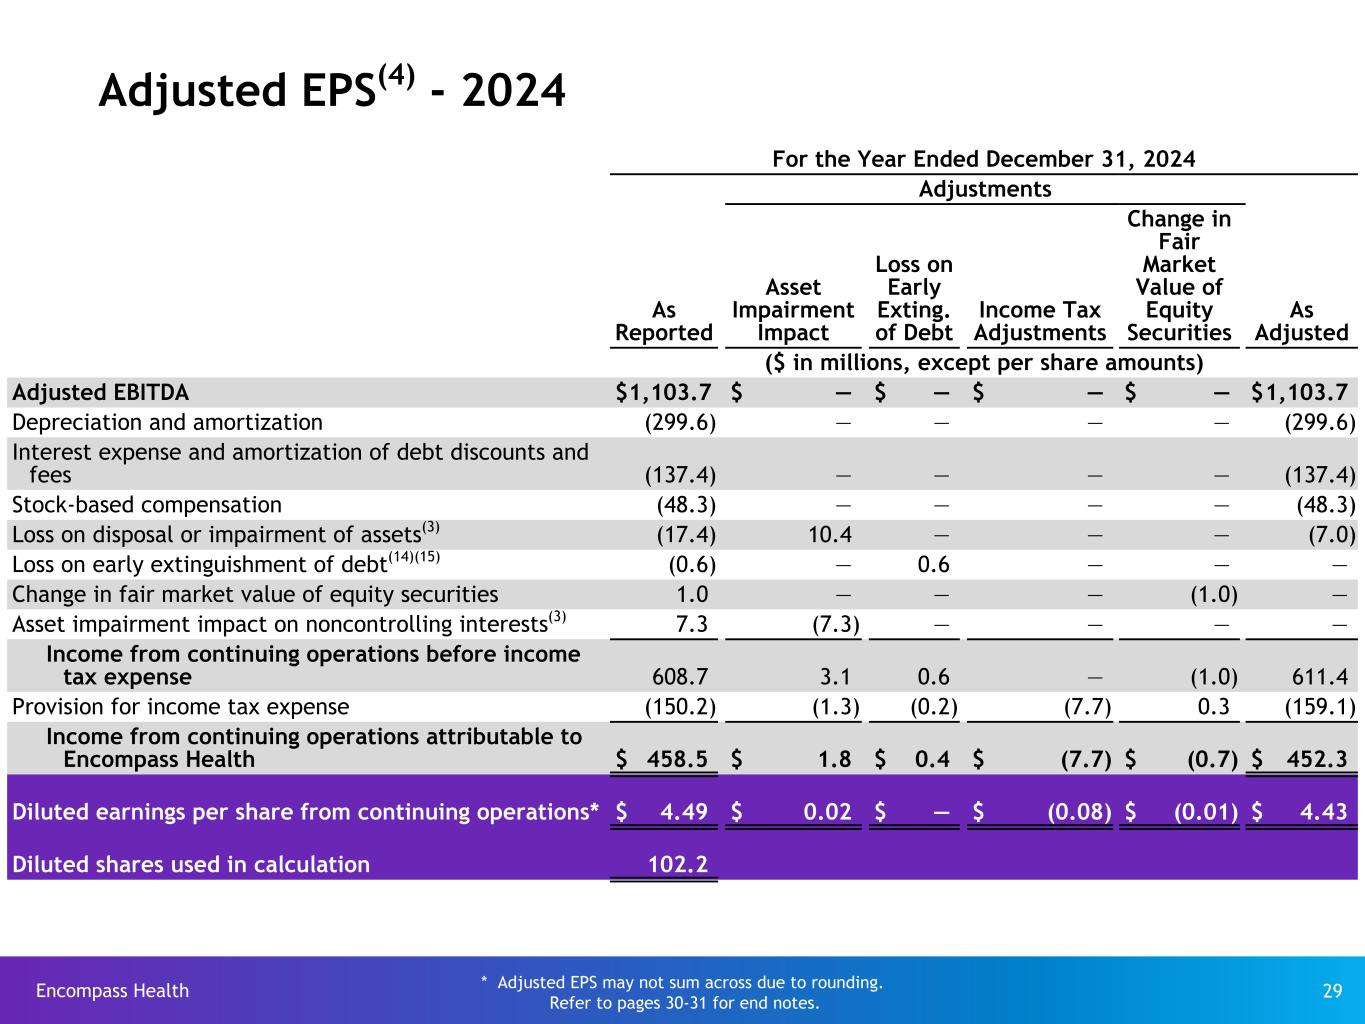
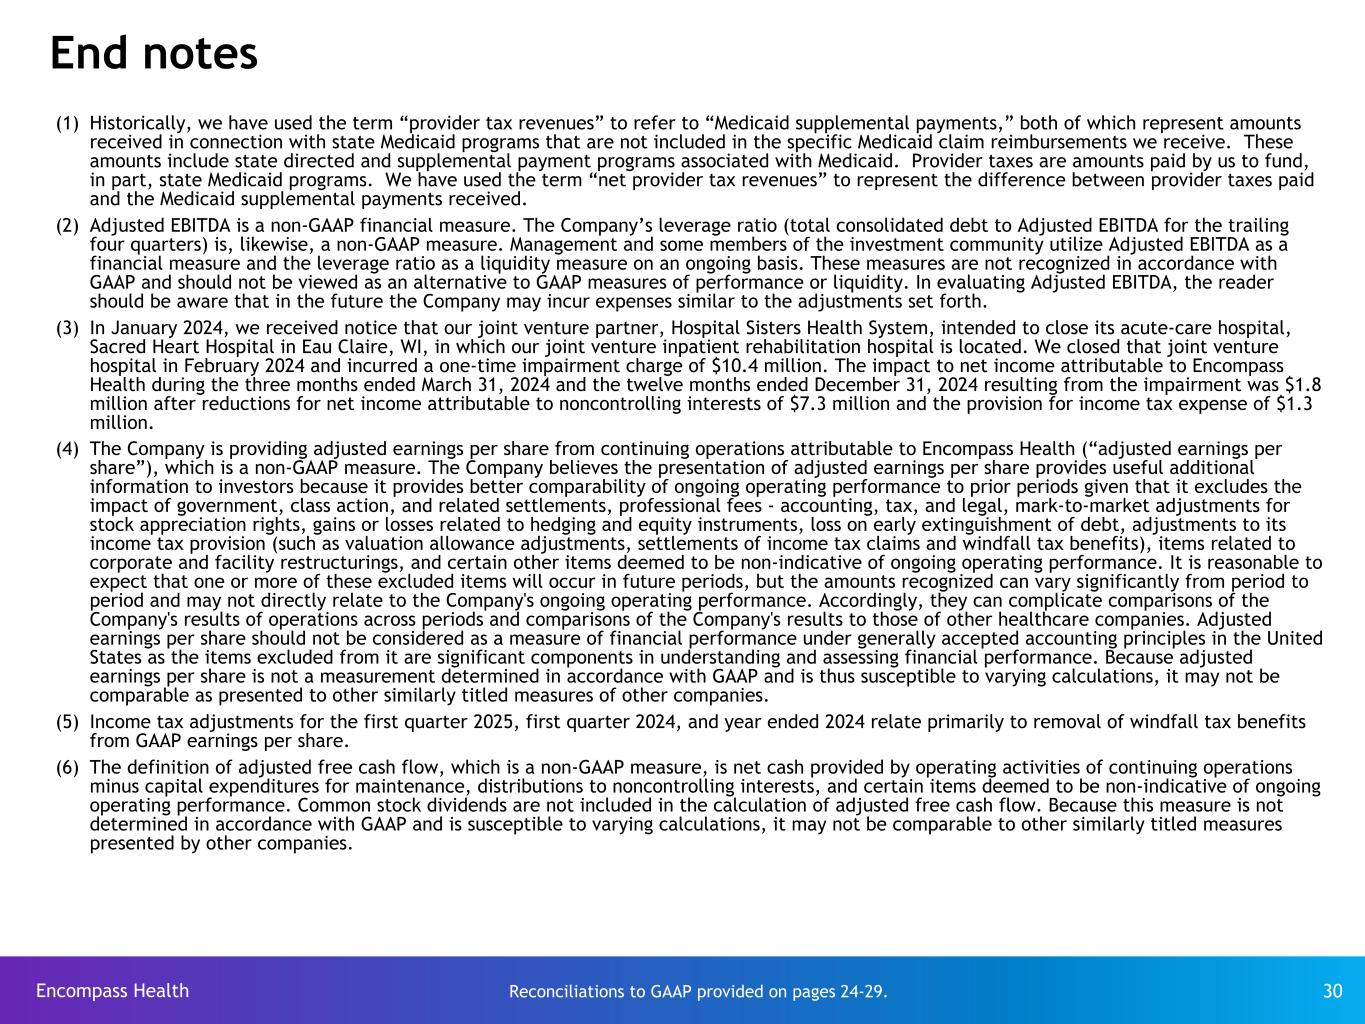
The financial data contained in the press release and supplemental information include non-GAAP financial measures, including the Company’s adjusted earnings per share, leverage ratio, Adjusted EBITDA, and adjusted free cash flow. Reconciliations to their most comparable GAAP measure, except with regard to non-GAAP guidance, are included below or in the Q1 Earnings Form 8-K. Readers are encouraged to review the “Note Regarding Presentation of Non-GAAP Financial Measures” included in the Q1 Earnings Form 8-K which provides further explanation and disclosure regarding the Company’s use of these non-GAAP financial measures.
Excluding net operating revenues, the Company does not provide guidance on a GAAP basis because it is unable to predict, with reasonable certainty, the future impact of items that are deemed to be outside the control of the Company or otherwise not indicative of its ongoing operating performance. Such items include government, class action, and related settlements; professional fees—accounting, tax, and legal; mark-to-market adjustments for stock appreciation rights; gains or losses related to hedging instruments; loss on early extinguishment of debt; adjustments to its income tax provision (such as valuation allowance adjustments and settlements of income tax claims); items related to corporate and facility restructurings; and certain other items the Company believes to be not indicative of its ongoing operations. These items cannot be reasonably predicted and will depend on several factors, including industry and market conditions, and could be material to the Company’s results computed in accordance with GAAP.
However, the following reasonably estimable GAAP measures for 2025 would be included in a reconciliation for Adjusted EBITDA if the other reconciling GAAP measures could be reasonably predicted:
•Interest expense and amortization of debt discounts and fees - approximately $125 million
•Amortization of debt-related items - approximately $10 million
The Q1 Earnings Form 8-K and, when filed, the March 2025 Form 10-Q can be found on the Company’s website at http://investor.encompasshealth.com and the SEC's website at www.sec.gov.
3 | ||||||||
Encompass Health Corporation and Subsidiaries
Condensed Consolidated Statements of Comprehensive Income
(Unaudited)
| Three Months Ended March 31, | |||||||||||
| 2025 | 2024 | ||||||||||
| (In Millions, Except Per Share Data) | |||||||||||
| Net operating revenues | $ | 1,455.4 | $ | 1,316.0 | |||||||
| Operating expenses: | |||||||||||
| Salaries and benefits | 762.3 | 711.6 | |||||||||
| Other operating expenses | 217.5 | 203.9 | |||||||||
| Occupancy costs | 14.9 | 14.0 | |||||||||
| Supplies | 62.2 | 58.5 | |||||||||
| General and administrative expenses | 52.3 | 50.2 | |||||||||
| Depreciation and amortization | 79.2 | 70.3 | |||||||||
| Total operating expenses | 1,188.4 | 1,108.5 | |||||||||
| Interest expense and amortization of debt discounts and fees | 31.8 | 35.2 | |||||||||
| Other income | (2.5) | (5.4) | |||||||||
| Equity in net income of nonconsolidated affiliates | (0.9) | (0.7) | |||||||||
| Income from continuing operations before income tax expense | 238.6 | 178.4 | |||||||||
| Provision for income tax expense | 41.6 | 38.3 | |||||||||
| Income from continuing operations | 197.0 | 140.1 | |||||||||
| Loss from discontinued operations, net of tax | (0.5) | (1.3) | |||||||||
| Net and comprehensive income | 196.5 | 138.8 | |||||||||
| Less: Net and comprehensive income attributable to noncontrolling interests | (45.0) | (26.3) | |||||||||
| Net and comprehensive income attributable to Encompass Health | $ | 151.5 | $ | 112.5 | |||||||
| Weighted average common shares outstanding: | |||||||||||
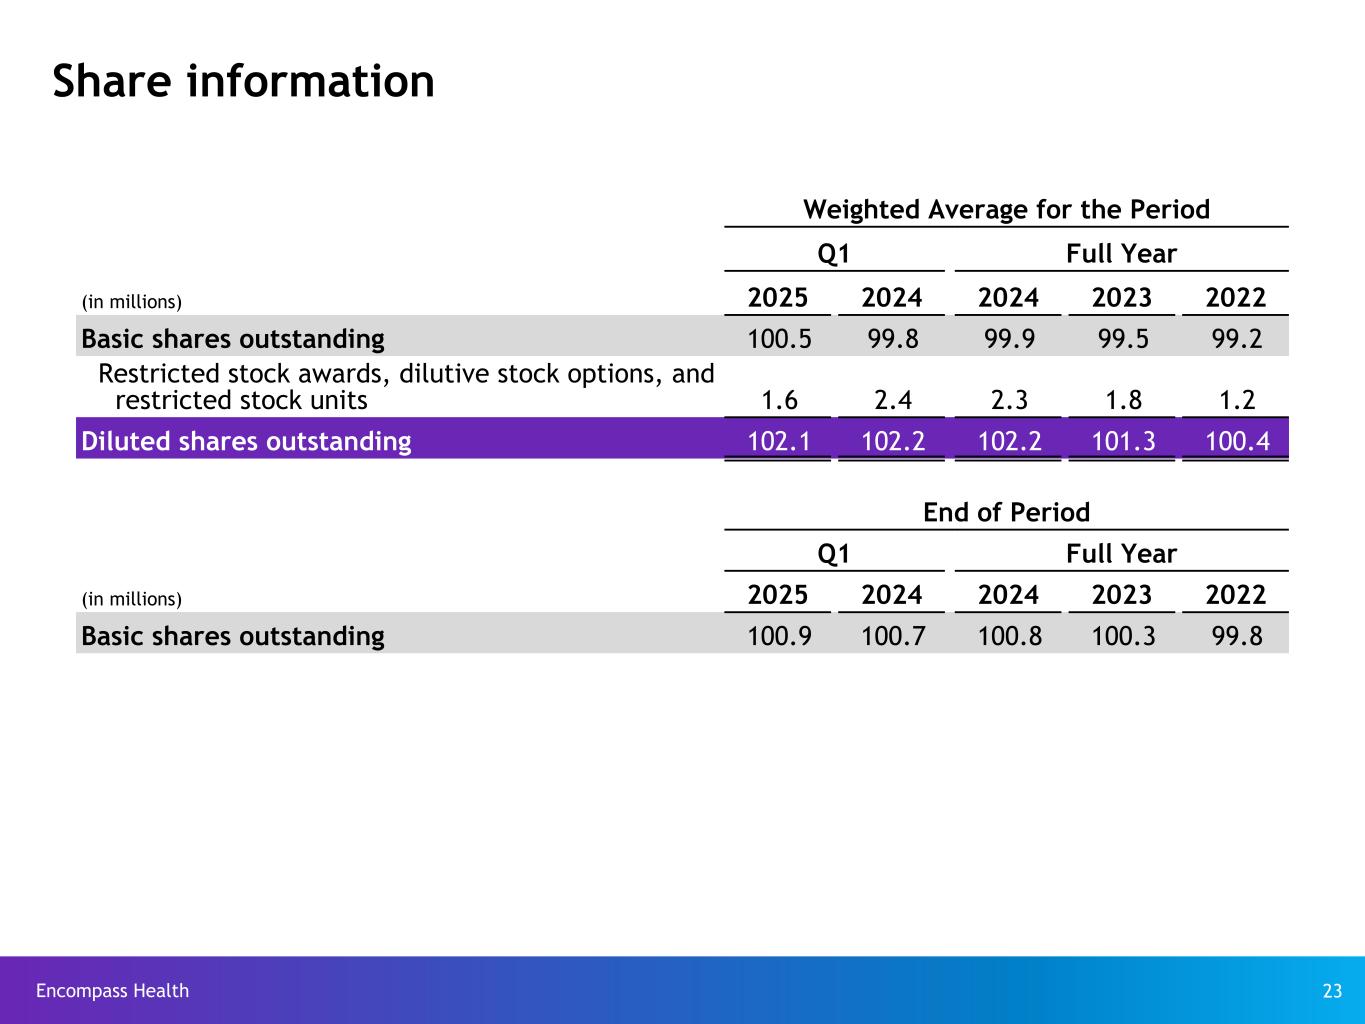
| Basic | 100.5 | 99.8 | |||||||||
| Diluted | 102.1 | 102.2 | |||||||||
Earnings per common share: | |||||||||||
Basic earnings per share attributable to Encompass Health common shareholders: | |||||||||||
Continuing operations | $ | 1.50 | $ | 1.13 | |||||||
Discontinued operations | — | (0.01) | |||||||||
Net income | $ | 1.50 | $ | 1.12 | |||||||
Diluted earnings per share attributable to Encompass Health common shareholders: | |||||||||||
Continuing operations | $ | 1.48 | $ | 1.11 | |||||||
Discontinued operations | — | (0.01) | |||||||||
Net income | $ | 1.48 | $ | 1.10 | |||||||
| Amounts attributable to Encompass Health common shareholders: | |||||||||||
| Income from continuing operations | $ | 152.0 | $ | 113.8 | |||||||
| Loss from discontinued operations, net of tax | (0.5) | (1.3) | |||||||||
| Net income attributable to Encompass Health | $ | 151.5 | $ | 112.5 | |||||||
4 | ||||||||
Encompass Health Corporation and Subsidiaries
Condensed Consolidated Balance Sheets
(Unaudited)
| March 31, 2025 | December 31, 2024 | ||||||||||
| (In Millions) | |||||||||||
| Assets | |||||||||||
| Current assets: | |||||||||||
| Cash and cash equivalents | $ | 95.8 | $ | 85.4 | |||||||
| Restricted cash | 27.0 | 37.7 | |||||||||
| Accounts receivable | 623.4 | 598.8 | |||||||||
| Other current assets | 164.7 | 165.0 | |||||||||
| Total current assets | 910.9 | 886.9 | |||||||||
| Property and equipment, net | 3,723.7 | 3,643.1 | |||||||||
| Operating lease right-of-use assets | 218.7 | 203.7 | |||||||||
| Goodwill | 1,284.0 | 1,284.0 | |||||||||
| Intangible assets, net | 294.5 | 297.8 | |||||||||
| Other long-term assets | 209.5 | 219.2 | |||||||||
| Total assets | $ | 6,641.3 | $ | 6,534.7 | |||||||
| Liabilities and Shareholders’ Equity | |||||||||||
| Current liabilities: | |||||||||||
| Current portion of long-term debt | $ | 138.7 | $ | 138.6 | |||||||
| Current operating lease liabilities | 26.7 | 26.3 | |||||||||
| Accounts payable | 159.1 | 171.0 | |||||||||
| Accrued expenses and other current liabilities | 531.5 | 505.1 | |||||||||
| Total current liabilities | 856.0 | 841.0 | |||||||||
| Long-term debt, net of current portion | 2,333.2 | 2,359.2 | |||||||||
| Long-term operating lease liabilities | 204.2 | 189.7 | |||||||||
| Deferred income tax liabilities | 114.0 | 105.2 | |||||||||
| Other long-term liabilities | 196.3 | 190.4 | |||||||||
| Total liabilities | 3,703.7 | 3,685.5 | |||||||||
| Commitments and contingencies | |||||||||||
| Redeemable noncontrolling interests | 56.1 | 56.5 | |||||||||
| Shareholders’ equity: | |||||||||||
| Encompass Health shareholders’ equity | 2,159.1 | 2,067.0 | |||||||||
| Noncontrolling interests | 722.4 | 725.7 | |||||||||
| Total shareholders’ equity | 2,881.5 | 2,792.7 | |||||||||
| Total liabilities and shareholders’ equity | $ | 6,641.3 | $ | 6,534.7 | |||||||
5 | ||||||||
Encompass Health Corporation and Subsidiaries
Condensed Consolidated Statements of Cash Flows
(Unaudited)
| Three Months Ended March 31, | |||||||||||
| 2025 | 2024 | ||||||||||
| (In Millions) | |||||||||||
| Cash flows from operating activities: | |||||||||||
| Net income | $ | 196.5 | $ | 138.8 | |||||||
| Loss from discontinued operations, net of tax | 0.5 | 1.3 | |||||||||
| Adjustments to reconcile net income to net cash provided by operating activities— | |||||||||||
| Depreciation and amortization | 79.2 | 70.3 | |||||||||
| Stock-based compensation | 9.5 | 9.3 | |||||||||
| Deferred tax expense | 8.8 | 6.5 | |||||||||
| Other, net | 2.3 | 14.9 | |||||||||
| Change in assets and liabilities, net of acquisitions— | |||||||||||
| Accounts receivable | (24.7) | (7.7) | |||||||||
| Other assets | 0.7 | (16.0) | |||||||||
| Accounts payable | (2.1) | (3.8) | |||||||||
| Other liabilities | 18.6 | 25.9 | |||||||||
| Net cash used in operating activities of discontinued operations | (0.7) | (0.7) | |||||||||
| Total adjustments | 91.6 | 98.7 | |||||||||
| Net cash provided by operating activities | 288.6 | 238.8 | |||||||||
| Cash flows from investing activities: | |||||||||||
| Purchases of property, equipment, and intangible assets | (163.1) | (139.4) | |||||||||
| Proceeds from sale of restricted investments | 11.0 | 16.0 | |||||||||
| Other, net | (6.4) | (6.3) | |||||||||
| Net cash used in investing activities | (158.5) | (129.7) | |||||||||
| Cash flows from financing activities: | |||||||||||
| Borrowings on revolving credit facility | 60.0 | 50.0 | |||||||||
| Payments on revolving credit facility | (80.0) | (50.0) | |||||||||
| Taxes paid on behalf of employees for shares withheld | (19.8) | (12.1) | |||||||||
| Contributions from noncontrolling interests of consolidated affiliates | — | 18.4 | |||||||||
| Dividends paid on common stock | (18.0) | (15.9) | |||||||||
| Distributions paid to noncontrolling interests of consolidated affiliates | (32.9) | (24.7) | |||||||||
| Repurchases of common stock, including fees and expenses | (32.1) | — | |||||||||
| Other, net | (7.6) | (6.3) | |||||||||
| Net cash used in financing activities | (130.4) | (40.6) | |||||||||
| (Decrease) increase in cash, cash equivalents, and restricted cash | (0.3) | 68.5 | |||||||||
| Cash, cash equivalents, and restricted cash at beginning of period | 123.1 | 104.2 | |||||||||
| Cash, cash equivalents, and restricted cash at end of period | $ | 122.8 | $ | 172.7 | |||||||
6 | ||||||||
Encompass Health Corporation and Subsidiaries
Supplemental Information
Earnings Per Share
| Three Months Ended March 31, | |||||||||||
| 2025 | 2024 | ||||||||||
| (In Millions, Except Per Share Data) | |||||||||||
| Adjusted EBITDA | $ | 313.6 | $ | 273.0 | |||||||
Depreciation and amortization | (79.2) | (70.3) | |||||||||
Interest expense and amortization of debt discounts and fees | (31.8) | (35.2) | |||||||||
| Stock-based compensation | (9.5) | (9.3) | |||||||||
| Loss on disposal or impairment of assets | (0.2) | (13.7) | |||||||||
| 192.9 | 144.5 | ||||||||||
| Items not indicative of ongoing operating performance: | |||||||||||
Change in fair market value of equity securities | 0.7 | 0.3 | |||||||||
| Asset impairment impact on noncontrolling interests | — | 7.3 | |||||||||
| Pre-tax income | 193.6 | 152.1 | |||||||||
Income tax expense | (41.6) | (38.3) | |||||||||
Income from continuing operations (1) | $ | 152.0 | $ | 113.8 | |||||||
| Basic shares | 100.5 | 99.8 | |||||||||
| Diluted shares | 102.1 | 102.2 | |||||||||
Basic earnings per share (1) | $ | 1.50 | $ | 1.13 | |||||||
Diluted earnings per share (1) | $ | 1.48 | $ | 1.11 | |||||||
(1)Income from continuing operations attributable to Encompass Health
7 | ||||||||
Encompass Health Corporation and Subsidiaries
Supplemental Information
Adjusted Earnings Per Share
| Three Months Ended March 31, | |||||||||||
| 2025 | 2024 | ||||||||||
| Earnings per share, as reported | $ | 1.48 | $ | 1.11 | |||||||
| Adjustments, net of tax: | |||||||||||
| Asset impairment impact | — | 0.02 | |||||||||
Income tax adjustments | (0.12) | (0.01) | |||||||||
Adjusted earnings per share* | $ | 1.37 | $ | 1.12 | |||||||
* Adjusted EPS may not sum due to rounding.
8 | ||||||||
Encompass Health Corporation and Subsidiaries
Supplemental Information
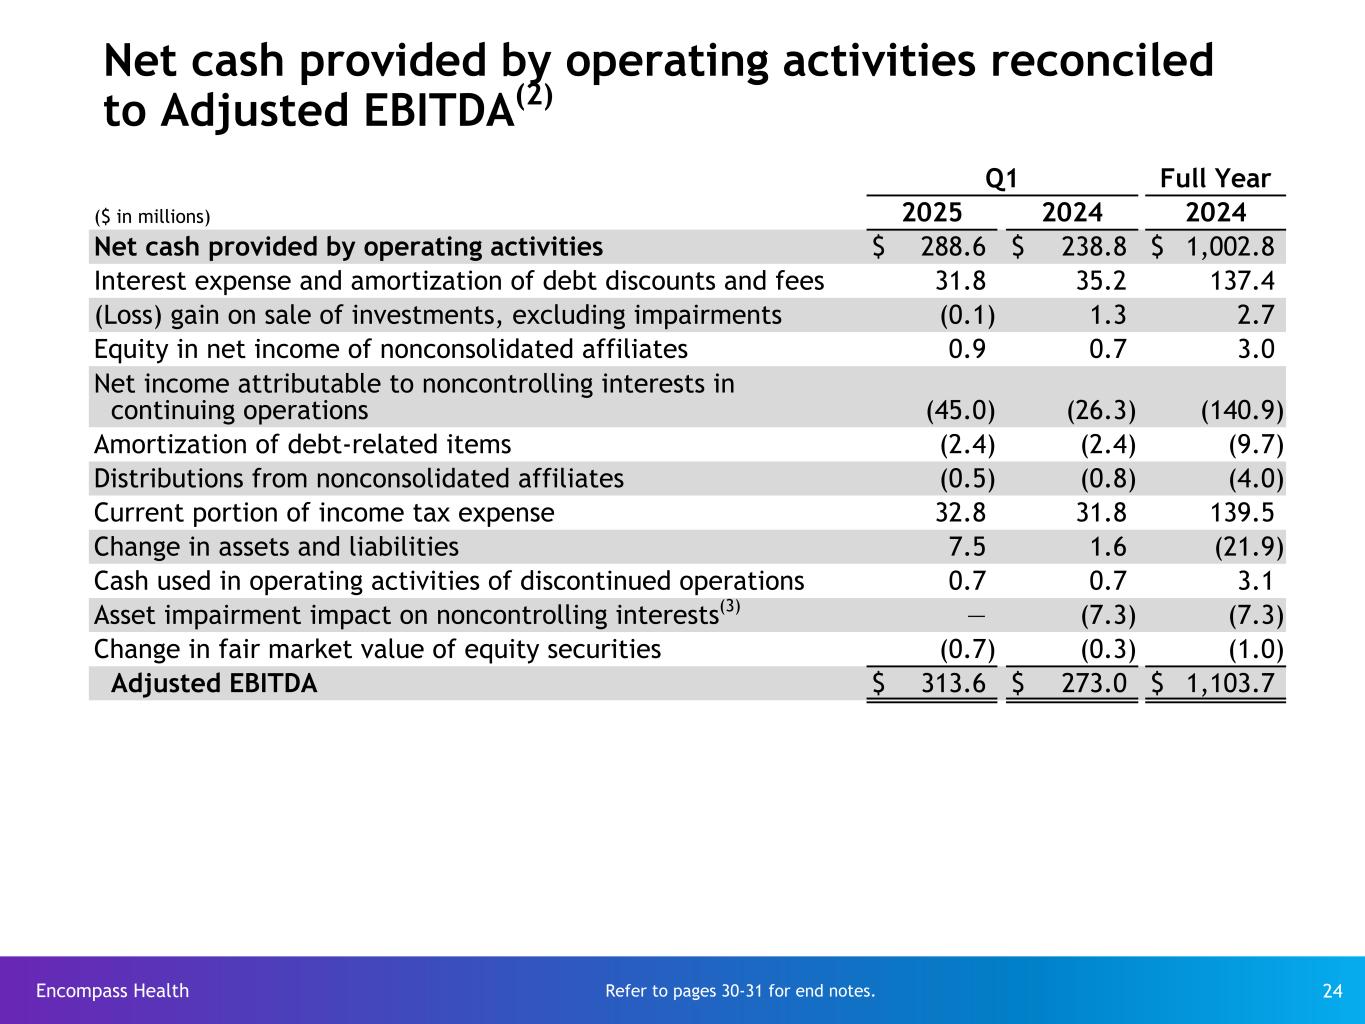
Reconciliation of Net Cash Provided by Operating Activities to Adjusted EBITDA
| Three Months Ended March 31, | |||||||||||
| 2025 | 2024 | ||||||||||
| (In Millions) | |||||||||||
Net cash provided by operating activities | $ | 288.6 | $ | 238.8 | |||||||
Interest expense and amortization of debt discounts and fees | 31.8 | 35.2 | |||||||||
| (Loss) gain on sale of investments, excluding impairments | (0.1) | 1.3 | |||||||||
Equity in net income of nonconsolidated affiliates | 0.9 | 0.7 | |||||||||
Net income attributable to noncontrolling interests in continuing operations | (45.0) | (26.3) | |||||||||
Amortization of debt-related items | (2.4) | (2.4) | |||||||||
Distributions from nonconsolidated affiliates | (0.5) | (0.8) | |||||||||
| Current portion of income tax expense | 32.8 | 31.8 | |||||||||
| Change in assets and liabilities | 7.5 | 1.6 | |||||||||
| Cash used in operating activities of discontinued operations | 0.7 | 0.7 | |||||||||
| Asset impairment impact on noncontrolling interests | — | (7.3) | |||||||||
| Change in fair market value of equity securities | (0.7) | (0.3) | |||||||||
| Adjusted EBITDA | $ | 313.6 | $ | 273.0 | |||||||
9 | ||||||||
Encompass Health Corporation and Subsidiaries
Supplemental Information
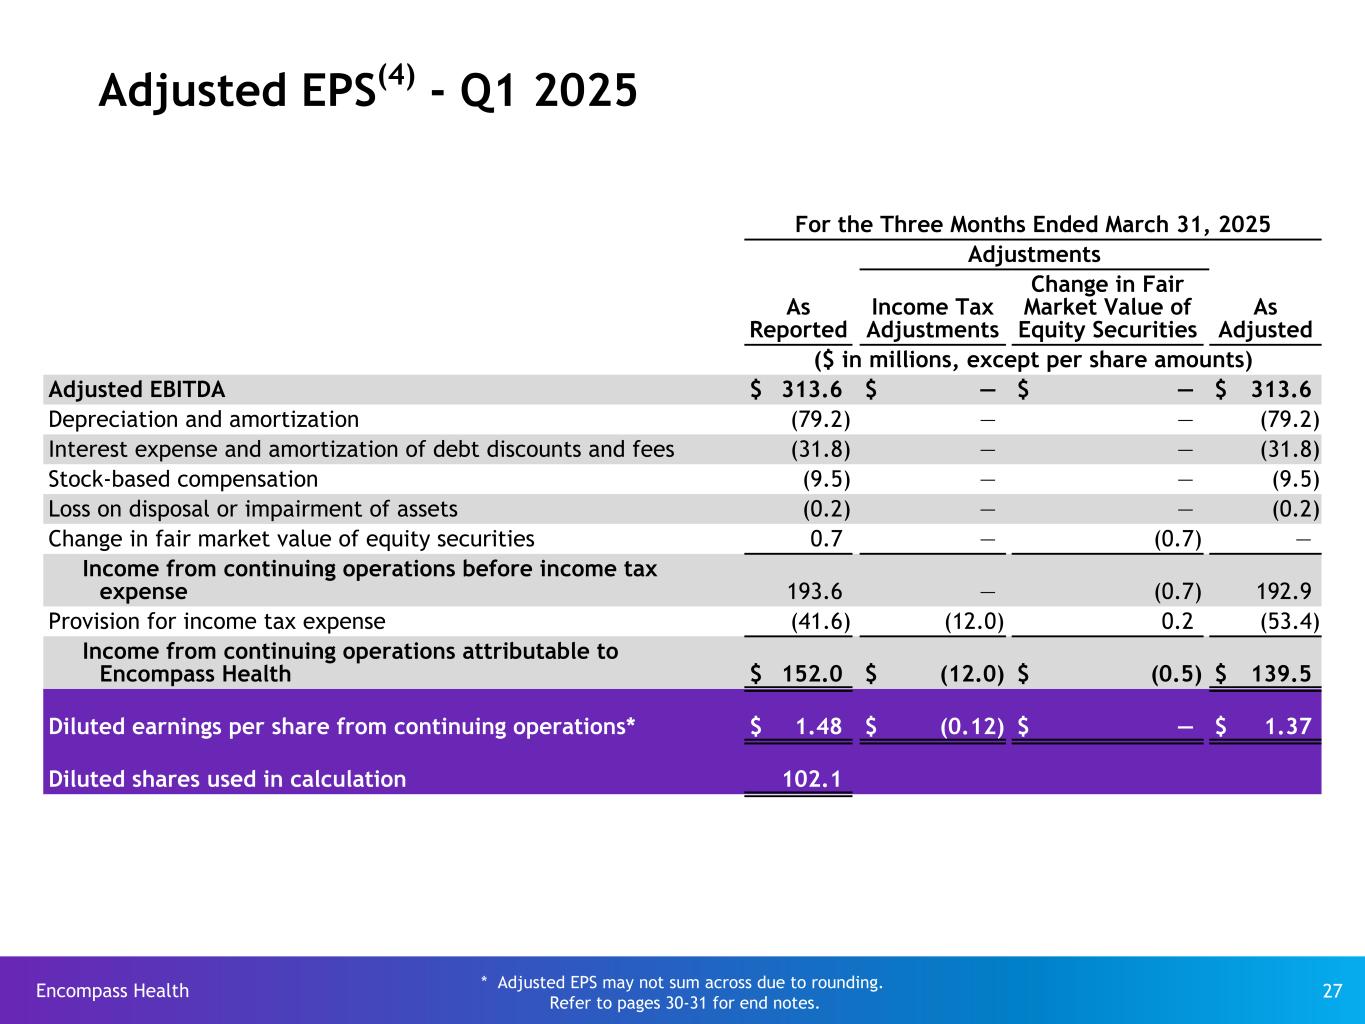
Reconciliation of Income from Continuing Operations Attributable to Encompass Health per Diluted Share to Adjusted Earnings Per Share
| For the Three Months Ended March 31, 2025 | |||||||||||||||||||||||
| Adjustments | |||||||||||||||||||||||
| As Reported | Income Tax Adjustments | Change in Fair Market Value of Equity Securities | As Adjusted | ||||||||||||||||||||
| (In Millions, Except Per Share Amounts) | |||||||||||||||||||||||
| Adjusted EBITDA* | $ | 313.6 | $ | — | $ | — | $ | 313.6 | |||||||||||||||
| Depreciation and amortization | (79.2) | — | — | (79.2) | |||||||||||||||||||
Interest expense and amortization of debt discounts and fees | (31.8) | — | — | (31.8) | |||||||||||||||||||
| Stock-based compensation | (9.5) | — | — | (9.5) | |||||||||||||||||||
| Loss on disposal or impairment of assets | (0.2) | — | — | (0.2) | |||||||||||||||||||
Change in fair market value of equity securities | 0.7 | — | (0.7) | — | |||||||||||||||||||
Income from continuing operations before income tax expense | 193.6 | — | (0.7) | 192.9 | |||||||||||||||||||
| Provision for income tax expense | (41.6) | (12.0) | 0.2 | (53.4) | |||||||||||||||||||
Income from continuing operations attributable to Encompass Health | $ | 152.0 | $ | (12.0) | $ | (0.5) | $ | 139.5 | |||||||||||||||
| Diluted earnings per share from continuing operations** | $ | 1.48 | $ | (0.12) | $ | — | $ | 1.37 | |||||||||||||||
| Diluted shares used in calculation | 102.1 | ||||||||||||||||||||||
* Reconciliation to GAAP provided on page 9
** Adjusted EPS may not sum across due to rounding.
10 | ||||||||
Encompass Health Corporation and Subsidiaries
Supplemental Information
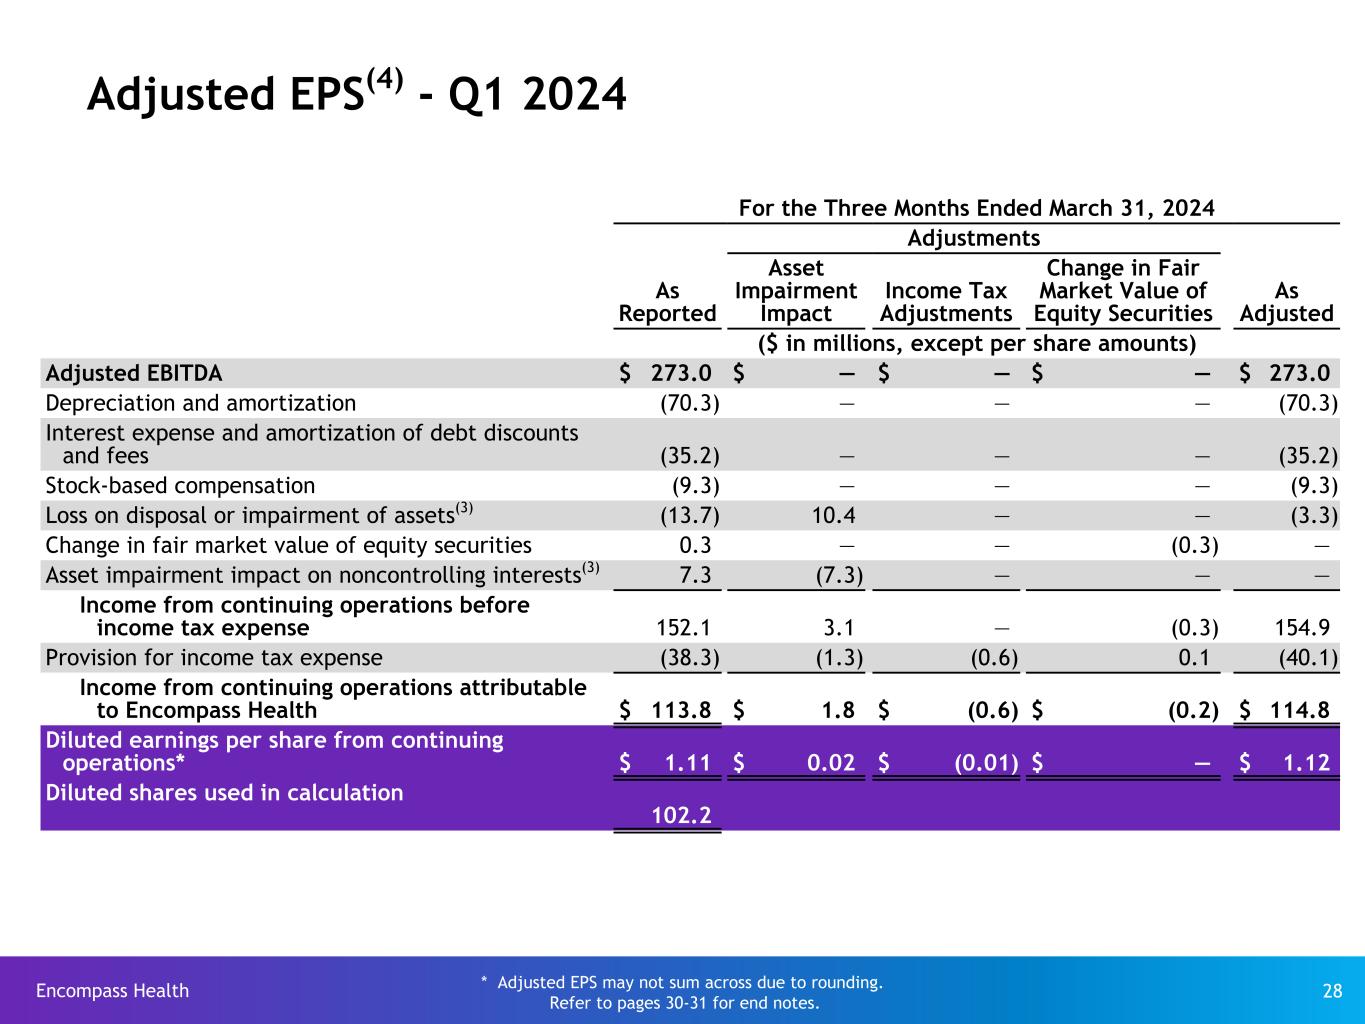
Reconciliation of Income from Continuing Operations Attributable to Encompass Health per Diluted Share to Adjusted Earnings Per Share
| For the Three Months Ended March 31, 2024 | |||||||||||||||||||||||||||||
| Adjustments | |||||||||||||||||||||||||||||
| As Reported | Asset Impairment Impact | Income Tax Adjustments | Change in Fair Market Value of Equity Securities | As Adjusted | |||||||||||||||||||||||||
| (In Millions, Except Per Share Amounts) | |||||||||||||||||||||||||||||
| Adjusted EBITDA* | $ | 273.0 | $ | — | $ | — | $ | — | $ | 273.0 | |||||||||||||||||||
| Depreciation and amortization | (70.3) | — | — | — | (70.3) | ||||||||||||||||||||||||
Interest expense and amortization of debt discounts and fees | (35.2) | — | — | — | (35.2) | ||||||||||||||||||||||||
| Stock-based compensation | (9.3) | — | — | — | (9.3) | ||||||||||||||||||||||||
| Loss on disposal or impairment of assets | (13.7) | 10.4 | — | — | (3.3) | ||||||||||||||||||||||||
Change in fair market value of equity securities | 0.3 | — | — | (0.3) | — | ||||||||||||||||||||||||
| Asset impairment impact on noncontrolling interests | 7.3 | (7.3) | — | — | — | ||||||||||||||||||||||||
Income from continuing operations before income tax expense | 152.1 | 3.1 | — | (0.3) | 154.9 | ||||||||||||||||||||||||
| Provision for income tax expense | (38.3) | (1.3) | (0.6) | 0.1 | (40.1) | ||||||||||||||||||||||||
Income from continuing operations attributable to Encompass Health | $ | 113.8 | $ | 1.8 | $ | (0.6) | $ | (0.2) | $ | 114.8 | |||||||||||||||||||
Diluted earnings per share from continuing operations** | $ | 1.11 | $ | 0.02 | $ | (0.01) | $ | — | $ | 1.12 | |||||||||||||||||||
Diluted shares used in calculation | 102.2 | ||||||||||||||||||||||||||||
* Reconciliation to GAAP provided on page 9
** Adjusted EPS may not sum across due to rounding.
11 | ||||||||
Encompass Health Corporation and Subsidiaries
Supplemental Information
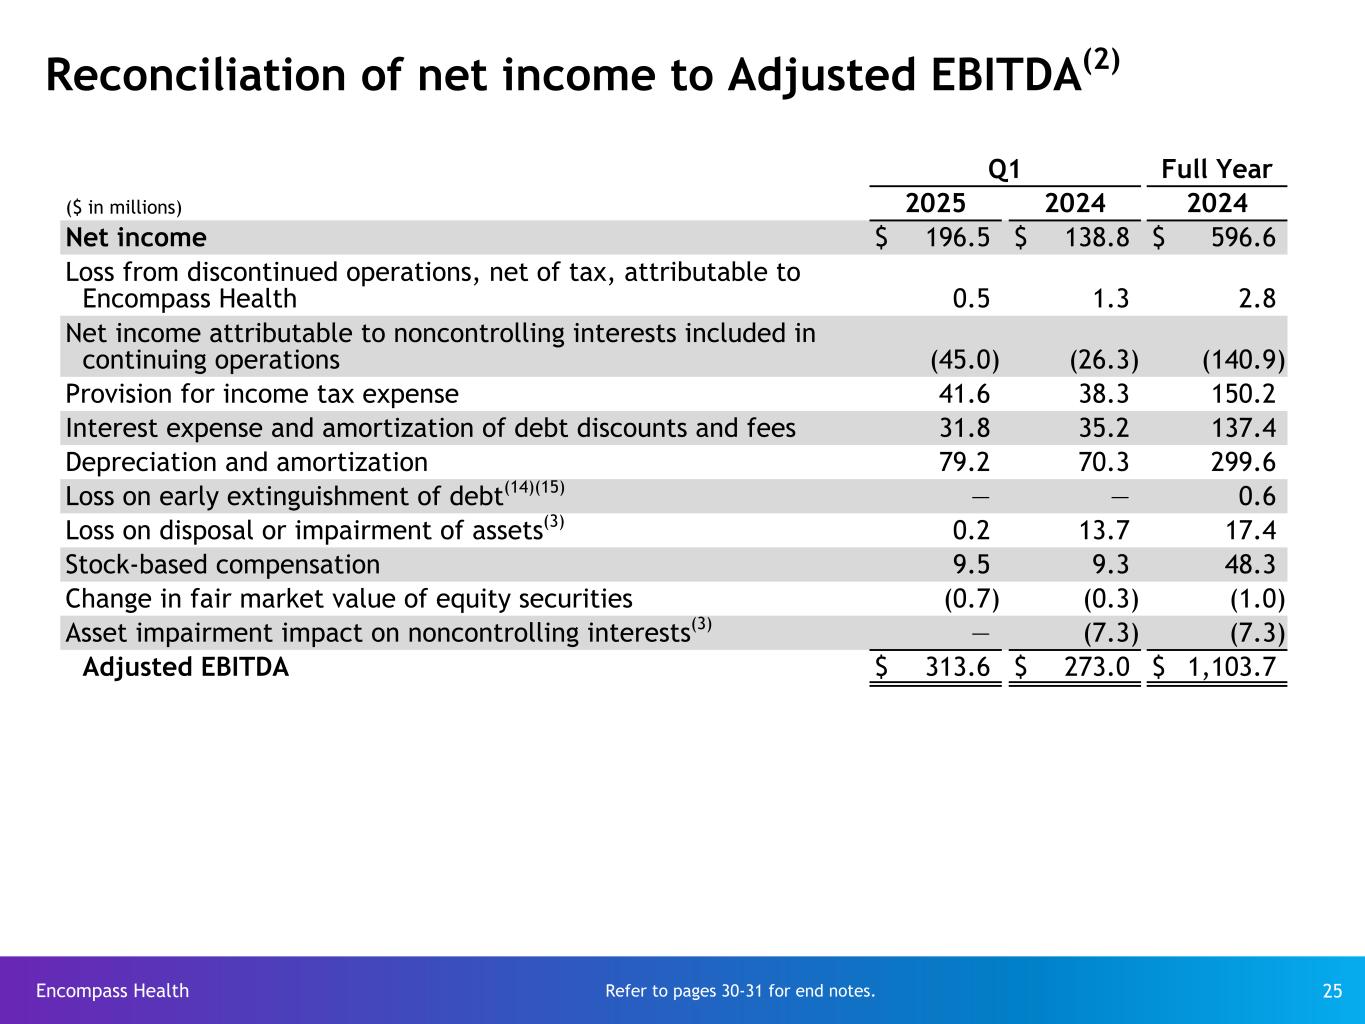
Reconciliation of Net Income to Adjusted EBITDA
| Three Months Ended March 31, | |||||||||||
| 2025 | 2024 | ||||||||||
| (In Millions) | |||||||||||
| Net income | $ | 196.5 | $ | 138.8 | |||||||
| Loss from discontinued operations, net of tax, attributable to Encompass Health | 0.5 | 1.3 | |||||||||
| Net income attributable to noncontrolling interests included in continuing operations | (45.0) | (26.3) | |||||||||
| Provision for income tax expense | 41.6 | 38.3 | |||||||||
Interest expense and amortization of debt discounts and fees | 31.8 | 35.2 | |||||||||
| Depreciation and amortization | 79.2 | 70.3 | |||||||||
| Loss on disposal or impairment of assets | 0.2 | 13.7 | |||||||||
| Stock-based compensation | 9.5 | 9.3 | |||||||||
| Change in fair market value of equity securities | (0.7) | (0.3) | |||||||||
| Asset impairment impact on noncontrolling interests | — | (7.3) | |||||||||
| Adjusted EBITDA | $ | 313.6 | $ | 273.0 | |||||||
12 | ||||||||
Encompass Health Corporation and Subsidiaries
Supplemental Information
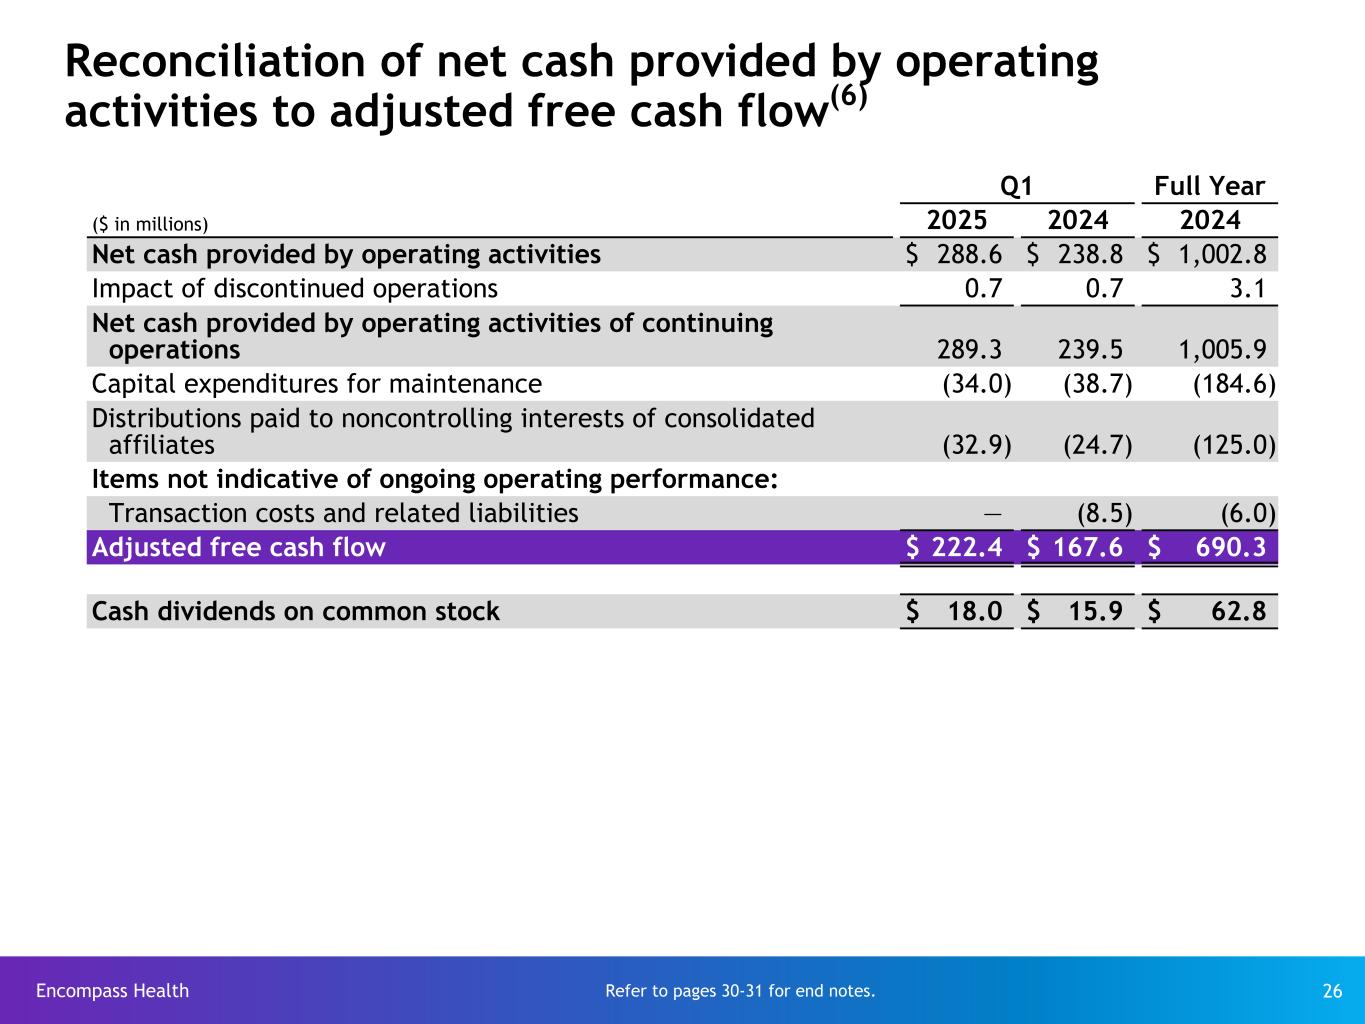
Reconciliation of Net Cash Provided by Operating Activities to Adjusted Free Cash Flow
| Three Months Ended March 31, | |||||||||||
| 2025 | 2024 | ||||||||||
| (In Millions) | |||||||||||
| Net cash provided by operating activities | $ | 288.6 | $ | 238.8 | |||||||
| Impact of discontinued operations | 0.7 | 0.7 | |||||||||
Net cash provided by operating activities of continuing operations | 289.3 | 239.5 | |||||||||
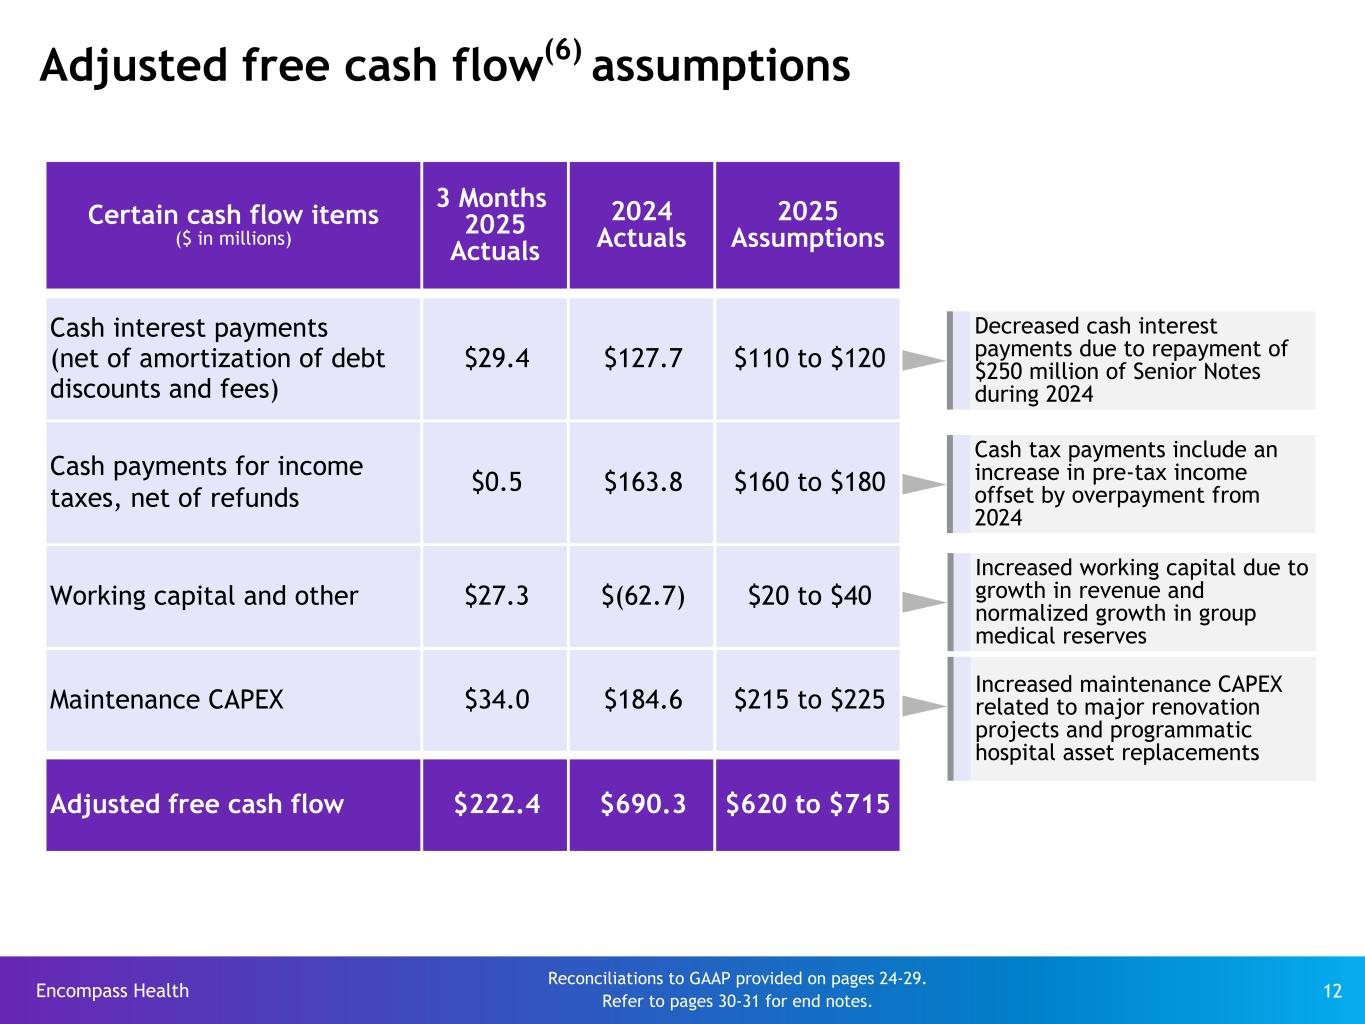
| Capital expenditures for maintenance | (34.0) | (38.7) | |||||||||
Distributions paid to noncontrolling interests of consolidated affiliates | (32.9) | (24.7) | |||||||||
| Items not indicative of ongoing operating performance: | |||||||||||
| Transaction costs and related liabilities | — | (8.5) | |||||||||
| Adjusted free cash flow | $ | 222.4 | $ | 167.6 | |||||||
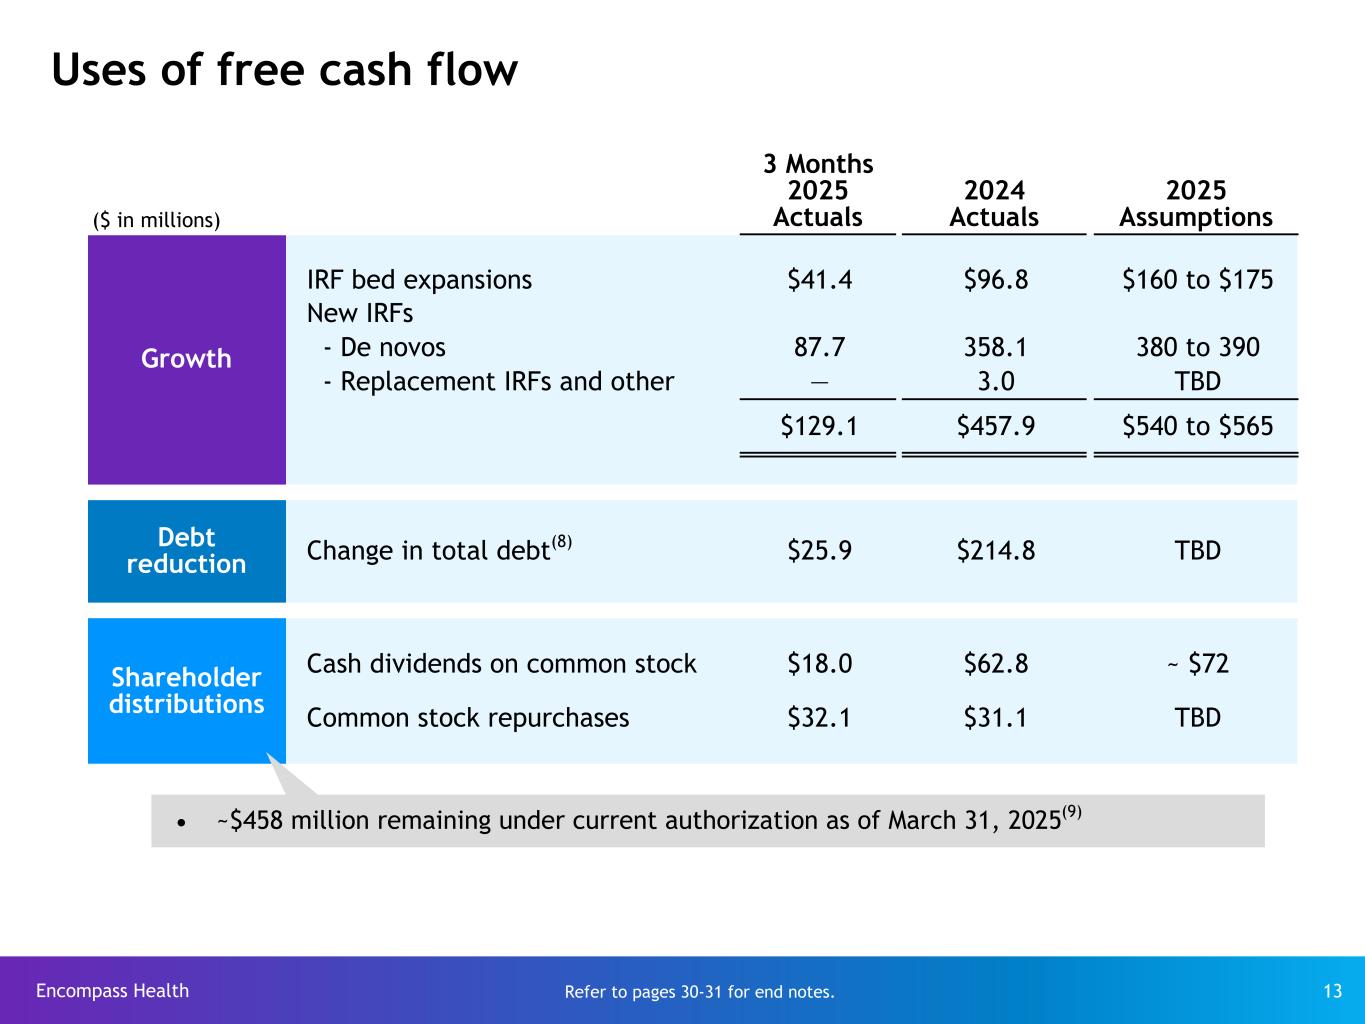
For the three months ended March 31, 2025, net cash used in investing activities was $158.5 million and resulted primarily from capital expenditures. Net cash used in financing activities during the three months ended March 31, 2025 was $130.4 million and resulted primarily from distributions paid to noncontrolling interests of consolidated affiliates, repurchases of common stock, net debt payments, and cash dividends paid on common stock.
For the three months ended March 31, 2024, net cash used in investing activities was $129.7 million and resulted primarily from capital expenditures. Net cash used in financing activities during the three months ended March 31, 2024 was $40.6 million and resulted primarily from distributions paid to noncontrolling interests of consolidated affiliates and cash dividends paid on common stock partially offset by contributions from noncontrolling interests of consolidated affiliates.
13 | ||||||||
Encompass Health Corporation and Subsidiaries
Forward-Looking Statements
Statements contained in this press release and the supplemental information which are not historical facts, such as those relating to the business, strategy, outlook, growth targets and guidance considerations, dividend strategies, effective income tax rates, cost trends, legislative and regulatory developments or their impacts, financial guidance, ability to return value to shareholders, projected capital expenditures, acquisition opportunities, development projects, addressable market size, other balance sheet and cash flow plans, are forward-looking statements within the meaning of the Private Securities Litigation Reform Act of 1995. In addition, Encompass Health, through its senior management, may from time to time make forward-looking public statements concerning the matters described herein. All such estimates, projections, and forward-looking information speak only as of the date hereof, and Encompass Health undertakes no duty to publicly update or revise such forward-looking information, whether as a result of new information, future events, or otherwise. Such forward-looking statements are necessarily estimates based upon current information and involve a number of risks and uncertainties. Actual events or results may differ materially from those anticipated in these forward-looking statements as a result of a variety of factors. While it is impossible to identify all such factors, factors which could cause actual events or results to differ materially from those estimated by Encompass Health include, but are not limited to, infectious disease outbreak, including the speed, depth, geographic reach and duration of its spread, which could decrease our patient volumes and revenues and lead to staffing and supply shortages and associated cost increases; Encompass Health's infectious disease prevention and control efforts; the demand for Encompass Health’s services, including based on any downturns in the economy, consumer confidence, or the capital markets; the price of Encompass Health's common stock as it affects Encompass Health's willingness and ability to repurchase shares and the financial and accounting effects of any repurchases; any adverse outcome of various lawsuits, claims, and legal or regulatory proceedings involving Encompass Health, including any matters related to yet undiscovered issues, if any, in acquired operations; Encompass Health's ability to attract and retain key management personnel; potential disruptions, breaches, or other incidents affecting the proper operation, availability, or security of Encompass Health's or its vendors' or partners’ information systems, including unauthorized access to or theft of patient, business associate, or other sensitive information or inability to provide patient care because of system unavailability; Encompass Health's ability to successfully complete and integrate de novo developments, acquisitions, investments, and joint ventures consistent with its growth strategy; Encompass Health’s ability to realize construction time and cost savings from prefabrication of hospitals; increases in Medicare audit activity, including increased use of sampling and extrapolation, resulting in additional unpaid reimbursement claims and an increase in the backlog of appealed claims denials; changes, delays in (including in connection with resolution of Medicare payment reviews or appeals), or suspension of reimbursement for Encompass Health's services by governmental or private payors; changes in the regulation of the healthcare industry at either or both of the federal and state levels, including as part of national healthcare reform and deficit reduction and Encompass Health's ability to adapt operations to those changes, including in connection with the CMS inpatient rehabilitation review choice demonstration project; competitive pressures in the healthcare industry and Encompass Health's response thereto; Encompass Health's ability to obtain and retain favorable arrangements with third-party payors; Encompass Health's ability to control costs, particularly labor and employee benefit costs, including group medical expenses; adverse effects resulting from coverage determinations made by Medicare Administrative Contractors regarding its Medicare reimbursement claims and lengthening delays in Encompass Health's ability to recover improperly denied claims through the administrative appeals process on a timely basis; Encompass Health's ability to adapt to changes in the healthcare delivery system, including value-based purchasing and involvement in coordinated care initiatives or programs that may arise with its referral sources; Encompass Health's ability to attract and retain nurses, therapists, and other healthcare professionals in a highly competitive environment with often severe staffing shortages, which may be worsened by infectious disease outbreaks, and the impact on Encompass Health's labor expenses from potential union activity, staffing shortages, and competitive compensation practices; general conditions in the economy and capital markets, including any instability or uncertainty related to trade war, armed conflict or an act of terrorism, governmental impasse over approval of the United States federal budget, an increase in the debt ceiling, or an international sovereign debt crisis; the increase in the cost of, or the decrease in the availability of, construction materials and necessary supplies, including as a result of tariffs and import restrictions; the increase in the costs of defending and insuring against
14 | ||||||||
Encompass Health Corporation and Subsidiaries
Forward-Looking Statements
alleged professional liability claims, and Encompass Health's ability to predict the estimated costs related to such claims; and other factors which may be identified from time to time in Encompass Health's SEC filings and other public announcements, including Encompass Health's Form 10‑K for the year ended December 31, 2024 and Form 10-Q for the quarter ended March 31, 2025, when filed.
15 | ||||||||