ehc-20221026
false000078516100007851612022-10-262022-10-26

UNITED STATES
SECURITIES AND EXCHANGE COMMISSION
WASHINGTON, D.C. 20549
FORM 8-K
CURRENT REPORT
Pursuant To Section 13 or 15(d) of the Securities Exchange Act of 1934
Date of Report (date of earliest event reported): October 26, 2022
Encompass Health Corporation
(Exact name of Registrant as specified in its Charter)
Delaware
(State or Other Jurisdiction of Incorporation)
001-1031563-0860407
(Commission File Number)(IRS Employer Identification No.)
9001 Liberty Parkway, Birmingham, Alabama 35242
(Address of Principal Executive Offices, Including Zip Code)
(205967-7116
(Registrant’s Telephone Number, Including Area Code)
Check the appropriate box below if the Form 8-K filing is intended to simultaneously satisfy the filing obligation of the registrant under any of the following provisions:
Written communication pursuant to Rule 425 under the Securities Act (17 CFR 230.425)
Soliciting material pursuant to Rule 14a-12 under the Exchange Act (17 CFR 240.14a-12)
Pre-commencement communications pursuant to Rule 14d-2(b) under the Exchange Act (17 CFR 240.14d-2(b))
Pre-commencement communications pursuant to Rule 13e-4(c) under the Exchange Act (17 CFR 240.13e-4(c))
Indicate by check mark whether the registrant is an emerging growth company as defined in Rule 405 of the Securities Act of 1933 or Rule 12b-2 of the Securities Exchange Act of 1934.     Emerging growth company  
If an emerging growth company, indicate by check mark if the registrant has elected not to use the extended transition period for complying with any new or revised financial accounting standards provided pursuant to Section 13(a) of the Exchange Act. ☐
Securities registered pursuant to Section 12(b) of the Act:
Title of each classTrading Symbol(s)Name of each exchange on which registered
Common Stock, par value $0.01 per shareEHCNew York Stock Exchange


The information contained herein is being furnished pursuant to Item 2.02 of Form 8‑K, “Results of Operations and Financial Condition,” and Item 7.01 of Form 8-K, “Regulation FD Disclosure.” This information shall not be deemed “filed” for purposes of Section 18 of the Securities Exchange Act of 1934, as amended (the “Exchange Act”), or incorporated by reference in any filing under the Securities Act of 1933, as amended, or the Exchange Act, except as shall be expressly set forth by specific reference in such a filing.
ITEM 2.02. Results of Operations and Financial Condition.
    On October 26, 2022, Encompass Health Corporation (“Encompass Health” or the “Company”) issued a press release reporting the financial results of the Company for the three and nine months ended September 30, 2022. A copy of the press release is attached to this report as Exhibit 99.1 and incorporated herein by reference.
    The Company uses “same-store” comparisons to explain the changes in certain performance metrics and line items within its financial statements. Same-store comparisons are calculated based on hospitals open throughout both the full current and prior periods presented. These comparisons include the financial results of market consolidation transactions in existing markets, as it is difficult to determine, with precision, the incremental impact of these transactions on the Company's results of operations.
ITEM 7.01. Regulation FD Disclosure.
See Item 2.02, “Results of Operations and Financial Condition,” above.
In addition, a copy of the supplemental information which will be discussed during the Company’s earnings call at 10:00 a.m. Eastern Time on Thursday, October 27, 2022 is attached to this report as Exhibit 99.2 and incorporated herein by reference.
Note Regarding Presentation of Non-GAAP Financial Measures
The financial data contained in the press release and supplemental information include non-GAAP financial measures, including the Company’s adjusted earnings per share, leverage ratio, Adjusted EBITDA, and adjusted free cash flow.
The Company is providing adjusted earnings per share from continuing operations attributable to Encompass Health (“adjusted earnings per share”). The Company believes the presentation of adjusted earnings per share provides useful additional information to investors because it provides better comparability of ongoing operating performance to prior periods given that it excludes the impact of government, class action, and related settlements; professional fees—accounting, tax, and legal; mark-to-market adjustments for stock appreciation rights; gains or losses related to hedging and equity instruments; loss on early extinguishment of debt; adjustments to its income tax provision (such as valuation allowance adjustments and settlements of income tax claims); items related to corporate and facility restructurings; and certain other items the Company believes to be non-indicative of its ongoing operating performance. It is reasonable to expect that one or more of these excluded items will occur in future periods, but the amounts recognized can vary significantly from period to period and may not directly relate to the Company’s ongoing operating performance. Accordingly, they can complicate comparisons of the Company’s results of operations across periods and comparisons of the Company’s results to those of other healthcare companies. Adjusted earnings per share should not be considered as a measure of financial performance under generally accepted accounting principles in the United States (“GAAP”) as the items excluded from it are significant components in understanding and assessing financial performance. Because adjusted earnings per share is not a measurement determined in accordance with GAAP and is thus susceptible to varying calculations, it may not be comparable as presented to other similarly titled measures of other companies. The Company reconciles adjusted earnings per share to earnings per share in the press release attached as Exhibit 99.1 and the supplemental information attached as Exhibit 99.2.
The leverage ratio referenced therein is defined as the ratio of consolidated total debt to Adjusted EBITDA for the trailing four quarters. The Company believes its leverage ratio and Adjusted EBITDA are measures of its ability to service its debt and its ability to make capital expenditures. Additionally, the leverage ratio is a standard measurement used by investors to gauge the creditworthiness of an institution. The Company’s credit agreement also includes a maximum leverage ratio financial covenant which allows the Company to deduct cash on hand from consolidated total debt. In calculating the leverage ratio under our credit agreement, we are permitted to use pro forma Adjusted EBITDA, the calculation of which includes historical income statement items and pro forma adjustments, subject to certain limitations, resulting from (1) dispositions and repayments or incurrence of debt and (2) investments, acquisitions, mergers, amalgamations, consolidations and other operational changes to the extent such items or effects are not yet reflected in our trailing four-quarter financial statements. The Company reconciles Adjusted EBITDA to net income and to net cash provided by operating activities in the press release attached as Exhibit 99.1 and the supplemental information attached as Exhibit 99.2.


The Company uses Adjusted EBITDA on a consolidated basis as a liquidity measure. The Company believes this financial measure on a consolidated basis is important in analyzing its liquidity because it is the key component of certain material covenants contained within the Company’s credit agreement, which is discussed in more detail in Item 7, Management’s Discussion and Analysis of Financial Condition and Results of Operations, “Liquidity and Capital Resources,” and Note 10, Long-term Debt, to the consolidated financial statements included in its Annual Report on Form 10‑K for the year ended December 31, 2021 (the “2021 Form 10‑K”). These covenants are material terms of the credit agreement. Noncompliance with these financial covenants under the credit agreement—its interest coverage ratio and its leverage ratio—could result in the Company’s lenders requiring the Company to immediately repay all amounts borrowed. If the Company anticipated a potential covenant violation, it would seek relief from its lenders, which would have some cost to the Company, and such relief might be on terms less favorable to those in the Company’s existing credit agreement. In addition, if the Company cannot satisfy these financial covenants, it would be prohibited under the credit agreement from engaging in certain activities, such as incurring additional indebtedness, paying common stock dividends, making certain payments, and acquiring and disposing of assets. Consequently, Adjusted EBITDA is critical to the Company’s assessment of its liquidity.
In general terms, the credit agreement definition of Adjusted EBITDA, therein referred to as “Adjusted Consolidated EBITDA,” allows the Company to add back to consolidated net income interest expense, income taxes, and depreciation and amortization and then add back to consolidated net income (1) all unusual or nonrecurring items reducing consolidated net income (of which only up to $10 million in a year may be cash expenditures), (2) any losses from discontinued operations, (3) non-ordinary course fees, costs and expenses incurred with respect to any litigation or settlement, (4) share-based compensation expense, (5) costs and expenses associated with changes in the fair value of marketable securities, (6) costs and expenses associated with the issuance or prepayment debt and acquisitions, and (7) any restructuring charges and certain pro-forma cost savings and synergies related to transactions and initiatives, which in the aggregate are not in excess of 25% of Adjusted Consolidated EBITDA. The Company also subtracts from consolidated net income all unusual or nonrecurring items to the extent they increase consolidated net income.
The calculation of Adjusted EBITDA under the credit agreement does not require us to deduct net income attributable to noncontrolling interests or gains on fair value adjustments of hedging and equity instruments, disposal of assets, and development activities. It also does not allow us to add back losses on fair value adjustments of hedging instruments or unusual or nonrecurring cash expenditures in excess of $10 million. These items and amounts, in addition to the items falling within the credit agreement’s “unusual or nonrecurring” classification, may occur in future periods, but can vary significantly from period to period and may not directly relate to, or be indicative of, the Company's ongoing liquidity or operating performance. Accordingly, the Adjusted EBITDA calculation presented here includes adjustments for them.
Adjusted EBITDA is not a measure of financial performance under GAAP, and the items excluded from Adjusted EBITDA are significant components in understanding and assessing financial performance. Therefore, Adjusted EBITDA should not be considered a substitute for net income or cash flows from operating, investing, or financing activities. Because Adjusted EBITDA is not a measurement determined in accordance with GAAP and is thus susceptible to varying calculations, Adjusted EBITDA, as presented, may not be comparable to other similarly titled measures of other companies. Revenues and expenses are measured in accordance with the policies and procedures described in Note 1, Summary of Significant Accounting Policies, to the consolidated financial statements accompanying the 2021 Form 10-K.
The Company also uses adjusted free cash flow as an analytical indicator to assess its performance. Management believes the presentation of adjusted free cash flow provides investors an efficient means by which they can evaluate the Company’s capacity to reduce debt, pursue development activities, and return capital to its common stockholders. The calculation of adjusted free cash flow and a reconciliation of net cash provided by operating activities to adjusted free cash flow are included in the press release attached as Exhibit 99.1 and the supplemental information attached as Exhibit 99.2. This measure is not a defined measure of financial performance under GAAP and should not be considered as an alternative to net cash provided by operating activities. The Company’s definition of adjusted free cash flow is limited and does not represent residual cash flows available for discretionary spending. Because this measure is not determined in accordance with GAAP and is susceptible to varying calculations, it may not be comparable to other similarly titled measures presented by other companies. See the consolidated statements of cash flows included in the 2021 Form 10-K and the condensed consolidated statements of cash flows included in the Company's quarterly report on Form 10-Q for the quarterly period ended September 30, 2022 (the “September 2022 Form 10-Q”), when filed, and in the press release attached as Exhibit 99.1 for the GAAP measures of cash flows from operating, investing, and financing activities.


Forward-Looking Statements
The information contained in the press release and supplemental information includes certain estimates, projections, and other forward-looking statements that involve known and unknown risks and relate to, among other things, future events, the business model, strategy, outlook and guidance, labor cost trends, financial plans, dividend strategies or payments, effective income tax rates, plans to repurchase its debt or equity securities, future financial performance, projected business results, ability to return value to its shareholders, projected capital expenditures and development plans, leverage ratio, acquisition opportunities, and the impact of future legislation or regulation. In some cases, you can identify forward-looking statements by terminology such as “may,” “will,” “should,” “expects,” “plans,” “anticipates,” “believes,” “estimates,” “predicts,” “targets,” “potential,” or “continue” or the negative of these terms or other comparable terminology. These estimates, projections, and other forward-looking statements are based on assumptions the Company believes, as of the date hereof, are reasonable. Inevitably, there will be differences between such estimates and actual results, and those differences may be material.
There can be no assurance that any estimates, projections, or forward-looking statements will be realized.
All such estimates, projections, and forward-looking statements speak only as of the date hereof. The Company undertakes no duty to publicly update or revise that information.
You are cautioned not to place undue reliance on the estimates, projections, and other forward-looking statements in this report, the press release, and supplemental information as they are based on current expectations and general assumptions and are subject to various risks, uncertainties, and other factors, including those set forth in the attached press release and in the 2021 Form 10‑K, the September 2022 Form 10-Q when filed, and in other documents the Company previously filed with the SEC, many of which are beyond the Company’s control. These factors may cause actual results to differ materially from the views, beliefs, and estimates expressed herein.
ITEM 9.01. Financial Statements and Exhibits.
(d)    Exhibits.
Exhibit NumberDescription
104Cover Page Interactive Data File - the cover page iXBRL tags are embedded within the Inline XBRL document


SIGNATURES
Pursuant to the requirements of the Securities Exchange Act of 1934, the Registrant has duly caused this Report to be signed on its behalf by the undersigned hereunto duly authorized.
ENCOMPASS HEALTH CORPORATION
By:
/S/   DOUGLAS E. COLTHARP
Name:Douglas E. Coltharp
Title:Executive Vice President and Chief Financial Officer
Dated: October 26, 2022

Exhibit 99.1
encompasshealthnewlogoa15.jpg
Media ContactOctober 26, 2022
Casey Winger, 205 447-6410
[email protected]
Investor Relations Contact
Mark Miller, 205 970-5860
[email protected]

Encompass Health reports results for third quarter 2022

BIRMINGHAM, Ala. - Encompass Health Corporation (NYSE: EHC), the largest owner and operator of inpatient rehabilitation hospitals in the United States, today reported its results of operations for the third quarter ended September 30, 2022.
“Our third quarter results are further evidence of the strong demand for our inpatient rehabilitation services,” said President and Chief Executive Officer of Encompass Health Mark Tarr. “Third quarter discharge growth was 7.5%, inclusive of 4.1% same-store growth. We made continued progress on reducing contract labor through our hiring and retention initiatives, but elevated staffing costs again impacted our profitability. Consequently, we have revised our 2022 guidance. We remain confident in the long-term prospects for our business.”
On July 1, 2022, Encompass Health completed the spin off of Enhabit Home Health & Hospice (“Enhabit”), which is now an independent, publicly traded company. Enhabit’s historical results are reported in Encompass Health’s discontinued operations.
Summary results
Growth
Q3 2022Q3 2021DollarsPercent
(In Millions, Except Per Share Data)
Net operating revenue$1,089.5 $1,010.8 $78.7 7.8 %
Income from continuing operations attributable to Encompass Health per diluted share
0.63 0.76 (0.13)(17.1)%
Adjusted earnings per share0.67 0.76 (0.09)(11.8)%
Cash flows provided by operating activities
70.1 177.6 (107.5)(60.5)%
Adjusted EBITDA195.3 199.3 (4.0)(2.0)%
Adjusted free cash flow26.6 87.7 (61.1)(69.7)%
Nine Months Ended September 30,
20222021
Cash flows provided by operating activities
$533.6 $592.0 $(58.4)(9.9)%
Adjusted free cash flow294.1 302.0 (7.9)(2.6)%
See attached supplemental information for calculations of non-GAAP measures and reconciliations to their most comparable GAAP measure.
1


Net operating revenue and Adjusted EBITDA
% of Revenue% of Revenue
(In Millions)Q3 2022Q3 2021
Net operating revenue$1,089.5 $1,010.8 
% Change7.8 %
Salaries and benefits(605.6)(55.6)%(537.0)(53.1)%
Hospital operating expenses (236.6)(21.7)%(217.6)(21.5)%
General and administrative expenses(32.0)(2.9)%(32.2)(3.2)%
Other income0.9 0.7 
Equity in nonconsolidated affiliates0.7 0.9 
Noncontrolling interests in continuing operations(21.6)(26.3)
Adjusted EBITDA$195.3 $199.3 
% Change(2.0)%
(Actual Amounts)
Discharges53,743 49,983 
% Change7.5 %
Same-store discharge growth
4.1 %
Net patient revenue per discharge$19,809 $19,681 
% Change0.7 %
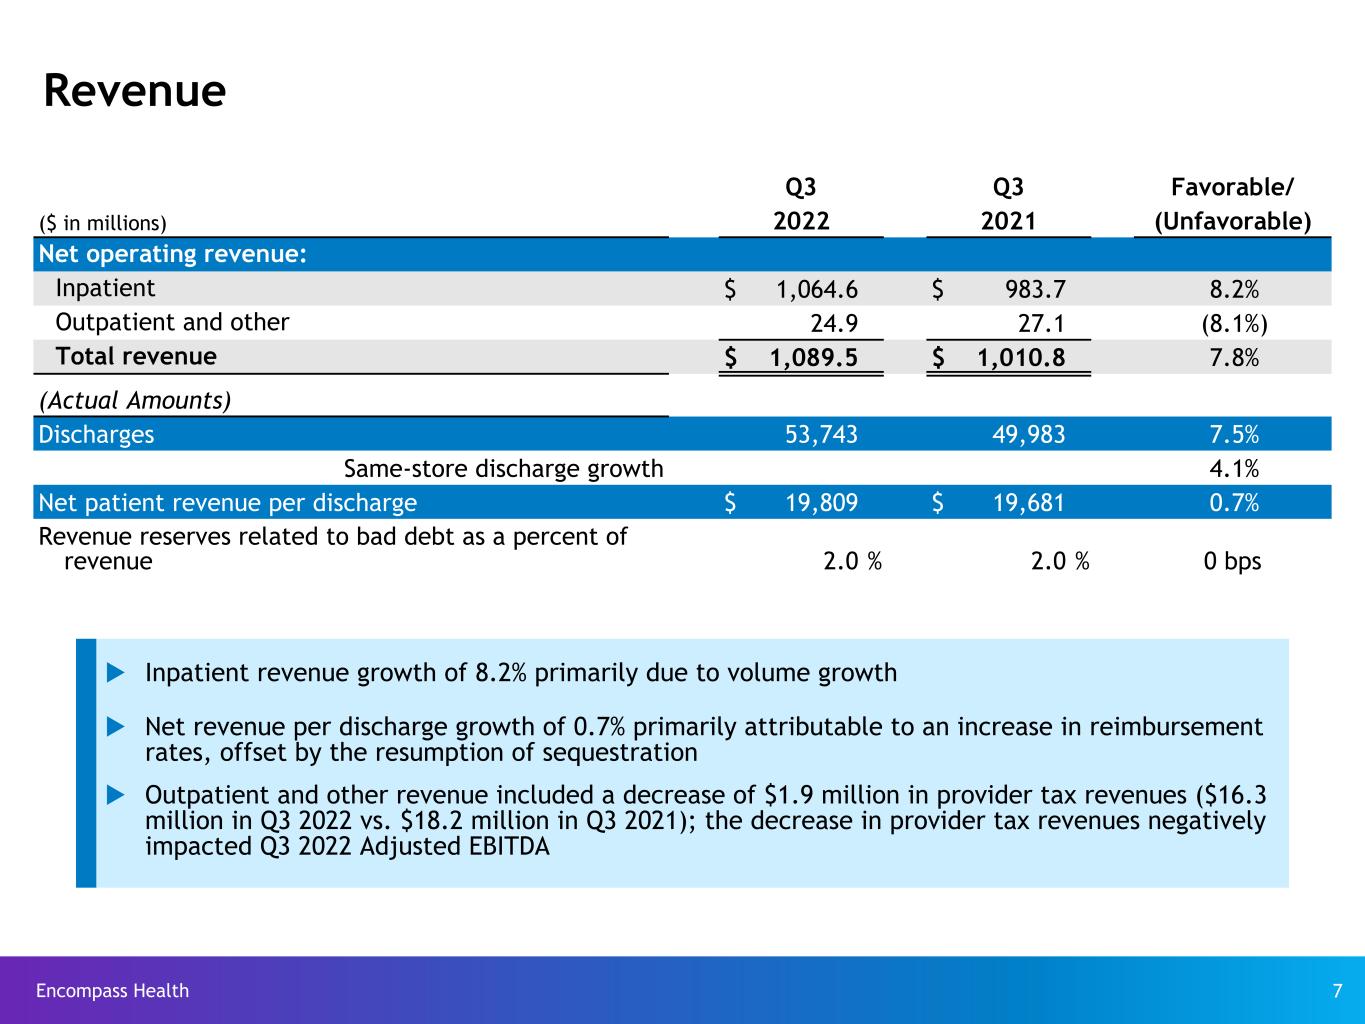
Revenue – Inpatient revenue growth resulted primarily from increased volumes. Total discharge growth for the third quarter of 2022 was 7.5% with same-store growth of 4.1%. Revenue reserves related to bad debt as a percent of revenue remained constant at 2.0%.
Growth in net patient revenue per discharge of 0.7% primarily resulted from an increase in reimbursement rates, offset by the resumption of sequestration.
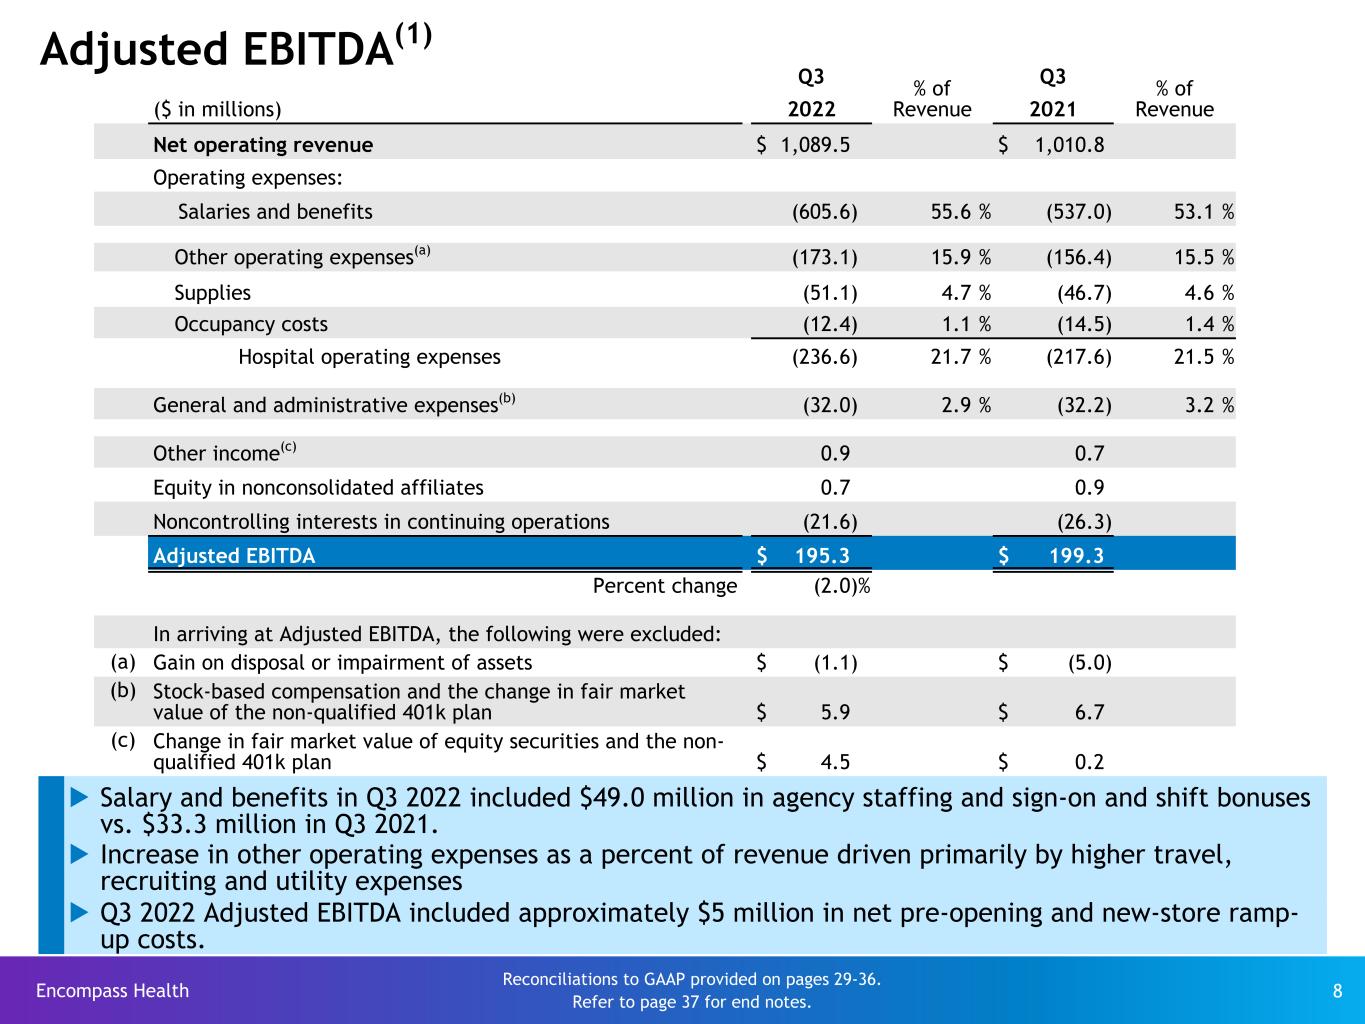
Adjusted EBITDA – The decrease in Adjusted EBITDA primarily resulted from increased staffing costs.
2022 Guidance
The Company is revising its guidance for full-year 2022.
PriorUpdated
2022 Guidance Ranges2022 Guidance Ranges
provided August 1, 2022provided October 26, 2022
(In Millions, Except Per Share Data)
Net operating revenue$4,250 to $4,300$4,320 to $4,350
Adjusted EBITDA$820 to $840$800 to $820
Adjusted earnings per share from continuing operations attributable to Encompass Health
$2.77 to $2.91$2.71 to $2.86
For considerations regarding the Company’s 2022 guidance ranges, see the supplemental information posted on the Company’s website at http://investor.encompasshealth.com. See also the “Other information” section below for an explanation of why the Company does not provide guidance for comparable GAAP measures for Adjusted EBITDA and adjusted earnings per share.
2


Earnings conference call and webcast
The Company will host an investor conference call at 10:00 a.m. Eastern Time on Thursday, October 27, 2022 to discuss its results for the third quarter of 2022. For reference during the call, the Company will post certain supplemental information at http://investor.encompasshealth.com.
The conference call may be accessed by dialing 800 274-8461 and giving the conference ID EHCQ322. International callers should dial 203 518-9843 and give the same conference ID. Please call approximately ten minutes before the start of the call to ensure you are connected. The conference call will also be webcast live and will be available for on-line replay at http://investor.encompasshealth.com by clicking on an available link.
About Encompass Health
Encompass Health (NYSE: EHC) is the largest owner and operator of inpatient rehabilitation hospitals in the United States. With a national footprint that includes 153 hospitals in 36 states and Puerto Rico, the Company provides high-quality, compassionate rehabilitative care for patients recovering from a major injury or illness, using advanced technology and innovative treatments to maximize recovery. Encompass Health is ranked as one of Fortune's 100 Best Companies to Work For. For more information, visit encompasshealth.com, or follow us on our newsroom, Twitter, Instagram and Facebook.
Other information
The information in this press release is summarized and should be read in conjunction with the Company’s Quarterly Report on Form 10-Q for the quarter ended September 30, 2022 (the “September 2022 Form 10-Q”), when filed, as well as the Company’s Current Report on Form 8-K filed on October 26, 2022 (the “Q3 Earnings Form 8-K”), to which this press release is attached as Exhibit 99.1. In addition, the Company will post supplemental information today on its website at http://investor.encompasshealth.com for reference during its October 27, 2022 earnings call.
The financial data contained in the press release and supplemental information include non-GAAP financial measures, including the Company’s adjusted earnings per share, leverage ratio, Adjusted EBITDA, and adjusted free cash flow. Reconciliations to their most comparable GAAP measure, except with regard to non-GAAP guidance, are included below or in the Q3 Earnings Form 8-K. Readers are encouraged to review the “Note Regarding Presentation of Non-GAAP Financial Measures” included in the Q3 Earnings Form 8-K which provides further explanation and disclosure regarding the Company’s use of these non-GAAP financial measures.
Excluding net operating revenues, the Company does not provide guidance on a GAAP basis because it is unable to predict, with reasonable certainty, the future impact of items that are deemed to be outside the control of the Company or otherwise not indicative of its ongoing operating performance. Such items include government, class action, and related settlements; professional fees—accounting, tax, and legal; mark-to-market adjustments for stock appreciation rights; gains or losses related to hedging instruments; loss on early extinguishment of debt; adjustments to its income tax provision (such as valuation allowance adjustments and settlements of income tax claims); items related to corporate and facility restructurings; and certain other items the Company believes to be not indicative of its ongoing operations. These items cannot be reasonably predicted and will depend on several factors, including industry and market conditions, and could be material to the Company’s results computed in accordance with GAAP.
However, the following reasonably estimable GAAP measures for 2022 would be included in a reconciliation for Adjusted EBITDA if the other reconciling GAAP measures could be reasonably predicted:
Interest expense and amortization of debt discounts and fees - estimate of $150 million to $160 million
Amortization of debt-related items - approximately $10 million
The Q3 Earnings Form 8-K and, when filed, the September 2022 Form 10-Q can be found on the Company’s website at http://investor.encompasshealth.com and the SEC's website at www.sec.gov.
3

Encompass Health Corporation and Subsidiaries
Condensed Consolidated Statements of Comprehensive Income
(Unaudited)
Three Months Ended September 30,Nine Months Ended September 30,
 2022202120222021
(In Millions, Except Per Share Data)
Net operating revenues$1,089.5 $1,010.8 $3,211.3 $2,972.4 
Operating expenses:
Salaries and benefits605.6 537.0 1,778.9 1,554.8 
Other operating expenses172.0 151.4 500.3 442.2 
Occupancy costs12.4 14.5 41.6 44.5 
Supplies51.1 46.7 148.2 136.0 
General and administrative expenses37.9 38.9 111.5 123.7 
Depreciation and amortization62.1 55.5 180.3 162.9 
Total operating expenses941.1 844.0 2,760.8 2,464.1 
Loss on early extinguishment of debt— — 1.4 1.0 
Interest expense and amortization of debt discounts and fees38.2 39.9 138.2 124.3 
Other expense (income)3.6 (0.5)13.6 (4.8)
Equity in net income of nonconsolidated affiliates(0.7)(0.9)(2.6)(2.5)
Income from continuing operations before income tax expense107.3 128.3 299.9 390.3 
Provision for income tax expense21.8 26.2 68.2 79.4 
Income from continuing operations85.5 102.1 231.7 310.9 
(Loss) income from discontinued operations, net of tax(18.5)24.6 16.7 90.6 
Net and comprehensive income67.0 126.7 248.4 401.5 
Less: Net income attributable to noncontrolling interests included in continuing operations(21.6)(26.3)(65.5)(79.6)
Less: Net income attributable to noncontrolling interests included in discontinued operations— (0.4)(1.3)(1.3)
Less: Net and comprehensive income attributable to noncontrolling interests(21.6)(26.7)(66.8)(80.9)
Net and comprehensive income attributable to Encompass Health$45.4 $100.0 $181.6 $320.6 
Weighted average common shares outstanding:  
Basic99.2 99.0 99.2 99.0 
Diluted100.5 100.2 100.3 100.1 
Earnings per common share:
Basic earnings per share attributable to Encompass Health common shareholders:
   
Continuing operations
$0.64 $0.76 $1.67 $2.32 
Discontinued operations
(0.19)0.24 0.15 0.90 
Net income
$0.45 $1.00 $1.82 $3.22 
Diluted earnings per share attributable to Encompass Health common shareholders:
Continuing operations
$0.63 $0.76 $1.66 $2.31 
Discontinued operations
(0.18)0.24 0.15 0.89 
Net income
$0.45 $1.00 $1.81 $3.20 
Amounts attributable to Encompass Health common shareholders: 
Income from continuing operations$63.9 $75.8 $166.2 $231.3 
(Loss) income from discontinued operations, net of tax(18.5)24.2 15.4 89.3 
Net income attributable to Encompass Health$45.4 $100.0 $181.6 $320.6 
4

Encompass Health Corporation and Subsidiaries
Condensed Consolidated Balance Sheets
(Unaudited)
September 30, 2022December 31, 2021
 (In Millions)
Assets  
Current assets:  
Cash and cash equivalents$59.8 $49.4 
Restricted cash44.3 62.5 
Accounts receivable500.1 515.8 
Other current assets129.6 114.9 
Current assets of discontinued operations— 178.8 
Total current assets733.8 921.4 
Property and equipment, net2,807.4 2,581.2 
Operating lease right-of-use assets195.7 193.7 
Goodwill1,247.4 1,237.0 
Intangible assets, net284.9 158.4 
Other long-term assets206.6 230.0 
Noncurrent assets of discontinued operations0.1 1,543.2 
Total assets$5,475.9 $6,864.9 
Liabilities and Shareholders’ Equity
Current liabilities:  
Current portion of long-term debt$26.2 $37.8 
Current operating lease liabilities22.7 23.5 
Accounts payable134.1 134.0 
Accrued expenses and other current liabilities421.6 421.1 
Current liabilities of discontinued operations0.1 132.4 
Total current liabilities604.7 748.8 
Long-term debt, net of current portion2,719.0 3,240.5 
Long-term operating lease liabilities183.3 179.6 
Deferred income tax liabilities46.7 23.3 
Other long-term liabilities174.0 172.7 
Noncurrent liabilities of discontinued operations0.4 100.8 
 3,728.1 4,465.7 
Commitments and contingencies
Redeemable noncontrolling interests37.8 42.2 
Shareholders’ equity:  
Encompass Health shareholders’ equity1,217.0 1,911.3 
Noncontrolling interests493.0 445.7 
Total shareholders’ equity1,710.0 2,357.0 
Total liabilities and shareholders’ equity$5,475.9 $6,864.9 
5

Encompass Health Corporation and Subsidiaries
Condensed Consolidated Statements of Cash Flows
(Unaudited)
 Nine Months Ended September 30,
 20222021
 (In Millions)
Cash flows from operating activities:  
Net income$248.4 $401.5 
Income from discontinued operations, net of tax(16.7)(90.6)
Adjustments to reconcile net income to net cash provided by operating activities—  
Depreciation and amortization180.3 162.9 
Loss on early extinguishment of debt1.4 1.0 
Equity in net income of nonconsolidated affiliates(2.6)(2.5)
Distributions from nonconsolidated affiliates3.7 2.4 
Stock-based compensation21.1 19.6 
Deferred tax (benefit) expense(7.7)1.6 
Realized loss (gain) on sale of investments16.5 (1.8)
Other, net9.7 4.2 
Change in assets and liabilities, net of acquisitions—  
Accounts receivable22.4 (10.9)
Other assets5.0 (26.5)
Accounts payable(0.3)9.7 
Accrued payroll(9.3)16.0 
Accrued interest payable(20.7)(23.1)
Other liabilities26.4 (5.0)
Net cash provided by operating activities of discontinued operations56.0 133.5 
Total adjustments301.9 281.1 
Net cash provided by operating activities533.6 592.0 
Cash flows from investing activities:
Acquisitions of businesses, net of cash acquired— (1.1)
Purchases of property and equipment(374.9)(332.3)
Additions to capitalized software costs(7.5)(11.9)
Proceeds from disposal of assets5.9 17.6 
Purchase of restricted investments(25.1)(8.3)
Other, net(15.4)(10.0)
Net cash used in investing activities of discontinued operations(3.6)(99.6)
Net cash used in investing activities(420.6)(445.6)
6

Encompass Health Corporation and Subsidiaries
Condensed Consolidated Statements of Cash Flows (Continued)
(Unaudited)
Nine Months Ended September 30,
20222021
(In Millions)
Cash flows from financing activities:  
Principal payments on debt, including pre-payments(345.3)(210.9)
Borrowings on revolving credit facility180.0 145.0 
Payments on revolving credit facility(340.0)(55.0)
Principal payments under finance lease obligations(14.3)(13.0)
Debt amendment costs(21.6)— 
Taxes paid on behalf of employees for shares withheld(7.2)(14.6)
Contributions from noncontrolling interests of consolidated affiliates55.1 36.1 
Dividends paid on common stock(84.1)(84.5)
Distributions paid to noncontrolling interests of consolidated affiliates(68.2)(76.2)
Other, net0.3 (0.1)
Net cash provided by (used in) financing activities of discontinued operations516.1 (9.2)
Net cash used in financing activities(129.2)(282.4)
Decrease in cash, cash equivalents, and restricted cash(16.2)(136.0)
Cash, cash equivalents, and restricted cash at beginning of period120.3 310.9 
Cash, cash equivalents, and restricted cash at end of period$104.1 $174.9 
Reconciliation of Cash, Cash Equivalents, and Restricted Cash
Cash and cash equivalents at beginning of period
$49.4 $185.6 
Restricted cash at beginning of period
62.5 63.9 
Restricted cash included in other long-term assets at beginning of period0.4 21.5 
Cash, cash equivalents, and restricted cash in discontinued operations at beginning of period8.0 39.9 
Cash, cash equivalents, and restricted cash at beginning of period
$120.3 $310.9 
Cash and cash equivalents at end of period
$59.8 $65.7 
Restricted cash at end of period
44.3 73.6 
Restricted cash included in other long-term assets at end of period
— 4.2 
Cash, cash equivalents, and restricted cash in discontinued operations at end of period— 31.4 
Cash, cash equivalents, and restricted cash at end of period
$104.1 $174.9 
7

Encompass Health Corporation and Subsidiaries
Supplemental Information
Earnings Per Share
Three Months Ended September 30,Nine Months Ended September 30,
2022202120222021
(In Millions, Except Per Share Data)
Adjusted EBITDA$195.3 $199.3 $586.6 $616.5 
Depreciation and amortization
(62.1)(55.5)(180.3)(162.9)
Interest expense and amortization of debt discounts and fees
(38.2)(39.9)(138.2)(124.3)
Stock-based compensation(7.3)(6.6)(21.1)(19.6)
Gain (loss) on disposal or impairment of assets1.1 5.0 (2.4)1.7 
88.8 102.3 244.6 311.4 
Items not indicative of ongoing operating performance:
Loss on early extinguishment of debt— — (1.4)(1.0)
Change in fair market value of equity securities
(3.1)(0.3)(8.8)0.3 
Pre-tax income85.7 102.0 234.4 310.7 
Income tax expense
(21.8)(26.2)(68.2)(79.4)
Income from continuing operations (1)
$63.9 $75.8 $166.2 $231.3 
Basic shares99.2 99.0 99.2 99.0 
Diluted shares100.5 100.2 100.3 100.1 
Basic earnings per share (1)
$0.64 $0.76 $1.67 $2.32 
Diluted earnings per share (1)
$0.63 $0.76 $1.66 $2.31 
(1)Income from continuing operations attributable to Encompass Health
8

Encompass Health Corporation and Subsidiaries
Supplemental Information
Adjusted Earnings Per Share

Q39 Months
2022202120222021
Earnings per share, as reported$0.63 $0.76 $1.66 $2.31 
Adjustments, net of tax:
Bondholder consent fees associated with Enhabit distribution— — 0.15 — 
Income tax adjustments
0.01 — 0.08 (0.03)
Loss on early extinguishment of debt— — 0.01 0.01 
Change in fair market value of equity securities
0.02 — 0.06 — 
Adjusted earnings per share*
$0.67 $0.76 $1.97 $2.28 
*    Adjusted EPS may not sum due to rounding.

9

Encompass Health Corporation and Subsidiaries
Supplemental Information
Adjusted Earnings Per Share

For the Three Months Ended September 30, 2022
Adjustments
As ReportedIncome Tax AdjustmentsChange in Fair Market Value of Equity SecuritiesAs Adjusted
(In Millions, Except Per Share Amounts)
Adjusted EBITDA*$195.3 $ $ $195.3 
Depreciation and amortization(62.1)— — (62.1)
Interest expense and amortization of debt discounts and fees
(38.2)— — (38.2)
Stock-based compensation(7.3)— — (7.3)
Gain on disposal or impairment of assets1.1 — — 1.1 
Change in fair market value of equity securities
(3.1)— 3.1 — 
Income from continuing operations before income tax expense
85.7 — 3.1 88.8 
Provision for income tax expense(21.8)1.3 (0.8)(21.3)
Income from continuing operations attributable to Encompass Health
$63.9 $1.3 $2.3 $67.5 
Diluted earnings per share from continuing operations**$0.63 $0.01 $0.02 $0.67 
Diluted shares used in calculation100.5 

*    Reconciliation to GAAP provided on page 14
**    Adjusted EPS may not sum across due to rounding.
10

Encompass Health Corporation and Subsidiaries
Supplemental Information
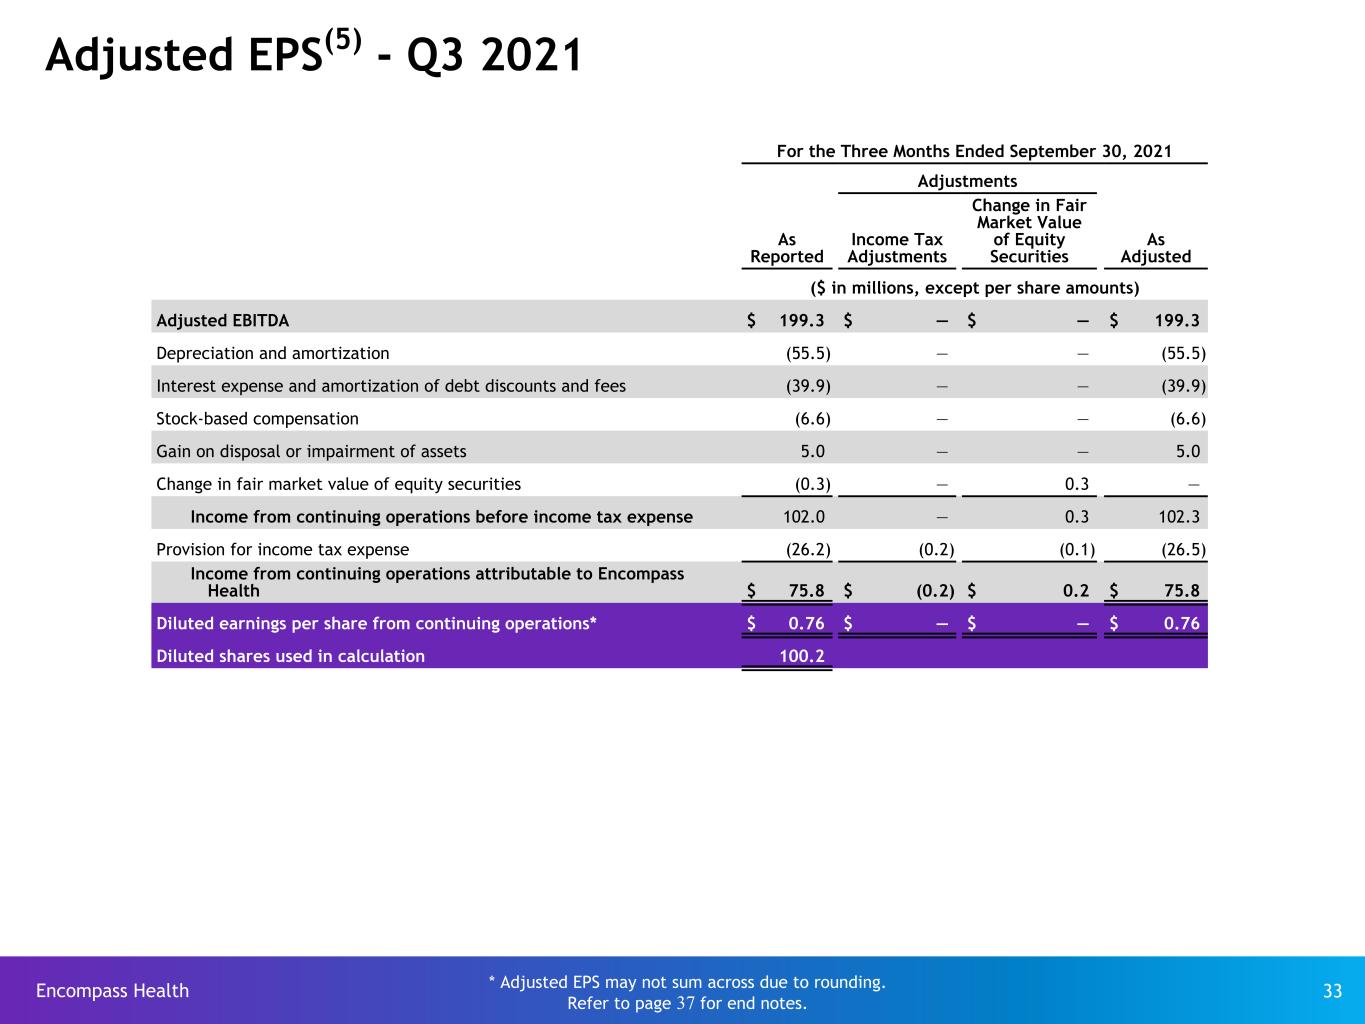
Adjusted Earnings Per Share

For the Three Months Ended September 30, 2021
Adjustments
As ReportedIncome Tax AdjustmentsChange in Fair Market Value of Equity SecuritiesAs Adjusted
(In Millions, Except Per Share Amounts)
Adjusted EBITDA*$199.3 $ $ $199.3 
Depreciation and amortization(55.5)— — (55.5)
Interest expense and amortization of debt discounts and fees
(39.9)— — (39.9)
Stock-based compensation(6.6)— — (6.6)
Gain on disposal or impairment of assets5.0 — — 5.0 
Change in fair market value of equity securities
(0.3)— 0.3 — 
Income from continuing operations before income tax expense
102.0 — 0.3 102.3 
Provision for income tax expense(26.2)(0.2)(0.1)(26.5)
Income from continuing operations attributable to Encompass Health
$75.8 $(0.2)$0.2 $75.8 
Diluted earnings per share from continuing operations**
$0.76 $ $ $0.76 
Diluted shares used in calculation100.2 

*    Reconciliation to GAAP provided on page 14
**    Adjusted EPS may not sum across due to rounding.

11

Encompass Health Corporation and Subsidiaries
Supplemental Information
Adjusted Earnings Per Share

For the Nine Months Ended September 30, 2022
Adjustments
As ReportedLoss on Early Extinguishment of DebtIncome Tax AdjustmentsBondholder Consent Fees Associated with Enhabit DistributionChange in Fair Market Value of Equity SecuritiesAs Adjusted
(In Millions, Except Per Share Amounts)
Adjusted EBITDA*$586.6 $ $ $ $ $586.6 
Depreciation and amortization(180.3)— — — — (180.3)
Interest expense and amortization of debt discounts and fees
(138.2)— — 20.5 — (117.7)
Stock-based compensation(21.1)— — — — (21.1)
Loss on disposal or impairment of assets(2.4)— — — — (2.4)
Loss on early extinguishment of debt(1.4)1.4 — — — — 
Change in fair market value of equity securities
(8.8)— — — 8.8 — 
Income from continuing operations before income tax expense
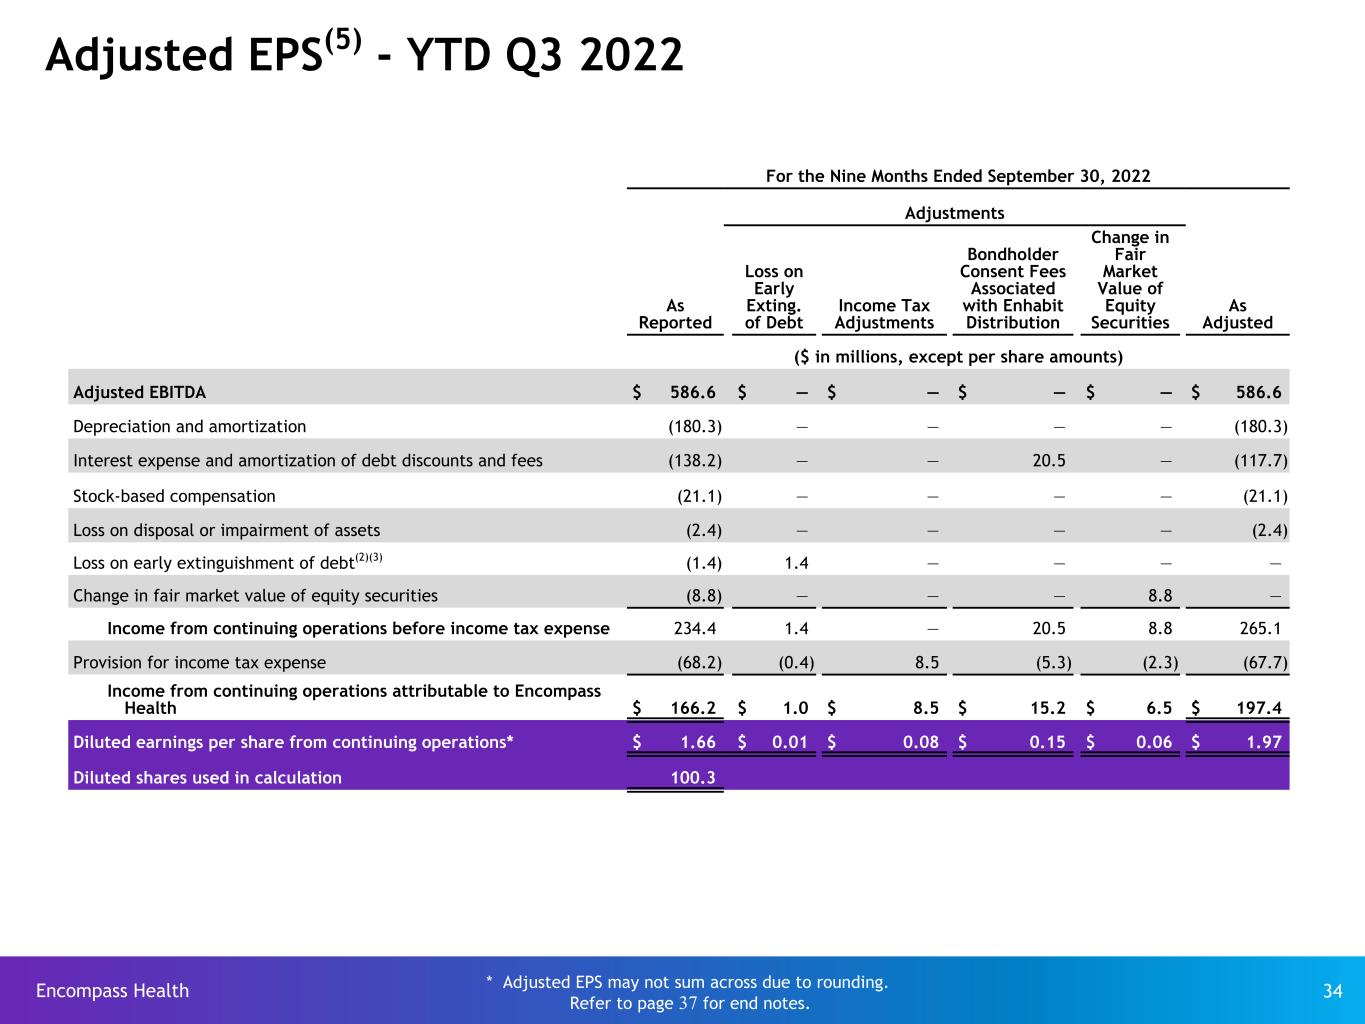
234.4 1.4 — 20.5 8.8 265.1 
Provision for income tax expense(68.2)(0.4)8.5 (5.3)(2.3)(67.7)
Income from continuing operations attributable to Encompass Health
$166.2 $1.0 $8.5 $15.2 $6.5 $197.4 
Diluted earnings per share from continuing operations**$1.66 $0.01 $0.08 $0.15 $0.06 $1.97 
Diluted shares used in calculation100.3 

*    Reconciliation to GAAP provided on page 14
**    Adjusted EPS may not sum across due to rounding.

12

Encompass Health Corporation and Subsidiaries
Supplemental Information
Adjusted Earnings Per Share

For the Nine Months Ended September 30, 2021
Adjustments
As ReportedLoss on Early Extinguishment of DebtIncome Tax AdjustmentsChange in Fair Market Value of Equity SecuritiesAs Adjusted
(In Millions, Except Per Share Amounts)
Adjusted EBITDA*$616.5 $ $ $ $616.5 
Depreciation and amortization(162.9)— — — (162.9)
Interest expense and amortization of debt discounts and fees
(124.3)— — — (124.3)
Stock-based compensation(19.6)— — — (19.6)
Gain on disposal or impairment of assets1.7 — — — 1.7 
Loss on early extinguishment of debt(1.0)1.0 — — — 
Change in fair market value of equity securities
0.3 — — (0.3)— 
Income from continuing operations before income tax expense
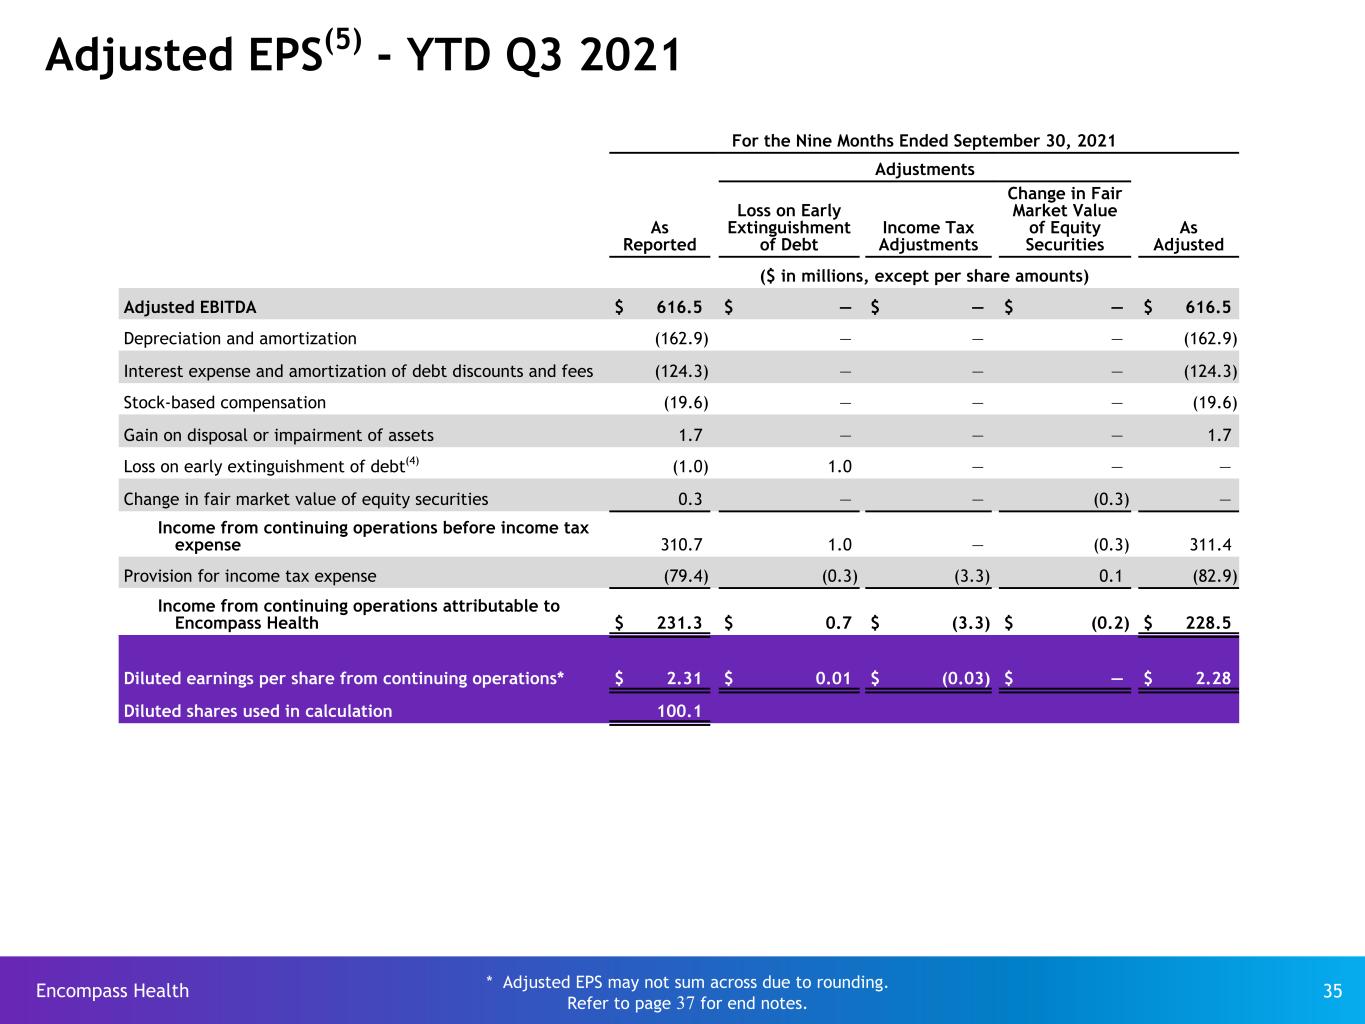
310.7 1.0 — (0.3)311.4 
Provision for income tax expense(79.4)(0.3)(3.3)0.1 (82.9)
Income from continuing operations attributable to Encompass Health
$231.3 $0.7 $(3.3)$(0.2)$228.5 
Diluted earnings per share from continuing operations**
$2.31 $0.01 $(0.03)$ $2.28 
Diluted shares used in calculation100.1 

*    Reconciliation to GAAP provided on page 14
**    Adjusted EPS may not sum across due to rounding.

13

Encompass Health Corporation and Subsidiaries
Supplemental Information
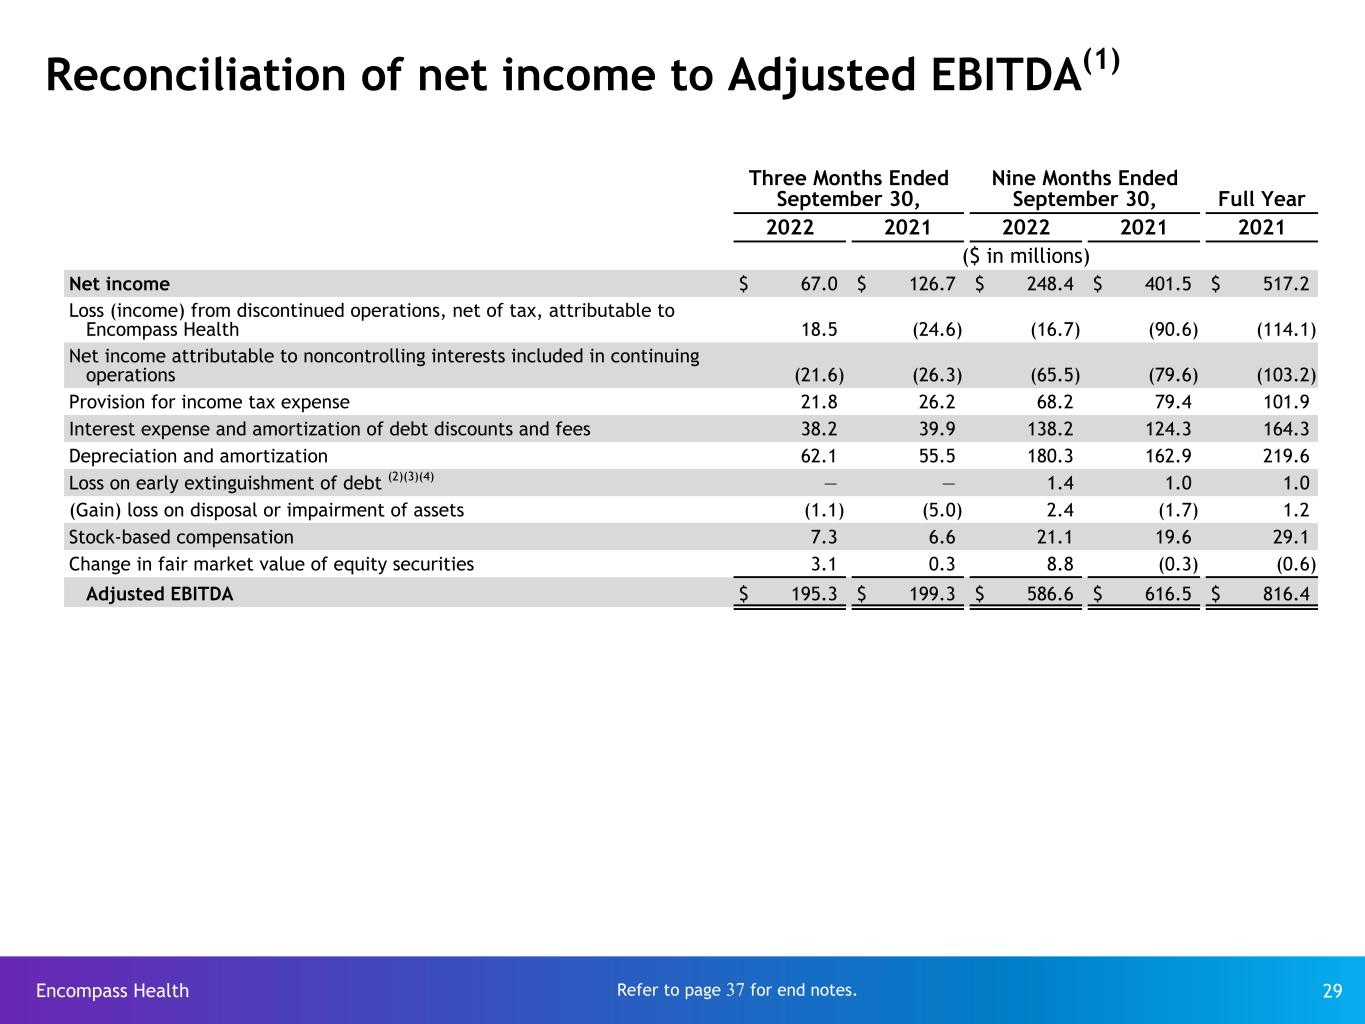
Reconciliation of Net Income to Adjusted EBITDA

 Three Months Ended September 30,Nine Months Ended September 30,
 2022202120222021
(In Millions)
Net income$67.0 $126.7 $248.4 $401.5 
Loss (income) from discontinued operations, net of tax, attributable to Encompass Health18.5 (24.6)(16.7)(90.6)
Net income attributable to noncontrolling interests included in continuing operations(21.6)(26.3)(65.5)(79.6)
Provision for income tax expense21.8 26.2 68.2 79.4 
Interest expense and amortization of debt discounts and fees
38.2 39.9 138.2 124.3 
Depreciation and amortization62.1 55.5 180.3 162.9 
Loss on early extinguishment of debt— — 1.4 1.0 
(Gain) loss on disposal or impairment of assets(1.1)(5.0)2.4 (1.7)
Stock-based compensation7.3 6.6 21.1 19.6 
Change in fair market value of equity securities3.1 0.3 8.8 (0.3)
Adjusted EBITDA$195.3 $199.3 $586.6 $616.5 


14

Encompass Health Corporation and Subsidiaries
Supplemental Information
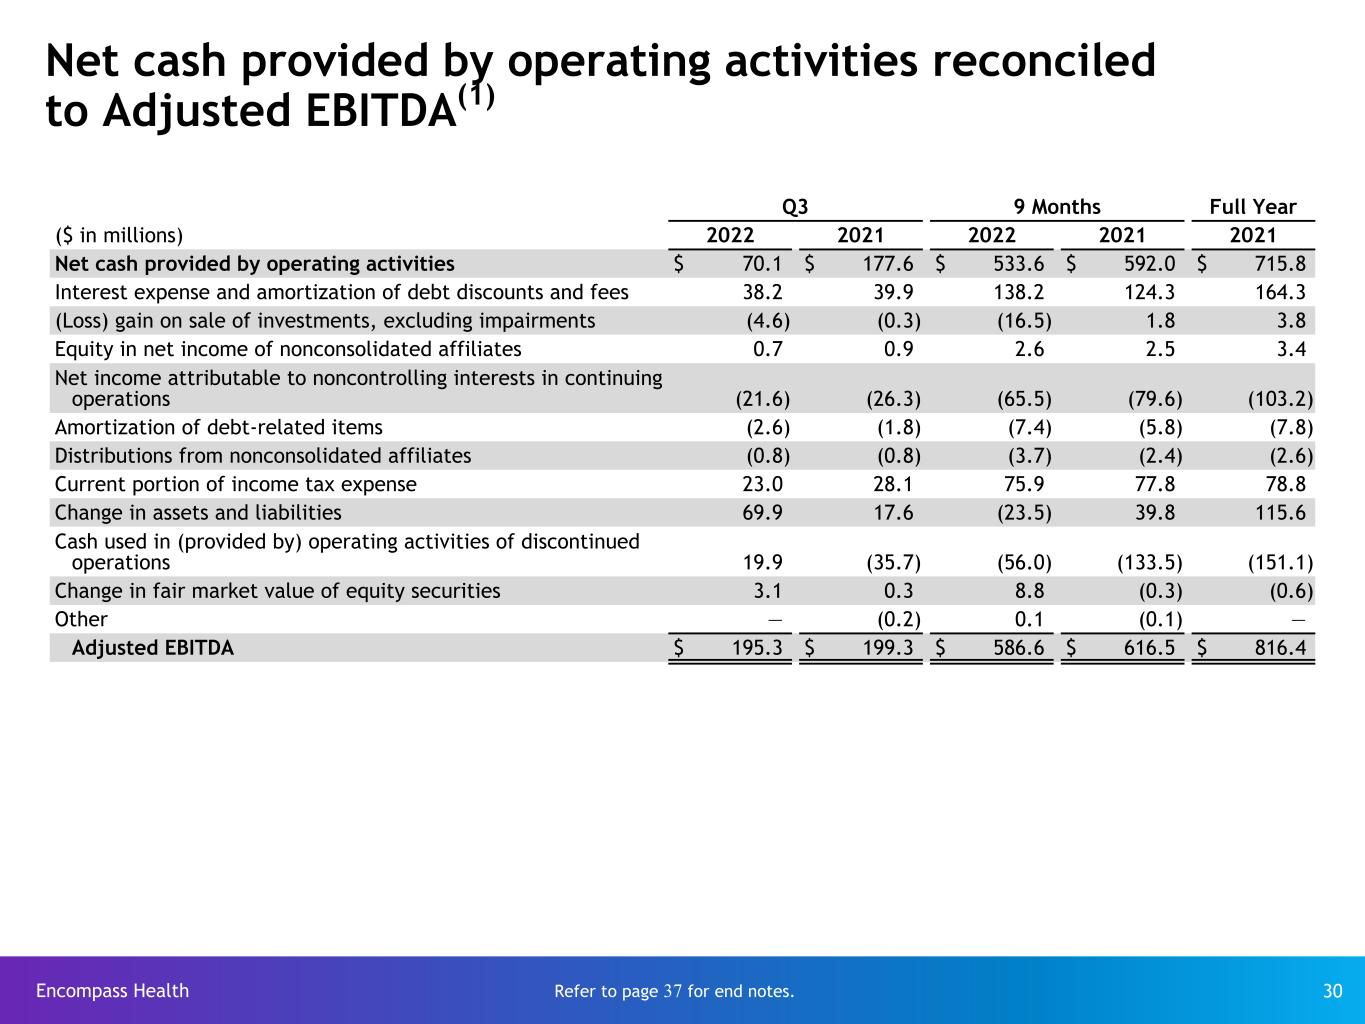
Reconciliation of Net Cash Provided by Operating Activities to Adjusted EBITDA

Three Months Ended September 30,Nine Months Ended September 30,
2022202120222021
(In Millions)
Net cash provided by operating activities
$70.1 $177.6 $533.6 $592.0 
Interest expense and amortization of debt discounts and fees
38.2 39.9 138.2 124.3 
(Loss) gain on sale of investments, excluding impairments(4.6)(0.3)(16.5)1.8 
Equity in net income of nonconsolidated affiliates
0.7 0.9 2.6 2.5 
Net income attributable to noncontrolling interests in continuing operations
(21.6)(26.3)(65.5)(79.6)
Amortization of debt-related items
(2.6)(1.8)(7.4)(5.8)
Distributions from nonconsolidated affiliates
(0.8)(0.8)(3.7)(2.4)
Current portion of income tax expense23.0 28.1 75.9 77.8 
Change in assets and liabilities69.9 17.6 (23.5)39.8 
Cash used in (provided by) operating activities of discontinued operations19.9 (35.7)(56.0)(133.5)
Change in fair market value of equity securities3.1 0.3 8.8 (0.3)
Other— (0.2)0.1 (0.1)
Adjusted EBITDA$195.3 $199.3 $586.6 $616.5 

15

Encompass Health Corporation and Subsidiaries
Supplemental Information
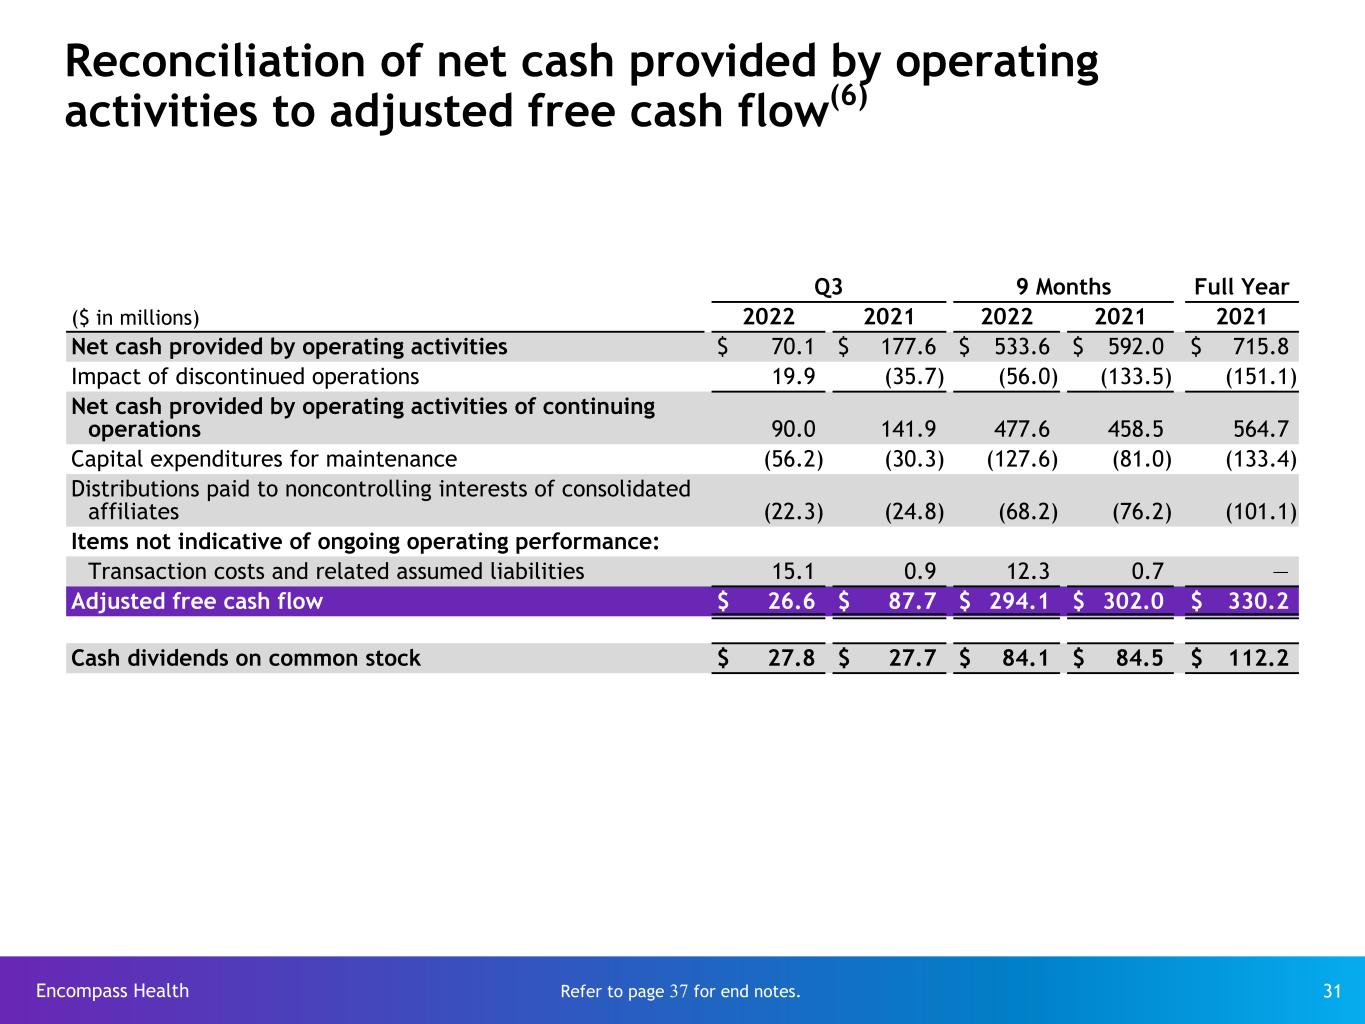
Reconciliation of Net Cash Provided by Operating Activities to Adjusted Free Cash Flow
Three Months Ended September 30,Nine Months Ended September 30,
2022202120222021
(In Millions)
Net cash provided by operating activities$70.1 $177.6 $533.6 $592.0 
Impact of discontinued operations19.9 (35.7)(56.0)(133.5)
Net cash provided by operating activities of continuing operations
90.0 141.9 477.6 458.5 
Capital expenditures for maintenance(56.2)(30.3)(127.6)(81.0)
Distributions paid to noncontrolling interests of consolidated affiliates
(22.3)(24.8)(68.2)(76.2)
Items not indicative of ongoing operating performance:
Transaction costs and related assumed liabilities
15.1 0.9 12.3 0.7 
Adjusted free cash flow$26.6 $87.7 $294.1 $302.0 
For the three months ended September 30, 2022, net cash used in investing activities was $174.3 million and resulted primarily from capital expenditures and purchase of restricted investments. Net cash provided by financing activities during the three months ended September 30, 2022 was $49.0 million and resulted primarily from net debt borrowings and contributions from consolidated affiliates partially offset by cash dividends paid on common stock and distributions to noncontrolling interests of consolidated affiliates.
For the three months ended September 30, 2021, net cash used in investing activities was $124.0 million and primarily resulted from capital expenditures. Net cash used in financing activities during the three months ended September 30, 2021 was $18.5 million and primarily resulted from cash dividends paid on common stock and distributions to noncontrolling interests of consolidated affiliates partially offset by net debt borrowings.
For the nine months ended September 30, 2022, net cash used in investing activities was $420.6 million and primarily resulted from capital expenditures and purchase of restricted investments. Net cash used in financing activities during the nine months ended September 30, 2022 was $129.2 million and primarily resulted from net debt payments, cash dividends paid on common stock and distributions to noncontrolling interests of consolidated affiliates partially offset by net cash provided by financing activities of discontinued operations and contributions from noncontrolling interests of consolidated affiliates.
For the nine months ended September 30, 2021, net cash used in investing activities was $445.6 million and primarily resulted from capital expenditures and the acquisition of assets from Frontier Home Health and Hospice, included in net cash used in investing activities of discontinued operations. Net cash used in financing activities during the nine months ended September 30, 2021 was $282.4 million and primarily resulted from net debt payments, cash dividends paid on common stock and distributions to noncontrolling interests of consolidated affiliates.
16

Encompass Health Corporation and Subsidiaries
Forward-Looking Statements
Statements contained in this press release and the supplemental information which are not historical facts, such as those relating to the business model, strategy, outlook and guidance, dividend strategies, effective income tax rates, labor cost trends, legislative and regulatory developments or their impacts, financial guidance, ability to return value to shareholders, projected capital expenditures, acquisition opportunities, development projects, other balance sheet and cash flow plans, are forward-looking statements within the meaning of the Private Securities Litigation Reform Act of 1995. In addition, Encompass Health, through its senior management, may from time to time make forward-looking public statements concerning the matters described herein. All such estimates, projections, and forward-looking information speak only as of the date hereof, and Encompass Health undertakes no duty to publicly update or revise such forward-looking information, whether as a result of new information, future events, or otherwise. Such forward-looking statements are necessarily estimates based upon current information and involve a number of risks and uncertainties. Actual events or results may differ materially from those anticipated in these forward-looking statements as a result of a variety of factors. While it is impossible to identify all such factors, factors which could cause actual events or results to differ materially from those estimated by Encompass Health include, but are not limited to, an infectious disease outbreak, including the speed, depth, geographic reach and duration of its spread, which could decrease our patient volumes and revenues and lead to staffing and supply shortages and associated cost increases; the legal, regulatory and administrative developments that occur at the federal, state and local levels; Encompass Health's infectious disease prevention and control efforts; the demand for Encompass Health’s services, including based on any downturns in the economy, consumer confidence, or the capital markets; the price of Encompass Health's common stock as it affects Encompass Health's willingness and ability to repurchase shares and the financial and accounting effects of any repurchases; any adverse outcome of various lawsuits, claims, and legal or regulatory proceedings involving Encompass Health, including any matters related to yet undiscovered issues, if any, in acquired operations; Encompass Health's ability to attract and retain key management personnel; any adverse effects on Encompass Health's stock price resulting from the integration of acquired operations; potential disruptions, breaches, or other incidents affecting the proper operation, availability, or security of Encompass Health's or its vendors' information systems, including unauthorized access to or theft of patient, business associate, or other sensitive information or inability to provide patient care because of system unavailability as well as unforeseen issues, if any, related to integration of acquired systems; the ability to successfully integrate acquired operations, including realization of anticipated tax benefits, revenues, and cost savings, minimizing the negative impact on margins arising from the changes in staffing and other operating practices, and avoidance of unforeseen exposure to liabilities; Encompass Health's ability to successfully complete and integrate de novo developments, acquisitions, investments, and joint ventures consistent with its growth strategy; increases in Medicare audit activity, including increased use of sampling and extrapolation, resulting in additional unpaid reimbursement claims and an increase in the backlog of appealed claims denials; changes, delays in (including in connection with resolution of Medicare payment reviews or appeals), or suspension of reimbursement for Encompass Health's services by governmental or private payors; changes in the regulation of the healthcare industry at either or both of the federal and state levels, including as part of national healthcare reform and deficit reduction and Encompass Health's ability to adapt operations to those changes; competitive pressures in the healthcare industry and Encompass Health's response thereto; Encompass Health's ability to obtain and retain favorable arrangements with third-party payors; Encompass Health's ability to control costs, particularly labor and employee benefit costs, including group medical expenses; adverse effects resulting from coverage determinations made by Medicare Administrative Contractors regarding its Medicare reimbursement claims and lengthening delays in Encompass Health's ability to recover improperly denied claims through the administrative appeals process on a timely basis; Encompass Health's ability to adapt to changes in the healthcare delivery system, including value-based purchasing and involvement in coordinated care initiatives or programs that may arise with its referral sources; Encompass Health's ability to attract and retain nurses, therapists, and other healthcare professionals in a highly competitive environment with often severe staffing shortages, which may be worsened by infectious disease outbreaks, and the impact on Encompass Health's labor expenses from potential union activity, staffing shortages, and competitive compensation practices; general conditions in the economy and capital markets, including any instability or uncertainty related to armed conflict or an act of terrorism, governmental impasse over approval of the United States federal
17

Encompass Health Corporation and Subsidiaries
Forward-Looking Statements
budget, an increase in the debt ceiling, or an international sovereign debt crisis; the increase in the cost of, or the decrease in the availability of, necessary supplies, such as personal protective equipment; the increase in the costs of defending and insuring against alleged professional liability claims, and Encompass Health's ability to predict the estimated costs related to such claims; and other factors which may be identified from time to time in Encompass Health's SEC filings and other public announcements, including Encompass Health's Form 10‑K for the year ended December 31, 2021 and Form 10-Q for the quarters ended March 31, 2022, June 30, 2022, and September 30, 2022, when filed.
18
Earnings Call April 28, 2022 Supplemental information 2022 First Quarter Third Quarter a l October 27, 2022 Supplemental information


Encompass Health 2 The information contained in this presentation includes certain estimates, projections and other forward-looking information that reflect Encompass Health’s current outlook, views and plans with respect to future events, including the business outlook and guidance, labor cost trends, legislative and regulatory developments, strategy, capital expenditures, acquisition and other development activities, dividend strategies, repurchases of securities, effective tax rates, financial performance, financial assumptions, business model, balance sheet and cash flow plans, market share, and shareholder value-enhancing transactions. These estimates, projections and other forward-looking information are based on assumptions the Company believes, as of the date hereof, are reasonable. Inevitably, there will be differences between such estimates and actual events or results, and those differences may be material. There can be no assurance any estimates, projections or forward-looking information will be realized. All such estimates, projections and forward-looking information speak only as of the date hereof. Encompass Health undertakes no duty to publicly update or revise the information contained herein. You are cautioned not to place undue reliance on the estimates, projections and other forward-looking information in this presentation as they are based on current expectations and general assumptions and are subject to various risks, uncertainties and other factors, including those set forth in the earnings release attached as Exhibit 99.1 to the Company’s Form 8-K dated October 26, 2022 (the “Q3 Earnings Release Form 8-K”), the Form 10-K for the year ended December 31, 2021, the Form 10-Q for the quarter ended March 31, 2022, the Form 10-Q for the quarter ended June 30, 2022, the Form 10- Q for the quarter ended September 30, 2022, when filed, and in other documents Encompass Health previously filed with the SEC, many of which are beyond Encompass Health’s control, that may cause actual events or results to differ materially from the views, beliefs and estimates expressed herein. Note regarding presentation of non-GAAP financial measures The following presentation includes certain “non-GAAP financial measures” as defined in Regulation G under the Securities Exchange Act of 1934, including Adjusted EBITDA, leverage ratios, adjusted earnings per share, and adjusted free cash flow. Schedules are attached that reconcile the non-GAAP financial measures included in the following presentation to the most directly comparable financial measures calculated and presented in accordance with Generally Accepted Accounting Principles in the United States. The Q3 Earnings Release Form 8-K, to which the following presentation is attached as Exhibit 99.2, provides further explanation and disclosure regarding Encompass Health’s use of non-GAAP financial measures and should be read in conjunction with this supplemental information. Forward-looking statements


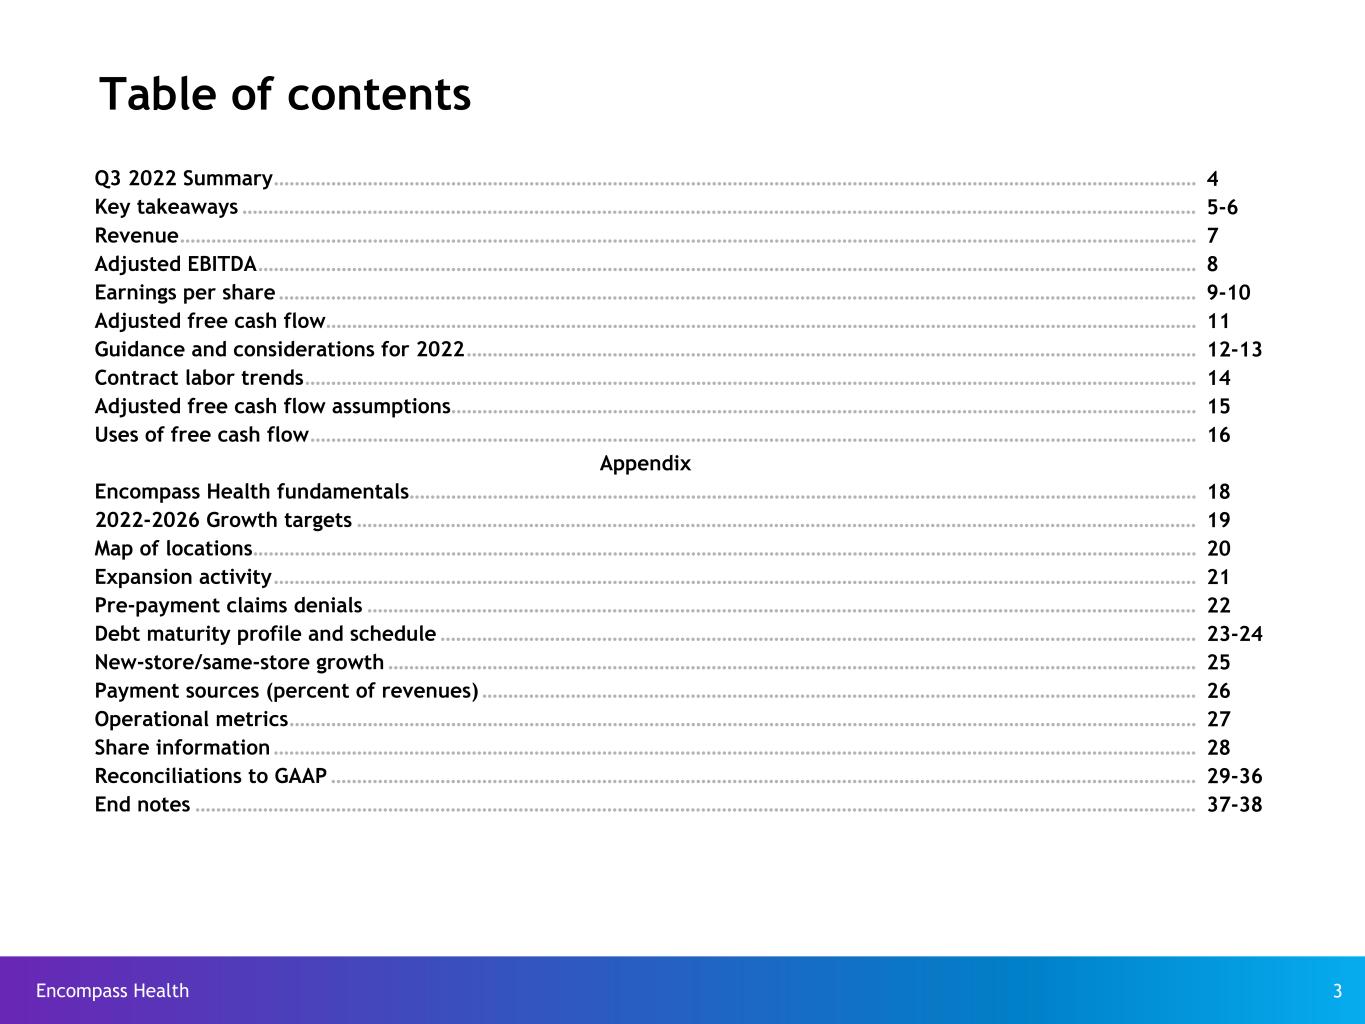
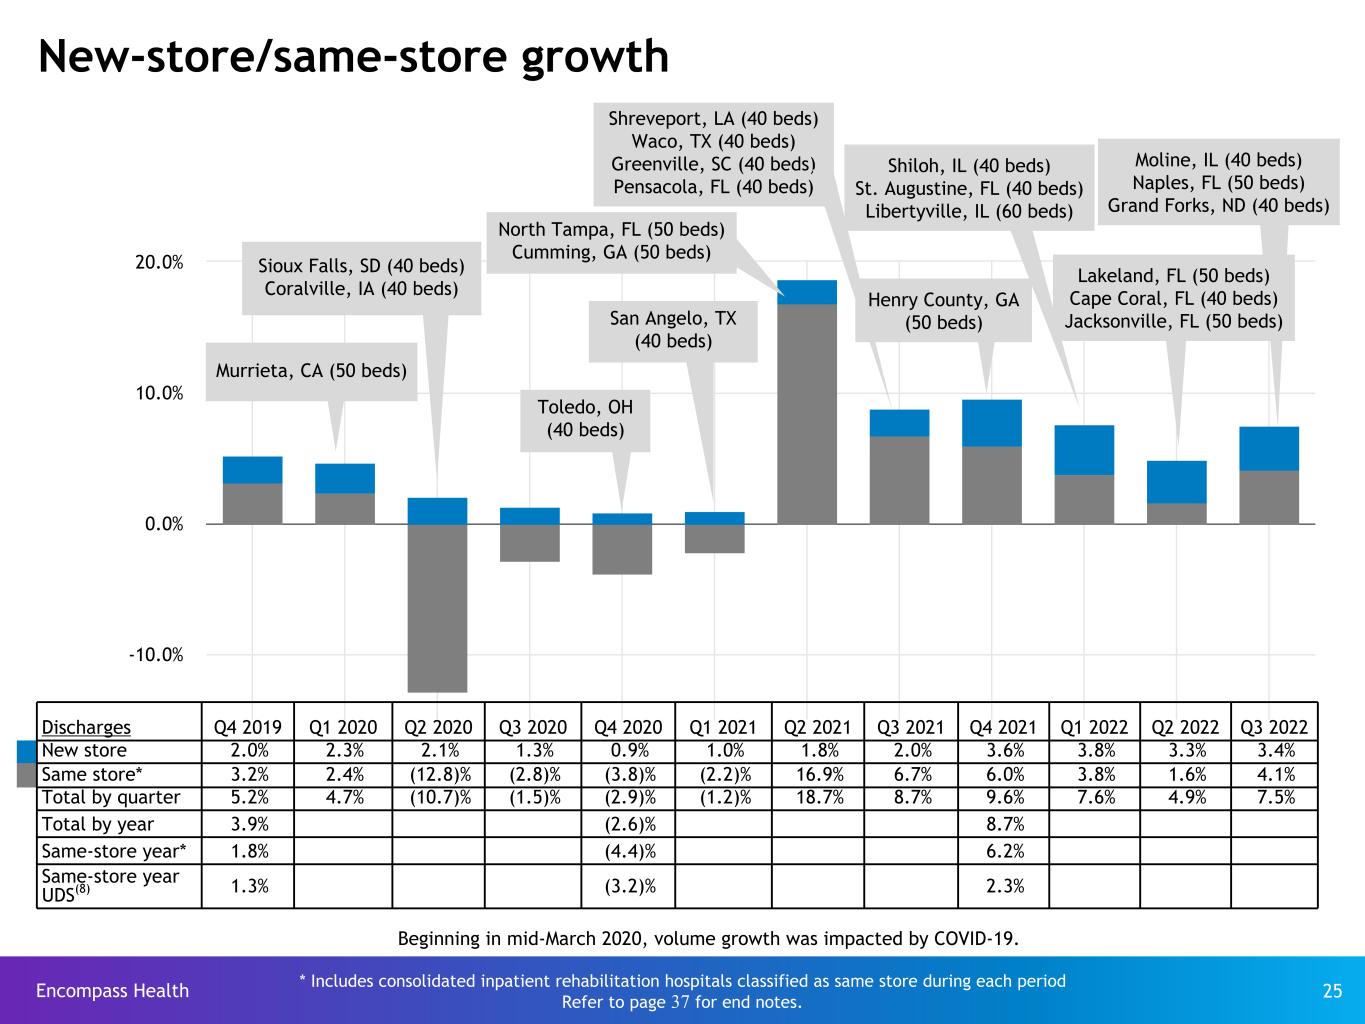
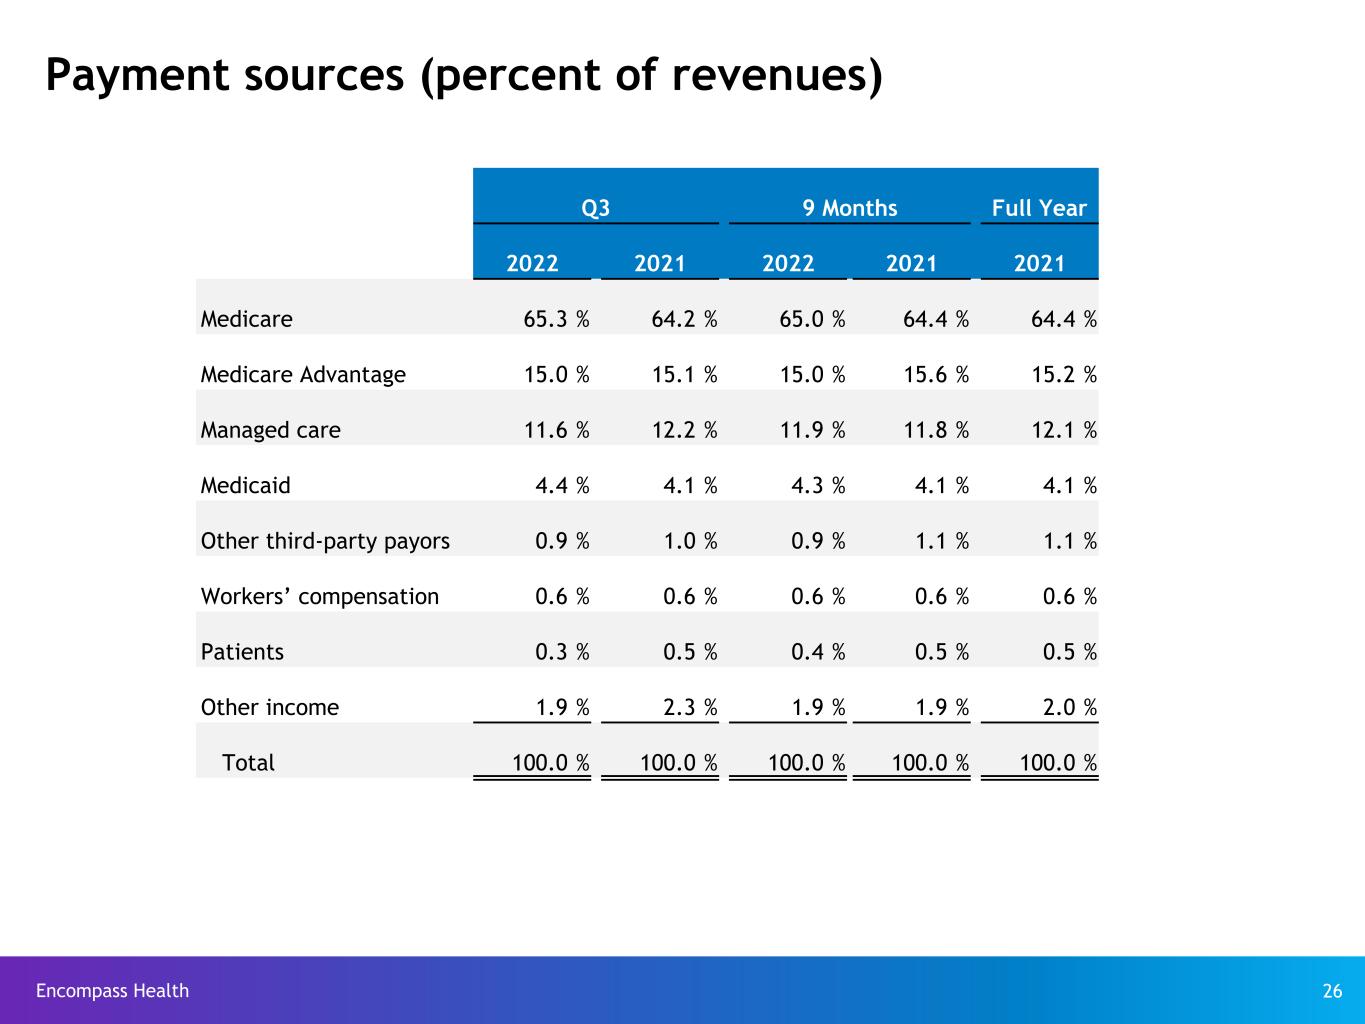
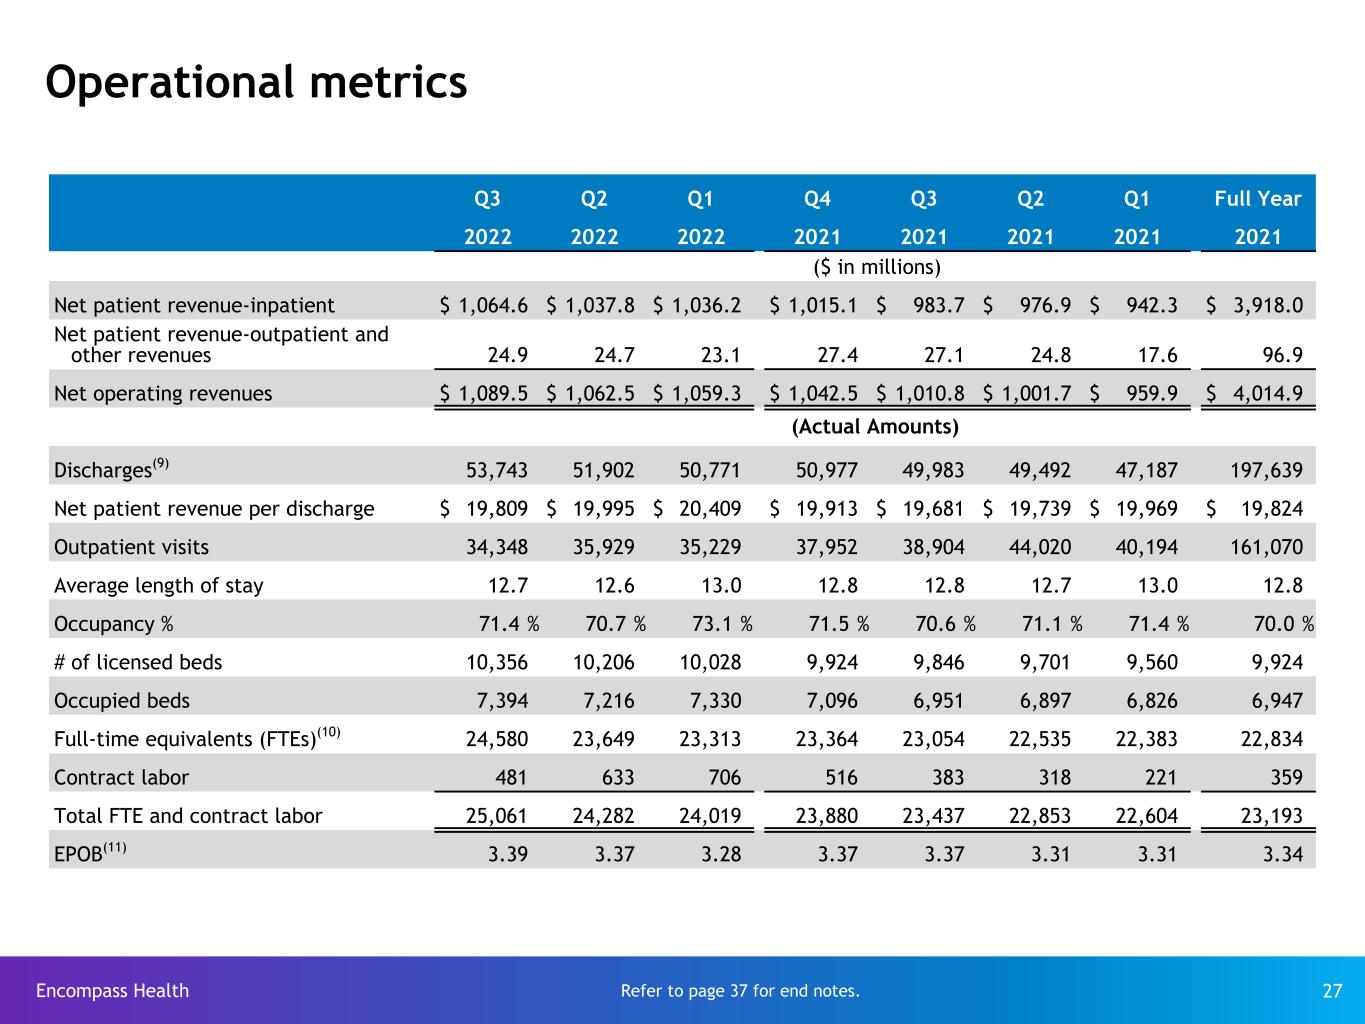
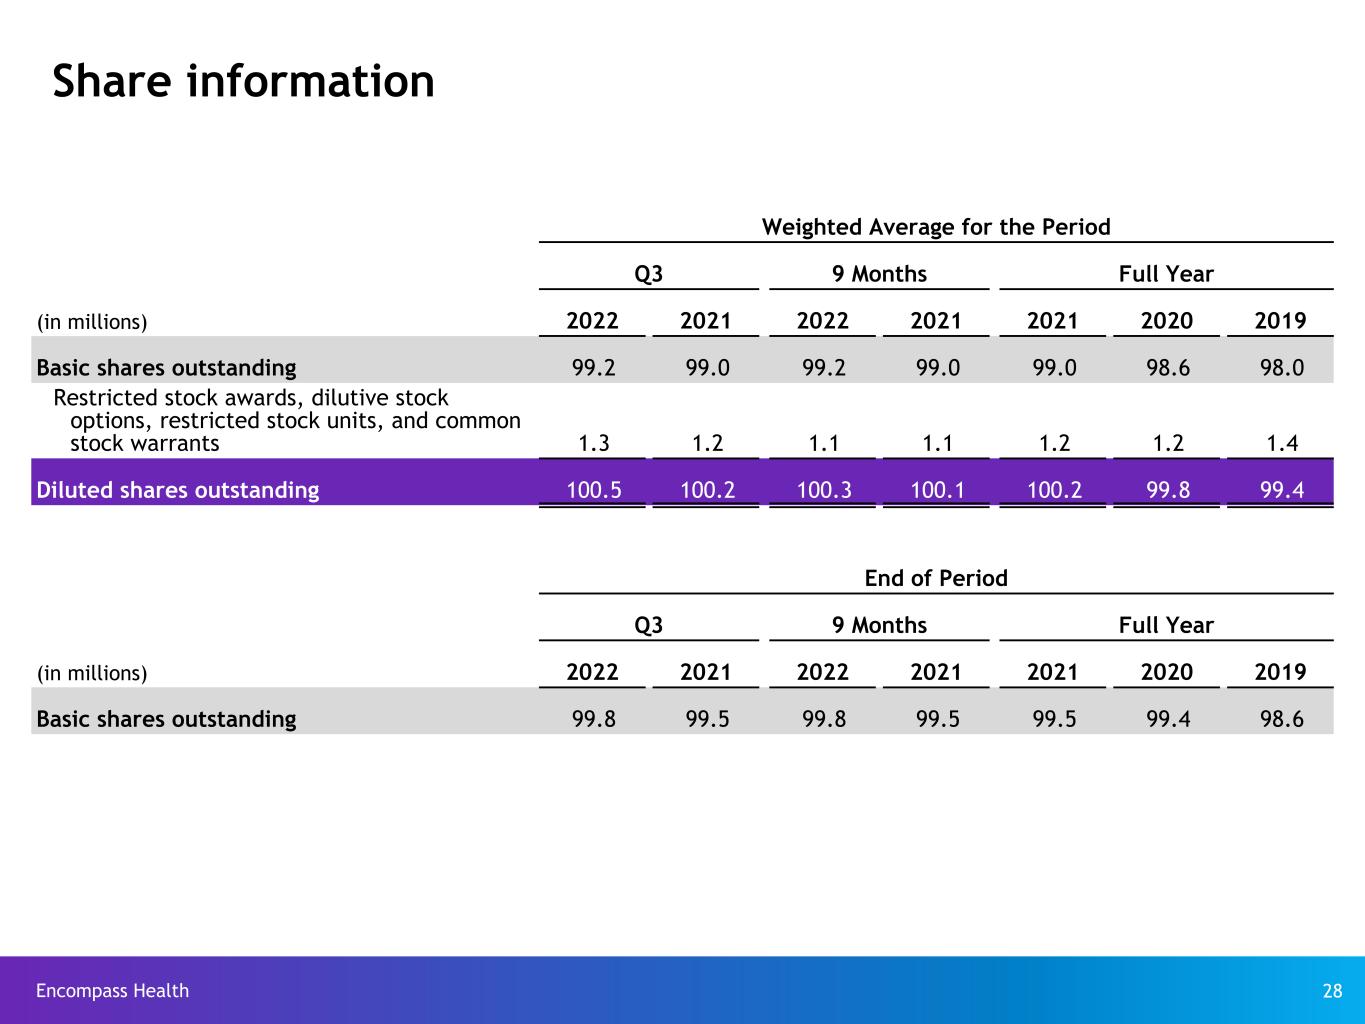
Encompass Health 3 Q3 2022 Summary ................................................................................................................................................................................. 4 Key takeaways ....................................................................................................................................................................................... 5-6 Revenue ................................................................................................................................................................................................... 7 Adjusted EBITDA .................................................................................................................................................................................... 8 Earnings per share ................................................................................................................................................................................ 9-10 Adjusted free cash flow ....................................................................................................................................................................... 11 Guidance and considerations for 2022 ............................................................................................................................................ 12-13 Contract labor trends ........................................................................................................................................................................... 14 Adjusted free cash flow assumptions ............................................................................................................................................... 15 Uses of free cash flow .......................................................................................................................................................................... 16 Appendix Encompass Health fundamentals ....................................................................................................................................................... 18 2022-2026 Growth targets ................................................................................................................................................................. 19 Map of locations ..................................................................................................................................................................................... 20 Expansion activity ................................................................................................................................................................................. 21 Pre-payment claims denials ............................................................................................................................................................... 22 Debt maturity profile and schedule ................................................................................................................................................. 23-24 New-store/same-store growth ........................................................................................................................................................... 25 Payment sources (percent of revenues) ......................................................................................................................................... 26 Operational metrics .............................................................................................................................................................................. 27 Share information ................................................................................................................................................................................. 28 Reconciliations to GAAP ...................................................................................................................................................................... 29-36 End notes ................................................................................................................................................................................................ 37-38 Table of contents


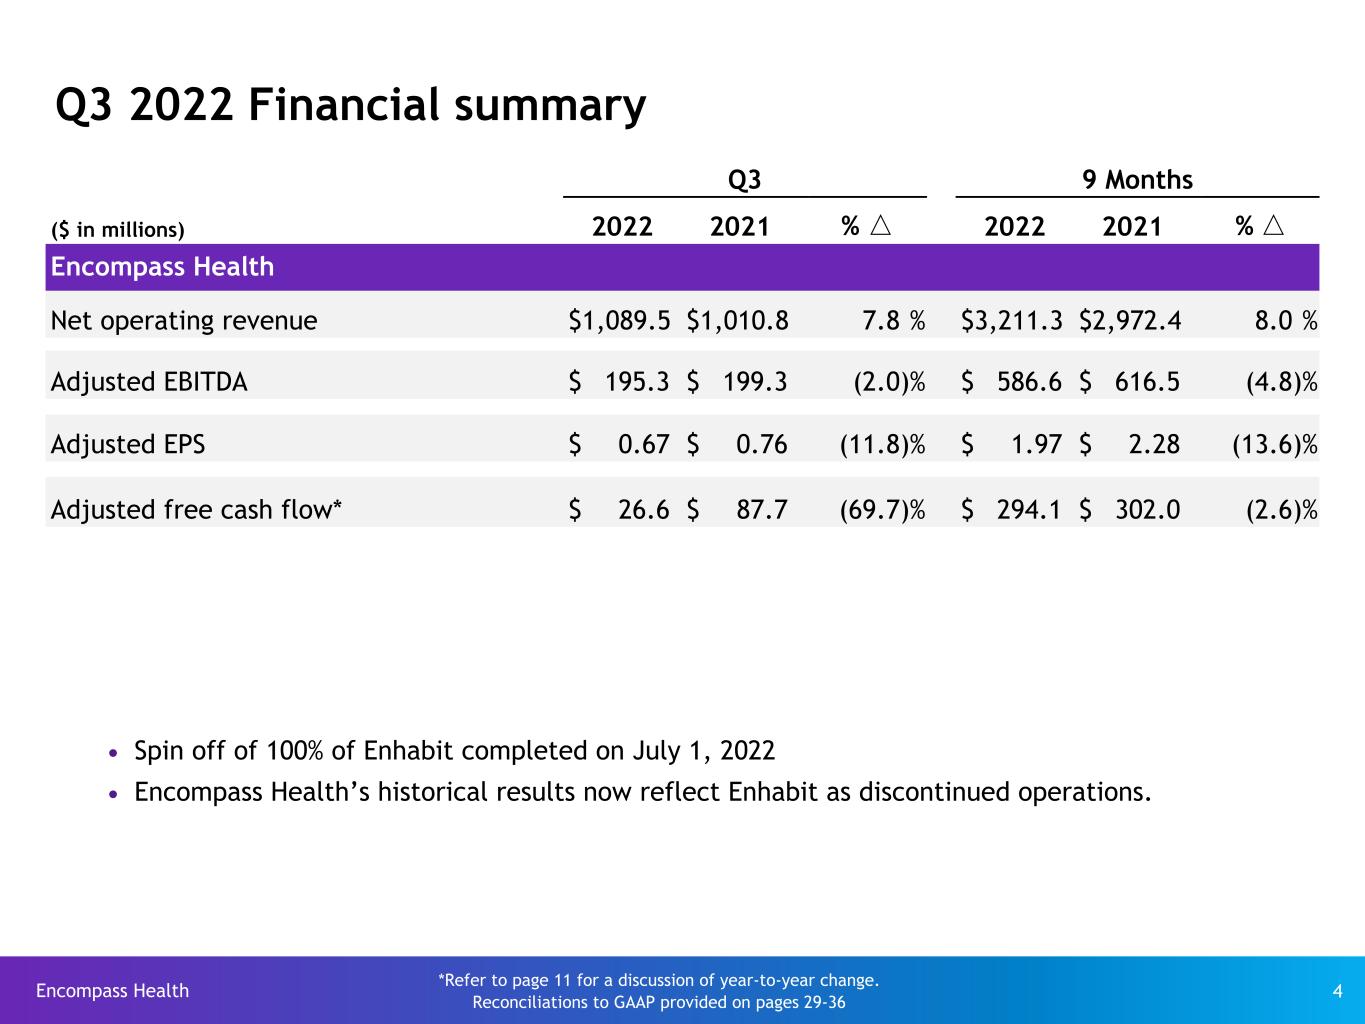
Encompass Health 4 Q3 2022 Financial summary Q3 9 Months ($ in millions) 2022 2021 % △ 2022 2021 % △ Encompass Health Net operating revenue $ 1,089.5 $ 1,010.8 7.8 % $ 3,211.3 $ 2,972.4 8.0 % Adjusted EBITDA $ 195.3 $ 199.3 (2.0) % $ 586.6 $ 616.5 (4.8) % Adjusted EPS $ 0.67 $ 0.76 (11.8) % $ 1.97 $ 2.28 (13.6) % Adjusted free cash flow* $ 26.6 $ 87.7 (69.7) % $ 294.1 $ 302.0 (2.6) % *Refer to page 11 for a discussion of year-to-year change. Reconciliations to GAAP provided on pages 29-36 Ÿ Spin off of 100% of Enhabit completed on July 1, 2022 Ÿ Encompass Health’s historical results now reflect Enhabit as discontinued operations.


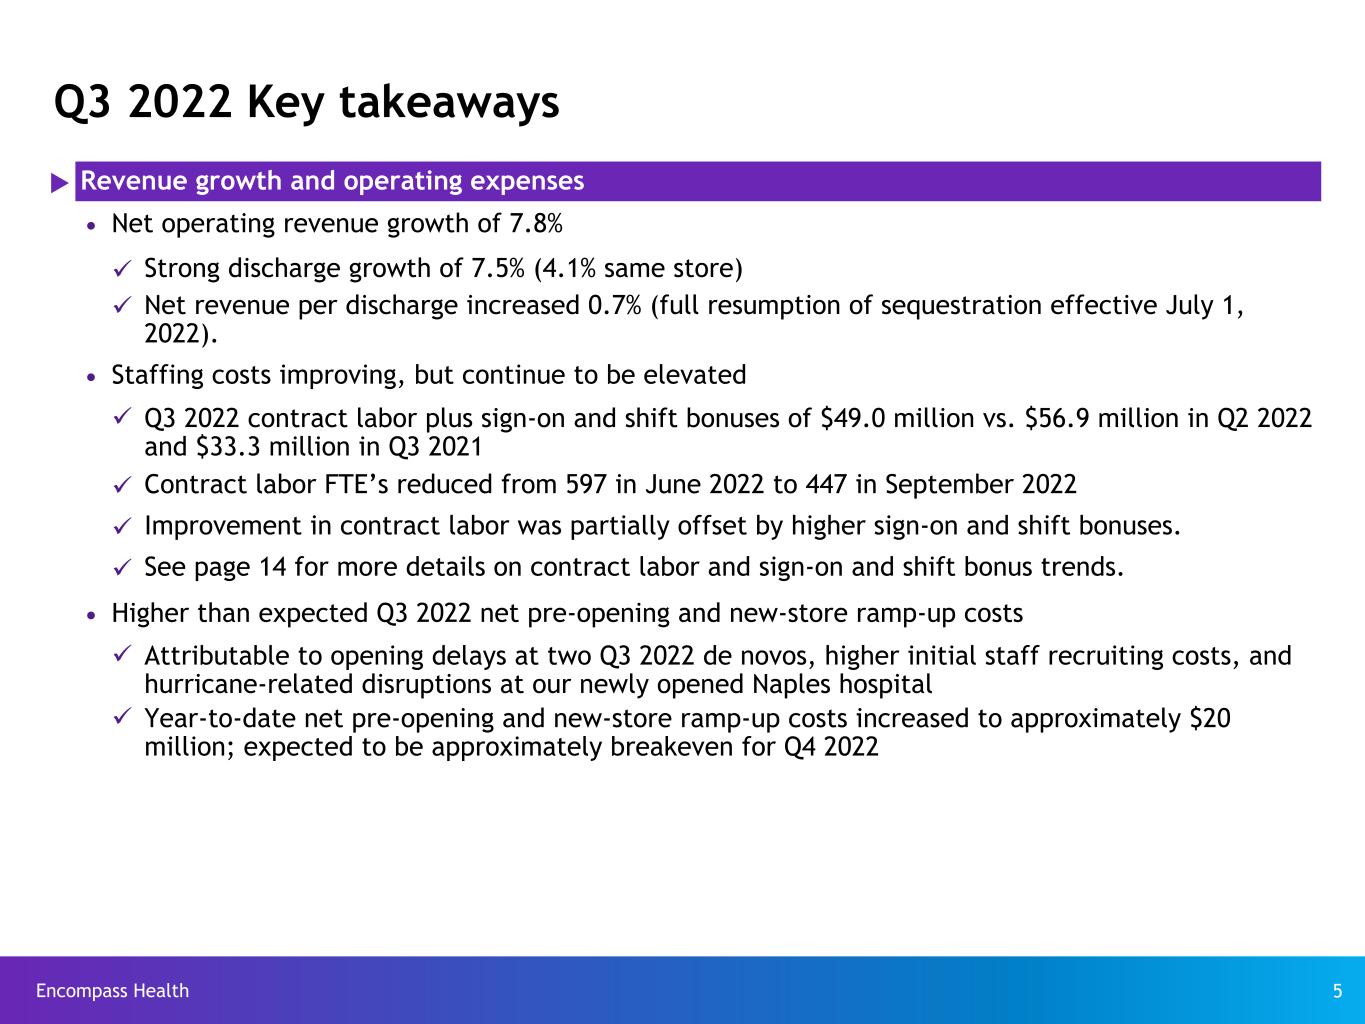
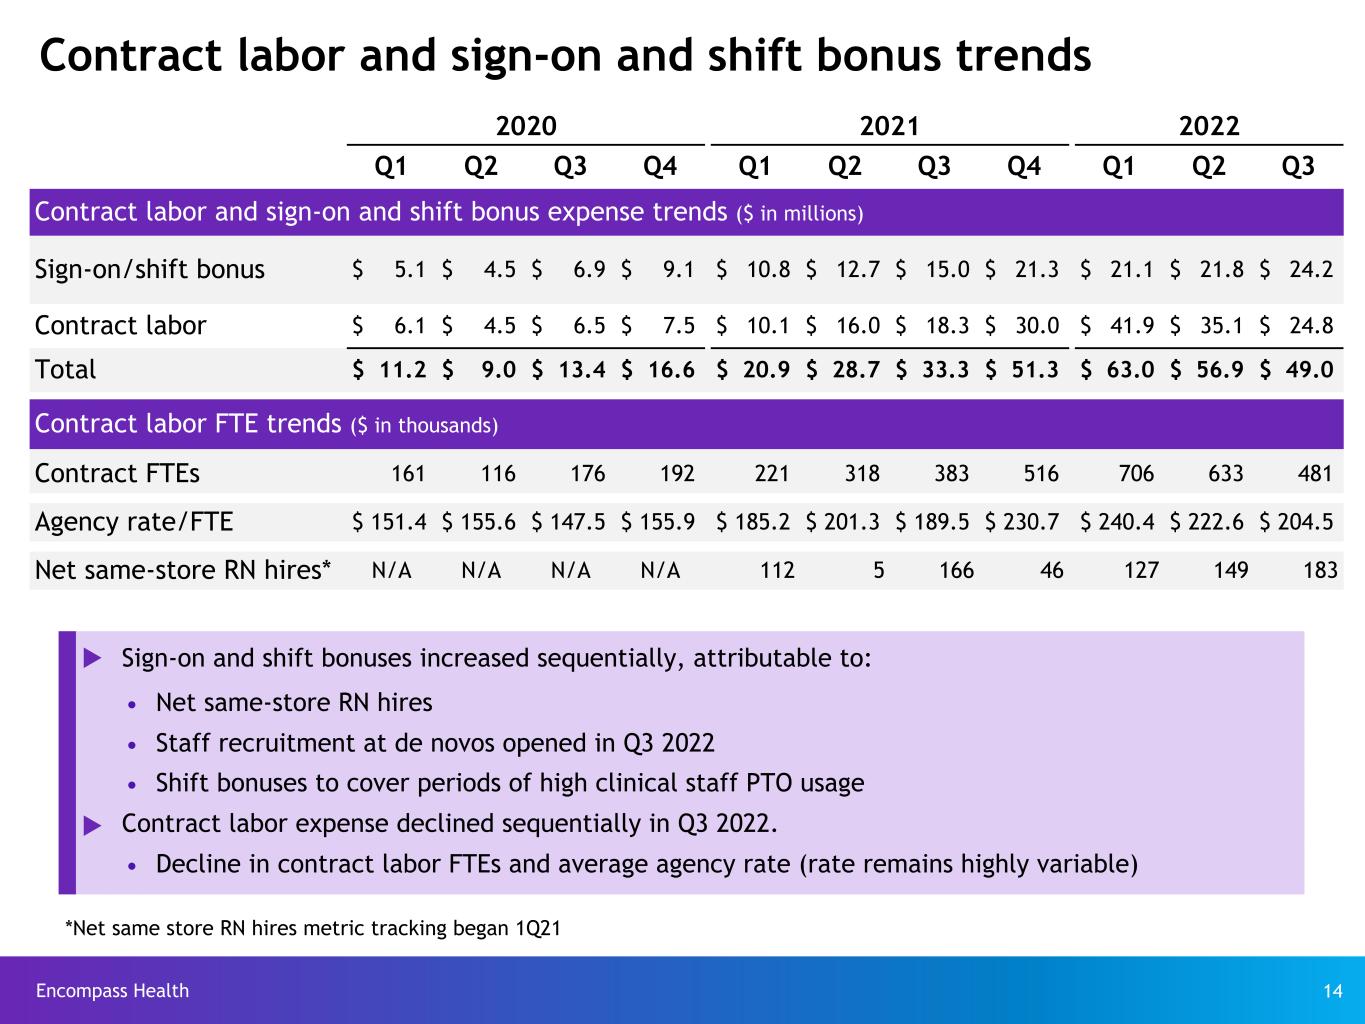
Encompass Health 5 Q3 2022 Key takeaways u Revenue growth and operating expenses Ÿ Net operating revenue growth of 7.8% ü Strong discharge growth of 7.5% (4.1% same store) ü Net revenue per discharge increased 0.7% (full resumption of sequestration effective July 1, 2022). Ÿ Staffing costs improving, but continue to be elevated ü Q3 2022 contract labor plus sign-on and shift bonuses of $49.0 million vs. $56.9 million in Q2 2022 and $33.3 million in Q3 2021 ü Contract labor FTE’s reduced from 597 in June 2022 to 447 in September 2022 ü Improvement in contract labor was partially offset by higher sign-on and shift bonuses. ü See page 14 for more details on contract labor and sign-on and shift bonus trends. Ÿ Higher than expected Q3 2022 net pre-opening and new-store ramp-up costs ü Attributable to opening delays at two Q3 2022 de novos, higher initial staff recruiting costs, and hurricane-related disruptions at our newly opened Naples hospital ü Year-to-date net pre-opening and new-store ramp-up costs increased to approximately $20 million; expected to be approximately breakeven for Q4 2022


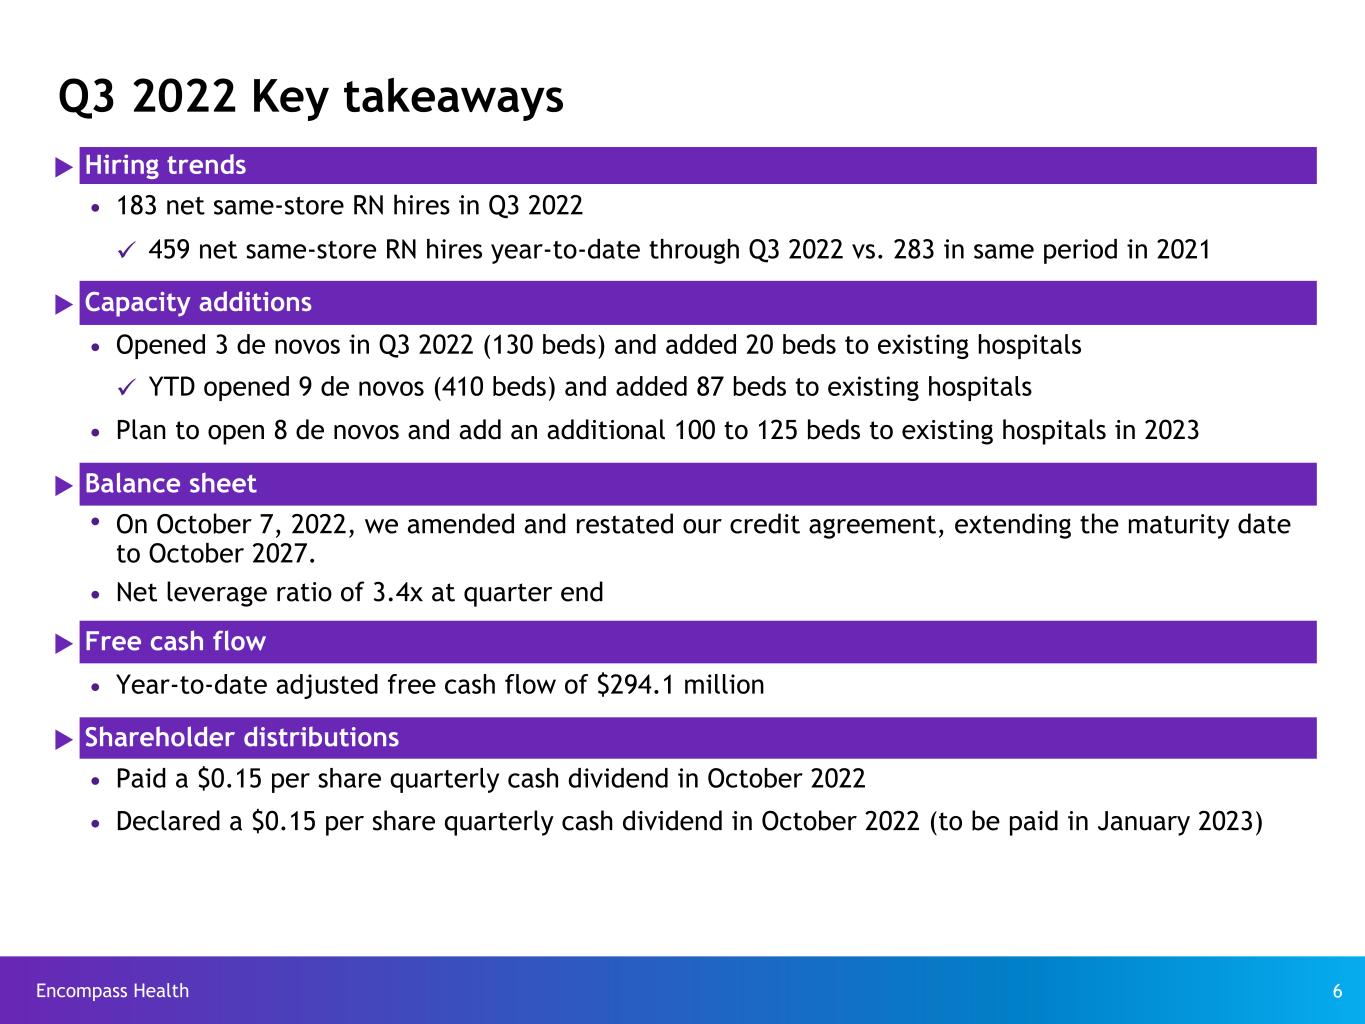
Encompass Health 6 Q3 2022 Key takeaways u Hiring trends Ÿ 183 net same-store RN hires in Q3 2022 ü 459 net same-store RN hires year-to-date through Q3 2022 vs. 283 in same period in 2021 u Capacity additions Ÿ Opened 3 de novos in Q3 2022 (130 beds) and added 20 beds to existing hospitals ü YTD opened 9 de novos (410 beds) and added 87 beds to existing hospitals Ÿ Plan to open 8 de novos and add an additional 100 to 125 beds to existing hospitals in 2023 u Balance sheet Ÿ On October 7, 2022, we amended and restated our credit agreement, extending the maturity date to October 2027. Ÿ Net leverage ratio of 3.4x at quarter end u Free cash flow Ÿ Year-to-date adjusted free cash flow of $294.1 million u Shareholder distributions Ÿ Paid a $0.15 per share quarterly cash dividend in October 2022 Ÿ Declared a $0.15 per share quarterly cash dividend in October 2022 (to be paid in January 2023)


Encompass Health 7 Revenue Q3 Q3 Favorable/ ($ in millions) 2022 2021 (Unfavorable) Net operating revenue: Inpatient $ 1,064.6 $ 983.7 8.2% Outpatient and other 24.9 27.1 (8.1%) Total revenue $ 1,089.5 $ 1,010.8 7.8% (Actual Amounts) Discharges 53,743 49,983 7.5% Same-store discharge growth 4.1% Net patient revenue per discharge $ 19,809 $ 19,681 0.7% Revenue reserves related to bad debt as a percent of revenue 2.0 % 2.0 % 0 bps u Inpatient revenue growth of 8.2% primarily due to volume growth u Net revenue per discharge growth of 0.7% primarily attributable to an increase in reimbursement rates, offset by the resumption of sequestration u Outpatient and other revenue included a decrease of $1.9 million in provider tax revenues ($16.3 million in Q3 2022 vs. $18.2 million in Q3 2021); the decrease in provider tax revenues negatively impacted Q3 2022 Adjusted EBITDA


Encompass Health 8 Adjusted EBITDA(1) Q3 % of Revenue Q3 % of Revenue($ in millions) 2022 2021 Net operating revenue $ 1,089.5 $ 1,010.8 Operating expenses: Salaries and benefits (605.6) 55.6 % (537.0) 53.1 % Other operating expenses(a) (173.1) 15.9 % (156.4) 15.5 % Supplies (51.1) 4.7 % (46.7) 4.6 % Occupancy costs (12.4) 1.1 % (14.5) 1.4 % Hospital operating expenses (236.6) 21.7 % (217.6) 21.5 % General and administrative expenses(b) (32.0) 2.9 % (32.2) 3.2 % Other income(c) 0.9 0.7 Equity in nonconsolidated affiliates 0.7 0.9 Noncontrolling interests in continuing operations (21.6) (26.3) Adjusted EBITDA $ 195.3 $ 199.3 Percent change (2.0) % In arriving at Adjusted EBITDA, the following were excluded: (a) Gain on disposal or impairment of assets $ (1.1) $ (5.0) (b) Stock-based compensation and the change in fair market value of the non-qualified 401k plan $ 5.9 $ 6.7 (c) Change in fair market value of equity securities and the non- qualified 401k plan $ 4.5 $ 0.2 u Salary and benefits in Q3 2022 included $49.0 million in agency staffing and sign-on and shift bonuses vs. $33.3 million in Q3 2021. u Increase in other operating expenses as a percent of revenue driven primarily by higher travel, recruiting and utility expenses u Q3 2022 Adjusted EBITDA included approximately $5 million in net pre-opening and new-store ramp- up costs. Reconciliations to GAAP provided on pages 29-36. Refer to page 37 for end notes.


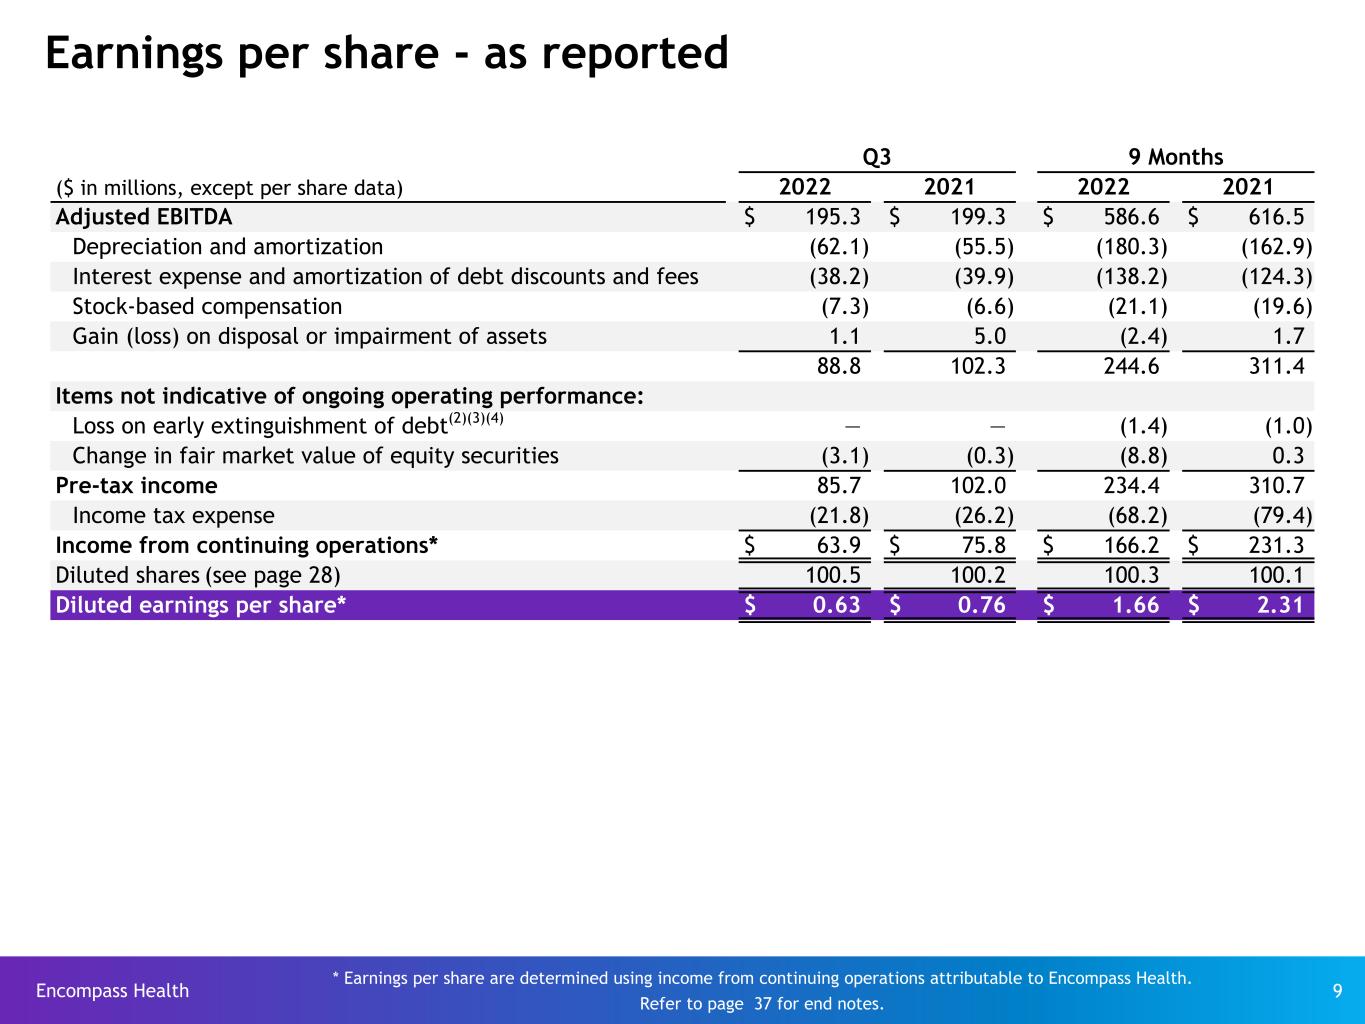
Encompass Health 9 Earnings per share - as reported Q3 9 Months ($ in millions, except per share data) 2022 2021 2022 2021 Adjusted EBITDA $ 195.3 $ 199.3 $ 586.6 $ 616.5 Depreciation and amortization (62.1) (55.5) (180.3) (162.9) Interest expense and amortization of debt discounts and fees (38.2) (39.9) (138.2) (124.3) Stock-based compensation (7.3) (6.6) (21.1) (19.6) Gain (loss) on disposal or impairment of assets 1.1 5.0 (2.4) 1.7 88.8 102.3 244.6 311.4 Items not indicative of ongoing operating performance: Loss on early extinguishment of debt(2)(3)(4) — — (1.4) (1.0) Change in fair market value of equity securities (3.1) (0.3) (8.8) 0.3 Pre-tax income 85.7 102.0 234.4 310.7 Income tax expense (21.8) (26.2) (68.2) (79.4) Income from continuing operations* $ 63.9 $ 75.8 $ 166.2 $ 231.3 Diluted shares (see page 28) 100.5 100.2 100.3 100.1 Diluted earnings per share* $ 0.63 $ 0.76 $ 1.66 $ 2.31 * Earnings per share are determined using income from continuing operations attributable to Encompass Health. Refer to page 37 for end notes.


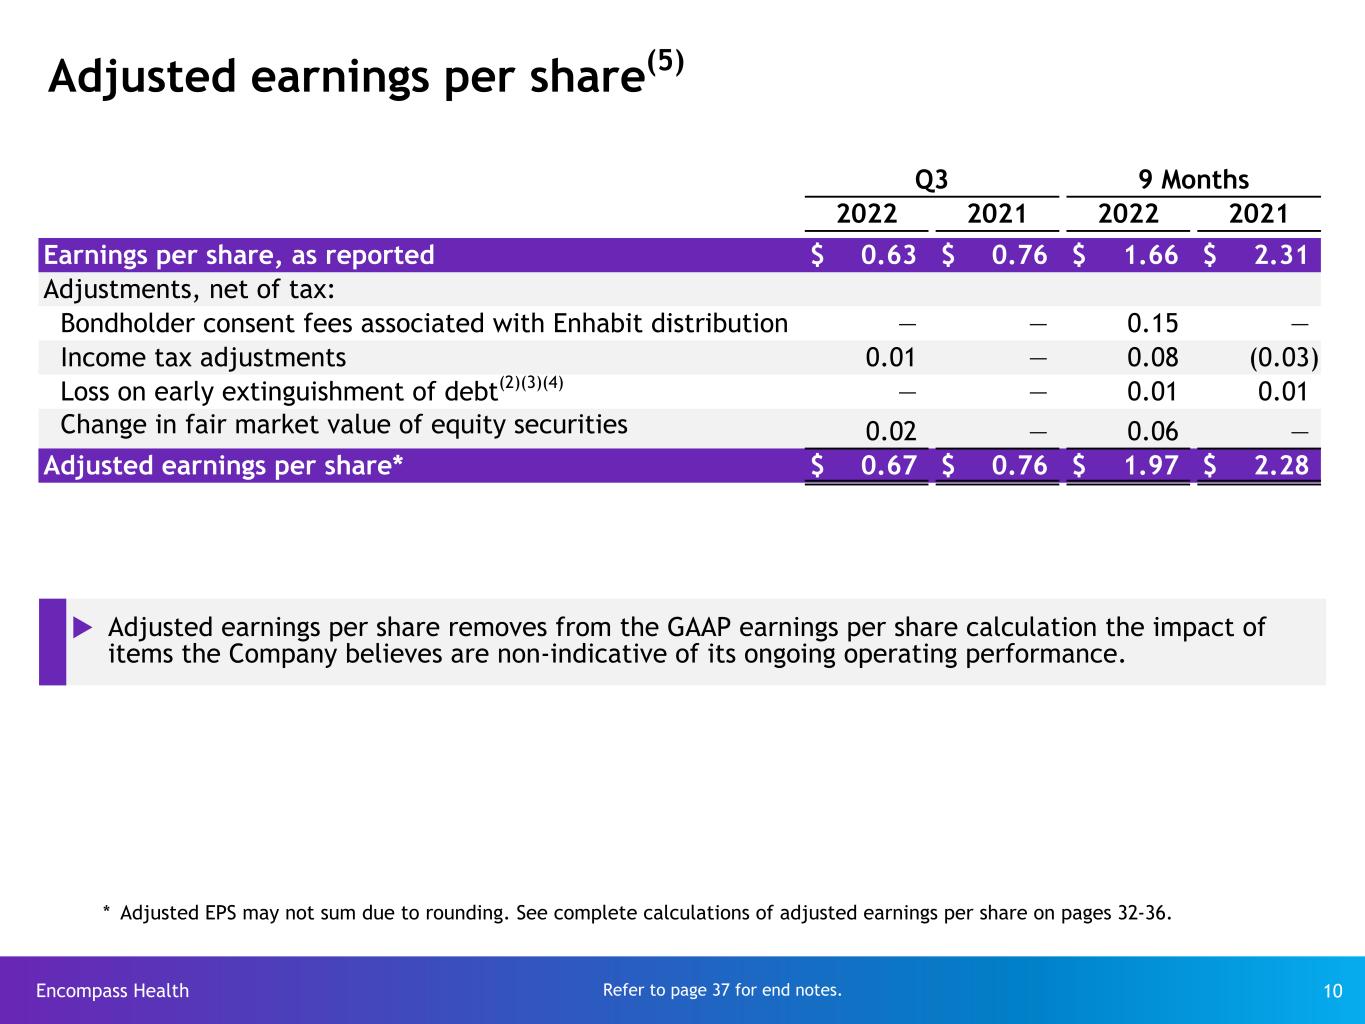
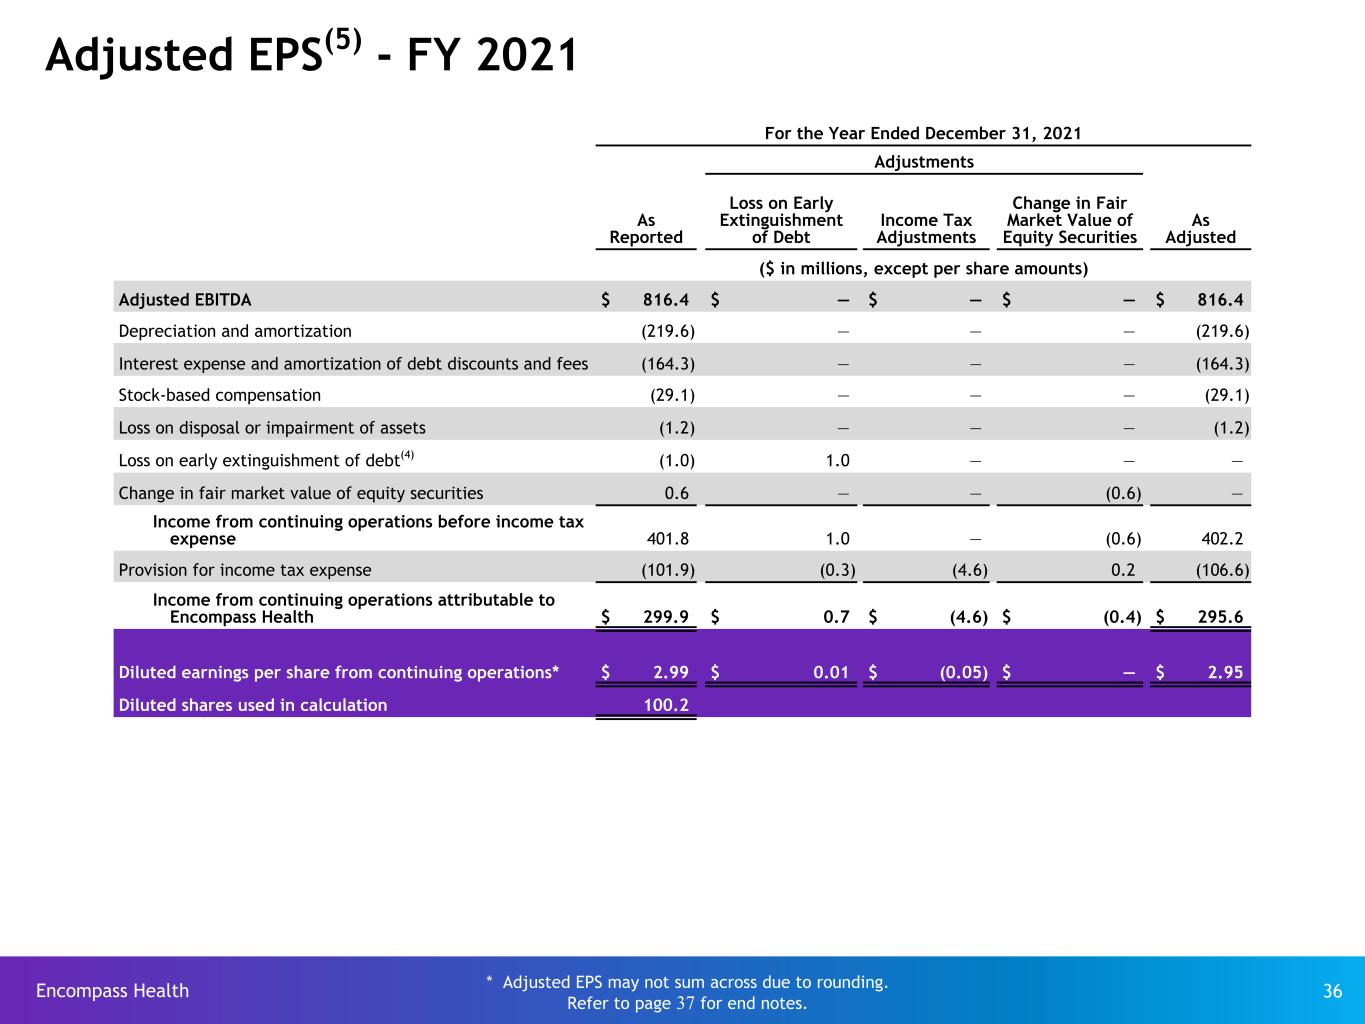
Encompass Health 10 Adjusted earnings per share(5) Refer to page 37 for end notes. Q3 9 Months 2022 2021 2022 2021 Earnings per share, as reported $ 0.63 $ 0.76 $ 1.66 $ 2.31 Adjustments, net of tax: Bondholder consent fees associated with Enhabit distribution — — 0.15 — Income tax adjustments 0.01 — 0.08 (0.03) Loss on early extinguishment of debt(2)(3)(4) — — 0.01 0.01 Change in fair market value of equity securities 0.02 — 0.06 — Adjusted earnings per share* $ 0.67 $ 0.76 $ 1.97 $ 2.28 u Adjusted earnings per share removes from the GAAP earnings per share calculation the impact of items the Company believes are non-indicative of its ongoing operating performance. * Adjusted EPS may not sum due to rounding. See complete calculations of adjusted earnings per share on pages 32-36.


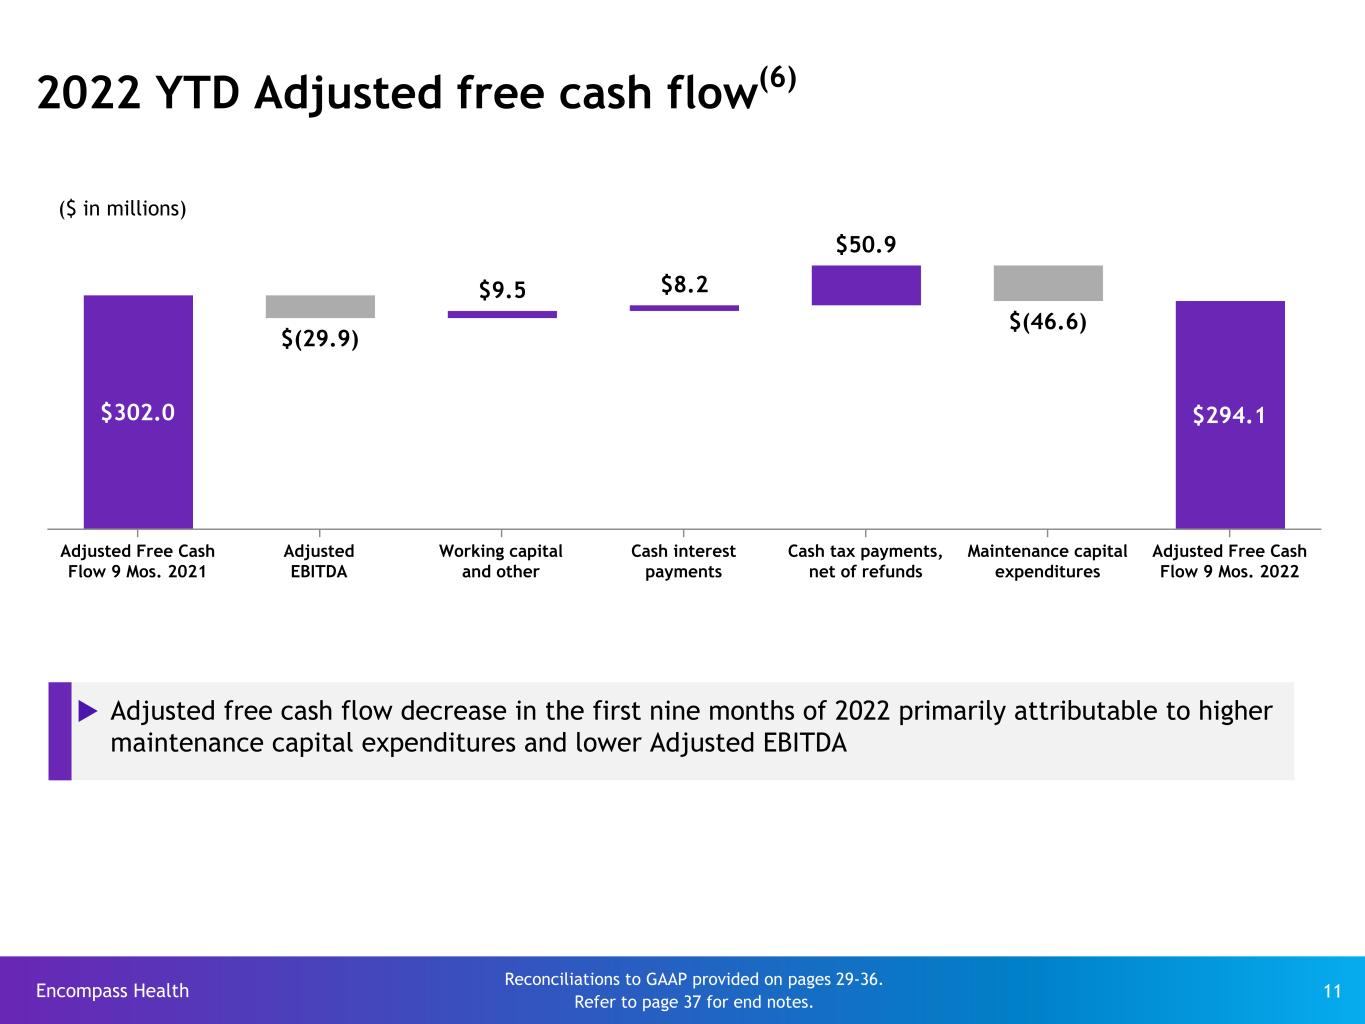
Encompass Health 11 $302.0 $(29.9) $9.5 $8.2 $50.9 $(46.6) $294.1 Adjusted Free Cash Flow 9 Mos. 2021 Adjusted EBITDA Working capital and other Cash interest payments Cash tax payments, net of refunds Maintenance capital expenditures Adjusted Free Cash Flow 9 Mos. 2022 2022 YTD Adjusted free cash flow(6) Reconciliations to GAAP provided on pages 29-36. Refer to page 37 for end notes. u Adjusted free cash flow decrease in the first nine months of 2022 primarily attributable to higher maintenance capital expenditures and lower Adjusted EBITDA ($ in millions)


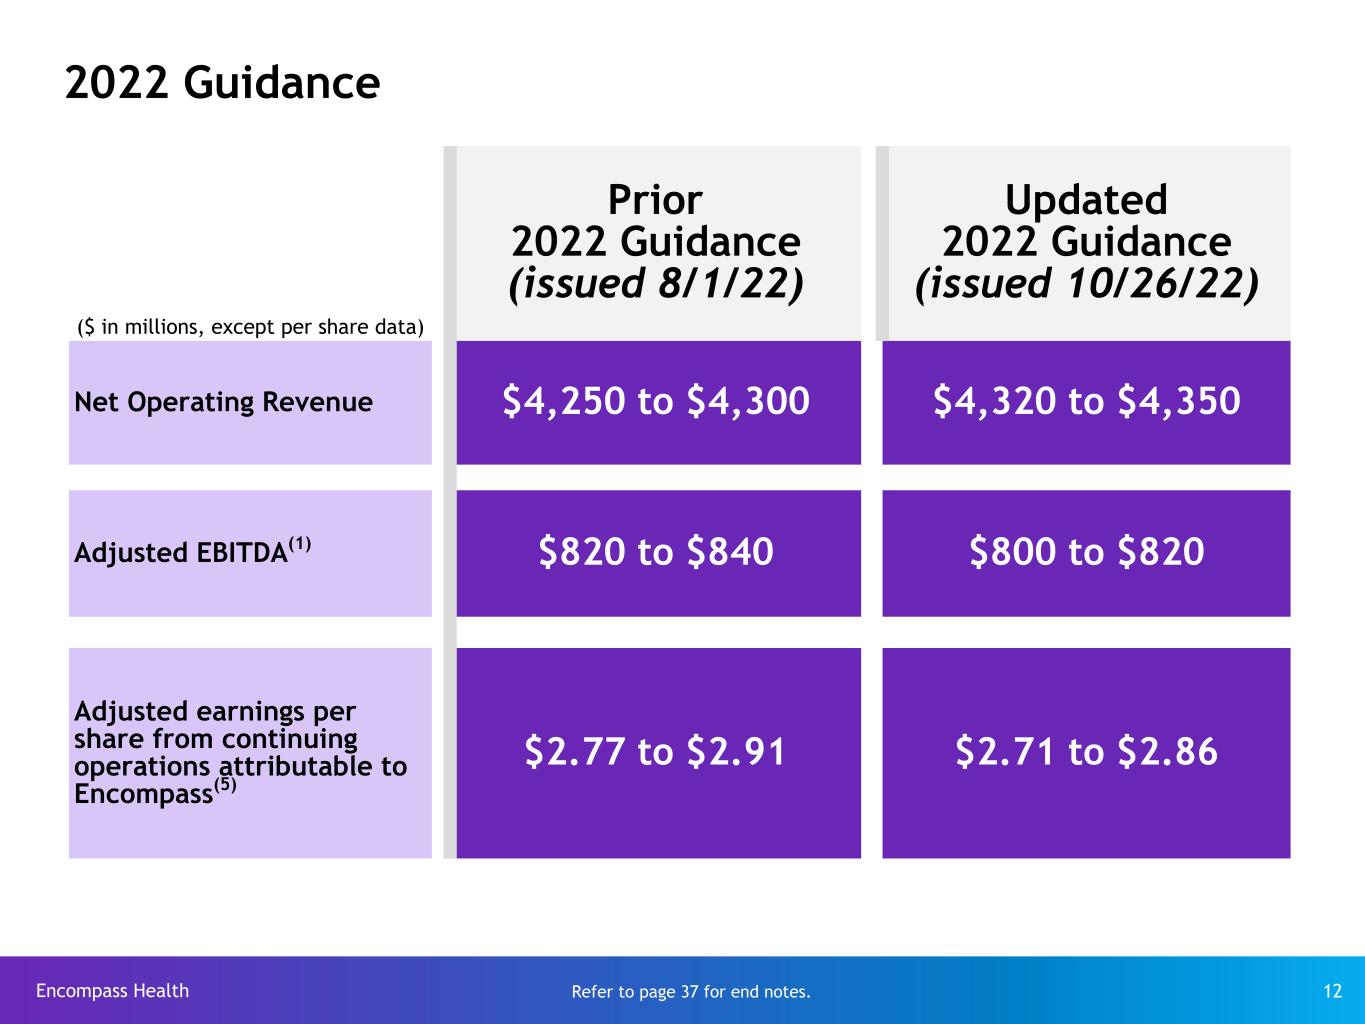
Encompass Health 12 2022 Guidance Prior 2022 Guidance (issued 8/1/22) Updated 2022 Guidance (issued 10/26/22) ($ in millions, except per share data) Net Operating Revenue $4,250 to $4,300 $4,320 to $4,350 Adjusted EBITDA(1) $820 to $840 $800 to $820 Adjusted earnings per share from continuing operations attributable to Encompass(5) $2.77 to $2.91 $2.71 to $2.86 Refer to page 37 for end notes.


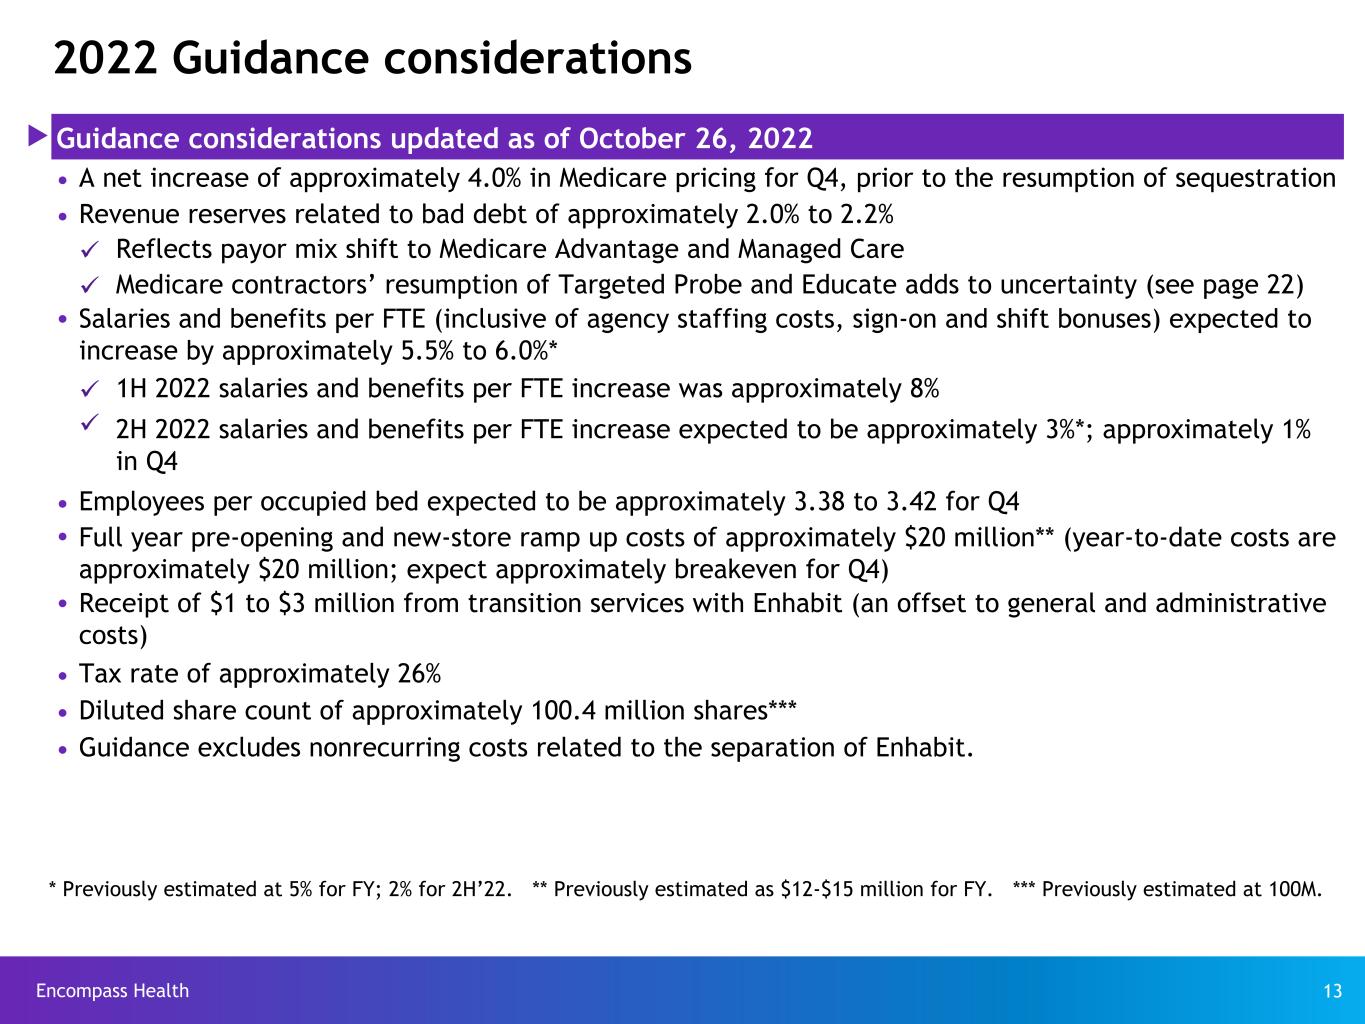
Encompass Health 13 2022 Guidance considerations u Guidance considerations updated as of October 26, 2022 Ÿ A net increase of approximately 4.0% in Medicare pricing for Q4, prior to the resumption of sequestration Ÿ Revenue reserves related to bad debt of approximately 2.0% to 2.2% ü Reflects payor mix shift to Medicare Advantage and Managed Care ü Medicare contractors’ resumption of Targeted Probe and Educate adds to uncertainty (see page 22) Ÿ Salaries and benefits per FTE (inclusive of agency staffing costs, sign-on and shift bonuses) expected to increase by approximately 5.5% to 6.0%* ü 1H 2022 salaries and benefits per FTE increase was approximately 8% ü 2H 2022 salaries and benefits per FTE increase expected to be approximately 3%*; approximately 1% in Q4 Ÿ Employees per occupied bed expected to be approximately 3.38 to 3.42 for Q4 Ÿ Full year pre-opening and new-store ramp up costs of approximately $20 million** (year-to-date costs are approximately $20 million; expect approximately breakeven for Q4) Ÿ Receipt of $1 to $3 million from transition services with Enhabit (an offset to general and administrative costs) Ÿ Tax rate of approximately 26% Ÿ Diluted share count of approximately 100.4 million shares*** Ÿ Guidance excludes nonrecurring costs related to the separation of Enhabit. * Previously estimated at 5% for FY; 2% for 2H’22. ** Previously estimated as $12-$15 million for FY. *** Previously estimated at 100M.


Encompass Health 14 Contract labor and sign-on and shift bonus trends 2020 2021 2022 Q1 Q2 Q3 Q4 Q1 Q2 Q3 Q4 Q1 Q2 Q3 Contract labor and sign-on and shift bonus expense trends ($ in millions) Sign-on/shift bonus $ 5.1 $ 4.5 $ 6.9 $ 9.1 $ 10.8 $ 12.7 $ 15.0 $ 21.3 $ 21.1 $ 21.8 $ 24.2 Contract labor $ 6.1 $ 4.5 $ 6.5 $ 7.5 $ 10.1 $ 16.0 $ 18.3 $ 30.0 $ 41.9 $ 35.1 $ 24.8 Total $ 11.2 $ 9.0 $ 13.4 $ 16.6 $ 20.9 $ 28.7 $ 33.3 $ 51.3 $ 63.0 $ 56.9 $ 49.0 Contract labor FTE trends ($ in thousands) Contract FTEs 161 116 176 192 221 318 383 516 706 633 481 Agency rate/FTE $ 151.4 $ 155.6 $ 147.5 $ 155.9 $ 185.2 $ 201.3 $ 189.5 $ 230.7 $ 240.4 $ 222.6 $ 204.5 Net same-store RN hires* N/A N/A N/A N/A 112 5 166 46 127 149 183 u Sign-on and shift bonuses increased sequentially, attributable to: Ÿ Net same-store RN hires Ÿ Staff recruitment at de novos opened in Q3 2022 Ÿ Shift bonuses to cover periods of high clinical staff PTO usage u Contract labor expense declined sequentially in Q3 2022. Ÿ Decline in contract labor FTEs and average agency rate (rate remains highly variable) *Net same store RN hires metric tracking began 1Q21


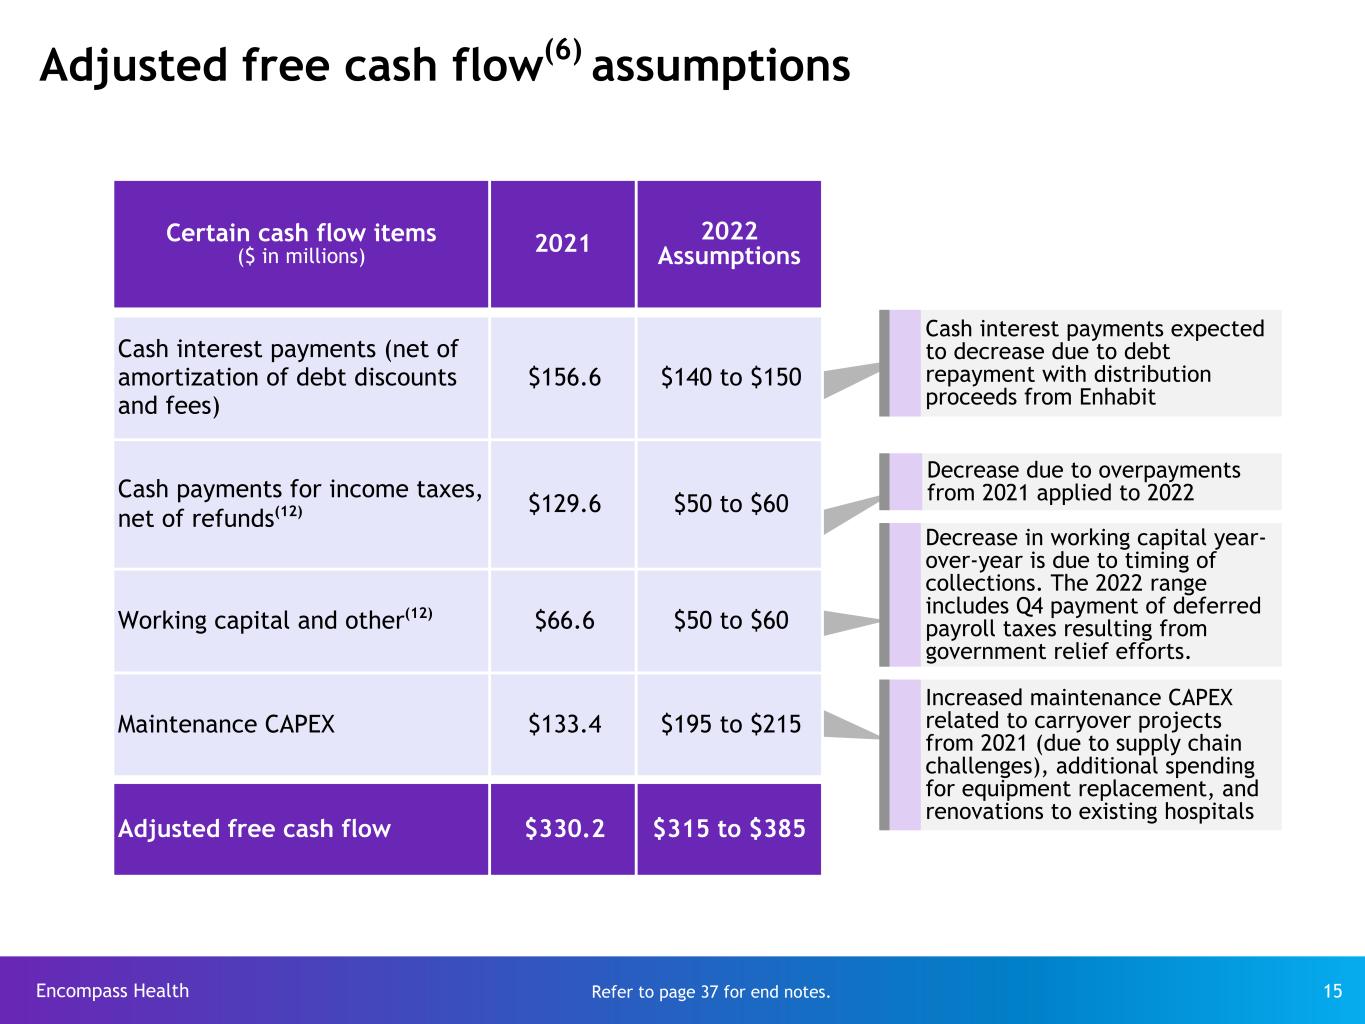
Encompass Health 15 Adjusted free cash flow(6) assumptions Certain cash flow items ($ in millions) 2021 2022 Assumptions Cash interest payments (net of amortization of debt discounts and fees) $156.6 $140 to $150 Cash payments for income taxes, net of refunds(12) $129.6 $50 to $60 Working capital and other(12) $66.6 $50 to $60 Maintenance CAPEX $133.4 $195 to $215 Adjusted free cash flow $330.2 $315 to $385 Decrease due to overpayments from 2021 applied to 2022 Decrease in working capital year- over-year is due to timing of collections. The 2022 range includes Q4 payment of deferred payroll taxes resulting from government relief efforts. Increased maintenance CAPEX related to carryover projects from 2021 (due to supply chain challenges), additional spending for equipment replacement, and renovations to existing hospitals Cash interest payments expected to decrease due to debt repayment with distribution proceeds from Enhabit Refer to page 37 for end notes.


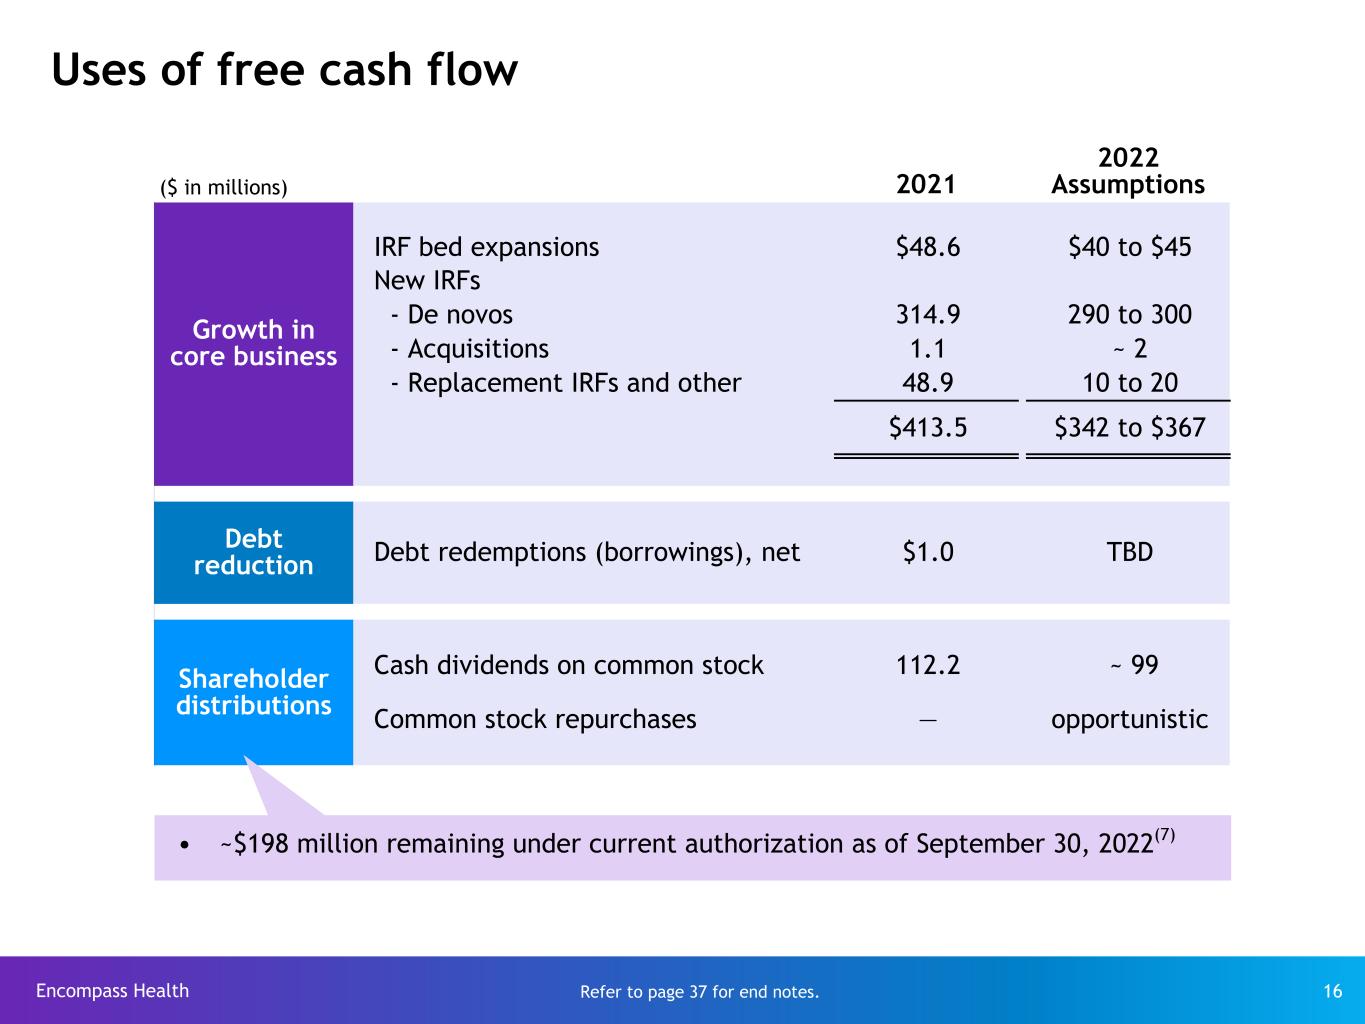
Encompass Health 16 Uses of free cash flow ($ in millions) 2021 2022 Assumptions Growth in core business IRF bed expansions $48.6 $40 to $45 New IRFs - De novos 314.9 290 to 300 - Acquisitions 1.1 ~ 2 - Replacement IRFs and other 48.9 10 to 20 $413.5 $342 to $367 Debt reduction Debt redemptions (borrowings), net $1.0 TBD Shareholder distributions Cash dividends on common stock 112.2 ~ 99 Common stock repurchases — opportunistic Ÿ ~$198 million remaining under current authorization as of September 30, 2022(7) Refer to page 37 for end notes.


Appendix


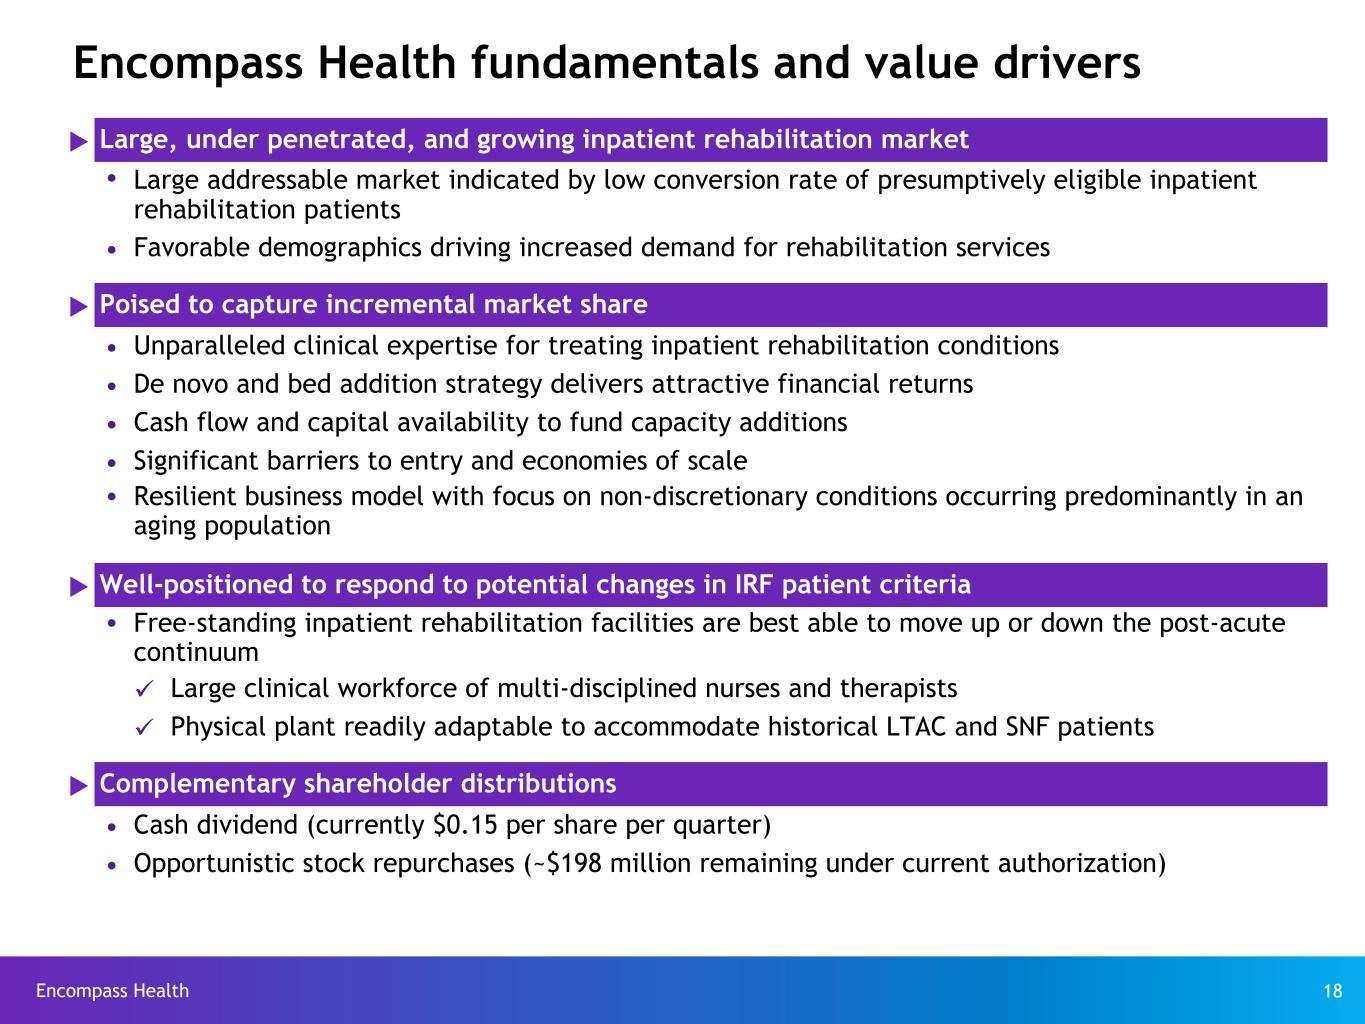
Encompass Health 18 Encompass Health fundamentals and value drivers u Large, under penetrated, and growing inpatient rehabilitation market Ÿ Large addressable market indicated by low conversion rate of presumptively eligible inpatient rehabilitation patients Ÿ Favorable demographics driving increased demand for rehabilitation services u Poised to capture incremental market share Ÿ Unparalleled clinical expertise for treating inpatient rehabilitation conditions Ÿ De novo and bed addition strategy delivers attractive financial returns Ÿ Cash flow and capital availability to fund capacity additions Ÿ Significant barriers to entry and economies of scale Ÿ Resilient business model with focus on non-discretionary conditions occurring predominantly in an aging population u Well-positioned to respond to potential changes in IRF patient criteria Ÿ Free-standing inpatient rehabilitation facilities are best able to move up or down the post-acute continuum ü Large clinical workforce of multi-disciplined nurses and therapists ü Physical plant readily adaptable to accommodate historical LTAC and SNF patients u Complementary shareholder distributions Ÿ Cash dividend (currently $0.15 per share per quarter) Ÿ Opportunistic stock repurchases (~$198 million remaining under current authorization)


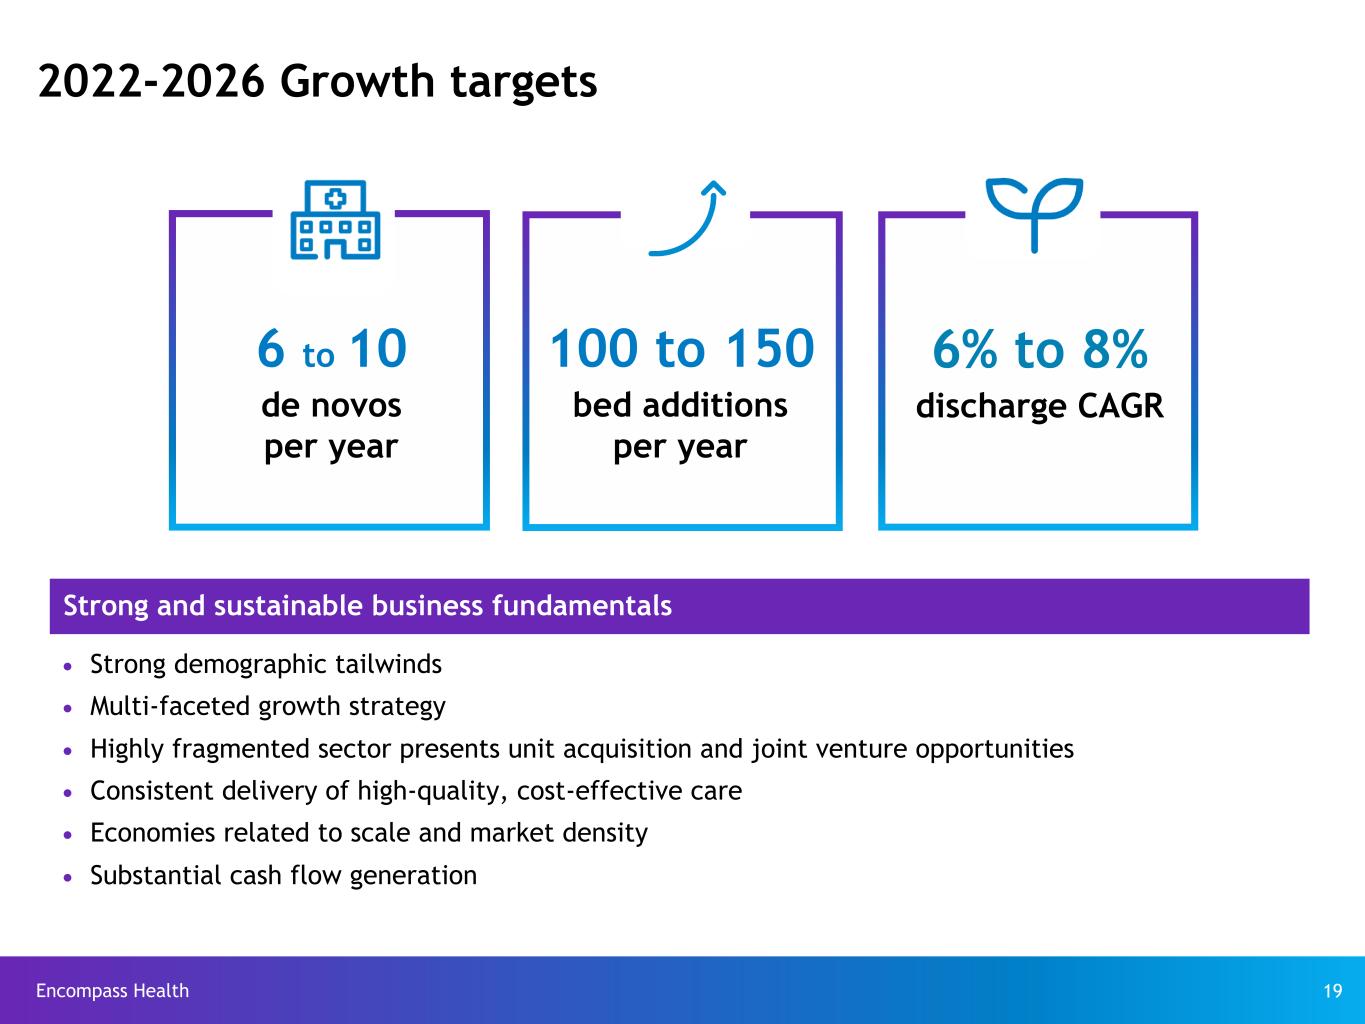
Encompass Health 19 2022-2026 Growth targets Strong and sustainable business fundamentals Ÿ Strong demographic tailwinds Ÿ Multi-faceted growth strategy Ÿ Highly fragmented sector presents unit acquisition and joint venture opportunities Ÿ Consistent delivery of high-quality, cost-effective care Ÿ Economies related to scale and market density Ÿ Substantial cash flow generation 6 to 10 de novos per year 100 to 150 bed additions per year 6% to 8% discharge CAGR


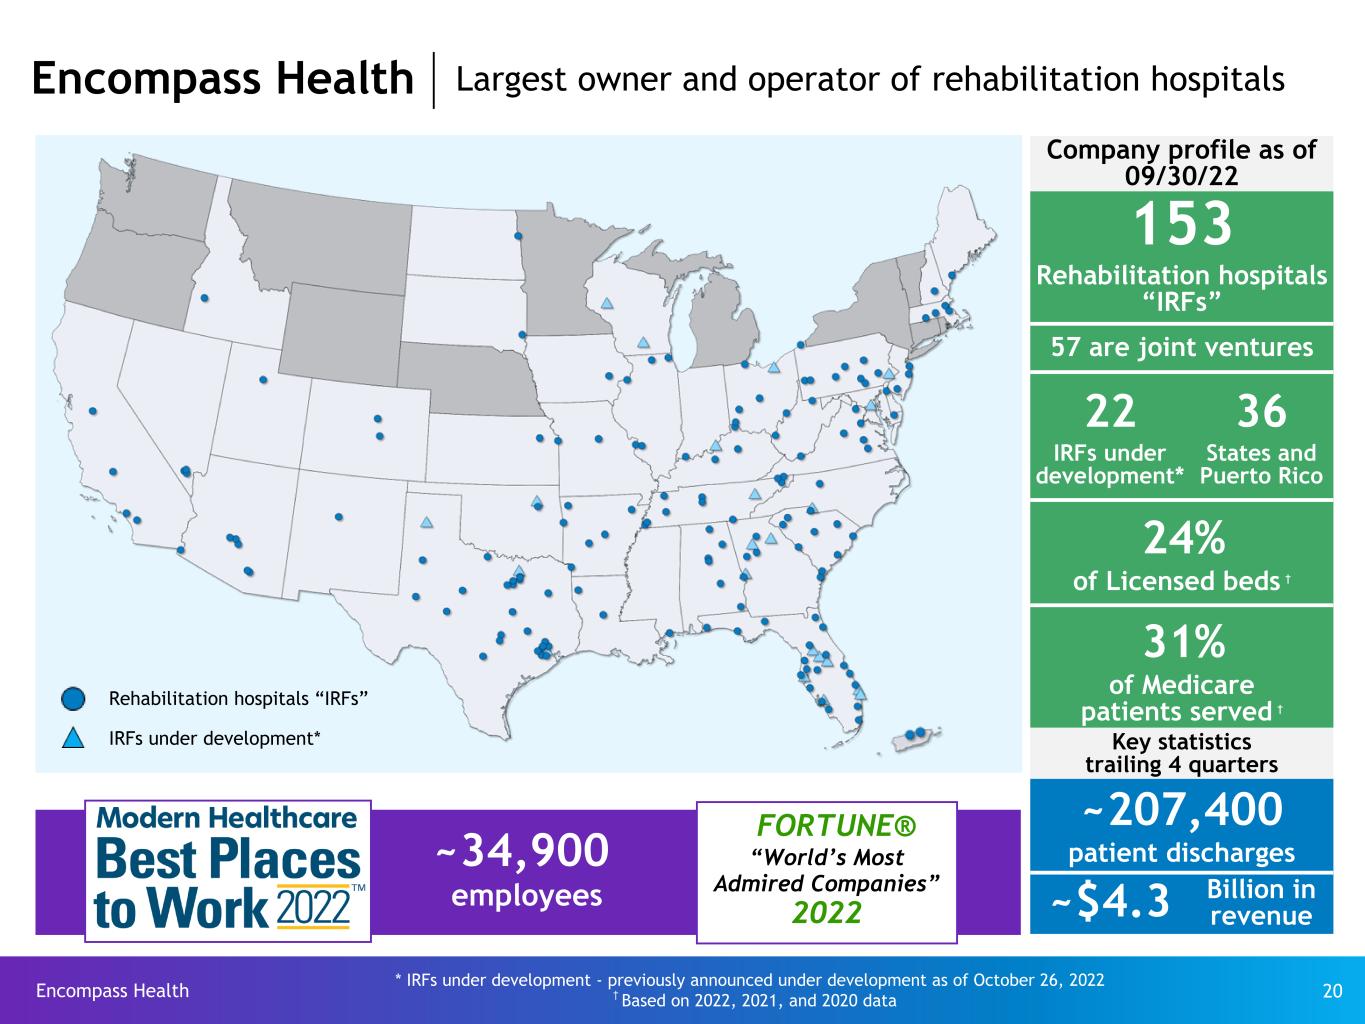
Encompass Health 20 ~34,900 employees Rehabilitation hospitals “IRFs” IRFs under development* * IRFs under development - previously announced under development as of October 26, 2022 † Based on 2022, 2021, and 2020 data Encompass Health Largest owner and operator of rehabilitation hospitals Company profile as of 09/30/22 153 Rehabilitation hospitals “IRFs” 57 are joint ventures 22 36 IRFs under development* States and Puerto Rico 24% of Licensed beds † 31% of Medicare patients served † Key statistics trailing 4 quarters ~207,400 patient discharges ~$4.3 Billion in revenue FORTUNE® “World’s Most Admired Companies” 2022


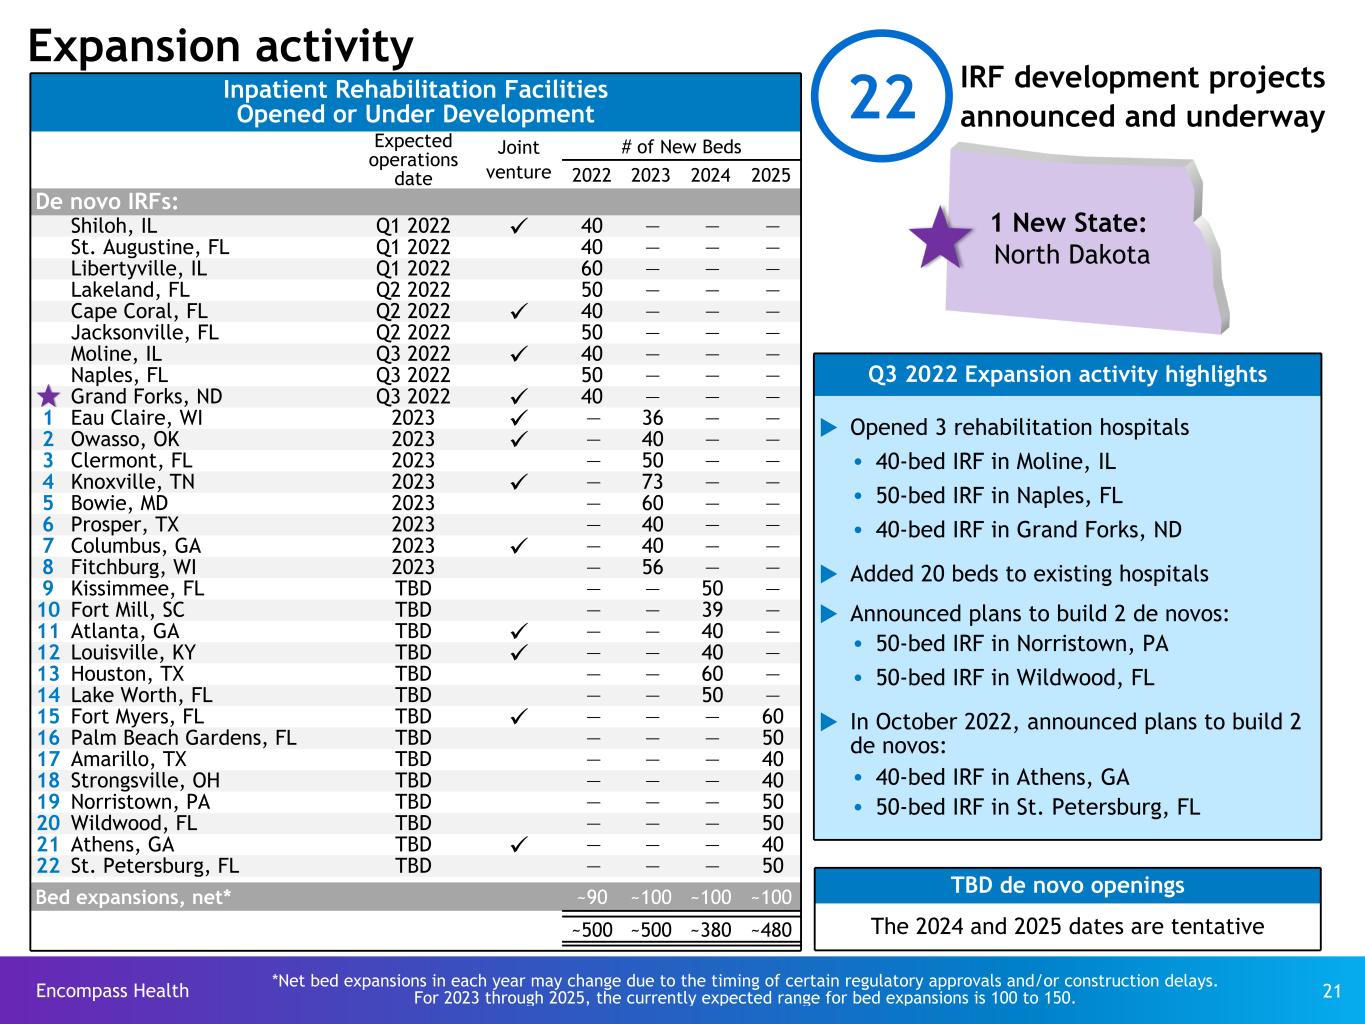
Encompass Health 21 Inpatient Rehabilitation Facilities Opened or Under Development Expected operations date Joint venture # of New Beds 2022 2023 2024 2025 De novo IRFs: Shiloh, IL Q1 2022 ü 40 — — — St. Augustine, FL Q1 2022 40 — — — Libertyville, IL Q1 2022 60 — — — Lakeland, FL Q2 2022 50 — — — Cape Coral, FL Q2 2022 ü 40 — — — Jacksonville, FL Q2 2022 50 — — — Moline, IL Q3 2022 ü 40 — — — Naples, FL Q3 2022 50 — — — Grand Forks, ND Q3 2022 ü 40 — — — 1 Eau Claire, WI 2023 ü — 36 — — 2 Owasso, OK 2023 ü — 40 — — 3 Clermont, FL 2023 — 50 — — 4 Knoxville, TN 2023 ü — 73 — — 5 Bowie, MD 2023 — 60 — — 6 Prosper, TX 2023 — 40 — — 7 Columbus, GA 2023 ü — 40 — — 8 Fitchburg, WI 2023 — 56 — — 9 Kissimmee, FL TBD — — 50 — 10 Fort Mill, SC TBD — — 39 — 11 Atlanta, GA TBD ü — — 40 — 12 Louisville, KY TBD ü — — 40 — 13 Houston, TX TBD — — 60 — 14 Lake Worth, FL TBD — — 50 — 15 Fort Myers, FL TBD ü — — — 60 16 Palm Beach Gardens, FL TBD — — — 50 17 Amarillo, TX TBD — — — 40 18 Strongsville, OH TBD — — — 40 19 Norristown, PA TBD — — — 50 20 Wildwood, FL TBD — — — 50 21 Athens, GA TBD ü — — — 40 22 St. Petersburg, FL TBD — — — 50 Bed expansions, net* ~90 ~100 ~100 ~100 ~500 ~500 ~380 ~480 Expansion activity *Net bed expansions in each year may change due to the timing of certain regulatory approvals and/or construction delays. For 2023 through 2025, the currently expected range for bed expansions is 100 to 150. Q3 2022 Expansion activity highlights u Opened 3 rehabilitation hospitals Ÿ 40-bed IRF in Moline, IL Ÿ 50-bed IRF in Naples, FL Ÿ 40-bed IRF in Grand Forks, ND u Added 20 beds to existing hospitals u Announced plans to build 2 de novos: Ÿ 50-bed IRF in Norristown, PA Ÿ 50-bed IRF in Wildwood, FL u In October 2022, announced plans to build 2 de novos: Ÿ 40-bed IRF in Athens, GA Ÿ 50-bed IRF in St. Petersburg, FL IRF development projects announced and underway 22 1 New State: North Dakota TBD de novo openings The 2024 and 2025 dates are tentative


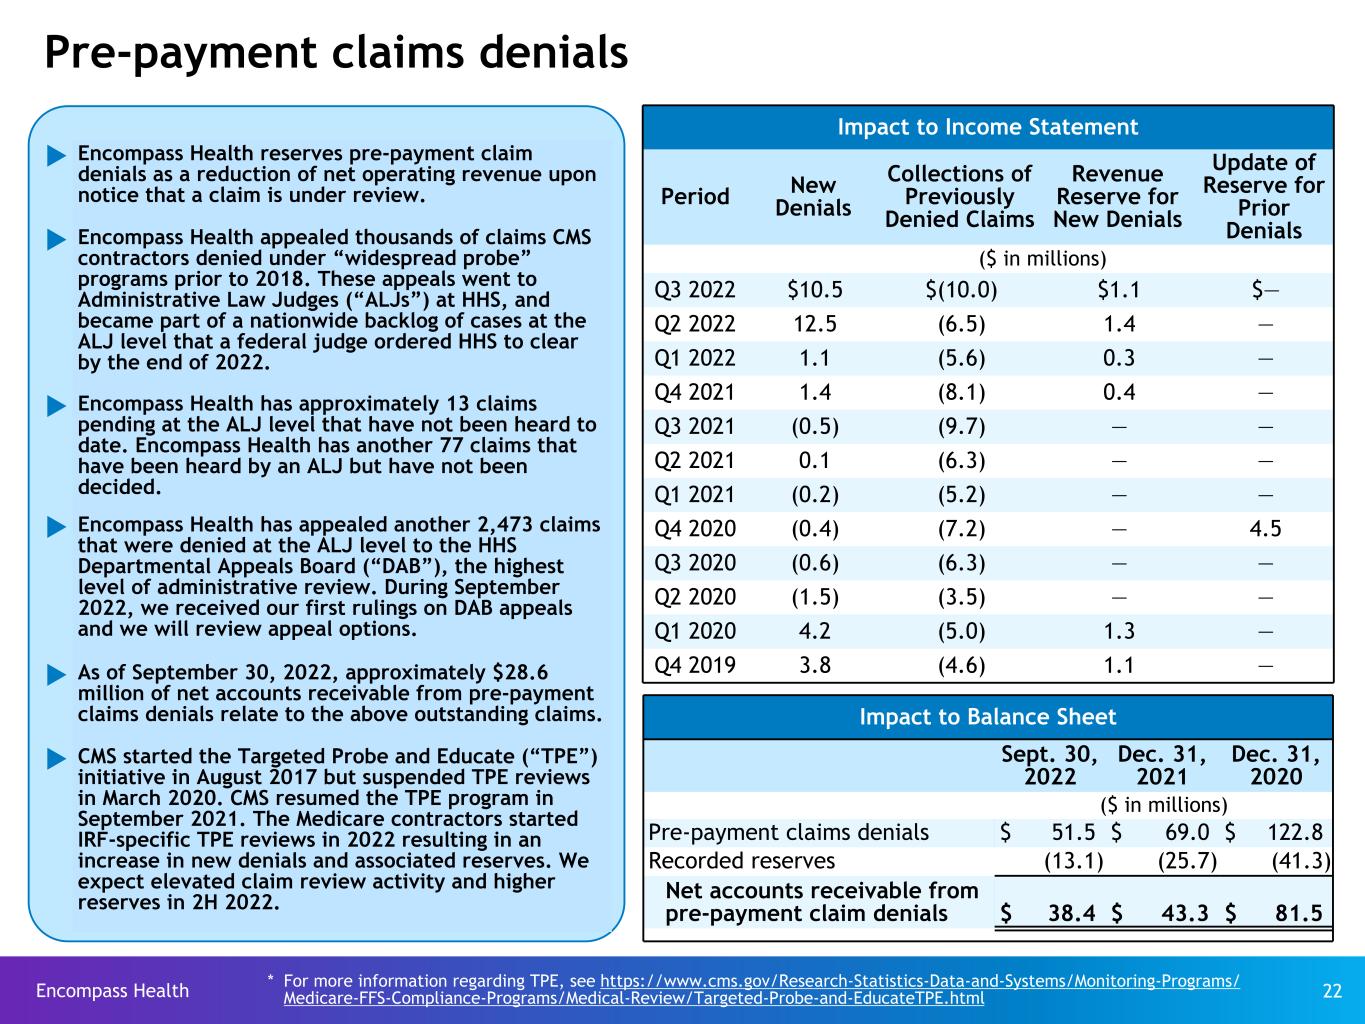
Encompass Health 22 Pre-payment claims denials Impact to Income Statement Period New Denials Collections of Previously Denied Claims Revenue Reserve for New Denials Update of Reserve for Prior Denials ($ in millions) Q3 2022 $10.5 $(10.0) $1.1 $— Q2 2022 12.5 (6.5) 1.4 — Q1 2022 1.1 (5.6) 0.3 — Q4 2021 1.4 (8.1) 0.4 — Q3 2021 (0.5) (9.7) — — Q2 2021 0.1 (6.3) — — Q1 2021 (0.2) (5.2) — — Q4 2020 (0.4) (7.2) — 4.5 Q3 2020 (0.6) (6.3) — — Q2 2020 (1.5) (3.5) — — Q1 2020 4.2 (5.0) 1.3 — Q4 2019 3.8 (4.6) 1.1 — Impact to Balance Sheet Sept. 30, 2022 Dec. 31, 2021 Dec. 31, 2020 ($ in millions) Pre-payment claims denials $ 51.5 $ 69.0 $ 122.8 Recorded reserves (13.1) (25.7) (41.3) Net accounts receivable from pre-payment claim denials $ 38.4 $ 43.3 $ 81.5 * For more information regarding TPE, see https://www.cms.gov/Research-Statistics-Data-and-Systems/Monitoring-Programs/ Medicare-FFS-Compliance-Programs/Medical-Review/Targeted-Probe-and-EducateTPE.html u Encompass Health reserves pre-payment claim denials as a reduction of net operating revenue upon notice that a claim is under review. u Encompass Health appealed thousands of claims CMS contractors denied under “widespread probe” programs prior to 2018. These appeals went to Administrative Law Judges (“ALJs”) at HHS, and became part of a nationwide backlog of cases at the ALJ level that a federal judge ordered HHS to clear by the end of 2022. u Encompass Health has approximately 13 claims pending at the ALJ level that have not been heard to date. Encompass Health has another 77 claims that have been heard by an ALJ but have not been decided. u Encompass Health has appealed another 2,473 claims that were denied at the ALJ level to the HHS Departmental Appeals Board (“DAB”), the highest level of administrative review. During September 2022, we received our first rulings on DAB appeals and we will review appeal options. u As of September 30, 2022, approximately $28.6 million of net accounts receivable from pre-payment claims denials relate to the above outstanding claims. u CMS started the Targeted Probe and Educate (“TPE”) initiative in August 2017 but suspended TPE reviews in March 2020. CMS resumed the TPE program in September 2021. The Medicare contractors started IRF-specific TPE reviews in 2022 resulting in an increase in new denials and associated reserves. We expect elevated claim review activity and higher reserves in 2H 2022.


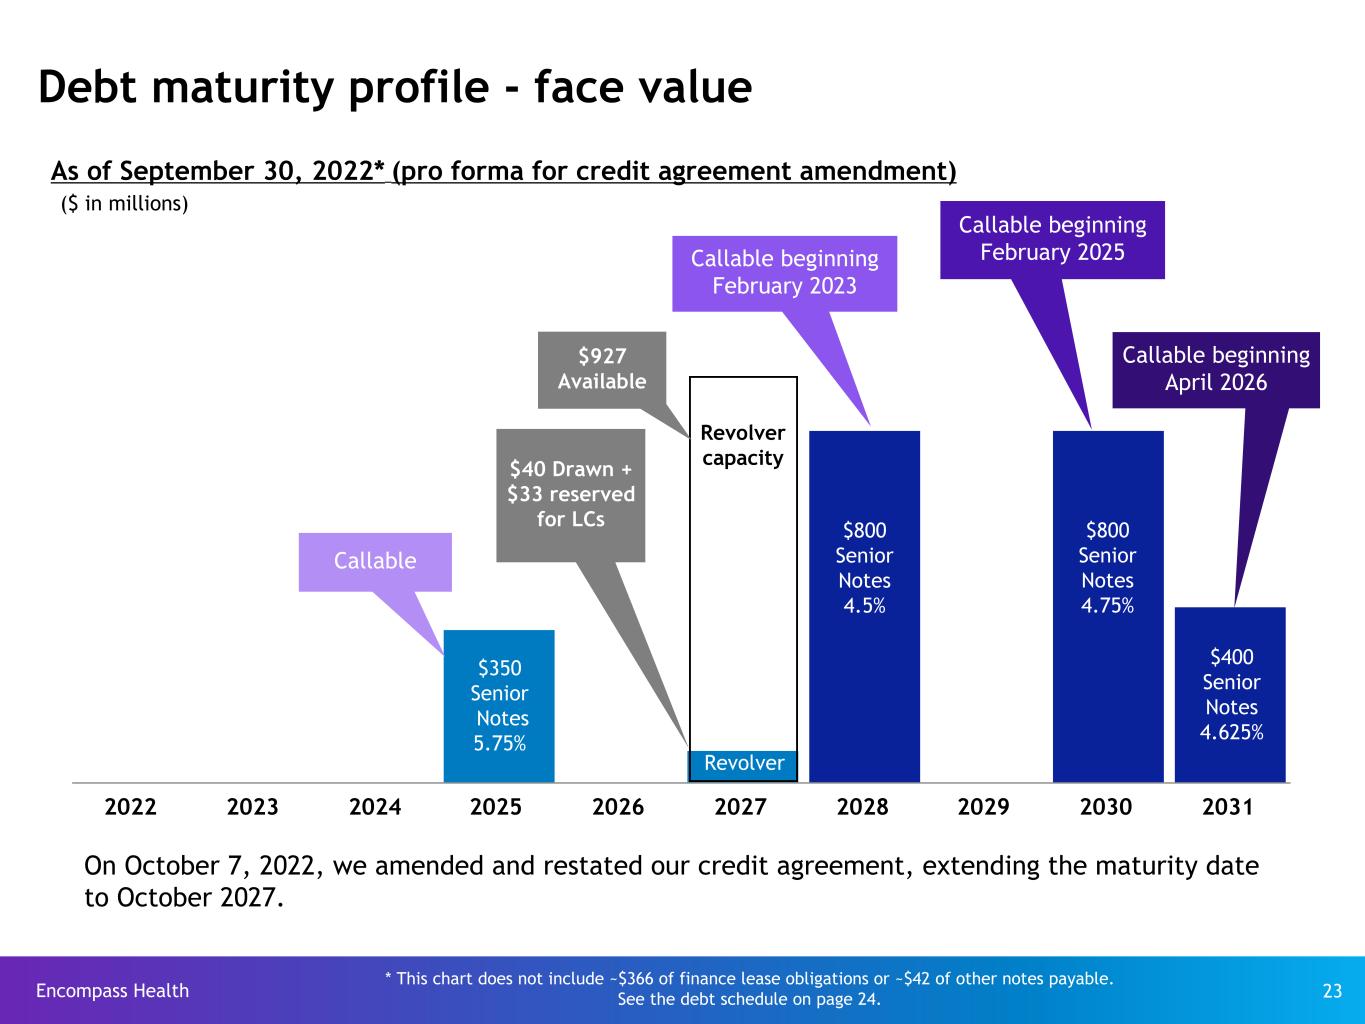
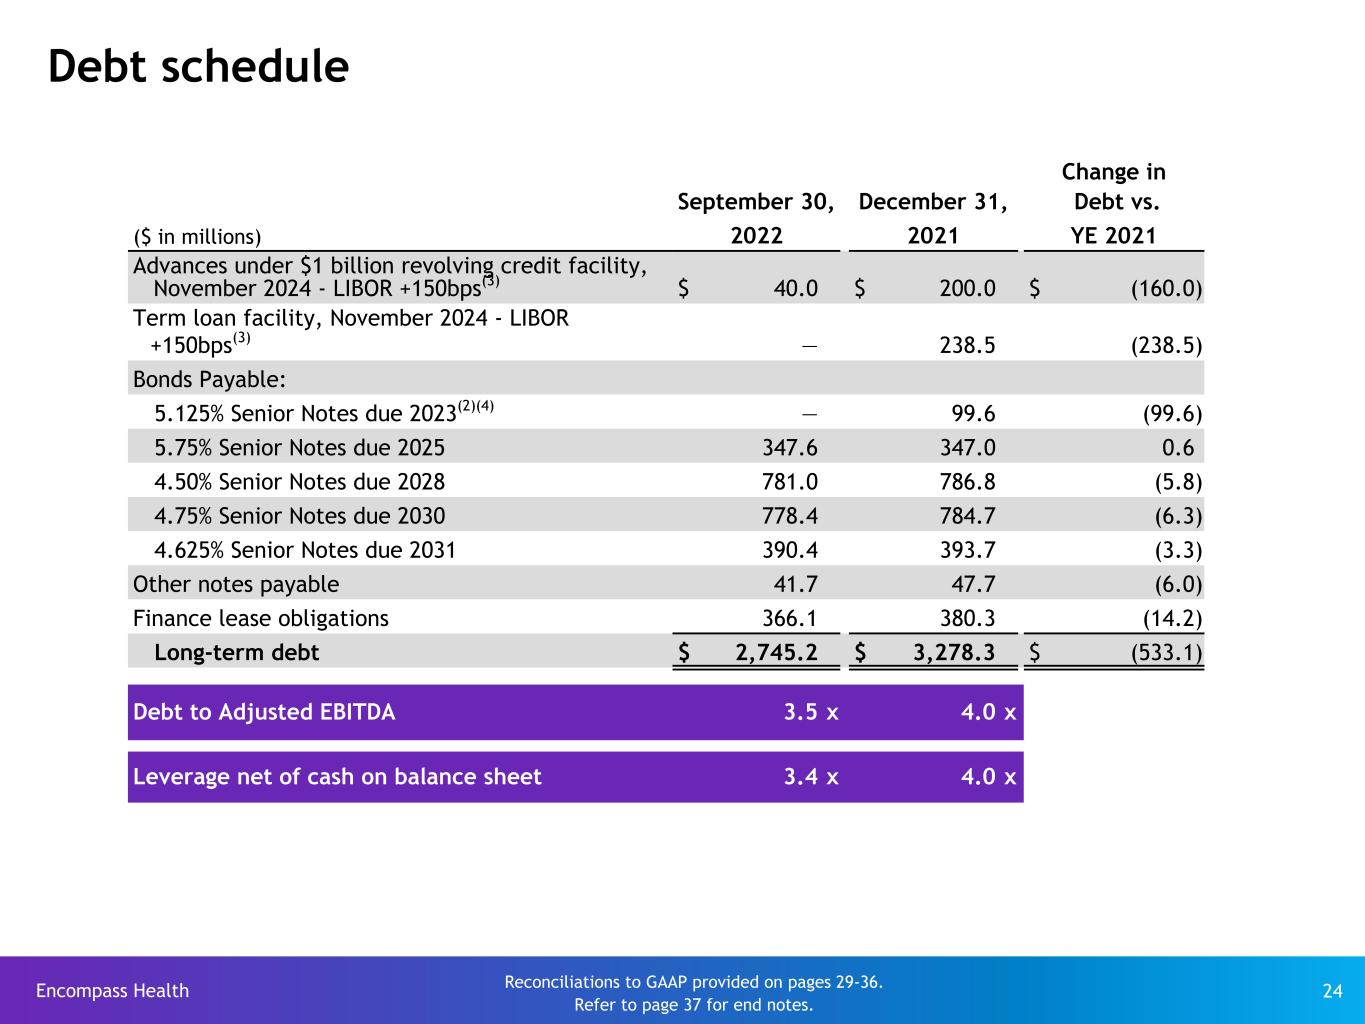
Encompass Health 23 2022 2023 2024 2025 2026 2027 2028 2029 2030 2031 * This chart does not include ~$366 of finance lease obligations or ~$42 of other notes payable. See the debt schedule on page 24. Debt maturity profile - face value $350 Senior Notes 5.75% ($ in millions) Revolver capacity $800 Senior Notes 4.75% $800 Senior Notes 4.5% Revolver As of September 30, 2022* (pro forma for credit agreement amendment) $927 Available $40 Drawn + $33 reserved for LCs Callable Callable beginning February 2025Callable beginning February 2023 $400 Senior Notes 4.625% Callable beginning April 2026 On October 7, 2022, we amended and restated our credit agreement, extending the maturity date to October 2027.


Encompass Health 24 Debt schedule Change in September 30, December 31, Debt vs. ($ in millions) 2022 2021 YE 2021 Advances under $1 billion revolving credit facility, November 2024 - LIBOR +150bps(3) $ 40.0 $ 200.0 $ (160.0) Term loan facility, November 2024 - LIBOR +150bps(3) — 238.5 (238.5) Bonds Payable: 5.125% Senior Notes due 2023(2)(4) — 99.6 (99.6) 5.75% Senior Notes due 2025 347.6 347.0 0.6 4.50% Senior Notes due 2028 781.0 786.8 (5.8) 4.75% Senior Notes due 2030 778.4 784.7 (6.3) 4.625% Senior Notes due 2031 390.4 393.7 (3.3) Other notes payable 41.7 47.7 (6.0) Finance lease obligations 366.1 380.3 (14.2) Long-term debt $ 2,745.2 $ 3,278.3 $ (533.1) Debt to Adjusted EBITDA 3.5 x 4.0 x Leverage net of cash on balance sheet 3.4 x 4.0 x Reconciliations to GAAP provided on pages 29-36. Refer to page 37 for end notes.


Encompass Health 25 -10.0% 0.0% 10.0% 20.0% * Includes consolidated inpatient rehabilitation hospitals classified as same store during each period Refer to page 37 for end notes. New-store/same-store growth North Tampa, FL (50 beds) Cumming, GA (50 beds) Shreveport, LA (40 beds) Waco, TX (40 beds) Greenville, SC (40 beds) Pensacola, FL (40 beds) Discharges Q4 2019 Q1 2020 Q2 2020 Q3 2020 Q4 2020 Q1 2021 Q2 2021 Q3 2021 Q4 2021 Q1 2022 Q2 2022 Q3 2022 New store 2.0% 2.3% 2.1% 1.3% 0.9% 1.0% 1.8% 2.0% 3.6% 3.8% 3.3% 3.4% Same store* 3.2% 2.4% (12.8)% (2.8)% (3.8)% (2.2)% 16.9% 6.7% 6.0% 3.8% 1.6% 4.1% Total by quarter 5.2% 4.7% (10.7)% (1.5)% (2.9)% (1.2)% 18.7% 8.7% 9.6% 7.6% 4.9% 7.5% Total by year 3.9% (2.6)% 8.7% Same-store year* 1.8% (4.4)% 6.2% Same-store year UDS(8) 1.3% (3.2)% 2.3% Murrieta, CA (50 beds) Sioux Falls, SD (40 beds) Coralville, IA (40 beds) Beginning in mid-March 2020, volume growth was impacted by COVID-19. Toledo, OH (40 beds) San Angelo, TX (40 beds) Shiloh, IL (40 beds) St. Augustine, FL (40 beds) Libertyville, IL (60 beds) Henry County, GA (50 beds) Moline, IL (40 beds) Naples, FL (50 beds) Grand Forks, ND (40 beds) Lakeland, FL (50 beds) Cape Coral, FL (40 beds) Jacksonville, FL (50 beds)


Encompass Health 26 Payment sources (percent of revenues) Q3 9 Months Full Year 2022 2021 2022 2021 2021 Medicare 65.3 % 64.2 % 65.0 % 64.4 % 64.4 % Medicare Advantage 15.0 % 15.1 % 15.0 % 15.6 % 15.2 % Managed care 11.6 % 12.2 % 11.9 % 11.8 % 12.1 % Medicaid 4.4 % 4.1 % 4.3 % 4.1 % 4.1 % Other third-party payors 0.9 % 1.0 % 0.9 % 1.1 % 1.1 % Workers’ compensation 0.6 % 0.6 % 0.6 % 0.6 % 0.6 % Patients 0.3 % 0.5 % 0.4 % 0.5 % 0.5 % Other income 1.9 % 2.3 % 1.9 % 1.9 % 2.0 % Total 100.0 % 100.0 % 100.0 % 100.0 % 100.0 %


Encompass Health 27 Operational metrics Q3 Q2 Q1 Q4 Q3 Q2 Q1 Full Year 2022 2022 2022 2021 2021 2021 2021 2021 ($ in millions) Net patient revenue-inpatient $ 1,064.6 $ 1,037.8 $ 1,036.2 $ 1,015.1 $ 983.7 $ 976.9 $ 942.3 $ 3,918.0 Net patient revenue-outpatient and other revenues 24.9 24.7 23.1 27.4 27.1 24.8 17.6 96.9 Net operating revenues $ 1,089.5 $ 1,062.5 $ 1,059.3 $ 1,042.5 $ 1,010.8 $ 1,001.7 $ 959.9 $ 4,014.9 (Actual Amounts) Discharges(9) 53,743 51,902 50,771 50,977 49,983 49,492 47,187 197,639 Net patient revenue per discharge $ 19,809 $ 19,995 $ 20,409 $ 19,913 $ 19,681 $ 19,739 $ 19,969 $ 19,824 Outpatient visits 34,348 35,929 35,229 37,952 38,904 44,020 40,194 161,070 Average length of stay 12.7 12.6 13.0 12.8 12.8 12.7 13.0 12.8 Occupancy % 71.4 % 70.7 % 73.1 % 71.5 % 70.6 % 71.1 % 71.4 % 70.0 % # of licensed beds 10,356 10,206 10,028 9,924 9,846 9,701 9,560 9,924 Occupied beds 7,394 7,216 7,330 7,096 6,951 6,897 6,826 6,947 Full-time equivalents (FTEs)(10) 24,580 23,649 23,313 23,364 23,054 22,535 22,383 22,834 Contract labor 481 633 706 516 383 318 221 359 Total FTE and contract labor 25,061 24,282 24,019 23,880 23,437 22,853 22,604 23,193 EPOB(11) 3.39 3.37 3.28 3.37 3.37 3.31 3.31 3.34 Refer to page 37 for end notes.


Encompass Health 28 Share information Weighted Average for the Period Q3 9 Months Full Year (in millions) 2022 2021 2022 2021 2021 2020 2019 Basic shares outstanding 99.2 99.0 99.2 99.0 99.0 98.6 98.0 Restricted stock awards, dilutive stock options, restricted stock units, and common stock warrants 1.3 1.2 1.1 1.1 1.2 1.2 1.4 Diluted shares outstanding 100.5 100.2 100.3 100.1 100.2 99.8 99.4 End of Period Q3 9 Months Full Year (in millions) 2022 2021 2022 2021 2021 2020 2019 Basic shares outstanding 99.8 99.5 99.8 99.5 99.5 99.4 98.6


Encompass Health 29 Reconciliation of net income to Adjusted EBITDA(1) Three Months Ended September 30, Nine Months Ended September 30, Full Year 2022 2021 2022 2021 2021 ($ in millions) Net income $ 67.0 $ 126.7 $ 248.4 $ 401.5 $ 517.2 Loss (income) from discontinued operations, net of tax, attributable to Encompass Health 18.5 (24.6) (16.7) (90.6) (114.1) Net income attributable to noncontrolling interests included in continuing operations (21.6) (26.3) (65.5) (79.6) (103.2) Provision for income tax expense 21.8 26.2 68.2 79.4 101.9 Interest expense and amortization of debt discounts and fees 38.2 39.9 138.2 124.3 164.3 Depreciation and amortization 62.1 55.5 180.3 162.9 219.6 Loss on early extinguishment of debt (2)(3)(4) — — 1.4 1.0 1.0 (Gain) loss on disposal or impairment of assets (1.1) (5.0) 2.4 (1.7) 1.2 Stock-based compensation 7.3 6.6 21.1 19.6 29.1 Change in fair market value of equity securities 3.1 0.3 8.8 (0.3) (0.6) Adjusted EBITDA $ 195.3 $ 199.3 $ 586.6 $ 616.5 $ 816.4 Refer to page 37 for end notes.


Encompass Health 30 Net cash provided by operating activities reconciled to Adjusted EBITDA(1) Q3 9 Months Full Year ($ in millions) 2022 2021 2022 2021 2021 Net cash provided by operating activities $ 70.1 $ 177.6 $ 533.6 $ 592.0 $ 715.8 Interest expense and amortization of debt discounts and fees 38.2 39.9 138.2 124.3 164.3 (Loss) gain on sale of investments, excluding impairments (4.6) (0.3) (16.5) 1.8 3.8 Equity in net income of nonconsolidated affiliates 0.7 0.9 2.6 2.5 3.4 Net income attributable to noncontrolling interests in continuing operations (21.6) (26.3) (65.5) (79.6) (103.2) Amortization of debt-related items (2.6) (1.8) (7.4) (5.8) (7.8) Distributions from nonconsolidated affiliates (0.8) (0.8) (3.7) (2.4) (2.6) Current portion of income tax expense 23.0 28.1 75.9 77.8 78.8 Change in assets and liabilities 69.9 17.6 (23.5) 39.8 115.6 Cash used in (provided by) operating activities of discontinued operations 19.9 (35.7) (56.0) (133.5) (151.1) Change in fair market value of equity securities 3.1 0.3 8.8 (0.3) (0.6) Other — (0.2) 0.1 (0.1) — Adjusted EBITDA $ 195.3 $ 199.3 $ 586.6 $ 616.5 $ 816.4 Refer to page 37 for end notes.


Encompass Health 31 Reconciliation of net cash provided by operating activities to adjusted free cash flow(6) Q3 9 Months Full Year ($ in millions) 2022 2021 2022 2021 2021 Net cash provided by operating activities $ 70.1 $ 177.6 $ 533.6 $ 592.0 $ 715.8 Impact of discontinued operations 19.9 (35.7) (56.0) (133.5) (151.1) Net cash provided by operating activities of continuing operations 90.0 141.9 477.6 458.5 564.7 Capital expenditures for maintenance (56.2) (30.3) (127.6) (81.0) (133.4) Distributions paid to noncontrolling interests of consolidated affiliates (22.3) (24.8) (68.2) (76.2) (101.1) Items not indicative of ongoing operating performance: Transaction costs and related assumed liabilities 15.1 0.9 12.3 0.7 — Adjusted free cash flow $ 26.6 $ 87.7 $ 294.1 $ 302.0 $ 330.2 Cash dividends on common stock $ 27.8 $ 27.7 $ 84.1 $ 84.5 $ 112.2 Refer to page 37 for end notes.


Encompass Health 32 Adjusted EPS(5) - Q3 2022 For the Three Months Ended September 30, 2022 Adjustments As Reported Income Tax Adjustments Change in Fair Market Value of Equity Securities As Adjusted ($ in millions, except per share amounts) Adjusted EBITDA $ 195.3 $ — $ — $ 195.3 Depreciation and amortization (62.1) — — (62.1) Interest expense and amortization of debt discounts and fees (38.2) — — (38.2) Stock-based compensation (7.3) — — (7.3) Gain on disposal or impairment of assets 1.1 — — 1.1 Change in fair market value of equity securities (3.1) — 3.1 — Income from continuing operations before income tax expense 85.7 — 3.1 88.8 Provision for income tax expense (21.8) 1.3 (0.8) (21.3) Income from continuing operations attributable to Encompass Health $ 63.9 $ 1.3 $ 2.3 $ 67.5 Diluted earnings per share from continuing operations* $ 0.63 $ 0.01 $ 0.02 $ 0.67 Diluted shares used in calculation 100.5 * Adjusted EPS may not sum across due to rounding. Refer to page 37 for end notes.


Encompass Health 33 For the Three Months Ended September 30, 2021 Adjustments As Reported Income Tax Adjustments Change in Fair Market Value of Equity Securities As Adjusted ($ in millions, except per share amounts) Adjusted EBITDA $ 199.3 $ — $ — $ 199.3 Depreciation and amortization (55.5) — — (55.5) Interest expense and amortization of debt discounts and fees (39.9) — — (39.9) Stock-based compensation (6.6) — — (6.6) Gain on disposal or impairment of assets 5.0 — — 5.0 Change in fair market value of equity securities (0.3) — 0.3 — Income from continuing operations before income tax expense 102.0 — 0.3 102.3 Provision for income tax expense (26.2) (0.2) (0.1) (26.5) Income from continuing operations attributable to Encompass Health $ 75.8 $ (0.2) $ 0.2 $ 75.8 Diluted earnings per share from continuing operations* $ 0.76 $ — $ — $ 0.76 Diluted shares used in calculation 100.2 Adjusted EPS(5) - Q3 2021 * Adjusted EPS may not sum across due to rounding. Refer to page 37 for end notes.


Encompass Health 34 Adjusted EPS(5) - YTD Q3 2022 For the Nine Months Ended September 30, 2022 Adjustments As Reported Loss on Early Exting. of Debt Income Tax Adjustments Bondholder Consent Fees Associated with Enhabit Distribution Change in Fair Market Value of Equity Securities As Adjusted ($ in millions, except per share amounts) Adjusted EBITDA $ 586.6 $ — $ — $ — $ — $ 586.6 Depreciation and amortization (180.3) — — — — (180.3) Interest expense and amortization of debt discounts and fees (138.2) — — 20.5 — (117.7) Stock-based compensation (21.1) — — — — (21.1) Loss on disposal or impairment of assets (2.4) — — — — (2.4) Loss on early extinguishment of debt(2)(3) (1.4) 1.4 — — — — Change in fair market value of equity securities (8.8) — — — 8.8 — Income from continuing operations before income tax expense 234.4 1.4 — 20.5 8.8 265.1 Provision for income tax expense (68.2) (0.4) 8.5 (5.3) (2.3) (67.7) Income from continuing operations attributable to Encompass Health $ 166.2 $ 1.0 $ 8.5 $ 15.2 $ 6.5 $ 197.4 Diluted earnings per share from continuing operations* $ 1.66 $ 0.01 $ 0.08 $ 0.15 $ 0.06 $ 1.97 Diluted shares used in calculation 100.3 * Adjusted EPS may not sum across due to rounding. Refer to page 37 for end notes.


Encompass Health 35 For the Nine Months Ended September 30, 2021 Adjustments As Reported Loss on Early Extinguishment of Debt Income Tax Adjustments Change in Fair Market Value of Equity Securities As Adjusted ($ in millions, except per share amounts) Adjusted EBITDA $ 616.5 $ — $ — $ — $ 616.5 Depreciation and amortization (162.9) — — — (162.9) Interest expense and amortization of debt discounts and fees (124.3) — — — (124.3) Stock-based compensation (19.6) — — — (19.6) Gain on disposal or impairment of assets 1.7 — — — 1.7 Loss on early extinguishment of debt(4) (1.0) 1.0 — — — Change in fair market value of equity securities 0.3 — — (0.3) — Income from continuing operations before income tax expense 310.7 1.0 — (0.3) 311.4 Provision for income tax expense (79.4) (0.3) (3.3) 0.1 (82.9) Income from continuing operations attributable to Encompass Health $ 231.3 $ 0.7 $ (3.3) $ (0.2) $ 228.5 Diluted earnings per share from continuing operations* $ 2.31 $ 0.01 $ (0.03) $ — $ 2.28 Diluted shares used in calculation 100.1 Adjusted EPS(5) - YTD Q3 2021 * Adjusted EPS may not sum across due to rounding. Refer to page 37 for end notes.


Encompass Health 36 For the Year Ended December 31, 2021 Adjustments As Reported Loss on Early Extinguishment of Debt Income Tax Adjustments Change in Fair Market Value of Equity Securities As Adjusted ($ in millions, except per share amounts) Adjusted EBITDA $ 816.4 $ — $ — $ — $ 816.4 Depreciation and amortization (219.6) — — — (219.6) Interest expense and amortization of debt discounts and fees (164.3) — — — (164.3) Stock-based compensation (29.1) — — — (29.1) Loss on disposal or impairment of assets (1.2) — — — (1.2) Loss on early extinguishment of debt(4) (1.0) 1.0 — — — Change in fair market value of equity securities 0.6 — — (0.6) — Income from continuing operations before income tax expense 401.8 1.0 — (0.6) 402.2 Provision for income tax expense (101.9) (0.3) (4.6) 0.2 (106.6) Income from continuing operations attributable to Encompass Health $ 299.9 $ 0.7 $ (4.6) $ (0.4) $ 295.6 Diluted earnings per share from continuing operations* $ 2.99 $ 0.01 $ (0.05) $ — $ 2.95 Diluted shares used in calculation 100.2 Adjusted EPS(5) - FY 2021 * Adjusted EPS may not sum across due to rounding. Refer to page 37 for end notes.


Encompass Health 37 End notes * Reconciliations to GAAP provided on pages 29-36. (1) Adjusted EBITDA is a non-GAAP financial measure. The Company’s leverage ratio (total consolidated debt to Adjusted EBITDA for the trailing four quarters) is, likewise, a non-GAAP measure. Management and some members of the investment community utilize Adjusted EBITDA as a financial measure and the leverage ratio as a liquidity measure on an ongoing basis. These measures are not recognized in accordance with GAAP and should not be viewed as an alternative to GAAP measures of performance or liquidity. In evaluating Adjusted EBITDA, the reader should be aware that in the future the Company may incur expenses similar to the adjustments set forth. (2) In the first quarter of 2022, the Company redeemed the remaining $100 million of its 5.125% Senior Notes due 2023. The redemption was completed at 100% of par using drawings under the Company’s revolving credit facility. As a result of the redemption, the Company recorded a $0.3 million loss on early extinguishment of debt in the first quarter of 2022. (3) In the second quarter of 2022, the Company redeemed approximately $236 million of its term loan due 2024 and fully repaid the $250 million outstanding balance on its revolving credit facility. The redemption was completed using proceeds which were dividended from Enhabit. As a result of the redemption, the Company recorded a $1.1 million loss on early extinguishment of debt in the second quarter of 2022. (4) In the second quarter of 2021, the Company redeemed a total of $200 million of 5.125% Senior Notes due 2023 ($100 million in April and $100 million in June). The redemptions were completed at 100% of par using cash on hand and drawings under the Company’s revolving credit facility. As a result of the redemptions, the Company recorded a $1.0 million loss on early extinguishment of debt in the second quarter of 2021. (5) The Company is providing adjusted earnings per share from continuing operations attributable to Encompass Health (“adjusted earnings per share”), which is a non- GAAP measure. The Company believes the presentation of adjusted earnings per share provides useful additional information to investors because it provides better comparability of ongoing operating performance to prior periods given that it excludes the impact of government, class action, and related settlements, professional fees - accounting, tax, and legal, mark-to-market adjustments for stock appreciation rights, gains or losses related to hedging and equity instruments, loss on early extinguishment of debt, adjustments to its income tax provision (such as valuation allowance adjustments, settlements of income tax claims and windfall tax benefits), items related to corporate and facility restructurings, and certain other items deemed to be non-indicative of ongoing operating performance. It is reasonable to expect that one or more of these excluded items will occur in future periods, but the amounts recognized can vary significantly from period to period and may not directly relate to the Company's ongoing operating performance. Accordingly, they can complicate comparisons of the Company's results of operations across periods and comparisons of the Company's results to those of other healthcare companies. Adjusted earnings per share should not be considered as a measure of financial performance under generally accepted accounting principles in the United States as the items excluded from it are significant components in understanding and assessing financial performance. Because adjusted earnings per share is not a measurement determined in accordance with GAAP and is thus susceptible to varying calculations, it may not be comparable as presented to other similarly titled measures of other companies.* (6) Definition of adjusted free cash flow, which is a non-GAAP measure, is net cash provided by operating activities of continuing operations minus capital expenditures for maintenance, dividends paid on preferred stock, distributions to noncontrolling interests, and certain other items deemed to be non-indicative of ongoing operating performance. Common stock dividends are not included in the calculation of adjusted free cash flow. Because this measure is not determined in accordance with GAAP and is susceptible to varying calculations, it may not be comparable to other similarly titled measures presented by other companies. (7) On Oct. 28, 2013, the Company announced its board of directors authorized the repurchase of up to $200 million of its common stock. On Feb. 14, 2014, the Company's board approved an increase in this common stock repurchase authorization from $200 million to $250 million. As of June 30, 2018, the remaining repurchase authorization was approximately $58 million. On July 24, 2018, the Company's board approved resetting the aggregate common stock repurchase authorization to $250 million. As of September 30, 2022, the remaining repurchase authorization was approximately $198 million. (8) Data provided by Uniform Data System for Medical Rehabilitation, a division of UB Foundation Activities, Inc., a data gathering and analysis organization for the rehabilitation industry; represents ~80% of industry, including Encompass Health inpatient rehabilitation sites. (9) Represents discharges from 153 consolidated hospitals in Q3 2022; 150 consolidated hospitals in Q2 2022; 147 consolidated hospitals in Q1 2022; 145 consolidated hospitals in Q4 2021; 144 consolidated hospitals in Q3 2021; 140 consolidated hospitals in Q2 2021; and 138 consolidated hospitals in Q1 2021. (10) Full-time equivalents included in the table represent Encompass Health employees who participate in or support the operations of our hospitals and include an estimate of full-time equivalents related to contract labor. (11) Employees per occupied bed, or “EPOB,” is calculated by dividing the number of full-time equivalents, including an estimate of full-time equivalents from the utilization of contract labor, by the number of occupied beds during each period. The number of occupied beds is determined by multiplying the number of licensed beds by the Company’s occupancy percentage. (12) Historical amounts previously reported within our Q2 2022 earnings release supplemental slides for Cash payments for income taxes and Working capital and other have been updated to reflect the final reporting of Enhabit as a discontinued operation for all periods presented. Namely, Cash payments for income taxes now reflect 100% of EHC income taxes paid and Working capital now reflects the elimination of any tax related intercompany balances due to(from) Enhabit for all historical periods through the distribution date.