Document
falsefalse00008270520000092103 0000827052 2020-02-27 2020-02-27 0000827052 eix:SouthernCaliforniaEdisonCompanyMember 2020-02-27 2020-02-27 0000827052 exch:XASE eix:SouthernCaliforniaEdisonCompanyMember eix:CumulativePreferredStockSeriesFourPointZeroEightPercentMember 2020-02-27 2020-02-27 0000827052 exch:XASE eix:SouthernCaliforniaEdisonCompanyMember eix:CumulativePreferredStockSeriesFourPointThreeTwoPercentMember 2020-02-27 2020-02-27 0000827052 exch:XASE eix:SouthernCaliforniaEdisonCompanyMember eix:CumulativePreferredStockSeriesFourPointTwoFourPercentMember 2020-02-27 2020-02-27 0000827052 exch:XASE eix:SouthernCaliforniaEdisonCompanyMember eix:CumulativePreferredStockSeriesFourPointSevenEightPercentMember 2020-02-27 2020-02-27


UNITED STATES
SECURITIES AND EXCHANGE COMMISSION
Washington, D.C. 20549
________________________

FORM 8-K
________________________

CURRENT REPORT

Pursuant to Section 13 or 15(d) of the Securities Exchange Act of 1934

Date of Report (Date of earliest event reported): February 27, 2020
Commission
File Number
 
Exact Name of Registrant
as specified in its charter
 
State or Other Jurisdiction of
Incorporation or Organization
 
IRS Employer
Identification Number
1-9936
 
EDISON INTERNATIONAL
 
California
 
95-4137452
1-2313
 
SOUTHERN CALIFORNIA EDISON COMPANY
 
California
 
95-1240335

image0a61.jpg
 
image1a71.jpg
2244 Walnut Grove Avenue
 
2244 Walnut Grove Avenue
(P.O. Box 976)
 
(P.O. Box 800)
Rosemead,
California
91770
 
Rosemead,
California
91770
(Address of principal executive offices)
 
(Address of principal executive offices)
(626)
302-2222
 
 
(626)
302-1212
 

(Registrant's telephone number, including area code)
 

(Registrant's telephone number, including area code)


Check the appropriate box below if the Form 8-K filing is intended to simultaneously satisfy the filing obligation of the registrant under any of the following provisions:

[ ] Written communications pursuant to Rule 425 under the Securities Act (17 CFR 230.425)

[ ] Soliciting material pursuant to Rule 14a-12 under the Exchange Act (17 CFR 240.14a-12)

[ ] Pre-commencement communications pursuant to Rule 14d-2(b) under the Exchange Act (17 CFR 240.14d-2(b))

[ ] Pre-commencement communications pursuant to Rule 13e-4(c) under the Exchange Act (17 CFR 240.13e-4(c))

Securities registered pursuant to Section 12(b) of the Act:
Edison International:
Title of each class
Trading Symbol(s)
Name of each exchange on which registered
Common Stock, no par value
EIX
NYSE
LLC
Southern California Edison Company:
Title of each class
Trading Symbol(s)
Name of each exchange on which registered
Cumulative Preferred Stock, 4.08% Series
SCEpB
NYSE American LLC
Cumulative Preferred Stock, 4.24% Series
SCEpC
NYSE American LLC
Cumulative Preferred Stock, 4.32% Series
SCEpD
NYSE American LLC
Cumulative Preferred Stock, 4.78% Series
SCEpE
NYSE American LLC
Indicate by check mark whether the registrant is an emerging growth company as defined in Rule 405 of the Securities Act of 1933 (§230.405 of this chapter) or Rule 12b-2 of the Securities Exchange Act of 1934 (§240.12b-2 of this chapter).
Emerging growth company     
If an emerging growth company, indicate by check mark if the registrant has elected not to use the extended transition period for complying with any new or revised financial accounting standards provided pursuant to Section 13(a) of the Exchange Act.                                                                                          ☐


This current report and its exhibits include forward-looking statements. Edison International and Southern California Edison Company ("SCE") based these forward-looking statements on their current expectations and projections about future events in light of their knowledge of facts as of the date of this current report and their assumptions about future circumstances. These forward-looking statements are subject to various risks and uncertainties that may be outside the control of Edison International and SCE. Edison International and SCE have no obligation to publicly update or revise any forward-looking statements, whether due to new information, future events, or otherwise. This current report should be read with Edison International's and SCE's combined Annual Report on Form 10-K for the year ended December 31, 2019. Additionally, Edison International and SCE provide direct links to EIX and SCE presentations, documents and other information at www.edisoninvestor.com (Events and Presentations) in order to publicly disseminate such information.
Item  2.02
Results of Operations and Financial Condition
On February 27, 2020, Edison International issued a press release reporting its financial results and the financial results for its subsidiary, Southern California Edison Company, for the quarter ended December 31, 2019. A copy of the press release is attached as Exhibit 99.1. On the same day, members of Edison International's management will speak to investors via a financial teleconference. Senior management's prepared remarks and accompanying presentation are attached as Exhibit 99.2 and Exhibit 99.3 to this report. The information furnished in this Item 2.02 and Exhibits 99.1, 99.2, and 99.3 shall not be deemed to be “filed” for purposes of the Securities Exchange Act of 1934, nor shall it be deemed to be incorporated by reference in any filing under the Securities Act of 1933.
Item  7.01
Regulation FD Disclosure
Members of Edison International management will use the information in the presentation furnished as Exhibit 99.3 to this report in meetings with institutional investors and analysts and at investor conferences. The attached presentation will also be posted posted on www.edisoninvestor.com.
Item  9.01
Financial Statements and Exhibits
(d)
Exhibits
EXHIBIT INDEX
Exhibit No.
Description
 
 
99.1


99.2


99.3
 
 
104
Cover Page Interactive Data File (embedded within the Inline XBRL document)


SIGNATURES
Pursuant to the requirements of the Securities Exchange Act of 1934, the registrants have duly caused this report to be signed on its behalf by the undersigned hereunto duly authorized.


EDISON INTERNATIONAL
 
(Registrant)


/s/ Aaron D. Moss
 
Aaron D. Moss
 
Vice President and Controller

Date: February 27, 2020


SOUTHERN CALIFORNIA EDISON COMPANY
 
(Registrant)


/s/ Aaron D. Moss
 
Aaron D. Moss
 
Vice President and Controller

Date: February 27, 2020


Exhibit 99.1

ex9911q3image3a24.jpg
 
NEWS


FOR IMMEDIATE RELEASE        
Investor relations contact:
Sam Ramraj, (626) 302-2540
Media relations contact:
Ron Gales, (626) 302-7927
 

Edison International Reports Fourth Quarter and Full-Year 2019 Results

ROSEMEAD, Calif., February 27, 2020 - Edison International (NYSE: EIX) today reported fourth quarter 2019 net income of $143 million, or $0.40 per share, compared to a net loss of $1.4 billion, or $4.39 loss per share, in the fourth quarter 2018. As adjusted, fourth quarter 2019 core earnings were $355 million, or $0.99 per share, compared to core earnings of $305 million, or $0.94 per share, in the fourth quarter 2018.

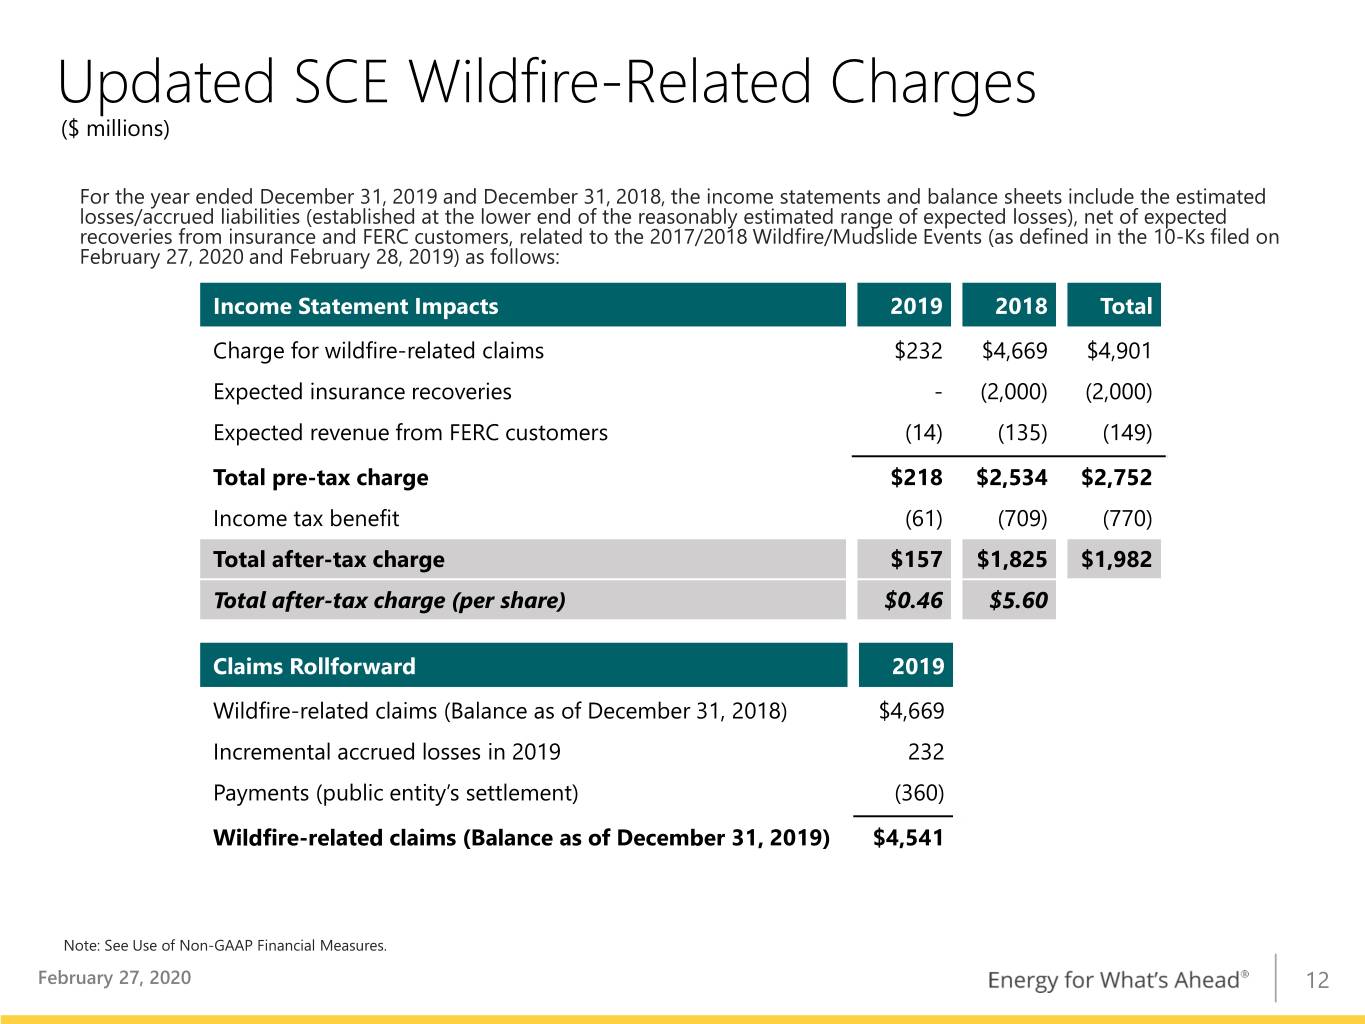
Southern California Edison's (SCE) fourth quarter 2019 net income of $194 million, or $0.54 per share, compared favorably to a net loss of $1.4 billion, or $4.38 loss per share, in the fourth quarter 2018. SCE's fourth quarter 2019 earnings per share (EPS) increased by $4.92 from the prior year period, consisting of $0.07 of higher core EPS and $4.85 of lower non-core loss per share. Higher core EPS was primarily due to the adoption of the 2018 General Rate Case (GRC) final decision and higher Federal Energy Regulatory Commission (FERC) revenue due to the settlement of SCE's 2018 Formula Rate proceeding and rate base growth, partially offset by higher wildfire mitigation expenses that were not deferred as regulatory assets and the increase in shares outstanding in 2019. Lower non-core loss per share was mainly related to the absence of an after-tax charge of $1.8 billion, or $5.60 per share, recorded in the fourth quarter 2018 related to wildfire-related claims associated with the 2017/2018 wildfire events, net of recoveries, and the increase in shares outstanding in 2019. This was partially offset by an after-tax charge of $157 million, or $0.44 per share, recorded in the fourth quarter 2019 related to wildfire-related claims associated with the 2017/2018 wildfire events, net of recoveries, and an after-tax expense of $61 million, or $0.17 per share, related to the amortization of SCE's contributions to the Wildfire Insurance Fund.

Edison International Parent and Other's fourth quarter 2019 net loss of $51 million, or $0.14 loss per share, was higher than a net loss of $35 million, or $0.11 loss per share, reported in the fourth quarter 2018. Edison International Parent and Other’s fourth quarter 2019 loss per share increased by $0.03 compared to fourth quarter 2018, consisting of $0.02 of higher core loss per share and $0.01 of higher non-core loss per share. Higher core loss per share was primarily due to higher interest expense and corporate expenses, partially offset by the increase in shares outstanding in 2019 and the absence of an after-tax goodwill impairment charge of $13 million, or $0.04 per share, on the Edison Energy reporting unit in 2018. The higher non-core loss per share was mainly related to an after-tax goodwill impairment charge of $18 million, or $0.05 per share, on the Edison Energy reporting unit in 2019.

Additionally, Edison International recorded net income of $34 million, or $0.10 per share, from discontinued operations in the fourth quarter 2018.


Edison International Reports Fourth Quarter and Full-Year 2019 Financial Results
Page 2 of 11


“An important part of 2019 was the State’s enactment and initial implementation of Assembly Bill 1054, including SCE’s participation in the Wildfire Fund and receipt of its approved safety certification,” said Pedro J. Pizarro, president and chief executive officer of Edison International. “SCE filed its 2021 General Rate Case which continues our significant investment in wildfire mitigation through grid hardening, increased situational awareness and enhanced operational practices, while investing in transportation electrification and infrastructure replacement. Additionally, through its Pathway 2045 whitepaper, SCE has identified substantial long-term opportunities across California to help meet the state’s 2045 carbon neutrality goal.”
    
Full-Year Earnings

For 2019, Edison International reported net income of $1.3 billion, or $3.78 per share, compared to a net loss of $423 million, or $1.30 loss per share, for 2018. As adjusted, Edison International’s core earnings were $1.6 billion, or $4.70 per share, compared to core earnings of $1.4 billion, or $4.15 per share, in 2018.

SCE's 2019 net income of $1.4 billion, or $4.15 per share, compared favorably to a net loss of $310 million, or $0.95 loss per share, in 2018. SCE's 2019 EPS increased by $5.10 from 2018, consisting of $0.59 of higher core EPS and $4.51 of lower non-core loss per share. Higher core EPS were due to the adoption of the 2018 GRC final decision, higher FERC revenue due to the settlement of SCE's 2018 Formula Rate proceeding and rate base growth, and the timing of regulatory deferral and cost recovery of incremental wildfire insurance expenses. These increases were partially offset by higher wildfire mitigation expenses that were not deferred as regulatory assets and the increase in shares outstanding in 2019. Lower non-core loss per share was mainly related to the absence of an after-tax charge of $1.8 billion, or $5.60 per share, recorded in 2018 related to wildfire-related claims associated with the 2017/2018 wildfire events, net of recoveries, and the increase in shares outstanding in 2019, partially offset by an after-tax charge of $157 million, or $0.46 per share, recorded in 2019 related to wildfire-related claims associated with the 2017/2018 wildfire events, net of recoveries, an after-tax impairment charge of $123 million, or $0.36 per share, related to disallowed historical capital expenditures in the 2018 GRC final decision and an after-tax expense of $109 million, or $0.32 per share, related to the amortization of SCE's contributions to the Wildfire Insurance Fund.

Edison International Parent and Other's 2019 net loss of $125 million, or $0.37 loss per share, compared favorably to a net loss of $147 million, or $0.45 loss per share, reported in 2018. Edison International Parent and Other’s 2019 loss per share decreased by $0.08 compared to 2018, consisting of $0.04 of higher core loss per share and $0.12 of lower non-core loss per share. Higher core loss per share was primarily due to higher interest expense and corporate expenses, partially offset by lower losses from the competitive businesses under Edison Energy Group, the absence of an after-tax goodwill impairment charge recorded in 2018 of $13 million, or $0.04 per share, on the Edison Energy reporting unit and the increase in shares outstanding in 2019. Lower non-core loss per share was primarily due to the absence of a loss recorded in 2018 related to the sale of SoCore Energy, partially offset by an after-tax goodwill impairment charge of $18 million, or $0.06 per share, for Edison Energy reporting unit in 2019.

Additionally, Edison International recorded net income of $34 million, or $0.10 per share, from discontinued operations in 2018.

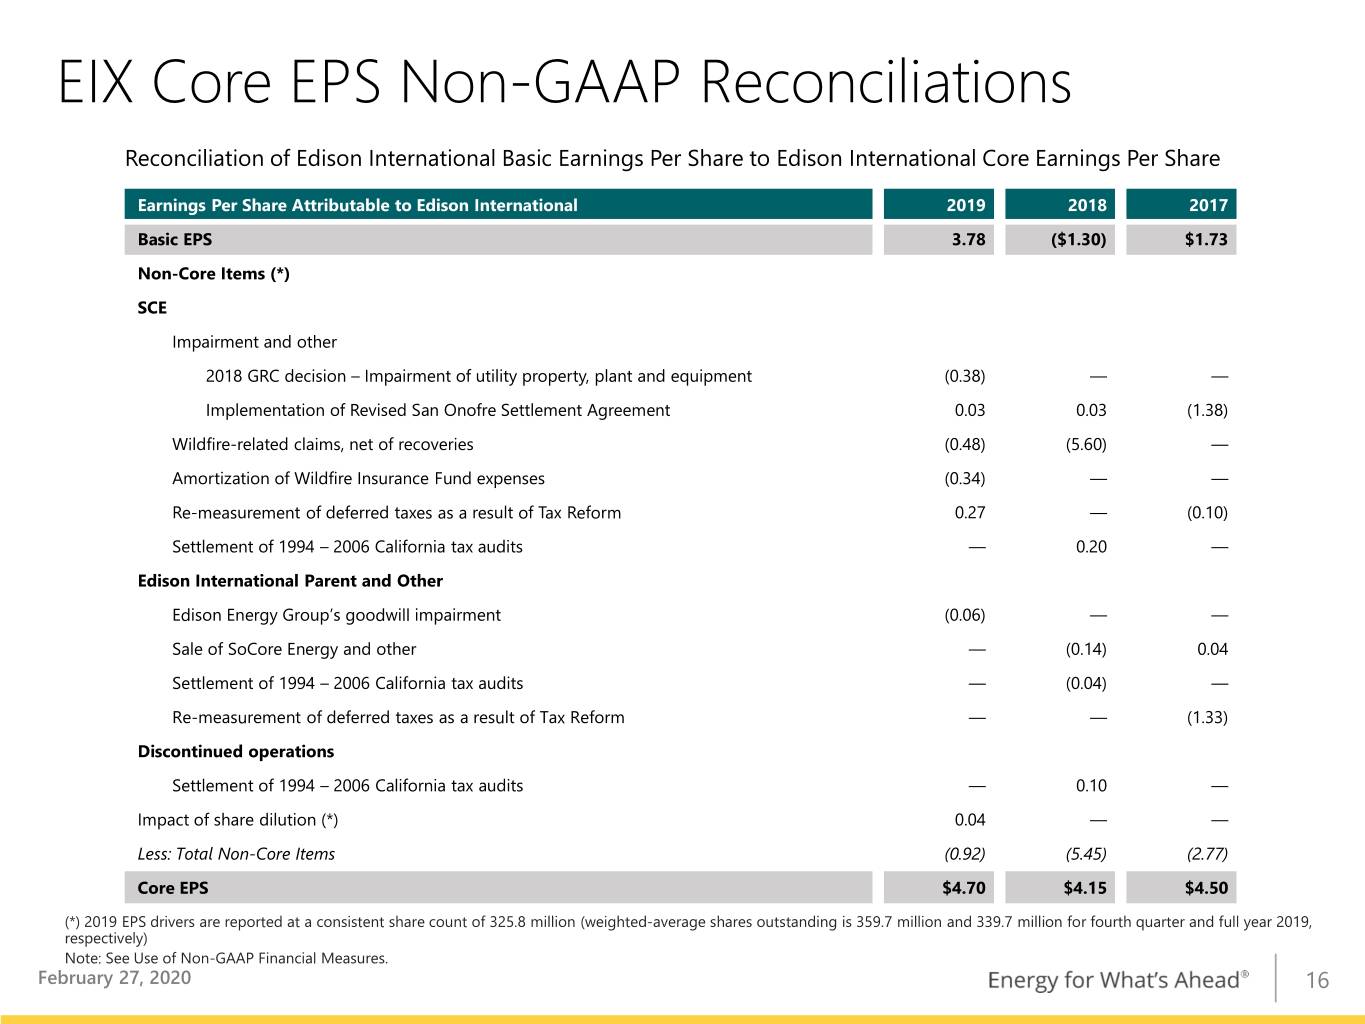
Edison International uses core earnings, which is a non-GAAP financial measure that adjusts for significant discrete items that management does not consider representative of ongoing earnings. Edison International management believes that core earnings provide more meaningful comparisons of performance from period to period. Please see the attached tables for a reconciliation of core earnings to basic GAAP earnings.


Edison International Reports Fourth Quarter and Full-Year 2019 Financial Results
Page 3 of 11


2020 Earnings Guidance

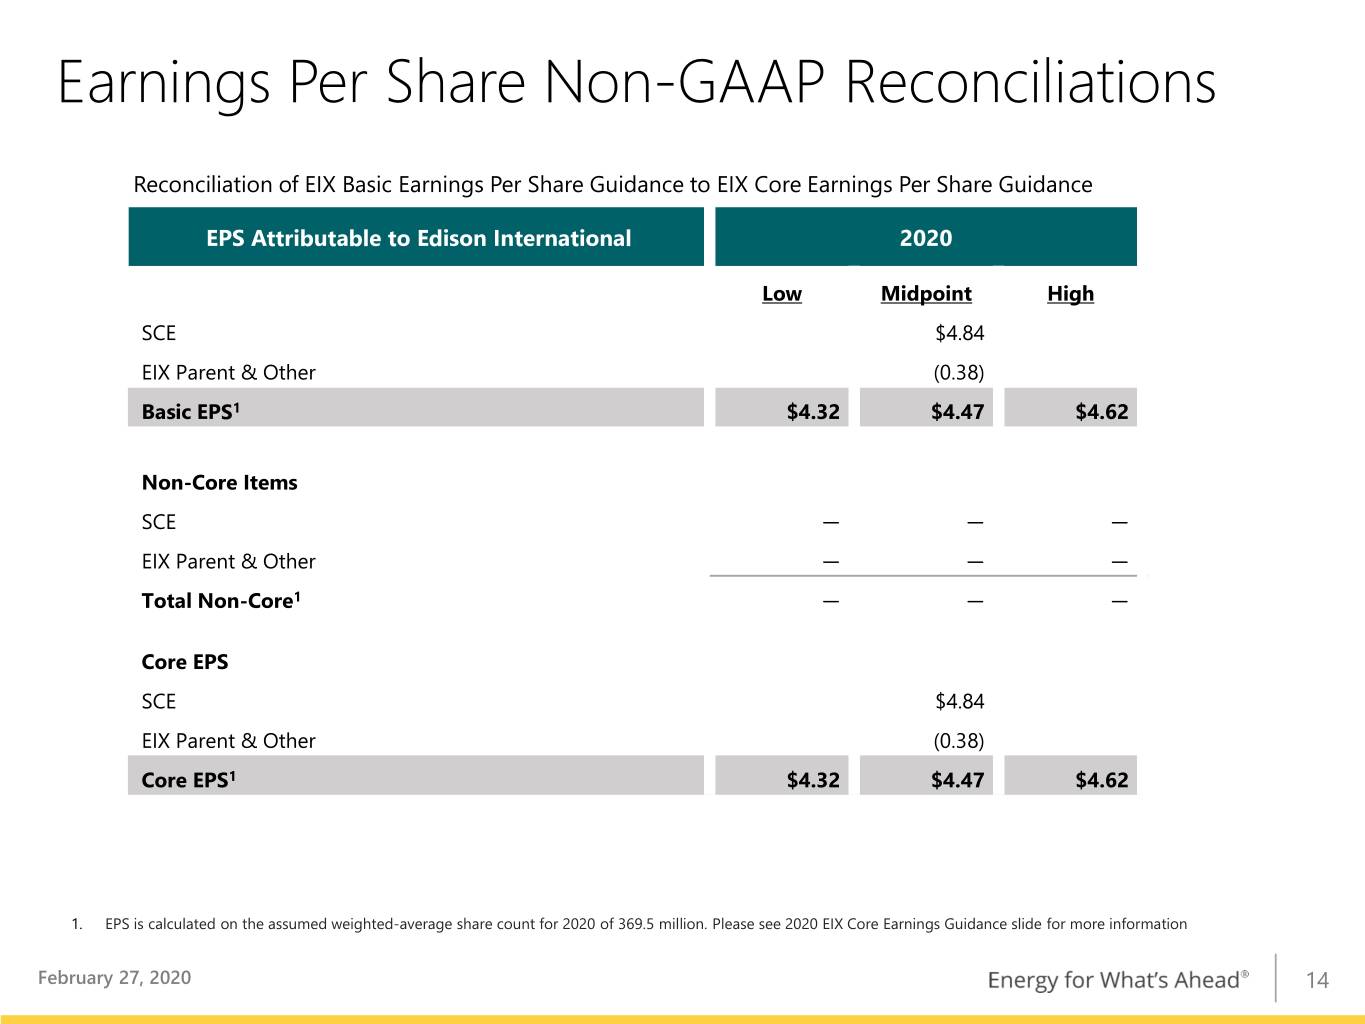
The company announced basic and core earnings guidance of $4.32 to $4.62 per share for 2020. See the presentation accompanying the company’s conference call for further information including key guidance assumptions.

2020 Basic and Core Earnings Guidance
as of February 27, 2020
 
Low
Mid
High
EIX Basic EPS
$4.32
$4.47
$4.62
Less: Non-core Items
-
-
-
EIX Core EPS
$4.32
$4.47
$4.62

Edison International and Southern California Edison Declare Dividends

Today, the Board of Directors of Edison International declared a quarterly common stock dividend of
$0.6375 per share, payable on April 20, 2020, to shareholders of record on March 31, 2020. Additionally, the Board of Directors of Southern California Edison Company today declared dividends on preference and preferred stock. For more information, please see the related press release at www.edisoninvestor.com.

About Edison International

Edison International (NYSE:EIX), through its subsidiaries, is a distributor and generator of electric power, as well as a provider of energy services and technologies, including renewable energy. Headquartered in Rosemead, California, Edison International is the parent company of Southern California Edison, one of the nation’s largest electric utilities. Edison International is also the parent company of Edison Energy, a portfolio of competitive businesses that provide commercial and industrial customers with energy management and procurement services. Edison Energy is independent from Southern California Edison.


Edison International Reports Fourth Quarter and Full-Year 2019 Financial Results
Page 4 of 11


Appendix

Use of Non-GAAP Financial Measures
Edison International’s earnings are prepared in accordance with generally accepted accounting principles used in the United States and represent the company’s earnings as reported to the Securities and Exchange Commission. Our management uses core earnings and core earnings per share (EPS) internally for financial planning and for analysis of performance of Edison International and Southern California Edison. We also use core earnings and core EPS when communicating with analysts and investors regarding our earnings results to facilitate comparisons of the Company’s performance from period to period. Financial measures referred to as net income, basic EPS, core earnings, or core EPS also apply to the description of earnings or earnings per share.
Core earnings and core EPS are non-GAAP financial measures and may not be comparable to those of other companies. Core earnings and core EPS are defined as basic earnings and basic EPS excluding income or loss from discontinued operations and income or loss from significant discrete items that management does not consider representative of ongoing earnings. Basic earnings and losses refer to net income or losses attributable to Edison International shareholders. Core earnings are reconciled to basic earnings in the attached tables. The impact of participating securities (vested awards that earn dividend equivalents that may participate in undistributed earnings with common stock) for the principal operating subsidiary is not material to the principal operating subsidiary’s EPS and is therefore reflected in the results of the Edison International holding company, which is included in Edison International Parent and Other.
Safe Harbor Statement
Statements contained in this presentation about future performance, including, without limitation, operating results, capital expenditures, rate base growth, dividend policy, financial outlook, and other statements that are not purely historical, are forward-looking statements. These forward-looking statements reflect our current expectations; however, such statements involve risks and uncertainties. Actual results could differ materially from current expectations. These forward-looking statements represent our expectations only as of the date of this presentation, and Edison International assumes no duty to update them to reflect new information, events or circumstances. Important factors that could cause different results include, but are not limited to the:
ability of SCE to recover its costs through regulated rates, including costs related to uninsured wildfire-related and mudslide-related liabilities, costs incurred to mitigate the risk of utility equipment causing future wildfires and costs incurred to implement SCE's new customer service system;
ability of SCE to implement its WMP, including effectively implementing Public Safety Power Shut-Offs when appropriate;
ability to obtain sufficient insurance at a reasonable cost, including insurance relating to SCE's nuclear facilities and wildfire-related claims, and to recover the costs of such insurance or, in the event liabilities exceed insured amounts, the ability to recover uninsured losses from customers or other parties;
risks associated with AB 1054 effectively mitigating the significant risk faced by California investor-owned utilities related to liability for damages arising from catastrophic wildfires where utility facilities are alleged to be a substantial cause, including SCE's ability to maintain a valid safety certification, SCE's ability to recover uninsured wildfire-related costs from the Wildfire Insurance Fund, the longevity of the Wildfire Insurance Fund, and the CPUC's interpretation of and actions under AB 1054, including their interpretation of the new prudency standard established under AB 1054;
decisions and other actions by the CPUC, the FERC, the NRC and other regulatory and legislative authorities, including decisions and actions related to determinations of authorized rates of return or return on equity, the recoverability of wildfire-related and mudslide-related costs, issuance of SCE's wildfire safety certification, wildfire mitigation efforts, and delays in regulatory and legislative actions;
ability of Edison International or SCE to borrow funds and access bank and capital markets on reasonable terms;


Edison International Reports Fourth Quarter and Full-Year 2019 Financial Results
Page 5 of 11


risks associated with the decommissioning of San Onofre, including those related to public opposition, permitting, governmental approvals, on-site storage of spent nuclear fuel, delays, contractual disputes, and cost overruns;
extreme weather-related incidents and other natural disasters (including earthquakes and events caused, or exacerbated, by climate change, such as wildfires), which could cause, among other things, public safety issues, property damage and operational issues;
physical security of Edison International's and SCE's critical assets and personnel and the cybersecurity of Edison International's and SCE's critical information technology systems for grid control, and business, employee and customer data;
risks associated with cost allocation resulting in higher rates for utility bundled service customers because of possible customer bypass or departure for other electricity providers such as CCAs and Electric Service Providers;
risks inherent in SCE's transmission and distribution infrastructure investment program, including those related to project site identification, public opposition, environmental mitigation, construction, permitting, power curtailment costs (payments due under power contracts in the event there is insufficient transmission to enable acceptance of power delivery), changes in the CAISO's transmission plans, and governmental approvals; and
risks associated with the operation of transmission and distribution assets and power generating facilities, including public and employee safety issues, the risk of utility assets causing or contributing to wildfires, failure, availability, efficiency, and output of equipment and facilities, and availability and cost of spare parts.

Additional information about risks and uncertainties, including more detail about the factors described in this report, is contained throughout this report and in the 2019 Form 10-K, including the "Risk Factors" section. Readers are urged to read this entire report, including information incorporated by reference, as well as the 2019 Form 10-K, and carefully consider the risks, uncertainties, and other factors that affect Edison International's and SCE's businesses. Edison International and SCE post or provide direct links (i) to certain SCE and other parties' regulatory filings and documents with the CPUC and the FERC and certain agency rulings and notices in open proceedings in a section titled "SCE Regulatory Highlights," (ii) to certain documents and information related to Southern California wildfires which may be of interest to investors in a section titled "Southern California Wildfires," and (iii) to presentations, documents and other information that may be of interest to investors in a section title "Events and Presentations" at www.edisoninvestor.com in order to publicly disseminate such information.
These forward-looking statements represent our expectations only as of the date of this news release, and Edison International assumes no duty to update them to reflect new information, events or circumstances. Readers should review future reports filed by Edison International and SCE with the SEC.
Reminder: Edison International Will Hold a Conference Call Today
When:    Thursday, February 27, 2020, 1:30 p.m. (Pacific Time)
Telephone Numbers:    1-888-673-9780 (US) and 1-312-470-0178 (Int'l) - Passcode: Edison
Telephone Replay:    1-866-396-7644 (US) and 1-203-369-0527 (Int’l) - Passcode: 5284
Telephone replay available through March 12, 2020
Webcast:     www.edisoninvestor.com


Edison International Reports Fourth Quarter and Full-Year 2019 Financial Results
Page 6 of 11


Fourth Quarter and Full-Year Reconciliation of Basic Earnings Per Share to Core Earnings Per Share
 
Three months ended December 31,


Twelve months ended December 31,


2019
 
2018
 
Change
 
2019
 
2018
 
Change
Earnings (loss) per share attributable to Edison International


Continuing operations


SCE
$
0.54

 
$
(4.38
)
 
$
4.92

 
$
4.15

 
$
(0.95
)
 
$
5.10

Edison International Parent and Other
(0.14
)
 
(0.11
)
 
(0.03
)
 
(0.37
)
 
(0.45
)
 
0.08

Discontinued operations

 
0.10

 
(0.10
)


0.10

 
(0.10
)
Edison International
0.40

 
(4.39
)
 
4.79

 
3.78

 
(1.30
)
 
5.08

Less: Non-core items


     SCE
(0.54
)
 
(5.39
)
 
4.85

 
(0.86
)
 
(5.37
)
 
4.51

     Edison International Parent and Other
(0.05
)
 
(0.04
)
 
(0.01
)
 
(0.06
)
 
(0.18
)
 
0.12

     Discontinued operations

 
0.10

 
(0.10
)


0.10

 
(0.10
)
Total non-core items
(0.59
)
 
(5.33
)
 
4.74

 
(0.92
)
 
(5.45
)
 
4.53

Core earnings (losses)


SCE
1.08

 
1.01

 
0.07

 
5.01

 
4.42

 
0.59

Edison International Parent and Other
(0.09
)
 
(0.07
)
 
(0.02
)
 
(0.31
)
 
(0.27
)
 
(0.04
)
Edison International
$
0.99

 
$
0.94

 
$
0.05

 
$
4.70

 
$
4.15

 
$
0.55

Note: Diluted earnings were $0.40 and $(4.39) per share for the three months ended December 31, 2019 and 2018, respectively, and $3.77 and $(1.30) per share for the twelve months ended December 31, 2019 and 2018, respectively.

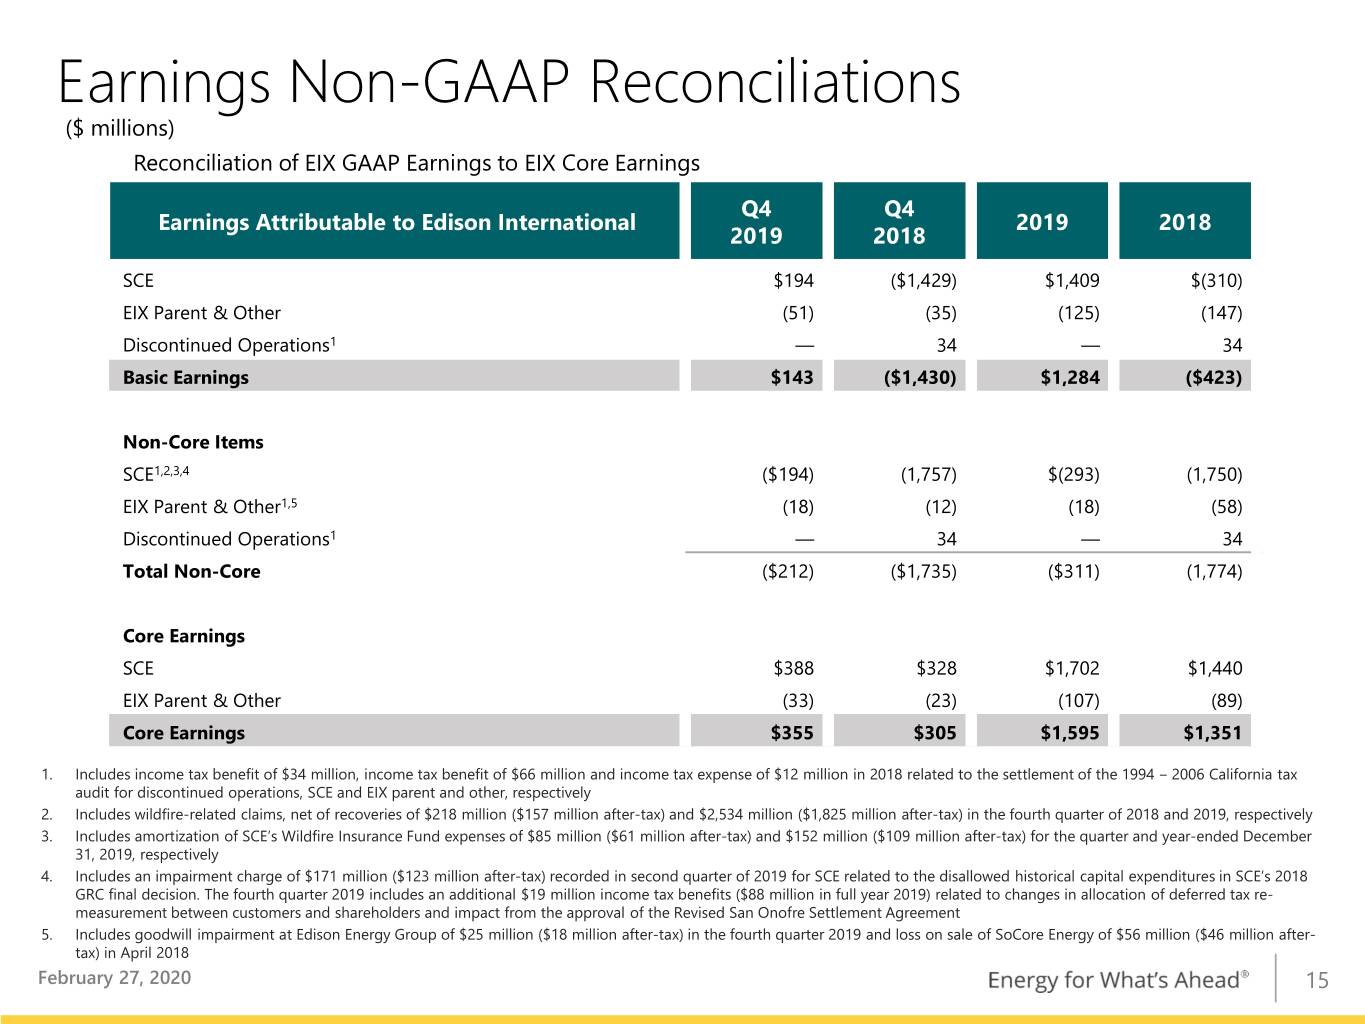
Fourth Quarter and Full-Year Reconciliation of Basic Earnings to Core Earnings (in millions)
 
Three months ended December 31,


Twelve months ended December 31,
 
 
(in millions)
2019
 
2018
 
Change
 
2019
 
2018
 
Change
Net income (loss) attributable to Edison International


Continuing operations


SCE
$
194

 
$
(1,429
)
 
$
1,623

 
$
1,409

 
$
(310
)
 
$
1,719

Edison International Parent and Other
(51
)
 
(35
)
 
(16
)
 
(125
)
 
(147
)
 
22

Discontinued operations

 
34

 
(34
)


34

 
(34
)
Edison International
143

 
(1,430
)
 
1,573

 
1,284

 
(423
)
 
1,707

Less: Non-core items


     SCE1,2,3,4
(194
)
 
(1,757
)
 
1,563

 
(293
)
 
(1,750
)
 
1,457

     Edison International Parent and Other1,5
(18
)
 
(12
)
 
(6
)
 
(18
)
 
(58
)
 
40

     Discontinued operations1

 
34

 
(34
)


34

 
(34
)
Total non-core items
(212
)
 
(1,735
)
 
1,523

 
(311
)
 
(1,774
)
 
1,463

Core earnings (losses)


SCE
388

 
328

 
60

 
1,702

 
1,440

 
262

Edison International Parent and Other
(33
)
 
(23
)
 
(10
)
 
(107
)
 
(89
)
 
(18
)
Edison International
$
355

 
$
305

 
$
50

 
$
1,595

 
$
1,351

 
$
244


1 
Includes income tax benefit of $34 million, income tax benefit of $66 million and income tax expense of $12 million in 2018 related to the settlement of the 1994 ‒ 2006 California tax audit for discontinued operations, SCE and EIX parent and other, respectively.
2 
Includes wildfire-related claims, net of recoveries of $218 million ($157 million after-tax) and $2,534 million ($1,825 million after-tax) in the fourth quarter of 2018 and 2019, respectively.


Edison International Reports Fourth Quarter and Full-Year 2019 Financial Results
Page 7 of 11


3 
Includes amortization of SCE’s Wildfire Insurance Fund expenses of $85 million ($61 million after-tax) and $152 million ($109 million after-tax) for the quarter and year-ended December 31, 2019, respectively.
4 
Includes an impairment charge of $171 million ($123 million after-tax) recorded in second quarter of 2019 for SCE related to the disallowed historical capital expenditures in SCE’s 2018 GRC final decision. The fourth quarter 2019 includes an additional $19 million income tax benefits ($88 million in full year 2019) related to changes in allocation of deferred tax re-measurement between customers and shareholders and impact from the approval of the Revised San Onofre Settlement Agreement.
5 
Includes goodwill impairment at Edison Energy Group of $25 million ($18 million after-tax) in the fourth quarter 2019 and loss on sale of SoCore Energy of $56 million ($46 million after-tax) in April 2018.


Edison International Reports Fourth Quarter and Full-Year 2019 Financial Results
Page 8 of 11


Consolidated Statements of Income
 
 
Edison International


Three months ended December 31,
 
Twelve months ended December 31,
(in millions, except per-share amounts, unaudited)
)
2019

2018
 
2019
 
2018
Total operating revenue
$
2,970

 
$
3,009

 
$
12,347

 
$
12,657

Purchased power and fuel
991

 
1,062

 
4,839

 
5,406

Operation and maintenance
760

 
729

 
3,018

 
2,797

Wildfire-related claims, net of insurance recoveries
262

 
2,669

 
255

 
2,669

Wildfire insurance fund expense
85


152


Depreciation and amortization
470

 
480

 
1,730

 
1,871

Property and other taxes
97

 
94

 
399

 
395

Impairment and other
18

 
18

 
184

 
78

Other operating income

 
(2
)
 
(5
)
 
(7
)
Total operating expenses
2,683

 
5,050

 
10,572

 
13,209

Operating income (loss)
287

 
(2,041
)
 
1,775

 
(552
)
Interest expense
(222
)
 
(196
)
 
(841
)
 
(734
)
Other income
42

 
21

 
193

 
197

Income (loss) from continuing operations before income taxes
107

 
(2,216
)
 
1,127

 
(1,089
)
Income tax (benefit)
(66
)
 
(782
)
 
(278
)
 
(739
)
Income (loss) from continuing operations
173

 
(1,434
)
 
1,405

 
(350
)
Income from discontinued operations, net of tax

 
34


34

Net income (loss)
173

 
(1,400
)
 
1,405

 
(316
)
Preferred and preference stock dividend requirements of SCE
30

 
30

 
121

 
121

Other noncontrolling interests


(14
)
Net income (loss) attributable to Edison International common shareholders
$
143

 
$
(1,430
)
 
$
1,284

 
$
(423
)
Amounts attributable to Edison International common shareholders:


Income (loss) from continuing operations, net of tax
$
143

 
$
(1,464
)
 
$
1,284

 
$
(457
)
Income from discontinued operations, net of tax

 
34


34

Net income attributable to Edison International common shareholders
$
143

 
$
(1,430
)
 
$
1,284

 
$
(423
)
Basic earnings (loss) per common share attributable to Edison International common shareholders:


Weighted average shares of common stock outstanding
360

 
326

 
340

 
326

Continuing operations
$
0.40

 
$
(4.49
)
 
$
3.78

 
$
(1.40
)
Discontinued operations

 
0.10


0.10

Total
$
0.40

 
$
(4.39
)
 
$
3.78

 
$
(1.30
)
Diluted earnings (loss) per common share attributable to Edison International common shareholders:


Weighted average shares of common stock outstanding, including effect of dilutive securities
361

 
326

 
341

 
326

Continuing operations
$
0.40

 
$
(4.49
)
 
$
3.77

 
$
(1.40
)
Discontinued operations

 
0.10


0.10

Total
$
0.40

 
$
(4.39
)
 
$
3.77

 
$
(1.30
)


Edison International Reports Fourth Quarter and Full-Year 2019 Financial Results
Page 9 of 11


Consolidated Balance Sheets
Edison International


(in millions, unaudited)
December 31,
2019

December 31, 2018
ASSETS


Cash and cash equivalents
$
68

 
$
144

Receivables, less allowances of $50 and $52 for uncollectible accounts at respective dates
788

 
730

Accrued unbilled revenue
488

 
482

Inventory
364

 
282

Income tax receivables
118

 
191

Prepaid expenses
214

 
148

Derivative assets
81

 
171

Regulatory assets
1,009

 
1,133

Wildfire Insurance Fund contributions
323


Other current assets
107

 
78

Total current assets
3,560

 
3,359

Nuclear decommissioning trusts
4,562

 
4,120

Other investments
64

 
63

Total investments
4,626

 
4,183

Utility property, plant and equipment, less accumulated depreciation and amortization of $9,958 and $9,566 at respective dates
44,198

 
41,269

Nonutility property, plant and equipment, less accumulated depreciation of $86 and $82 at respective dates
87

 
79

Total property, plant and equipment
44,285

 
41,348

Regulatory assets
6,088

 
5,380

Wildfire Insurance Fund contributions
2,767


Operating lease right-of-use assets
693


Other long-term assets
2,363

 
2,445

Total long-term assets
11,911

 
7,825


Total assets
$
64,382

 
$
56,715


Edison International Reports Fourth Quarter and Full-Year 2019 Financial Results
Page 10 of 11


Consolidated Balance Sheets
Edison International


(in millions, except share amounts, unaudited)
December 31,
2019
 
December 31, 2018
LIABILITIES AND EQUITY


Short-term debt
$
550

 
$
720

Current portion of long-term debt
479

 
79

Accounts payable
1,752

 
1,511

Customer deposits
302

 
299

Regulatory liabilities
972

 
1,532

Current portion of operating lease liabilities
80


Other current liabilities
1,388

 
1,254

Total current liabilities
5,523

 
5,395

Long-term debt
17,864

 
14,632

Deferred income taxes and credits
5,078

 
4,576

Pensions and benefits
674

 
869

Asset retirement obligations
3,029

 
3,031

Regulatory liabilities
8,385

 
8,329

Operating lease liabilities
613


Wildfire-related claims
4,568

 
4,669

Other deferred credits and other long-term liabilities
3,152

 
2,562

Total deferred credits and other liabilities
25,499

 
24,036

Total liabilities
48,886

 
44,063

Commitments and contingencies


Common stock, no par value (800,000,000 shares authorized; 361,985,133 and 325,811,206 shares issued and outstanding at respective dates)
4,990

 
2,545

Accumulated other comprehensive loss
(69
)
 
(50
)
Retained earnings
8,382

 
7,964

Total Edison International's common shareholders' equity
13,303

 
10,459

Noncontrolling interests – preferred and preference stock of SCE
2,193

 
2,193

Total equity
15,496

 
12,652


Total liabilities and equity
$
64,382

 
$
56,715


Edison International Reports Fourth Quarter and Full-Year 2019 Financial Results
Page 11 of 11


Consolidated Statements of Cash Flows
Edison International


Twelve months ended December 31,
(in millions, unaudited)
2019
 
2018
 
2017
Cash flows from operating activities:


Net income (loss)
$
1,405

 
$
(316
)
 
$
668

Adjustments to reconcile to net cash provided by operating activities:


Depreciation and amortization
1,803

 
1,940

 
2,115

Allowance for equity during construction
(101
)
 
(104
)
 
(87
)
Impairment and other
184

 
78

 
738

Deferred income taxes
(284
)
 
(527
)
 
498

Wildfire Insurance Fund amortization expense
152


Other
29

 
35

 
34

Nuclear decommissioning trusts
(106
)
 
(109
)
 
(197
)
Contributions to Wildfire Insurance Fund
(2,457
)


Changes in operating assets and liabilities:


Receivables
(76
)
 
(39
)
 
6

Inventory
(83
)
 
(49
)
 
(12
)
Accounts payable
288

 
(31
)
 
50

Tax receivables and payables
88

 
32

 
(250
)
Other current assets and liabilities
(13
)
 
(79
)
 
7

Regulatory assets and liabilities, net
(1,278
)
 
(92
)
 
4

Other noncurrent assets and liabilities
(42
)
 
(197
)
 
23

Net cash (used in) provided by operating activities
(307
)
 
3,177

 
3,597

Cash flows from financing activities:


Long-term debt issued or remarketed, net of premium, discount and issuance costs of $4, $63 and $2 for the respective years
3,696

 
3,237

 
2,233

Long-term debt repaid
(82
)
 
(654
)
 
(1,285
)
Term loan issued
1,750


Term loan repaid
(1,750
)


Common stock issued
2,391


Preference stock issued, net


462

Preference stock redeemed


(475
)
Short-term debt financing, net
(172
)
 
(1,611
)
 
1,084

Payments for stock-based compensation
(64
)
 
(46
)
 
(393
)
Receipts from stock option exercises
58

 
26

 
215

Dividends and distribution to noncontrolling interests
(121
)
 
(121
)
 
(125
)
Dividends paid
(810
)
 
(788
)
 
(707
)
Other
7

 
39

 
(2
)
Net cash provided by financing activities
4,903

 
82

 
1,007

Cash flows from investing activities:


Capital expenditures
(4,877
)
 
(4,509
)
 
(3,844
)
Proceeds from sale of nuclear decommissioning trust investments
4,389

 
4,340

 
5,239

Purchases of nuclear decommissioning trust investments
(4,283
)
 
(4,231
)
 
(5,042
)
Proceeds from sale of SoCore Energy, net of cash acquired by buyer

 
78


Other
93

 
83

 
61

Net cash used in investing activities
(4,678
)
 
(4,239
)
 
(3,586
)
Net (decrease) increase in cash, cash equivalents and restricted cash
(82
)
 
(980
)
 

Cash, cash equivalents and restricted cash at beginning of year
152

 
1,132

 
114

Cash, cash equivalents and restricted cash at end of year
$
70

 
$
152

 
114


Exhibit 99.2


Prepared Remarks of Edison International CEO and CFO
Fourth Quarter 2019 Earnings Teleconference
February 27, 2020, 1:30 p.m. (PST)


Pedro Pizarro, President and Chief Executive Officer, Edison International
Today, Edison International reported core EPS of $4.70 for 2019 compared to $4.15 a year ago. The increase in core EPS was primarily due to the approval of the 2018 General Rate Case and higher FERC revenues. This was partially offset by higher wildfire mitigation costs and an increase in the number of shares outstanding. Maria will discuss our financial performance in more detail during her remarks.
We believe that SCE and California are beginning 2020 with a very different wildfire risk profile than the previous two years. Edison particularly commends the State’s efforts on wildfire suppression and the improved coordination among utility, state and local emergency management personnel. Also, the State’s enactment of Assembly Bill 1054 had a stabilizing effect on the financial health of California’s investor-owned utilities.
We have been pleased with the continued implementation of the AB 1054 regulatory framework. This includes the issuance of our safety certification last year, the appointments to the new California Catastrophe Response Council and Wildfire Safety Advisory Board, and our recently filed 2020-2022 Wildfire Mitigation Plan. We also are encouraged by the CPUC’s timely approval of SCE’s 2020 Cost of Capital application and the proposed schedule for SCE’s 2021 General Rate Case. However, much work remains to be done. For SCE, this particularly means obtaining decisions on outstanding proceedings at the CPUC. This includes the Grid Safety and Resiliency Program settlement, SCE’s Wildfire Expense Memorandum Account application, the capital structure waiver application related to the accounting for our 2017 and 2018 charges, and the litigation of the various phases of SCE’s 2021 GRC application. Additionally, in 2020, SCE expects to continue to work with legislators, regulators and communities to improve public safety power shutoff, or PSPS, related operations. At the same time, we are moving forward with our vision for a sustainable and clean energy future. I will discuss more about this later.

1


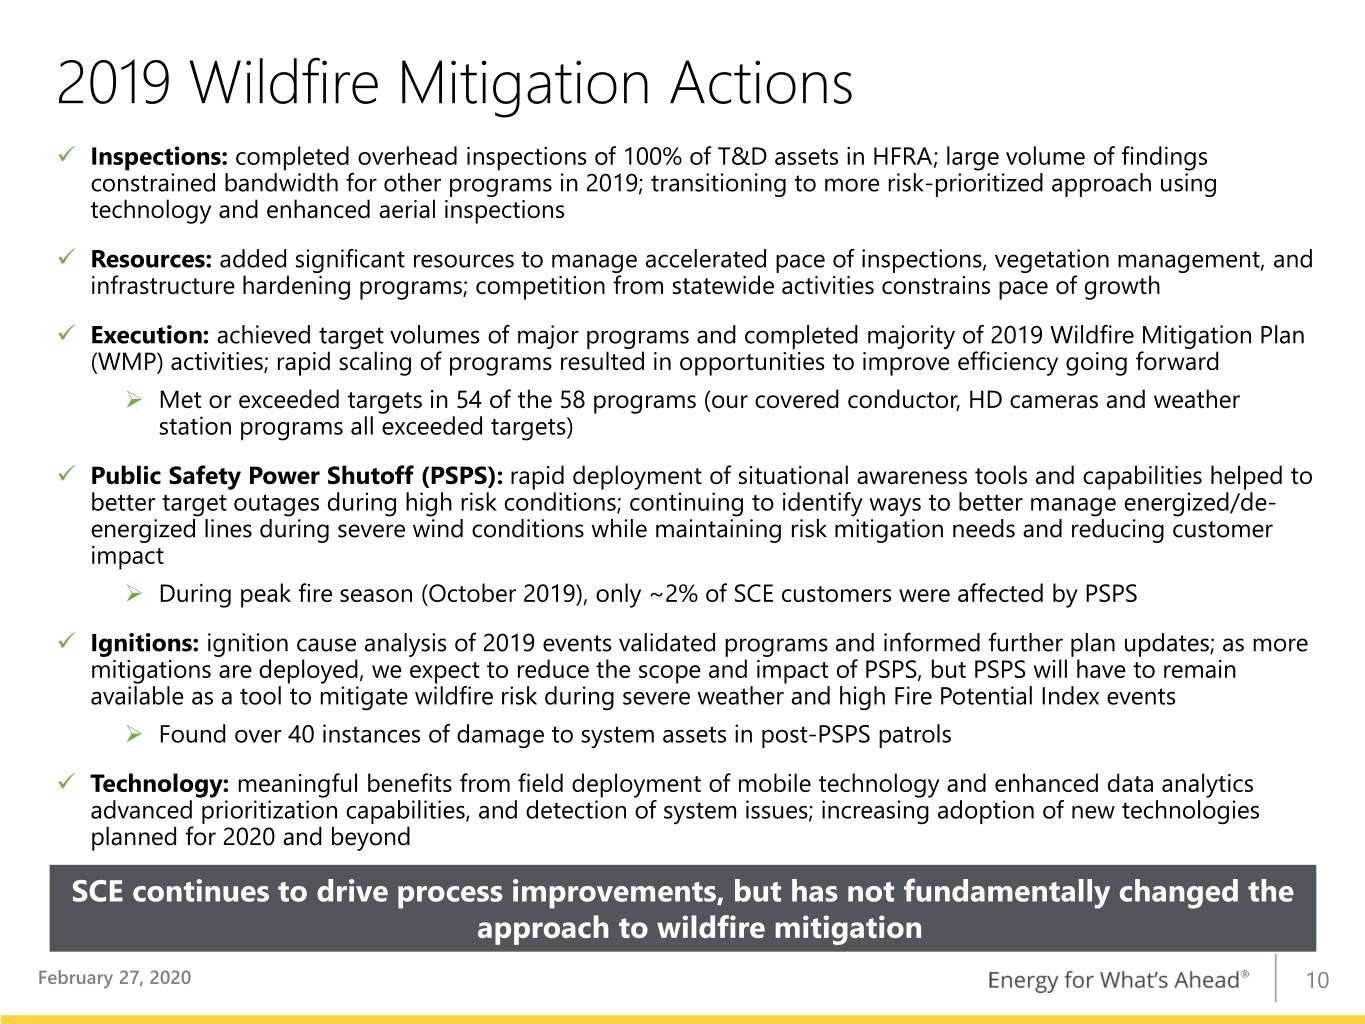
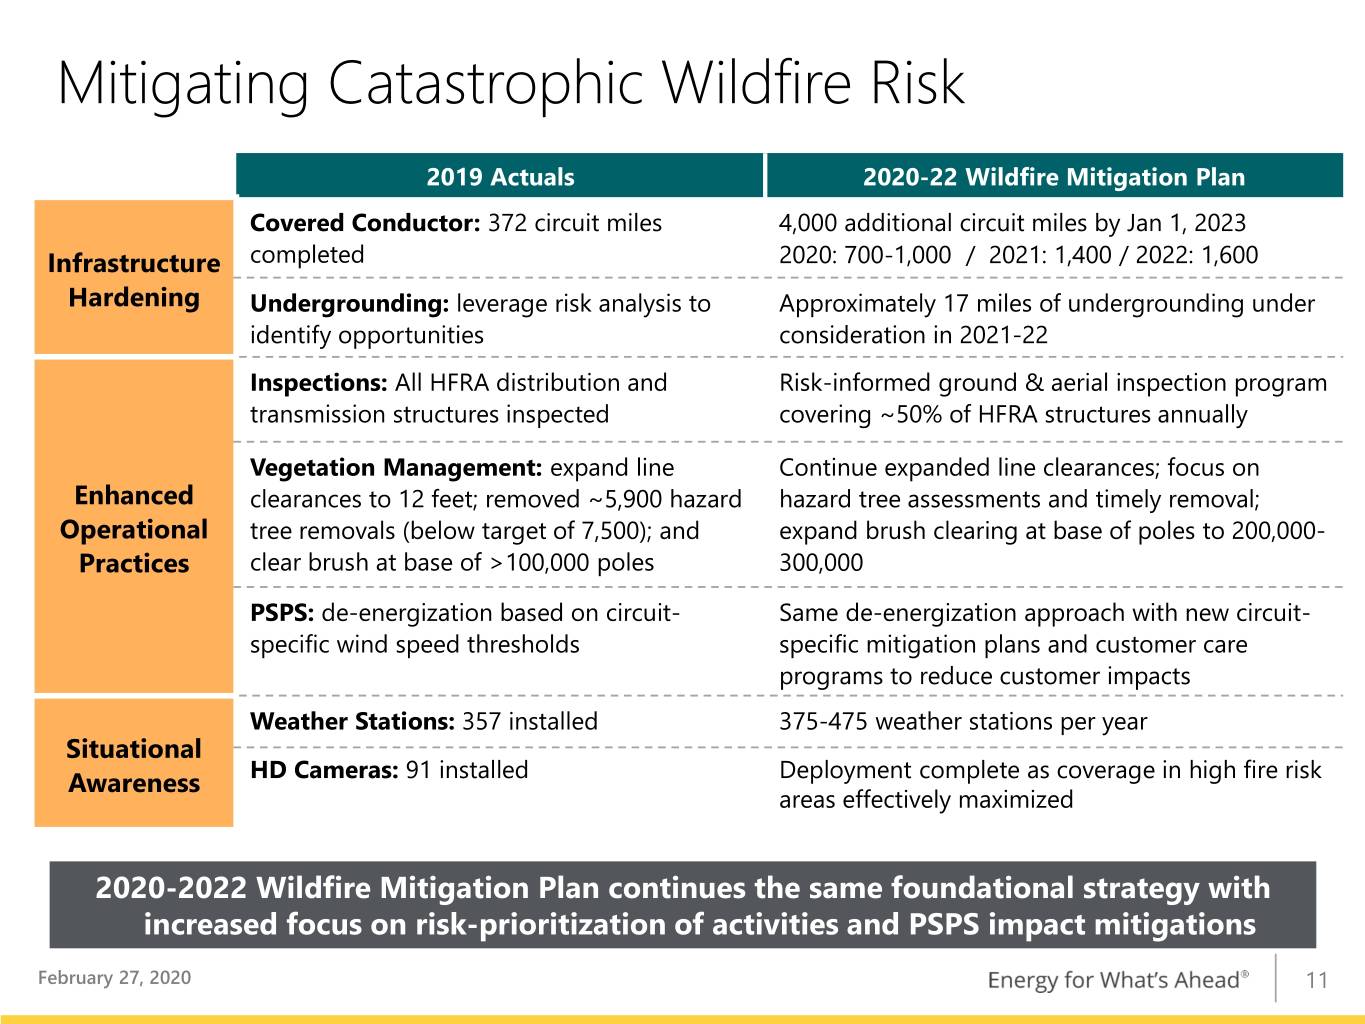
This past year, SCE aggressively executed the comprehensive wildfire mitigation strategy laid out in our Grid Safety and Resiliency Program and 2019 Wildfire Mitigation Plan. Since 2018, SCE has installed more than 500 miles of covered conductor, over 480 micro weather stations and more than 160 high-definition cameras covering 90 percent of high fire risk areas, reaching our effective saturation point for cameras. We were able to go beyond the compliance targets in our 2019 WMP in many areas as we work to reduce wildfire risk as quickly as possible. We also completed enhanced inspection of all of our overhead infrastructure in our high fire risk areas during the first five months of the year. In the past, this would have been performed over a five-year period.
SCE’s recently filed 2020-2022 Wildfire Mitigation Plan will advance our risk-prioritization approach. This plan includes ground-based and aerial inspections for higher-risk transmission and distribution assets beyond standard inspection cycles, building on the lessons learned from our comprehensive enhanced overhead inspection program in 2019. The plan also calls for us to further harden infrastructure, bolster situational awareness capabilities and enhance operational practices while harnessing data analytics and technology. The plan includes specific metrics that provide transparency to the public and other stakeholders and will enable the CPUC to evaluate SCE’s performance. In our filing, SCE has proposed spending approximately $3.8 billion in capital and O&M over the 3-year plan period.
Last October, parts of our service territory faced many days of elevated wildfire threat conditions marked by severe winds, low humidity and dry fuel. During these periods, SCE exercised our PSPS protocols to protect the public from the risk of electric equipment causing a fire. Patrols conducted after those PSPS events found over 40 impacts from the severe conditions, including equipment damage and tree branches contacting power lines. This further validated the importance of preventive de-energization as a safety measure under severe weather conditions.
SCE understands that PSPS can be a hardship for our customers and communities. We utilized an extensive community outreach effort to help customers prepare for these events. We have learned from these experiences and are working to improve our wildfire mitigation and

2


PSPS resilience capabilities. Our number one priority continues to be the safety of the public, our customers, employees and first responders. SCE has also spent significant time educating customers, communities, and state and local government officials on our PSPS-related efforts to demonstrate the vast amount of work and data analysis that go into our decision-making on PSPS events. As more mitigations are deployed, we expect to reduce the scope and impact of PSPS, but PSPS will have to remain available as a tool to mitigate wildfire risk during severe weather and high Fire Potential Index events.
I would now like to give you an update on our accounting reserve related to the 2017 and 2018 wildfire and mudslide events. You will recall that in the fourth quarter of 2018, SCE recorded a gross liability of $4.7 billion for the low end of the estimable loss range for these events. We regularly re-assess this reserve, which includes our internal assessment of damage estimates, known and expected third-party claims, litigation proceedings and risks, and prior experience litigating and settling wildfire related claims.
In our latest assessment, we increased the estimated losses for claims related to the 2017 and 2018 wildfire and mudslide events by $232 million to a gross estimate of $4.9 billion. While this estimate is determined on an aggregate basis, some of the factors we evaluated in connection with the review contributed to a significant increase in certain loss estimates, while others contributed to a significant decrease. Also, we lowered our accrued liabilities by the $360 million settlement reached in the fourth quarter with a number of local public entities. These changes led to a revised pre-tax accrued liability of $4.5 billion for the 2017 and 2018 wildfire and mudslide events. After adjusting this gross liability for $1.6 billion of remaining insurance coverage and $149 million for a FERC regulatory asset, the net after-tax charge for these events is $1.98 billion, which is an increase of $157 million from our previous estimate.
I would now like to provide an update on our operational and service excellence efforts and a few of the key non-financial metrics our Board uses in measuring our performance. Operational and service excellence starts with the safety of our workers and our communities. This is a major priority across our company and is at the top of our core values. Our 2019 performance on worker safety had mixed results. While we did not have any employee fatalities,

3


there were three worker fatalities among our contractor workforce. The number of serious SCE employee injuries in 2019 fell by more than 50 percent from 2018, but our rate of injuries leading to days away, on restricted duty, or transferred – known as the “DART” rate – was worse than our target. We did, however, successfully complete an enterprise-wide safety culture training program that has received strong reviews from our employees and lays a foundation for long-term improvement.
Our goals related to improving public safety are tied to the implementation of the wildfire resiliency measures outlined in our GSRP and 2019 Wildfire Mitigation Plan. We made significant progress in these areas as I discussed earlier. Among other key measures, our customer satisfaction and system reliability fell short of our targets. Our performance was heavily impacted by maintenance and repair activities related to wildfire mitigation, the installation of new equipment to harden our electric system, and PSPS de-energizations to safeguard our communities during dangerous fire weather conditions.
We also deployed additional digital technologies to transform processes across our business and improve the quality and efficiency of our operations. For example, we rolled out new mobile solutions to support our enhanced overhead inspections and used robotic process automation to improve outage notification to customers.
We continued our focus on sustainability, particularly on addressing climate change. We are committed to delivering 60 percent renewable power by 2030 and 100 percent clean energy by 2045, which are among the most aggressive targets in the industry. Last quarter, I announced the release of our Pathway 2045 white paper, which shows the changes required across California’s economy to meet the state’s 2045 carbon neutrality goals will be profound. We are focused on doing our part, such as accelerating transportation electrification. Today, SCE is implementing the largest electric truck and transit utility initiative in the nation by installing charging infrastructure to support approximately 8,500 medium- and heavy-duty vehicles at 870 sites by 2024, through our $356 million Charge Ready Transport program. We are also awaiting CPUC approval for our $750 million Charge Ready 2 application that will support over 50,000 passenger vehicle chargers. We believe this is just a fraction of the new technologies and

4


infrastructure that will be needed to support California’s economy in the years ahead, which further underscores the need for resilient and financially strong utilities.
To conclude, we are making significant investments over the near-term in grid hardening and resiliency. At the same time, we continue to see significant long-term investment opportunities in our business related to addressing California’s 2045 climate goals. We have a robust capital program over the next few years that, if approved, will invest more than $5 billion annually on infrastructure replacement, transportation electrification, transmission infrastructure and wildfire mitigation.
As you can see, we have a continuing focus on safety and resiliency, operational excellence and strategic advancement of policy objectives. Our near-term priorities to improve safety and mitigate wildfire risk will enable the reliable and resilient grid that is needed to accelerate toward the state’s clean energy goals and achieve our Pathway 2045 vision for California, including increased use of zero-carbon resources and broad electrification of the economy.

Maria Rigatti, Executive Vice President and Chief Financial Officer, Edison International
My comments today will cover fourth quarter and full year 2019 results, our capital expenditure and rate base forecast, 2020 EPS guidance and financing framework. As we have said, year-over-year comparisons for 2019 are less meaningful given the timing of the 2018 GRC decision.
Please turn to page 2.
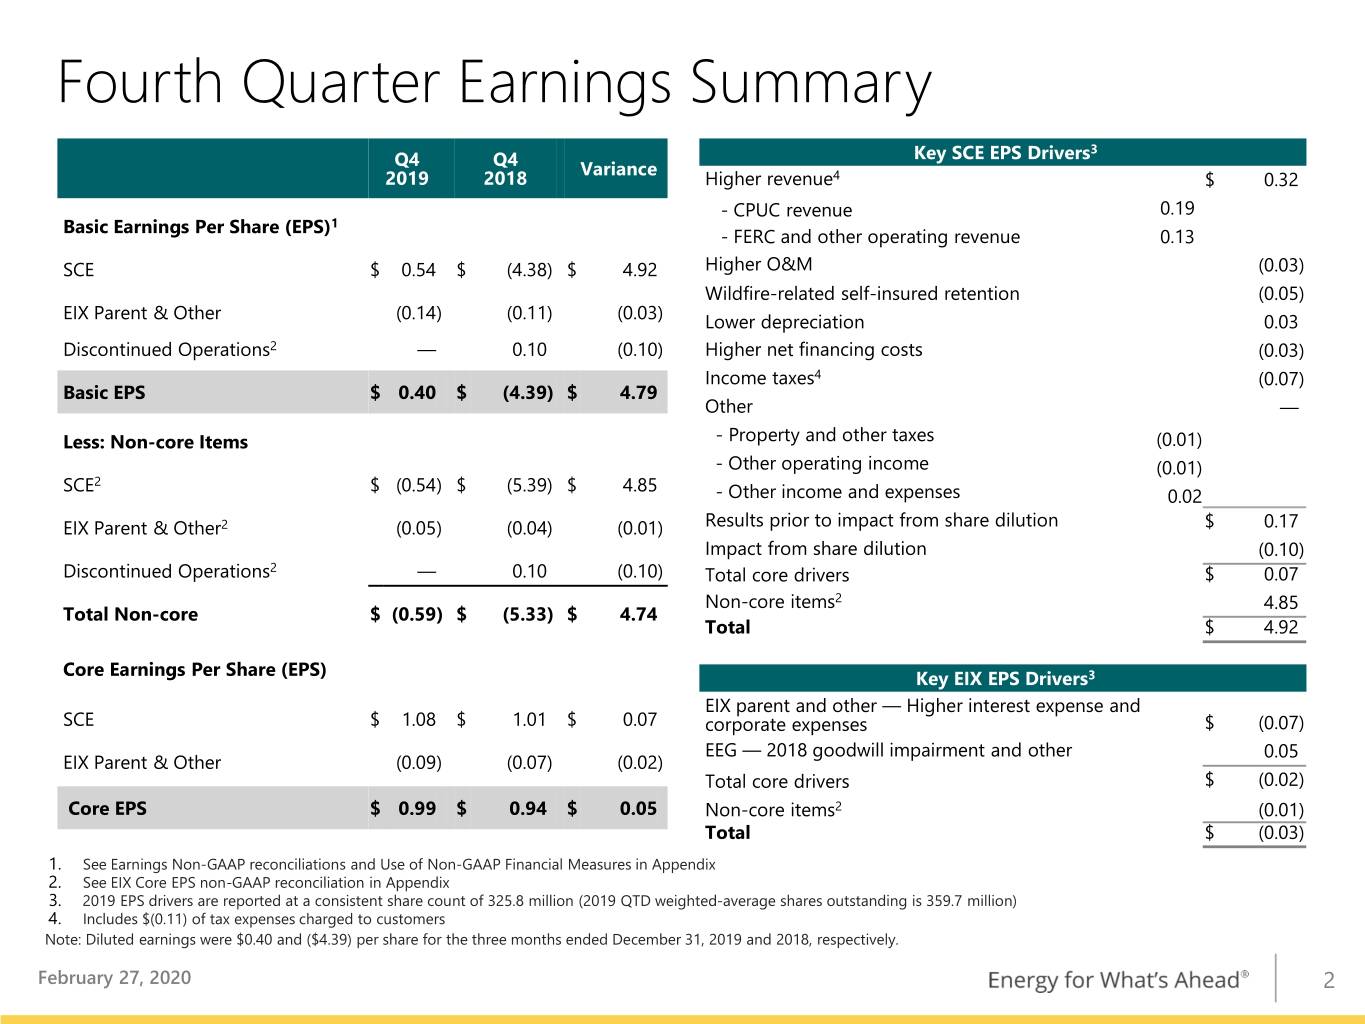
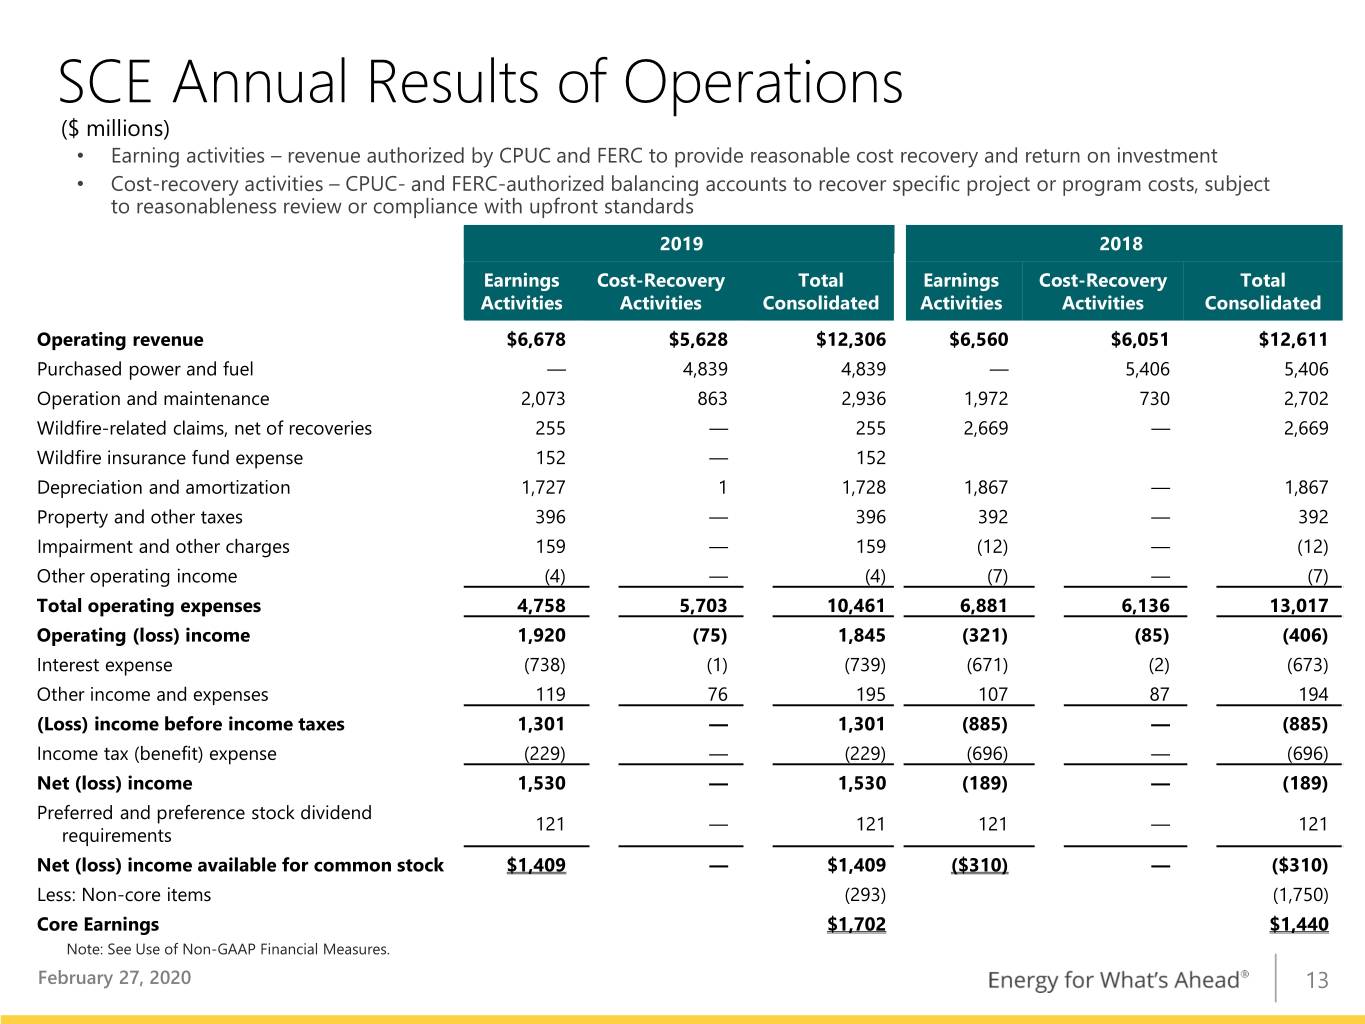
For the fourth quarter 2019, Edison International reported core earnings of 99 cents per share, which was 5 cents higher than the same period last year. From the table on the right-hand side, you will see that SCE had a core EPS variance of positive 7 cents year-over-year. This was primarily driven by 17 cents of higher EPS from SCE core activities which was partially offset by 10 cents of dilution from an increase in shares outstanding. There are a few items that accounted for the majority of the EPS variance at SCE.

5


To begin with, higher revenues had a positive variance of 32 cents. This was primarily driven by 19 cents of higher CPUC revenues largely as a result of the GRC escalation mechanism and lower income tax benefits refunded to customers in our tax balancing account which is offset in income taxes. FERC revenues had a positive variance of 13 cents due to higher expenses, rate base growth and increased ROE from the 2019 settlement of the 2018 Formula Rate proceeding.
Higher O&M expenses negatively impacted year-over-year EPS by 3 cents. This was largely driven by an increase in wildfire mitigation expenses. I will discuss more about this when we cover full-year variances.
During the quarter, we recorded a 5-cent charge for the self-insured retention under our wildfire insurance, primarily related to 2019 wildfires. We treated this charge as core to remain consistent with how we treat deductibles for expenses that are covered by insurance. Higher net financing costs related to increased borrowings had a negative 3 cents impact. There was also a 7 cent lower income tax benefit, which primarily reflects tax benefits captured through our tax balancing account as noted earlier.
EIX Parent and Other had a negative 2 cents core variance in the quarter. This was largely due to 7 cents of higher interest expense related to increased borrowings, partially offset by a 5 cents positive variance at Edison Energy due to the 2018 goodwill impairment.
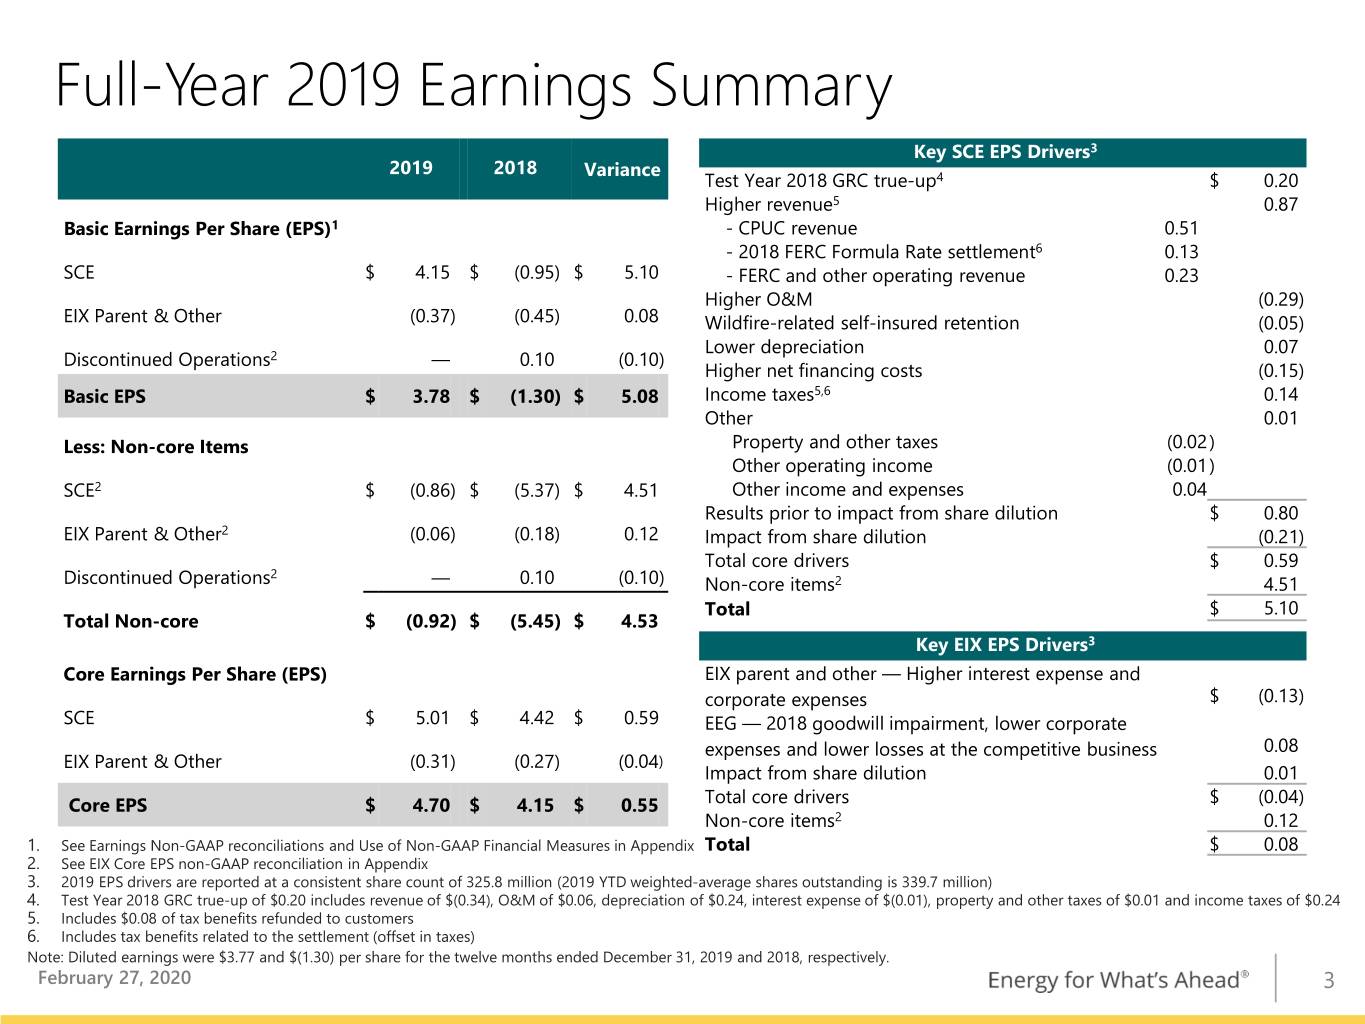
Please turn to page 3. For the full year 2019, Edison International core earnings per share increased 55 cents to $4.70 per share. This includes an improvement in core earnings of 59 cents at SCE partly offset by higher EIX Parent and Other costs of 4 cents. While the full year and fourth quarter earnings analysis are largely consistent, I will highlight a few areas. You will see a positive 20 cents impact from the retroactive application of the 2018 GRC decision that was recorded in Q2. Also, we have positive 13 cents in FERC revenues related to SCE’s 2018 Formula Rate settlement, which includes 10 cents we recorded in the third quarter. Finally, for the year, there was a positive 14 cents income tax variance primarily related to benefits that are passed back to customers through the tax balancing account, with no impact on earnings.

6


Related specifically to wildfire mitigation activities, for the full year, we recorded expenses of $519 million to the related memo accounts. We recorded regulatory assets for $400 million of the spend that most closely resemble historical precedents. As you know, a regulatory asset is only recorded when there is objectively verifiable precedent for recovery. We have not recorded a regulatory asset for the remaining $119 million, pre-tax, and I would like to provide some additional context for these amounts which are reflected in O&M expenses for the year.
The scale of this mitigation effort is unlike what we have seen in the past and there are some activities for which there is no historical precedent. During the year, we had to increase crews, project management personnel and other human resources to execute our wildfire mitigation programs. We also managed and sequenced the work in order to reduce risk as quickly as possible which also contributed to higher costs. The higher volume of work that drove increases in crew, human resource and execution costs in high fire risk areas also drove increased costs in non-high fire risk areas. We don’t have a precedent where incremental cost impacts in one program or geographic area drive incremental costs in another area. So, we have not recorded regulatory assets for all the costs incurred, particularly the incremental costs in non-high fire risk areas. However, SCE is seeking full recovery of these costs through separate tracks of the 2021 GRC.
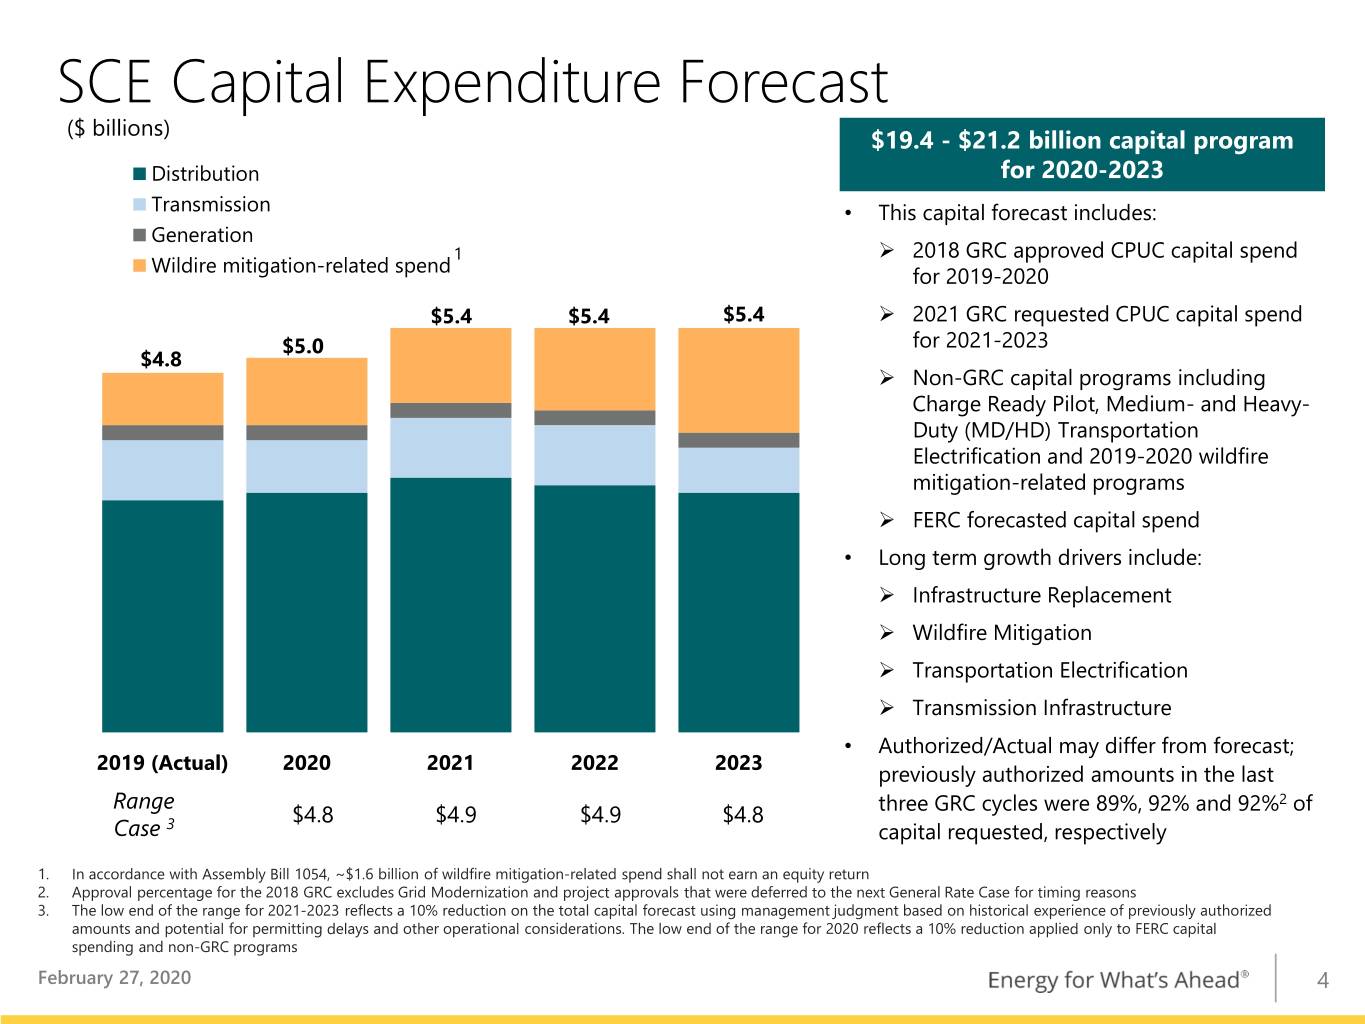
Page 4 shows SCE’s capital expenditure forecast. This includes CPUC-jurisdictional GRC capital expenditures, certain non-GRC CPUC capital spending and FERC capital spending. From 2020 through 2023, we are forecasting a robust $19.4 to $21.2 billion capital program. This represents an increase of approximately $200 million from our previous forecast and is primarily due to higher spending on wildfire mitigation.
In January, the CPUC extended the GRC cycle by adding a fourth year for SCE and other large utilities. As a result, SCE is required to file an amendment to its 2021 GRC application to add an attrition year for 2024. We are awaiting further direction from the Commission on the timing of this amendment.


7


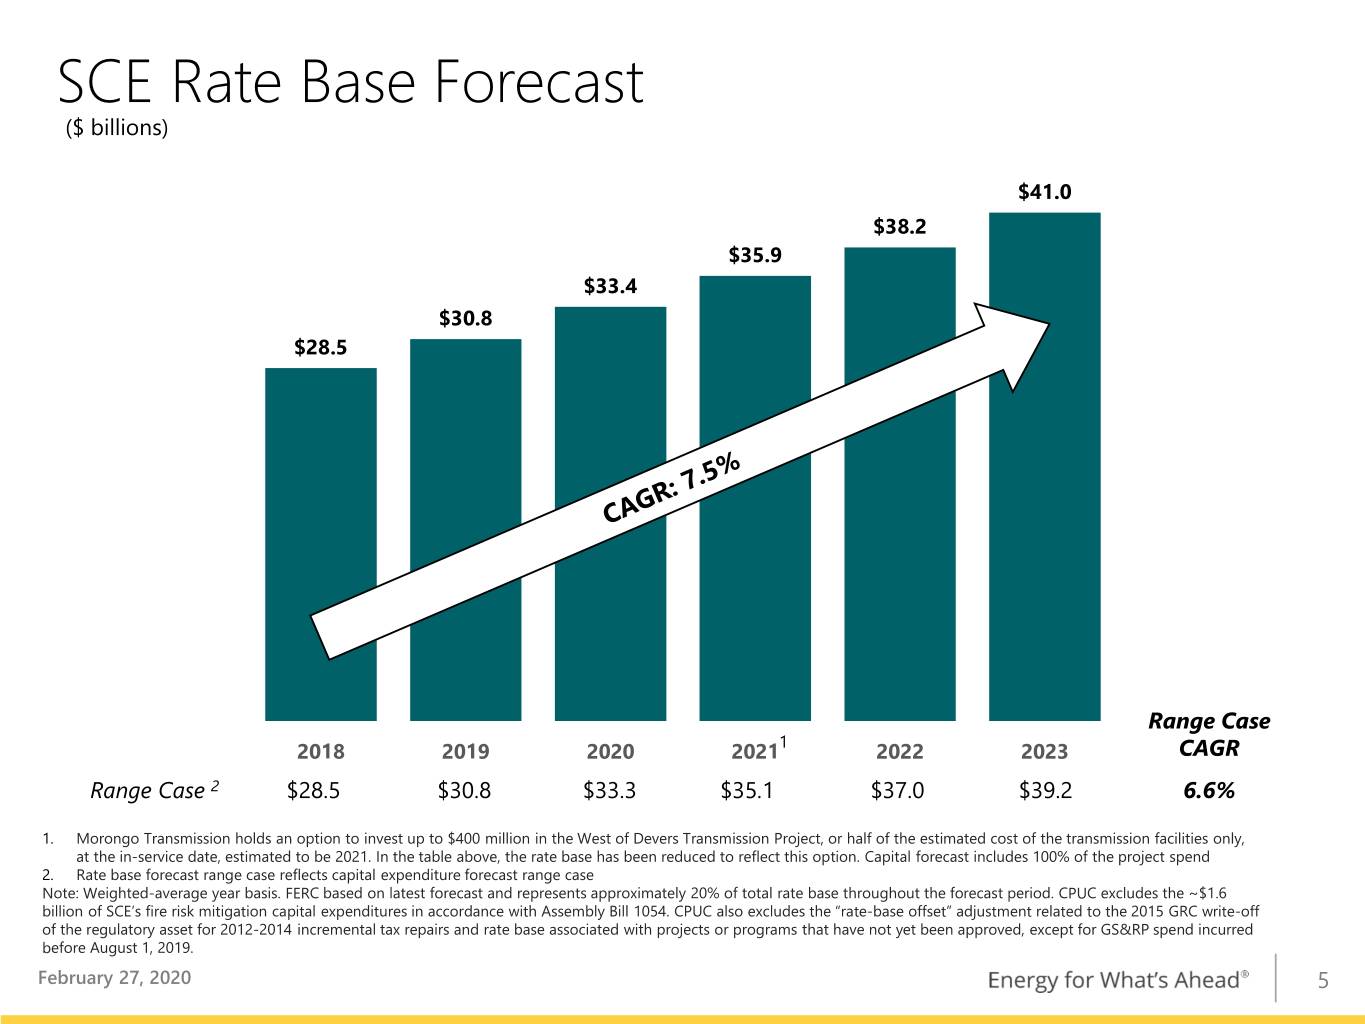
On page 5, we show SCE’s rate base forecast. At the capital expenditure levels requested in the 2021 GRC, total weighted-average CPUC- and FERC-jurisdictional rate base will increase to $41 billion by 2023. Spanning two rate case periods, this represents a six-year compound annual growth rate of 7.5% at the request level. To develop a range of outcomes, management is applying a 10% reduction to the rate base forecast, based on our historical experience of previously authorized amounts and other operational considerations. At this level, SCE’s rate base forecast reflects a compound annual growth rate of 6.6%.
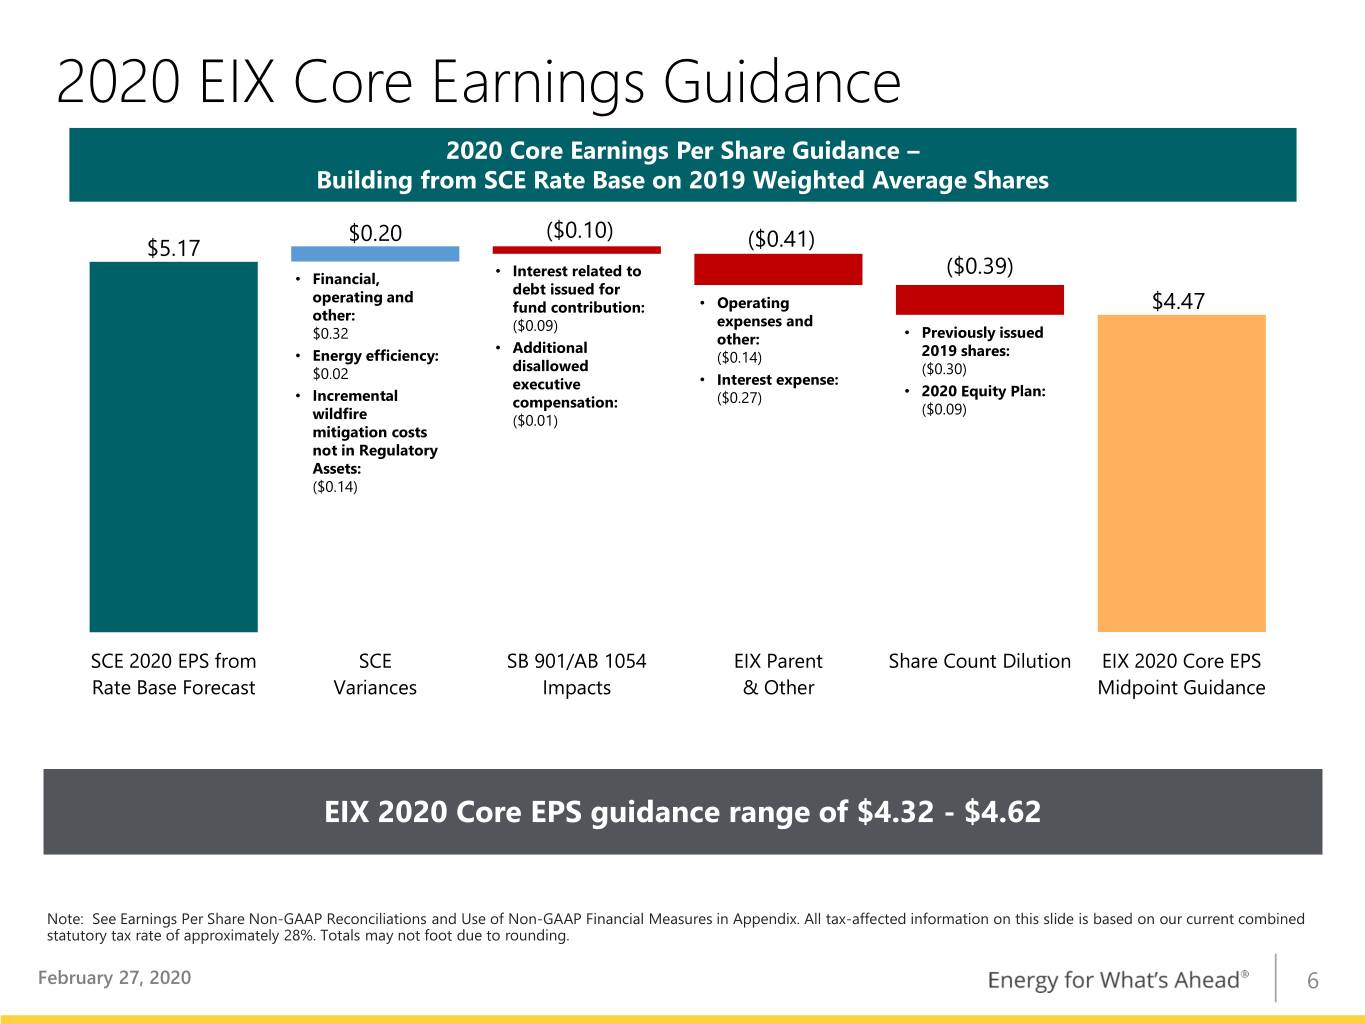
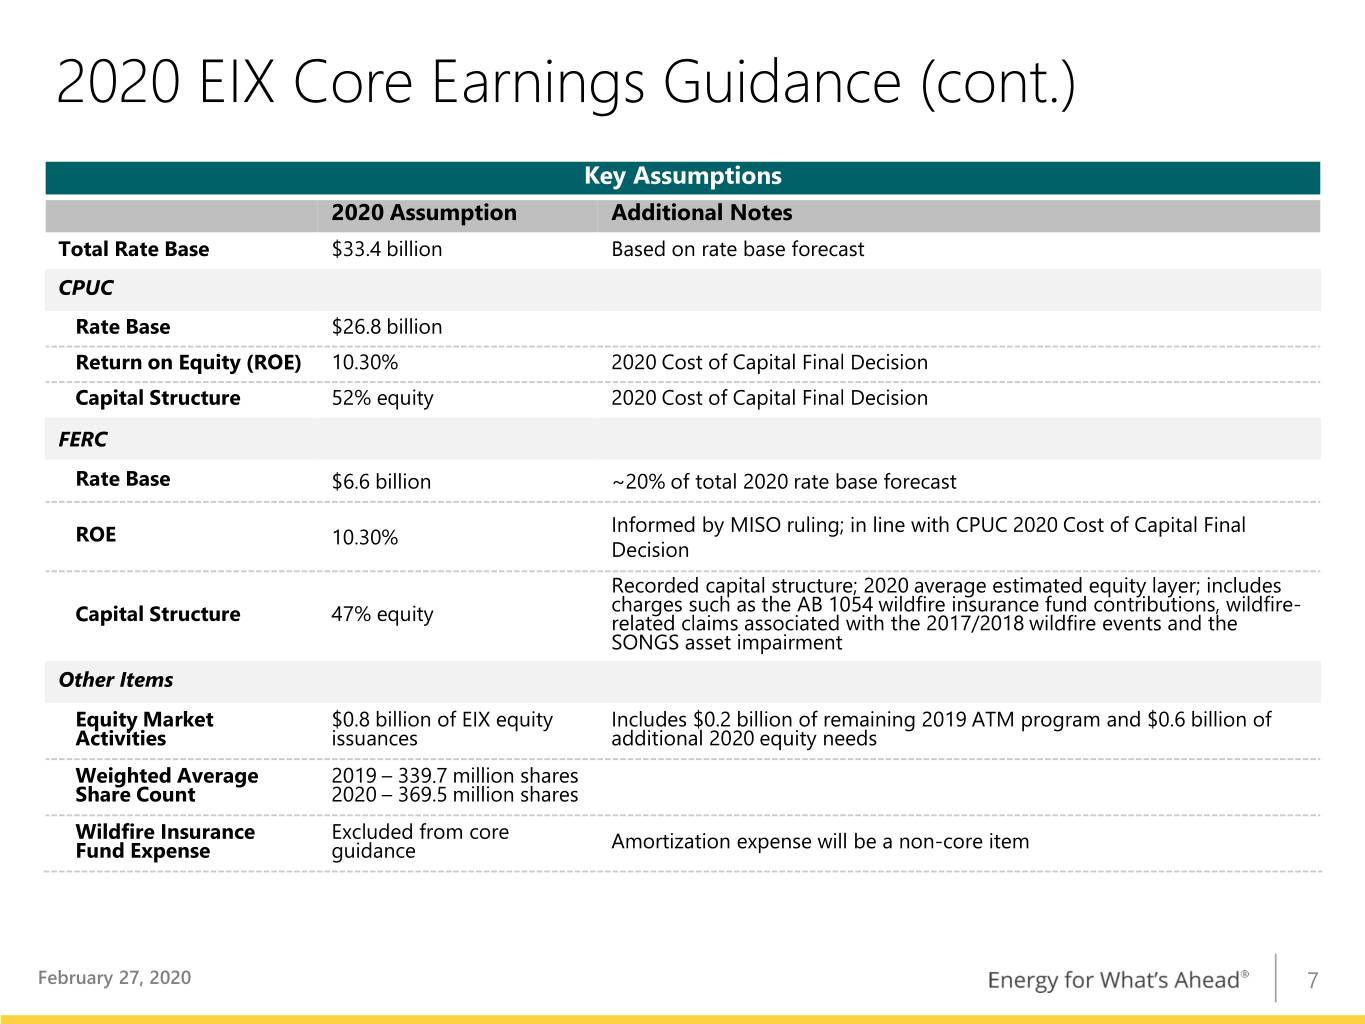
Pages 6 and 7 show our 2020 guidance and the key assumptions for modeling purposes. As we have in the past, let’s begin with rate base earnings. This reflects the CPUC jurisdictional rate base authorized in the 2018 GRC as well as the recently approved ROE and capital structure from the 2020 Cost of Capital decision. We settled the 2018 transmission rate case and that rate was in effect until early November 2019. However, we have not yet resolved the subsequent case and had to make an assumption regarding the FERC ROE in 2020. As you know, FERC has varied its approach to determining ROE over the past few years and its approach remains unsettled, with FERC currently considering rehearing requests to the MISO Order. We believe that methodologies resulting in FERC ROEs lower than state-level ROEs will result in sub-optimal investment decisions. At this time, we are basing guidance on a 2020 FERC ROE that is comparable to our CPUC ROE of 10.3%. Finally, FERC has historically used recorded capital structure to determine revenues. This is forecasted at 47% in 2020 and does not benefit from the CPUC exclusions related to AB 1054 and other items. Based on the actual 2019 weighted average share count of 339.7 million, these items result in a rate base EPS outlook of $5.17.
Let’s next discuss SCE operating and financial variances which add to rate base earnings. This is forecasted at a net contribution of 20 cents, which is not as large as we have seen in some prior years. There are a number of drivers to this. First, as noted earlier, on January 1, the CPUC cost of capital decision was implemented, and the embedded cost of debt and preferred equity were adjusted to actual, reducing previous financing benefits. On the operating side, we continue to manage costs, which ultimately benefits our customers. However, 14 cents of costs related to wildfire mitigation activities represent a larger offset to other items, such as AFUDC, than we have seen historically. As I discussed earlier, we will pursue recovery of these incremental costs

8


that we record in wildfire memo accounts. However, lacking a historical precedent, we do not assume we will meet the accounting requirements for deferral. We expect the drag related to wildfire mitigation activities to be removed in 2021 since the costs are included in the 2021 GRC revenue request. Finally, we also include 2 cents related to expected energy efficiency earnings.
Moving to the right in the chart – SB 901 and AB 1054 included certain items that are not recovered in rates. In 2020 guidance, we highlight the annualized cost of interest expense related to the wildfire insurance fund contribution and the non-recovery of disallowed executive compensation. These amount to a total drag of 10 cents.
Finally, for EIX Parent and Other, we expect a total drag of 41 cents. This includes holdco and other operating expenses at the previously communicated rate of approximately 1 cent per month, or 14 cents for the year. The balance of 27 cents is the after-tax interest cost, including the expected impact of the $400 million debt issuance that is part of the 2020 financing plan. The impact from share count dilution in 2020 can be broken down into two areas. The first is the full year impact of the shares issued in 2019 and this translates to 30 cents. The second area is the impact related to the $800 million equity issuance in 2020. This results in another 9 cents of dilution in our 2020 EPS guidance. I will discuss the 2020 financing plan that relates to these debt and equity assumptions embedded in guidance in a moment.
Overall, this results in 2020 EPS guidance of $4.47/share with a range of $4.32 – $4.62/share. This range is slightly wider than in the past and accommodates the large number of items that are being resolved in proceedings outside our typical General Rate Case.
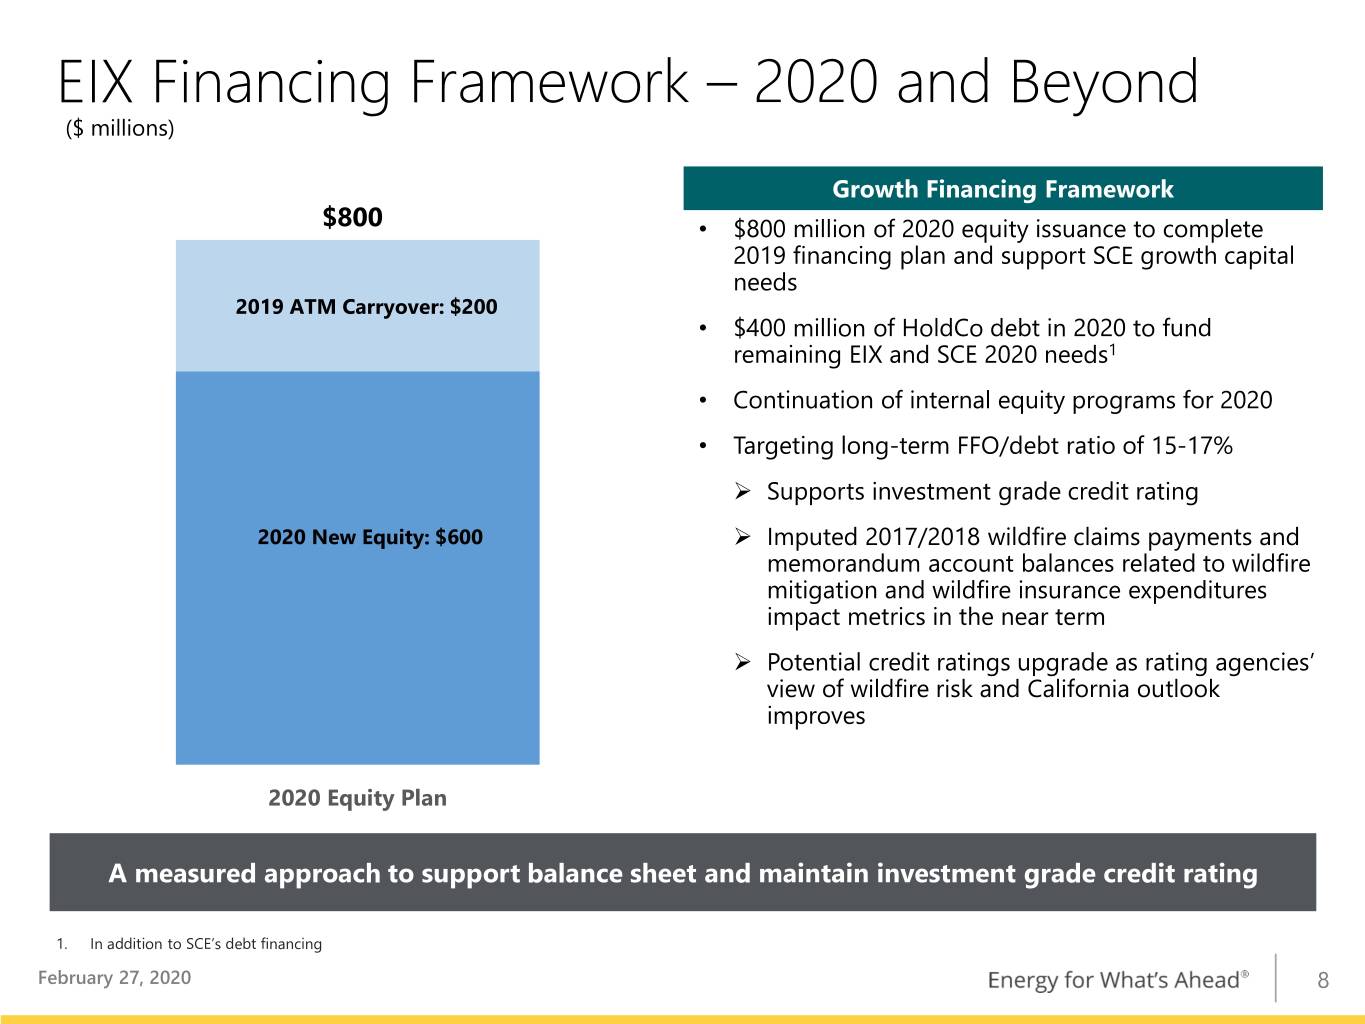
Please turn to slide 8 and we will discuss the rationale and strategy for our 2020 funding plan and longer-term outlook. The objective is to provide details regarding 2020 as well as a framework that informs our longer-term approach. Over the past two years, there have been some unique issues that have informed our financing plans, including the Wildfire Insurance Fund contribution. One constant has been the robust level of capital spending required to make our grid more resilient and prepare for the clean energy future.

9


As we discussed earlier, SCE is estimating approximately $5 billion per year of capital spending over the next several years. One key part of our framework is to deliver on these capital plans while we maintain investment grade ratings at both SCE and EIX. That overarching tenet informs the 2020 financing plan and will also influence us in the longer run as we are targeting a long-term FFO-to-debt ratio of 15-17%. We also look forward to a point when this ratio level will be supportive of a ratings improvement as the rating agencies’ view of wildfire risk and their general California outlook further improves.
This longer-term ratings framework has implications for our near-term financing plan. First, we are spending significant amounts on wildfire mitigation and wildfire insurance and those amounts are not yet being recovered in rates. Even though we expect the Commission to begin addressing some of the amounts this year, and while this spending provides additional operational risk mitigation, these items will continue to challenge our near-term credit metrics until the proceedings are resolved and the balances are worked down. Second, while very few claims have yet been paid related to the 2017-18 events, some rating agencies are burdening our credit metrics with imputed debt equivalent to their assumptions around our liability to pay those claims.
With this framework and factors in mind, the holdco financing plan for 2020 includes $800 million in equity of which $600 million supports the growth capital need at SCE. The remaining $200 million is a carry-over related to the equity plan we disclosed in 2019 that we expect to complete this year. We have the flexibility to address this total equity need through a variety of approaches including our ATM and internal programs. The plan also includes $400 million of debt as mentioned earlier.
In 2019, we deployed significant capital to meet our customers’ needs and we expect this need to continue. Given this level of growth at the utility, our dividend payout ratio and current ratings, as supported by the 2020 equity issuance, we expect minimal equity requirements to fund our ongoing capital expenditures program beyond 2020. With regard to wildfire-related costs, this financing plan is also predicated on requested cost recovery on the memorandum accounts, the current level of liabilities reflected on our balance sheet for the 2017 and 2018

10


wildfire and mudslide events and timely resolution of SCE’s capital structure waiver request. If there is a material change in these wildfire-related assumptions, we will then re-evaluate our balance sheet requirements using the same framework that drove our current and prior year plans, that is, we will work to maintain our investment grade ratings and our financing approach will be consistent with that objective.



11

Exhibit 99.3 Fourth Quarter and Full-Year 2019 Financial Results February 27, 2020


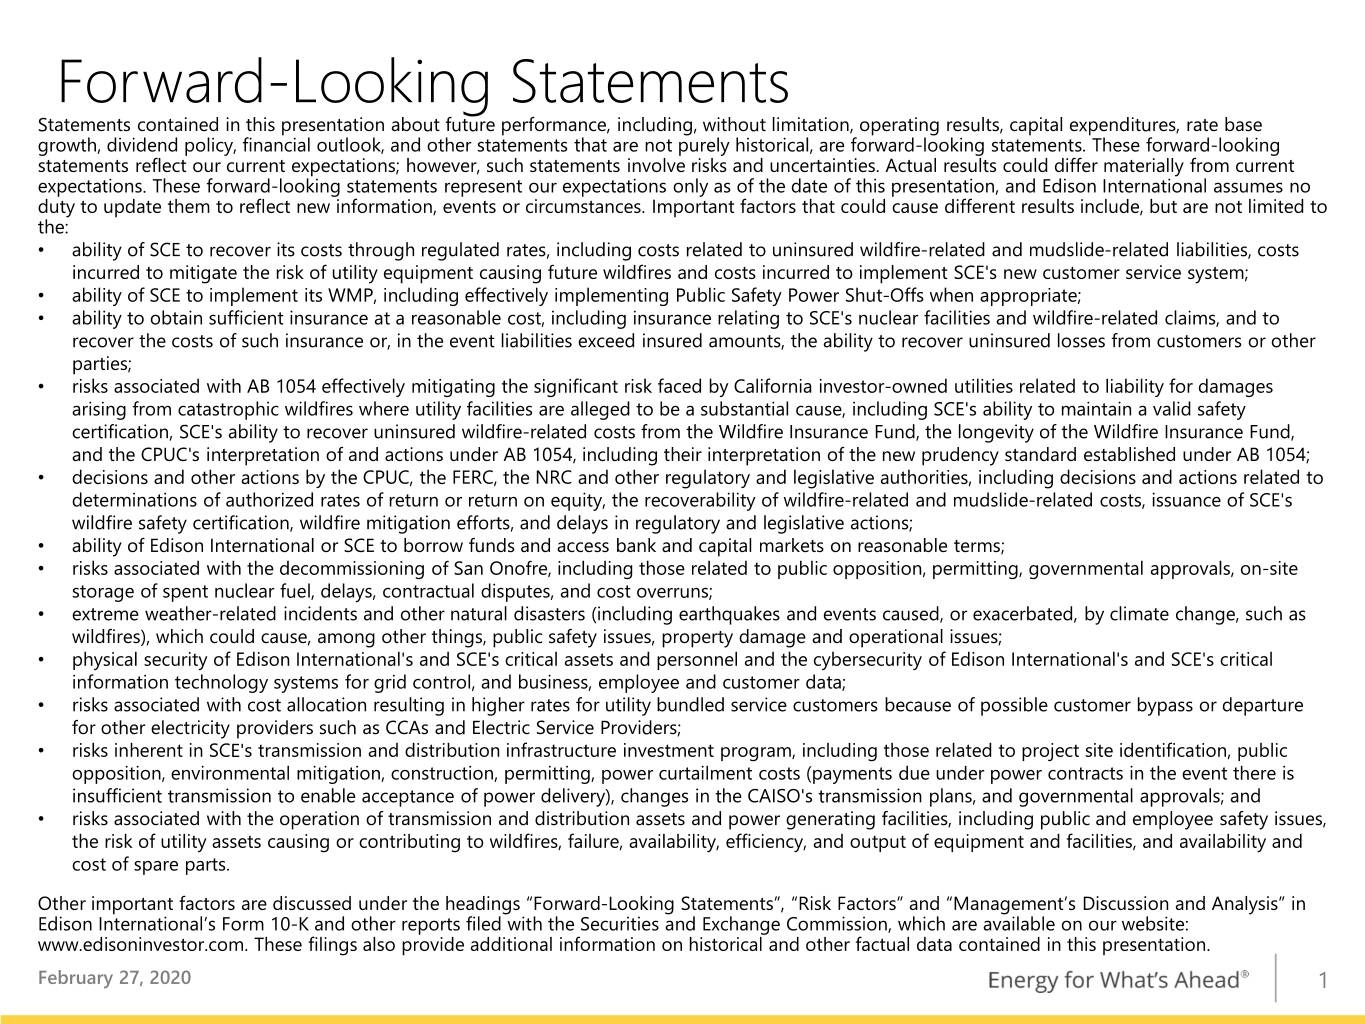
Forward-Looking Statements Statements contained in this presentation about future performance, including, without limitation, operating results, capital expenditures, rate base growth, dividend policy, financial outlook, and other statements that are not purely historical, are forward-looking statements. These forward-looking statements reflect our current expectations; however, such statements involve risks and uncertainties. Actual results could differ materially from current expectations. These forward-looking statements represent our expectations only as of the date of this presentation, and Edison International assumes no duty to update them to reflect new information, events or circumstances. Important factors that could cause different results include, but are not limited to the: • ability of SCE to recover its costs through regulated rates, including costs related to uninsured wildfire-related and mudslide-related liabilities, costs incurred to mitigate the risk of utility equipment causing future wildfires and costs incurred to implement SCE's new customer service system; • ability of SCE to implement its WMP, including effectively implementing Public Safety Power Shut-Offs when appropriate; • ability to obtain sufficient insurance at a reasonable cost, including insurance relating to SCE's nuclear facilities and wildfire-related claims, and to recover the costs of such insurance or, in the event liabilities exceed insured amounts, the ability to recover uninsured losses from customers or other parties; • risks associated with AB 1054 effectively mitigating the significant risk faced by California investor-owned utilities related to liability for damages arising from catastrophic wildfires where utility facilities are alleged to be a substantial cause, including SCE's ability to maintain a valid safety certification, SCE's ability to recover uninsured wildfire-related costs from the Wildfire Insurance Fund, the longevity of the Wildfire Insurance Fund, and the CPUC's interpretation of and actions under AB 1054, including their interpretation of the new prudency standard established under AB 1054; • decisions and other actions by the CPUC, the FERC, the NRC and other regulatory and legislative authorities, including decisions and actions related to determinations of authorized rates of return or return on equity, the recoverability of wildfire-related and mudslide-related costs, issuance of SCE's wildfire safety certification, wildfire mitigation efforts, and delays in regulatory and legislative actions; • ability of Edison International or SCE to borrow funds and access bank and capital markets on reasonable terms; • risks associated with the decommissioning of San Onofre, including those related to public opposition, permitting, governmental approvals, on-site storage of spent nuclear fuel, delays, contractual disputes, and cost overruns; • extreme weather-related incidents and other natural disasters (including earthquakes and events caused, or exacerbated, by climate change, such as wildfires), which could cause, among other things, public safety issues, property damage and operational issues; • physical security of Edison International's and SCE's critical assets and personnel and the cybersecurity of Edison International's and SCE's critical information technology systems for grid control, and business, employee and customer data; • risks associated with cost allocation resulting in higher rates for utility bundled service customers because of possible customer bypass or departure for other electricity providers such as CCAs and Electric Service Providers; • risks inherent in SCE's transmission and distribution infrastructure investment program, including those related to project site identification, public opposition, environmental mitigation, construction, permitting, power curtailment costs (payments due under power contracts in the event there is insufficient transmission to enable acceptance of power delivery), changes in the CAISO's transmission plans, and governmental approvals; and • risks associated with the operation of transmission and distribution assets and power generating facilities, including public and employee safety issues, the risk of utility assets causing or contributing to wildfires, failure, availability, efficiency, and output of equipment and facilities, and availability and cost of spare parts. Other important factors are discussed under the headings “Forward-Looking Statements”, “Risk Factors” and “Management’s Discussion and Analysis” in Edison International’s Form 10-K and other reports filed with the Securities and Exchange Commission, which are available on our website: www.edisoninvestor.com. These filings also provide additional information on historical and other factual data contained in this presentation. February 27, 2020 1


Fourth Quarter Earnings Summary Key SCE EPS Drivers3 Q4 Q4 Variance 2019 2018 Higher revenue4 $ 0.32 - CPUC revenue 0.19 Basic Earnings Per Share (EPS)1 - FERC and other operating revenue 0.13 SCE $ 0.54 $ (4.38) $ 4.92 Higher O&M (0.03) Wildfire-related self-insured retention (0.05) EIX Parent & Other (0.14) (0.11) (0.03) Lower depreciation 0.03 Discontinued Operations2 — 0.10 (0.10) Higher net financing costs (0.03) Income taxes4 (0.07) Basic EPS $ 0.40 $ (4.39) $ 4.79 Other — Less: Non-core Items - Property and other taxes (0.01) - Other operating income (0.01) SCE2 $ (0.54) $ (5.39) $ 4.85 - Other income and expenses 0.02 EIX Parent & Other2 (0.05) (0.04) (0.01) Results prior to impact from share dilution $ 0.17 Impact from share dilution (0.10) Discontinued Operations2 — 0.10 (0.10) Total core drivers $ 0.07 Non-core items2 4.85 Total Non-core $ (0.59) $ (5.33) $ 4.74 Total $ 4.92 Core Earnings Per Share (EPS) Key EIX EPS Drivers3 EIX parent and other — Higher interest expense and SCE $ 1.08 $ 1.01 $ 0.07 corporate expenses $ (0.07) EEG — 2018 goodwill impairment and other 0.05 EIX Parent & Other (0.09) (0.07) (0.02) Total core drivers $ (0.02) Core EPS $ 0.99 $ 0.94 $ 0.05 Non-core items2 (0.01) Total $ (0.03) 1. See Earnings Non-GAAP reconciliations and Use of Non-GAAP Financial Measures in Appendix 2. See EIX Core EPS non-GAAP reconciliation in Appendix 3. 2019 EPS drivers are reported at a consistent share count of 325.8 million (2019 QTD weighted-average shares outstanding is 359.7 million) 4. Includes $(0.11) of tax expenses charged to customers Note: Diluted earnings were $0.40 and ($4.39) per share for the three months ended December 31, 2019 and 2018, respectively. February 27, 2020 2


Full-Year 2019 Earnings Summary Key SCE EPS Drivers3 2019 2018 Variance Test Year 2018 GRC true-up4 $ 0.20 Higher revenue5 0.87 Basic Earnings Per Share (EPS)1 - CPUC revenue 0.51 - 2018 FERC Formula Rate settlement6 0.13 SCE $ 4.15 $ (0.95) $ 5.10 - FERC and other operating revenue 0.23 Higher O&M (0.29) EIX Parent & Other (0.37) (0.45) 0.08 Wildfire-related self-insured retention (0.05) Lower depreciation 0.07 Discontinued Operations2 — 0.10 (0.10) Higher net financing costs (0.15) Basic EPS $ 3.78 $ (1.30) $ 5.08 Income taxes5,6 0.14 Other 0.01 Less: Non-core Items Property and other taxes (0.02) Other operating income (0.01) SCE2 $ (0.86) $ (5.37) $ 4.51 Other income and expenses 0.04 Results prior to impact from share dilution $ 0.80 EIX Parent & Other2 (0.06) (0.18) 0.12 Impact from share dilution (0.21) Total core drivers $ 0.59 2 Discontinued Operations — 0.10 (0.10) Non-core items2 4.51 Total $ 5.10 Total Non-core $ (0.92) $ (5.45) $ 4.53 Key EIX EPS Drivers3 Core Earnings Per Share (EPS) EIX parent and other — Higher interest expense and corporate expenses $ (0.13) SCE $ 5.01 $ 4.42 $ 0.59 EEG — 2018 goodwill impairment, lower corporate expenses and lower losses at the competitive business 0.08 EIX Parent & Other (0.31) (0.27) (0.04) Impact from share dilution 0.01 Core EPS $ 4.70 $ 4.15 $ 0.55 Total core drivers $ (0.04) Non-core items2 0.12 1. See Earnings Non-GAAP reconciliations and Use of Non-GAAP Financial Measures in Appendix Total $ 0.08 2. See EIX Core EPS non-GAAP reconciliation in Appendix 3. 2019 EPS drivers are reported at a consistent share count of 325.8 million (2019 YTD weighted-average shares outstanding is 339.7 million) 4. Test Year 2018 GRC true-up of $0.20 includes revenue of $(0.34), O&M of $0.06, depreciation of $0.24, interest expense of $(0.01), property and other taxes of $0.01 and income taxes of $0.24 5. Includes $0.08 of tax benefits refunded to customers 6. Includes tax benefits related to the settlement (offset in taxes) Note: Diluted earnings were $3.77 and $(1.30) per share for the twelve months ended December 31, 2019 and 2018, respectively. February 27, 2020 3


SCE Capital Expenditure Forecast ($ billions) $19.4 - $21.2 billion capital program Distribution for 2020-2023 Transmission • This capital forecast includes: Generation 1  2018 GRC approved CPUC capital spend Wildire mitigation-related spend for 2019-2020 $5.4 $5.4 $5.4  2021 GRC requested CPUC capital spend $5.0 for 2021-2023 $4.8  Non-GRC capital programs including Charge Ready Pilot, Medium- and Heavy- Duty (MD/HD) Transportation Electrification and 2019-2020 wildfire mitigation-related programs  FERC forecasted capital spend • Long term growth drivers include:  Infrastructure Replacement  Wildfire Mitigation  Transportation Electrification  Transmission Infrastructure • Authorized/Actual may differ from forecast; 2019 (Actual) 2020 2021 2022 2023 previously authorized amounts in the last Range three GRC cycles were 89%, 92% and 92%2 of 3 $4.8 $4.9 $4.9 $4.8 Case capital requested, respectively 1. In accordance with Assembly Bill 1054, ~$1.6 billion of wildfire mitigation-related spend shall not earn an equity return 2. Approval percentage for the 2018 GRC excludes Grid Modernization and project approvals that were deferred to the next General Rate Case for timing reasons 3. The low end of the range for 2021-2023 reflects a 10% reduction on the total capital forecast using management judgment based on historical experience of previously authorized amounts and potential for permitting delays and other operational considerations. The low end of the range for 2020 reflects a 10% reduction applied only to FERC capital spending and non-GRC programs February 27, 2020 4


SCE Rate Base Forecast ($ billions) $41.0 $38.2 $35.9 $33.4 $30.8 $28.5 Range Case 1 2018 2019 2020 2021 2022 2023 CAGR Range Case 2 $28.5 $30.8 $33.3 $35.1 $37.0 $39.2 6.6% 1. Morongo Transmission holds an option to invest up to $400 million in the West of Devers Transmission Project, or half of the estimated cost of the transmission facilities only, at the in-service date, estimated to be 2021. In the table above, the rate base has been reduced to reflect this option. Capital forecast includes 100% of the project spend 2. Rate base forecast range case reflects capital expenditure forecast range case Note: Weighted-average year basis. FERC based on latest forecast and represents approximately 20% of total rate base throughout the forecast period. CPUC excludes the ~$1.6 billion of SCE’s fire risk mitigation capital expenditures in accordance with Assembly Bill 1054. CPUC also excludes the “rate-base offset” adjustment related to the 2015 GRC write-off of the regulatory asset for 2012-2014 incremental tax repairs and rate base associated with projects or programs that have not yet been approved, except for GS&RP spend incurred before August 1, 2019. February 27, 2020 5


2020 EIX Core Earnings Guidance 2020 Core Earnings Per Share Guidance – Building from SCE Rate Base on 2019 Weighted Average Shares $0.20 ($0.10) $5.17 ($0.41) • Interest related to • Financial, ($0.39) debt issued for operating and fund contribution: • Operating $4.47 other: expenses and ($0.09) • $0.32 other: Previously issued • Additional • Energy efficiency: ($0.14) 2019 shares: disallowed ($0.30) $0.02 • Interest expense: executive • • Incremental ($0.27) 2020 Equity Plan: compensation: ($0.09) wildfire ($0.01) mitigation costs not in Regulatory Assets: ($0.14) SCE 2020 EPS from SCE SB 901/AB 1054 EIX Parent Share Count Dilution EIX 2020 Core EPS Rate Base Forecast Variances Impacts & Other Midpoint Guidance EIX 2020 Core EPS guidance range of $4.32 - $4.62 Note: See Earnings Per Share Non-GAAP Reconciliations and Use of Non-GAAP Financial Measures in Appendix. All tax-affected information on this slide is based on our current combined statutory tax rate of approximately 28%. Totals may not foot due to rounding. February 27, 2020 6


2020 EIX Core Earnings Guidance (cont.) Key Assumptions 2020 Assumption Additional Notes Total Rate Base $33.4 billion Based on rate base forecast CPUC Rate Base $26.8 billion Return on Equity (ROE) 10.30% 2020 Cost of Capital Final Decision Capital Structure 52% equity 2020 Cost of Capital Final Decision FERC Rate Base $6.6 billion ~20% of total 2020 rate base forecast Informed by MISO ruling; in line with CPUC 2020 Cost of Capital Final ROE 10.30% Decision Recorded capital structure; 2020 average estimated equity layer; includes charges such as the AB 1054 wildfire insurance fund contributions, wildfire- Capital Structure 47% equity related claims associated with the 2017/2018 wildfire events and the SONGS asset impairment Other Items Equity Market $0.8 billion of EIX equity Includes $0.2 billion of remaining 2019 ATM program and $0.6 billion of Activities issuances additional 2020 equity needs Weighted Average 2019 – 339.7 million shares Share Count 2020 – 369.5 million shares Wildfire Insurance Excluded from core Fund Expense guidance Amortization expense will be a non-core item February 27, 2020 7


EIX Financing Framework – 2020 and Beyond ($ millions) Growth Financing Framework $800 • $800 million of 2020 equity issuance to complete 2019 financing plan and support SCE growth capital needs 2019 ATM Carryover: $200 • $400 million of HoldCo debt in 2020 to fund remaining EIX and SCE 2020 needs1 • Continuation of internal equity programs for 2020 • Targeting long-term FFO/debt ratio of 15-17%  Supports investment grade credit rating 2020 New Equity: $600  Imputed 2017/2018 wildfire claims payments and memorandum account balances related to wildfire mitigation and wildfire insurance expenditures impact metrics in the near term  Potential credit ratings upgrade as rating agencies’ view of wildfire risk and California outlook improves 2020 Equity Plan A measured approach to support balance sheet and maintain investment grade credit rating 1. In addition to SCE’s debt financing February 27, 2020 8


Appendix February 27, 2020 9


2019 Wildfire Mitigation Actions  Inspections: completed overhead inspections of 100% of T&D assets in HFRA; large volume of findings constrained bandwidth for other programs in 2019; transitioning to more risk-prioritized approach using technology and enhanced aerial inspections  Resources: added significant resources to manage accelerated pace of inspections, vegetation management, and infrastructure hardening programs; competition from statewide activities constrains pace of growth  Execution: achieved target volumes of major programs and completed majority of 2019 Wildfire Mitigation Plan (WMP) activities; rapid scaling of programs resulted in opportunities to improve efficiency going forward  Met or exceeded targets in 54 of the 58 programs (our covered conductor, HD cameras and weather station programs all exceeded targets)  Public Safety Power Shutoff (PSPS): rapid deployment of situational awareness tools and capabilities helped to better target outages during high risk conditions; continuing to identify ways to better manage energized/de- energized lines during severe wind conditions while maintaining risk mitigation needs and reducing customer impact  During peak fire season (October 2019), only ~2% of SCE customers were affected by PSPS  Ignitions: ignition cause analysis of 2019 events validated programs and informed further plan updates; as more mitigations are deployed, we expect to reduce the scope and impact of PSPS, but PSPS will have to remain available as a tool to mitigate wildfire risk during severe weather and high Fire Potential Index events  Found over 40 instances of damage to system assets in post-PSPS patrols  Technology: meaningful benefits from field deployment of mobile technology and enhanced data analytics advanced prioritization capabilities, and detection of system issues; increasing adoption of new technologies planned for 2020 and beyond SCE continues to drive process improvements, but has not fundamentally changed the approach to wildfire mitigation February 27, 2020 10


Mitigating Catastrophic Wildfire Risk 2019 Actuals 2020-22 Wildfire Mitigation Plan Covered Conductor: 372 circuit miles 4,000 additional circuit miles by Jan 1, 2023 Infrastructure completed 2020: 700-1,000 / 2021: 1,400 / 2022: 1,600 Hardening Undergrounding: leverage risk analysis to Approximately 17 miles of undergrounding under identify opportunities consideration in 2021-22 Inspections: All HFRA distribution and Risk-informed ground & aerial inspection program transmission structures inspected covering ~50% of HFRA structures annually Vegetation Management: expand line Continue expanded line clearances; focus on Enhanced clearances to 12 feet; removed ~5,900 hazard hazard tree assessments and timely removal; Operational tree removals (below target of 7,500); and expand brush clearing at base of poles to 200,000- Practices clear brush at base of >100,000 poles 300,000 PSPS: de-energization based on circuit- Same de-energization approach with new circuit- specific wind speed thresholds specific mitigation plans and customer care programs to reduce customer impacts Weather Stations: 357 installed 375-475 weather stations per year Situational HD Cameras: 91 installed Deployment complete as coverage in high fire risk Awareness areas effectively maximized 2020-2022 Wildfire Mitigation Plan continues the same foundational strategy with increased focus on risk-prioritization of activities and PSPS impact mitigations February 27, 2020 11


Updated SCE Wildfire-Related Charges ($ millions) For the year ended December 31, 2019 and December 31, 2018, the income statements and balance sheets include the estimated losses/accrued liabilities (established at the lower end of the reasonably estimated range of expected losses), net of expected recoveries from insurance and FERC customers, related to the 2017/2018 Wildfire/Mudslide Events (as defined in the 10-Ks filed on February 27, 2020 and February 28, 2019) as follows: Income Statement Impacts 2019 2018 Total Charge for wildfire-related claims $232 $4,669 $4,901 Expected insurance recoveries - (2,000) (2,000) Expected revenue from FERC customers (14) (135) (149) Total pre-tax charge $218 $2,534 $2,752 Income tax benefit (61) (709) (770) Total after-tax charge $157 $1,825 $1,982 Total after-tax charge (per share) $0.46 $5.60 Claims Rollforward 2019 Wildfire-related claims (Balance as of December 31, 2018) $4,669 Incremental accrued losses in 2019 232 Payments (public entity’s settlement) (360) Wildfire-related claims (Balance as of December 31, 2019) $4,541 Note: See Use of Non-GAAP Financial Measures. February 27, 2020 12


SCE Annual Results of Operations ($ millions) • Earning activities – revenue authorized by CPUC and FERC to provide reasonable cost recovery and return on investment • Cost-recovery activities – CPUC- and FERC-authorized balancing accounts to recover specific project or program costs, subject to reasonableness review or compliance with upfront standards 2019 2018 Earnings Cost-Recovery Total Earnings Cost-Recovery Total Activities Activities Consolidated Activities Activities Consolidated Operating revenue $6,678 $5,628 $12,306 $6,560 $6,051 $12,611 Purchased power and fuel — 4,839 4,839 — 5,406 5,406 Operation and maintenance 2,073 863 2,936 1,972 730 2,702 Wildfire-related claims, net of recoveries 255 — 255 2,669 — 2,669 Wildfire insurance fund expense 152 — 152 Depreciation and amortization 1,727 1 1,728 1,867 — 1,867 Property and other taxes 396 — 396 392 — 392 Impairment and other charges 159 — 159 (12) — (12) Other operating income (4) — (4) (7) — (7) Total operating expenses 4,758 5,703 10,461 6,881 6,136 13,017 Operating (loss) income 1,920 (75) 1,845 (321) (85) (406) Interest expense (738) (1) (739) (671) (2) (673) Other income and expenses 119 76 195 107 87 194 (Loss) income before income taxes 1,301 — 1,301 (885) — (885) Income tax (benefit) expense (229) — (229) (696) — (696) Net (loss) income 1,530 — 1,530 (189) — (189) Preferred and preference stock dividend 121 — 121 121 — 121 requirements Net (loss) income available for common stock $1,409 — $1,409 ($310) — ($310) Less: Non-core items (293) (1,750) Core Earnings $1,702 $1,440 Note: See Use of Non-GAAP Financial Measures. February 27, 2020 13


Earnings Per Share Non-GAAP Reconciliations Reconciliation of EIX Basic Earnings Per Share Guidance to EIX Core Earnings Per Share Guidance EPS Attributable to Edison International 2020 Low Midpoint High SCE $4.84 EIX Parent & Other (0.38) Basic EPS1 $4.32 $4.47 $4.62 Non-Core Items SCE — — — EIX Parent & Other — — — Total Non-Core1 — — — Core EPS SCE $4.84 EIX Parent & Other (0.38) Core EPS1 $4.32 $4.47 $4.62 1. EPS is calculated on the assumed weighted-average share count for 2020 of 369.5 million. Please see 2020 EIX Core Earnings Guidance slide for more information February 27, 2020 14


Earnings Non-GAAP Reconciliations ($ millions) Reconciliation of EIX GAAP Earnings to EIX Core Earnings Q4 Q4 Earnings Attributable to Edison International 2019 2018 2019 2018 SCE $194 ($1,429) $1,409 $(310) EIX Parent & Other (51) (35) (125) (147) Discontinued Operations1 — 34 — 34 Basic Earnings $143 ($1,430) $1,284 ($423) Non-Core Items SCE1,2,3,4 ($194) (1,757) $(293) (1,750) EIX Parent & Other1,5 (18) (12) (18) (58) Discontinued Operations1 — 34 — 34 Total Non-Core ($212) ($1,735) ($311) (1,774) Core Earnings SCE $388 $328 $1,702 $1,440 EIX Parent & Other (33) (23) (107) (89) Core Earnings $355 $305 $1,595 $1,351 1. Includes income tax benefit of $34 million, income tax benefit of $66 million and income tax expense of $12 million in 2018 related to the settlement of the 1994 ‒ 2006 California tax audit for discontinued operations, SCE and EIX parent and other, respectively 2. Includes wildfire-related claims, net of recoveries of $218 million ($157 million after-tax) and $2,534 million ($1,825 million after-tax) in the fourth quarter of 2018 and 2019, respectively 3. Includes amortization of SCE’s Wildfire Insurance Fund expenses of $85 million ($61 million after-tax) and $152 million ($109 million after-tax) for the quarter and year-ended December 31, 2019, respectively 4. Includes an impairment charge of $171 million ($123 million after-tax) recorded in second quarter of 2019 for SCE related to the disallowed historical capital expenditures in SCE’s 2018 GRC final decision. The fourth quarter 2019 includes an additional $19 million income tax benefits ($88 million in full year 2019) related to changes in allocation of deferred tax re- measurement between customers and shareholders and impact from the approval of the Revised San Onofre Settlement Agreement 5. Includes goodwill impairment at Edison Energy Group of $25 million ($18 million after-tax) in the fourth quarter 2019 and loss on sale of SoCore Energy of $56 million ($46 million after- tax) in April 2018 February 27, 2020 15


EIX Core EPS Non-GAAP Reconciliations Reconciliation of Edison International Basic Earnings Per Share to Edison International Core Earnings Per Share Earnings Per Share Attributable to Edison International 2019 2018 2017 Basic EPS 3.78 ($1.30) $1.73 Non-Core Items (*) SCE Impairment and other 2018 GRC decision – Impairment of utility property, plant and equipment (0.38) — — Implementation of Revised San Onofre Settlement Agreement 0.03 0.03 (1.38) Wildfire-related claims, net of recoveries (0.48) (5.60) — Amortization of Wildfire Insurance Fund expenses (0.34) — — Re-measurement of deferred taxes as a result of Tax Reform 0.27 — (0.10) Settlement of 1994 – 2006 California tax audits — 0.20 — Edison International Parent and Other Edison Energy Group’s goodwill impairment (0.06) — — Sale of SoCore Energy and other — (0.14) 0.04 Settlement of 1994 – 2006 California tax audits — (0.04) — Re-measurement of deferred taxes as a result of Tax Reform — — (1.33) Discontinued operations Settlement of 1994 – 2006 California tax audits — 0.10 — Impact of share dilution (*) 0.04 — — Less: Total Non-Core Items (0.92) (5.45) (2.77) Core EPS $4.70 $4.15 $4.50 (*) 2019 EPS drivers are reported at a consistent share count of 325.8 million (weighted-average shares outstanding is 359.7 million and 339.7 million for fourth quarter and full year 2019, respectively) Note: See Use of Non-GAAP Financial Measures. February 27, 2020 16


Use of Non-GAAP Financial Measures Edison International's earnings are prepared in accordance with generally accepted accounting principles used in the United States. Management uses core earnings internally for financial planning and for analysis of performance. Core earnings are also used when communicating with investors and analysts regarding Edison International's earnings results to facilitate comparisons of the Company's performance from period to period. Core earnings are a non-GAAP financial measure and may not be comparable to those of other companies. Core earnings (or losses) are defined as earnings or losses attributable to Edison International shareholders less income or loss from discontinued operations and income or loss from significant discrete items that management does not consider representative of ongoing earnings, such as: exit activities, including sale of certain assets, and other activities that are no longer continuing; asset impairments and certain tax, regulatory or legal settlements or proceedings. A reconciliation of Non-GAAP information to GAAP information is included either on the slide where the information appears or on another slide referenced in this presentation. EIX Investor Relations Contact Sam Ramraj, Vice President (626) 302-2540 [email protected] Allison Bahen, Principal Manager (626) 302-5493 [email protected] February 27, 2020 17