EPR Properties Reports Second Quarter 2025 Results
Kansas City, MO, July 30, 2025 -- EPR Properties (NYSE:EPR) today announced operating results for the second quarter ended June 30, 2025 (dollars in thousands, except per share data):
| | | | | | | | | | | | | | | | | | | | | | | | | | | | | |
| | Three Months Ended June 30, | | | | Six Months Ended June 30, | | |
| | 2025 | 2024 | | % Change | | 2025 | 2024 | | % Change |
| Total revenue | $ | 178,068 | | $ | 173,095 | | | 2.9 | % | | $ | 353,101 | | $ | 340,327 | | | 3.8 | % |
| Net income available to common shareholders | 69,603 | | 39,062 | | | 78.2 | % | | 129,374 | | 95,739 | | | 35.1 | % |
| Net income available to common shareholders per diluted common share | 0.91 | | 0.51 | | | 78.4 | % | | 1.69 | | 1.26 | | | 34.1 | % |
| | | | | | | | | |
| | | | | | | | | |
| Funds From Operations as adjusted (FFOAA)(1) | 97,321 | | 93,515 | | | 4.1 | % | | 189,061 | | 179,238 | | | 5.5 | % |
| FFOAA per diluted common share (1) | 1.26 | | 1.22 | | | 3.3 | % | | 2.45 | | 2.34 | | | 4.7 | % |
| Adjusted Funds From Operations (AFFO)(1) | 95,834 | | 92,286 | | | 3.8 | % | | 188,780 | | 177,961 | | | 6.1 | % |
| AFFO per diluted common share (1) | 1.24 | | 1.20 | | | 3.3 | % | | 2.44 | | 2.33 | | | 4.7 | % |
| | | | | | | | | |
| | |
| (1) A non-GAAP financial measure | | |
| | |
| | |
| | |
| | |
Second Quarter Company Headlines
•Executes on Investment Pipeline - During the second quarter of 2025, the Company's investment spending totaled $48.6 million, bringing year-to-date investment spending to $86.3 million. Additionally, the Company has committed approximately $109.0 million for experiential development and redevelopment projects, which is expected to be funded over the next 18 months, and has a strong pipeline of potential new investments.
•Capital Recycling - The Company is outpacing its capital recycling plan and is raising its disposition proceeds guidance as discussed below. During the second quarter of 2025, the Company sold three theatre properties for total disposition proceeds of $35.6 million and recognized a net gain on sale of $16.8 million. Subsequent to quarter-end, the Company sold an additional vacant theatre property for net proceeds of approximately $16.0 million and expects to recognize a gain on this sale of approximately $3.0 million during the third quarter ending September 30, 2025.
•Strong Liquidity Position - As of June 30, 2025, the Company had cash on hand of $13.0 million and $405.0 million outstanding on its $1.0 billion unsecured revolving credit facility. During the quarter, the Company fully repaid $300.0 million in senior unsecured notes due April 1, 2025 using borrowings under its credit facility. There are no other debt maturities in the next 12 months.
•Updates 2025 Guidance - The Company is confirming FFOAA per diluted common share guidance for 2025 of $5.00 to $5.16, representing an increase of 4.3% at the midpoint over 2024. The Company is also confirming investment spending guidance for 2025 of $200.0 million to $300.0 million and increasing disposition proceeds guidance for 2025 to a range of $130.0 million to $145.0 million from a range of $80.0 million to $120.0 million.
"Our second quarter results demonstrate continued momentum in our business, with solid earnings growth while maintaining our disciplined approach to capital allocation," stated Company Chairman
and CEO Greg Silvers. "We are pleased with our ongoing capital recycling progress, where we are ahead of our expectations as we further position our portfolio with productive and diversified experiential assets. While our investment spending has been measured in the first half of the year, we have a robust pipeline of opportunities, including more than $100 million committed to experiential development and redevelopment projects in the coming quarters. With our healthy balance sheet and strong performing portfolio, we are well-equipped to pursue our growth objectives while maintaining our focus on creating long-term shareholder value."
Investment Update
The Company's investment spending during the three months ended June 30, 2025 totaled $48.6 million, bringing the total investment spending for the six months ended June 30, 2025 to $86.3 million. Investment spending for the quarter included the acquisition of land for $1.2 million and mortgage financing of $5.9 million secured by the improvements of a fitness and wellness property in Georgia and the acquisition of land for $1.6 million for a new build-to-suit eat & play property in Virginia, which has a total expected cost of approximately $19.0 million at completion in 2026. The remaining investment spending for the quarter was primarily related to experiential build-to-suit development and redevelopment projects.
As of June 30, 2025, the Company has committed approximately $109.0 million in additional spending for experiential development and redevelopment projects, which is expected to be funded over the next 18 months.
Capital Recycling
During the second quarter of 2025, the Company sold one vacant theatre property and two leased theatre properties for net proceeds totaling $35.6 million and recognized a net gain of $16.8 million. Disposition proceeds totaled $114.5 million for the six months ended June 30, 2025. Subsequent to quarter-end, the Company sold an additional vacant theatre property for net proceeds of approximately $16.0 million and expects to recognize a gain on this sale of approximately $3.0 million during the third quarter ending September 30, 2025. Accordingly, the Company is raising its 2025 guidance for disposition proceeds to $130.0 million to $145.0 million from $80.0 million to $120.0 million.
Strong Liquidity Position
The Company remains focused on maintaining strong liquidity and financial flexibility. At June 30, 2025, the Company had $13.0 million of cash on hand and $405.0 million outstanding on its $1.0 billion unsecured revolving credit facility.
Upon maturity, on April 1, 2025, the Company fully repaid $300.0 million of senior unsecured notes using borrowings under its credit facility.
Portfolio Update
The Company's total assets were $5.6 billion (after accumulated depreciation of approximately $1.6 billion) and total investments (a non-GAAP financial measure) were $6.9 billion at June 30, 2025, with Experiential investments totaling $6.5 billion, or 94%, and Education investments totaling $0.4 billion, or 6%.
The Company's Experiential portfolio (excluding property under development, undeveloped land inventory and two joint venture properties) consisted of the following property types (owned or financed) at June 30, 2025:
•151 theatre properties;
•58 eat & play properties (including seven theatres located in entertainment districts);
•25 attraction properties;
•11 ski properties;
•four experiential lodging properties;
•23 fitness & wellness properties;
•one gaming property; and
•one cultural property.
As of June 30, 2025, the Company's wholly-owned Experiential portfolio consisted of approximately 18.5 million square feet, which includes 0.2 million square feet of vacant properties the Company intends to sell. The wholly-owned Experiential portfolio, excluding the vacant properties the Company intends to sell, was 99% leased or operated and included a total of $84.2 million in property under development and $20.2 million in undeveloped land inventory.
The Company's Education portfolio consisted of the following property types (owned or financed) at June 30, 2025:
•46 early childhood education center properties; and
•nine private school properties.
As of June 30, 2025, the Company's wholly-owned Education portfolio consisted of approximately 1.1 million square feet. The wholly-owned Education portfolio was 100% leased.
The combined wholly-owned portfolio consisted of 19.6 million square feet, which includes 0.2 million square feet of vacant properties the Company intends to sell. The wholly-owned portfolio, excluding the vacant properties the Company intends to sell, was 99% leased or operated.
Dividend Information
The Company's Board of Trustees declared its monthly cash dividends during the second quarter of 2025 totaling $0.885 per share, which represents an annualized dividend of $3.54 per common share, an increase of 3.5% over the prior year's annualized dividend (based upon the monthly dividend at the end of the prior year).
Additionally, the Company declared its regular quarterly dividends to preferred shareholders of $0.359375 per share on both the Company's 5.75% Series C cumulative convertible preferred shares and Series G cumulative redeemable preferred shares and $0.5625 per share on its 9.00% Series E cumulative convertible preferred shares, payable July 15, 2025 to shareholders of record as of June 30, 2025.
Chief Investment Officer Transition
Gregory E. Zimmerman recently notified the Company of his intention to retire from his position as Executive Vice President and Chief Investment Officer in the first quarter of calendar year 2026. The Company has hired Ben Fox, who will be joining the Company in August 2025, as an Executive Vice President and is expected to succeed Mr. Zimmerman as Chief Investment Officer upon Mr. Zimmerman’s retirement from such position. Mr. Fox previously served as Managing Director in the Net Lease Division of Ares Management Corporation (“Ares”), a global alternative investment manager operating in the credit, private equity and real estate markets. Prior to Ares, Mr. Fox served as Executive Vice President, Asset Management and Operations at Realty Income, where he oversaw and managed approximately 7,000 properties across the U.S. and U.K.
Commenting on the transition, the Company’s Chairman and CEO Greg Silvers stated, “Greg has made significant contributions to the Company and while I know that he is excited to begin this next phase of his life, I likewise know that he is committed to our success and ensuring continuity in the business.”
“In addition, we are excited to welcome Ben Fox to EPR Properties. Ben has over 18 years of real estate experience and his extensive expertise in the net lease REIT business makes him an excellent fit. We are confident that Ben’s insights and forward-thinking approach will be invaluable as we continue to grow and evolve.”
2025 Guidance
(Dollars in millions, except per share data):
| | | | | | | | | | | | | | | | | | | | | | | | | | |
| | | | | | |
| | | | | | | | |
| | Current | | Prior |
| Net income available to common shareholders per diluted common share | | $ | 3.20 | | to | $ | 3.36 | | | $ | 2.98 | | to | $ | 3.14 | |
| FFOAA per diluted common share | | $ | 5.00 | | to | $ | 5.16 | | | $ | 5.00 | | to | $ | 5.16 | |
| Investment spending | | $ | 200.0 | | to | $ | 300.0 | | | $ | 200.0 | | to | $ | 300.0 | |
| Disposition proceeds | | $ | 130.0 | | to | $ | 145.0 | | | $ | 80.0 | | to | $ | 120.0 | |
The Company is confirming its 2025 earnings guidance for FFOAA per diluted common share of $5.00 to $5.16, representing an increase of 4.3% at the midpoint over 2024. The 2025 guidance for FFOAA per diluted common share is based on an FFO per diluted common share range of $4.97 to $5.13 adjusted for retirement and severance expense, transaction costs, provision (benefit) for credit losses, net, and deferred income tax benefit. FFO per diluted common share for 2025 is based on a net income available to common shareholders per diluted common share range of $3.20 to $3.36 plus estimated real estate depreciation and amortization of $2.16 and allocated share of joint venture depreciation of $0.05, less estimated gain on sale of real estate of $0.38 and the impact of Series C and Series E dilution of $0.06 (in accordance with the NAREIT definition of FFO).
Additional earnings guidance detail can be found on page 23 in the Company's supplemental information package available in the Investor Center of the Company's website located at https://investors.eprkc.com/earnings-supplementals.
Conference Call Information
Management will host a conference call to discuss the Company's financial results on July 31, 2025 at 8:30 a.m. Eastern Time. The call may also include discussion of Company developments and forward-looking and other material information about business and financial matters. The conference will be webcast and can be accessed via the Webcasts page in the Investor Center on the Company's website located at https://investors.eprkc.com/webcasts. It is recommended that you join 10 minutes prior to the start of the event (although you may register and join the webcast at any time during the call).
You may watch a replay of the webcast by visiting the Webcasts page at https://investors.eprkc.com/webcasts.
Quarterly Supplemental
The Company's supplemental information package for the second quarter and six months ended June 30, 2025 is available in the Investor Center on the Company's website located at https://investors.eprkc.com/earnings-supplementals.
EPR Properties
Consolidated Statements of Income
(Unaudited, dollars in thousands except per share data)
| | | | | | | | | | | | | | | | | | | | | | | |
| | Three Months Ended June 30, | | Six Months Ended June 30, |
| | 2025 | | 2024 | | 2025 | | 2024 |
| Rental revenue | $ | 150,351 | | | $ | 145,093 | | | $ | 296,710 | | | $ | 287,374 | |
| Other income | 12,218 | | | 14,418 | | | 23,854 | | | 26,455 | |
| Mortgage and other financing income | 15,499 | | | 13,584 | | | 32,537 | | | 26,498 | |
| Total revenue | 178,068 | | | 173,095 | | | 353,101 | | | 340,327 | |
| Property operating expense | 14,661 | | | 14,427 | | | 29,832 | | | 29,347 | |
| Other expense | 11,959 | | | 14,833 | | | 24,570 | | | 27,809 | |
| General and administrative expense | 13,230 | | | 12,020 | | | 27,254 | | | 25,928 | |
| Retirement and severance expense | — | | | — | | | — | | | 1,836 | |
| | | | | | | |
| Transaction costs | 669 | | | 199 | | | 1,236 | | | 200 | |
| Provision (benefit) for credit losses, net | 997 | | | 404 | | | 345 | | | 3,141 | |
| Impairment charges | — | | | 11,812 | | | — | | | 11,812 | |
| Depreciation and amortization | 42,080 | | | 41,474 | | | 83,169 | | | 81,943 | |
| Total operating expenses | 83,596 | | | 95,169 | | | 166,406 | | | 182,016 | |
| Gain on sale of real estate | 16,779 | | | 1,459 | | | 26,163 | | | 19,408 | |
| | | | | | | |
| Income from operations | 111,251 | | | 79,385 | | | 212,858 | | | 177,719 | |
| | | | | | | |
| | | | | | | |
| Interest expense, net | 33,246 | | | 32,820 | | | 66,267 | | | 64,471 | |
| Equity in loss from joint ventures | 1,681 | | | 906 | | | 4,328 | | | 4,533 | |
| | | | | | | |
| Income before income taxes | 76,324 | | | 45,659 | | | 142,263 | | | 108,715 | |
| Income tax expense | 681 | | | 557 | | | 817 | | | 904 | |
| Net income | $ | 75,643 | | | $ | 45,102 | | | $ | 141,446 | | | $ | 107,811 | |
| | | | | | | |
| | | | | | | |
| | | | | | | |
| | | | | | | |
| | | | | | | |
| | | | | | | |
| | | | | | | |
| | | | | | | |
| | | | | | | |
| | | | | | | |
| Preferred dividend requirements | 6,040 | | | 6,040 | | | 12,072 | | | 12,072 | |
| | | | | | | |
| Net income available to common shareholders of EPR Properties | $ | 69,603 | | | $ | 39,062 | | | $ | 129,374 | | | $ | 95,739 | |
| Net income available to common shareholders of EPR Properties per share: | | | | | | | |
| | | | | | | |
| | | | | | | |
| Basic | $ | 0.91 | | | $ | 0.52 | | | $ | 1.70 | | | $ | 1.27 | |
| | | | | | | |
| | | | | | | |
| | | | | | | |
| Diluted | $ | 0.91 | | | $ | 0.51 | | | $ | 1.69 | | | $ | 1.26 | |
| Shares used for computation (in thousands): | | | | | | | |
| Basic | 76,083 | | | 75,689 | | | 75,944 | | | 75,543 | |
| Diluted | 76,571 | | | 76,022 | | | 76,404 | | | 75,861 | |
EPR Properties
Condensed Consolidated Balance Sheets
(Unaudited, dollars in thousands)
| | | | | | | | | | | |
| |
| | June 30, 2025 | | December 31, 2024 |
| Assets | | | |
Real estate investments, net of accumulated depreciation of $1,641,916 and $1,562,645 at June 30, 2025 and December 31, 2024, respectively | $ | 4,402,379 | | | $ | 4,435,358 | |
| Land held for development | 20,168 | | | 20,168 | |
| Property under development | 84,195 | | | 112,263 | |
| Operating lease right-of-use assets | 177,919 | | | 173,364 | |
Mortgage notes and related accrued interest receivable, net of allowance for credit losses of $7,149 and $17,111 at June 30, 2025 and December 31, 2024, respectively | 666,154 | | | 665,796 | |
| | | |
| Investment in joint ventures | 9,680 | | | 14,019 | |
| Cash and cash equivalents | 12,955 | | | 22,062 | |
| Restricted cash | 15,765 | | | 13,637 | |
| | | |
| Accounts receivable | 94,514 | | | 84,589 | |
| | | |
| Other assets | 77,151 | | | 75,251 | |
| Total assets | $ | 5,560,880 | | | $ | 5,616,507 | |
| Liabilities and Equity | | | |
| Accounts payable and accrued liabilities | $ | 101,543 | | | $ | 107,976 | |
| Operating lease liabilities | 216,411 | | | 212,400 | |
| Dividends payable | 28,486 | | | 31,863 | |
| Unearned rents and interest | 90,379 | | | 80,565 | |
| Debt | 2,792,970 | | | 2,860,458 | |
| Total liabilities | 3,229,789 | | | 3,293,262 | |
| | | |
| | | |
| Total equity | $ | 2,331,091 | | | $ | 2,323,245 | |
| Total liabilities and equity | $ | 5,560,880 | | | $ | 5,616,507 | |
Non-GAAP Financial Measures
Funds From Operations (FFO), Funds From Operations As Adjusted (FFOAA) and Adjusted Funds From Operations (AFFO)
The National Association of Real Estate Investment Trusts (NAREIT) developed FFO as a relative non-GAAP financial measure of performance of an equity REIT in order to recognize that income-producing real estate historically has not depreciated on the basis determined under GAAP. Pursuant to the definition of FFO by the Board of Governors of NAREIT, the Company calculates FFO as net income available to common shareholders, computed in accordance with GAAP, excluding gains and losses from disposition of real estate and impairment losses on real estate, plus real estate related depreciation and amortization, and after adjustments for unconsolidated partnerships, joint ventures and other affiliates. Adjustments for unconsolidated partnerships, joint ventures and other affiliates are calculated to reflect FFO on the same basis. The Company has calculated FFO for all periods presented in accordance with this definition.
In addition to FFO, the Company presents FFOAA and AFFO. FFOAA is presented by adding to FFO retirement and severance expense, transaction costs, provision (benefit) for credit losses, net, costs associated with loan refinancing or payoff, preferred share redemption costs and impairment of operating lease right-of-use assets and subtracting sale participation income, gain on insurance recovery and deferred income tax (benefit) expense. AFFO is presented by adding to FFOAA non-real estate depreciation and amortization, deferred financing fees amortization and share-based compensation expense to management and Trustees; and subtracting amortization of above and below market leases, net and tenant allowances, maintenance capital expenditures (including second generation tenant improvements and leasing commissions), straight-lined rental revenue (removing the impact of straight-lined ground sublease expense), the non-cash portion of mortgage and other financing income and the allocated share of joint venture non-cash items.
FFO, FFOAA and AFFO are widely used measures of the operating performance of real estate companies and are provided here as supplemental measures to GAAP net income available to common shareholders and earnings per share, and management provides FFO, FFOAA and AFFO herein because it believes this information is useful to investors in this regard. FFO, FFOAA and AFFO are non-GAAP financial measures. FFO, FFOAA and AFFO do not represent cash flows from operations as defined by GAAP and are not indicative that cash flows are adequate to fund all cash needs and are not to be considered alternatives to net income or any other GAAP measure as a measurement of the results of our operations or our cash flows or liquidity as defined by GAAP. It should also be noted that not all REITs calculate FFO, FFOAA and AFFO the same way so comparisons with other REITs may not be meaningful.
The following table summarizes FFO, FFOAA and AFFO including per share amounts for FFO and FFOAA, for the three and six months ended June 30, 2025 and 2024 and reconciles such measures to net income available to common shareholders, the most directly comparable GAAP measure:
EPR Properties
Reconciliation of Non-GAAP Financial Measures
(Unaudited, dollars in thousands except per share data)
| | | | | | | | | | | | | | | | | | | | | | | | | | |
| | | Three Months Ended June 30, | | Six Months Ended June 30, |
| | | 2025 | | 2024 | | 2025 | | 2024 |
| FFO: | | | | | | | |
| Net income available to common shareholders of EPR Properties | $ | 69,603 | | | $ | 39,062 | | | $ | 129,374 | | | $ | 95,739 | |
| Gain on sale of real estate | (16,779) | | | (1,459) | | | (26,163) | | | (19,408) | |
| | | | | | | |
| Impairment of real estate investments | — | | | 11,812 | | | — | | | 11,812 | |
| Real estate depreciation and amortization | 41,939 | | | 41,289 | | | 82,871 | | | 81,571 | |
| Allocated share of joint venture depreciation | 985 | | | 2,457 | | | 2,021 | | | 4,873 | |
| | | | | | | |
| FFO available to common shareholders of EPR Properties | $ | 95,748 | | | $ | 93,161 | | | $ | 188,103 | | | $ | 174,587 | |
| | | | | | | | |
| FFO available to common shareholders of EPR Properties | $ | 95,748 | | | $ | 93,161 | | | $ | 188,103 | | | $ | 174,587 | |
| Add: Preferred dividends for Series C preferred shares | 1,938 | | | 1,938 | | | 3,876 | | | 3,876 | |
| Add: Preferred dividends for Series E preferred shares | 1,938 | | | 1,938 | | | 3,876 | | | 3,876 | |
| Diluted FFO available to common shareholders of EPR Properties | $ | 99,624 | | | $ | 97,037 | | | $ | 195,855 | | | $ | 182,339 | |
| | | | | | | |
| FFOAA: | | | | | | | |
| FFO available to common shareholders of EPR Properties | $ | 95,748 | | | $ | 93,161 | | | $ | 188,103 | | | $ | 174,587 | |
| Retirement and severance expense | — | | | — | | | — | | | 1,836 | |
| Transaction costs | 669 | | | 199 | | | 1,236 | | | 200 | |
| | | | | | | |
| | | | | | | |
| | | | | | | |
| Provision (benefit) for credit losses, net | 997 | | | 404 | | | 345 | | | 3,141 | |
| | | | | | | |
| | | | | | | |
| | | | | | | |
| | | | | | | |
| | | | | | | |
| Deferred income tax benefit | (93) | | | (249) | | | (623) | | | (526) | |
| FFOAA available to common shareholders of EPR Properties | $ | 97,321 | | | $ | 93,515 | | | $ | 189,061 | | | $ | 179,238 | |
| | | | | | | | |
| FFOAA available to common shareholders of EPR Properties | $ | 97,321 | | | $ | 93,515 | | | $ | 189,061 | | | $ | 179,238 | |
| Add: Preferred dividends for Series C preferred shares | 1,938 | | | 1,938 | | | 3,876 | | | 3,876 | |
| Add: Preferred dividends for Series E preferred shares | 1,938 | | | 1,938 | | | 3,876 | | | 3,876 | |
| Diluted FFOAA available to common shareholders of EPR Properties | $ | 101,197 | | | $ | 97,391 | | | $ | 196,813 | | | $ | 186,990 | |
| | | | | | | |
| | | | | | | | | | | | | | | | | | | | | | | | | | |
| | | Three Months Ended June 30, | | Six Months Ended June 30, |
| | | 2025 | | 2024 | | 2025 | | 2024 |
| AFFO: | | | | | | |
| FFOAA available to common shareholders of EPR Properties | $ | 97,321 | | | $ | 93,515 | | | $ | 189,061 | | | $ | 179,238 | |
| Non-real estate depreciation and amortization | 141 | | | 185 | | | 298 | | | 372 | |
| Deferred financing fees amortization | 2,102 | | | 2,234 | | | 4,308 | | | 4,446 | |
| Share-based compensation expense to management and trustees | 3,912 | | | 3,538 | | | 7,779 | | | 7,230 | |
| Amortization of above and below market leases, net and tenant allowances | (81) | | | (84) | | | (162) | | | (168) | |
| Maintenance capital expenditures (1) | (1,858) | | | (1,321) | | | (3,109) | | | (2,876) | |
| Straight-lined rental revenue | (5,137) | | | (5,251) | | | (8,534) | | | (8,921) | |
| Straight-lined ground sublease expense | — | | | 25 | | | 2 | | | 57 | |
| Non-cash portion of mortgage and other financing income | (566) | | | (555) | | | (863) | | | (1,417) | |
| | | | | | | |
| AFFO available to common shareholders of EPR Properties | $ | 95,834 | | | $ | 92,286 | | | $ | 188,780 | | | $ | 177,961 | |
| | | | | | | |
| AFFO available to common shareholders of EPR Properties | $ | 95,834 | | | $ | 92,286 | | | $ | 188,780 | | | $ | 177,961 | |
| Add: Preferred dividends for Series C preferred shares | 1,938 | | | 1,938 | | | 3,876 | | | 3,876 | |
| Add: Preferred dividends for Series E preferred shares | 1,938 | | | 1,938 | | | 3,876 | | | 3,876 | |
| Diluted AFFO available to common shareholders of EPR Properties | $ | 99,710 | | | $ | 96,162 | | | $ | 196,532 | | | $ | 185,713 | |
| | | | | | | |
| FFO per common share: | | | | | | | |
| Basic | $ | 1.26 | | | $ | 1.23 | | | $ | 2.48 | | | $ | 2.31 | |
| Diluted | 1.24 | | | 1.21 | | | 2.44 | | | 2.28 | |
| FFOAA per common share: | | | | | | | |
| Basic | $ | 1.28 | | | $ | 1.24 | | | $ | 2.49 | | | $ | 2.37 | |
| Diluted | 1.26 | | | 1.22 | | | 2.45 | | | 2.34 | |
| AFFO per common share: | | | | | | | |
| Basic | $ | 1.26 | | | $ | 1.22 | | | $ | 2.49 | | | $ | 2.36 | |
| Diluted | 1.24 | | | 1.20 | | | 2.44 | | | 2.33 | |
| Shares used for computation (in thousands): | | | | | | | |
| Basic | 76,083 | | | 75,689 | | | 75,944 | | | 75,543 | |
| Diluted | 76,571 | | | 76,022 | | | 76,404 | | | 75,861 | |
| | | | | | | | |
| Weighted average shares outstanding-diluted EPS | 76,571 | | | 76,022 | | | 76,404 | | | 75,861 | |
| Effect of dilutive Series C preferred shares | 2,344 | | | 2,310 | | | 2,340 | | | 2,306 | |
| | | | | | | |
| Effect of dilutive Series E preferred shares | 1,667 | | | 1,664 | | | 1,666 | | | 1,663 | |
| Adjusted weighted average shares outstanding-diluted Series C and Series E | 80,582 | | | 79,996 | | | 80,410 | | | 79,830 | |
| Other financial information: | | | | | | | |
| | | | | | | |
| Dividends per common share | $ | 0.885 | | | $ | 0.855 | | | $ | 1.750 | | | $ | 1.690 | |
| | | | | | | | |
(1) Includes maintenance capital expenditures and certain second generation tenant improvements and leasing commissions.
The conversion of the 5.75% Series C cumulative convertible preferred shares and the 9.00% Series E cumulative convertible preferred shares would be dilutive to FFO, FFOAA and AFFO per share for the three and six months ended June 30, 2025 and 2024. Therefore, the additional common
shares that would result from the conversion and the corresponding add-back of the preferred dividends declared on those shares are included in the calculation of diluted FFO, FFOAA and AFFO per share for those periods.
Net Debt
Net Debt represents debt (reported in accordance with GAAP) adjusted to exclude deferred financing costs, net and reduced for cash and cash equivalents. By excluding deferred financing costs, net, and reducing debt for cash and cash equivalents on hand, the result provides an estimate of the contractual amount of borrowed capital to be repaid, net of cash available to repay it. The Company believes this calculation constitutes a beneficial supplemental non-GAAP financial disclosure to investors in understanding our financial condition. The Company's method of calculating Net Debt may be different from methods used by other REITs and, accordingly, may not be comparable to such other REITs.
Gross Assets
Gross Assets represents total assets (reported in accordance with GAAP) adjusted to exclude accumulated depreciation and reduced by cash and cash equivalents. By excluding accumulated depreciation and reducing cash and cash equivalents, the result provides an estimate of the investment made by the Company. The Company believes that investors commonly use versions of this calculation in a similar manner. The Company's method of calculating Gross Assets may be different from methods used by other REITs and, accordingly, may not be comparable to such other REITs.
Net Debt to Gross Assets Ratio
Net Debt to Gross Assets Ratio is a supplemental measure derived from non-GAAP financial measures that the Company uses to evaluate capital structure and the magnitude of debt to gross assets. The Company believes that investors commonly use versions of this ratio in a similar manner. The Company's method of calculating the Net Debt to Gross Assets Ratio may be different from methods used by other REITs and, accordingly, may not be comparable to such other REITs.
EBITDAre
NAREIT developed EBITDAre as a relative non-GAAP financial measure of REITs, independent of a company's capital structure, to provide a uniform basis to measure the enterprise value of a company. Pursuant to the definition of EBITDAre by the Board of Governors of NAREIT, the Company calculates EBITDAre as net income, computed in accordance with GAAP, excluding interest expense (net), income tax (benefit) expense, depreciation and amortization, gains and losses from dispositions of real estate, impairment losses on real estate, costs associated with loan refinancing or payoff and adjustments for unconsolidated partnerships, joint ventures and other affiliates.
Management provides EBITDAre herein because it believes this information is useful to investors as a supplemental performance measure because it can help facilitate comparisons of operating performance between periods and with other REITs. The Company's method of calculating EBITDAre may be different from methods used by other REITs and, accordingly, may not be comparable to such other REITs. EBITDAre is not a measure of performance under GAAP, does not represent cash generated from operations as defined by GAAP and is not indicative of cash available to fund all cash needs, including distributions. This measure should not be considered an alternative to net income or any other GAAP measure as a measurement of the results of the Company's operations or cash flows or liquidity as defined by GAAP.
Adjusted EBITDAre
Management uses Adjusted EBITDAre in its analysis of the performance of the business and operations of the Company. Management believes Adjusted EBITDAre is useful to investors because it excludes various items that management believes are not indicative of operating performance, and because it is an informative measure to use in computing various financial ratios to evaluate the Company. The Company defines Adjusted EBITDAre as EBITDAre (defined above) for the quarter excluding sale participation income, gain on insurance recovery, retirement and
severance expense, transaction costs, provision (benefit) for credit losses, net, impairment losses on operating lease right-of-use assets and prepayment fees.
The Company's method of calculating Adjusted EBITDAre may be different from methods used by other REITs and, accordingly, may not be comparable to such other REITs. Adjusted EBITDAre is not a measure of performance under GAAP, does not represent cash generated from operations as defined by GAAP and is not indicative of cash available to fund all cash needs, including distributions. This measure should not be considered as an alternative to net income or any other GAAP measure as a measurement of the results of the Company's operations or cash flows or liquidity as defined by GAAP.
Net Debt to Adjusted EBITDAre Ratio
Net Debt to Adjusted EBITDAre Ratio is a supplemental measure derived from non-GAAP financial measures that the Company uses to evaluate our capital structure and the magnitude of our debt against our operating performance. The Company believes that investors commonly use versions of this ratio in a similar manner. In addition, financial institutions use versions of this ratio in connection with debt agreements to set pricing and covenant limitations. The Company's method of calculating the Net Debt to Adjusted EBITDAre Ratio may be different from methods used by other REITs and, accordingly, may not be comparable to such other REITs.
Reconciliations of debt, total assets and net income (all reported in accordance with GAAP) to Net Debt, Gross Assets, Net Debt to Gross Assets Ratio, EBITDAre, Adjusted EBITDAre and Net Debt to Adjusted EBITDAre Ratio (each of which is a non-GAAP financial measure), as applicable, are included in the following tables (unaudited, in thousands except ratios):
| | | | | | | | | | | |
| June 30, |
| 2025 | | 2024 |
| Net Debt: | | | |
| Debt | $ | 2,792,970 | | $ | 2,819,029 |
| Deferred financing costs, net | 16,622 | | 22,200 |
| Cash and cash equivalents | (12,955) | | (33,731) |
| Net Debt | $ | 2,796,637 | | $ | 2,807,498 |
| | | |
| Gross Assets: | | | |
| Total Assets | $ | 5,560,880 | | $ | 5,645,367 |
| Accumulated depreciation | 1,641,916 | | 1,504,427 |
| Cash and cash equivalents | (12,955) | | (33,731) |
| Gross Assets | $ | 7,189,841 | | $ | 7,116,063 |
| | | |
| Debt to Total Assets Ratio | 50 | % | | 50 | % |
| Net Debt to Gross Assets Ratio | 39 | % | | 39 | % |
| | | |
| Three Months Ended June 30, |
| 2025 | | 2024 |
| EBITDAre and Adjusted EBITDAre: | | | |
| Net income | $ | 75,643 | | | $ | 45,102 | |
| Interest expense, net | 33,246 | | | 32,820 | |
| Income tax expense | 681 | | | 557 | |
| Depreciation and amortization | 42,080 | | | 41,474 | |
| Gain on sale of real estate | (16,779) | | | (1,459) | |
| Impairment of real estate investments | — | | | 11,812 | |
| | | |
| | | |
| | | |
| | | |
| | | |
| Allocated share of joint venture depreciation | 985 | | | 2,457 | |
| Allocated share of joint venture interest expense | 430 | | | 2,310 | |
| | | |
| EBITDAre | $ | 136,286 | | | $ | 135,073 | |
| | | |
| | | |
| | | |
| | | |
| | | |
| | | |
| Transaction costs | 669 | | | 199 | |
| Provision (benefit) for credit losses, net | 997 | | | 404 | |
| | | |
| | | |
| | | |
| | | |
| Adjusted EBITDAre (for the quarter) | $ | 137,952 | | | $ | 135,676 | |
| | | |
| Adjusted EBITDAre (annualized) (1) | $ | 551,808 | | | $ | 542,704 | |
| | | |
| Net Debt/Adjusted EBITDAre Ratio | 5.1 | | | 5.2 | |
| | | |
|
|
| |
| | | |
| | | |
| | | |
| | | |
| | | |
| | | |
| | | |
| | | |
|
| |
| | | |
| | | |
| | | |
| | | |
| | | |
| | | |
| | | |
| | | |
| | | |
| | | |
|
| |
| | | |
| | | |
| | | |
| | | |
| | | |
| | | |
|
(1) Adjusted EBITDA for the quarter is multiplied by four to calculate an annualized amount but does not include the annualization of investments put in service, acquired or disposed of during the quarter, as well as the potential earnings on property under development, the annualization of percentage rent and participating interest and adjustments for other items. See detailed calculation and reconciliation of Annualized Adjusted EBITDAre and Net Debt/Annualized EBITDAre ratio that includes these adjustments in the Company's Supplemental Operating and Financial Data for the quarter ended June 30, 2025. |
Total Investments
Total investments is a non-GAAP financial measure defined as the sum of the carrying values of real estate investments (before accumulated depreciation), land held for development, property under development, mortgage notes receivable and related accrued interest receivable, net, investment in joint ventures, intangible assets, gross (before accumulated amortization and included in other assets) and notes receivable and related accrued interest receivable, net (included in other assets). Total investments is a useful measure for management and investors as it illustrates across which asset categories the Company's funds have been invested. Our method of calculating total investments may be different from methods used by other REITs and, accordingly, may not be comparable to such other REITs. A reconciliation of total assets (computed in accordance with GAAP) to total investments is included in the following table (unaudited, in thousands):
| | | | | | | | | | | |
| June 30, 2025 | | December 31, 2024 |
| | | |
| Total assets | $ | 5,560,880 | | | $ | 5,616,507 | |
| Operating lease right-of-use assets | (177,919) | | | (173,364) | |
| Cash and cash equivalents | (12,955) | | | (22,062) | |
| Restricted cash | (15,765) | | | (13,637) | |
| Accounts receivable | (94,514) | | | (84,589) | |
| Add: accumulated depreciation on real estate investments | 1,641,916 | | | 1,562,645 | |
| Add: accumulated amortization on intangible assets (1) | 30,456 | | | 31,876 | |
| Prepaid expenses and other current assets (1) | (41,300) | | | (39,464) | |
| Total investments | $ | 6,890,799 | | | $ | 6,877,912 | |
| | | |
| Total Investments: | | | |
| Real estate investments, net of accumulated depreciation | $ | 4,402,379 | | | $ | 4,435,358 | |
| Add back accumulated depreciation on real estate investments | 1,641,916 | | | 1,562,645 | |
| Land held for development | 20,168 | | | 20,168 | |
| Property under development | 84,195 | | | 112,263 | |
| Mortgage notes and related accrued interest receivable, net | 666,154 | | | 665,796 | |
| | | |
| Investment in joint ventures | 9,680 | | | 14,019 | |
| Intangible assets, gross (1) | 63,239 | | | 64,317 | |
| Notes receivable and related accrued interest receivable, net (1) | 3,068 | | | 3,346 | |
| Total investments | $ | 6,890,799 | | | $ | 6,877,912 | |
| | | |
| (1) Included in other assets in the accompanying consolidated balance sheet. Other assets include the following: |
| | | |
| June 30, 2025 | | December 31, 2024 |
| Intangible assets, gross | $ | 63,239 | | | $ | 64,317 | |
| Less: accumulated amortization on intangible assets | (30,456) | | | (31,876) | |
| Notes receivable and related accrued interest receivable, net | 3,068 | | | 3,346 | |
| Prepaid expenses and other current assets | 41,300 | | | 39,464 | |
| Total other assets | $ | 77,151 | | | $ | 75,251 | |
About EPR Properties
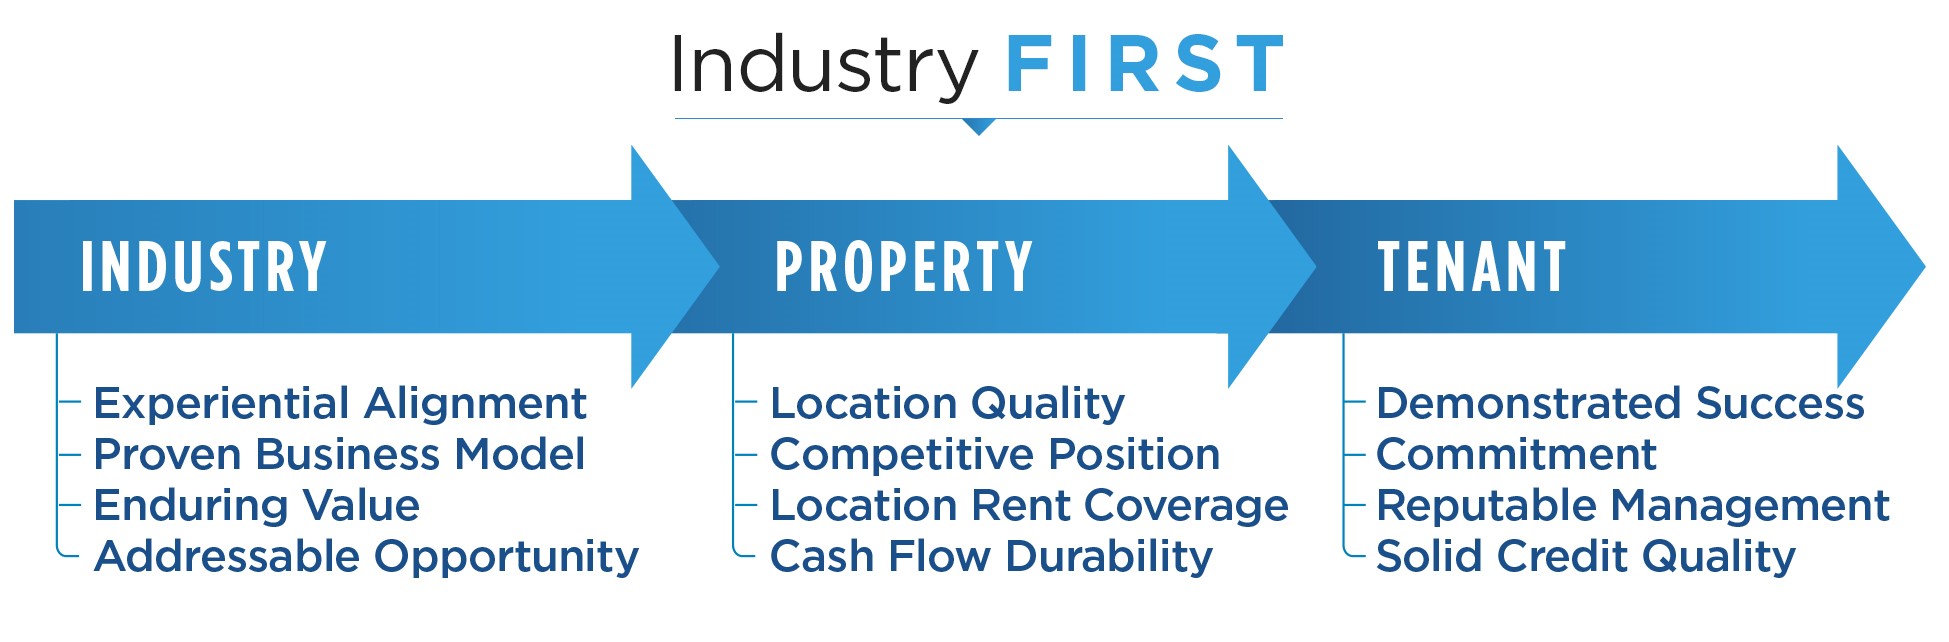
EPR Properties (NYSE:EPR) is the leading diversified experiential net lease real estate investment trust (REIT), specializing in select enduring experiential properties in the real estate industry. We focus on real estate venues that create value by facilitating out of home leisure and recreation experiences where consumers choose to spend their discretionary time and money. We have total assets of approximately $5.6 billion (after accumulated depreciation of approximately $1.6 billion) across 43 states. We adhere to rigorous underwriting and investing criteria centered on key industry, property and tenant level cash flow standards. We believe our focused approach provides a competitive advantage and the potential for stable and attractive returns. Further information is available at www.eprkc.com.
CAUTIONARY STATEMENT CONCERNING FORWARD-LOOKING STATEMENTS
The financial results in this press release reflect preliminary, unaudited results, which are not final until the Company’s Quarterly Report on Form 10-Q is filed. With the exception of historical information, certain statements contained or incorporated by reference herein may contain forward-looking statements within the meaning of Section 27A of the Securities Act of 1933, as amended (the “Securities Act”), and Section 21E of the Securities Exchange Act of 1934, as amended (the “Exchange Act”), such as those pertaining to our guidance, our capital resources and liquidity, our pursuit of growth opportunities, the timing of transaction closings and investment spending, our ongoing negotiations to exit from certain joint ventures or the ultimate terms of any such exit, our expected cash flows, the performance of our customers, our expected cash collections and our results of operations and financial condition. The forward-looking statements presented herein are based on the Company's current expectations. Forward-looking statements involve numerous risks and uncertainties, and you should not rely on them as predictions of actual events. There is no assurance that the events or circumstances reflected in the forward-looking statements will occur. You can identify forward-looking statements by use of words such as “will be,” “intend,” “continue,” “believe,” “may,” “expect,” “hope,” “anticipate,” “goal,” “forecast,” “pipeline,” “estimates,” “offers,” “plans,” “would” or other similar expressions or other comparable terms or discussions of strategy, plans or intentions contained or incorporated by reference herein. Forward-looking statements necessarily are dependent on assumptions, data or methods that may be incorrect or imprecise. These forward-looking statements represent our intentions, plans, expectations and beliefs and are subject to numerous assumptions, risks and uncertainties. Many of the factors that will determine these items are beyond our ability to control or predict. For further discussion of these factors see “Item 1A. Risk Factors” in our most recent Annual Report on Form 10-K and, to the extent applicable, our Quarterly Reports on Form 10-Q.
For these statements, we claim the protection of the safe harbor for forward-looking statements contained in the Private Securities Litigation Reform Act of 1995. You are cautioned not to place undue reliance on our forward-looking statements, which speak only as of the date hereof or the date of any document incorporated by reference herein. All subsequent written and oral forward-looking statements attributable to us or any person acting on our behalf are expressly qualified in their entirety by the cautionary statements contained or referred to in this section. Except as required by law, we do not undertake any obligation to release publicly any revisions to our forward-looking statements to reflect events or circumstances after the date hereof.
EPR Properties
Brian Moriarty, 816-472-1700
www.eprkc.com
| | | | | | | | | | | | | | | | | | | | | | | | | | |
| TABLE OF CONTENTS |
| | | | | | | | |
| SECTION | | | | | | | | PAGE |
| | | | | | | | |
| Company Profile | |
| Investor Information | |
| Selected Financial Information | |
| Selected Balance Sheet Information | |
| Selected Operating Data | |
| Funds From Operations and Funds From Operations as Adjusted | |
| Adjusted Funds From Operations | |
| Capital Structure | |
| Summary of Ratios | |
| Summary of Mortgage Notes Receivable | |
| |
| Investment Spending and Disposition Summaries | |
| Property Under Development - Investment Spending Estimates | |
| Portfolio Detail | |
| |
| Lease Expirations | |
| Top Ten Customers by Total Revenue | |
| |
| Guidance | |
| Definitions-Non-GAAP Financial Measures | |
| Appendix-Reconciliation of Certain Non-GAAP Financial Measures | |
| | | | | | | | |
| | |
| Q2 2025 Supplemental | Page 2 |
| |
| | | | | | | | | | | | | | |
| CAUTIONARY STATEMENT CONCERNING FORWARD-LOOKING STATEMENTS |
The financial results in this document reflect preliminary, unaudited results, which are not final until the Company’s Quarterly Report on Form 10-Q is filed. With the exception of historical information, certain statements contained or incorporated by reference herein may contain forward-looking statements within the meaning of Section 27A of the Securities Act of 1933, as amended (the “Securities Act”), and Section 21E of the Securities Exchange Act of 1934, as amended (the “Exchange Act”), such as those pertaining to our guidance, our capital resources and liquidity, our pursuit of growth opportunities, the timing of transaction closings and investment spending, our ongoing negotiations to exit from certain joint ventures or the ultimate terms of any such exit, our expected cash flows, the performance of our customers, our expected cash collections and our results of operations and financial condition. Forward-looking statements involve numerous risks and uncertainties, and you should not rely on them as predictions of actual events. There is no assurance that the events or circumstances reflected in the forward-looking statements will occur. You can identify forward-looking statements by use of words such as “will be,” “intend,” “continue,” “believe,” “may,” “expect,” “hope,” “anticipate,” “goal,” “forecast,” “pipeline,” “estimates,” “offers,” “plans,” “would” or other similar expressions or other comparable terms or discussions of strategy, plans or intentions contained or incorporated by reference herein. Forward-looking statements necessarily are dependent on assumptions, data or methods that may be incorrect or imprecise. These forward-looking statements represent our intentions, plans, expectations and beliefs and are subject to numerous assumptions, risks and uncertainties. Many of the factors that will determine these items are beyond our ability to control or predict. For further discussion of these factors see “Item 1A. Risk Factors” in our most recent Annual Report on Form 10-K and, to the extent applicable, our Quarterly Reports on Form 10-Q.
For these statements, we claim the protection of the safe harbor for forward-looking statements contained in the Private Securities Litigation Reform Act of 1995. You are cautioned not to place undue reliance on our forward-looking statements, which speak only as of the date hereof or the date of any document incorporated by reference herein. All subsequent written and oral forward-looking statements attributable to us or any person acting on our behalf are expressly qualified in their entirety by the cautionary statements contained or referred to in this section. Except as required by law, we do not undertake any obligation to release publicly any revisions to our forward-looking statements to reflect events or circumstances after the date hereof.
NON-GAAP INFORMATION
This document contains certain non-GAAP measures. These non-GAAP measures, as calculated by the Company, are not necessarily comparable to similarly titled measures reported by other companies. Additionally, these non-GAAP measures are not measurements of financial performance or liquidity under GAAP and should not be considered alternatives to the Company's other financial information determined under GAAP. See pages 24 through 26 for definitions of certain non-GAAP financial measures used in this document and the reconciliations of certain non-GAAP measures on pages 9 and 10 and in the Appendix on pages 27 through 31.
| | | | | | | | |
| | |
| Q2 2025 Supplemental | Page 3 |
| |
| | | | | | | | |
| THE COMPANY | | COMPANY STRATEGY |
| EPR Properties ("we," "us," "our," "EPR" or the "Company") is a self-administered and self-managed real estate investment trust. EPR was formed in August 1997 as a Maryland real estate investment trust ("REIT"), and an initial public offering was completed on November 18, 1997. | | Our primary business objective is to enhance shareholder value by achieving predictable growth in Funds from Operations As Adjusted ("FFOAA") and dividends per share. |
| Our strategic growth is focused on acquiring or developing a diversified portfolio of experiential real estate venues which create value by facilitating out of home congregate entertainment, recreation and leisure experiences where consumers choose to spend their discretionary time and money. This strategy is driven by the long-term trends of the growing experience economy. |
| Since that time, the Company has been a leading Experiential net lease REIT, specializing in select enduring experiential properties. We are focused on growing our Experiential portfolio with properties that offer a variety of enduring, congregate entertainment, recreation and leisure activities. Separately, our Education portfolio is a legacy investment that provides additional geographic and operator diversity. | |
| This focus is consistent with our depth of knowledge across each of our property types, creating a competitive advantage that allows us to more quickly identify key market trends. We deliberately apply information and our ingenuity to target properties that represent logical extensions within each of our existing property types or potential future investments. |
| |
| As part of our strategic planning and portfolio management process we assess new opportunities against the following underwriting principles: |
| |
|
|
|
|
|
| | | | | | | | | | | | | | | | | | | | |
| BUILDING THE PREMIER EXPERIENTIAL REAL ESTATE PORTFOLIO |
| | | | | | |
| | | | | | |
| | | | | | | | |
| | |
| Q2 2025 Supplemental | Page 4 |
| |
| | | | | | | | |
| INVESTOR INFORMATION |
| SENIOR MANAGEMENT |
| Greg Silvers | | Mark Peterson |
| Chairman and Chief Executive Officer | | Executive Vice President and Chief Financial Officer |
| | |
| Tonya Mater | | Greg Zimmerman |
| Senior Vice President and Chief Accounting Officer | | Executive Vice President and Chief Investment Officer |
| | |
| Paul Turvey | | Elizabeth Grace |
| Senior Vice President, General Counsel and Secretary | | Senior Vice President - Human Resources and Administration |
| | |
| Brian Moriarty | | Gwen Johnson |
| Senior Vice President - Corporate Communications | | Senior Vice President - Asset Management |
| | |
| | | | | | | | |
| COMPANY INFORMATION |
| | |
| CORPORATE HEADQUARTERS | | TRADING SYMBOLS |
| 909 Walnut Street, Suite 200 | | Common Stock: |
| Kansas City, MO 64106 | | EPR |
| 816-472-1700 | | Preferred Stock: |
| www.eprkc.com | | EPR-PrC |
| STOCK EXCHANGE LISTING | | EPR-PrE |
| New York Stock Exchange | | EPR-PrG |
| | | | | | | | |
| EQUITY RESEARCH COVERAGE |
| | |
| Bank of America Merrill Lynch | Jana Galan | 646-855-5042 |
| Citi Global Markets | Nick Joseph/Smedes Rose | 212-816-6243 |
| | |
| Citizens Capital Markets & Advisory | Mitch Germain | 212-906-3537 |
| Janney Montgomery Scott | Rob Stevenson | 646-840-3217 |
| J.P. Morgan | Anthony Paolone | 212-622-6682 |
| Kansas City Capital Associates | Jonathan Braatz | 816-932-8019 |
| KeyBanc Capital Markets | Todd Thomas | 917-368-2286 |
| | |
| Raymond James & Associates | RJ Milligan | 727-567-2585 |
| RBC Capital Markets | Michael Carroll | 440-715-2649 |
| Stifel | Simon Yarmak | 443-224-1345 |
| Truist | Ki Bin Kim | 212-303-4124 |
| UBS | Michael Goldsmith | 212-713-2951 |
| Wells Fargo | James Feldman/ John Kilichowski | 212-214-5311 |
EPR Properties is followed by the analysts identified above. Please note that any opinions, estimates, forecasts or recommendations regarding EPR Properties’ performance made by these analysts are theirs alone and do not represent opinions, estimates, forecasts or recommendations of EPR Properties or its management. EPR Properties does not by its reference above or distribution imply its endorsement of or concurrence with such information, conclusions or recommendations.
| | | | | | | | |
| | |
| Q2 2025 Supplemental | Page 5 |
| |
| | | | | | | | | | | | | | | | | | | | | | | |
| SELECTED FINANCIAL INFORMATION |
| (UNAUDITED, DOLLARS AND SHARES IN THOUSANDS) |
| THREE MONTHS ENDED JUNE 30, | | SIX MONTHS ENDED JUNE 30, |
| OPERATING INFORMATION: | 2025 | | 2024 | | 2025 | | 2024 |
| Revenue | $ | 178,068 | | | $ | 173,095 | | | $ | 353,101 | | | $ | 340,327 | |
| Net income available to common shareholders of EPR Properties | 69,603 | | | 39,062 | | | 129,374 | | | 95,739 | |
| EBITDAre (1) | 136,286 | | | 135,073 | | | 268,362 | | | 256,847 | |
| Adjusted EBITDAre (1) | 137,952 | | | 135,676 | | | 269,943 | | | 262,024 | |
| Interest expense, net | 33,246 | | | 32,820 | | | 66,267 | | | 64,471 | |
| | | | | | | |
| Capitalized interest | 961 | | | 471 | | | 2,396 | | | 1,429 | |
| Straight-lined rental revenue | 5,137 | | | 5,251 | | | 8,534 | | | 8,921 | |
| Percentage rent and participating interest | 4,594 | | | 1,973 | | | 9,679 | | | 3,873 | |
| Dividends declared on preferred shares | 6,040 | | | 6,040 | | | 12,072 | | | 12,072 | |
| Dividends declared on common shares | 67,335 | | | 64,726 | | | 133,088 | | | 127,872 | |
| General and administrative expense | 13,230 | | | 12,020 | | | 27,254 | | | 25,928 | |
| | | | | | | |
| JUNE 30, | | | | |
| BALANCE SHEET INFORMATION: | 2025 | | 2024 | | | | |
| Total assets | $ | 5,560,880 | | | $ | 5,645,367 | | | | | |
| Accumulated depreciation | 1,641,916 | | | 1,504,427 | | | | | |
| Cash and cash equivalents | 12,955 | | | 33,731 | | | | | |
| Total assets before accumulated depreciation less cash and cash equivalents (gross assets) | 7,189,841 | | | 7,116,063 | | | | | |
| Debt | 2,792,970 | | | 2,819,029 | | | | | |
| Deferred financing costs, net | 16,622 | | | 22,200 | | | | | |
| Net debt (1) | 2,796,637 | | | 2,807,498 | | | | | |
| Equity | 2,331,091 | | | 2,424.796 | | | | | |
| Common shares outstanding | 76,115 | | | 75,719 | | | | | |
| Total market capitalization (using EOP closing price and liquidation values)(2) | 7,602,049 | | | 6,357,165 | | | | | |
| Net debt/total market capitalization ratio (1) | 37 | % | | 44 | % | | | | |
| Debt to total assets ratio | 50 | % | | 50 | % | | | | |
| Net debt/gross assets ratio (1) | 39 | % | | 39 | % | | | | |
| | | | | | | |
| Net debt/Adjusted EBITDAre ratio (1) (3) | 5.1 | | | 5.2 | | | | | |
| Net debt/Annualized adjusted EBITDAre ratio (1) (4) | 5.0 | | | 5.2 | | | | | |
| | | | | | | |
(1) See pages 24 through 26 for definitions. See calculation on page 30, as applicable. |
| (2) See calculation on page 15. |
(3) Adjusted EBITDAre in this calculation is for the three-month period multiplied times four. See pages 24 through 26 for definitions. See calculation on page 30. |
|
(4) Annualized adjusted EBITDAre is adjusted EBITDAre for the quarter further adjusted for in-service and disposed projects, percentage rent and participating interest and other items which is then multiplied times four. These calculations can be found on page 30 under the reconciliation of Adjusted EBITDAre and Annualized Adjusted EBITDAre. See pages 24 through 26 for definitions. |
| | | | | | | | |
| | |
| Q2 2025 Supplemental | Page 6 |
| |
| | | | | | | | | | | | | | | | | | | | | | | | | | | | | | | | | | | | | | |
| SELECTED BALANCE SHEET INFORMATION |
| (UNAUDITED, DOLLARS IN THOUSANDS) |
| | | | | | | | | | | | |
| ASSETS | | 2ND QUARTER 2025 | | 1ST QUARTER 2025 | | 4TH QUARTER 2024 | | 3RD QUARTER 2024 | | 2ND QUARTER 2024 | | 1ST QUARTER 2024 |
| Real estate investments | | $ | 6,044,295 | | | $ | 5,949,713 | | | $ | 5,998,003 | | | $ | 6,080,959 | | | $ | 6,070,909 | | | $ | 6,100,366 | |
| Less: accumulated depreciation | | (1,641,916) | | | (1,595,820) | | | (1,562,645) | | | (1,546,509) | | | (1,504,427) | | | (1,470,507) | |
| Land held for development | | 20,168 | | | 20,168 | | | 20,168 | | | 20,168 | | | 20,168 | | | 20,168 | |
| Property under development | | 84,195 | | | 118,264 | | | 112,263 | | | 76,913 | | | 59,092 | | | 36,138 | |
| Operating lease right-of-use assets | | 177,919 | | | 180,557 | | | 173,364 | | | 175,451 | | | 179,260 | | | 183,031 | |
| Mortgage notes and related accrued interest receivable, net | | 666,154 | | | 659,004 | | | 665,796 | | | 657,636 | | | 593,084 | | | 578,915 | |
| | | | | | | | | | | | |
| Investment in joint ventures | | 9,680 | | | 11,361 | | | 14,019 | | | 32,426 | | | 45,406 | | | 46,127 | |
| Cash and cash equivalents | | 12,955 | | | 20,572 | | | 22,062 | | | 35,328 | | | 33,731 | | | 59,476 | |
| Restricted cash | | 15,765 | | | 6,354 | | | 13,637 | | | 2,992 | | | 2,958 | | | 2,929 | |
| Accounts receivable | | 94,514 | | | 85,811 | | | 84,589 | | | 79,726 | | | 75,493 | | | 69,414 | |
| Other assets | | 77,151 | | | 76,565 | | | 75,251 | | | 74,072 | | | 69,693 | | | 67,979 | |
| Total assets | | $ | 5,560,880 | | | $ | 5,532,549 | | | $ | 5,616,507 | | | $ | 5,689,162 | | | $ | 5,645,367 | | | $ | 5,694,036 | |
| LIABILITIES AND EQUITY | | | | | | | | | | | | |
| Liabilities: | | | | | | | | | | | | |
| Accounts payable and accrued liabilities | | $ | 101,543 | | | $ | 93,248 | | | $ | 107,976 | | | $ | 99,334 | | | $ | 63,441 | | | $ | 84,153 | |
| Operating lease liabilities | | 216,411 | | | 219,305 | | | 212,400 | | | 214,809 | | | 219,004 | | | 223,077 | |
| Common dividends payable | | 22,454 | | | 22,440 | | | 25,831 | | | 23,811 | | | 23,365 | | | 22,918 | |
| Preferred dividends payable | | 6,032 | | | 6,032 | | | 6,032 | | | 6,032 | | | 6,032 | | | 6,032 | |
| Unearned rents and interest | | 90,379 | | | 78,550 | | | 80,565 | | | 88,503 | | | 89,700 | | | 91,829 | |
| Line of credit | | 405,000 | | | 105,000 | | | 175,000 | | | 169,000 | | | — | | | — | |
| Deferred financing costs, net | | (16,622) | | | (17,630) | | | (19,134) | | | (20,622) | | | (22,200) | | | (23,519) | |
| Other debt | | 2,404,592 | | | 2,704,592 | | | 2,704,592 | | | 2,704,592 | | | 2,841,229 | | | 2,841,229 | |
| Total liabilities | | 3,229,789 | | | 3,211,537 | | | 3,293,262 | | | 3,285,459 | | | 3,220,571 | | | 3,245,719 | |
| Equity: | | | | | | | | | | | | |
| Common stock and additional paid-in-capital | | 3,968,520 | | | 3,964,272 | | | 3,951,364 | | | 3,947,470 | | | 3,943,925 | | | 3,940,077 | |
| Preferred stock at par value | | 148 | | | 148 | | | 148 | | | 148 | | | 148 | | | 148 | |
| Treasury stock | | (295,258) | | | (295,258) | | | (285,413) | | | (285,413) | | | (285,413) | | | (285,413) | |
| Accumulated other comprehensive (loss) income | | (4) | | | (3,567) | | | (3,756) | | | (609) | | | (541) | | | 1,119 | |
| Distributions in excess of net income | | (1,342,315) | | | (1,344,583) | | | (1,339,098) | | | (1,257,893) | | | (1,233,323) | | | (1,207,614) | |
| | | | | | | | | | | | |
| | | | | | | | | | | | |
| Total equity | | 2,331,091 | | | 2,321,012 | | | 2,323,245 | | | 2,403,703 | | | 2,424,796 | | | 2,448,317 | |
| Total liabilities and equity | | $ | 5,560,880 | | | $ | 5,532,549 | | | $ | 5,616,507 | | | $ | 5,689,162 | | | $ | 5,645,367 | | | $ | 5,694,036 | |
| | | | | | | | |
| | |
| Q2 2025 Supplemental | Page 7 |
| |
| | | | | | | | | | | | | | | | | | | | | | | | | | | | | | | | | | | | |
| SELECTED OPERATING DATA | |
| (UNAUDITED, DOLLARS IN THOUSANDS) | |
| | | | | | | | | | | | |
| 2ND QUARTER 2025 | | 1ST QUARTER 2025 | | 4TH QUARTER 2024 | | 3RD QUARTER 2024 | | 2ND QUARTER 2024 | | 1ST QUARTER 2024 | |
| Rental revenue | $ | 150,351 | | | $ | 146,359 | | | $ | 149,116 | | | $ | 148,677 | | | $ | 145,093 | | | $ | 142,281 | | |
| Other income (1) | 12,218 | | | 11,636 | | | 13,197 | | | 17,419 | | | 14,418 | | | 12,037 | | |
| Mortgage and other financing income | 15,499 | | | 17,038 | | | 14,921 | | | 14,411 | | | 13,584 | | | 12,914 | | |
| Total revenue | 178,068 | | | 175,033 | | | 177,234 | | | 180,507 | | | 173,095 | | | 167,232 | | |
| Property operating expense | 14,661 | | | 15,171 | | | 15,188 | | | 14,611 | | | 14,427 | | | 14,920 | | |
| Other expense (1) | 11,959 | | | 12,611 | | | 13,437 | | | 15,631 | | | 14,833 | | | 12,976 | | |
| General and administrative expense | 13,230 | | | 14,024 | | | 12,233 | | | 11,935 | | | 12,020 | | | 13,908 | | |
| Retirement and severance expense | — | | | — | | | — | | | — | | | — | | | 1,836 | | |
| | | | | | | | | | | | |
| Transaction costs | 669 | | | 567 | | | 423 | | | 175 | | | 199 | | | 1 | | |
| Provision (benefit) for credit losses, net | 997 | | | (652) | | | 9,876 | | | (770) | | | 404 | | | 2,737 | | |
| Impairment charges | — | | | — | | | 39,952 | | | — | | | 11,812 | | | — | | |
| Depreciation and amortization | 42,080 | | | 41,089 | | | 40,995 | | | 42,795 | | | 41,474 | | | 40,469 | | |
| Total operating expenses | 83,596 | | | 82,810 | | | 132,104 | | | 84,377 | | | 95,169 | | | 86,847 | | |
| Gain (loss) on sale of real estate | 16,779 | | | 9,384 | | | 112 | | | (3,419) | | | 1,459 | | | 17,949 | | |
| Income from operations | 111,251 | | | 101,607 | | | 45,242 | | | 92,711 | | | 79,385 | | | 98,334 | | |
| Costs associated with loan refinancing or payoff | — | | | — | | | — | | | 337 | | | — | | | — | | |
| Interest expense, net | 33,246 | | | 33,021 | | | 33,472 | | | 32,867 | | | 32,820 | | | 31,651 | | |
| Equity in loss from joint ventures | 1,681 | | | 2,647 | | | 3,425 | | | 851 | | | 906 | | | 3,627 | | |
| Impairment charges on joint ventures | — | | | — | | | 16,087 | | | 12,130 | | | — | | | — | | |
| Income (loss) before income taxes | 76,324 | | | 65,939 | | | (7,742) | | | 46,526 | | | 45,659 | | | 63,056 | | |
| Income tax expense (benefit) | 681 | | | 136 | | | 653 | | | (124) | | | 557 | | | 347 | | |
| | | | | | | | | | | | |
| | | | | | | | | | | | |
| | | | | | | | | | | | |
| | | | | | | | | | | | |
| | | | | | | | | | | | |
| | | | | | | | | | | | |
| | | | | | | | | | | | |
| | | | | | | | | | | | |
| Net income (loss) | 75,643 | | | 65,803 | | | (8,395) | | | 46,650 | | | 45,102 | | | 62,709 | | |
| | | | | | | | | | | | |
| Preferred dividend requirements | 6,040 | | | 6,032 | | | 6,040 | | | 6,032 | | | 6,040 | | | 6,032 | | |
| | | | | | | | | | | | |
| Net income (loss) available to common shareholders of EPR Properties | $ | 69,603 | | | $ | 59,771 | | | $ | (14,435) | | | $ | 40,618 | | | $ | 39,062 | | | $ | 56,677 | | |
| | | | | | | | | | | | |
| (1) Other income and other expense consist primarily of results from the Company's properties operated through third-party managers. | |
| | | | | | | | |
| | |
| Q2 2025 Supplemental | Page 8 |
| |
| | | | | | | | | | | | | | | | | | | | | | | | | | | | | | | | | | | |
| FUNDS FROM OPERATIONS AND FUNDS FROM OPERATIONS AS ADJUSTED |
| (UNAUDITED, DOLLARS IN THOUSANDS EXCEPT PER SHARE INFORMATION) |
| FUNDS FROM OPERATIONS ("FFO") (1): | 2ND QUARTER 2025 | | 1ST QUARTER 2025 | | 4TH QUARTER 2024 | | 3RD QUARTER 2024 | | 2ND QUARTER 2024 | | 1ST QUARTER 2024 |
| Net income (loss) available to common shareholders of EPR Properties | $ | 69,603 | | | $ | 59,771 | | | $ | (14,435) | | | $ | 40,618 | | | $ | 39,062 | | | $ | 56,677 | |
| (Gain) loss on sale of real estate | (16,779) | | | (9,384) | | | (112) | | | 3,419 | | | (1,459) | | | (17,949) | |
| | | | | | | | | | | |
| | | | | | | | | | | |
| Impairment of real estate investments | — | | | — | | | 39,952 | | | — | | | 11,812 | | | — | |
| | | | | | | | | | | |
| Real estate depreciation and amortization | 41,939 | | | 40,932 | | | 40,838 | | | 42,620 | | | 41,289 | | | 40,282 | |
| Allocated share of joint venture depreciation | 985 | | | 1,036 | | | 1,965 | | | 2,581 | | | 2,457 | | | 2,416 | |
| Impairment charges on joint ventures | — | | | — | | | 16,087 | | | 12,130 | | | — | | | — | |
| FFO available to common shareholders of EPR Properties | $ | 95,748 | | | $ | 92,355 | | | $ | 84,295 | | | $ | 101,368 | | | $ | 93,161 | | | $ | 81,426 | |
| FFO available to common shareholders of EPR Properties | $ | 95,748 | | | $ | 92,355 | | | $ | 84,295 | | | $ | 101,368 | | | $ | 93,161 | | | $ | 81,426 | |
| Add: Preferred dividends for Series C preferred shares | 1,938 | | | 1,938 | | | 1,938 | | | 1,938 | | | 1,938 | | | 1,938 | |
| Add: Preferred dividends for Series E preferred shares | 1,938 | | | 1,938 | | | 1,938 | | | 1,938 | | | 1,938 | | | 1,938 | |
| Diluted FFO available to common shareholders of EPR Properties | $ | 99,624 | | | $ | 96,231 | | | $ | 88,171 | | | $ | 105,244 | | | $ | 97,037 | | | $ | 85,302 | |
| FUNDS FROM OPERATIONS AS ADJUSTED ("FFOAA") (1): | | | | | | | | | | | |
| FFO available to common shareholders of EPR Properties | $ | 95,748 | | | $ | 92,355 | | | $ | 84,295 | | | $ | 101,368 | | | $ | 93,161 | | | $ | 81,426 | |
| Retirement and severance expense | — | | | — | | | — | | | — | | | — | | | 1,836 | |
| Transaction costs | 669 | | | 567 | | | 423 | | | 175 | | | 199 | | | 1 | |
| Provision (benefit) for credit losses, net | 997 | | | (652) | | | 9,876 | | | (770) | | | 404 | | | 2,737 | |
| Costs associated with loan refinancing or payoff | — | | | — | | | — | | | 337 | | | — | | | — | |
| | | | | | | | | | | |
| | | | | | | | | | | |
| | | | | | | | | | | |
| | | | | | | | | | | |
| | | | | | | | | | | |
| | | | | | | | | | | |
| | | | | | | | | | | |
| | | | | | | | | | | |
| | | | | | | | | | | |
| Deferred income tax benefit | (93) | | | (530) | | | (285) | | | (728) | | | (249) | | | (277) | |
| FFO as adjusted available to common shareholders of EPR Properties | $ | 97,321 | | | $ | 91,740 | | | $ | 94,309 | | | $ | 100,382 | | | $ | 93,515 | | | $ | 85,723 | |
| FFO as adjusted available to common shareholders of EPR Properties | $ | 97,321 | | | $ | 91,740 | | | $ | 94,309 | | | $ | 100,382 | | | $ | 93,515 | | | $ | 85,723 | |
| Add: Preferred dividends for Series C preferred shares | 1,938 | | | 1,938 | | | 1,938 | | | 1,938 | | | 1,938 | | | 1,938 | |
| Add: Preferred dividends for Series E preferred shares | 1,938 | | | 1,938 | | | 1,938 | | | 1,938 | | | 1,938 | | | 1,938 | |
| Diluted FFO as adjusted available to common shareholders of EPR Properties | $ | 101,197 | | | $ | 95,616 | | | $ | 98,185 | | | $ | 104,258 | | | $ | 97,391 | | | $ | 89,599 | |
| FFO per common share: | | | | | | | | | | | |
| Basic | $ | 1.26 | | | $ | 1.22 | | | $ | 1.11 | | | $ | 1.34 | | | $ | 1.23 | | | $ | 1.08 | |
| Diluted | 1.24 | | | 1.20 | | | 1.10 | | | 1.31 | | | 1.21 | | | 1.07 | |
| FFO as adjusted per common share: | | | | | | | | | | | |
| Basic | $ | 1.28 | | | $ | 1.21 | | | $ | 1.25 | | | $ | 1.33 | | | $ | 1.24 | | | $ | 1.14 | |
| Diluted | 1.26 | | | 1.19 | | | 1.23 | | | 1.30 | | | 1.22 | | | 1.13 | |
| Shares used for computation (in thousands): | | | | | | | | | | | |
| Basic | 76,083 | | | 75,804 | | | 75,733 | | | 75,723 | | | 75,689 | | | 75,398 | |
| Diluted | 76,571 | | | 76,215 | | | 76,156 | | | 76,108 | | | 76,022 | | | 75,705 | |
| | | | | | | | | | | |
| Effect of dilutive Series C preferred shares | 2,344 | | | 2,336 | | | 2,327 | | | 2,319 | | | 2,310 | | | 2,301 | |
| | | | | | | | | | | |
| Effect of dilutive Series E preferred shares | 1,667 | | | 1,665 | | | 1,665 | | | 1,664 | | | 1,664 | | | 1,663 | |
| Adjusted weighted-average shares outstanding-diluted Series C and Series E | 80,582 | | | 80,216 | | | 80,148 | | | 80,091 | | | 79,996 | | | 79,669 | |
(1) See pages 24 through 26 for definitions. | | | | | | | | | | | |
|
|
|
| | | | | | | | |
| | |
| Q2 2025 Supplemental | Page 9 |
| |
| | | | | | | | | | | | | | | | | | | | | | | | | | | | | | | | | | | | | | |
| ADJUSTED FUNDS FROM OPERATIONS |
| (UNAUDITED, DOLLARS IN THOUSANDS EXCEPT PER SHARE INFORMATION) |
| ADJUSTED FUNDS FROM OPERATIONS ("AFFO") (1): | | 2ND QUARTER 2025 | | 1ST QUARTER 2025 | | 4TH QUARTER 2024 | | 3RD QUARTER 2024 | | 2ND QUARTER 2024 | | 1ST QUARTER 2024 |
FFO available to common shareholders of EPR Properties | | $ | 95,748 | | | $ | 92,355 | | | $ | 84,295 | | | $ | 101,368 | | | $ | 93,161 | | | $ | 81,426 | |
| Adjustments: | | | | | | | | | | | | |
| Retirement and severance expense | | — | | | — | | | — | | | — | | | — | | | 1,836 | |
| Transaction costs | | 669 | | | 567 | | | 423 | | | 175 | | | 199 | | | 1 | |
| Provision (benefit) for credit losses, net | | 997 | | | (652) | | | 9,876 | | | (770) | | | 404 | | | 2,737 | |
Costs associated with loan refinancing or payoff | | — | | | — | | | — | | | 337 | | | — | | | — | |
| | | | | | | | | | | | |
| | | | | | | | | | | | |
| | | | | | | | | | | | |
| | | | | | | | | | | | |
| | | | | | | | | | | | |
| | | | | | | | | | | | |
| | | | | | | | | | | | |
| | | | | | | | | | | | |
| | | | | | | | | | | | |
| Deferred income tax benefit | | (93) | | | (530) | | | (285) | | | (728) | | | (249) | | | (277) | |
| | | | | | | | | | | | |
| Non-real estate depreciation and amortization | | 141 | | | 157 | | | 157 | | | 175 | | | 185 | | | 187 | |
| Deferred financing fees amortization | | 2,102 | | | 2,206 | | | 2,187 | | | 2,211 | | | 2,234 | | | 2,212 | |
Share-based compensation expense to management and trustees | | 3,912 | | | 3,867 | | | 3,572 | | | 3,264 | | | 3,538 | | | 3,692 | |
| Amortization of above/below market leases, net and tenant allowances | | (81) | | | (81) | | | (81) | | | (84) | | | (84) | | | (84) | |
| Maintenance capital expenditures (2) | | (1,858) | | | (1,251) | | | (1,862) | | | (2,561) | | | (1,321) | | | (1,555) | |
| Straight-lined rental revenue | | (5,137) | | | (3,397) | | | (3,992) | | | (4,414) | | | (5,251) | | | (3,670) | |
| Straight-lined ground sublease expense | | — | | | 2 | | | 20 | | | 20 | | | 25 | | | 32 | |
Non-cash portion of mortgage and other financing income | | (566) | | | (297) | | | (171) | | | (396) | | | (555) | | | (862) | |
| Allocated share of joint venture non-cash items | | — | | | — | | | — | | | 712 | | | — | | | — | |
| AFFO available to common shareholders of EPR Properties | | $ | 95,834 | | | $ | 92,946 | | | $ | 94,139 | | | $ | 99,309 | | | $ | 92,286 | | | $ | 85,675 | |
| | | | | | | | | | | | |
| AFFO available to common shareholders of EPR Properties | | $ | 95,834 | | | $ | 92,946 | | | $ | 94,139 | | | $ | 99,309 | | | $ | 92,286 | | | $ | 85,675 | |
| Add: Preferred dividends for Series C preferred shares | | 1,938 | | | 1,938 | | | 1,938 | | | 1,938 | | | 1,938 | | | 1,938 | |
| Add: Preferred dividends for Series E preferred shares | | 1,938 | | | 1,938 | | | 1,938 | | | 1,938 | | | 1,938 | | | 1,938 | |
| Diluted AFFO available to common shareholders of EPR Properties | | $ | 99,710 | | | $ | 96,822 | | | $ | 98,015 | | | $ | 103,185 | | | $ | 96,162 | | | $ | 89,551 | |
| | | | | | | | | | | | |
Weighted average diluted shares outstanding (in thousands) | | 76,571 | | | 76,215 | | | 76,156 | | | 76,108 | | | 76,022 | | | 75,705 | |
| Effect of dilutive Series C preferred shares | | 2,344 | | | 2,336 | | | 2,327 | | | 2,319 | | | 2,310 | | | 2,301 | |
| Effect of dilutive Series E preferred shares | | 1,667 | | | 1,665 | | | 1,665 | | | 1,664 | | | 1,664 | | | 1,663 | |
| Adjusted weighted-average shares outstanding-diluted | | 80,582 | | | 80,216 | | | 80,148 | | | 80,091 | | | 79,996 | | | 79,669 | |
| | | | | | | | | | | | |
| AFFO per diluted common share | | $ | 1.24 | | | $ | 1.21 | | | $ | 1.22 | | | $ | 1.29 | | | $ | 1.20 | | | $ | 1.12 | |
| Dividends declared per common share | | $ | 0.885 | | | $ | 0.865 | | | $ | 0.855 | | | $ | 0.855 | | | $ | 0.855 | | | $ | 0.835 | |
| AFFO payout ratio (3) | | 71 | % | | 71 | % | | 70 | % | | 66 | % | | 71 | % | | 75 | % |
| | | | | | | | | | | | |
(1) See pages 24 through 26 for definitions. |
|
| (2) Includes maintenance capital expenditures and certain second generation tenant improvements and leasing commissions. |
| (3) AFFO payout ratio is calculated by dividing dividends declared per common share by AFFO per diluted common share. |
|
| | | | | | | | |
| | |
| Q2 2025 Supplemental | Page 10 |
| |
| | | | | | | | | | | | | | | | | | | | | | | | | | | | | | | | | | | |
CAPITAL STRUCTURE AS OF JUNE 30, 2025 |
| (UNAUDITED, DOLLARS IN THOUSANDS) |
| | | | | | | | | | | |
| CONSOLIDATED DEBT |
| PRINCIPAL PAYMENTS DUE ON DEBT: |
| | BONDS/TERM LOAN/OTHER (1) | | UNSECURED CREDIT FACILITY (2) | | UNSECURED SENIOR NOTES | | TOTAL | | WEIGHTED AVG INTEREST RATE | |
| YEAR | | | | | | |
| 2025 | | $ | — | | | $ | — | | | $ | — | | | $ | — | | | —% | |
| 2026 | | — | | | — | | | 629,597 | | | 629,597 | | | 4.70% | |
| 2027 | | — | | | — | | | 450,000 | | | 450,000 | | | 4.50% | |
| 2028 | | — | | | 405,000 | | | 400,000 | | | 805,000 | | | 5.20% | |
| 2029 | | — | | | — | | | 500,000 | | | 500,000 | | | 3.75% | |
| 2030 | | — | | | — | | | — | | | — | | | —% | |
| 2031 | | — | | | — | | | 400,000 | | | 400,000 | | | 3.60% | |
| 2032 | | — | | | — | | | — | | | — | | | —% | |
| 2033 | | — | | | — | | | — | | | — | | | —% | |
| 2034 | | — | | | — | | | — | | | — | | | —% | |
| 2035 | | — | | | — | | | — | | | — | | | —% | |
| Thereafter | | 24,995 | | | — | | | — | | | 24,995 | | | 2.53% | |
| Less: deferred financing costs, net | | — | | | — | | | — | | | (16,622) | | | —% | |
| | $ | 24,995 | | | $ | 405,000 | | | $ | 2,379,597 | | | $ | 2,792,970 | | | 4.46% | |
| | | | | | | | | | | |
| | | | BALANCE | | WEIGHTED AVG INTEREST RATE | | WEIGHTED AVG MATURITY | | | |
| Fixed rate unsecured debt | | $ | 2,379,597 | | | 4.32 | % | | 3.10 | | | | |
| Fixed rate secured debt (1) | | 24,995 | | | 2.53 | % | | 22.09 | | | | |
| | | | | | | | | |
| Variable rate unsecured debt | | 405,000 | | | 5.44 | % | | 3.27 | | | | |
| Less: deferred financing costs, net | | (16,622) | | | — | % | | — | | | | |
| Total | | | | $ | 2,792,970 | | | 4.46 | % | | 3.32 | | | | |
|
|
| (1) Includes $25.0 million of secured bonds that have been fixed through interest rate swaps through September 20, 2026. |
| (2) Unsecured Revolving Credit Facility Summary: |
| | | | BALANCE | | | | RATE | | | |
| | COMMITMENT | | AT 6/30/2025 | | MATURITY | | AT 6/30/2025 | | | |
| | | | | | | | | | | |
| | $1,000,000 | | $405,000 | | October 2, 2028 | | 5.44% | | | |
| | | | | | | | | | | |
| | Note: This facility will mature on October 2, 2028 and has two six-month extensions available at the Company's option, and includes an accordion feature pursuant to which the maximum borrowing amount can be increased from $1.0 billion to $2.0 billion, in each case, subject to certain terms and conditions. | | | |
| | | | | | | | |
| | |
| Q2 2025 Supplemental | Page 11 |
| |
| | | | | | | | | | | | | | |
CAPITAL STRUCTURE AS OF JUNE 30, 2025 AND DECEMBER 31, 2024 |
| (UNAUDITED, DOLLARS IN THOUSANDS) |
| | | | |
| CONSOLIDATED DEBT (continued) |
| | | | |
| SUMMARY OF DEBT: | | June 30, 2025 | | December 31, 2024 |
| Senior unsecured notes payable, 4.50%, paid in full on April 1, 2025 | | $ | — | | | $ | 300,000 | |
| Senior unsecured notes payable, 4.56%, due August 22, 2026 | | 179,597 | | | 179,597 | |
| Senior unsecured notes payable, 4.75%, due December 15, 2026 | | 450,000 | | | 450,000 | |
| Senior unsecured notes payable, 4.50%, due June 1, 2027 | | 450,000 | | | 450,000 | |
| Senior unsecured notes payable, 4.95%, due April 15, 2028 | | 400,000 | | | 400,000 | |
| Unsecured revolving variable rate credit facility, SOFR + 1.15%, due October 2, 2028 | | 405,000 | | | 175,000 | |
| Senior unsecured notes payable, 3.75%, due August 15, 2029 | | 500,000 | | | 500,000 | |
| Senior unsecured notes payable, 3.60%, due November 15, 2031 | | 400,000 | | | 400,000 | |
| Bonds payable, variable rate, fixed at 2.53% through September 30, 2026, due August 1, 2047 | | 24,995 | | | 24,995 | |
| Less: deferred financing costs, net | | (16,622) | | | (19,134) | |
| Total debt | | $ | 2,792,970 | | | $ | 2,860,458 | |
| | | | |
| | | | | | | | |
| | |
| Q2 2025 Supplemental | Page 12 |
| |
| | | | | | | | | | | | | | | | | | | | | | | |
| CAPITAL STRUCTURE |
| SENIOR NOTES |
| | | | | | | |
SENIOR DEBT RATINGS AS OF JUNE 30, 2025 |
| | | | | | | |
| Moody's | | Baa3 (stable) | | | | | |
| Fitch | | BBB- (stable) | | | | | |
| Standard and Poor's | | BBB- (stable) | | | | | |
| |
| SUMMARY OF COVENANTS |
| | | | | | | |
The Company had outstanding public senior unsecured notes with fixed interest rates of 3.60%, 3.75%, 4.50%, 4.75% and 4.95% at June 30, 2025. Interest on these notes is paid semiannually. These public senior unsecured notes contain various covenants, including: (i) a limitation on incurrence of any debt that would cause the Company's debt to adjusted total assets ratio to exceed 60%; (ii) a limitation on incurrence of any secured debt which would cause the Company’s secured debt to adjusted total assets ratio to exceed 40%; (iii) a limitation on incurrence of any debt which would cause the Company’s debt service coverage ratio to be less than 1.5 times; and (iv) the maintenance at all times of total unencumbered assets not less than 150% of the Company’s outstanding unsecured debt. | |
| | | | | | | |
The following is a summary of the key financial covenants for the Company's 3.60%, 3.75%, 4.50%, 4.75% and 4.95% public senior unsecured notes, as defined and calculated per the Company's interpretation of the terms of the notes. These calculations, which are not based on U.S. generally accepted accounting principles ("GAAP") measurements, are presented to investors to show the Company's ability to incur additional debt under the terms of the senior unsecured notes only and are not measures of the Company's liquidity or performance. The actual amounts as of June 30, 2025 and March 31, 2025 are: | |
| | | | Actual | | Actual | |
| NOTE COVENANTS | | Required | | 2nd Quarter 2025 (1) | | 1st Quarter 2025 (1) | |
| Limitation on incurrence of total debt (Total Debt/Total Assets) | | ≤ 60% | | 39% | | 40% | |
| Limitation on incurrence of secured debt (Secured Debt/Total Assets) | | ≤ 40% | | —% | | —% | |
| Limitation on incurrence of debt: Debt service coverage (Consolidated Income Available for Debt Service/Annual Debt Service) - trailing twelve months | | ≥ 1.5 x | | 4.1x | | 4.0x | |
| Maintenance of total unencumbered assets (Unencumbered Assets/Unsecured Debt) | | ≥ 150% of unsecured debt | | 251% | | 249% | |
| | | | | | | |
| (1) See page 14 for details of calculations. | | | | | | | |
| | | | | | | |
| | | | | | | | |
| | |
| Q2 2025 Supplemental | Page 13 |
| |
| | | | | | | | | | | | | | | | | | | | | | | | | | | | | | |
| CAPITAL STRUCTURE |
| SENIOR NOTES |
| (UNAUDITED, DOLLARS IN THOUSANDS) |
| | | | | | | | | | |
| COVENANT CALCULATIONS |
| | | | | | | | | | |
| TOTAL ASSETS: | | June 30, 2025 | | | | TOTAL DEBT: | | | | June 30, 2025 |
| Total Assets per balance sheet | | $ | 5,560,880 | | | | | Secured debt obligations | $ | 24,995 | |
| Add: accumulated depreciation | | 1,641,916 | | | | | Unsecured debt obligations: | | |
| Less: intangible assets, net | | (32,783) | | | | | Unsecured debt | | 2,784,597 | |
| Total Assets | | $ | 7,170,013 | | | | | Outstanding letters of credit | | — | |
| | | | | | Guarantees | | 10,000 | |
| TOTAL UNENCUMBERED ASSETS: | | June 30, 2025 | | | | Derivatives at fair market value, net, if liability | 8,464 | |
| Total Assets, per above | | $ | 7,170,013 | | | | | Total unsecured debt obligations: | | $ | 2,803,061 | |
| Less: investment in joint ventures | | (9,680) | | | | | Total Debt | | $ | 2,828,056 | |
| Less: accounts receivable | | (94,514) | | | | | | | | | |
| Less: encumbered assets | | (25,665) | | | | | | | | | |
| Total Unencumbered Assets | | $ | 7,040,154 | | | | | | | | | |
| | | | | | | | | | |
| | | | | | | | | | |
| CONSOLIDATED INCOME AVAILABLE FOR DEBT SERVICE: | | 2ND QUARTER 2025 | | 1ST QUARTER 2025 | | 4TH QUARTER 2024 | | 3RD QUARTER 2024 | | TRAILING TWELVE MONTHS |
| Adjusted EBITDAre | | $ | 137,952 | | | $ | 131,991 | | | $ | 135,505 | | | $ | 142,647 | | | $ | 548,095 | |
| | | | | | | | | | |
| | | | | | | | | | |
| | | | | | | | | | |
| Less: straight-line revenue, net, included in adjusted EBITDAre | | (5,137) | | | (3,397) | | | (3,992) | | | (4,414) | | | (16,940) | |
| Less: joint venture EBITDA | | 266 | | | 1,236 | | | 870 | | | (4,318) | | | (1,946) | |
| CONSOLIDATED INCOME AVAILABLE FOR DEBT SERVICE | | $ | 133,081 | | | $ | 129,830 | | | $ | 132,383 | | | $ | 133,915 | | | $ | 529,209 | |
| ANNUAL DEBT SERVICE: | | | | | | | | | | |
| Interest expense, gross | | $ | 34,506 | | | $ | 34,784 | | | $ | 34,991 | | | $ | 34,402 | | | $ | 138,683 | |
| | | | | | | | | | |
| Less: deferred financing fees amortization | | (2,102) | | | (2,206) | | | (2,187) | | | (2,211) | | | (8,706) | |
| ANNUAL DEBT SERVICE | | $ | 32,404 | | | $ | 32,578 | | | $ | 32,804 | | | $ | 32,191 | | | $ | 129,977 | |
| | | | | | | | | | |
| DEBT SERVICE COVERAGE | | 4.1 | | | 4.0 | | | 4.0 | | | 4.2 | | | 4.1 | |
| | | | | | | | | | |
|
|
|
| | | | | | | | |
| | |
| Q2 2025 Supplemental | Page 14 |
| |
| | | | | | | | | | | | | | | | | | | | | | | | | | | | | | | | | | | | | | | | | | | | |
CAPITAL STRUCTURE AS OF JUNE 30, 2025 |
| (UNAUDITED, DOLLARS IN THOUSANDS EXCEPT SHARE INFORMATION) |
| | | | | | | | | | | | | | |
| EQUITY |
| SECURITY | | SHARES OUTSTANDING | | PRICE PER SHARE AT JUNE 30, 2025 | | LIQUIDATION PREFERENCE | | DIVIDEND RATE | | CONVERTIBLE | | CONVERSION RATIO AT JUNE 30, 2025 | | CONVERSION PRICE AT JUNE 30, 2025 |
| Common shares | | 76,114,781 | | $58.26 | | N/A | | (1) | | N/A | | N/A | | N/A |
| Series C | | 5,392,616 | | $25.05 | | $134,815 | | 5.750% | | Y | | 0.4346 | | $57.52 |
| Series E | | 3,445,980 | | $31.18 | | $86,150 | | 9.000% | | Y | | 0.4837 | | $51.68 |
| Series G | | 6,000,000 | | $20.84 | | $150,000 | | 5.750% | | N | | N/A | | N/A |
| | | | | | | | | | | | | | |
| CALCULATION OF TOTAL MARKET CAPITALIZATION: | | |
Common shares outstanding at June 30, 2025 multiplied by closing price at June 30, 2025 | | $ | 4,434,447 | | | |
| Aggregate liquidation value of Series C preferred shares (2) | | | 134,815 | | | |
| Aggregate liquidation value of Series E preferred shares (2) | | | 86,150 | | | |
| Aggregate liquidation value of Series G preferred shares (2) | | | 150,000 | | | |
Net debt at June 30, 2025 (3) | | | 2,796,637 | | | |
| Total consolidated market capitalization | | | $ | 7,602,049 | | | |
| | | | | | | | | | | | | | |
(1) Total monthly dividends declared in the second quarter of 2025 were $0.885 per share. |
(2) Excludes accrued unpaid dividends at June 30, 2025. | | | | |
(3) See pages 24 through 26 for definitions. | | | | |
| | | | | | | | |
| | |
| Q2 2025 Supplemental | Page 15 |
| |
| | | | | | | | | | | | | | | | | | | | | | | | | | | | | | | | | | | |
| SUMMARY OF RATIOS |
| (UNAUDITED) |
| | | | | | | | | | | |
| 2ND QUARTER 2025 | | 1ST QUARTER 2025 | | 4TH QUARTER 2024 | | 3RD QUARTER 2024 | | 2ND QUARTER 2024 | | 1ST QUARTER 2024 |
| Debt to total assets ratio | 50% | | 50% | | 51% | | 50% | | 50% | | 49% |
| | | | | | | | | | | |
| Net debt to total market capitalization ratio (1) | 37% | | 39% | | 43% | | 41% | | 44% | | 44% |
| | | | | | | | | | | |
| Net debt to gross assets ratio (1) | 39% | | 39% | | 40% | | 39% | | 39% | | 39% |
| | | | | | | | | | | |
| Net debt/Adjusted EBITDAre ratio (1)(2) | 5.1 | | 5.3 | | 5.3 | | 5.0 | | 5.2 | | 5.5 |
| | | | | | | | | | | |
| Net debt/Annualized adjusted EBITDAre ratio (1)(3) | 5.0 | | 5.1 | | 5.1 | | 5.2 | | 5.2 | | 5.2 |
| | | | | | | | | | | |
| | | | | | | | | | | |
| | | | | | | | | | | |
| | | | | | | | | | | |
| | | | | | | | | | | |
| | | | | | | | | | | |
| | | | | | | | | | | |
| Interest coverage ratio (4) | 3.9 | | 3.8 | | 3.8 | | 4.0 | | 3.8 | | 3.6 |
| | | | | | | | | | | |
| Fixed charge coverage ratio (4) | 3.3 | | 3.2 | | 3.2 | | 3.4 | | 3.2 | | 3.1 |
| | | | | | | | | | | |
| Debt service coverage ratio (4) | 3.9 | | 3.8 | | 3.8 | | 4.0 | | 3.8 | | 3.6 |
| | | | | | | | | | | |
| FFO payout ratio (5) | 71% | | 72% | | 78% | | 65% | | 71% | | 78% |
| | | | | | | | | | | |
| FFO as adjusted payout ratio (6) | 70% | | 73% | | 70% | | 66% | | 70% | | 74% |
| | | | | | | | | | | |
| AFFO payout ratio (7) | 71% | | 71% | | 70% | | 66% | | 71% | | 75% |
| | | | | | | | | | | |
(1) See pages 24 through 26 for definitions. See prior period supplementals for detailed calculations, as applicable. |
(2) Adjusted EBITDAre is for the quarter multiplied times four. See calculation on page 30. |
(3) Annualized adjusted EBITDAre is adjusted EBITDAre for the quarter further adjusted for in-service and disposed projects, percentage rent and participating interest and other items which is then multiplied times four. These calculations can be found on page 30 under the reconciliation of Adjusted EBITDAre and Annualized Adjusted EBITDAre. See pages 24 through 26 for definitions. |
(4) See page 28 for detailed calculation. |
| (5) FFO payout ratio is calculated by dividing dividends declared per common share by FFO per diluted common share. |
| (6) FFO as adjusted payout ratio is calculated by dividing dividends declared per common share by FFO as adjusted per diluted common share. |
| (7) AFFO payout ratio is calculated by dividing dividends declared per common share by AFFO per diluted common share. |
|
|
| | | | | | | | |
| | |
| Q2 2025 Supplemental | Page 16 |
| |
| | | | | | | | | | | | | | | | | | | | | | | | | | | |
| | | | |
| SUMMARY OF MORTGAGE NOTES RECEIVABLE |
| (UNAUDITED, DOLLARS IN THOUSANDS) | | | | |
| | | | | CARRYING AMOUNT AS OF (1) | | | | |
| DESCRIPTION | INTEREST RATE | PAYOFF DATE/MATURITY DATE | OUTSTANDING PRINCIPAL AMOUNT OF MORTGAGE | | JUNE 30, 2025 | | DECEMBER 31, 2024 | | | | |
| Eat & play property Eugene, Oregon | 8.13 | % | 12/31/2025 | $ | 10,750 | | | $ | 10,417 | | | $ | 10,417 | | | | | |
| Attraction property Powells Point, North Carolina | 7.48 | % | 6/30/2026 | 29,378 | | | 28,917 | | | 29,173 | | | | | |
| Fitness & wellness property Merriam, Kansas | 8.15 | % | 7/31/2029 | 9,090 | | | 9,215 | | | 9,238 | | | | | |
| Fitness & wellness property Omaha, Nebraska | 9.50 | % | 6/30/2030 | 10,905 | | | 10,984 | | | 10,996 | | | | | |
| Fitness & wellness property Omaha, Nebraska | 9.50 | % | 6/30/2030 | 10,539 | | | 10,682 | | | 10,659 | | | | | |
| Experiential lodging property Nashville, Tennessee | 7.69 | % | 9/30/2031 | 70,000 | | | 71,023 | | | 71,041 | | | | | |
| Ski property Girdwood, Alaska | 8.79 | % | 7/31/2032 | 82,000 | | | 81,032 | | | 79,742 | | | | | |
| Fitness & wellness properties Colorado and California | 7.15 | % | 1/10/2033 | 64,550 | | | 64,525 | | | 64,275 | | | | | |
| Eat & play property Austin, Texas | 11.31 | % | 6/1/2033 | 8,747 | | | 8,746 | | | 9,083 | | | | | |
| Eat & play property Dallas, Texas | 10.25 | % | 11/26/2033 | 6,449 | | | 6,217 | | | 6,163 | | | | | |
| Experiential lodging property Breaux Bridge, Louisiana | 7.25 | % | 3/8/2034 | — | | | — | | | 1,000 | | | | | |
| Fitness & wellness property Glenwood Springs, Colorado | 8.45 | % | 8/16/2034 | 53,674 | | | 53,477 | | | 51,892 | | | | | |
| Ski property West Dover and Wilmington, Vermont | 12.69 | % | 12/1/2034 | 51,050 | | | 51,049 | | | 51,049 | | | | | |
| Four ski properties Ohio and Pennsylvania | 11.58 | % | 12/1/2034 | 37,562 | | | 37,428 | | | 37,430 | | | | | |
| Ski property Chesterland, Ohio | 12.07 | % | 12/1/2034 | 4,550 | | | 4,399 | | | 4,394 | | | | | |
| Fitness & wellness property Acworth, Georgia | 8.65 | % | 6/1/2035 | 5,923 | | | 5,964 | | | — | | | | | |
| Ski property Hunter, New York | 9.35 | % | 1/5/2036 | 21,000 | | | 21,000 | | | 21,000 | | | | | |
| Eat & play property Midvale, Utah | 10.25 | % | 5/31/2036 | 17,505 | | | 17,505 | | | 17,505 | | | | | |
| Eat & play property West Chester, Ohio | 9.75 | % | 8/1/2036 | 18,068 | | | 18,068 | | | 18,068 | | | | | |
| Fitness & wellness property Fort Collins, Colorado | 8.00 | % | 1/31/2038 | 10,292 | | | 9,978 | | | 9,896 | | | | | |
| Early childhood education center Lake Mary, Florida | 8.35 | % | 5/9/2039 | — | | | — | | | 4,412 | | | | | |
| Early childhood education center Lithia, Florida | 9.11 | % | 10/31/2039 | — | | | — | | | 4,103 | | | | | |
| Attraction property Frankenmuth, Michigan | 8.25 | % | 10/14/2042 | 69,139 | | | 68,344 | | | 67,966 | | | | | |
| Fitness & wellness properties Massachusetts and New York | 8.45 | % | 1/10/2044 | 77,000 | | | 77,184 | | | 76,294 | | | | | |
| Total | | | $ | 668,171 | | | $ | 666,154 | | | $ | 665,796 | | | | | |
| | | | | | | | | | | |
(1) Amounts include accrued interest and are net of allowance for credit losses.
| | | | | | | | |
| | |
| Q2 2025 Supplemental | Page 17 |
| |
| | | | | | | | | | | | | | | | | | | | | | | |
| INVESTMENT SPENDING AND DISPOSITION SUMMARIES |
| (UNAUDITED, DOLLARS IN THOUSANDS) | |
INVESTMENT SPENDING THREE MONTHS ENDED JUNE 30, 2025 |
| INVESTMENT TYPE | TOTAL INVESTMENT SPENDING | NEW DEVELOPMENT | RE-DEVELOPMENT | | ASSET ACQUISITION | MORTGAGE NOTES OR NOTES RECEIVABLE | INVESTMENT IN JOINT VENTURES |
| | | | | | | |
| Eat & Play | $ | 31,104 | | $ | 30,535 | | $ | 295 | | | $ | — | | $ | 274 | | $ | — | |
| Attractions | — | | — | | — | | | — | | — | | — | |
| Ski | 1,880 | | — | | — | | | — | | 1,880 | | — | |
| Experiential Lodging | 506 | | — | | — | | | — | | — | | 506 | |
| Fitness & Wellness | 15,165 | | — | | 6,326 | | | 1,242 | | 7,597 | | — | |
| | | | | | | |
| | | | | | | |
| Total Experiential | 48,655 | | 30,535 | | 6,621 | | | 1,242 | | 9,751 | | 506 | |
| | | | | | | |
| | | | | | | |
| | | | | | | |
| | | | | | | |
| | | | | | | |
| Total Investment Spending | $ | 48,655 | | $ | 30,535 | | $ | 6,621 | | | $ | 1,242 | | $ | 9,751 | | $ | 506 | |
| | | | | | | |
INVESTMENT SPENDING SIX MONTHS ENDED JUNE 30, 2025 |
| INVESTMENT TYPE | TOTAL INVESTMENT SPENDING | NEW DEVELOPMENT | RE-DEVELOPMENT | | ASSET ACQUISITION | MORTGAGE NOTES OR NOTES RECEIVABLE | INVESTMENT IN JOINT VENTURES |
| | | | | | | |
| Eat & Play | $ | 45,910 | | $ | 44,715 | | $ | 921 | | | $ | — | | $ | 274 | | $ | — | |
| Attractions | 14,281 | | — | | — | | | 14,281 | | — | | — | |
| Ski | 1,880 | | — | | — | | | — | | 1,880 | | — | |
| Experiential Lodging | 1,246 | | — | | — | | | — | | — | | 1,246 | |
| Fitness & Wellness | 23,015 | | — | | 13,878 | | | 1,242 | | 7,895 | | — | |
| | | | | | | |
| | | | | | | |
| Total Experiential | 86,332 | | 44,715 | | 14,799 | | | 15,523 | | 10,049 | | 1,246 | |
| | | | | | | |
| | | | | | | |
| | | | | | | |
| | | | | | | |
| | | | | | | |
| Total Investment Spending | $ | 86,332 | | $ | 44,715 | | $ | 14,799 | | | $ | 15,523 | | $ | 10,049 | | $ | 1,246 | |
|
| | | | | | | | | | | | | | | | | | | | | | | |
2025 DISPOSITIONS |
| THREE MONTHS ENDED JUNE 30, 2025 | | SIX MONTHS ENDED JUNE 30, 2025 |
| INVESTMENT TYPE | TOTAL DISPOSITIONS | NET PROCEEDS FROM SALE OF REAL ESTATE | NET PROCEEDS FROM PAYDOWN OF MORTGAGE NOTES | | TOTAL DISPOSITIONS | NET PROCEEDS FROM SALE OF REAL ESTATE | NET PROCEEDS FROM PAYDOWN OF MORTGAGE NOTES |
| Theatres | $ | 35,591 | | $ | 35,591 | | $ | — | | | $ | 67,515 | | $ | 67,515 | | $ | — | |
| | | | | | | |
| | | | | | | |
| Total Experiential | 35,591 | | 35,591 | | — | | | 67,515 | | 67,515 | | — | |
| | | | | | | |
| Education | — | | — | | — | | | 47,009 | | 38,887 | | 8,122 | |
| | | | | | | |
| Total Education | — | | — | | — | | | 47,009 | | 38,887 | | 8,122 | |
| | | | | | | |
| Total Dispositions | $ | 35,591 | | $ | 35,591 | | $ | — | | | $ | 114,524 | | $ | 106,402 | | $ | 8,122 | |
| | | | | | | | |
| | |
| Q2 2025 Supplemental | Page 18 |
| |
| | | | | | | | | | | | | | | | | | | | | | | | | | | | | | | | | | | | | | | | | | | | | | | |
|
PROPERTY UNDER DEVELOPMENT - INVESTMENT SPENDING ESTIMATES AT JUNE 30, 2025 (1) |
| (UNAUDITED, DOLLARS IN THOUSANDS) |
| | | | | | | | |
| | JUNE 30, 2025 | | OWNED BUILD-TO-SUIT SPENDING ESTIMATES | | | | |
| | PROPERTY UNDER DEVELOPMENT | | # OF PROJECTS | | 3RD QUARTER 2025 | 4TH QUARTER 2025 | 1ST QUARTER 2026 | 2ND QUARTER 2026 | | THEREAFTER | | TOTAL EXPECTED COSTS (2) | | % LEASED |
| Total Build-to-Suit (3) | $ | 80,781 | | | 4 | | $ | 16,825 | | $ | 11,326 | | $ | 8,192 | | $ | 3,550 | | | $ | 5,705 | | | $ | 126,379 | | | 100 | % |
| Non Build-to-Suit Development | 3,414 | | | | | | | | | | | | | | |
| | | | | | | | | | | | | | |
| Total Property Under Development | $ | 84,195 | | | | | | | | | | | | | | |
| | | | | | | | | | | | | | | |
| | | | JUNE 30, 2025 | | OWNED BUILD-TO-SUIT IN-SERVICE ESTIMATES | | | | |
| | | | # OF PROJECTS | | 3RD QUARTER 2025 | 4TH QUARTER 2025 | 1ST QUARTER 2026 | 2ND QUARTER 2026 | | THEREAFTER | | TOTAL IN-SERVICE (2) | | ACTUAL IN-SERVICE 2ND QUARTER 2025 |
| Total Build-to-Suit | | | 4 | | $ | 32,774 | | $ | 36,193 | | $ | — | | $ | 38,312 | | | $ | 19,100 | | | $ | 126,379 | | | $ | 92,998 | |
| | | | | | | | | | | | | | | |
| | JUNE 30, 2025 | | MORTGAGE BUILD-TO-SUIT SPENDING ESTIMATES | | | | |
| | MORTGAGE NOTES RECEIVABLE | | # OF PROJECTS | | 3RD QUARTER 2025 | 4TH QUARTER 2025 | 1ST QUARTER 2026 | 2ND QUARTER 2026 | | THEREAFTER | | TOTAL EXPECTED COSTS (2) | | |
| Total Build-to-Suit Mortgage Notes | $ | 130,661 | | | 2 | | $ | 3,225 | | $ | 1,101 | | $ | — | | $ | — | | | $ | 45,500 | | | $ | 180,487 | | | |
| Non Build-to-Suit Mortgage Notes | 535,493 | | | | | | | | | | | | | | |
| Total Mortgage Notes Receivable | $ | 666,154 | | | | | | | | | | | | | | |
| | | | | | | | | | | | | | | |
(1) This schedule includes only those properties for which the Company has commenced construction as of June 30, 2025. |
| (2) "Total Expected Costs" and "Total In-Service" each reflect the total capital costs expected to be funded by the Company through completion (including capitalized interest or accrued interest, as applicable). |
| (3) "Total Build-to-Suit" excludes property under development related to the Company's real estate joint ventures. The Company's investment spending for these joint ventures is estimated at $0.6 million for the remainder 2025. |
| | | | | | | | | | | | | | | |
Note: This schedule includes future estimates for which the Company can give no assurance as to timing or amounts. Development projects have risks. See Item 1A - "Risk Factors" in the Company's most recent Annual Report on Form 10-K and, to the extent applicable, the Company's Quarterly Reports on Form 10-Q. |
| | | | | | | | |
| | |
| Q2 2025 Supplemental | Page 19 |
| |
| | | | | | | | | | | | | | | | | | | | | | | | | | |
|
PORTFOLIO DETAIL AS OF JUNE 30, 2025 |
| (UNAUDITED) |
|
| | |
| PROPERTY TYPE | | PROPERTIES | | OPERATORS | | ANNUALIZED ADJUSTED EBITDAre (1) | | STRATEGIC FOCUS |
| | | | | | | | |
| Theatres (2) (4) | | 151 | | 17 | | 37 | % | | Reduce |
| Eat & Play | | 58 | | 9 | (3) | 25 | % | | Grow |
| Attractions | | 25 | | 8 | | 12 | % | | Grow |
| Ski | | 11 | | 3 | | 8 | % | | Grow |
| Experiential Lodging (5) | | 4 | | 3 | | 1 | % | | Grow |
| Fitness & Wellness | | 23 | | 10 | | 8 | % | | Grow |
| Gaming | | 1 | | 1 | | 2 | % | | Grow |
| Cultural | | 1 | | 1 | | 1 | % | | Grow |
| EXPERIENTIAL PORTFOLIO | | 274 | | 52 | | 94 | % | | |
| | | | | | | | |
| Early Childhood Education | | 46 | | 4 | | 4 | % | | Reduce |
| Private schools | | 9 | | 1 | | 2 | % | | Reduce |
| EDUCATION PORTFOLIO | | 55 | | 5 | | 6 | % | | |
| | | | | | | | |
| TOTAL PORTFOLIO | | 329 | | 57 | | 100 | % | | |
| | | | | | | | |
(1) See pages 24 through 26 for definitions. |
|
| (2) Excludes seven theatres located in Entertainment Districts (included in Eat & Play). |
| (3) Excludes non-theatre operators at Entertainment districts. |
| (4) Includes three vacant properties that the Company intends to sell. |
| (5) Excludes two experiential lodging properties held in unconsolidated joint ventures that the Company is working in good faith with the Company's joint venture partners, the non-recourse debt provider and insurance companies to identify a path forward in which the Company expects will result in the eventual removal of both experiential properties from the Company's portfolio. |
|
| | | | | | | | |
| | | | | | | | |
|
| | | | | | | | |
| | | | | | | | |
| | |
| Q2 2025 Supplemental | Page 20 |
| |
| | | | | | | | | | | | | | | | | | | | | | | |
|
| LEASE EXPIRATIONS |
AS OF JUNE 30, 2025 |
| (UNAUDITED, DOLLARS IN THOUSANDS) |
| | | |
| YEAR | | TOTAL NUMBER OF PROPERTIES | | RENTAL REVENUE FOR THE TWELVE MONTHS ENDED JUNE 30, 2025 (1) | | % OF TOTAL REVENUE | |
| 2025 | | — | | | $ | — | | | — | % | |
| 2026 | | 2 | | | 2,456 | | | — | % | |
| 2027 | | 4 | | | 20,464 | | | 3 | % | |
| 2028 | | 9 | | | 14,948 | | | 2 | % | |
| 2029 | | 15 | | | 23,836 | | | 3 | % | |
| 2030 | | 20 | | | 33,638 | | | 5 | % | |
| 2031 | | 3 | | | 5,063 | | | 1 | % | |
| 2032 | | 8 | | | 12,236 | | | 2 | % | |
| 2033 | | 7 | | | 10,491 | | | 2 | % | |
| 2034 | | 36 | | | 67,210 | | | 9 | % | |
| 2035 | | 29 | | | 70,614 | | | 10 | % | |
| 2036 | | 38 | | | 73,080 | | | 10 | % | |
| 2037 | | 27 | | | 61,437 | | | 9 | % | |
| 2038 | | 40 | | | 62,276 | | | 9 | % | |
| 2039 | | 2 | | | 4,945 | | | 1 | % | |
| 2040 | | 3 | | | 9,699 | | | 1 | % | |
| 2041 | | 30 | | | 18,608 | | | 3 | % | |
| 2042 | | 4 | | | 17,426 | | | 2 | % | |
| 2043 | | 7 | | | 20,698 | | | 3 | % | |
| 2044 | | 1 | | | 3,071 | | | — | % | |
| Thereafter | | 5 | | | 21,774 | | | 3 | % | |
| | 290 | | | $ | 553,970 | | | 78 | % | |
| | | | | | | |
Note: This schedule excludes non-theatre tenant leases within the Company's entertainment districts, properties under development, land held for development, properties operated by the Company and investments in mortgage notes receivable. |
|
(1) Rental revenue for the trailing twelve months ended June 30, 2025 includes lease revenue related to the Company's existing operating ground leases (leases in which the Company is a sub-lessor) as well as the gross-up of tenant reimbursed expenses recognized during the trailing twelve months ended June 30, 2025 in accordance with Accounting Standards Update (ASU) No. 2016-02 Leases (Topic 842). |
| | | | | | | |
|
| | | | | | | | |
| | |
| Q2 2025 Supplemental | Page 21 |
| |
| | | | | | | | | | | | | | | | | |
| | | | | |
| TOP TEN CUSTOMERS BY PERCENTAGE OF TOTAL REVENUE |
| (UNAUDITED) | |
| | | | | |
| | | PERCENTAGE OF TOTAL REVENUE | | PERCENTAGE OF TOTAL REVENUE |
| | | FOR THE THREE MONTHS ENDED | | FOR THE SIX MONTHS ENDED |
| CUSTOMERS | | JUNE 30, 2025 | | JUNE 30, 2025 |
| | | | | |
| 1. | Topgolf | | 14.1% | | 14.2% |
| 2. | AMC Entertainment Holdings, Inc. | | 13.2% | | 13.4% |
| 3. | Regal Entertainment Group | | 12.1% | | 11.4% |
| 4. | Cinemark | | 6.0% | | 6.0% |
| 5. | Vail Resorts | | 4.7% | | 4.9% |
| 6. | Premier Parks | | 4.7% | | 4.2% |
| 7. | Camelback Resort | | 3.2% | | 3.2% |
| 8. | Santikos Theaters, LLC | | 2.5% | | 2.5% |
| 9. | Six Flags Entertainment Corporation | | 2.5% | | 2.5% |
| 10. | Endeavor Schools | | 2.0% | | 2.1% |
| | | | | |
| Total | | 65.0% | | 64.4% |
| | | | | |
|
|
| | | | | |
| | | | | | | | |
| | |
| Q2 2025 Supplemental | Page 22 |
| |
| | | | | | | | | | | | | | | | |
| GUIDANCE | | |
| (UNAUDITED, DOLLARS IN MILLIONS, EXCEPT PER SHARE DATA) |
| | | | | | | | | | | | | | | | | | | | | | | | | | | | | | | | |
| MEASURE | | | | 2025 GUIDANCE |
| | YTD ACTUALS | | CURRENT | | PRIOR |
| Investment spending | | $86.3 | | $200.0 | to | $300.0 | | $200.0 | to | $300.0 |
| Disposition proceeds and mortgage note payoff | | $114.5 | | $130.0 | to | $145.0 | | $80.0 | to | $120.0 |
| Percentage rent and participating interest | | $9.7 | | $21.5 | to | $25.5 | | $21.5 | to | $25.5 |
| General and administrative expense | | $27.3 | | $53.0 | to | $56.0 | | $53.0 | to | $56.0 |
| Other income (1) | | $23.9 | | $42.0 | to | $52.0 | | $42.0 | to | $52.0 |
| Other expense (1) | | $24.6 | | $42.0 | to | $52.0 | | $42.0 | to | $52.0 |
| | | | | | | | | | |
| | | | | | | | | | |
| FFO per diluted share | | $2.44 | | $4.97 | to | $5.13 | | $5.01 | to | $5.17 |
| FFOAA per diluted share | | $2.45 | | $5.00 | to | $5.16 | | $5.00 | to | $5.16 |
| | | | | | | | | | |
| RECONCILIATION FROM NET INCOME AVAILABLE TO COMMON SHAREHOLDERS OF EPR PROPERTIES (PER DILUTED SHARE): | | YTD ACTUALS | | 2025 GUIDANCE | | | | |
| Net income available to common shareholders of EPR Properties | | $1.69 | | $3.20 | to | $3.36 | | | | |
| Gain on sale of real estate | | (0.34) | | (0.38) | | | | |
| | | | | | | | |
| Real estate depreciation and amortization | | 1.08 | | 2.16 | | | | |
| Allocated share of joint venture depreciation | | 0.03 | | 0.05 | | | | |
| | | | | | | | |
| Impact of Series C and Series E Dilution, if applicable | | (0.02) | | (0.06) | | | | |
| FFO available to common shareholders of EPR Properties | | $2.44 | | $4.97 | to | $5.13 | | | | |
| Retirement and severance expense | | — | | 0.03 | | | | |
| Transaction costs | | 0.02 | | 0.02 | | | | |
| | | | | | | | |
| Provision (benefit) for credit losses, net | | — | | — | | | | |
| | | | | | | | | | |
| | | | | | | | |
| | | | | | | | | | |
| Deferred income tax benefit | | (0.01) | | (0.02) | | | | |
| | | | | | | | |
| FFO as adjusted (FFOAA) available to common shareholders of EPR Properties | | $2.45 | | $5.00 | to | $5.16 | | | | |
| | | | | | | | | | |
| (1) Other income and other expense consist primarily of results from the Company's properties operated through third-party managers. |
Note: This schedule includes future estimates for which the Company can give no assurance as to timing or amounts. See cautionary statement concerning forward-looking statements on page 3.
| | | | | | | | |
| | |
| Q2 2025 Supplemental | Page 23 |
| |
| | | | | | | | | | | | | | |
| DEFINITIONS - NON-GAAP FINANCIAL MEASURES |
EBITDAre
The National Association of Real Estate Investment Trusts (“NAREIT”) developed EBITDAre as a relative non-GAAP financial measure of REITs, independent of a company's capital structure, to provide a uniform basis to measure the enterprise value of a company. Pursuant to the definition of EBITDAre by the Board of Governors of NAREIT, the Company calculates EBITDAre as net income, computed in accordance with GAAP, excluding interest expense (net), income tax expense (benefit), depreciation and amortization, gains and losses from disposition of real estate, impairment losses on real estate, costs associated with loan refinancing or payoff and adjustments for unconsolidated partnerships, joint ventures and other affiliates. Management provides EBITDAre herein because it believes this information is useful to investors as a supplemental performance measure because it can help facilitate comparisons of operating performance between periods and with other REITs. The Company's method of calculating EBITDAre may be different from methods used by other REITs and, accordingly, may not be comparable to such other REITs. EBITDAre is not a measure of performance under GAAP, does not represent cash generated from operations as defined by GAAP and is not indicative of cash available to fund all cash needs, including distributions. This measure should not be considered an alternative to net income or any other GAAP measure as a measurement of the results of the Company's operations or cash flows or liquidity as defined by GAAP.
ADJUSTED EBITDAre AND ANNUALIZED ADJUSTED EBITDAre
Management uses Adjusted EBITDAre in its analysis of the performance of the business and operations of the Company. Management believes Adjusted EBITDAre is useful to investors because it excludes various items that management believes are not indicative of operating performance, and because it is an informative measure to use in computing various financial ratios to evaluate the Company. The Company defines Adjusted EBITDAre as EBITDAre (defined above) for the quarter excluding sale participation income, gain on insurance recovery, retirement and severance expense, transaction costs, provision (benefit) for credit losses, net, impairment losses on operating lease right-of-use assets and prepayment fees. This number for the quarter is then multiplied by four to get an annual amount. Annualized Adjusted EBITDAre is Adjusted EBITDAre further adjusted to reflect (1) in-service and disposed projects (2) property under development that is build-to-suit at the initial cash yields of the projects upon completion (3) removal of other non-recurring items including out of period deferrals and stub rent payments and (4) annualization of the following items to ultimately reflect the financial results of the trailing twelve months or mid-point of guidance: (i) percentage rent and participating interest income and (ii) adjusted EBITDAre of managed properties and joint ventures.
The Company's method of calculating Adjusted EBITDAre and Annualized Adjusted EBITDAre may be different from methods used by other REITs and, accordingly, may not be comparable to such other REITs. Adjusted EBITDAre and Annualized Adjusted EBITDAre are not measures of performance under GAAP, do not represent cash generated from operations as defined by GAAP and are not indicative of cash available to fund all cash needs, including distributions. These measures should not be considered as an alternative to net income or any other GAAP measure as a measurement of the results of the Company's operations or cash flows or liquidity as defined by GAAP.
NET DEBT
Net Debt represents debt (reported in accordance with GAAP) adjusted to exclude deferred financing costs, net and reduced by cash and cash equivalents. By excluding deferred financing costs, net, and reducing debt for cash and cash equivalents on hand, the result provides an estimate of the contractual amount of borrowed capital to be repaid, net of cash available to repay it. The Company believes this calculation constitutes a beneficial supplemental non-GAAP financial disclosure to investors in understanding its financial condition. The Company's method of calculating Net Debt may be different from methods used by other REITs and, accordingly, may not be comparable to such other REITs.
| | | | | | | | |
| | |
| Q2 2025 Supplemental | Page 24 |
| |
NET DEBT TO ADJUSTED EBITDAre RATIO, NET DEBT TO GROSS ASSETS RATIO AND NET DEBT TO TOTAL MARKET CAPITALIZATION RATIO
Net Debt to Adjusted EBITDAre Ratio, Net Debt to Gross Assets Ratio and Net Debt to Total Market Capitalization Ratio are supplemental measures derived from non-GAAP financial measures that the Company uses to evaluate its capital structure and the magnitude of its debt against its operating performance. The Company believes that investors commonly use versions of these ratios in a similar manner. In addition, financial institutions use versions of these ratios in connection with debt agreements to set pricing and covenant limitations. The Company's method of calculating Net Debt to Adjusted EBITDAre Ratio, Net Debt to Gross Assets Ratio and Net Debt to Total Market Capitalization Ratio may be different from methods used by other REITs and, accordingly, may not be comparable to such other REITs.
FUNDS FROM OPERATIONS (“FFO”) AND FFO AS ADJUSTED
NAREIT developed FFO as a relative non-GAAP financial measure of performance of an equity REIT in order to recognize that income-producing real estate historically has not depreciated on the basis determined under GAAP and management provides FFO herein because it believes this information is useful to investors in this regard. FFO is a widely used measure of the operating performance of real estate companies and is provided here as a supplemental measure to GAAP net income available to common shareholders and earnings per share. Pursuant to the definition of FFO by the Board of Governors of NAREIT, the Company calculates FFO as net income available to common shareholders, computed in accordance with GAAP, excluding gains and losses from disposition of real estate and impairment losses on real estate, plus real estate related depreciation and amortization, and after adjustments for unconsolidated partnerships, joint ventures and other affiliates. Adjustments for unconsolidated partnerships, joint ventures and other affiliates are calculated to reflect FFO on the same basis. The Company has calculated FFO for all periods presented in accordance with this definition. In addition, the Company presents FFO as adjusted. Management believes it is useful to provide FFO as adjusted as a supplemental measure to GAAP net income available to common shareholders and earnings per share. FFO as adjusted is FFO plus retirement and severance expense, transaction costs, provision (benefit) for credit losses, net, costs associated with loan refinancing or payoff, preferred share redemption costs and impairment of operating lease right-of-use assets, and by subtracting sale participation income, gain on insurance recovery and deferred income tax expense (benefit). FFO and FFO as adjusted are non-GAAP financial measures. FFO and FFO as adjusted do not represent cash flows from operations as defined by GAAP and are not indicative that cash flows are adequate to fund all cash needs and are not to be considered an alternative to net income or any other GAAP measure as a measurement of the results of the Company's operations, cash flows or liquidity as defined by GAAP. It should also be noted that not all REITs calculate FFO and FFO as adjusted the same way so comparisons with other REITs may not be meaningful.
ADJUSTED FUNDS FROM OPERATIONS (“AFFO”)
In addition to FFO, the Company presents AFFO by adding to FFO retirement and severance expense, transaction costs, provision (benefit) for credit losses, net, costs associated with loan refinancing or payoff, preferred share redemption costs, impairment of operating lease right-of-use assets, termination fees associated with tenants' exercises of public charter school buy-out options, non-real estate depreciation and amortization, deferred financing fees amortization and share-based compensation expense to management and trustees; and by subtracting amortization of above and below market leases, net and tenant allowances, sale participation income, maintenance capital expenditures (including second generation tenant improvements and leasing commissions), straight-lined rental revenue (removing the impact of straight-line ground sublease expense), non-cash portion of mortgage and other financing income, allocated share of joint venture non-cash items, gain on insurance recovery and deferred income tax (benefit) expense. AFFO is a widely used measure of the operating performance of real estate companies and is provided here as a supplemental measure to GAAP net income available to common shareholders and earnings per share and management provides AFFO herein because it believes this information is useful to investors in this regard. AFFO is a non-GAAP financial measure. AFFO does not represent cash flows from operations as defined by GAAP and is not indicative that cash flows are adequate to fund all cash needs and is not to be considered an alternative to net income or any other GAAP measure as a measurement of the results of the Company's operations or its cash flows or liquidity as defined by GAAP. It should also be noted that not all REITs calculate AFFO the same way so comparisons with other REITs may not be meaningful.
| | | | | | | | |
| | |
| Q2 2025 Supplemental | Page 25 |
| |
INTEREST COVERAGE RATIO
The interest coverage ratio is calculated as the interest coverage amount divided by interest expense, gross. The Company calculates the interest coverage amount by adding to net income impairment charges, provision (benefit) for credit losses, net, transaction costs, interest expense, gross (including interest expense in discontinued operations), retirement and severance expense, depreciation and amortization, share-based compensation expense to management and trustees and costs associated with loan refinancing or payoff; subtracting sale participation income, interest cost capitalized, straight-line rental revenue, gain on early extinguishment of debt, gain (loss) on sale of real estate from continuing and discontinued operations, gain on insurance recovery, gain on previously held equity interest, gain on early extinguishment of debt, prepayment fees and deferred income tax benefit (expense). The Company calculates interest expense, gross, by adding to interest expense, net, interest income and interest cost capitalized. The Company considers the interest coverage ratio to be an appropriate supplemental measure of a company’s ability to meet its interest expense obligations and management believes it is useful to investors in this regard. The Company's calculation of the interest coverage ratio may be different from the calculation used by other companies, and therefore, comparability may be limited. This information should not be considered as an alternative to any GAAP liquidity measures.
FIXED CHARGE COVERAGE RATIO
The fixed charge coverage ratio is calculated in exactly the same manner as the interest coverage ratio, except that interest expense, gross and preferred share dividends are also added to the denominator. The Company considers the fixed charge coverage ratio to be an appropriate supplemental measure of a company’s ability to make its interest and preferred share dividend payments and management believes it is useful to investors in this regard. The Company's calculation of the fixed charge coverage ratio may be different from the calculation used by other companies and, therefore, comparability may be limited. This information should not be considered as an alternative to any GAAP liquidity measures.
DEBT SERVICE COVERAGE RATIO
The debt service coverage ratio is calculated in exactly the same manner as the interest coverage ratio, except that interest expense, gross and recurring principal payments are also added to the denominator. The Company considers the debt service coverage ratio to be an appropriate supplemental measure of a company’s ability to make its debt service payments and management believes it is useful to investors in this regard. The Company's calculation of the debt service coverage ratio may be different from the calculation used by other companies and, therefore, comparability may be limited. This information should not be considered as an alternative to any GAAP liquidity measures.
NON-GAAP PRO-RATA FINANCIAL INFORMATION - UNCONSOLIDATED JOINT VENTURES
This information includes non-GAAP financial measures. The Company's share of unconsolidated joint ventures is derived on an entity-by-entity basis by applying its ownership percentage to each line item in the GAAP financial statements of these properties to calculate its share of that line item. The Company believes this form of presentation offers insights into the financial performance and condition of our Company as a whole, given the significance of its unconsolidated joint ventures that are accounted for under the equity method of accounting, although the presentation of such information may not accurately depict the legal and economic implications of holding an unconsolidated joint venture. The Company's method of calculating its proportionate interest may be different from methods used by other REITs and, accordingly, may not be comparable to such other REITs. The Company does not control the unconsolidated joint venture for purposes of GAAP and the presentation of the assets and liabilities and revenues and expenses do not represent a legal claim to such items. Due to these limitations, the non-GAAP pro-rata financial information should not be considered in isolation or as a substitute for the Company's consolidated financial statements as reported under GAAP.
| | | | | | | | |
| | |
| Q2 2025 Supplemental | Page 26 |
| |
| | | | | | | | | | | | | | | | | | | | | | | | | | |
| Appendix to Supplemental Operating and Financial Data |
| Reconciliation of Certain Non-GAAP Financial Measures |
Second Quarter Ended June 30, 2025 |
| | | | | | | | |
| | |
| Q2 2025 Supplemental | Page 27 |
| |
| | | | | | | | | | | | | | | | | | | | | | | | | | | | | | | | | | | | |
| CALCULATION OF INTEREST, FIXED CHARGE AND DEBT SERVICE COVERAGE RATIOS | |
| (UNAUDITED, DOLLARS IN THOUSANDS) | |
| INTEREST COVERAGE RATIO (1): | 2ND QUARTER 2025 | | 1ST QUARTER 2025 | | 4TH QUARTER 2024 | | 3RD QUARTER 2024 | | 2ND QUARTER 2024 | | 1ST QUARTER 2024 | |
| Net income (loss) | $ | 75,643 | | | $ | 65,803 | | | $ | (8,395) | | | $ | 46,650 | | | $ | 45,102 | | | $ | 62,709 | | |
| Impairment charges | — | | | — | | | 39,952 | | | — | | | 11,812 | | | — | | |
| Impairment charges on joint ventures | — | | | — | | | 16,087 | | | 12,130 | | | — | | | — | | |
| Retirement and severance expense | — | | | — | | | — | | | — | | | — | | | 1,836 | | |
| Transaction costs | 669 | | | 567 | | | 423 | | | 175 | | | 199 | | | 1 | | |
| Provision (benefit) for credit losses, net | 997 | | | (652) | | | 9,876 | | | (770) | | | 404 | | | 2,737 | | |
| Interest expense, gross | 34,506 | | | 34,784 | | | 34,991 | | | 34,402 | | | 33,784 | | | 33,592 | | |
| | | | | | | | | | | | |
| Depreciation and amortization | 42,080 | | | 41,089 | | | 40,995 | | | 42,795 | | | 41,474 | | | 40,469 | | |
| Share-based compensation expense | | | | | | | | | | | | |
| to management and trustees | 3,912 | | | 3,867 | | | 3,572 | | | 3,264 | | | 3,538 | | | 3,692 | | |
| Costs associated with loan refinancing or payoff | — | | | — | | | — | | | 337 | | | — | | | — | | |
| | | | | | | | | | | | |
| Interest cost capitalized | (961) | | | (1,435) | | | (1,161) | | | (878) | | | (471) | | | (958) | | |
| Straight-line rental revenue | (5,137) | | | (3,397) | | | (3,992) | | | (4,414) | | | (5,251) | | | (3,670) | | |
| | | | | | | | | | | | |
| (Gain) loss on sale of real estate | (16,779) | | | (9,384) | | | (112) | | | 3,419 | | | (1,459) | | | (17,949) | | |
| | | | | | | | | | | | |
| | | | | | | | | | | | |
| | | | | | | | | | | | |
| | | | | | | | | | | | |
| Deferred income tax benefit | (93) | | | (530) | | | (285) | | | (728) | | | (249) | | | (277) | | |
| Interest coverage amount | $ | 134,837 | | | $ | 130,712 | | | $ | 131,951 | | | $ | 136,382 | | | $ | 128,883 | | | $ | 122,182 | | |
| | | | | | | | | | | | |
| Interest expense, net | $ | 33,246 | | | $ | 33,021 | | | $ | 33,472 | | | $ | 32,867 | | | $ | 32,820 | | | $ | 31,651 | | |
| Interest income | 299 | | | 328 | | | 358 | | | 657 | | | 493 | | | 983 | | |
| Interest cost capitalized | 961 | | | 1,435 | | | 1,161 | | | 878 | | | 471 | | | 958 | | |
| Interest expense, gross | $ | 34,506 | | | $ | 34,784 | | | $ | 34,991 | | | $ | 34,402 | | | $ | 33,784 | | | $ | 33,592 | | |
| | | | | | | | | | | | |
| Interest coverage ratio | 3.9 | | | 3.8 | | | 3.8 | | | 4.0 | | | 3.8 | | | 3.6 | | |
| | | | | | | | | | | | |
| FIXED CHARGE COVERAGE RATIO (1): | | | | | | | | | | | | |
| Interest coverage amount | $ | 134,837 | | | $ | 130,712 | | | $ | 131,951 | | | $ | 136,382 | | | $ | 128,883 | | | $ | 122,182 | | |
| | | | | | | | | | | | |
| Interest expense, gross | $ | 34,506 | | | $ | 34,784 | | | $ | 34,991 | | | $ | 34,402 | | | $ | 33,784 | | | $ | 33,592 | | |
| Preferred share dividends | 6,040 | | | 6,032 | | | 6,040 | | | 6,032 | | | 6,040 | | | 6,032 | | |
| Fixed charges | $ | 40,546 | | | $ | 40,816 | | | $ | 41,031 | | | $ | 40,434 | | | $ | 39,824 | | | $ | 39,624 | | |
| Fixed charge coverage ratio | 3.3 | | | 3.2 | | | 3.2 | | | 3.4 | | | 3.2 | | | 3.1 | | |
| | | | | | | | | | | | |
| DEBT SERVICE COVERAGE RATIO (1): | | | | | | | | | | | | |
| Interest coverage amount | $ | 134,837 | | | $ | 130,712 | | | $ | 131,951 | | | $ | 136,382 | | | $ | 128,883 | | | $ | 122,182 | | |
| Interest expense, gross | $ | 34,506 | | | $ | 34,784 | | | $ | 34,991 | | | $ | 34,402 | | | $ | 33,784 | | | $ | 33,592 | | |
| Recurring principal payments | — | | | — | | | — | | | — | | | — | | | — | | |
| Debt service | $ | 34,506 | | | $ | 34,784 | | | $ | 34,991 | | | $ | 34,402 | | | $ | 33,784 | | | $ | 33,592 | | |
| Debt service coverage ratio | 3.9 | | | 3.8 | | | 3.8 | | | 4.0 | | | 3.8 | | | 3.6 | | |
| | | | | | | | | | | | |
(1) See pages 24 through 26 for definitions. | |
| |
| |
| | | | | | | | |
| | |
| Q2 2025 Supplemental | Page 28 |
| |
| | | | | | | | | | | | | | | | | | | | | | | | | | | | | | | | | | | | | | |
| RECONCILIATION OF INTEREST COVERAGE AMOUNT TO NET CASH PROVIDED BY OPERATING ACTIVITIES |
| (UNAUDITED, DOLLARS IN THOUSANDS) |
| | | | | | | | | | | | |
The interest coverage amount per the table on page 28 is a non-GAAP financial measure and should not be considered an alternative to any GAAP liquidity measures. It is most directly comparable to the GAAP liquidity measure, “Net cash provided by operating activities,” and is not directly comparable to the GAAP liquidity measures, “Net cash used by investing activities” and “Net cash provided by financing activities.” The interest coverage amount can be reconciled to “Net cash provided by operating activities” per the consolidated statements of cash flows as follows: |
| | 2ND QUARTER 2025 | | 1ST QUARTER 2025 | | 4TH QUARTER 2024 | | 3RD QUARTER 2024 | | 2ND QUARTER 2024 | | 1ST QUARTER 2024 |
| | | | | | | | | | | | |
| Net cash provided by operating activities | | $ | 87,321 | | | $ | 99,369 | | | $ | 92,938 | | | $ | 122,001 | | | $ | 78,655 | | | $ | 99,543 | |
| | | | | | | | | | | | |
| Equity in loss from joint ventures | | (1,681) | | | (2,647) | | | (3,425) | | | (851) | | | (906) | | | (3,627) | |
| Distributions from joint ventures | | — | | | (11) | | | — | | | — | | | — | | | — | |
| Amortization of deferred financing costs | | (2,102) | | | (2,206) | | | (2,187) | | | (2,211) | | | (2,234) | | | (2,212) | |
| Amortization of above and below market leases and tenant allowances, net | | 81 | | | 81 | | | 81 | | | 84 | | | 84 | | | 84 | |
| Changes in assets and liabilities: | | | | | | | | | | | | |
| Operating lease assets and liabilities | | 259 | | | 293 | | | 324 | | | 373 | | | 315 | | | 287 | |
| Mortgage notes accrued interest receivable | | (1,266) | | | 1,687 | | | (549) | | | 485 | | | 817 | | | 1,418 | |
| Accounts receivable | | 8,619 | | | 3,862 | | | 5,902 | | | 4,209 | | | 6,101 | | | 5,819 | |
| | | | | | | | | | | | |
| | | | | | | | | | | | |
| Other assets | | 3,370 | | | 1,507 | | | 759 | | | 677 | | | 2,621 | | | 3,878 | |
| Accounts payable and accrued liabilities | | 10,160 | | | (3,759) | | | 81 | | | (18,882) | | | 13,053 | | | (6,202) | |
| Unearned rents and interest | | 999 | | | 2,017 | | | 7,766 | | | 1,212 | | | 2,116 | | | (6,009) | |
| | | | | | | | | | | | |
| Straight-line rental revenue | | (5,137) | | | (3,397) | | | (3,992) | | | (4,414) | | | (5,251) | | | (3,670) | |
| Interest expense, gross | | 34,506 | | | 34,784 | | | 34,991 | | | 34,402 | | | 33,784 | | | 33,592 | |
| Interest cost capitalized | | (961) | | | (1,435) | | | (1,161) | | | (878) | | | (471) | | | (958) | |
| | | | | | | | | | | | |
| Transaction costs | | 669 | | | 567 | | | 423 | | | 175 | | | 199 | | | 1 | |
| | | | | | | | | | | | |
| Retirement and severance expense (cash portion) | | — | | | — | | | — | | | — | | | — | | | 238 | |
| | | | | | | | | | | | |
| | | | | | | | | | | | |
| Interest coverage amount (1) | | $ | 134,837 | | | $ | 130,712 | | | $ | 131,951 | | | $ | 136,382 | | | $ | 128,883 | | | $ | 122,182 | |
| | | | | | | | | | | | |
| Net cash (used) provided by investing activities | | $ | (12,574) | | | $ | 42,397 | | | $ | (30,710) | | | $ | (73,160) | | | $ | (33,931) | | | $ | (38,551) | |
| | | | | | | | | | | | |
| Net cash used by financing activities | | $ | (73,416) | | | $ | (150,490) | | | $ | (64,468) | | | $ | (47,295) | | | $ | (70,372) | | | $ | (79,484) | |
| | | | | | | | | | | | |
(1) See pages 24 through 26 for definitions. |
| | | | | | | | |
| | |
| Q2 2025 Supplemental | Page 29 |
| |
| | | | | | | | | | | | | | | | | | | | | | | | | | | | | | | | | | | | | | |
| RECONCILIATION OF EBITDAre, ADJUSTED EBITDAre AND ANNUALIZED ADJUSTED EBITDAre |
| (UNAUDITED, DOLLARS IN THOUSANDS) |
| ADJUSTED EBITDAre (1): | | 2ND QUARTER 2025 | | 1ST QUARTER 2025 | | 4TH QUARTER 2024 | | 3RD QUARTER 2024 | | 2ND QUARTER 2024 | | 1ST QUARTER 2024 |
| Net income (loss) | | $ | 75,643 | | | $ | 65,803 | | | $ | (8,395) | | | $ | 46,650 | | | $ | 45,102 | | | $ | 62,709 | |
| Interest expense, net | | 33,246 | | | 33,021 | | | 33,472 | | | 32,867 | | | 32,820 | | | 31,651 | |
| Income tax expense | | 681 | | | 136 | | | 653 | | | (124) | | | 557 | | | 347 | |
| Depreciation and amortization | | 42,080 | | | 41,089 | | | 40,995 | | | 42,795 | | | 41,474 | | | 40,469 | |
| (Gain) loss on sale of real estate | | (16,779) | | | (9,384) | | | (112) | | | 3,419 | | | (1,459) | | | (17,949) | |
| | | | | | | | | | | | |
| Impairment of real estate investments | | — | | | — | | | 39,952 | | | — | | | 11,812 | | | — | |
| | | | | | | | | | | | |
| Costs associated with loan refinancing or payoff | | — | | | — | | | — | | | 337 | | | — | | | — | |
| | | | | | | | | | | | |
| Allocated share of joint venture depreciation | | 985 | | | 1,036 | | | 1,965 | | | 2,581 | | | 2,457 | | | 2,416 | |
| Allocated share of joint venture interest expense | | 430 | | | 375 | | | 589 | | | 2,587 | | | 2,310 | | | 2,131 | |
| Impairment charges on joint ventures | | — | | | — | | | 16,087 | | | 12,130 | | | — | | | — | |
| EBITDAre | | $ | 136,286 | | | $ | 132,076 | | | $ | 125,206 | | | $ | 143,242 | | | $ | 135,073 | | | $ | 121,774 | |
| | | | | | | | | | | | |
| | | | | | | | | | | | |
| Retirement and severance expense | | — | | | — | | | — | | | — | | | — | | | 1,836 | |
| | | | | | | | | | | | |
| | | | | | | | | | | | |
| Transaction costs | | 669 | | | 567 | | | 423 | | | 175 | | | 199 | | | 1 | |
| | | | | | | | | | | | |
| Provision (benefit) for credit losses, net | | 997 | | | (652) | | | 9,876 | | | (770) | | | 404 | | | 2,737 | |
| | | | | | | | | | | | |
| | | | | | | | | | | | |
| | | | | | | | | | | | |
| | | | | | | | | | | | |
| | | | | | | | | | | | |
| Adjusted EBITDAre (for the quarter) | | $ | 137,952 | | | $ | 131,991 | | | $ | 135,505 | | | $ | 142,647 | | | $ | 135,676 | | | $ | 126,348 | |
| Adjusted EBITDAre (2) | | $ | 551,808 | | | $ | 527,964 | | | $ | 542,020 | | | $ | 570,588 | | | $ | 542,704 | | | $ | 505,392 | |
| | | | | | | | | | | | |
| ANNUALIZED ADJUSTED EBITDAre (1): | | | | | | | | | | | | |
| Adjusted EBITDAre (for the quarter) | | $ | 137,952 | | | $ | 131,991 | | | $ | 135,505 | | | $ | 142,647 | | | $ | 135,676 | | | $ | 126,348 | |
| | | | | | | | | | | | |
| In-service and disposition adjustments (3) | | 200 | | | (500) | | | 448 | | | 708 | | | 141 | | | 2,079 | |
| Managed and JV property adjustments (4) | | 285 | | | 2,420 | | | 1,711 | | | (5,392) | | | (881) | | | 2,832 | |
| Property under development adjustments (5) | | 1,715 | | | 2,336 | | | 2,258 | | | 1,472 | | | 1,118 | | | 646 | |
| Percentage rent/participation adjustments (6) | | 496 | | | 40 | | | 70 | | | (2,193) | | | 1,527 | | | 1,660 | |
| Deferral and stub rent collections not previously recognized (7) | | — | | | — | | | — | | | — | | | — | | | (565) | |
| Non-recurring adjustments (8) | | (606) | | | 1,313 | | | (643) | | | (187) | | | (1,305) | | | 798 | |
| Annualized Adjusted EBITDAre (for the quarter) | | $ | 140,042 | | | $ | 137,600 | | | $ | 139,349 | | | $ | 137,055 | | | $ | 136,276 | | | $ | 133,798 | |
| Annualized Adjusted EBITDAre (9) | | $ | 560,168 | | | $ | 550,400 | | | $ | 557,396 | | | $ | 548,220 | | | $ | 545,104 | | | $ | 535,192 | |
| | | | | | | | | | | | |
| | | | | | | | | | | | |
| | | | | | | | | | | | |
| | | | | | | | | | | | |
| | | | | | | | | | | | |
| | | | | | | | | | | | |
| | | | | | | | | | | | |
| | | | | | | | | | | | |
| | | | | | | | | | | | |
| | | | | | | | | | | | |
| | | | | | | | | | | | |
| | | | | | | | | | | | |
| See footnotes on the following page. | | | | | | | | | | | | |
|
| | | | | | | | | | | | |
| | | | | | | | | | | | |
| | | | | | | | | | | | |
| | | | | | | | | | | | |
| | | | | | | | | | | | |
| | | | | | | | | | | | |
| | | | | | | | | | | | |
| | | | | | | | | | | | |
| | | | | | | | |
| | |
| Q2 2025 Supplemental | Page 30 |
| |
| | | | | | | | | | | | | | | | | | | | | | | | | | | | | | | | | | | | | | |
| | | | | | | | | | | | |
|
| | | | | | | | | | | | |
| | | | | | | | | | | | |
| | | | | | | | | | | | |
| | | | | | | | | | | | |
| | | | | | | | | | | | |
| | | | | | | | | | | | |
| | | | | | | | | | | | |
| | | | | | | | | | | | |
| | | | | | | | | | | | |
| | | | | | | | | | | | |
|
(1) See pages 24 through 26 for definitions. |
| (2) Adjusted EBITDAre for the quarter is multiplied by four to calculate an annualized amount but does not include the annualization of investments put in service, acquired or disposed of during the quarter, as well as the potential earnings on property under development, the annualization of percentage rent and participating interest and adjustments for other items. These adjustments are considered in the calculation of Annualized Adjusted EBITDAre. |
|
| (3) Adjustments for rental properties commencing or terminating GAAP net operating income during the quarter and adjustments to revenue from mortgage notes receivable to be consistent with end of quarter balance. |
| (4) To annualize amounts from the actual latest quarterly amount to the trailing 12-month amount divided by four. Annualized Adjusted EBITDAre related to the Company's investments in two joint venture properties in St. Pete Beach, Florida has been reduced to zero. |
| (5) To add in income for property under development that is build-to-suit at the initial cash yields of the projects upon completion. |
| (6) To adjust percentage rents and participating interest income from the actual quarterly amount to the mid-point of the guidance amount shown on page 23, less non-recurring adjustments, divided by four. |
| (7) To remove non-recurring, out-of-period deferred and stub rent collections |
| (8) Adjustments for various non-recurring items during the quarter. |
| (9) Annualized Adjusted EBITDAre for the quarter is multiplied by four to calculate an annualized amount. |
|
|
| | | | | | | | |
| | |
| Q2 2025 Supplemental | Page 31 |
| |