
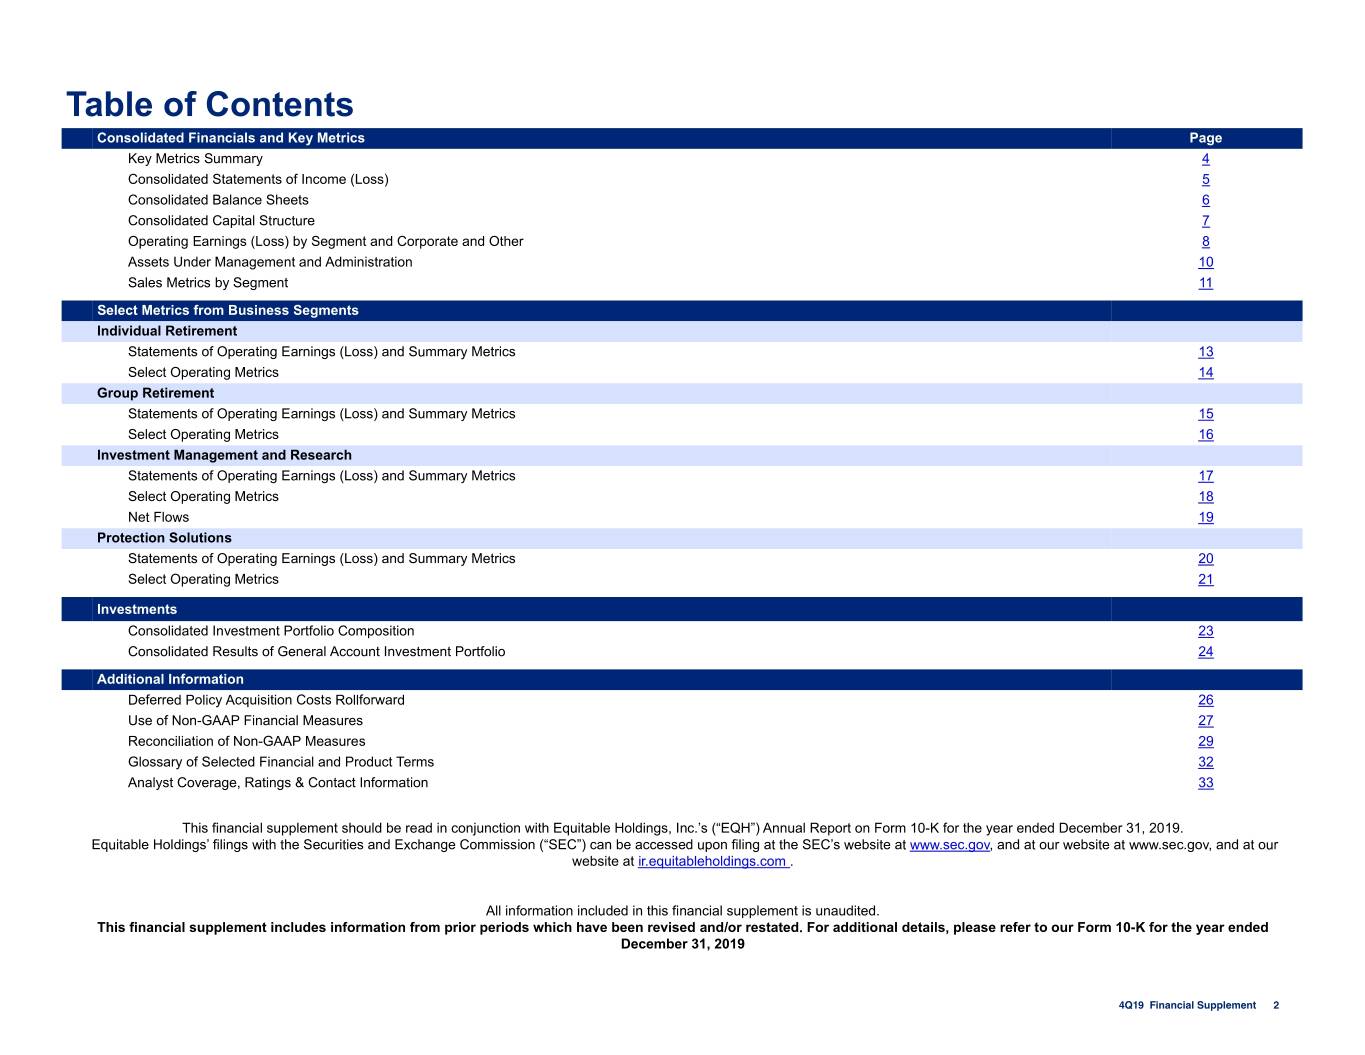
Table of Contents Consolidated Financials and Key Metrics Page Key Metrics Summary 4 Consolidated Statements of Income (Loss) 5 Consolidated Balance Sheets 6 Consolidated Capital Structure 7 Operating Earnings (Loss) by Segment and Corporate and Other 8 Assets Under Management and Administration 10 Sales Metrics by Segment 11 Select Metrics from Business Segments Individual Retirement Statements of Operating Earnings (Loss) and Summary Metrics 13 Select Operating Metrics 14 Group Retirement Statements of Operating Earnings (Loss) and Summary Metrics 15 Select Operating Metrics 16 Investment Management and Research Statements of Operating Earnings (Loss) and Summary Metrics 17 Select Operating Metrics 18 Net Flows 19 Protection Solutions Statements of Operating Earnings (Loss) and Summary Metrics 20 Select Operating Metrics 21 Investments Consolidated Investment Portfolio Composition 23 Consolidated Results of General Account Investment Portfolio 24 Additional Information Deferred Policy Acquisition Costs Rollforward 26 Use of Non-GAAP Financial Measures 27 Reconciliation of Non-GAAP Measures 29 Glossary of Selected Financial and Product Terms 32 Analyst Coverage, Ratings & Contact Information 33 This financial supplement should be read in conjunction with Equitable Holdings, Inc.’s (“EQH”) Annual Report on Form 10-K for the year ended December 31, 2019. Equitable Holdings’ filings with the Securities and Exchange Commission (“SEC”) can be accessed upon filing at the SEC’s website at www.sec.gov, and at our website at www.sec.gov, and at our website at ir.equitableholdings.com . All information included in this financial supplement is unaudited. This financial supplement includes information from prior periods which have been revised and/or restated. For additional details, please refer to our Form 10-K for the year ended December 31, 2019 4Q19 Financial Supplement 2
Consolidated Financials and Key Metrics 4Q19 Financial Supplement 3
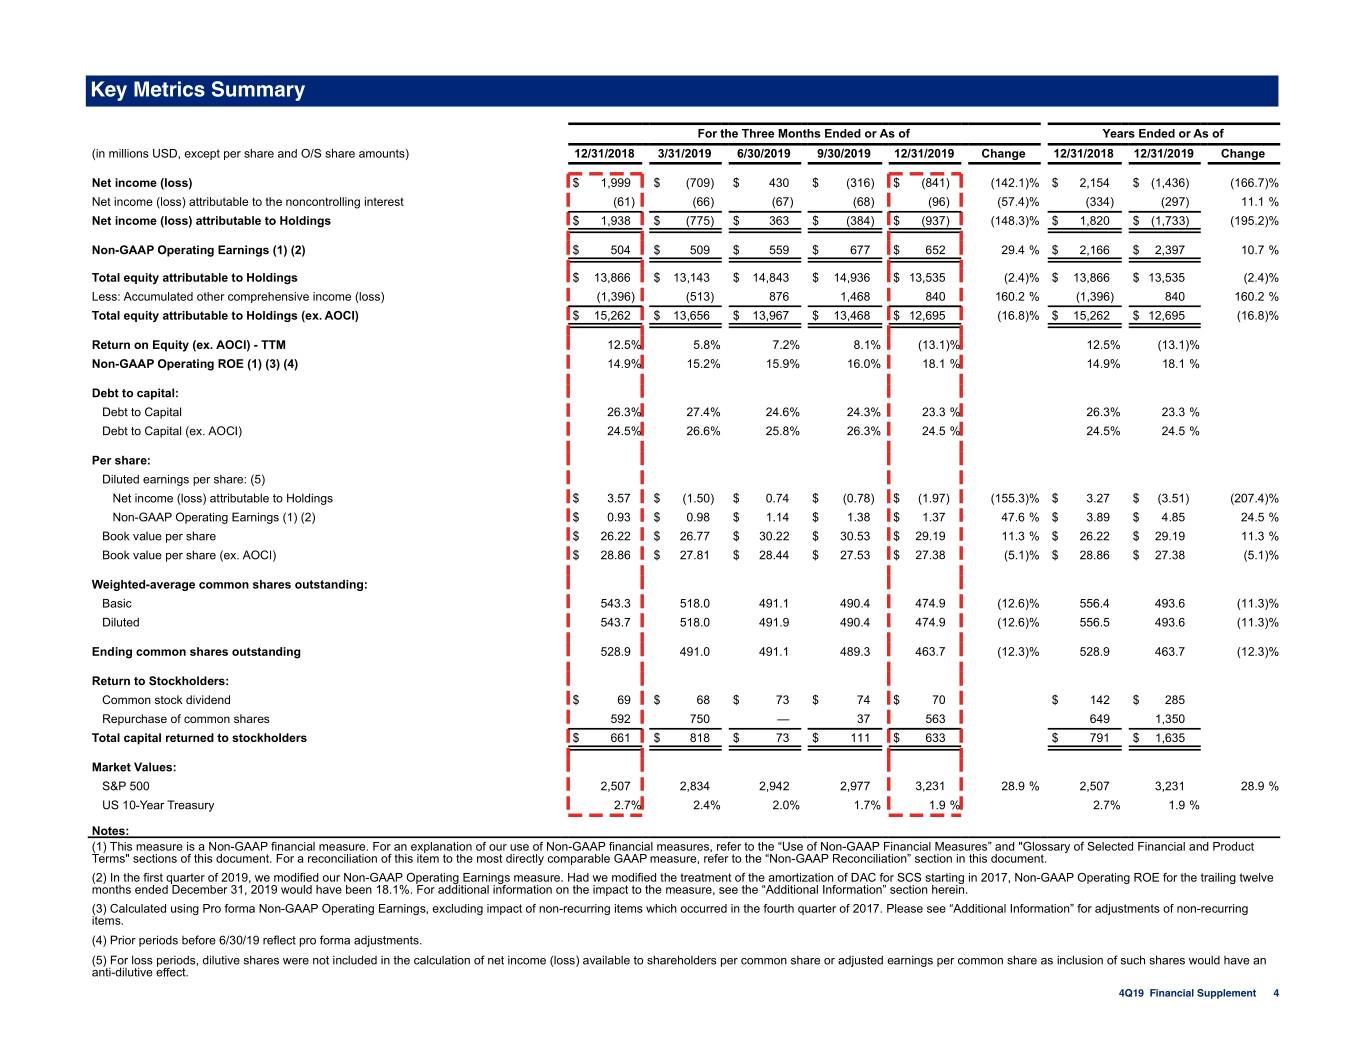
Key Metrics Summary For the Three Months Ended or As of Years Ended or As of (in millions USD, except per share and O/S share amounts) 12/31/2018 3/31/2019 6/30/2019 9/30/2019 12/31/2019 Change 12/31/2018 12/31/2019 Change Net income (loss) $ 1,999 $ (709) $ 430 $ (316) $ (841) (142.1)% $ 2,154 $ (1,436) (166.7)% Net income (loss) attributable to the noncontrolling interest (61) (66) (67) (68) (96) (57.4)% (334) (297) 11.1 % Net income (loss) attributable to Holdings $ 1,938 $ (775) $ 363 $ (384) $ (937) (148.3)% $ 1,820 $ (1,733) (195.2)% Non-GAAP Operating Earnings (1) (2) $ 504 $ 509 $ 559 $ 677 $ 652 29.4 % $ 2,166 $ 2,397 10.7 % Total equity attributable to Holdings $ 13,866 $ 13,143 $ 14,843 $ 14,936 $ 13,535 (2.4)% $ 13,866 $ 13,535 (2.4)% Less: Accumulated other comprehensive income (loss) (1,396) (513) 876 1,468 840 160.2 % (1,396) 840 160.2 % Total equity attributable to Holdings (ex. AOCI) $ 15,262 $ 13,656 $ 13,967 $ 13,468 $ 12,695 (16.8)% $ 15,262 $ 12,695 (16.8)% Return on Equity (ex. AOCI) - TTM 12.5% 5.8% 7.2% 8.1% (13.1)% 12.5% (13.1)% Non-GAAP Operating ROE (1) (3) (4) 14.9% 15.2% 15.9% 16.0% 18.1 % 14.9% 18.1 % — % Debt to capital: Debt to Capital 26.3% 27.4% 24.6% 24.3% 23.3 % 26.3% 23.3 % Debt to Capital (ex. AOCI) 24.5% 26.6% 25.8% 26.3% 24.5 % 24.5% 24.5 % Per share: Diluted earnings per share: (5) Net income (loss) attributable to Holdings $ 3.57 $ (1.50) $ 0.74 $ (0.78) $ (1.97) (155.3)% $ 3.27 $ (3.51) (207.4)% Non-GAAP Operating Earnings (1) (2) $ 0.93 $ 0.98 $ 1.14 $ 1.38 $ 1.37 47.6 % $ 3.89 $ 4.85 24.5 % Book value per share $ 26.22 $ 26.77 $ 30.22 $ 30.53 $ 29.19 11.3 % $ 26.22 $ 29.19 11.3 % Book value per share (ex. AOCI) $ 28.86 $ 27.81 $ 28.44 $ 27.53 $ 27.38 (5.1)% $ 28.86 $ 27.38 (5.1)% Weighted-average common shares outstanding: Basic 543.3 518.0 491.1 490.4 474.9 (12.6)% 556.4 493.6 (11.3)% Diluted 543.7 518.0 491.9 490.4 474.9 (12.6)% 556.5 493.6 (11.3)% Ending common shares outstanding 528.9 491.0 491.1 489.3 463.7 (12.3)% 528.9 463.7 (12.3)% Return to Stockholders: Common stock dividend $ 69 $ 68 $ 73 $ 74 $ 70 $ 142 $ 285 Repurchase of common shares 592 750 — 37 563 649 1,350 Total capital returned to stockholders $ 661 $ 818 $ 73 $ 111 $ 633 $ 791 $ 1,635 Market Values: S&P 500 2,507 2,834 2,942 2,977 3,231 28.9 % 2,507 3,231 28.9 % US 10-Year Treasury 2.7% 2.4% 2.0% 1.7% 1.9 % 2.7% 1.9 % Notes: (1) This measure is a Non-GAAP financial measure. For an explanation of our use of Non-GAAP financial measures, refer to the “Use of Non-GAAP Financial Measures” and "Glossary of Selected Financial and Product Terms" sections of this document. For a reconciliation of this item to the most directly comparable GAAP measure, refer to the “Non-GAAP Reconciliation” section in this document. (2) In the first quarter of 2019, we modified our Non-GAAP Operating Earnings measure. Had we modified the treatment of the amortization of DAC for SCS starting in 2017, Non-GAAP Operating ROE for the trailing twelve months ended December 31, 2019 would have been 18.1%. For additional information on the impact to the measure, see the “Additional Information” section herein. (3) Calculated using Pro forma Non-GAAP Operating Earnings, excluding impact of non-recurring items which occurred in the fourth quarter of 2017. Please see “Additional Information” for adjustments of non-recurring items. (4) Prior periods before 6/30/19 reflect pro forma adjustments. (5) For loss periods, dilutive shares were not included in the calculation of net income (loss) available to shareholders per common share or adjusted earnings per common share as inclusion of such shares would have an anti-dilutive effect. 4Q19 Financial Supplement 4
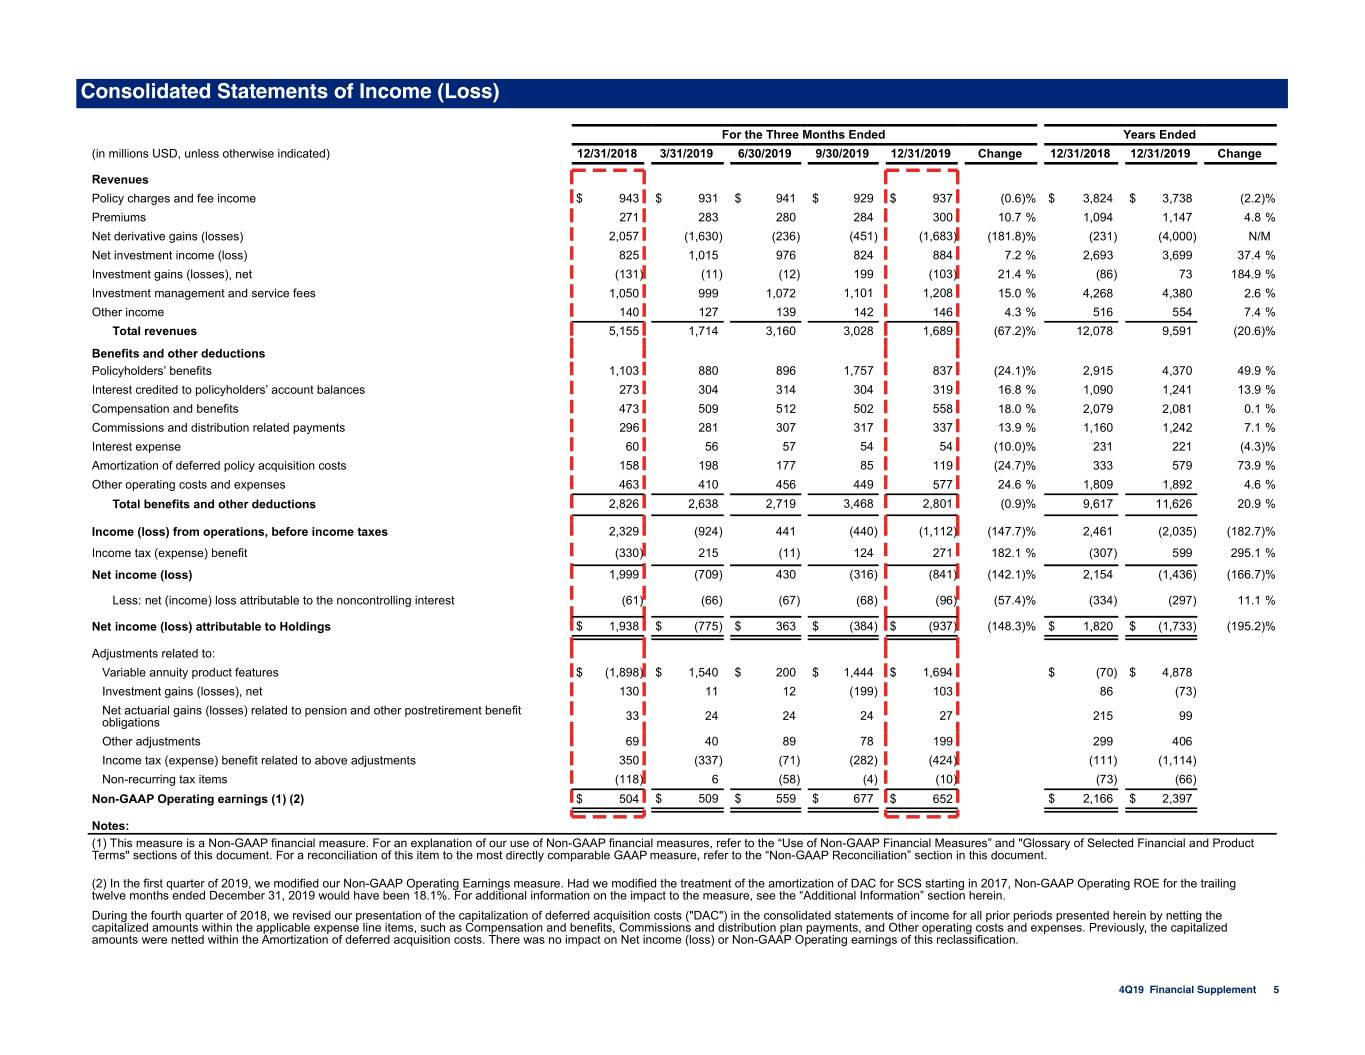
Consolidated Statements of Income (Loss) For the Three Months Ended Years Ended (in millions USD, unless otherwise indicated) 12/31/2018 3/31/2019 6/30/2019 9/30/2019 12/31/2019 Change 12/31/2018 12/31/2019 Change Revenues Policy charges and fee income $ 943 $ 931 $ 941 $ 929 $ 937 (0.6)% $ 3,824 $ 3,738 (2.2)% Premiums 271 283 280 284 300 10.7 % 1,094 1,147 4.8 % Net derivative gains (losses) 2,057 (1,630) (236) (451) (1,683) (181.8)% (231) (4,000) N/M Net investment income (loss) 825 1,015 976 824 884 7.2 % 2,693 3,699 37.4 % Investment gains (losses), net (131) (11) (12) 199 (103) 21.4 % (86) 73 184.9 % Investment management and service fees 1,050 999 1,072 1,101 1,208 15.0 % 4,268 4,380 2.6 % Other income 140 127 139 142 146 4.3 % 516 554 7.4 % Total revenues 5,155 1,714 3,160 3,028 1,689 (67.2)% 12,078 9,591 (20.6)% Benefits and other deductions Policyholders’ benefits 1,103 880 896 1,757 837 (24.1)% 2,915 4,370 49.9 % Interest credited to policyholders’ account balances 273 304 314 304 319 16.8 % 1,090 1,241 13.9 % Compensation and benefits 473 509 512 502 558 18.0 % 2,079 2,081 0.1 % Commissions and distribution related payments 296 281 307 317 337 13.9 % 1,160 1,242 7.1 % Interest expense 60 56 57 54 54 (10.0)% 231 221 (4.3)% Amortization of deferred policy acquisition costs 158 198 177 85 119 (24.7)% 333 579 73.9 % Other operating costs and expenses 463 410 456 449 577 24.6 % 1,809 1,892 4.6 % Total benefits and other deductions 2,826 2,638 2,719 3,468 2,801 (0.9)% 9,617 11,626 20.9 % Income (loss) from operations, before income taxes 2,329 (924) 441 (440) (1,112) (147.7)% 2,461 (2,035) (182.7)% Income tax (expense) benefit (330) 215 (11) 124 271 182.1 % (307) 599 295.1 % Net income (loss) 1,999 (709) 430 (316) (841) (142.1)% 2,154 (1,436) (166.7)% Less: net (income) loss attributable to the noncontrolling interest (61) (66) (67) (68) (96) (57.4)% (334) (297) 11.1 % Net income (loss) attributable to Holdings $ 1,938 $ (775) $ 363 $ (384) $ (937) (148.3)% $ 1,820 $ (1,733) (195.2)% Adjustments related to: Variable annuity product features $ (1,898) $ 1,540 $ 200 $ 1,444 $ 1,694 $ (70) $ 4,878 Investment gains (losses), net 130 11 12 (199) 103 86 (73) Net actuarial gains (losses) related to pension and other postretirement benefit 33 24 24 24 27 215 99 obligations Other adjustments 69 40 89 78 199 299 406 Income tax (expense) benefit related to above adjustments 350 (337) (71) (282) (424) (111) (1,114) Non-recurring tax items (118) 6 (58) (4) (10) (73) (66) Non-GAAP Operating earnings (1) (2) $ 504 $ 509 $ 559 $ 677 $ 652 $ 2,166 $ 2,397 Notes: (1) This measure is a Non-GAAP financial measure. For an explanation of our use of Non-GAAP financial measures, refer to the “Use of Non-GAAP Financial Measures” and "Glossary of Selected Financial and Product Terms" sections of this document. For a reconciliation of this item to the most directly comparable GAAP measure, refer to the “Non-GAAP Reconciliation” section in this document. (2) In the first quarter of 2019, we modified our Non-GAAP Operating Earnings measure. Had we modified the treatment of the amortization of DAC for SCS starting in 2017, Non-GAAP Operating ROE for the trailing twelve months ended December 31, 2019 would have been 18.1%. For additional information on the impact to the measure, see the “Additional Information” section herein. During the fourth quarter of 2018, we revised our presentation of the capitalization of deferred acquisition costs ("DAC") in the consolidated statements of income for all prior periods presented herein by netting the capitalized amounts within the applicable expense line items, such as Compensation and benefits, Commissions and distribution plan payments, and Other operating costs and expenses. Previously, the capitalized amounts were netted within the Amortization of deferred acquisition costs. There was no impact on Net income (loss) or Non-GAAP Operating earnings of this reclassification. 4Q19 Financial Supplement 5
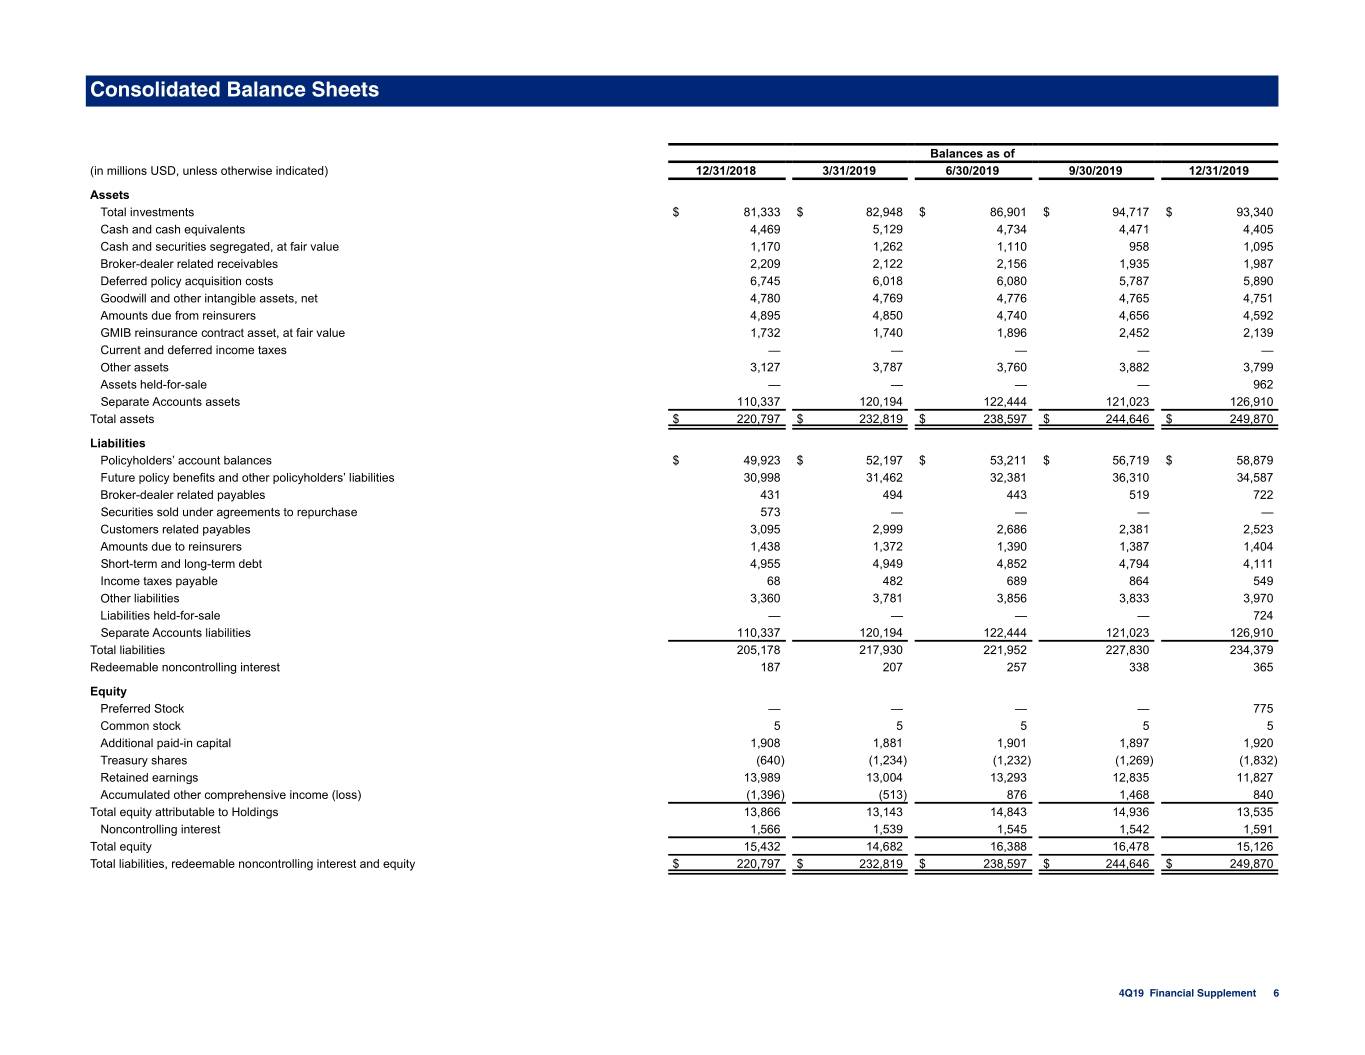
Consolidated Balance Sheets Balances as of (in millions USD, unless otherwise indicated) 12/31/2018 3/31/2019 6/30/2019 9/30/2019 12/31/2019 Assets Total investments $ 81,333 $ 82,948 $ 86,901 $ 94,717 $ 93,340 Cash and cash equivalents 4,469 5,129 4,734 4,471 4,405 Cash and securities segregated, at fair value 1,170 1,262 1,110 958 1,095 Broker-dealer related receivables 2,209 2,122 2,156 1,935 1,987 Deferred policy acquisition costs 6,745 6,018 6,080 5,787 5,890 Goodwill and other intangible assets, net 4,780 4,769 4,776 4,765 4,751 Amounts due from reinsurers 4,895 4,850 4,740 4,656 4,592 GMIB reinsurance contract asset, at fair value 1,732 1,740 1,896 2,452 2,139 Current and deferred income taxes — — — — — Other assets 3,127 3,787 3,760 3,882 3,799 Assets held-for-sale — — — — 962 Separate Accounts assets 110,337 120,194 122,444 121,023 126,910 Total assets $ 220,797 $ 232,819 $ 238,597 $ 244,646 $ 249,870 Liabilities Policyholders’ account balances $ 49,923 $ 52,197 $ 53,211 $ 56,719 $ 58,879 Future policy benefits and other policyholders’ liabilities 30,998 31,462 32,381 36,310 34,587 Broker-dealer related payables 431 494 443 519 722 Securities sold under agreements to repurchase 573 — — — — Customers related payables 3,095 2,999 2,686 2,381 2,523 Amounts due to reinsurers 1,438 1,372 1,390 1,387 1,404 Short-term and long-term debt 4,955 4,949 4,852 4,794 4,111 Income taxes payable 68 482 689 864 549 Other liabilities 3,360 3,781 3,856 3,833 3,970 Liabilities held-for-sale — — — — 724 Separate Accounts liabilities 110,337 120,194 122,444 121,023 126,910 Total liabilities 205,178 217,930 221,952 227,830 234,379 Redeemable noncontrolling interest 187 207 257 338 365 Equity Preferred Stock — — — — 775 Common stock 5 5 5 5 5 Additional paid-in capital 1,908 1,881 1,901 1,897 1,920 Treasury shares (640) (1,234) (1,232) (1,269) (1,832) Retained earnings 13,989 13,004 13,293 12,835 11,827 Accumulated other comprehensive income (loss) (1,396) (513) 876 1,468 840 Total equity attributable to Holdings 13,866 13,143 14,843 14,936 13,535 Noncontrolling interest 1,566 1,539 1,545 1,542 1,591 Total equity 15,432 14,682 16,388 16,478 15,126 Total liabilities, redeemable noncontrolling interest and equity $ 220,797 $ 232,819 $ 238,597 $ 244,646 $ 249,870 4Q19 Financial Supplement 6
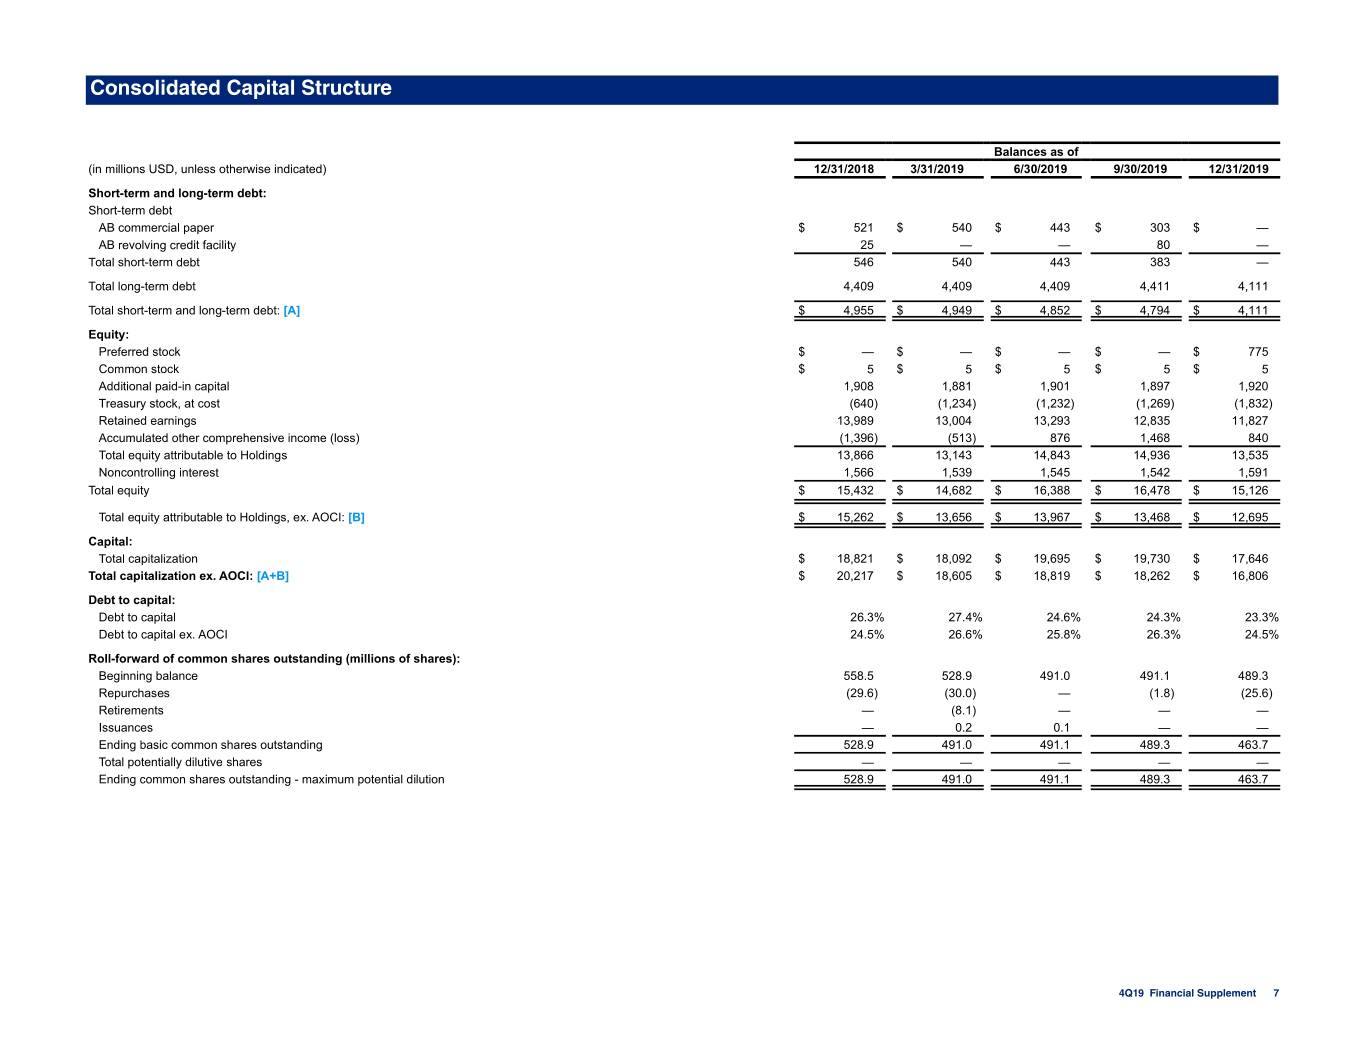
Consolidated Capital Structure Balances as of (in millions USD, unless otherwise indicated) 12/31/2018 3/31/2019 6/30/2019 9/30/2019 12/31/2019 Short-term and long-term debt: Short-term debt AB commercial paper $ 521 $ 540 $ 443 $ 303 $ — AB revolving credit facility 25 — — 80 — Total short-term debt 546 540 443 383 — Total long-term debt 4,409 4,409 4,409 4,411 4,111 Total short-term and long-term debt: [A] $ 4,955 $ 4,949 $ 4,852 $ 4,794 $ 4,111 Equity: Preferred stock $ — $ — $ — $ — $ 775 Common stock $ 5 $ 5 $ 5 $ 5 $ 5 Additional paid-in capital 1,908 1,881 1,901 1,897 1,920 Treasury stock, at cost (640) (1,234) (1,232) (1,269) (1,832) Retained earnings 13,989 13,004 13,293 12,835 11,827 Accumulated other comprehensive income (loss) (1,396) (513) 876 1,468 840 Total equity attributable to Holdings 13,866 13,143 14,843 14,936 13,535 Noncontrolling interest 1,566 1,539 1,545 1,542 1,591 Total equity $ 15,432 $ 14,682 $ 16,388 $ 16,478 $ 15,126 Total equity attributable to Holdings, ex. AOCI: [B] $ 15,262 $ 13,656 $ 13,967 $ 13,468 $ 12,695 Capital: Total capitalization $ 18,821 $ 18,092 $ 19,695 $ 19,730 $ 17,646 Total capitalization ex. AOCI: [A+B] $ 20,217 $ 18,605 $ 18,819 $ 18,262 $ 16,806 Debt to capital: Debt to capital 26.3% 27.4% 24.6% 24.3% 23.3% Debt to capital ex. AOCI 24.5% 26.6% 25.8% 26.3% 24.5% Roll-forward of common shares outstanding (millions of shares): Beginning balance 558.5 528.9 491.0 491.1 489.3 Repurchases (29.6) (30.0) — (1.8) (25.6) Retirements — (8.1) — — — Issuances — 0.2 0.1 — — Ending basic common shares outstanding 528.9 491.0 491.1 489.3 463.7 Total potentially dilutive shares — — — — — Ending common shares outstanding - maximum potential dilution 528.9 491.0 491.1 489.3 463.7 4Q19 Financial Supplement 7
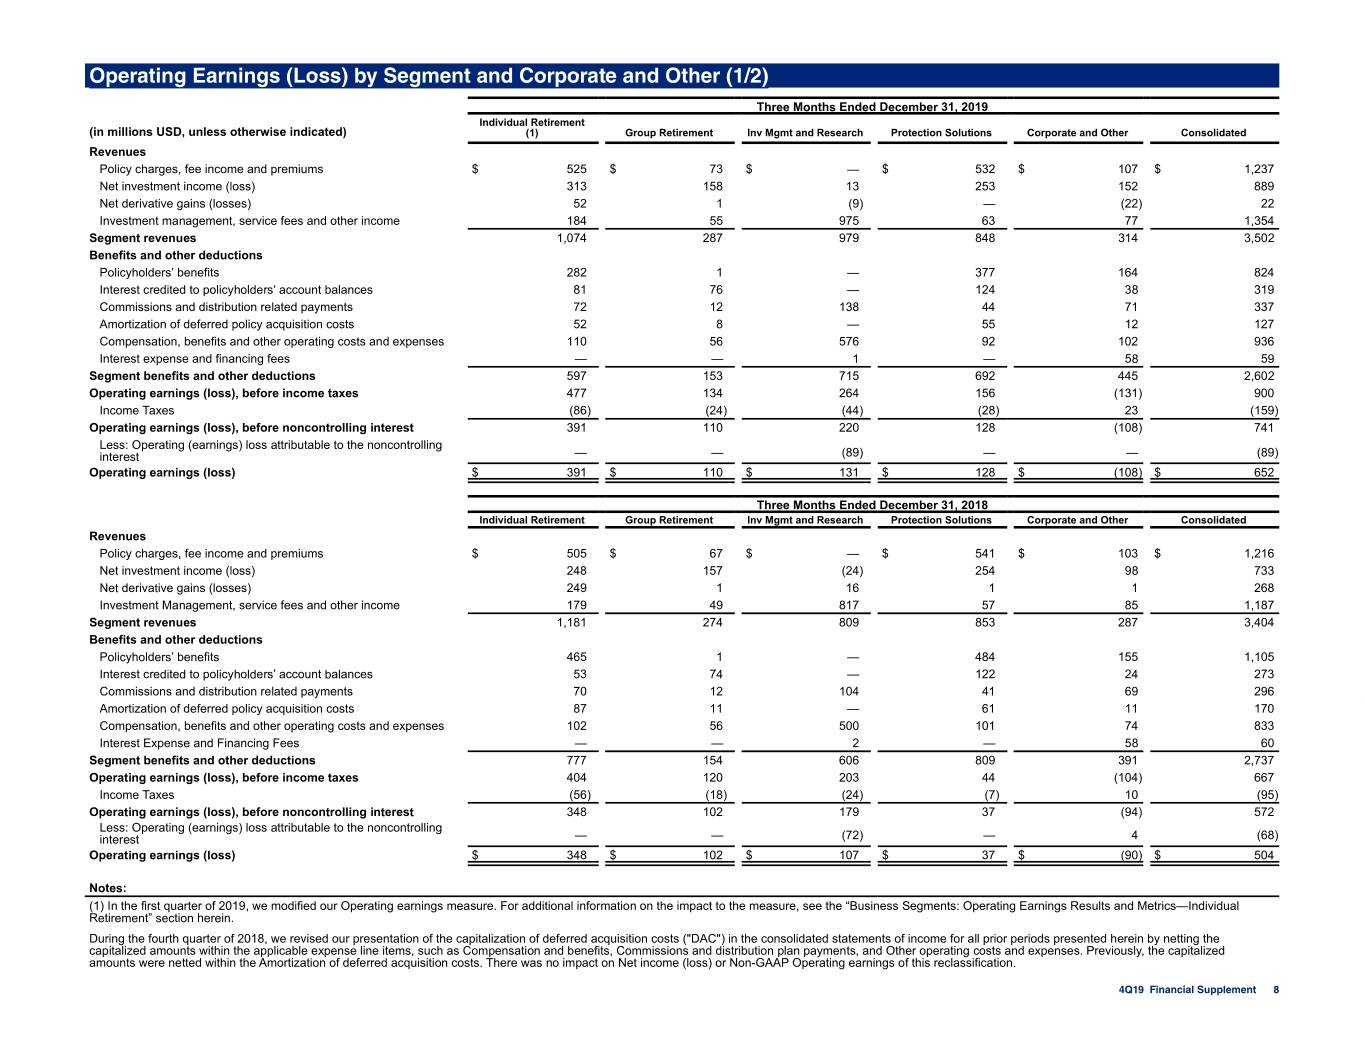
Operating Earnings (Loss) by Segment and Corporate and Other (1/2) Three Months Ended December 31, 2019 Individual Retirement (in millions USD, unless otherwise indicated) (1) Group Retirement Inv Mgmt and Research Protection Solutions Corporate and Other Consolidated Revenues Policy charges, fee income and premiums $ 525 $ 73 $ — $ 532 $ 107 $ 1,237 Net investment income (loss) 313 158 13 253 152 889 Net derivative gains (losses) 52 1 (9) — (22) 22 Investment management, service fees and other income 184 55 975 63 77 1,354 Segment revenues 1,074 287 979 848 314 3,502 Benefits and other deductions Policyholders’ benefits 282 1 — 377 164 824 Interest credited to policyholders’ account balances 81 76 — 124 38 319 Commissions and distribution related payments 72 12 138 44 71 337 Amortization of deferred policy acquisition costs 52 8 — 55 12 127 Compensation, benefits and other operating costs and expenses 110 56 576 92 102 936 Interest expense and financing fees — — 1 — 58 59 Segment benefits and other deductions 597 153 715 692 445 2,602 Operating earnings (loss), before income taxes 477 134 264 156 (131) 900 Income Taxes (86) (24) (44) (28) 23 (159) Operating earnings (loss), before noncontrolling interest 391 110 220 128 (108) 741 Less: Operating (earnings) loss attributable to the noncontrolling interest — — (89) — — (89) Operating earnings (loss) $ 391 $ 110 $ 131 $ 128 $ (108) $ 652 Three Months Ended December 31, 2018 Individual Retirement Group Retirement Inv Mgmt and Research Protection Solutions Corporate and Other Consolidated Revenues Policy charges, fee income and premiums $ 505 $ 67 $ — $ 541 $ 103 $ 1,216 Net investment income (loss) 248 157 (24) 254 98 733 Net derivative gains (losses) 249 1 16 1 1 268 Investment Management, service fees and other income 179 49 817 57 85 1,187 Segment revenues 1,181 274 809 853 287 3,404 Benefits and other deductions Policyholders’ benefits 465 1 — 484 155 1,105 Interest credited to policyholders’ account balances 53 74 — 122 24 273 Commissions and distribution related payments 70 12 104 41 69 296 Amortization of deferred policy acquisition costs 87 11 — 61 11 170 Compensation, benefits and other operating costs and expenses 102 56 500 101 74 833 Interest Expense and Financing Fees — — 2 — 58 60 Segment benefits and other deductions 777 154 606 809 391 2,737 Operating earnings (loss), before income taxes 404 120 203 44 (104) 667 Income Taxes (56) (18) (24) (7) 10 (95) Operating earnings (loss), before noncontrolling interest 348 102 179 37 (94) 572 Less: Operating (earnings) loss attributable to the noncontrolling interest — — (72) — 4 (68) Operating earnings (loss) $ 348 $ 102 $ 107 $ 37 $ (90) $ 504 Notes: (1) In the first quarter of 2019, we modified our Operating earnings measure. For additional information on the impact to the measure, see the “Business Segments: Operating Earnings Results and Metrics—Individual Retirement” section herein. During the fourth quarter of 2018, we revised our presentation of the capitalization of deferred acquisition costs ("DAC") in the consolidated statements of income for all prior periods presented herein by netting the capitalized amounts within the applicable expense line items, such as Compensation and benefits, Commissions and distribution plan payments, and Other operating costs and expenses. Previously, the capitalized amounts were netted within the Amortization of deferred acquisition costs. There was no impact on Net income (loss) or Non-GAAP Operating earnings of this reclassification. 4Q19 Financial Supplement 8
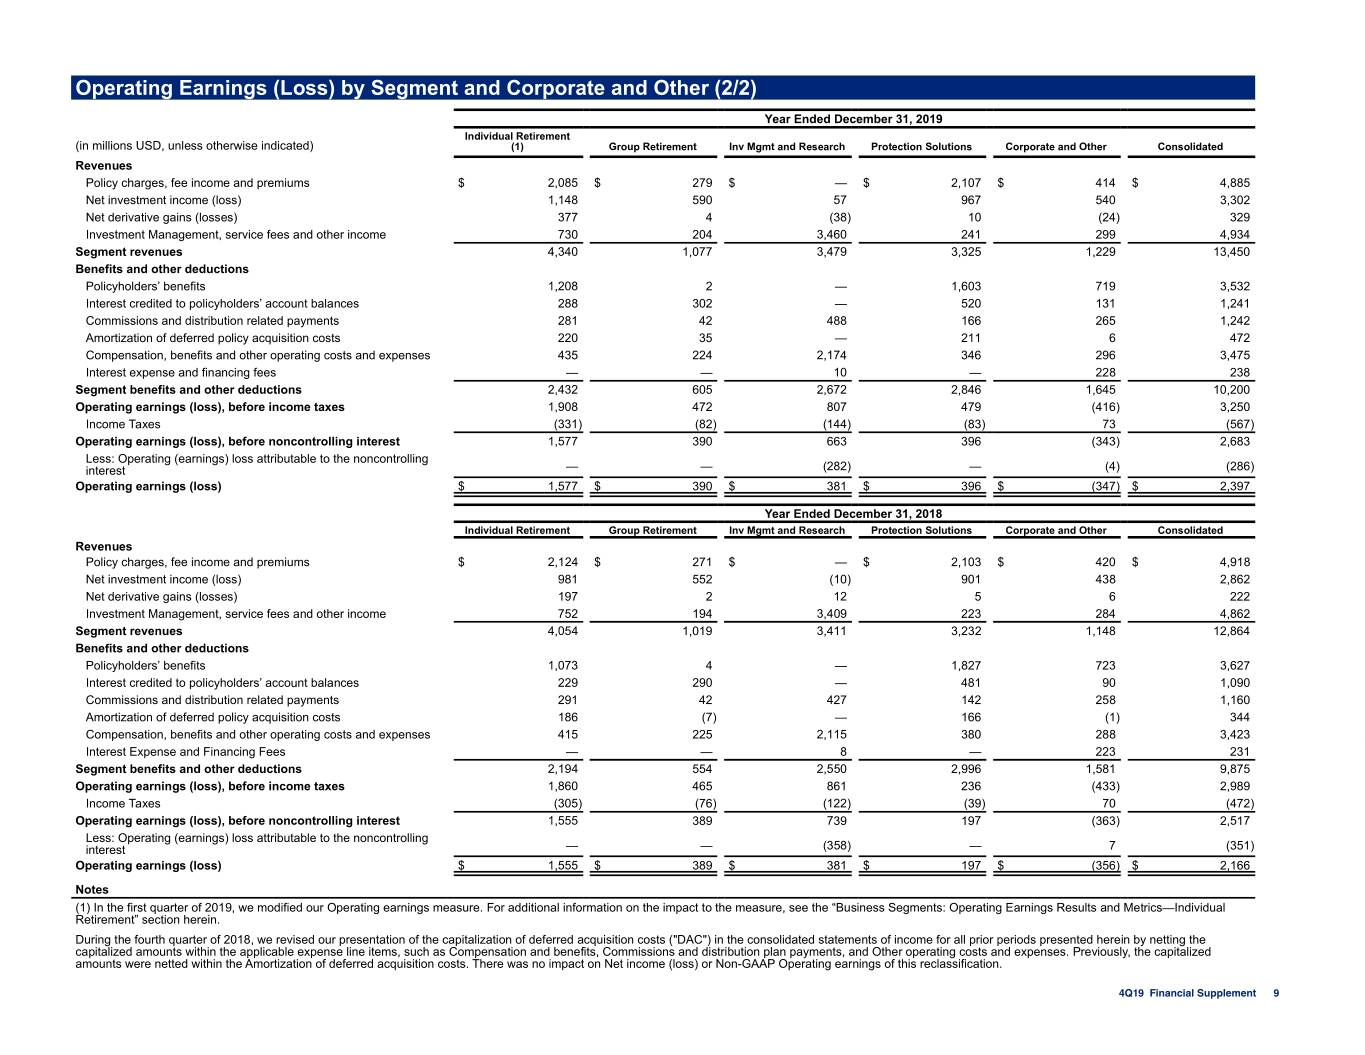
Operating Earnings (Loss) by Segment and Corporate and Other (2/2) Year Ended December 31, 2019 Individual Retirement (in millions USD, unless otherwise indicated) (1) Group Retirement Inv Mgmt and Research Protection Solutions Corporate and Other Consolidated Revenues Policy charges, fee income and premiums $ 2,085 $ 279 $ — $ 2,107 $ 414 $ 4,885 Net investment income (loss) 1,148 590 57 967 540 3,302 Net derivative gains (losses) 377 4 (38) 10 (24) 329 Investment Management, service fees and other income 730 204 3,460 241 299 4,934 Segment revenues 4,340 1,077 3,479 3,325 1,229 13,450 Benefits and other deductions Policyholders’ benefits 1,208 2 — 1,603 719 3,532 Interest credited to policyholders’ account balances 288 302 — 520 131 1,241 Commissions and distribution related payments 281 42 488 166 265 1,242 Amortization of deferred policy acquisition costs 220 35 — 211 6 472 Compensation, benefits and other operating costs and expenses 435 224 2,174 346 296 3,475 Interest expense and financing fees — — 10 — 228 238 Segment benefits and other deductions 2,432 605 2,672 2,846 1,645 10,200 Operating earnings (loss), before income taxes 1,908 472 807 479 (416) 3,250 Income Taxes (331) (82) (144) (83) 73 (567) Operating earnings (loss), before noncontrolling interest 1,577 390 663 396 (343) 2,683 Less: Operating (earnings) loss attributable to the noncontrolling interest — — (282) — (4) (286) Operating earnings (loss) $ 1,577 $ 390 $ 381 $ 396 $ (347) $ 2,397 Year Ended December 31, 2018 Individual Retirement Group Retirement Inv Mgmt and Research Protection Solutions Corporate and Other Consolidated Revenues Policy charges, fee income and premiums $ 2,124 $ 271 $ — $ 2,103 $ 420 $ 4,918 Net investment income (loss) 981 552 (10) 901 438 2,862 Net derivative gains (losses) 197 2 12 5 6 222 Investment Management, service fees and other income 752 194 3,409 223 284 4,862 Segment revenues 4,054 1,019 3,411 3,232 1,148 12,864 Benefits and other deductions Policyholders’ benefits 1,073 4 — 1,827 723 3,627 Interest credited to policyholders’ account balances 229 290 — 481 90 1,090 Commissions and distribution related payments 291 42 427 142 258 1,160 Amortization of deferred policy acquisition costs 186 (7) — 166 (1) 344 Compensation, benefits and other operating costs and expenses 415 225 2,115 380 288 3,423 Interest Expense and Financing Fees — — 8 — 223 231 Segment benefits and other deductions 2,194 554 2,550 2,996 1,581 9,875 Operating earnings (loss), before income taxes 1,860 465 861 236 (433) 2,989 Income Taxes (305) (76) (122) (39) 70 (472) Operating earnings (loss), before noncontrolling interest 1,555 389 739 197 (363) 2,517 Less: Operating (earnings) loss attributable to the noncontrolling interest — — (358) — 7 (351) Operating earnings (loss) $ 1,555 $ 389 $ 381 $ 197 $ (356) $ 2,166 Notes (1) In the first quarter of 2019, we modified our Operating earnings measure. For additional information on the impact to the measure, see the “Business Segments: Operating Earnings Results and Metrics—Individual Retirement” section herein. During the fourth quarter of 2018, we revised our presentation of the capitalization of deferred acquisition costs ("DAC") in the consolidated statements of income for all prior periods presented herein by netting the capitalized amounts within the applicable expense line items, such as Compensation and benefits, Commissions and distribution plan payments, and Other operating costs and expenses. Previously, the capitalized amounts were netted within the Amortization of deferred acquisition costs. There was no impact on Net income (loss) or Non-GAAP Operating earnings of this reclassification. 4Q19 Financial Supplement 9
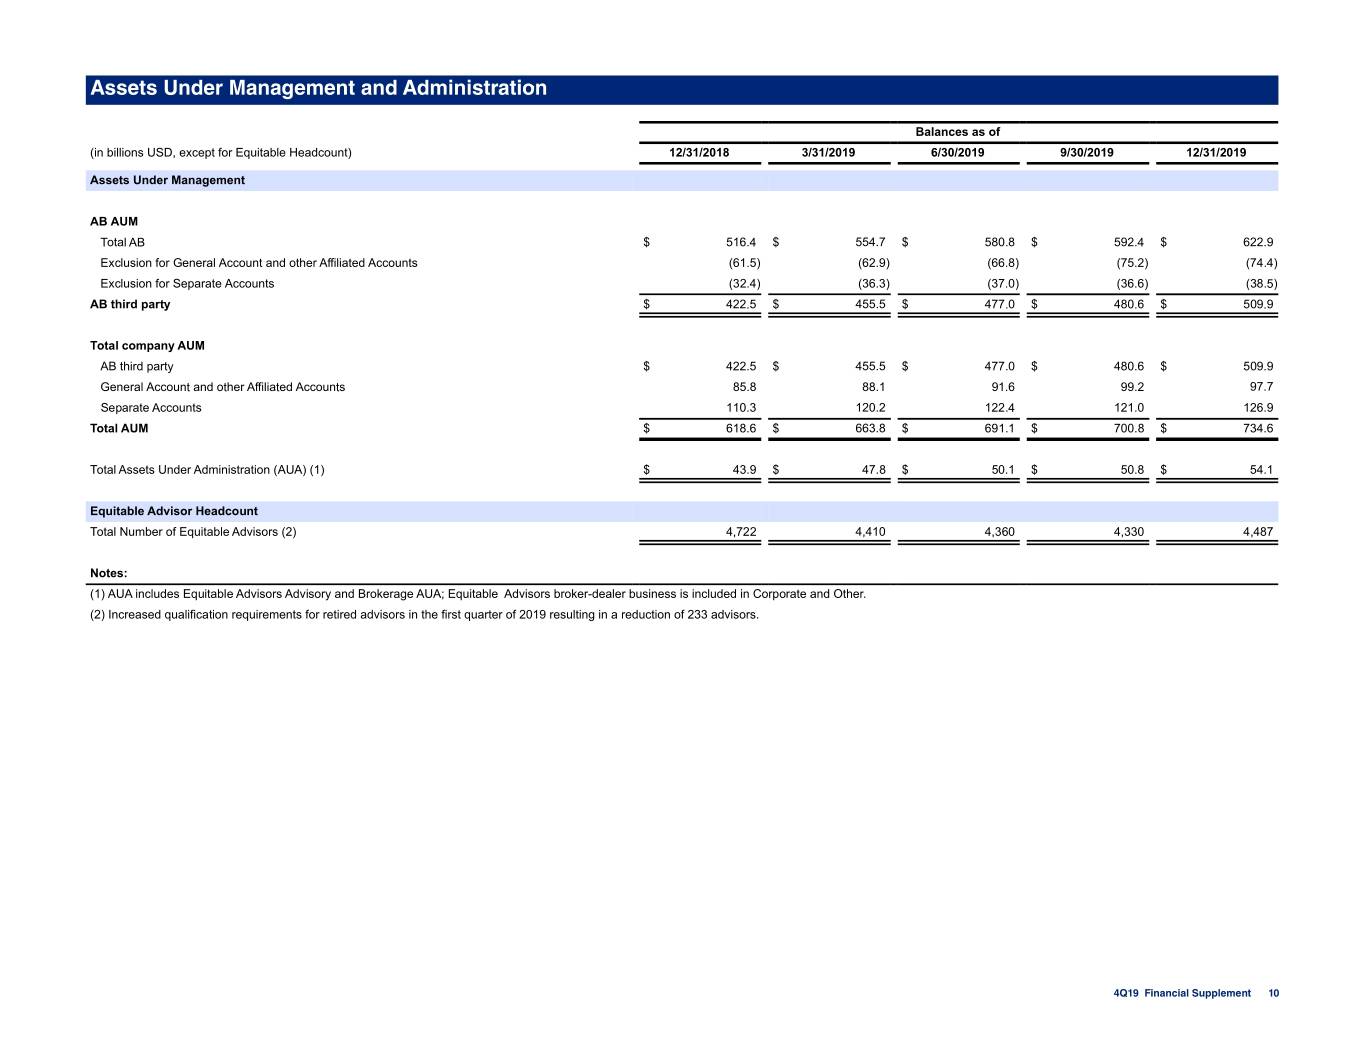
Assets Under Management and Administration Balances as of (in billions USD, except for Equitable Headcount) 12/31/2018 3/31/2019 6/30/2019 9/30/2019 12/31/2019 Assets Under Management AB AUM Total AB $ 516.4 $ 554.7 $ 580.8 $ 592.4 $ 622.9 Exclusion for General Account and other Affiliated Accounts (61.5) (62.9) (66.8) (75.2) (74.4) Exclusion for Separate Accounts (32.4) (36.3) (37.0) (36.6) (38.5) AB third party $ 422.5 $ 455.5 $ 477.0 $ 480.6 $ 509.9 Total company AUM AB third party $ 422.5 $ 455.5 $ 477.0 $ 480.6 $ 509.9 General Account and other Affiliated Accounts 85.8 88.1 91.6 99.2 97.7 Separate Accounts 110.3 120.2 122.4 121.0 126.9 Total AUM $ 618.6 $ 663.8 $ 691.1 $ 700.8 $ 734.6 Total Assets Under Administration (AUA) (1) $ 43.9 $ 47.8 $ 50.1 $ 50.8 $ 54.1 Equitable Advisor Headcount Total Number of Equitable Advisors (2) 4,722 4,410 4,360 4,330 4,487 Notes: (1) AUA includes Equitable Advisors Advisory and Brokerage AUA; Equitable Advisors broker-dealer business is included in Corporate and Other. (2) Increased qualification requirements for retired advisors in the first quarter of 2019 resulting in a reduction of 233 advisors. 4Q19 Financial Supplement 10
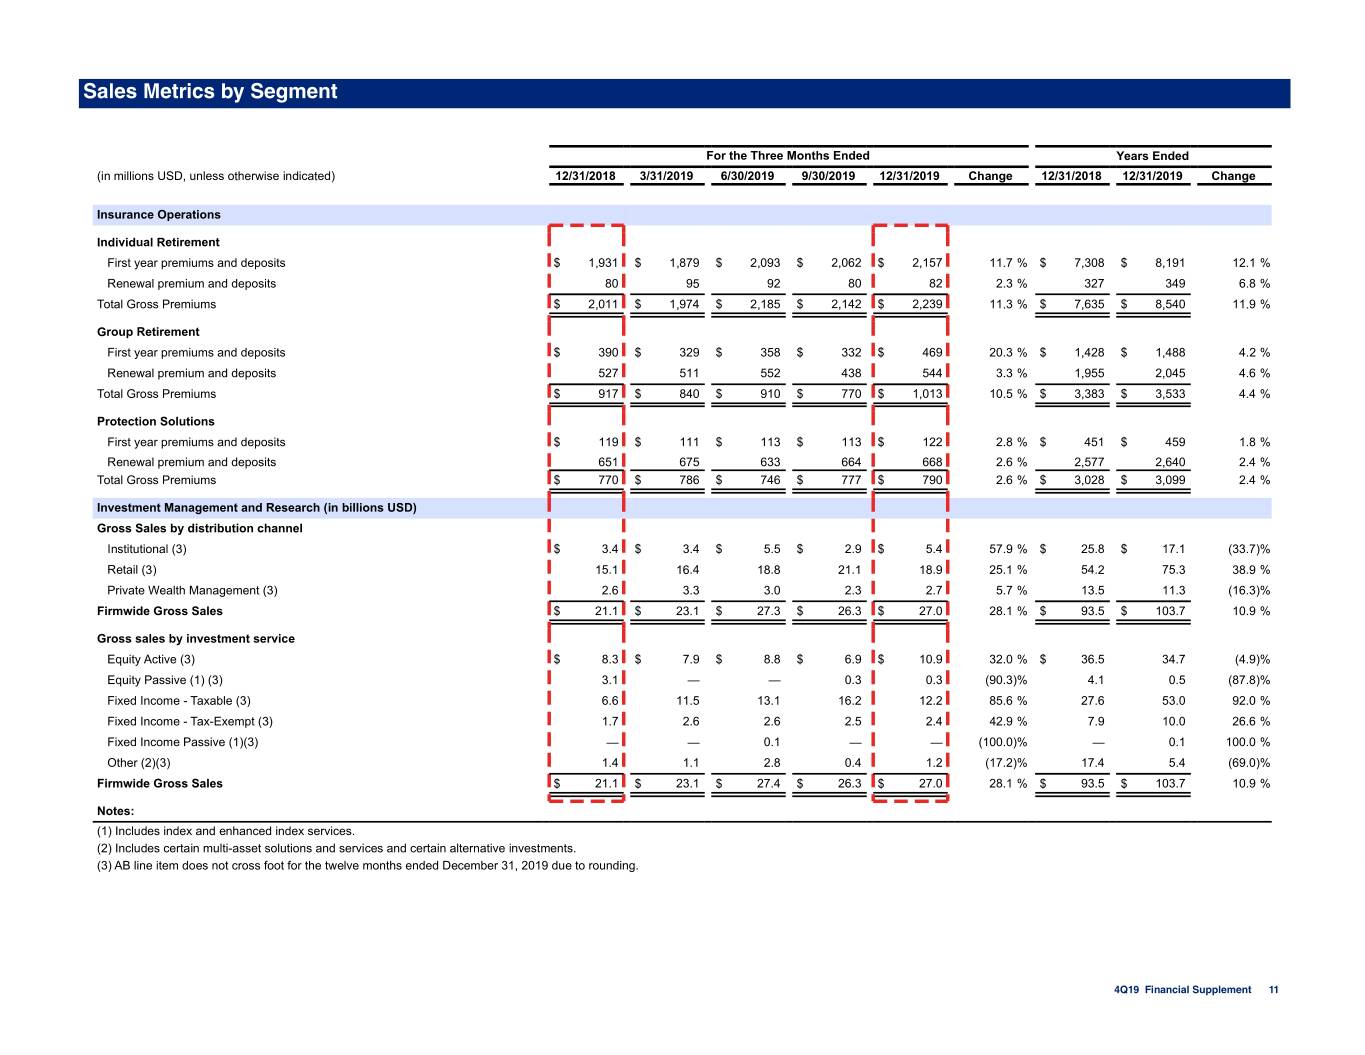
Sales Metrics by Segment For the Three Months Ended Years Ended (in millions USD, unless otherwise indicated) 12/31/2018 3/31/2019 6/30/2019 9/30/2019 12/31/2019 Change 12/31/2018 12/31/2019 Change Insurance Operations Individual Retirement First year premiums and deposits $ 1,931 $ 1,879 $ 2,093 $ 2,062 $ 2,157 11.7 % $ 7,308 $ 8,191 12.1 % Renewal premium and deposits 80 95 92 80 82 2.3 % 327 349 6.8 % Total Gross Premiums $ 2,011 $ 1,974 $ 2,185 $ 2,142 $ 2,239 11.3 % $ 7,635 $ 8,540 11.9 % Group Retirement First year premiums and deposits $ 390 $ 329 $ 358 $ 332 $ 469 20.3 % $ 1,428 $ 1,488 4.2 % Renewal premium and deposits 527 511 552 438 544 3.3 % 1,955 2,045 4.6 % Total Gross Premiums $ 917 $ 840 $ 910 $ 770 $ 1,013 10.5 % $ 3,383 $ 3,533 4.4 % Protection Solutions First year premiums and deposits $ 119 $ 111 $ 113 $ 113 $ 122 2.8 % $ 451 $ 459 1.8 % Renewal premium and deposits 651 675 633 664 668 2.6 % 2,577 2,640 2.4 % Total Gross Premiums $ 770 $ 786 $ 746 $ 777 $ 790 2.6 % $ 3,028 $ 3,099 2.4 % Investment Management and Research (in billions USD) Gross Sales by distribution channel Institutional (3) $ 3.4 $ 3.4 $ 5.5 $ 2.9 $ 5.4 57.9 % $ 25.8 $ 17.1 (33.7)% Retail (3) 15.1 16.4 18.8 21.1 18.9 25.1 % 54.2 75.3 38.9 % Private Wealth Management (3) 2.6 3.3 3.0 2.3 2.7 5.7 % 13.5 11.3 (16.3)% Firmwide Gross Sales $ 21.1 $ 23.1 $ 27.3 $ 26.3 $ 27.0 28.1 % $ 93.5 $ 103.7 10.9 % Gross sales by investment service Equity Active (3) $ 8.3 $ 7.9 $ 8.8 $ 6.9 $ 10.9 32.0 % $ 36.5 34.7 (4.9)% Equity Passive (1) (3) 3.1 — — 0.3 0.3 (90.3)% 4.1 0.5 (87.8)% Fixed Income - Taxable (3) 6.6 11.5 13.1 16.2 12.2 85.6 % 27.6 53.0 92.0 % Fixed Income - Tax-Exempt (3) 1.7 2.6 2.6 2.5 2.4 42.9 % 7.9 10.0 26.6 % Fixed Income Passive (1)(3) — — 0.1 — — (100.0)% — 0.1 100.0 % Other (2)(3) 1.4 1.1 2.8 0.4 1.2 (17.2)% 17.4 5.4 (69.0)% Firmwide Gross Sales $ 21.1 $ 23.1 $ 27.4 $ 26.3 $ 27.0 28.1 % $ 93.5 $ 103.7 10.9 % Notes: (1) Includes index and enhanced index services. (2) Includes certain multi-asset solutions and services and certain alternative investments. (3) AB line item does not cross foot for the twelve months ended December 31, 2019 due to rounding. 4Q19 Financial Supplement 11
Business Segments: Operating Earnings Results and Metrics 4Q19 Financial Supplement 12
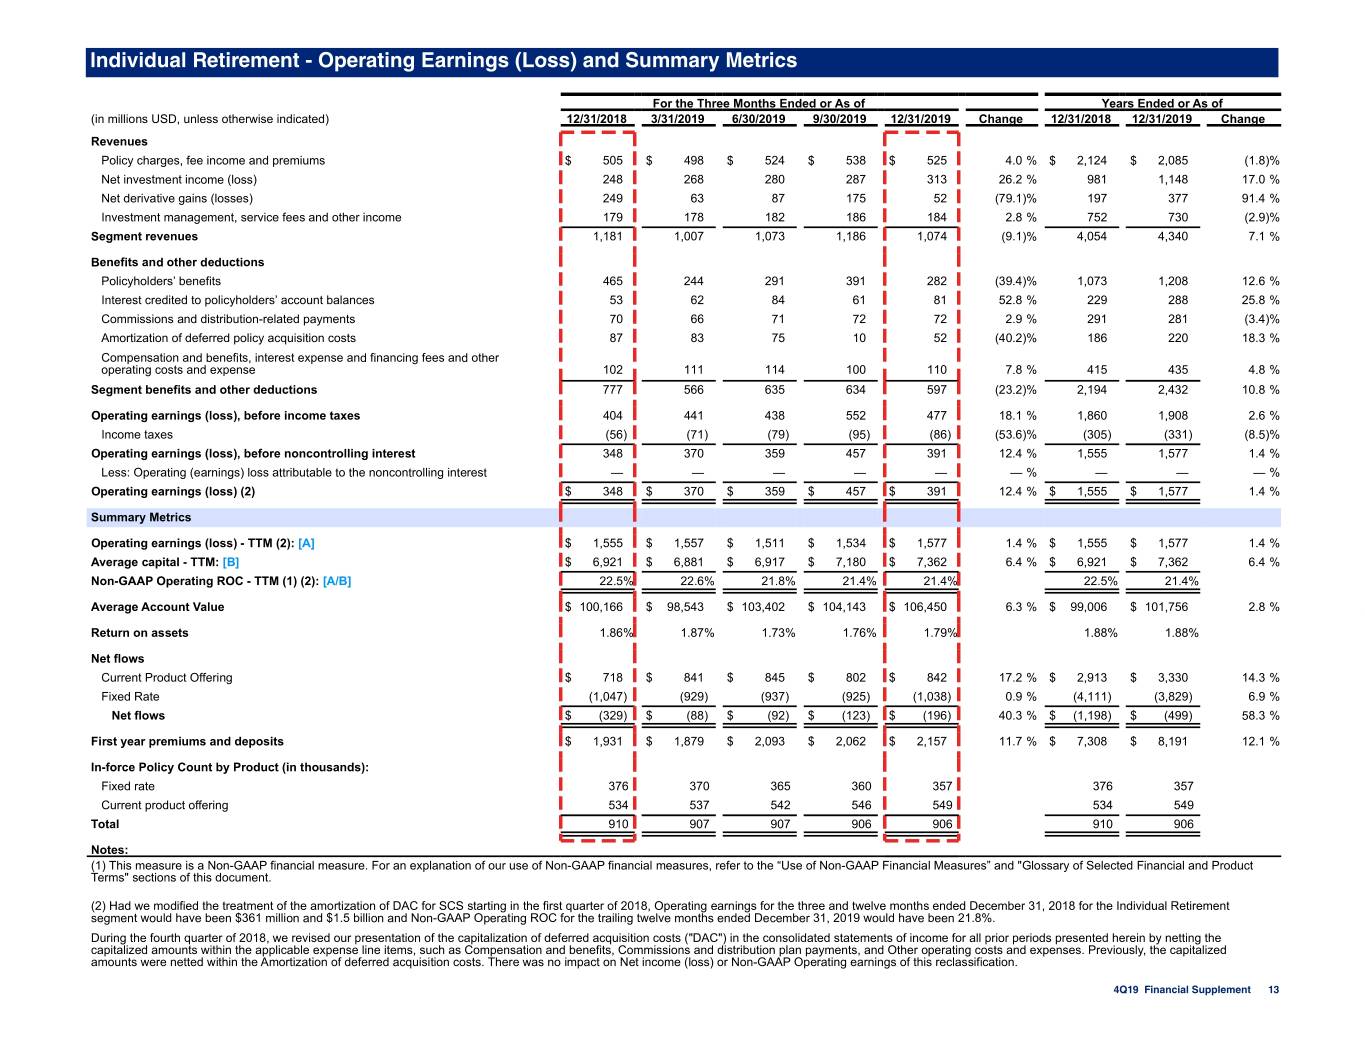
Individual Retirement - Operating Earnings (Loss) and Summary Metrics For the Three Months Ended or As of Years Ended or As of (in millions USD, unless otherwise indicated) 12/31/2018 3/31/2019 6/30/2019 9/30/2019 12/31/2019 Change 12/31/2018 12/31/2019 Change Revenues Policy charges, fee income and premiums $ 505 $ 498 $ 524 $ 538 $ 525 4.0 % $ 2,124 $ 2,085 (1.8)% Net investment income (loss) 248 268 280 287 313 26.2 % 981 1,148 17.0 % Net derivative gains (losses) 249 63 87 175 52 (79.1)% 197 377 91.4 % Investment management, service fees and other income 179 178 182 186 184 2.8 % 752 730 (2.9)% Segment revenues 1,181 1,007 1,073 1,186 1,074 (9.1)% 4,054 4,340 7.1 % Benefits and other deductions Policyholders’ benefits 465 244 291 391 282 (39.4)% 1,073 1,208 12.6 % Interest credited to policyholders’ account balances 53 62 84 61 81 52.8 % 229 288 25.8 % Commissions and distribution-related payments 70 66 71 72 72 2.9 % 291 281 (3.4)% Amortization of deferred policy acquisition costs 87 83 75 10 52 (40.2)% 186 220 18.3 % Compensation and benefits, interest expense and financing fees and other operating costs and expense 102 111 114 100 110 7.8 % 415 435 4.8 % Segment benefits and other deductions 777 566 635 634 597 (23.2)% 2,194 2,432 10.8 % Operating earnings (loss), before income taxes 404 441 438 552 477 18.1 % 1,860 1,908 2.6 % Income taxes (56) (71) (79) (95) (86) (53.6)% (305) (331) (8.5)% Operating earnings (loss), before noncontrolling interest 348 370 359 457 391 12.4 % 1,555 1,577 1.4 % Less: Operating (earnings) loss attributable to the noncontrolling interest — — — — — — % — — — % Operating earnings (loss) (2) $ 348 $ 370 $ 359 $ 457 $ 391 12.4 % $ 1,555 $ 1,577 1.4 % Summary Metrics Operating earnings (loss) - TTM (2): [A] $ 1,555 $ 1,557 $ 1,511 $ 1,534 $ 1,577 1.4 % $ 1,555 $ 1,577 1.4 % Average capital - TTM: [B] $ 6,921 $ 6,881 $ 6,917 $ 7,180 $ 7,362 6.4 % $ 6,921 $ 7,362 6.4 % Non-GAAP Operating ROC - TTM (1) (2): [A/B] 22.5% 22.6% 21.8% 21.4% 21.4% 22.5% 21.4% Average Account Value $ 100,166 $ 98,543 $ 103,402 $ 104,143 $ 106,450 6.3 % $ 99,006 $ 101,756 2.8 % Return on assets 1.86% 1.87% 1.73% 1.76% 1.79% 1.88% 1.88% Net flows Current Product Offering $ 718 $ 841 $ 845 $ 802 $ 842 17.2 % $ 2,913 $ 3,330 14.3 % Fixed Rate (1,047) (929) (937) (925) (1,038) 0.9 % (4,111) (3,829) 6.9 % Net flows $ (329) $ (88) $ (92) $ (123) $ (196) 40.3 % $ (1,198) $ (499) 58.3 % First year premiums and deposits $ 1,931 $ 1,879 $ 2,093 $ 2,062 $ 2,157 11.7 % $ 7,308 $ 8,191 12.1 % In-force Policy Count by Product (in thousands): Fixed rate 376 370 365 360 357 376 357 Current product offering 534 537 542 546 549 534 549 Total 910 907 907 906 906 910 906 Notes: (1) This measure is a Non-GAAP financial measure. For an explanation of our use of Non-GAAP financial measures, refer to the “Use of Non-GAAP Financial Measures” and "Glossary of Selected Financial and Product Terms" sections of this document. (2) Had we modified the treatment of the amortization of DAC for SCS starting in the first quarter of 2018, Operating earnings for the three and twelve months ended December 31, 2018 for the Individual Retirement segment would have been $361 million and $1.5 billion and Non-GAAP Operating ROC for the trailing twelve months ended December 31, 2019 would have been 21.8%. During the fourth quarter of 2018, we revised our presentation of the capitalization of deferred acquisition costs ("DAC") in the consolidated statements of income for all prior periods presented herein by netting the capitalized amounts within the applicable expense line items, such as Compensation and benefits, Commissions and distribution plan payments, and Other operating costs and expenses. Previously, the capitalized amounts were netted within the Amortization of deferred acquisition costs. There was no impact on Net income (loss) or Non-GAAP Operating earnings of this reclassification. 4Q19 Financial Supplement 13
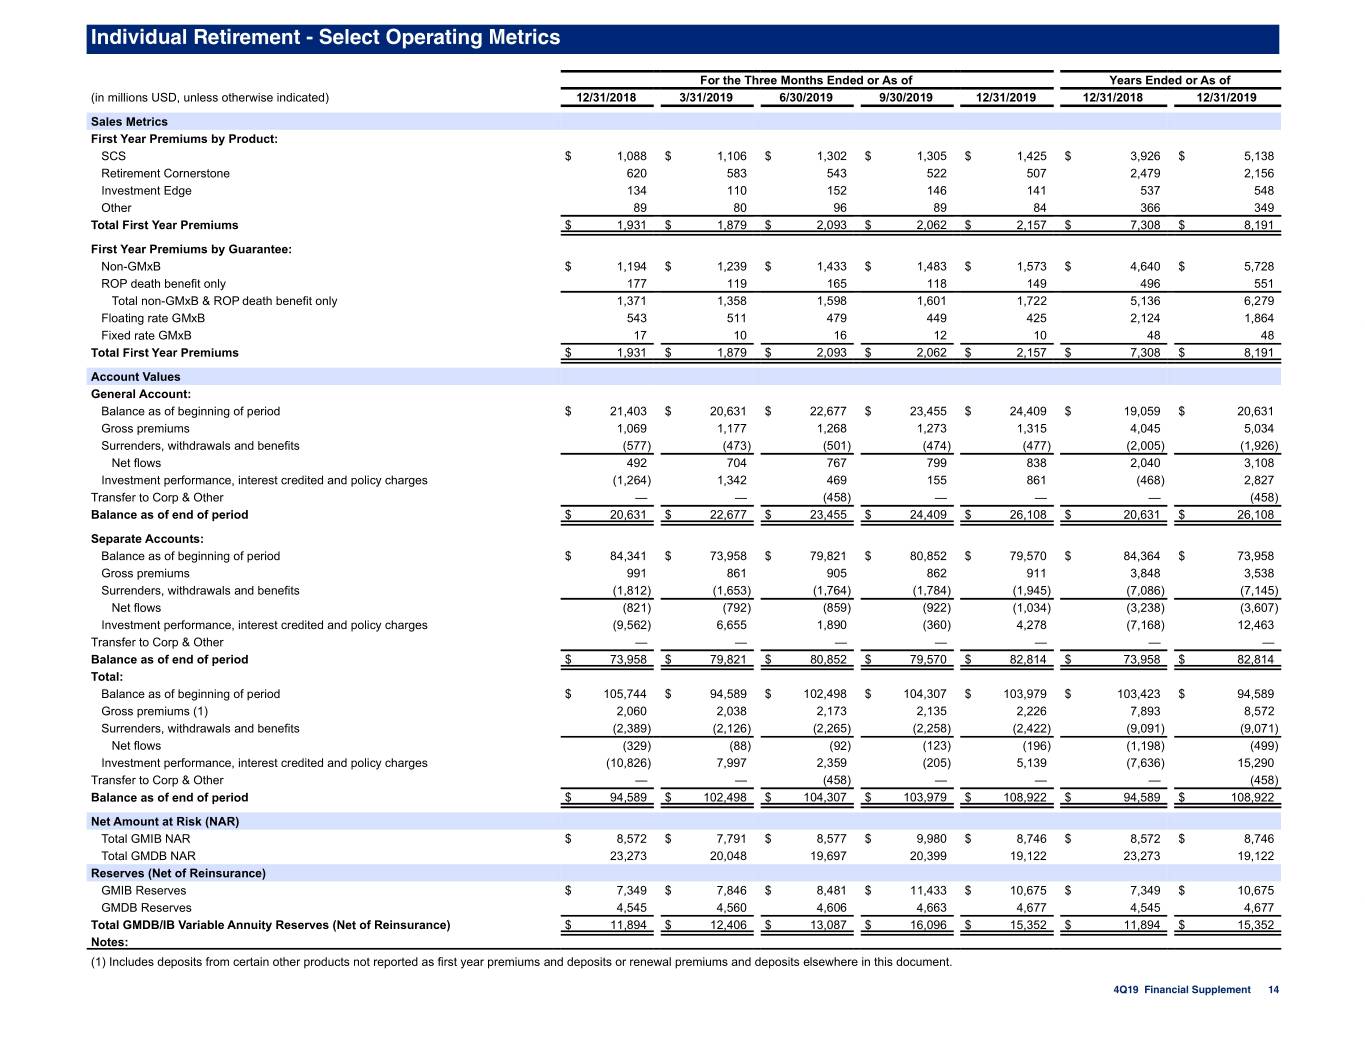
Individual Retirement - Select Operating Metrics For the Three Months Ended or As of Years Ended or As of (in millions USD, unless otherwise indicated) 12/31/2018 3/31/2019 6/30/2019 9/30/2019 12/31/2019 12/31/2018 12/31/2019 Sales Metrics First Year Premiums by Product: SCS $ 1,088 $ 1,106 $ 1,302 $ 1,305 $ 1,425 $ 3,926 $ 5,138 Retirement Cornerstone 620 583 543 522 507 2,479 2,156 Investment Edge 134 110 152 146 141 537 548 Other 89 80 96 89 84 366 349 Total First Year Premiums $ 1,931 $ 1,879 $ 2,093 $ 2,062 $ 2,157 $ 7,308 $ 8,191 First Year Premiums by Guarantee: Non-GMxB $ 1,194 $ 1,239 $ 1,433 $ 1,483 $ 1,573 $ 4,640 $ 5,728 ROP death benefit only 177 119 165 118 149 496 551 Total non-GMxB & ROP death benefit only 1,371 1,358 1,598 1,601 1,722 5,136 6,279 Floating rate GMxB 543 511 479 449 425 2,124 1,864 Fixed rate GMxB 17 10 16 12 10 48 48 Total First Year Premiums $ 1,931 $ 1,879 $ 2,093 $ 2,062 $ 2,157 $ 7,308 $ 8,191 Account Values General Account: Balance as of beginning of period $ 21,403 $ 20,631 $ 22,677 $ 23,455 $ 24,409 $ 19,059 $ 20,631 Gross premiums 1,069 1,177 1,268 1,273 1,315 4,045 5,034 Surrenders, withdrawals and benefits (577) (473) (501) (474) (477) (2,005) (1,926) Net flows 492 704 767 799 838 2,040 3,108 Investment performance, interest credited and policy charges (1,264) 1,342 469 155 861 (468) 2,827 Transfer to Corp & Other — — (458) — — — (458) Balance as of end of period $ 20,631 $ 22,677 $ 23,455 $ 24,409 $ 26,108 $ 20,631 $ 26,108 Separate Accounts: Balance as of beginning of period $ 84,341 $ 73,958 $ 79,821 $ 80,852 $ 79,570 $ 84,364 $ 73,958 Gross premiums 991 861 905 862 911 3,848 3,538 Surrenders, withdrawals and benefits (1,812) (1,653) (1,764) (1,784) (1,945) (7,086) (7,145) Net flows (821) (792) (859) (922) (1,034) (3,238) (3,607) Investment performance, interest credited and policy charges (9,562) 6,655 1,890 (360) 4,278 (7,168) 12,463 Transfer to Corp & Other — — — — — — — Balance as of end of period $ 73,958 $ 79,821 $ 80,852 $ 79,570 $ 82,814 $ 73,958 $ 82,814 Total: Balance as of beginning of period $ 105,744 $ 94,589 $ 102,498 $ 104,307 $ 103,979 $ 103,423 $ 94,589 Gross premiums (1) 2,060 2,038 2,173 2,135 2,226 7,893 8,572 Surrenders, withdrawals and benefits (2,389) (2,126) (2,265) (2,258) (2,422) (9,091) (9,071) Net flows (329) (88) (92) (123) (196) (1,198) (499) Investment performance, interest credited and policy charges (10,826) 7,997 2,359 (205) 5,139 (7,636) 15,290 Transfer to Corp & Other — — (458) — — — (458) Balance as of end of period $ 94,589 $ 102,498 $ 104,307 $ 103,979 $ 108,922 $ 94,589 $ 108,922 Net Amount at Risk (NAR) Total GMIB NAR $ 8,572 $ 7,791 $ 8,577 $ 9,980 $ 8,746 $ 8,572 $ 8,746 Total GMDB NAR 23,273 20,048 19,697 20,399 19,122 23,273 19,122 Reserves (Net of Reinsurance) GMIB Reserves $ 7,349 $ 7,846 $ 8,481 $ 11,433 $ 10,675 $ 7,349 $ 10,675 GMDB Reserves 4,545 4,560 4,606 4,663 4,677 4,545 4,677 Total GMDB/IB Variable Annuity Reserves (Net of Reinsurance) $ 11,894 $ 12,406 $ 13,087 $ 16,096 $ 15,352 $ 11,894 $ 15,352 Notes: (1) Includes deposits from certain other products not reported as first year premiums and deposits or renewal premiums and deposits elsewhere in this document. 4Q19 Financial Supplement 14
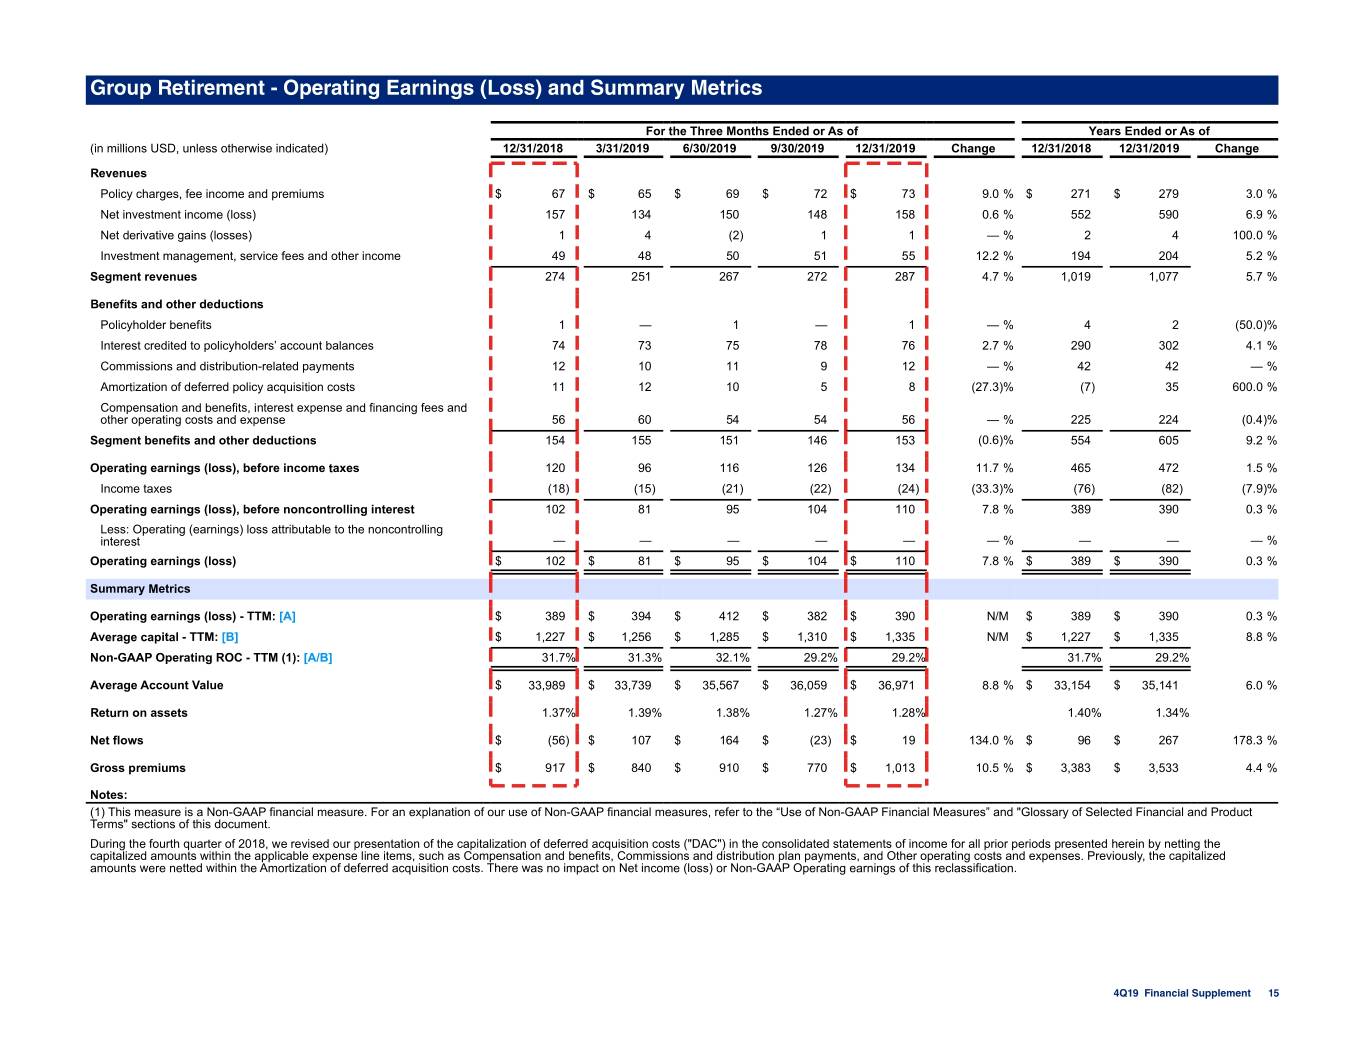
Group Retirement - Operating Earnings (Loss) and Summary Metrics For the Three Months Ended or As of Years Ended or As of (in millions USD, unless otherwise indicated) 12/31/2018 3/31/2019 6/30/2019 9/30/2019 12/31/2019 Change 12/31/2018 12/31/2019 Change Revenues Policy charges, fee income and premiums $ 67 $ 65 $ 69 $ 72 $ 73 9.0 % $ 271 $ 279 3.0 % Net investment income (loss) 157 134 150 148 158 0.6 % 552 590 6.9 % Net derivative gains (losses) 1 4 (2) 1 1 — % 2 4 100.0 % Investment management, service fees and other income 49 48 50 51 55 12.2 % 194 204 5.2 % Segment revenues 274 251 267 272 287 4.7 % 1,019 1,077 5.7 % Benefits and other deductions Policyholder benefits 1 — 1 — 1 — % 4 2 (50.0)% Interest credited to policyholders’ account balances 74 73 75 78 76 2.7 % 290 302 4.1 % Commissions and distribution-related payments 12 10 11 9 12 — % 42 42 — % Amortization of deferred policy acquisition costs 11 12 10 5 8 (27.3)% (7) 35 600.0 % Compensation and benefits, interest expense and financing fees and other operating costs and expense 56 60 54 54 56 — % 225 224 (0.4)% Segment benefits and other deductions 154 155 151 146 153 (0.6)% 554 605 9.2 % Operating earnings (loss), before income taxes 120 96 116 126 134 11.7 % 465 472 1.5 % Income taxes (18) (15) (21) (22) (24) (33.3)% (76) (82) (7.9)% Operating earnings (loss), before noncontrolling interest 102 81 95 104 110 7.8 % 389 390 0.3 % Less: Operating (earnings) loss attributable to the noncontrolling interest — — — — — — % — — — % Operating earnings (loss) $ 102 $ 81 $ 95 $ 104 $ 110 7.8 % $ 389 $ 390 0.3 % Summary Metrics Operating earnings (loss) - TTM: [A] $ 389 $ 394 $ 412 $ 382 $ 390 N/M $ 389 $ 390 0.3 % Average capital - TTM: [B] $ 1,227 $ 1,256 $ 1,285 $ 1,310 $ 1,335 N/M $ 1,227 $ 1,335 8.8 % Non-GAAP Operating ROC - TTM (1): [A/B] 31.7% 31.3% 32.1% 29.2% 29.2% 31.7% 29.2% Average Account Value $ 33,989 $ 33,739 $ 35,567 $ 36,059 $ 36,971 8.8 % $ 33,154 $ 35,141 6.0 % Return on assets 1.37% 1.39% 1.38% 1.27% 1.28% 1.40% 1.34% Net flows $ (56) $ 107 $ 164 $ (23) $ 19 134.0 % $ 96 $ 267 178.3 % Gross premiums $ 917 $ 840 $ 910 $ 770 $ 1,013 10.5 % $ 3,383 $ 3,533 4.4 % Notes: (1) This measure is a Non-GAAP financial measure. For an explanation of our use of Non-GAAP financial measures, refer to the “Use of Non-GAAP Financial Measures” and "Glossary of Selected Financial and Product Terms" sections of this document. During the fourth quarter of 2018, we revised our presentation of the capitalization of deferred acquisition costs ("DAC") in the consolidated statements of income for all prior periods presented herein by netting the capitalized amounts within the applicable expense line items, such as Compensation and benefits, Commissions and distribution plan payments, and Other operating costs and expenses. Previously, the capitalized amounts were netted within the Amortization of deferred acquisition costs. There was no impact on Net income (loss) or Non-GAAP Operating earnings of this reclassification. 4Q19 Financial Supplement 15
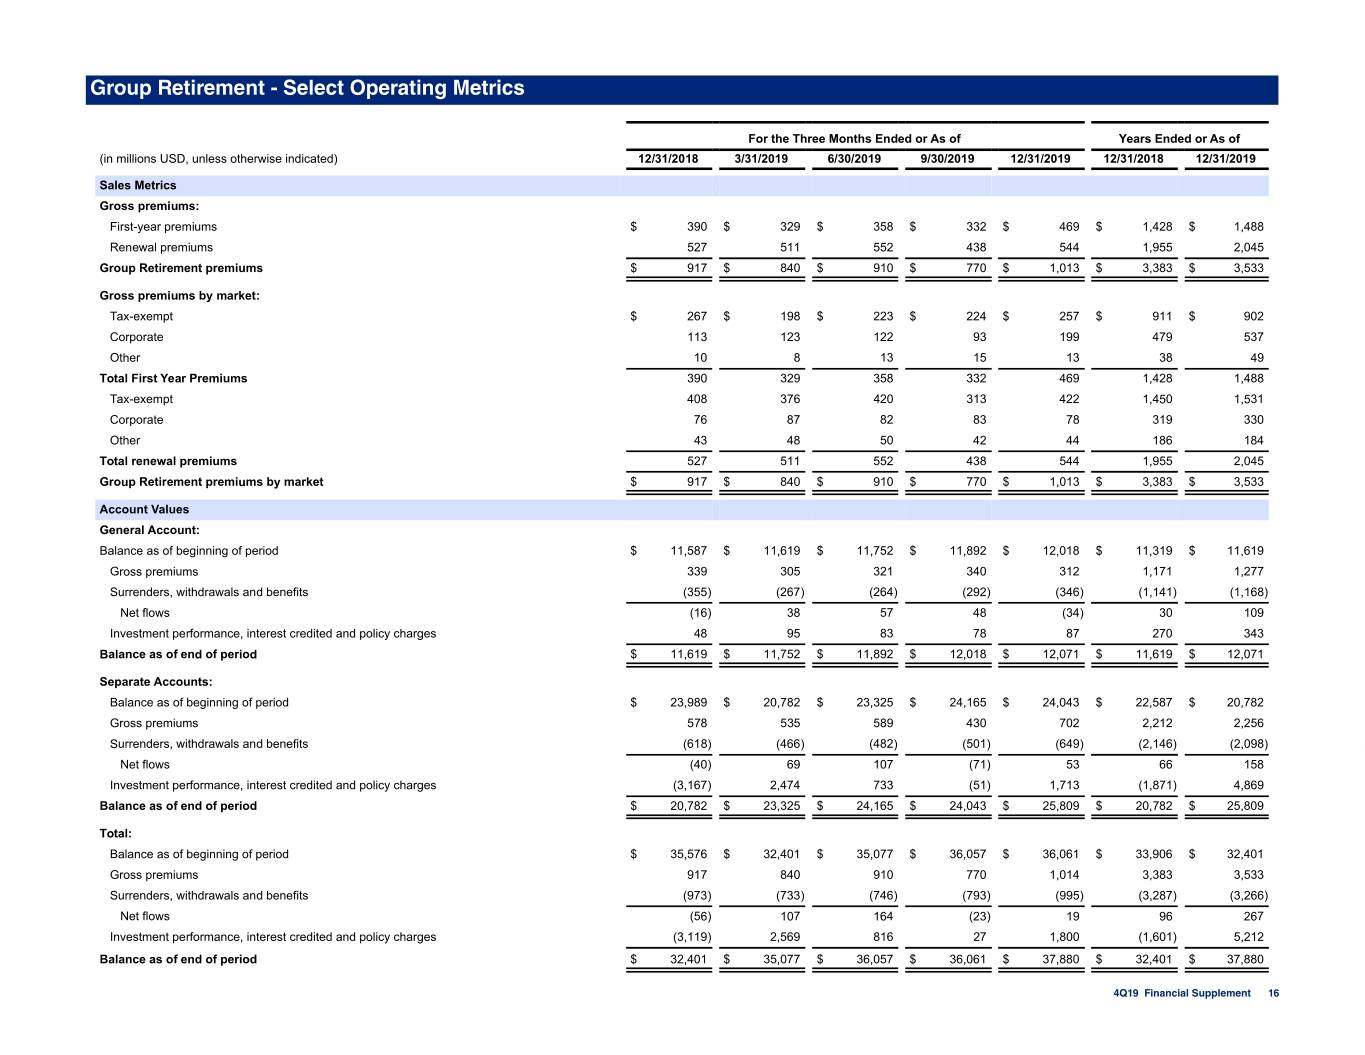
Group Retirement - Select Operating Metrics For the Three Months Ended or As of Years Ended or As of (in millions USD, unless otherwise indicated) 12/31/2018 3/31/2019 6/30/2019 9/30/2019 12/31/2019 12/31/2018 12/31/2019 Sales Metrics Gross premiums: First-year premiums $ 390 $ 329 $ 358 $ 332 $ 469 $ 1,428 $ 1,488 Renewal premiums 527 511 552 438 544 1,955 2,045 Group Retirement premiums $ 917 $ 840 $ 910 $ 770 $ 1,013 $ 3,383 $ 3,533 Gross premiums by market: Tax-exempt $ 267 $ 198 $ 223 $ 224 $ 257 $ 911 $ 902 Corporate 113 123 122 93 199 479 537 Other 10 8 13 15 13 38 49 Total First Year Premiums 390 329 358 332 469 1,428 1,488 Tax-exempt 408 376 420 313 422 1,450 1,531 Corporate 76 87 82 83 78 319 330 Other 43 48 50 42 44 186 184 Total renewal premiums 527 511 552 438 544 1,955 2,045 Group Retirement premiums by market $ 917 $ 840 $ 910 $ 770 $ 1,013 $ 3,383 $ 3,533 Account Values General Account: Balance as of beginning of period $ 11,587 $ 11,619 $ 11,752 $ 11,892 $ 12,018 $ 11,319 $ 11,619 Gross premiums 339 305 321 340 312 1,171 1,277 Surrenders, withdrawals and benefits (355) (267) (264) (292) (346) (1,141) (1,168) Net flows (16) 38 57 48 (34) 30 109 Investment performance, interest credited and policy charges 48 95 83 78 87 270 343 Balance as of end of period $ 11,619 $ 11,752 $ 11,892 $ 12,018 $ 12,071 $ 11,619 $ 12,071 Separate Accounts: Balance as of beginning of period $ 23,989 $ 20,782 $ 23,325 $ 24,165 $ 24,043 $ 22,587 $ 20,782 Gross premiums 578 535 589 430 702 2,212 2,256 Surrenders, withdrawals and benefits (618) (466) (482) (501) (649) (2,146) (2,098) Net flows (40) 69 107 (71) 53 66 158 Investment performance, interest credited and policy charges (3,167) 2,474 733 (51) 1,713 (1,871) 4,869 Balance as of end of period $ 20,782 $ 23,325 $ 24,165 $ 24,043 $ 25,809 $ 20,782 $ 25,809 Total: Balance as of beginning of period $ 35,576 $ 32,401 $ 35,077 $ 36,057 $ 36,061 $ 33,906 $ 32,401 Gross premiums 917 840 910 770 1,014 3,383 3,533 Surrenders, withdrawals and benefits (973) (733) (746) (793) (995) (3,287) (3,266) Net flows (56) 107 164 (23) 19 96 267 Investment performance, interest credited and policy charges (3,119) 2,569 816 27 1,800 (1,601) 5,212 Balance as of end of period $ 32,401 $ 35,077 $ 36,057 $ 36,061 $ 37,880 $ 32,401 $ 37,880 4Q19 Financial Supplement 16
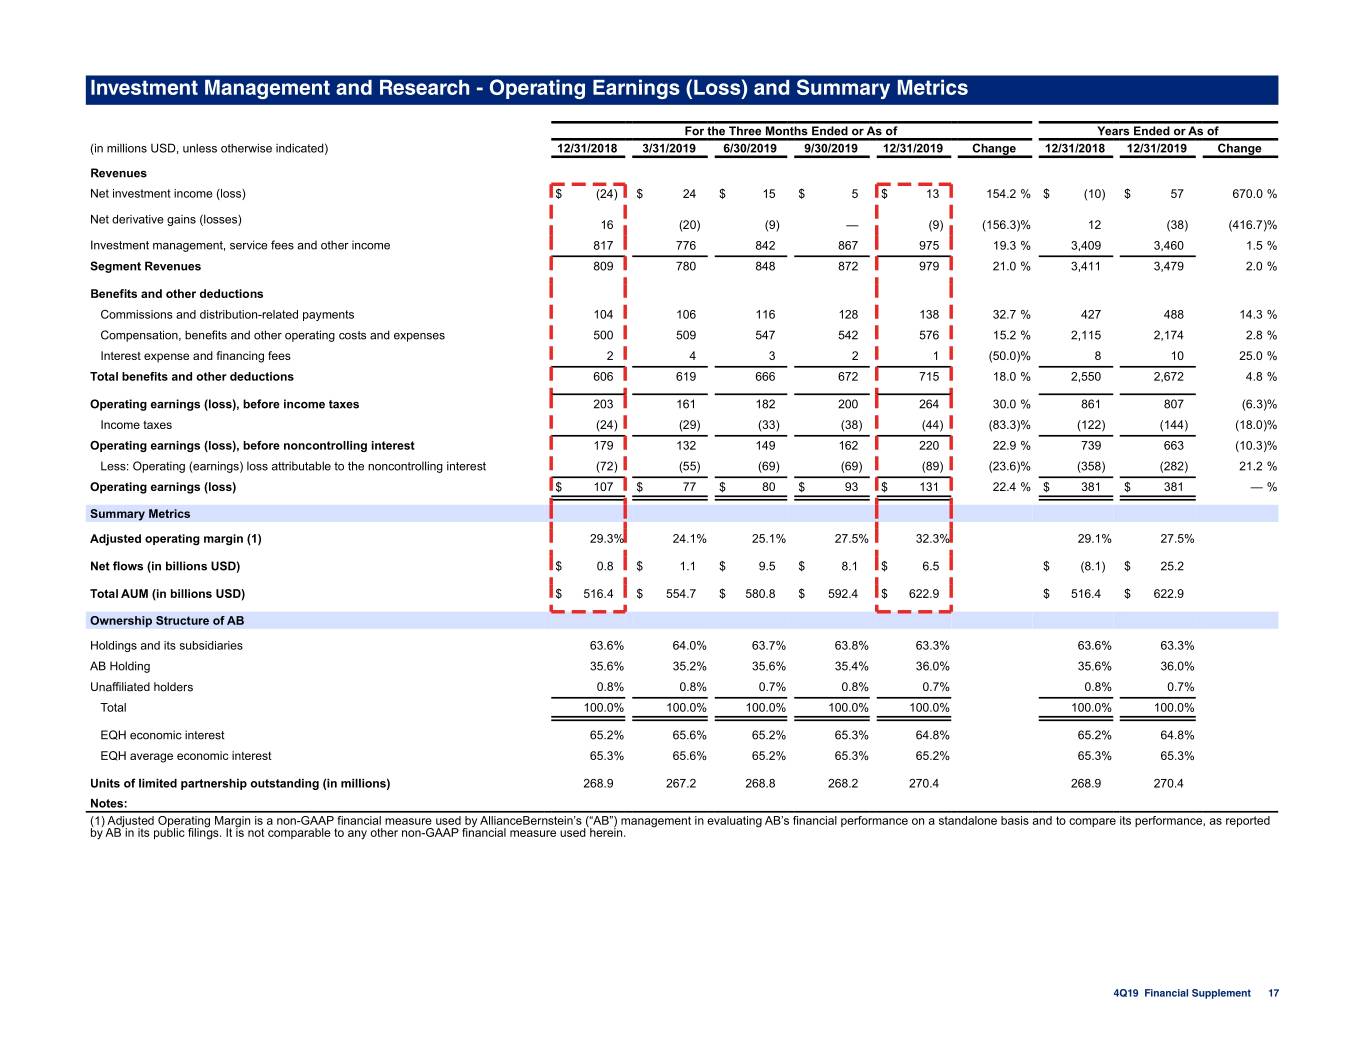
Investment Management and Research - Operating Earnings (Loss) and Summary Metrics For the Three Months Ended or As of Years Ended or As of (in millions USD, unless otherwise indicated) 12/31/2018 3/31/2019 6/30/2019 9/30/2019 12/31/2019 Change 12/31/2018 12/31/2019 Change Revenues Net investment income (loss) $ (24) $ 24 $ 15 $ 5 $ 13 154.2 % $ (10) $ 57 670.0 % Net derivative gains (losses) 16 (20) (9) — (9) (156.3)% 12 (38) (416.7)% Investment management, service fees and other income 817 776 842 867 975 19.3 % 3,409 3,460 1.5 % Segment Revenues 809 780 848 872 979 21.0 % 3,411 3,479 2.0 % Benefits and other deductions Commissions and distribution-related payments 104 106 116 128 138 32.7 % 427 488 14.3 % Compensation, benefits and other operating costs and expenses 500 509 547 542 576 15.2 % 2,115 2,174 2.8 % Interest expense and financing fees 2 4 3 2 1 (50.0)% 8 10 25.0 % Total benefits and other deductions 606 619 666 672 715 18.0 % 2,550 2,672 4.8 % Operating earnings (loss), before income taxes 203 161 182 200 264 30.0 % 861 807 (6.3)% Income taxes (24) (29) (33) (38) (44) (83.3)% (122) (144) (18.0)% Operating earnings (loss), before noncontrolling interest 179 132 149 162 220 22.9 % 739 663 (10.3)% Less: Operating (earnings) loss attributable to the noncontrolling interest (72) (55) (69) (69) (89) (23.6)% (358) (282) 21.2 % Operating earnings (loss) $ 107 $ 77 $ 80 $ 93 $ 131 22.4 % $ 381 $ 381 — % Summary Metrics Adjusted operating margin (1) 29.3% 24.1% 25.1% 27.5% 32.3% 29.1% 27.5% Net flows (in billions USD) $ 0.8 $ 1.1 $ 9.5 $ 8.1 $ 6.5 $ (8.1) $ 25.2 Total AUM (in billions USD) $ 516.4 $ 554.7 $ 580.8 $ 592.4 $ 622.9 $ 516.4 $ 622.9 Ownership Structure of AB Holdings and its subsidiaries 63.6% 64.0% 63.7% 63.8% 63.3% 63.6% 63.3% AB Holding 35.6% 35.2% 35.6% 35.4% 36.0% 35.6% 36.0% Unaffiliated holders 0.8% 0.8% 0.7% 0.8% 0.7% 0.8% 0.7% Total 100.0% 100.0% 100.0% 100.0% 100.0% 100.0% 100.0% EQH economic interest 65.2% 65.6% 65.2% 65.3% 64.8% 65.2% 64.8% EQH average economic interest 65.3% 65.6% 65.2% 65.3% 65.2% 65.3% 65.3% Units of limited partnership outstanding (in millions) 268.9 267.2 268.8 268.2 270.4 268.9 270.4 Notes: (1) Adjusted Operating Margin is a non-GAAP financial measure used by AllianceBernstein’s (“AB”) management in evaluating AB’s financial performance on a standalone basis and to compare its performance, as reported by AB in its public filings. It is not comparable to any other non-GAAP financial measure used herein. 4Q19 Financial Supplement 17
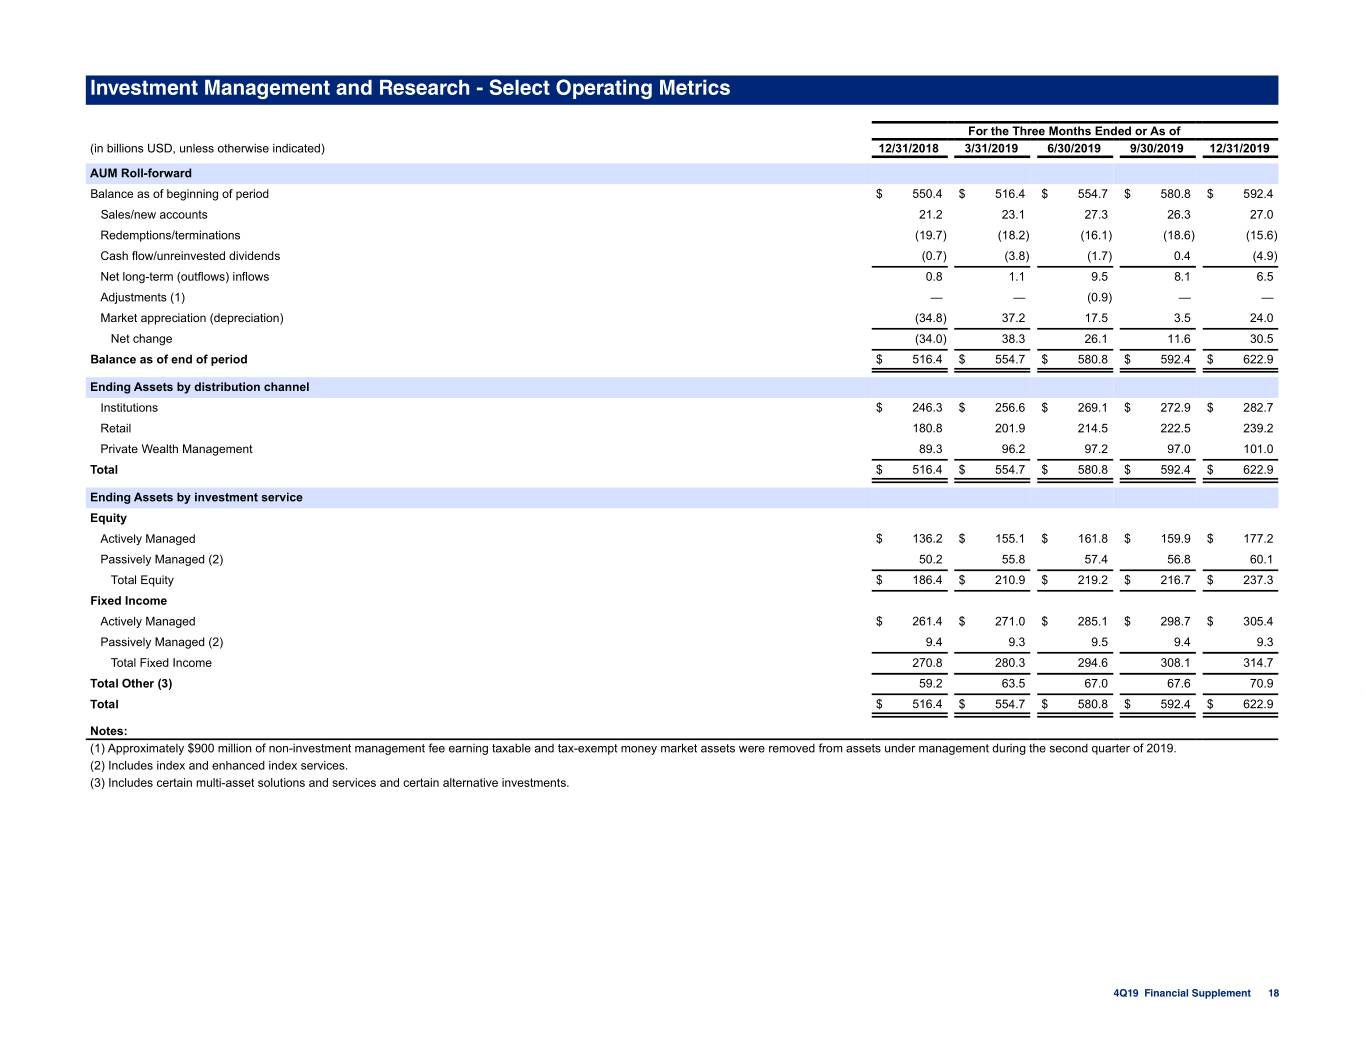
Investment Management and Research - Select Operating Metrics For the Three Months Ended or As of (in billions USD, unless otherwise indicated) 12/31/2018 3/31/2019 6/30/2019 9/30/2019 12/31/2019 AUM Roll-forward Balance as of beginning of period $ 550.4 $ 516.4 $ 554.7 $ 580.8 $ 592.4 Sales/new accounts 21.2 23.1 27.3 26.3 27.0 Redemptions/terminations (19.7) (18.2) (16.1) (18.6) (15.6) Cash flow/unreinvested dividends (0.7) (3.8) (1.7) 0.4 (4.9) Net long-term (outflows) inflows 0.8 1.1 9.5 8.1 6.5 Adjustments (1) — — (0.9) — — Market appreciation (depreciation) (34.8) 37.2 17.5 3.5 24.0 Net change (34.0) 38.3 26.1 11.6 30.5 Balance as of end of period $ 516.4 $ 554.7 $ 580.8 $ 592.4 $ 622.9 Ending Assets by distribution channel Institutions $ 246.3 $ 256.6 $ 269.1 $ 272.9 $ 282.7 Retail 180.8 201.9 214.5 222.5 239.2 Private Wealth Management 89.3 96.2 97.2 97.0 101.0 Total $ 516.4 $ 554.7 $ 580.8 $ 592.4 $ 622.9 Ending Assets by investment service Equity Actively Managed $ 136.2 $ 155.1 $ 161.8 $ 159.9 $ 177.2 Passively Managed (2) 50.2 55.8 57.4 56.8 60.1 Total Equity $ 186.4 $ 210.9 $ 219.2 $ 216.7 $ 237.3 Fixed Income Actively Managed $ 261.4 $ 271.0 $ 285.1 $ 298.7 $ 305.4 Passively Managed (2) 9.4 9.3 9.5 9.4 9.3 Total Fixed Income 270.8 280.3 294.6 308.1 314.7 Total Other (3) 59.2 63.5 67.0 67.6 70.9 Total $ 516.4 $ 554.7 $ 580.8 $ 592.4 $ 622.9 Notes: (1) Approximately $900 million of non-investment management fee earning taxable and tax-exempt money market assets were removed from assets under management during the second quarter of 2019. (2) Includes index and enhanced index services. (3) Includes certain multi-asset solutions and services and certain alternative investments. 4Q19 Financial Supplement 18
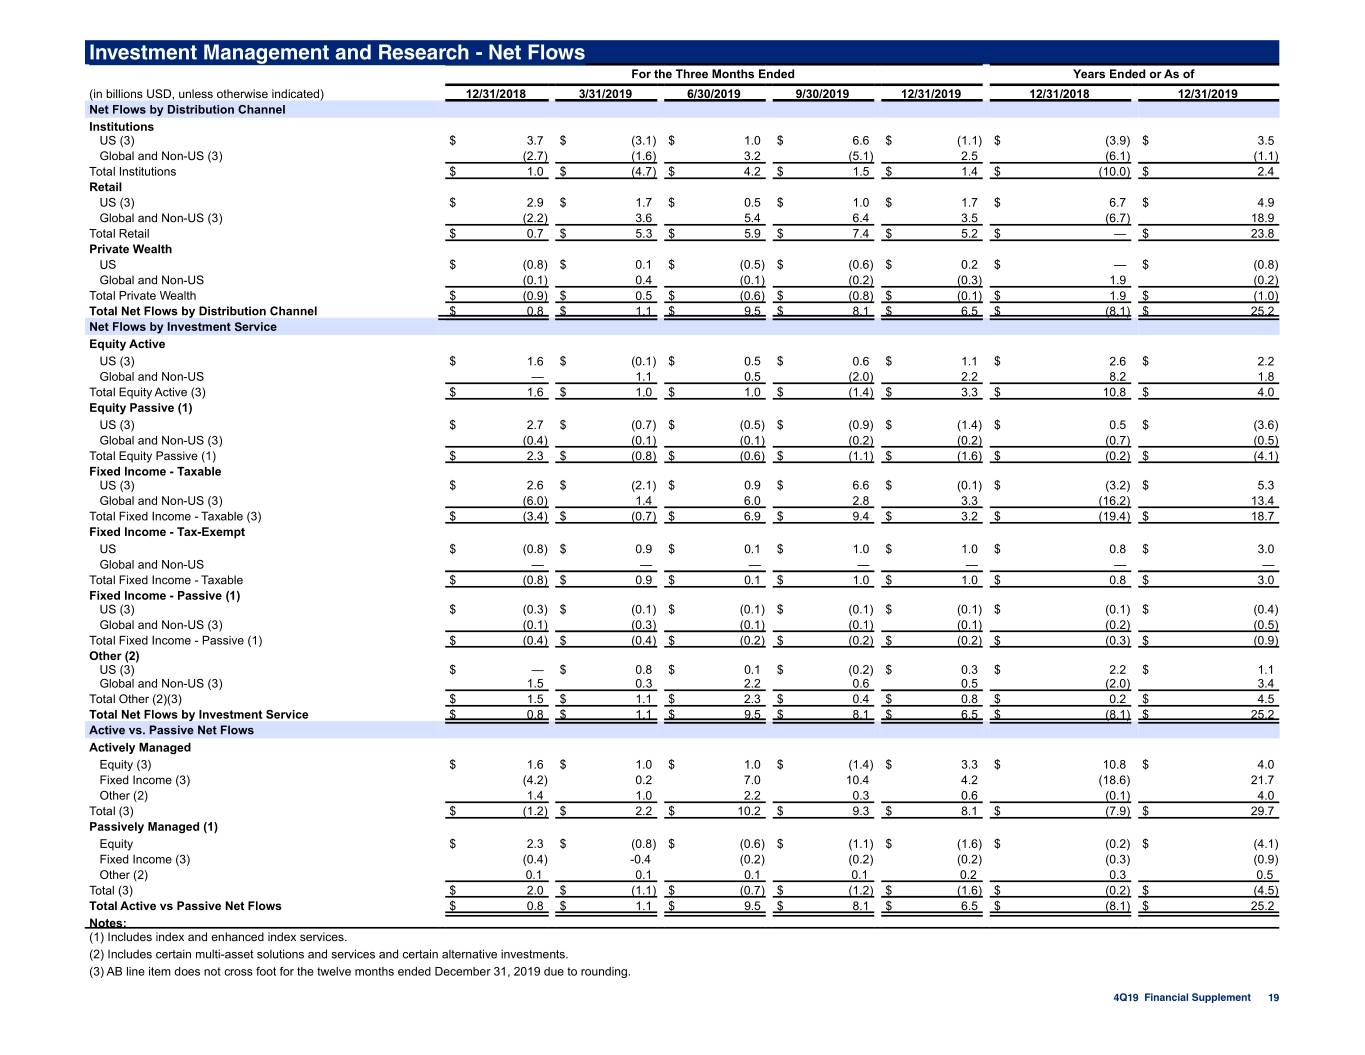
Investment Management and Research - Net Flows For the Three Months Ended Years Ended or As of (in billions USD, unless otherwise indicated) 12/31/2018 3/31/2019 6/30/2019 9/30/2019 12/31/2019 12/31/2018 12/31/2019 Net Flows by Distribution Channel Institutions US (3) $ 3.7 $ (3.1) $ 1.0 $ 6.6 $ (1.1) $ (3.9) $ 3.5 Global and Non-US (3) (2.7) (1.6) 3.2 (5.1) 2.5 (6.1) (1.1) Total Institutions $ 1.0 $ (4.7) $ 4.2 $ 1.5 $ 1.4 $ (10.0) $ 2.4 Retail US (3) $ 2.9 $ 1.7 $ 0.5 $ 1.0 $ 1.7 $ 6.7 $ 4.9 Global and Non-US (3) (2.2) 3.6 5.4 6.4 3.5 (6.7) 18.9 Total Retail $ 0.7 $ 5.3 $ 5.9 $ 7.4 $ 5.2 $ — $ 23.8 Private Wealth US $ (0.8) $ 0.1 $ (0.5) $ (0.6) $ 0.2 $ — $ (0.8) Global and Non-US (0.1) 0.4 (0.1) (0.2) (0.3) 1.9 (0.2) Total Private Wealth $ (0.9) $ 0.5 $ (0.6) $ (0.8) $ (0.1) $ 1.9 $ (1.0) Total Net Flows by Distribution Channel $ 0.8 $ 1.1 $ 9.5 $ 8.1 $ 6.5 $ (8.1) $ 25.2 Net Flows by Investment Service Equity Active US (3) $ 1.6 $ (0.1) $ 0.5 $ 0.6 $ 1.1 $ 2.6 $ 2.2 Global and Non-US — 1.1 0.5 (2.0) 2.2 8.2 1.8 Total Equity Active (3) $ 1.6 $ 1.0 $ 1.0 $ (1.4) $ 3.3 $ 10.8 $ 4.0 Equity Passive (1) US (3) $ 2.7 $ (0.7) $ (0.5) $ (0.9) $ (1.4) $ 0.5 $ (3.6) Global and Non-US (3) (0.4) (0.1) (0.1) (0.2) (0.2) (0.7) (0.5) Total Equity Passive (1) $ 2.3 $ (0.8) $ (0.6) $ (1.1) $ (1.6) $ (0.2) $ (4.1) Fixed Income - Taxable US (3) $ 2.6 $ (2.1) $ 0.9 $ 6.6 $ (0.1) $ (3.2) $ 5.3 Global and Non-US (3) (6.0) 1.4 6.0 2.8 3.3 (16.2) 13.4 Total Fixed Income - Taxable (3) $ (3.4) $ (0.7) $ 6.9 $ 9.4 $ 3.2 $ (19.4) $ 18.7 Fixed Income - Tax-Exempt US $ (0.8) $ 0.9 $ 0.1 $ 1.0 $ 1.0 $ 0.8 $ 3.0 Global and Non-US — — — — — — — Total Fixed Income - Taxable $ (0.8) $ 0.9 $ 0.1 $ 1.0 $ 1.0 $ 0.8 $ 3.0 Fixed Income - Passive (1) US (3) $ (0.3) $ (0.1) $ (0.1) $ (0.1) $ (0.1) $ (0.1) $ (0.4) Global and Non-US (3) (0.1) (0.3) (0.1) (0.1) (0.1) (0.2) (0.5) Total Fixed Income - Passive (1) $ (0.4) $ (0.4) $ (0.2) $ (0.2) $ (0.2) $ (0.3) $ (0.9) Other (2) US (3) $ — $ 0.8 $ 0.1 $ (0.2) $ 0.3 $ 2.2 $ 1.1 Global and Non-US (3) 1.5 0.3 2.2 0.6 0.5 (2.0) 3.4 Total Other (2)(3) $ 1.5 $ 1.1 $ 2.3 $ 0.4 $ 0.8 $ 0.2 $ 4.5 Total Net Flows by Investment Service $ 0.8 $ 1.1 $ 9.5 $ 8.1 $ 6.5 $ (8.1) $ 25.2 Active vs. Passive Net Flows Actively Managed Equity (3) $ 1.6 $ 1.0 $ 1.0 $ (1.4) $ 3.3 $ 10.8 $ 4.0 Fixed Income (3) (4.2) 0.2 7.0 10.4 4.2 (18.6) 21.7 Other (2) 1.4 1.0 2.2 0.3 0.6 (0.1) 4.0 Total (3) $ (1.2) $ 2.2 $ 10.2 $ 9.3 $ 8.1 $ (7.9) $ 29.7 Passively Managed (1) Equity $ 2.3 $ (0.8) $ (0.6) $ (1.1) $ (1.6) $ (0.2) $ (4.1) Fixed Income (3) (0.4) -0.4 (0.2) (0.2) (0.2) (0.3) (0.9) Other (2) 0.1 0.1 0.1 0.1 0.2 0.3 0.5 Total (3) $ 2.0 $ (1.1) $ (0.7) $ (1.2) $ (1.6) $ (0.2) $ (4.5) Total Active vs Passive Net Flows $ 0.8 $ 1.1 $ 9.5 $ 8.1 $ 6.5 $ (8.1) $ 25.2 Notes: (1) Includes index and enhanced index services. (2) Includes certain multi-asset solutions and services and certain alternative investments. (3) AB line item does not cross foot for the twelve months ended December 31, 2019 due to rounding. 4Q19 Financial Supplement 19
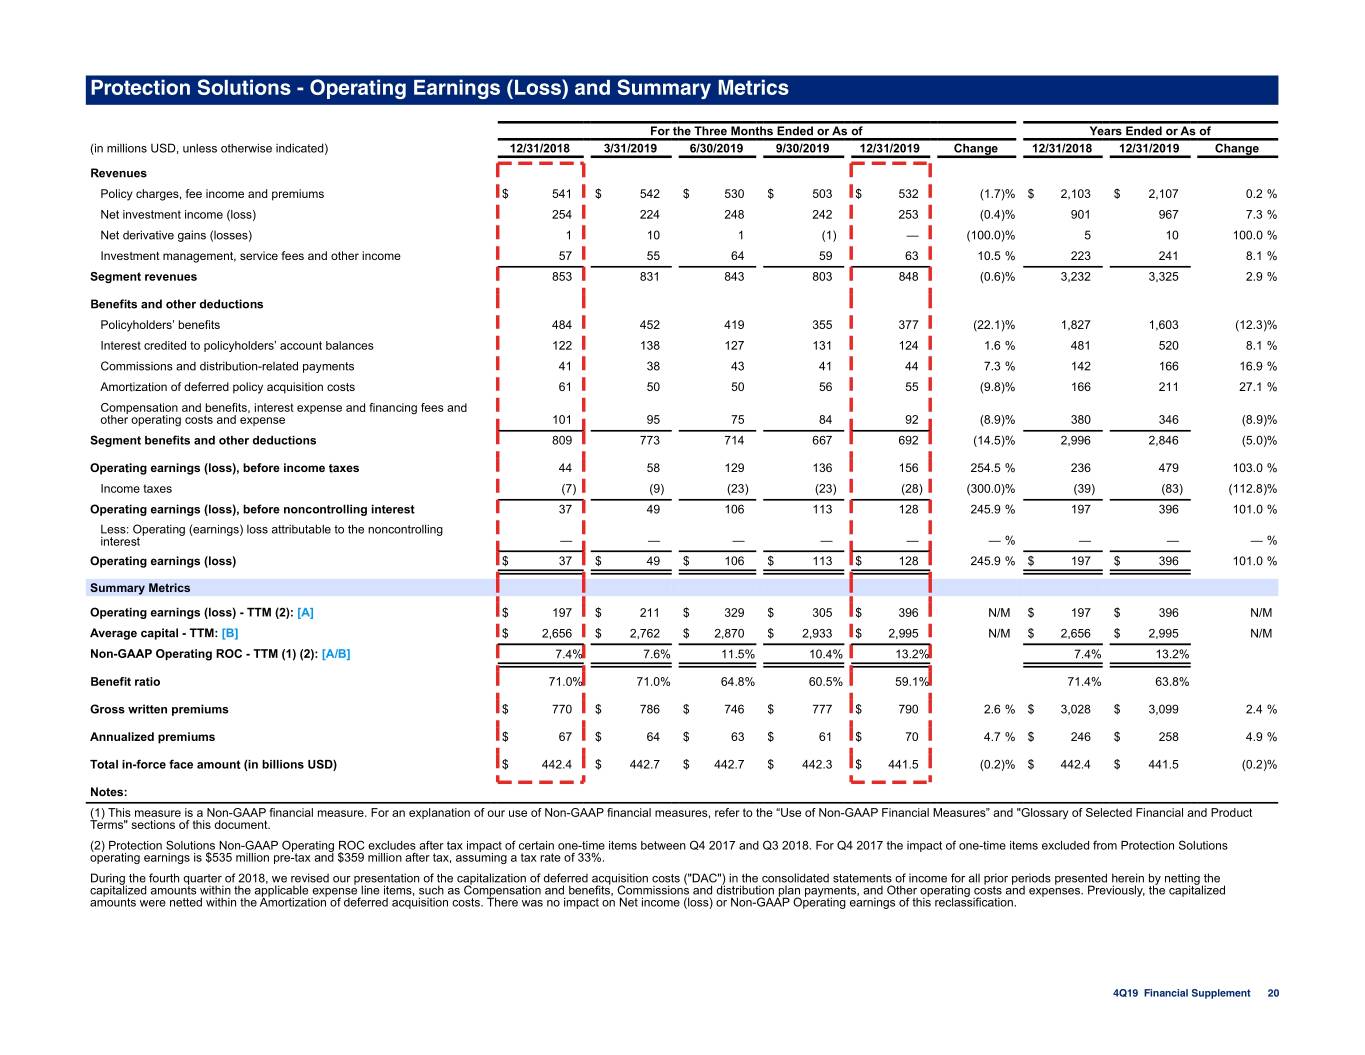
Protection Solutions - Operating Earnings (Loss) and Summary Metrics For the Three Months Ended or As of Years Ended or As of (in millions USD, unless otherwise indicated) 12/31/2018 3/31/2019 6/30/2019 9/30/2019 12/31/2019 Change 12/31/2018 12/31/2019 Change Revenues Policy charges, fee income and premiums $ 541 $ 542 $ 530 $ 503 $ 532 (1.7)% $ 2,103 $ 2,107 0.2 % Net investment income (loss) 254 224 248 242 253 (0.4)% 901 967 7.3 % Net derivative gains (losses) 1 10 1 (1) — (100.0)% 5 10 100.0 % Investment management, service fees and other income 57 55 64 59 63 10.5 % 223 241 8.1 % Segment revenues 853 831 843 803 848 (0.6)% 3,232 3,325 2.9 % Benefits and other deductions Policyholders’ benefits 484 452 419 355 377 (22.1)% 1,827 1,603 (12.3)% Interest credited to policyholders’ account balances 122 138 127 131 124 1.6 % 481 520 8.1 % Commissions and distribution-related payments 41 38 43 41 44 7.3 % 142 166 16.9 % Amortization of deferred policy acquisition costs 61 50 50 56 55 (9.8)% 166 211 27.1 % Compensation and benefits, interest expense and financing fees and other operating costs and expense 101 95 75 84 92 (8.9)% 380 346 (8.9)% Segment benefits and other deductions 809 773 714 667 692 (14.5)% 2,996 2,846 (5.0)% Operating earnings (loss), before income taxes 44 58 129 136 156 254.5 % 236 479 103.0 % Income taxes (7) (9) (23) (23) (28) (300.0)% (39) (83) (112.8)% Operating earnings (loss), before noncontrolling interest 37 49 106 113 128 245.9 % 197 396 101.0 % Less: Operating (earnings) loss attributable to the noncontrolling interest — — — — — — % — — — % Operating earnings (loss) $ 37 $ 49 $ 106 $ 113 $ 128 245.9 % $ 197 $ 396 101.0 % Summary Metrics Operating earnings (loss) - TTM (2): [A] $ 197 $ 211 $ 329 $ 305 $ 396 N/M $ 197 $ 396 N/M Average capital - TTM: [B] $ 2,656 $ 2,762 $ 2,870 $ 2,933 $ 2,995 N/M $ 2,656 $ 2,995 N/M Non-GAAP Operating ROC - TTM (1) (2): [A/B] 7.4% 7.6% 11.5% 10.4% 13.2% 7.4% 13.2% Benefit ratio 71.0% 71.0% 64.8% 60.5% 59.1% 71.4% 63.8% Gross written premiums $ 770 $ 786 $ 746 $ 777 $ 790 2.6 % $ 3,028 $ 3,099 2.4 % Annualized premiums $ 67 $ 64 $ 63 $ 61 $ 70 4.7 % $ 246 $ 258 4.9 % Total in-force face amount (in billions USD) $ 442.4 $ 442.7 $ 442.7 $ 442.3 $ 441.5 (0.2)% $ 442.4 $ 441.5 (0.2)% Notes: (1) This measure is a Non-GAAP financial measure. For an explanation of our use of Non-GAAP financial measures, refer to the “Use of Non-GAAP Financial Measures” and "Glossary of Selected Financial and Product Terms" sections of this document. (2) Protection Solutions Non-GAAP Operating ROC excludes after tax impact of certain one-time items between Q4 2017 and Q3 2018. For Q4 2017 the impact of one-time items excluded from Protection Solutions operating earnings is $535 million pre-tax and $359 million after tax, assuming a tax rate of 33%. During the fourth quarter of 2018, we revised our presentation of the capitalization of deferred acquisition costs ("DAC") in the consolidated statements of income for all prior periods presented herein by netting the capitalized amounts within the applicable expense line items, such as Compensation and benefits, Commissions and distribution plan payments, and Other operating costs and expenses. Previously, the capitalized amounts were netted within the Amortization of deferred acquisition costs. There was no impact on Net income (loss) or Non-GAAP Operating earnings of this reclassification. 4Q19 Financial Supplement 20
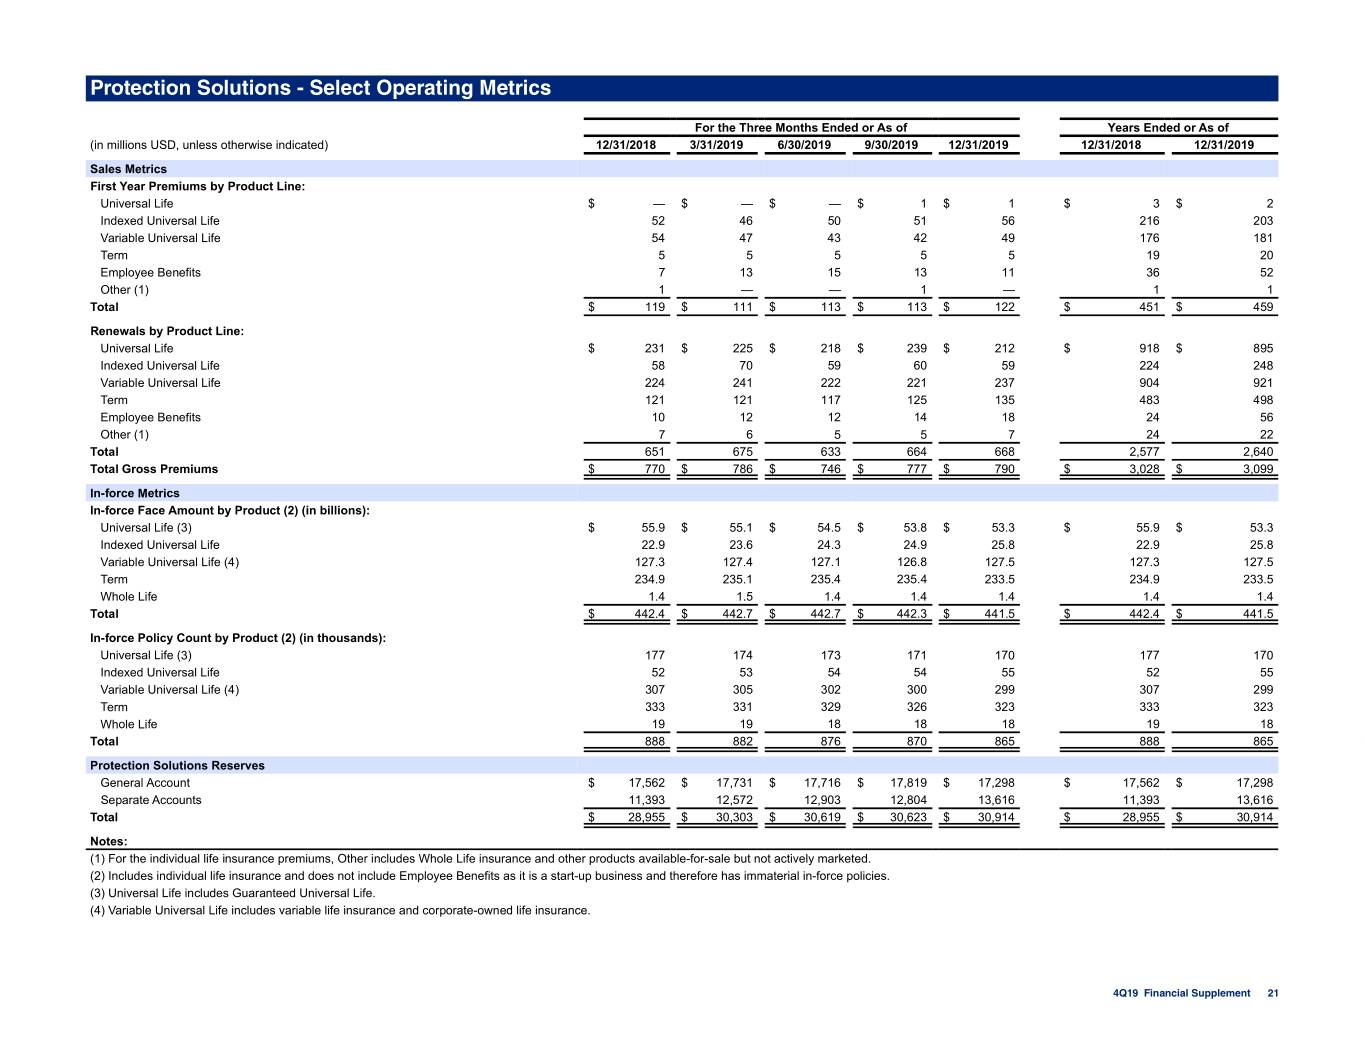
Protection Solutions - Select Operating Metrics For the Three Months Ended or As of Years Ended or As of (in millions USD, unless otherwise indicated) 12/31/2018 3/31/2019 6/30/2019 9/30/2019 12/31/2019 12/31/2018 12/31/2019 Sales Metrics First Year Premiums by Product Line: Universal Life $ — $ — $ — $ 1 $ 1 $ 3 $ 2 Indexed Universal Life 52 46 50 51 56 216 203 Variable Universal Life 54 47 43 42 49 176 181 Term 5 5 5 5 5 19 20 Employee Benefits 7 13 15 13 11 36 52 Other (1) 1 — — 1 — 1 1 Total $ 119 $ 111 $ 113 $ 113 $ 122 $ 451 $ 459 Renewals by Product Line: Universal Life $ 231 $ 225 $ 218 $ 239 $ 212 $ 918 $ 895 Indexed Universal Life 58 70 59 60 59 224 248 Variable Universal Life 224 241 222 221 237 904 921 Term 121 121 117 125 135 483 498 Employee Benefits 10 12 12 14 18 24 56 Other (1) 7 6 5 5 7 24 22 Total 651 675 633 664 668 2,577 2,640 Total Gross Premiums $ 770 $ 786 $ 746 $ 777 $ 790 $ 3,028 $ 3,099 In-force Metrics In-force Face Amount by Product (2) (in billions): Universal Life (3) $ 55.9 $ 55.1 $ 54.5 $ 53.8 $ 53.3 $ 55.9 $ 53.3 Indexed Universal Life 22.9 23.6 24.3 24.9 25.8 22.9 25.8 Variable Universal Life (4) 127.3 127.4 127.1 126.8 127.5 127.3 127.5 Term 234.9 235.1 235.4 235.4 233.5 234.9 233.5 Whole Life 1.4 1.5 1.4 1.4 1.4 1.4 1.4 Total $ 442.4 $ 442.7 $ 442.7 $ 442.3 $ 441.5 $ 442.4 $ 441.5 In-force Policy Count by Product (2) (in thousands): Universal Life (3) 177 174 173 171 170 177 170 Indexed Universal Life 52 53 54 54 55 52 55 Variable Universal Life (4) 307 305 302 300 299 307 299 Term 333 331 329 326 323 333 323 Whole Life 19 19 18 18 18 19 18 Total 888 882 876 870 865 888 865 Protection Solutions Reserves General Account $ 17,562 $ 17,731 $ 17,716 $ 17,819 $ 17,298 $ 17,562 $ 17,298 Separate Accounts 11,393 12,572 12,903 12,804 13,616 11,393 13,616 Total $ 28,955 $ 30,303 $ 30,619 $ 30,623 $ 30,914 $ 28,955 $ 30,914 Notes: (1) For the individual life insurance premiums, Other includes Whole Life insurance and other products available-for-sale but not actively marketed. (2) Includes individual life insurance and does not include Employee Benefits as it is a start-up business and therefore has immaterial in-force policies. (3) Universal Life includes Guaranteed Universal Life. (4) Variable Universal Life includes variable life insurance and corporate-owned life insurance. 4Q19 Financial Supplement 21

Investments 4Q19 Financial Supplement 22
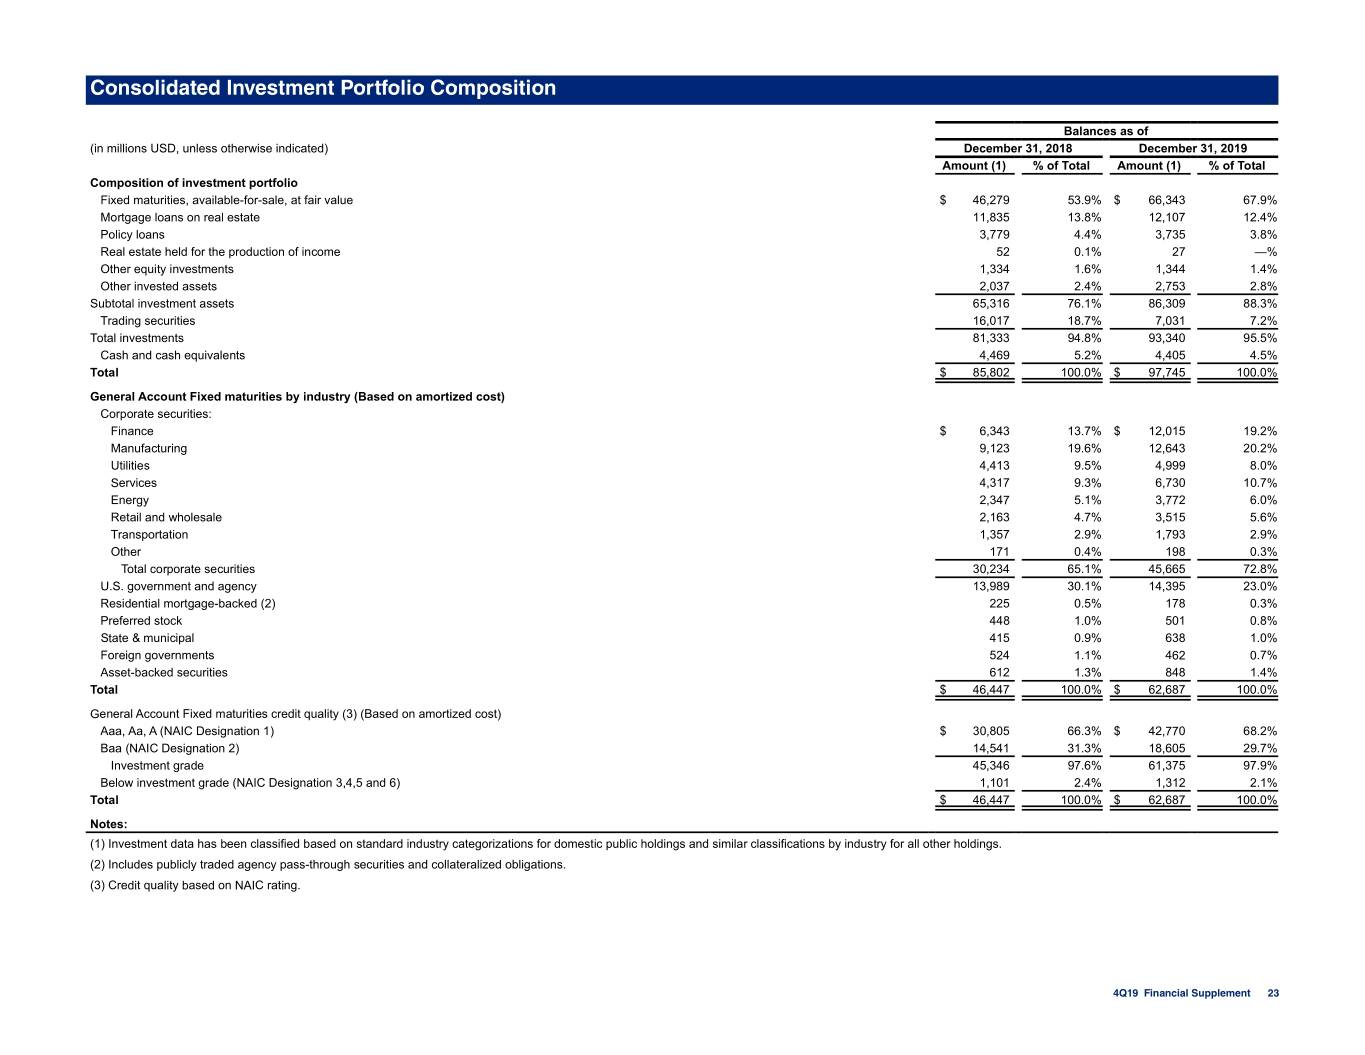
Consolidated Investment Portfolio Composition Balances as of (in millions USD, unless otherwise indicated) December 31, 2018 December 31, 2019 Amount (1) % of Total Amount (1) % of Total Composition of investment portfolio Fixed maturities, available-for-sale, at fair value $ 46,279 53.9% $ 66,343 67.9% Mortgage loans on real estate 11,835 13.8% 12,107 12.4% Policy loans 3,779 4.4% 3,735 3.8% Real estate held for the production of income 52 0.1% 27 —% Other equity investments 1,334 1.6% 1,344 1.4% Other invested assets 2,037 2.4% 2,753 2.8% Subtotal investment assets 65,316 76.1% 86,309 88.3% Trading securities 16,017 18.7% 7,031 7.2% Total investments 81,333 94.8% 93,340 95.5% Cash and cash equivalents 4,469 5.2% 4,405 4.5% Total $ 85,802 100.0% $ 97,745 100.0% General Account Fixed maturities by industry (Based on amortized cost) Corporate securities: Finance $ 6,343 13.7% $ 12,015 19.2% Manufacturing 9,123 19.6% 12,643 20.2% Utilities 4,413 9.5% 4,999 8.0% Services 4,317 9.3% 6,730 10.7% Energy 2,347 5.1% 3,772 6.0% Retail and wholesale 2,163 4.7% 3,515 5.6% Transportation 1,357 2.9% 1,793 2.9% Other 171 0.4% 198 0.3% Total corporate securities 30,234 65.1% 45,665 72.8% U.S. government and agency 13,989 30.1% 14,395 23.0% Residential mortgage-backed (2) 225 0.5% 178 0.3% Preferred stock 448 1.0% 501 0.8% State & municipal 415 0.9% 638 1.0% Foreign governments 524 1.1% 462 0.7% Asset-backed securities 612 1.3% 848 1.4% Total $ 46,447 100.0% $ 62,687 100.0% General Account Fixed maturities credit quality (3) (Based on amortized cost) Aaa, Aa, A (NAIC Designation 1) $ 30,805 66.3% $ 42,770 68.2% Baa (NAIC Designation 2) 14,541 31.3% 18,605 29.7% Investment grade 45,346 97.6% 61,375 97.9% Below investment grade (NAIC Designation 3,4,5 and 6) 1,101 2.4% 1,312 2.1% Total $ 46,447 100.0% $ 62,687 100.0% Notes: (1) Investment data has been classified based on standard industry categorizations for domestic public holdings and similar classifications by industry for all other holdings. (2) Includes publicly traded agency pass-through securities and collateralized obligations. (3) Credit quality based on NAIC rating. 4Q19 Financial Supplement 23
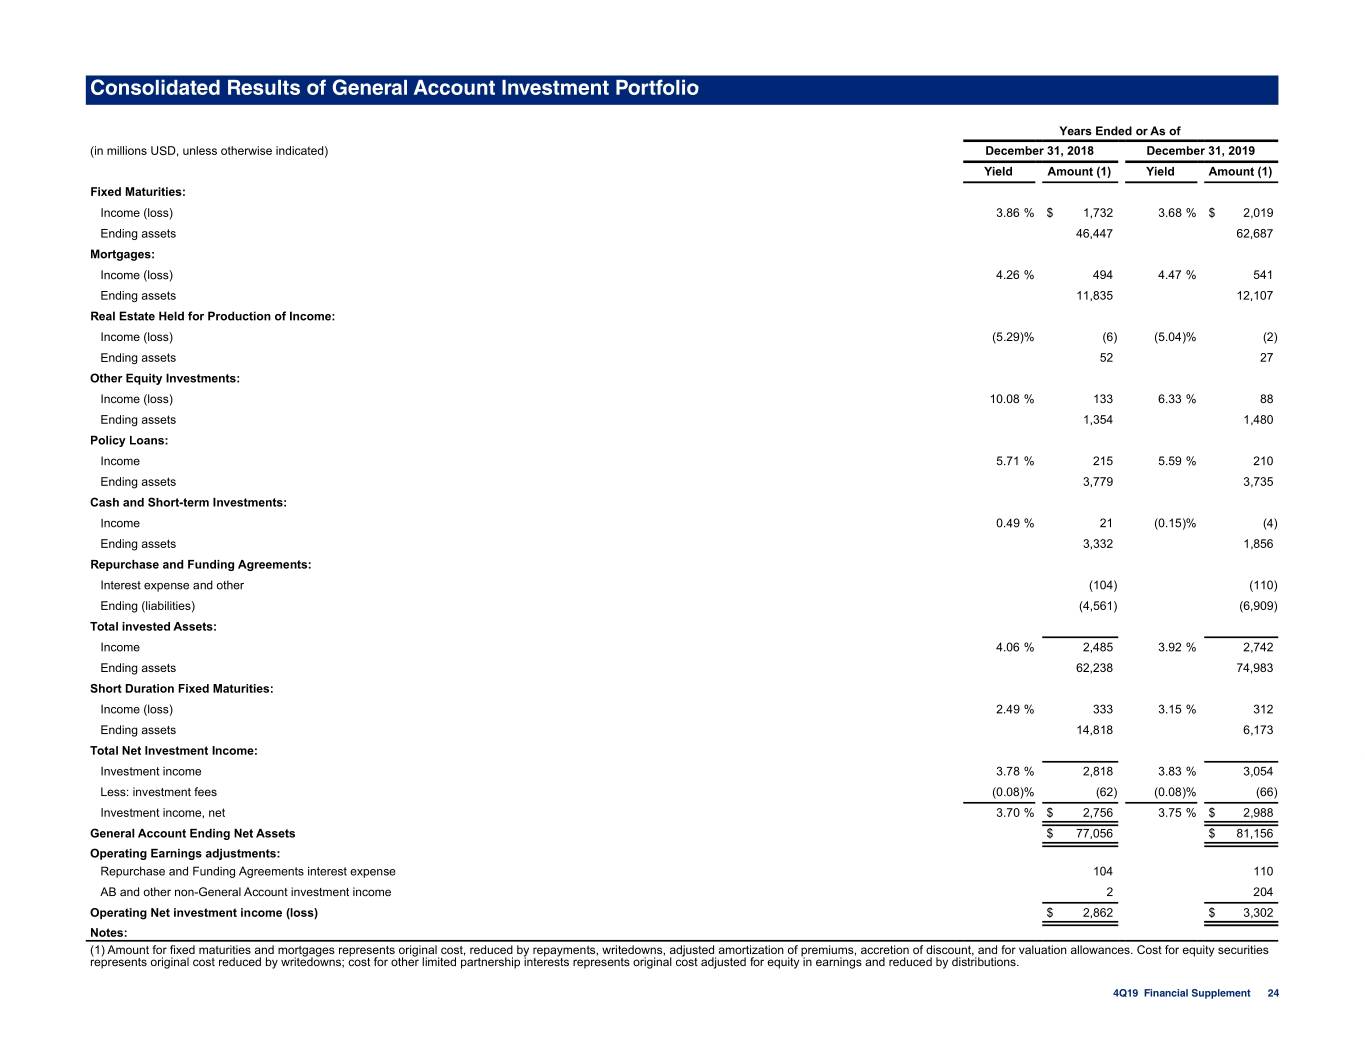
Consolidated Results of General Account Investment Portfolio Years Ended or As of (in millions USD, unless otherwise indicated) December 31, 2018 December 31, 2019 Yield Amount (1) Yield Amount (1) Fixed Maturities: Income (loss) 3.86 % $ 1,732 3.68 % $ 2,019 Ending assets 46,447 62,687 Mortgages: Income (loss) 4.26 % 494 4.47 % 541 Ending assets 11,835 12,107 Real Estate Held for Production of Income: Income (loss) (5.29)% (6) (5.04)% (2) Ending assets 52 27 Other Equity Investments: Income (loss) 10.08 % 133 6.33 % 88 Ending assets 1,354 1,480 Policy Loans: Income 5.71 % 215 5.59 % 210 Ending assets 3,779 3,735 Cash and Short-term Investments: Income 0.49 % 21 (0.15)% (4) Ending assets 3,332 1,856 Repurchase and Funding Agreements: Interest expense and other (104) (110) Ending (liabilities) (4,561) (6,909) Total invested Assets: Income 4.06 % 2,485 3.92 % 2,742 Ending assets 62,238 74,983 Short Duration Fixed Maturities: Income (loss) 2.49 % 333 3.15 % 312 Ending assets 14,818 6,173 Total Net Investment Income: Investment income 3.78 % 2,818 3.83 % 3,054 Less: investment fees (0.08)% (62) (0.08)% (66) Investment income, net 3.70 % $ 2,756 3.75 % $ 2,988 General Account Ending Net Assets $ 77,056 $ 81,156 Operating Earnings adjustments: Repurchase and Funding Agreements interest expense 104 110 AB and other non-General Account investment income 2 204 Operating Net investment income (loss) $ 2,862 $ 3,302 Notes: (1) Amount for fixed maturities and mortgages represents original cost, reduced by repayments, writedowns, adjusted amortization of premiums, accretion of discount, and for valuation allowances. Cost for equity securities represents original cost reduced by writedowns; cost for other limited partnership interests represents original cost adjusted for equity in earnings and reduced by distributions. 4Q19 Financial Supplement 24

Additional Information 4Q19 Financial Supplement 25
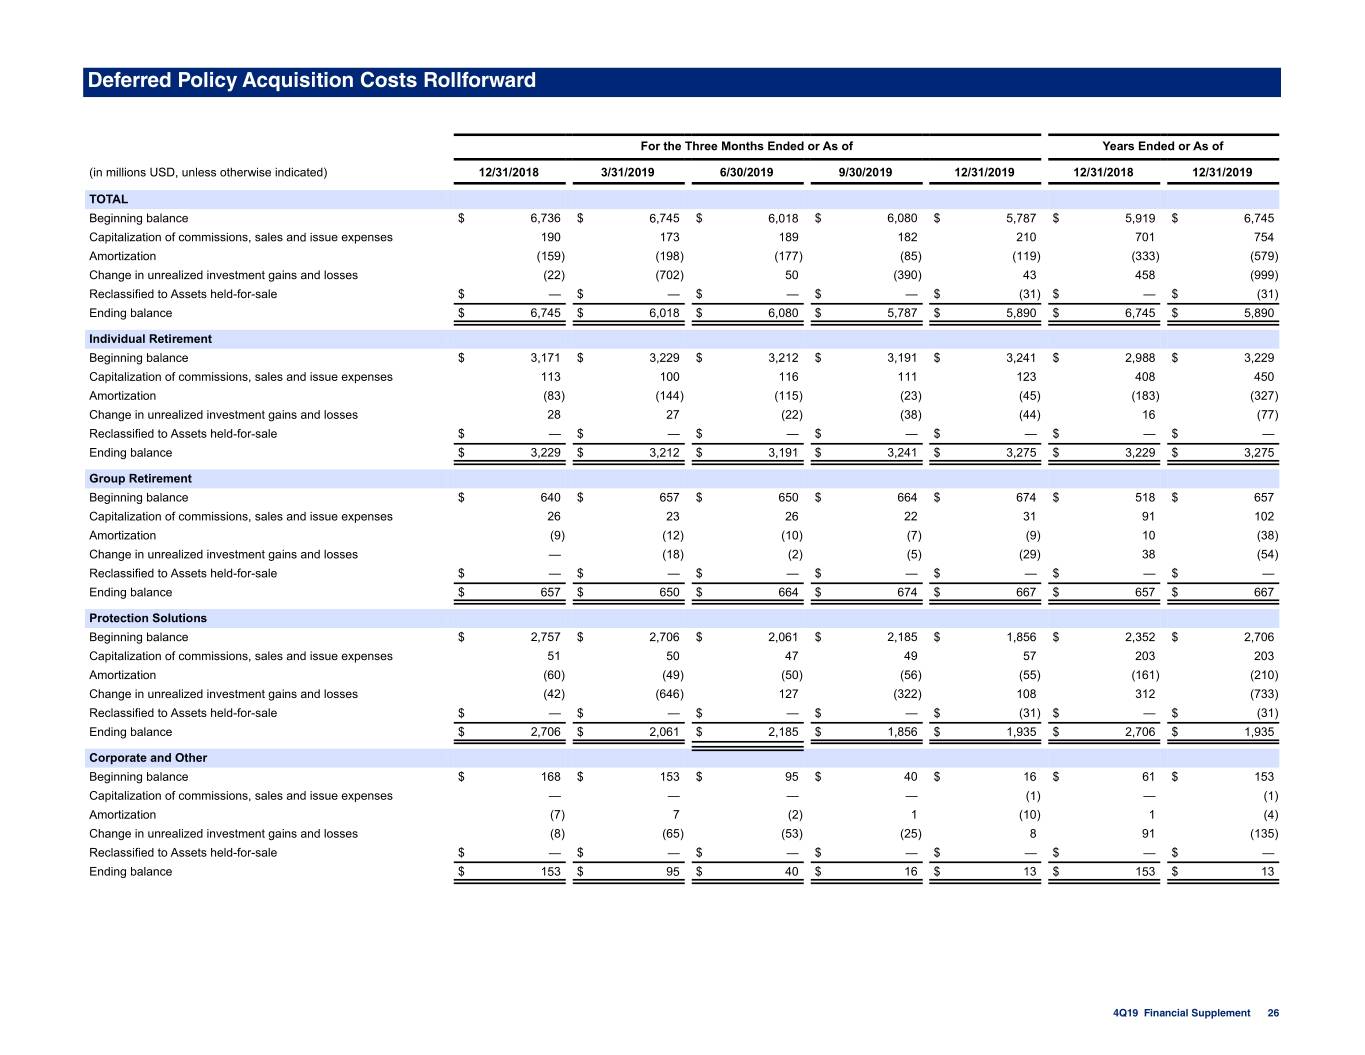
Deferred Policy Acquisition Costs Rollforward For the Three Months Ended or As of Years Ended or As of (in millions USD, unless otherwise indicated) 12/31/2018 3/31/2019 6/30/2019 9/30/2019 12/31/2019 12/31/2018 12/31/2019 TOTAL Beginning balance $ 6,736 $ 6,745 $ 6,018 $ 6,080 $ 5,787 $ 5,919 $ 6,745 Capitalization of commissions, sales and issue expenses 190 173 189 182 210 701 754 Amortization (159) (198) (177) (85) (119) (333) (579) Change in unrealized investment gains and losses (22) (702) 50 (390) 43 458 (999) Reclassified to Assets held-for-sale $ — $ — $ — $ — $ (31) $ — $ (31) Ending balance $ 6,745 $ 6,018 $ 6,080 $ 5,787 $ 5,890 $ 6,745 $ 5,890 Individual Retirement Beginning balance $ 3,171 $ 3,229 $ 3,212 $ 3,191 $ 3,241 $ 2,988 $ 3,229 Capitalization of commissions, sales and issue expenses 113 100 116 111 123 408 450 Amortization (83) (144) (115) (23) (45) (183) (327) Change in unrealized investment gains and losses 28 27 (22) (38) (44) 16 (77) Reclassified to Assets held-for-sale $ — $ — $ — $ — $ — $ — $ — Ending balance $ 3,229 $ 3,212 $ 3,191 $ 3,241 $ 3,275 $ 3,229 $ 3,275 Group Retirement Beginning balance $ 640 $ 657 $ 650 $ 664 $ 674 $ 518 $ 657 Capitalization of commissions, sales and issue expenses 26 23 26 22 31 91 102 Amortization (9) (12) (10) (7) (9) 10 (38) Change in unrealized investment gains and losses — (18) (2) (5) (29) 38 (54) Reclassified to Assets held-for-sale $ — $ — $ — $ — $ — $ — $ — Ending balance $ 657 $ 650 $ 664 $ 674 $ 667 $ 657 $ 667 Protection Solutions Beginning balance $ 2,757 $ 2,706 $ 2,061 $ 2,185 $ 1,856 $ 2,352 $ 2,706 Capitalization of commissions, sales and issue expenses 51 50 47 49 57 203 203 Amortization (60) (49) (50) (56) (55) (161) (210) Change in unrealized investment gains and losses (42) (646) 127 (322) 108 312 (733) Reclassified to Assets held-for-sale $ — $ — $ — $ — $ (31) $ — $ (31) Ending balance $ 2,706 $ 2,061 $ 2,185 $ 1,856 $ 1,935 $ 2,706 $ 1,935 Corporate and Other Beginning balance $ 168 $ 153 $ 95 $ 40 $ 16 $ 61 $ 153 Capitalization of commissions, sales and issue expenses — — — — (1) — (1) Amortization (7) 7 (2) 1 (10) 1 (4) Change in unrealized investment gains and losses (8) (65) (53) (25) 8 91 (135) Reclassified to Assets held-for-sale $ — $ — $ — $ — $ — $ — $ — Ending balance $ 153 $ 95 $ 40 $ 16 $ 13 $ 153 $ 13 4Q19 Financial Supplement 26
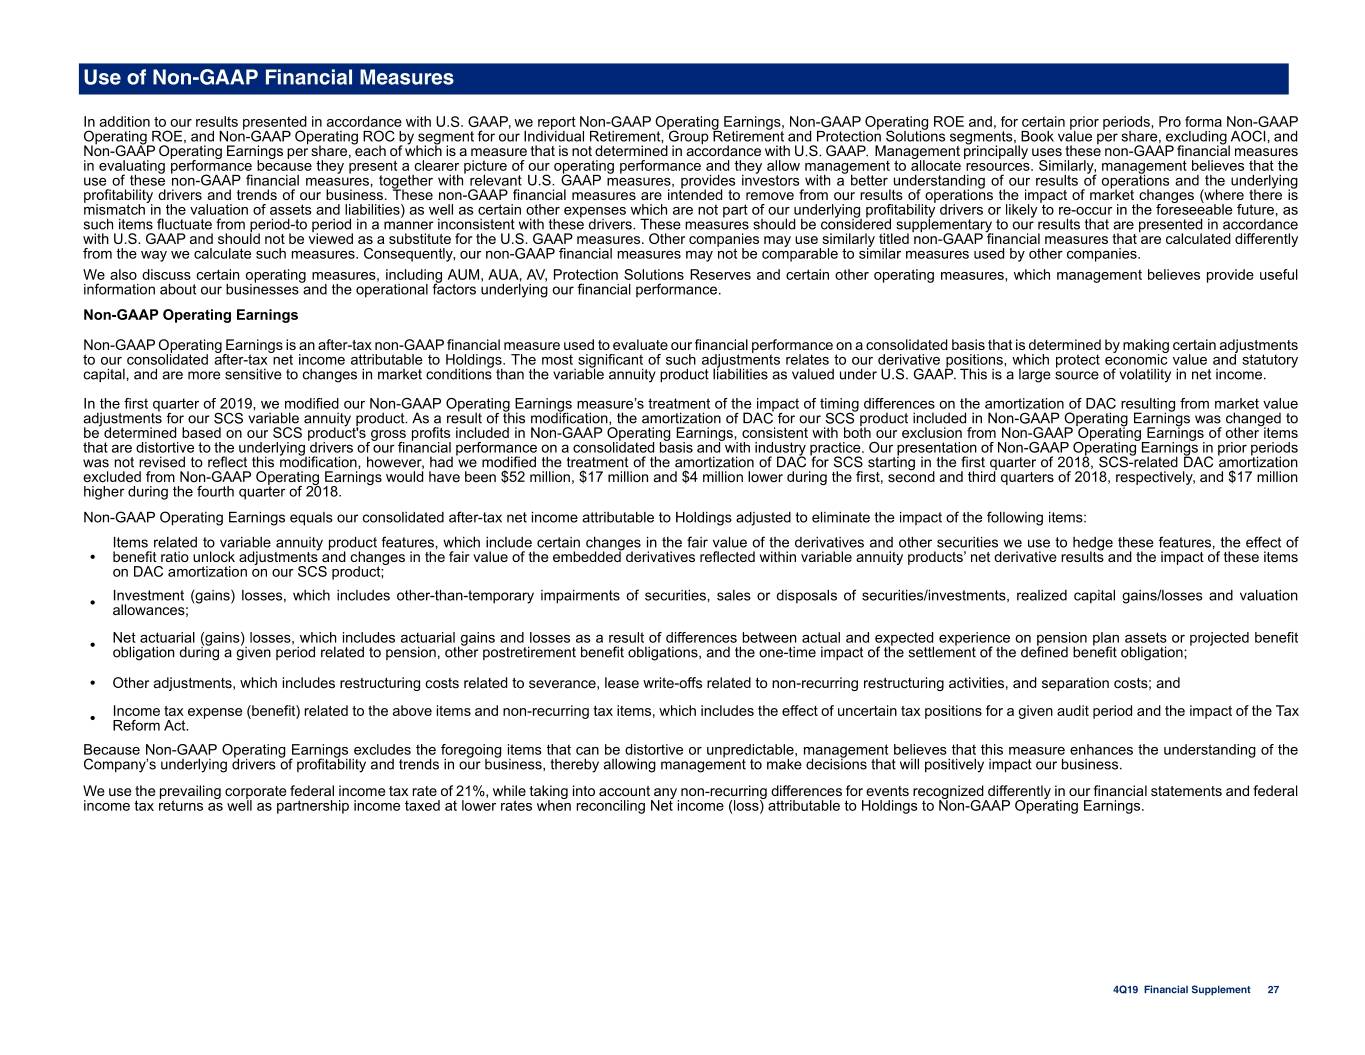
Use of Non-GAAP Financial Measures In addition to our results presented in accordance with U.S. GAAP, we report Non-GAAP Operating Earnings, Non-GAAP Operating ROE and, for certain prior periods, Pro forma Non-GAAP Operating ROE, and Non-GAAP Operating ROC by segment for our Individual Retirement, Group Retirement and Protection Solutions segments, Book value per share, excluding AOCI, and Non-GAAP Operating Earnings per share, each of which is a measure that is not determined in accordance with U.S. GAAP. Management principally uses these non-GAAP financial measures in evaluating performance because they present a clearer picture of our operating performance and they allow management to allocate resources. Similarly, management believes that the use of these non-GAAP financial measures, together with relevant U.S. GAAP measures, provides investors with a better understanding of our results of operations and the underlying profitability drivers and trends of our business. These non-GAAP financial measures are intended to remove from our results of operations the impact of market changes (where there is mismatch in the valuation of assets and liabilities) as well as certain other expenses which are not part of our underlying profitability drivers or likely to re-occur in the foreseeable future, as such items fluctuate from period-to period in a manner inconsistent with these drivers. These measures should be considered supplementary to our results that are presented in accordance with U.S. GAAP and should not be viewed as a substitute for the U.S. GAAP measures. Other companies may use similarly titled non-GAAP financial measures that are calculated differently from the way we calculate such measures. Consequently, our non-GAAP financial measures may not be comparable to similar measures used by other companies. We also discuss certain operating measures, including AUM, AUA, AV, Protection Solutions Reserves and certain other operating measures, which management believes provide useful information about our businesses and the operational factors underlying our financial performance. Non-GAAP Operating Earnings Non-GAAP Operating Earnings is an after-tax non-GAAP financial measure used to evaluate our financial performance on a consolidated basis that is determined by making certain adjustments to our consolidated after-tax net income attributable to Holdings. The most significant of such adjustments relates to our derivative positions, which protect economic value and statutory capital, and are more sensitive to changes in market conditions than the variable annuity product liabilities as valued under U.S. GAAP. This is a large source of volatility in net income. In the first quarter of 2019, we modified our Non-GAAP Operating Earnings measure’s treatment of the impact of timing differences on the amortization of DAC resulting from market value adjustments for our SCS variable annuity product. As a result of this modification, the amortization of DAC for our SCS product included in Non-GAAP Operating Earnings was changed to be determined based on our SCS product's gross profits included in Non-GAAP Operating Earnings, consistent with both our exclusion from Non-GAAP Operating Earnings of other items that are distortive to the underlying drivers of our financial performance on a consolidated basis and with industry practice. Our presentation of Non-GAAP Operating Earnings in prior periods was not revised to reflect this modification, however, had we modified the treatment of the amortization of DAC for SCS starting in the first quarter of 2018, SCS-related DAC amortization excluded from Non-GAAP Operating Earnings would have been $52 million, $17 million and $4 million lower during the first, second and third quarters of 2018, respectively, and $17 million higher during the fourth quarter of 2018. Non-GAAP Operating Earnings equals our consolidated after-tax net income attributable to Holdings adjusted to eliminate the impact of the following items: Items related to variable annuity product features, which include certain changes in the fair value of the derivatives and other securities we use to hedge these features, the effect of • benefit ratio unlock adjustments and changes in the fair value of the embedded derivatives reflected within variable annuity products’ net derivative results and the impact of these items on DAC amortization on our SCS product; Investment (gains) losses, which includes other-than-temporary impairments of securities, sales or disposals of securities/investments, realized capital gains/losses and valuation • allowances; Net actuarial (gains) losses, which includes actuarial gains and losses as a result of differences between actual and expected experience on pension plan assets or projected benefit • obligation during a given period related to pension, other postretirement benefit obligations, and the one-time impact of the settlement of the defined benefit obligation; • Other adjustments, which includes restructuring costs related to severance, lease write-offs related to non-recurring restructuring activities, and separation costs; and Income tax expense (benefit) related to the above items and non-recurring tax items, which includes the effect of uncertain tax positions for a given audit period and the impact of the Tax • Reform Act. Because Non-GAAP Operating Earnings excludes the foregoing items that can be distortive or unpredictable, management believes that this measure enhances the understanding of the Company’s underlying drivers of profitability and trends in our business, thereby allowing management to make decisions that will positively impact our business. We use the prevailing corporate federal income tax rate of 21%, while taking into account any non-recurring differences for events recognized differently in our financial statements and federal income tax returns as well as partnership income taxed at lower rates when reconciling Net income (loss) attributable to Holdings to Non-GAAP Operating Earnings. 4Q19 Financial Supplement 27
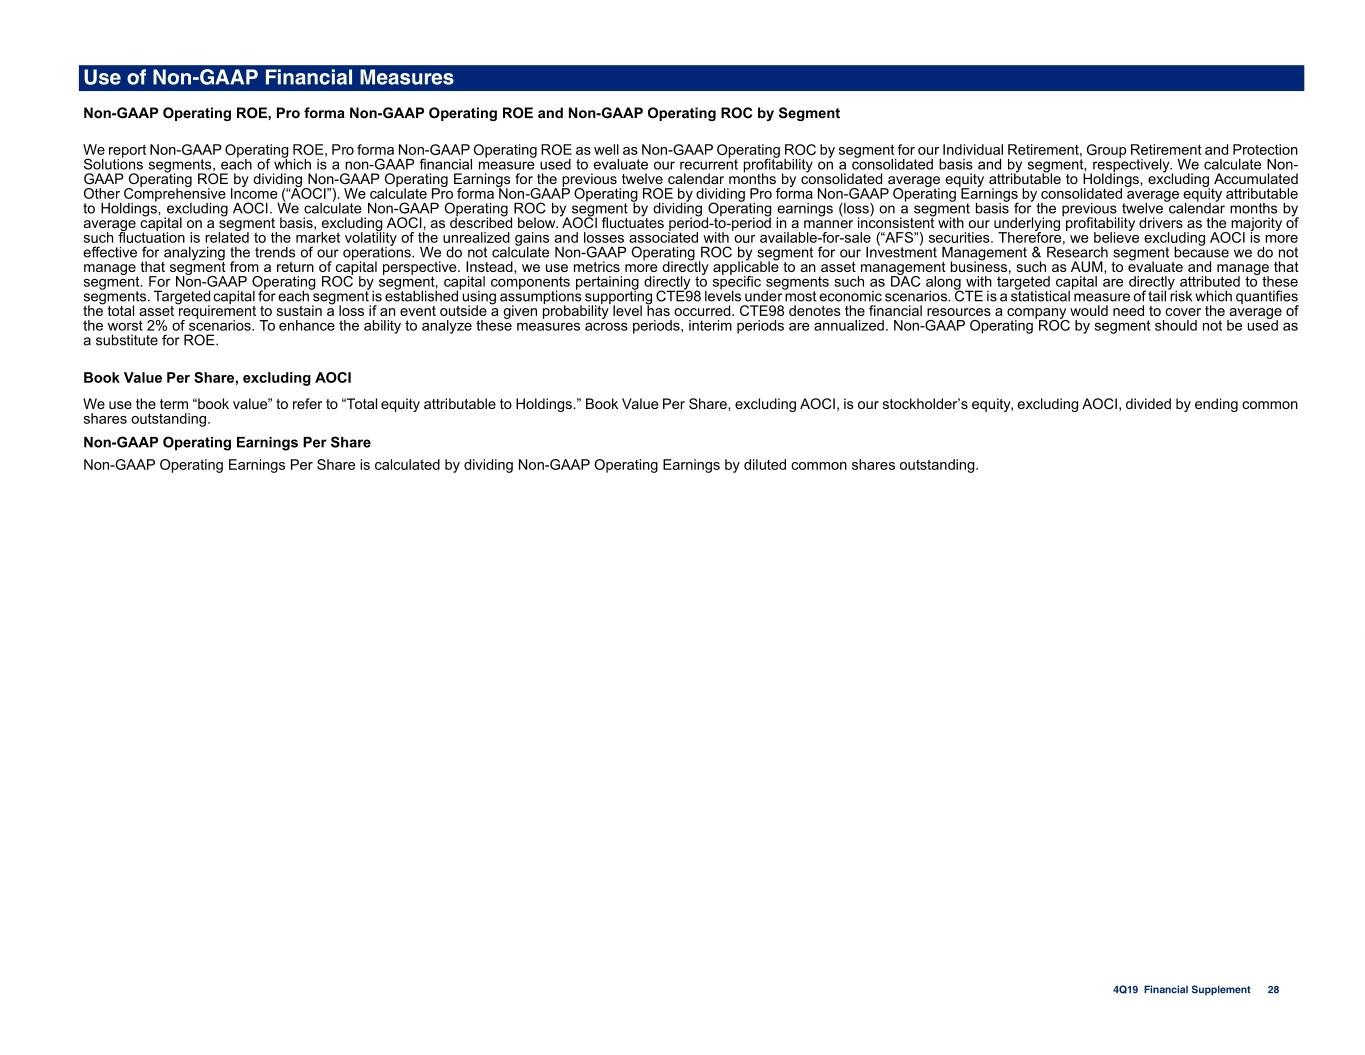
Use of Non-GAAP Financial Measures Non-GAAP Operating ROE, Pro forma Non-GAAP Operating ROE and Non-GAAP Operating ROC by Segment We report Non-GAAP Operating ROE, Pro forma Non-GAAP Operating ROE as well as Non-GAAP Operating ROC by segment for our Individual Retirement, Group Retirement and Protection Solutions segments, each of which is a non-GAAP financial measure used to evaluate our recurrent profitability on a consolidated basis and by segment, respectively. We calculate Non- GAAP Operating ROE by dividing Non-GAAP Operating Earnings for the previous twelve calendar months by consolidated average equity attributable to Holdings, excluding Accumulated Other Comprehensive Income (“AOCI”). We calculate Pro forma Non-GAAP Operating ROE by dividing Pro forma Non-GAAP Operating Earnings by consolidated average equity attributable to Holdings, excluding AOCI. We calculate Non-GAAP Operating ROC by segment by dividing Operating earnings (loss) on a segment basis for the previous twelve calendar months by average capital on a segment basis, excluding AOCI, as described below. AOCI fluctuates period-to-period in a manner inconsistent with our underlying profitability drivers as the majority of such fluctuation is related to the market volatility of the unrealized gains and losses associated with our available-for-sale (“AFS”) securities. Therefore, we believe excluding AOCI is more effective for analyzing the trends of our operations. We do not calculate Non-GAAP Operating ROC by segment for our Investment Management & Research segment because we do not manage that segment from a return of capital perspective. Instead, we use metrics more directly applicable to an asset management business, such as AUM, to evaluate and manage that segment. For Non-GAAP Operating ROC by segment, capital components pertaining directly to specific segments such as DAC along with targeted capital are directly attributed to these segments. Targeted capital for each segment is established using assumptions supporting CTE98 levels under most economic scenarios. CTE is a statistical measure of tail risk which quantifies the total asset requirement to sustain a loss if an event outside a given probability level has occurred. CTE98 denotes the financial resources a company would need to cover the average of the worst 2% of scenarios. To enhance the ability to analyze these measures across periods, interim periods are annualized. Non-GAAP Operating ROC by segment should not be used as a substitute for ROE. Book Value Per Share, excluding AOCI We use the term “book value” to refer to “Total equity attributable to Holdings.” Book Value Per Share, excluding AOCI, is our stockholder’s equity, excluding AOCI, divided by ending common shares outstanding. Non-GAAP Operating Earnings Per Share Non-GAAP Operating Earnings Per Share is calculated by dividing Non-GAAP Operating Earnings by diluted common shares outstanding. 4Q19 Financial Supplement 28
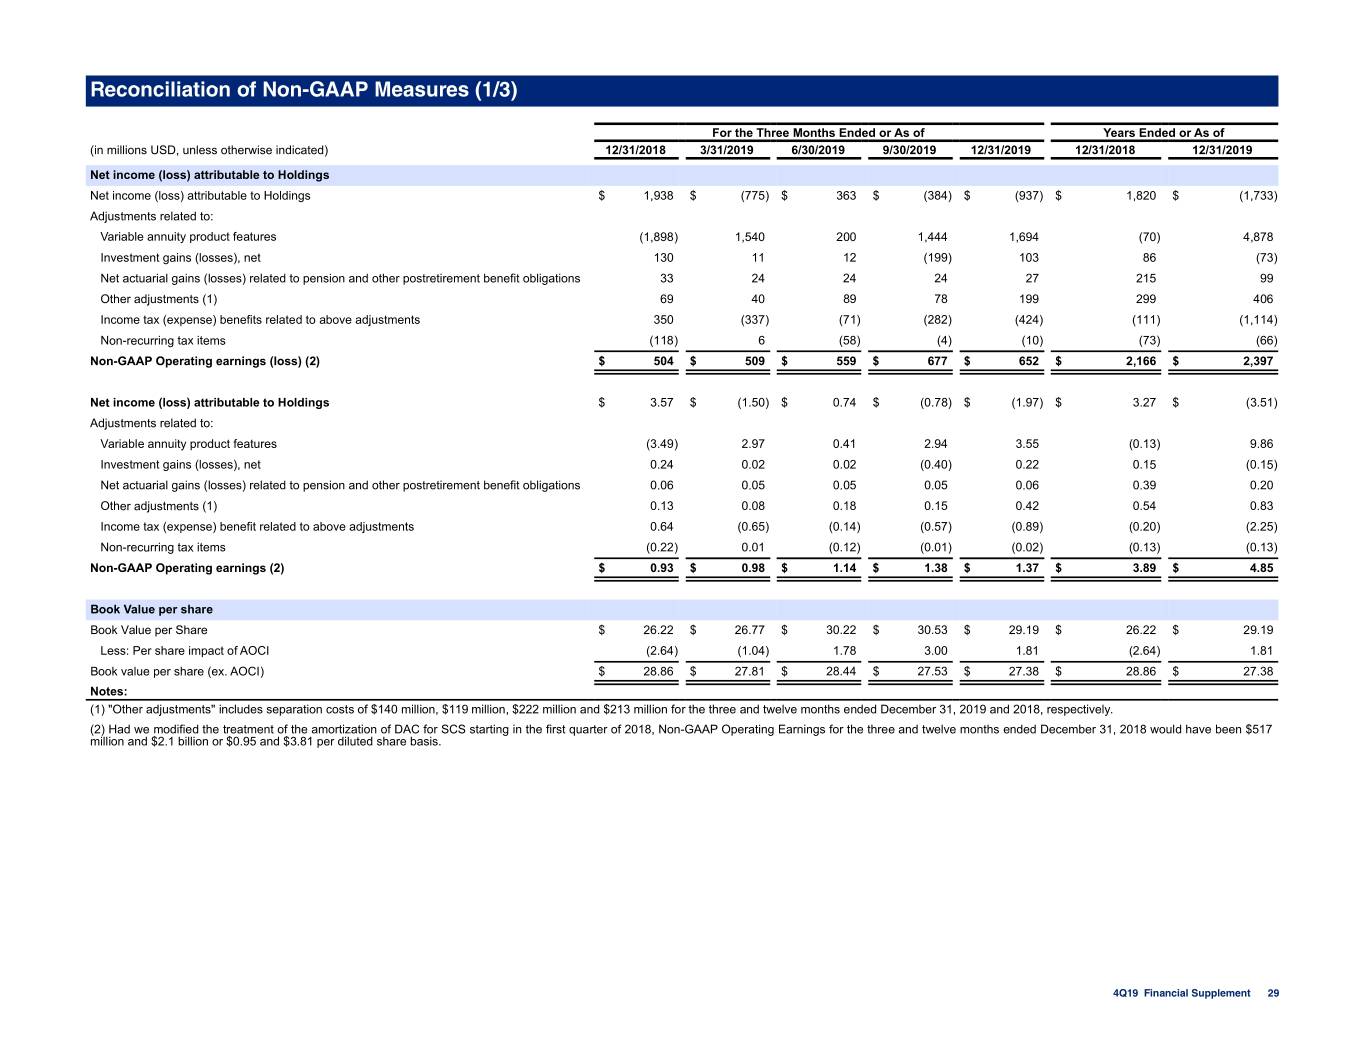
Reconciliation of Non-GAAP Measures (1/3) For the Three Months Ended or As of Years Ended or As of (in millions USD, unless otherwise indicated) 12/31/2018 3/31/2019 6/30/2019 9/30/2019 12/31/2019 12/31/2018 12/31/2019 Net income (loss) attributable to Holdings Net income (loss) attributable to Holdings $ 1,938 $ (775) $ 363 $ (384) $ (937) $ 1,820 $ (1,733) Adjustments related to: Variable annuity product features (1,898) 1,540 200 1,444 1,694 (70) 4,878 Investment gains (losses), net 130 11 12 (199) 103 86 (73) Net actuarial gains (losses) related to pension and other postretirement benefit obligations 33 24 24 24 27 215 99 Other adjustments (1) 69 40 89 78 199 299 406 Income tax (expense) benefits related to above adjustments 350 (337) (71) (282) (424) (111) (1,114) Non-recurring tax items (118) 6 (58) (4) (10) (73) (66) Non-GAAP Operating earnings (loss) (2) $ 504 $ 509 $ 559 $ 677 $ 652 $ 2,166 $ 2,397 Net income (loss) attributable to Holdings $ 3.57 $ (1.50) $ 0.74 $ (0.78) $ (1.97) $ 3.27 $ (3.51) Adjustments related to: Variable annuity product features (3.49) 2.97 0.41 2.94 3.55 (0.13) 9.86 Investment gains (losses), net 0.24 0.02 0.02 (0.40) 0.22 0.15 (0.15) Net actuarial gains (losses) related to pension and other postretirement benefit obligations 0.06 0.05 0.05 0.05 0.06 0.39 0.20 Other adjustments (1) 0.13 0.08 0.18 0.15 0.42 0.54 0.83 Income tax (expense) benefit related to above adjustments 0.64 (0.65) (0.14) (0.57) (0.89) (0.20) (2.25) Non-recurring tax items (0.22) 0.01 (0.12) (0.01) (0.02) (0.13) (0.13) Non-GAAP Operating earnings (2) $ 0.93 $ 0.98 $ 1.14 $ 1.38 $ 1.37 $ 3.89 $ 4.85 Book Value per share Book Value per Share $ 26.22 $ 26.77 $ 30.22 $ 30.53 $ 29.19 $ 26.22 $ 29.19 Less: Per share impact of AOCI (2.64) (1.04) 1.78 3.00 1.81 (2.64) 1.81 Book value per share (ex. AOCI) $ 28.86 $ 27.81 $ 28.44 $ 27.53 $ 27.38 $ 28.86 $ 27.38 Notes: 561.0 561.0 561.0 561.1 560.3 561.0 560.8 (1) "Other adjustments" includes separation costs of $140 million, $119 million, $222 million and $213 million for the three and twelve months ended December 31, 2019 and 2018, respectively. (2) Had we modified the treatment of the amortization of DAC for SCS starting in the first quarter of 2018, Non-GAAP Operating Earnings for the three and twelve months ended December 31, 2018 would have been $517 million and $2.1 billion or $0.95 and $3.81 per diluted share basis. 4Q19 Financial Supplement 29
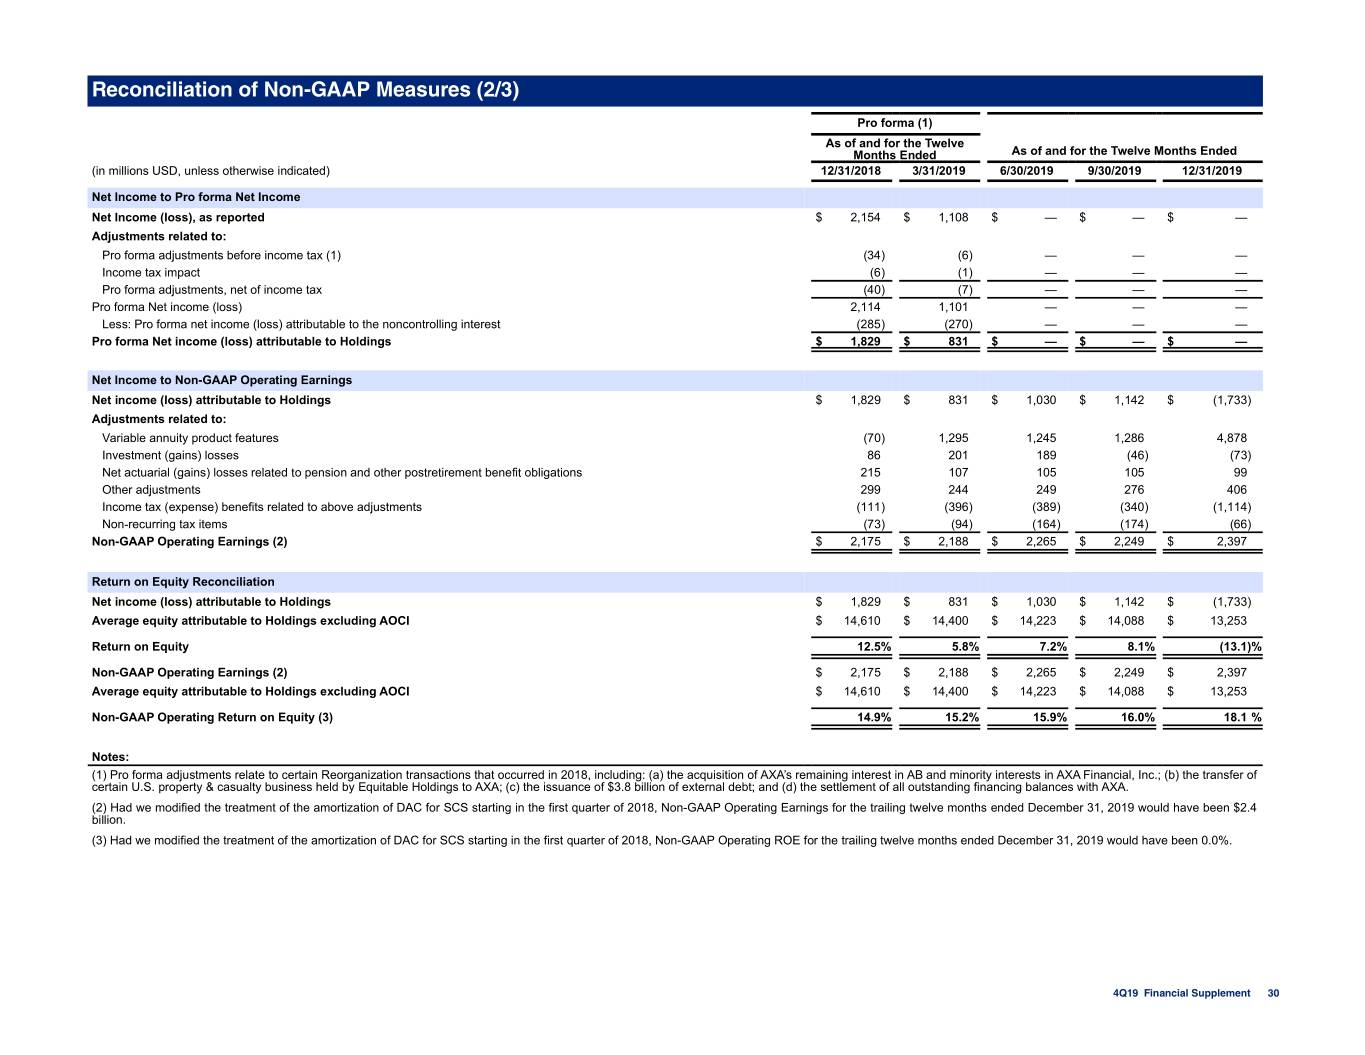
Reconciliation of Non-GAAP Measures (2/3) Pro forma (1) As of and for the Twelve Months Ended As of and for the Twelve Months Ended (in millions USD, unless otherwise indicated) 12/31/2018 3/31/2019 6/30/2019 9/30/2019 12/31/2019 Net Income to Pro forma Net Income Net Income (loss), as reported $ 2,154 $ 1,108 $ — $ — $ — Adjustments related to: Pro forma adjustments before income tax (1) (34) (6) — — — Income tax impact (6) (1) — — — Pro forma adjustments, net of income tax (40) (7) — — — Pro forma Net income (loss) 2,114 1,101 — — — Less: Pro forma net income (loss) attributable to the noncontrolling interest (285) (270) — — — Pro forma Net income (loss) attributable to Holdings $ 1,829 $ 831 $ — $ — $ — Net Income to Non-GAAP Operating Earnings Net income (loss) attributable to Holdings $ 1,829 $ 831 $ 1,030 $ 1,142 $ (1,733) Adjustments related to: Variable annuity product features (70) 1,295 1,245 1,286 4,878 Investment (gains) losses 86 201 189 (46) (73) Net actuarial (gains) losses related to pension and other postretirement benefit obligations 215 107 105 105 99 Other adjustments 299 244 249 276 406 Income tax (expense) benefits related to above adjustments (111) (396) (389) (340) (1,114) Non-recurring tax items (73) (94) (164) (174) (66) Non-GAAP Operating Earnings (2) $ 2,175 $ 2,188 $ 2,265 $ 2,249 $ 2,397 Return on Equity Reconciliation Net income (loss) attributable to Holdings $ 1,829 $ 831 $ 1,030 $ 1,142 $ (1,733) Average equity attributable to Holdings excluding AOCI $ 14,610 $ 14,400 $ 14,223 $ 14,088 $ 13,253 Return on Equity 12.5% 5.8% 7.2% 8.1% (13.1)% Non-GAAP Operating Earnings (2) $ 2,175 $ 2,188 $ 2,265 $ 2,249 $ 2,397 Average equity attributable to Holdings excluding AOCI $ 14,610 $ 14,400 $ 14,223 $ 14,088 $ 13,253 Non-GAAP Operating Return on Equity (3) 14.9% 15.2% 15.9% 16.0% 18.1 % Notes: (1) Pro forma adjustments relate to certain Reorganization transactions that occurred in 2018, including: (a) the acquisition of AXA’s remaining interest in AB and minority interests in AXA Financial, Inc.; (b) the transfer of certain U.S. property & casualty business held by Equitable Holdings to AXA; (c) the issuance of $3.8 billion of external debt; and (d) the settlement of all outstanding financing balances with AXA. (2) Had we modified the treatment of the amortization of DAC for SCS starting in the first quarter of 2018, Non-GAAP Operating Earnings for the trailing twelve months ended December 31, 2019 would have been $2.4 billion. (3) Had we modified the treatment of the amortization of DAC for SCS starting in the first quarter of 2018, Non-GAAP Operating ROE for the trailing twelve months ended December 31, 2019 would have been 0.0%. 4Q19 Financial Supplement 30
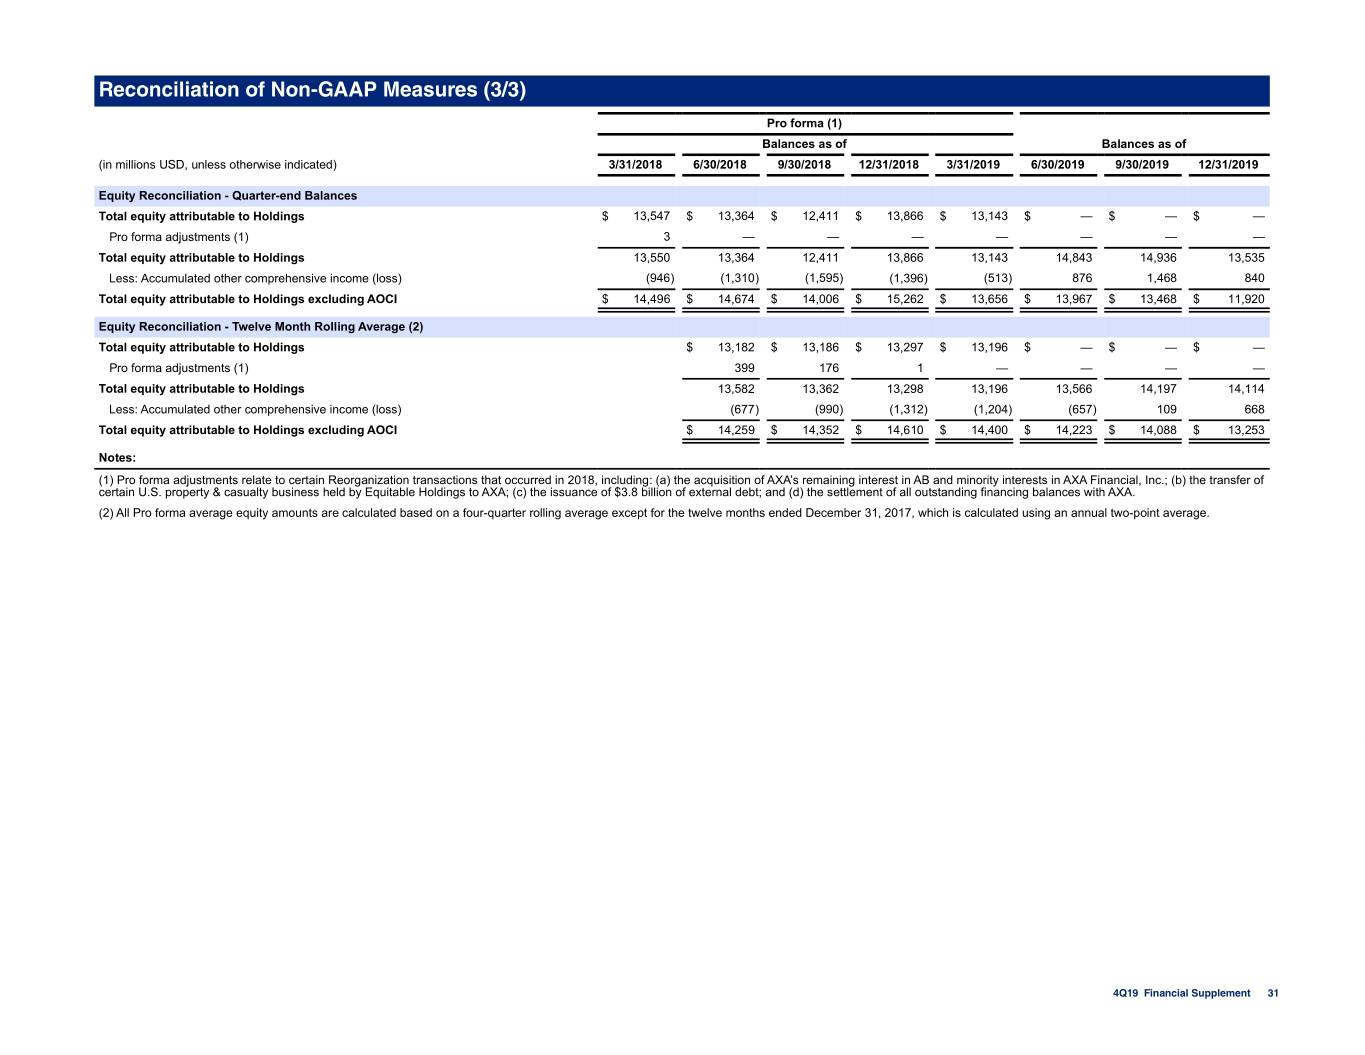
Reconciliation of Non-GAAP Measures (3/3) Pro forma (1) Balances as of Balances as of (in millions USD, unless otherwise indicated) 3/31/2018 6/30/2018 9/30/2018 12/31/2018 3/31/2019 6/30/2019 9/30/2019 12/31/2019 Equity Reconciliation - Quarter-end Balances Total equity attributable to Holdings $ 13,547 $ 13,364 $ 12,411 $ 13,866 $ 13,143 $ — $ — $ — Pro forma adjustments (1) 3 — — — — — — — Total equity attributable to Holdings 13,550 13,364 12,411 13,866 13,143 14,843 14,936 13,535 Less: Accumulated other comprehensive income (loss) (946) (1,310) (1,595) (1,396) (513) 876 1,468 840 Total equity attributable to Holdings excluding AOCI $ 14,496 $ 14,674 $ 14,006 $ 15,262 $ 13,656 $ 13,967 $ 13,468 $ 11,920 Equity Reconciliation - Twelve Month Rolling Average (2) Total equity attributable to Holdings $ 13,182 $ 13,186 $ 13,297 $ 13,196 $ — $ — $ — Pro forma adjustments (1) 399 176 1 — — — — Total equity attributable to Holdings 13,582 13,362 13,298 13,196 13,566 14,197 14,114 Less: Accumulated other comprehensive income (loss) (677) (990) (1,312) (1,204) (657) 109 668 Total equity attributable to Holdings excluding AOCI $ 14,259 $ 14,352 $ 14,610 $ 14,400 $ 14,223 $ 14,088 $ 13,253 Notes: (1) Pro forma adjustments relate to certain Reorganization transactions that occurred in 2018, including: (a) the acquisition of AXA’s remaining interest in AB and minority interests in AXA Financial, Inc.; (b) the transfer of certain U.S. property & casualty business held by Equitable Holdings to AXA; (c) the issuance of $3.8 billion of external debt; and (d) the settlement of all outstanding financing balances with AXA. (2) All Pro forma average equity amounts are calculated based on a four-quarter rolling average except for the twelve months ended December 31, 2017, which is calculated using an annual two-point average. 4Q19 Financial Supplement 31
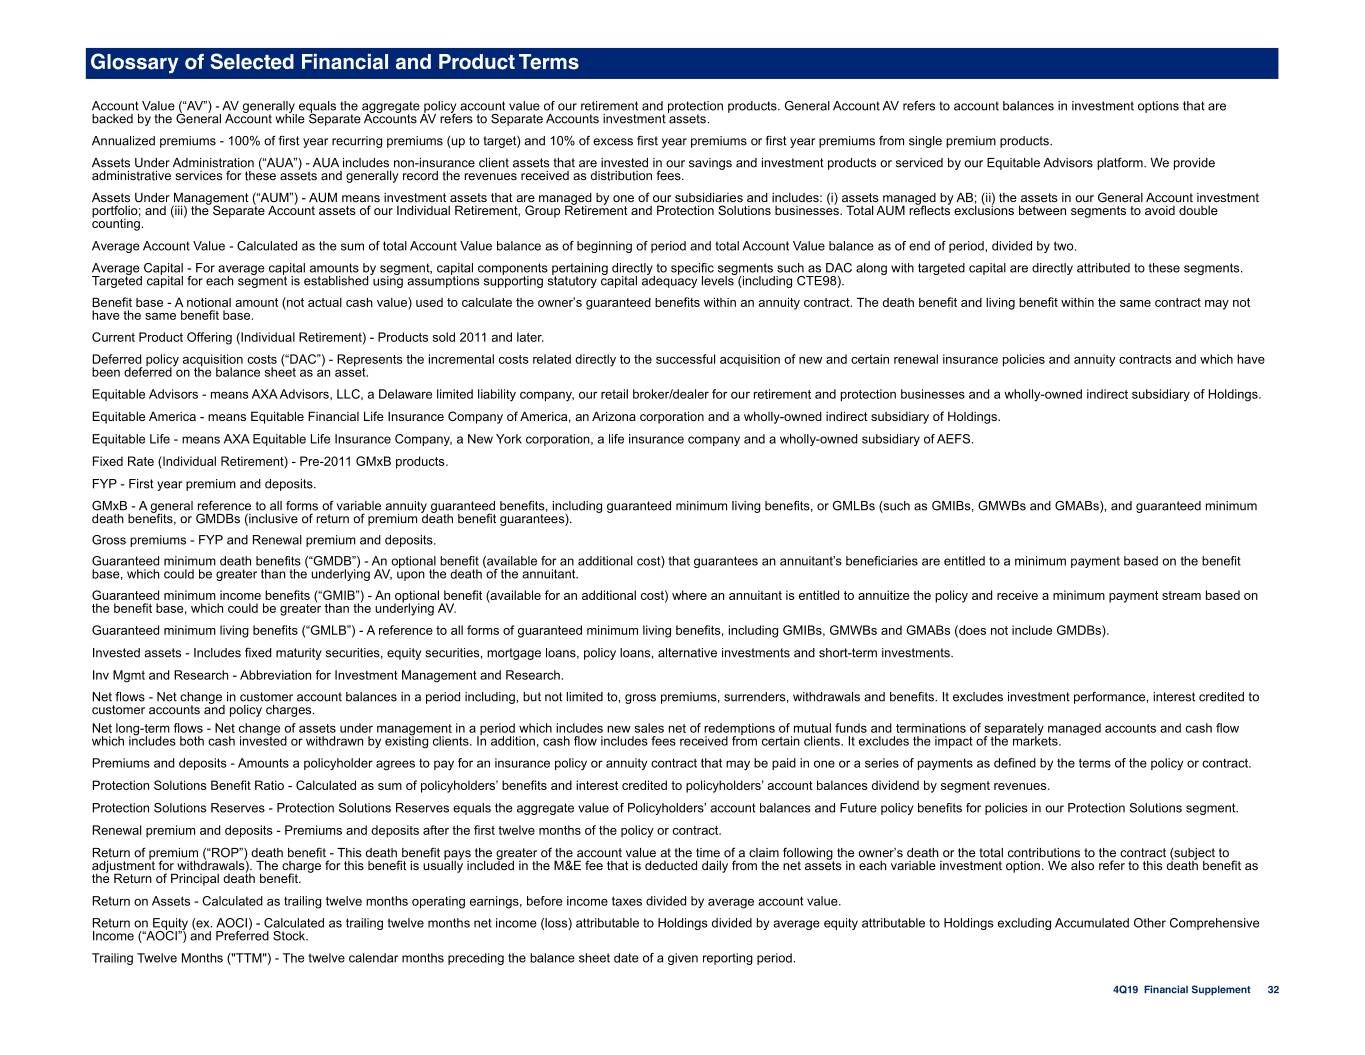
Glossary of Selected Financial and Product Terms Account Value (“AV”) - AV generally equals the aggregate policy account value of our retirement and protection products. General Account AV refers to account balances in investment options that are backed by the General Account while Separate Accounts AV refers to Separate Accounts investment assets. Annualized premiums - 100% of first year recurring premiums (up to target) and 10% of excess first year premiums or first year premiums from single premium products. Assets Under Administration (“AUA”) - AUA includes non-insurance client assets that are invested in our savings and investment products or serviced by our Equitable Advisors platform. We provide administrative services for these assets and generally record the revenues received as distribution fees. Assets Under Management (“AUM”) - AUM means investment assets that are managed by one of our subsidiaries and includes: (i) assets managed by AB; (ii) the assets in our General Account investment portfolio; and (iii) the Separate Account assets of our Individual Retirement, Group Retirement and Protection Solutions businesses. Total AUM reflects exclusions between segments to avoid double counting. Average Account Value - Calculated as the sum of total Account Value balance as of beginning of period and total Account Value balance as of end of period, divided by two. Average Capital - For average capital amounts by segment, capital components pertaining directly to specific segments such as DAC along with targeted capital are directly attributed to these segments. Targeted capital for each segment is established using assumptions supporting statutory capital adequacy levels (including CTE98). Benefit base - A notional amount (not actual cash value) used to calculate the owner’s guaranteed benefits within an annuity contract. The death benefit and living benefit within the same contract may not have the same benefit base. Current Product Offering (Individual Retirement) - Products sold 2011 and later. Deferred policy acquisition costs (“DAC”) - Represents the incremental costs related directly to the successful acquisition of new and certain renewal insurance policies and annuity contracts and which have been deferred on the balance sheet as an asset. Equitable Advisors - means AXA Advisors, LLC, a Delaware limited liability company, our retail broker/dealer for our retirement and protection businesses and a wholly-owned indirect subsidiary of Holdings. Equitable America - means Equitable Financial Life Insurance Company of America, an Arizona corporation and a wholly-owned indirect subsidiary of Holdings. Equitable Life - means AXA Equitable Life Insurance Company, a New York corporation, a life insurance company and a wholly-owned subsidiary of AEFS. Fixed Rate (Individual Retirement) - Pre-2011 GMxB products. FYP - First year premium and deposits. GMxB - A general reference to all forms of variable annuity guaranteed benefits, including guaranteed minimum living benefits, or GMLBs (such as GMIBs, GMWBs and GMABs), and guaranteed minimum death benefits, or GMDBs (inclusive of return of premium death benefit guarantees). Gross premiums - FYP and Renewal premium and deposits. Guaranteed minimum death benefits (“GMDB”) - An optional benefit (available for an additional cost) that guarantees an annuitant’s beneficiaries are entitled to a minimum payment based on the benefit base, which could be greater than the underlying AV, upon the death of the annuitant. Guaranteed minimum income benefits (“GMIB”) - An optional benefit (available for an additional cost) where an annuitant is entitled to annuitize the policy and receive a minimum payment stream based on the benefit base, which could be greater than the underlying AV. Guaranteed minimum living benefits (“GMLB”) - A reference to all forms of guaranteed minimum living benefits, including GMIBs, GMWBs and GMABs (does not include GMDBs). Invested assets - Includes fixed maturity securities, equity securities, mortgage loans, policy loans, alternative investments and short-term investments. Inv Mgmt and Research - Abbreviation for Investment Management and Research. Net flows - Net change in customer account balances in a period including, but not limited to, gross premiums, surrenders, withdrawals and benefits. It excludes investment performance, interest credited to customer accounts and policy charges. Net long-term flows - Net change of assets under management in a period which includes new sales net of redemptions of mutual funds and terminations of separately managed accounts and cash flow which includes both cash invested or withdrawn by existing clients. In addition, cash flow includes fees received from certain clients. It excludes the impact of the markets. Premiums and deposits - Amounts a policyholder agrees to pay for an insurance policy or annuity contract that may be paid in one or a series of payments as defined by the terms of the policy or contract. Protection Solutions Benefit Ratio - Calculated as sum of policyholders’ benefits and interest credited to policyholders’ account balances dividend by segment revenues. Protection Solutions Reserves - Protection Solutions Reserves equals the aggregate value of Policyholders’ account balances and Future policy benefits for policies in our Protection Solutions segment. Renewal premium and deposits - Premiums and deposits after the first twelve months of the policy or contract. Return of premium (“ROP”) death benefit - This death benefit pays the greater of the account value at the time of a claim following the owner’s death or the total contributions to the contract (subject to adjustment for withdrawals). The charge for this benefit is usually included in the M&E fee that is deducted daily from the net assets in each variable investment option. We also refer to this death benefit as the Return of Principal death benefit. Return on Assets - Calculated as trailing twelve months operating earnings, before income taxes divided by average account value. Return on Equity (ex. AOCI) - Calculated as trailing twelve months net income (loss) attributable to Holdings divided by average equity attributable to Holdings excluding Accumulated Other Comprehensive Income (“AOCI”) and Preferred Stock. Trailing Twelve Months ("TTM") - The twelve calendar months preceding the balance sheet date of a given reporting period. 4Q19 Financial Supplement 32
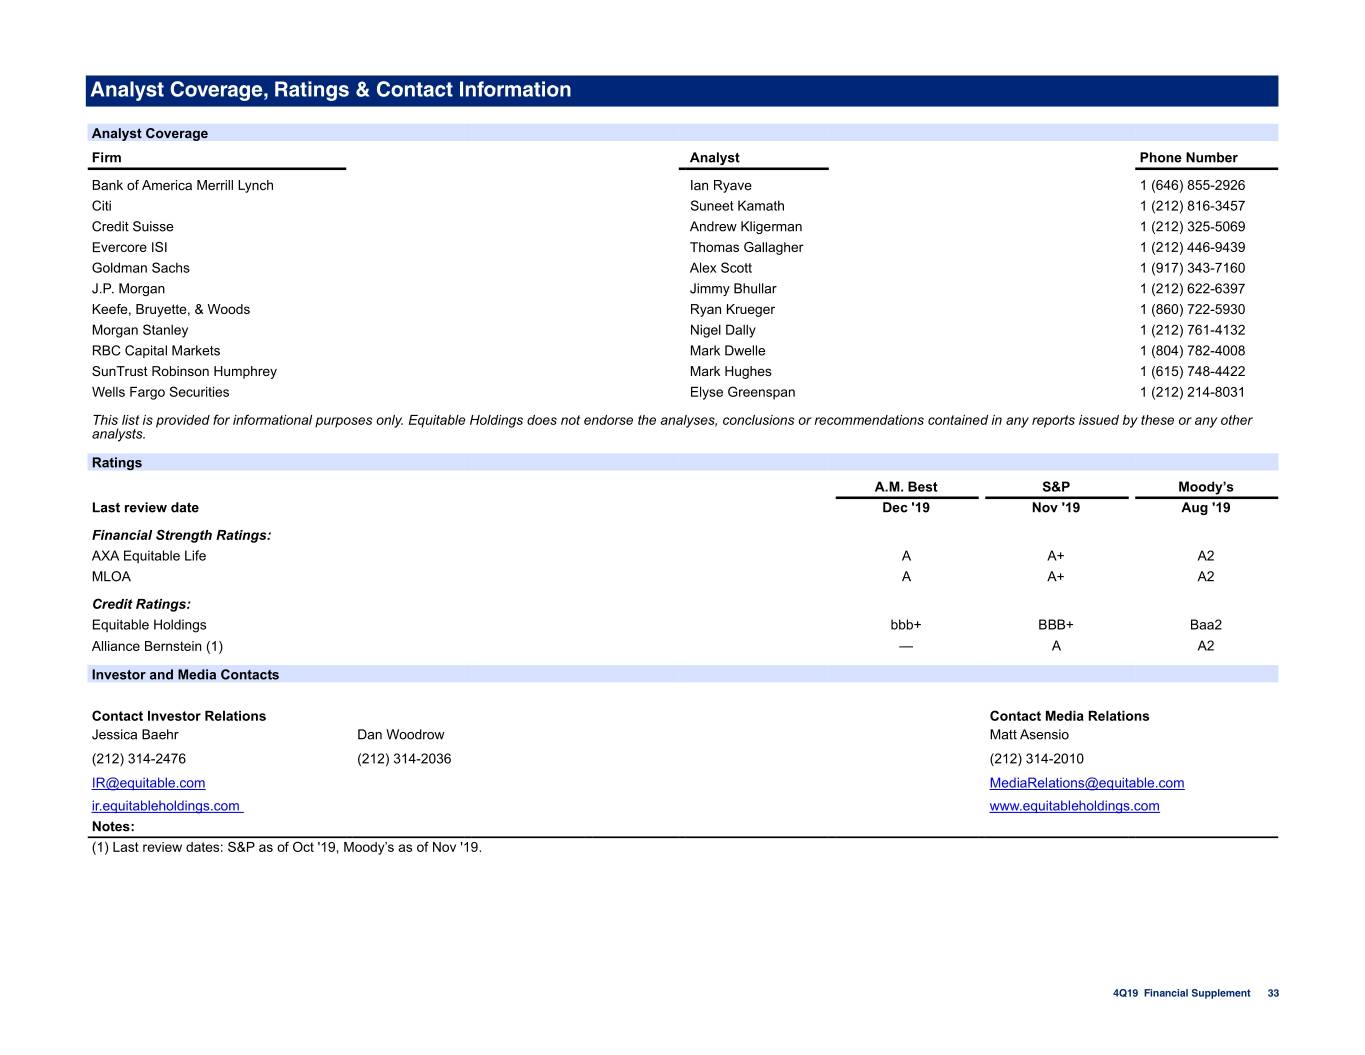
Analyst Coverage, Ratings & Contact Information Analyst Coverage Firm Analyst Phone Number Bank of America Merrill Lynch Ian Ryave 1 (646) 855-2926 Citi Suneet Kamath 1 (212) 816-3457 Credit Suisse Andrew Kligerman 1 (212) 325-5069 Evercore ISI Thomas Gallagher 1 (212) 446-9439 Goldman Sachs Alex Scott 1 (917) 343-7160 J.P. Morgan Jimmy Bhullar 1 (212) 622-6397 Keefe, Bruyette, & Woods Ryan Krueger 1 (860) 722-5930 Morgan Stanley Nigel Dally 1 (212) 761-4132 RBC Capital Markets Mark Dwelle 1 (804) 782-4008 SunTrust Robinson Humphrey Mark Hughes 1 (615) 748-4422 Wells Fargo Securities Elyse Greenspan 1 (212) 214-8031 This list is provided for informational purposes only. Equitable Holdings does not endorse the analyses, conclusions or recommendations contained in any reports issued by these or any other analysts. Ratings A.M. Best S&P Moody’s Last review date Dec '19 Nov '19 Aug '19 Financial Strength Ratings: AXA Equitable Life A A+ A2 MLOA A A+ A2 Credit Ratings: Equitable Holdings bbb+ BBB+ Baa2 Alliance Bernstein (1) — A A2 Investor and Media Contacts Contact Investor Relations Contact Media Relations Jessica Baehr Dan Woodrow Matt Asensio (212) 314-2476 (212) 314-2036 (212) 314-2010 [email protected] [email protected] ir.equitableholdings.com www.equitableholdings.com Notes: (1) Last review dates: S&P as of Oct '19, Moody’s as of Nov '19. 4Q19 Financial Supplement 33