0000072741
false
8-K
2020-05-06
false
0000023426
¨
¨
¨
¨
8-K
2020-05-06
false
0000013372
¨
¨
¨
¨
0000315256
¨
8-K
2020-05-06
false
¨
¨
¨
0000072741
2020-05-05
2020-05-06
0000072741
es:TheConnecticutLightAndPowerCompanyMember
2020-05-05
2020-05-06
0000072741
es:NstarElectricCompanyMember
2020-05-05
2020-05-06
0000072741
es:PublicServiceCompanyOfNewHampshireMember
2020-05-05
2020-05-06
iso4217:USD
xbrli:shares
iso4217:USD
xbrli:shares
UNITED STATES
SECURITIES AND EXCHANGE COMMISSION
Washington, D.C. 20549
FORM 8-K
CURRENT REPORT
Pursuant to Section 13 or 15(d) of the
Securities Exchange Act of 1934
Date of Report (Date of earliest event
reported): May 6, 2020 (May 6, 2020)
Commission
File Number |
Registrant; State of Incorporation
Address;
and Telephone Number |
I.R.S. Employer
Identification No. |
| |
|
|
| 1-5324 |
EVERSOURCE
ENERGY
(a Massachusetts voluntary association)
300 Cadwell Drive
Springfield, Massachusetts 01104
Telephone: (800) 286-5000 |
04-2147929 |
| |
|
|
| 0-00404 |
THE
CONNECTICUT LIGHT AND POWER COMPANY
(a Connecticut corporation)
107 Selden Street
Berlin, Connecticut 06037-1616
Telephone: (800) 286-5000 |
06-0303850 |
| |
|
|
| 1-02301 |
NSTAR
ELECTRIC COMPANY
(a Massachusetts corporation)
800 Boylston Street
Boston, Massachusetts 02199
Telephone: (800) 286-5000 |
04-1278810 |
| |
|
|
| 1-6392 |
PUBLIC
SERVICE COMPANY OF NEW HAMPSHIRE
(a New Hampshire corporation)
Energy Park
780 North Commercial Street
Manchester, New Hampshire 03101-1134
Telephone: (800) 286-5000 |
02-0181050 |
Not Applicable
(Former name or former address, if changed
since last report)
Check the appropriate box below if the Form 8-K filing is intended
to simultaneously satisfy the filing obligation of the registrant under any of the following provisions (see General Instruction
A.2. below):
| ¨ | Written communications pursuant to Rule 425 under the
Securities Act (17 CFR 230.425) |
| ¨ | Soliciting material pursuant to Rule 14a-12 under the
Exchange Act (17 CFR 240.14a-12) |
| ¨ | Pre-commencement communications pursuant to Rule 14d-2(b) under the Exchange Act (17 CFR 240.14d-2(b)) |
| ¨ | Pre-commencement communications pursuant to Rule 13e-4(c) under the Exchange Act (17 CFR 240.13e-4(c)) |
| Securities registered pursuant to Section 12(b) of the Act: |
| Registrant |
Title of each class |
Trading
Symbol(s) |
Name of each exchange on
which registered |
| Eversource Energy |
Common Shares, $5.00 par value per share
|
ES |
New York Stock Exchange |
| The Connecticut Light and Power Company |
None |
N/A |
N/A |
| NSTAR Electric Company |
None |
N/A |
N/A |
| Public Service Company of New Hampshire |
None |
N/A |
N/A |
Indicate by check mark whether the registrant is an emerging
growth company as defined in Rule 405 of the Securities Act of 1933 (17 CFR §230.405) or Rule 12b-2 of the Securities
Exchange Act of 1934 (17 CFR §240.12b-2).
| |
Emerging
growth
company |
| Eversource Energy |
¨ |
| The Connecticut Light and Power Company |
¨ |
| NSTAR Electric Company |
¨ |
| Public Service Company of New Hampshire |
¨ |
If an emerging growth company, indicate by check mark if the
registrant has elected not to use the extended transition period for complying with any new or revised financial accounting standards
provided pursuant to Section 13(a) of the Exchange Act.
| Eversource Energy |
¨ |
| The Connecticut Light and Power Company |
¨ |
| NSTAR Electric Company |
¨ |
| Public Service Company of New Hampshire |
¨ |
Section 2 Financial Information
| Item 2.02 | Results of Operations and Financial Conditions. |
On May 6, 2020, Eversource Energy issued
a news release announcing its unaudited results of operations for the three months ended March 31, 2020 and related financial information
for certain of its subsidiaries as of and for the same period. A copy of the news release and related unaudited financial reports
are attached as Exhibits 99.1 and 99.2, and are incorporated herein by reference thereto.
The information contained in this Item 2.02,
including Exhibits 99.1 and 99.2, shall not be deemed “filed” with the Securities and Exchange Commission (“SEC”)
nor incorporated by reference in any registration statement filed by Eversource Energy or any subsidiary thereof under the Securities
Act of 1933, as amended (the “Securities Act”), unless specified otherwise.
Section 7 Regulation FD
| Item 7.01 | Regulation FD Disclosure. |
On May 7, 2020, Eversource Energy will webcast
a conference call with financial analysts during which senior management will discuss the company’s financial performance
through the first quarter of 2020. The webcast will be accessible from the Investors section of the Eversource Energy website at
www.eversource.com. Attached as Exhibit 99.3 and incorporated herein by reference are the slides to be discussed by Eversource
Energy during the conference call.
The information contained in this Item 7.01,
including Exhibit 99.3, shall not be deemed “filed” with the SEC nor incorporated by reference into any registration
statement filed by Eversource Energy or any subsidiary thereof under the Securities Act, unless specified otherwise.
Section 9 Financial Statements
and Exhibits
| Item 9.01 | Financial Statements and Exhibits. |
[The remainder of this page left blank intentionally.]
SIGNATURE
Pursuant to the requirements of the Securities
Exchange Act of 1934, the registrants have duly caused this report to be signed on their behalf by the undersigned hereunto duly
authorized.
| |
EVERSOURCE ENERGY |
| |
THE CONNECTICUT LIGHT AND POWER COMPANY |
| |
NSTAR ELECTRIC COMPANY |
| |
PUBLIC SERVICE COMPANY OF NEW HAMPSHIRE |
| |
(Registrants) |
| |
|
| |
|
| |
|
| May 6, 2020 |
By: |
/s/ JAY S. BUTH |
| |
|
Jay S. Buth |
| |
|
Vice President, Controller and |
| |
|
Chief Accounting Officer |
| Document Type |
8-K |
| Document Period End Date |
2020-05-06 |
| Amendment Flag |
false |
| CIK |
0000023426 |
| THE
CONNECTICUT LIGHT_Written communications |
¨ |
| THE
CONNECTICUT LIGHT_Soliciting material pursuant to |
¨ |
| THE
CONNECTICUT LIGHT_Pre-commencement communications pursuant |
¨ |
| THE
CONNECTICUT LIGHT_Pre-commencement communications pursuant |
¨ |
| Document Type |
8-K |
| Document Period End Date |
2020-05-06 |
| Amendment Flag |
false |
| CIK |
0000013372 |
| NSTAR
ELECTRIC_Written communications |
¨ |
| NSTAR
ELECTRIC_Soliciting material pursuant to |
¨ |
| NSTAR
ELECTRIC_Pre-commencement communications pursuant |
¨ |
| NSTAR
ELECTRIC_Pre-commencement communications pursuant |
¨ |
| CIK |
0000315256 |
| Public Service Company_Written communications |
¨ |
| Document Type |
8-K |
| Document Period End Date |
2020-05-06 |
| Amendment Flag |
false |
| Public Service Company_Soliciting material pursuant to |
¨ |
| Public Service Company_Pre-commencement communications pursuant |
¨ |
| Public Service Company_Pre-commencement communications pursuant |
¨ |
| |
|
| |
|
| |
|
Exhibit 99.1
 | 56 Prospect St., Hartford, Connecticut 06103-2818
800 Boylston St., Boston, Massachusetts 02199
|

Eversource
Energy Reports First Quarter 2020 Results
(HARTFORD, Conn. and BOSTON, Mass. – May
6, 2020) Eversource Energy (NYSE: ES) today reported first quarter 2020 earnings of $334.8 million, or $1.01 per share, compared
with earnings of $308.7 million, or $0.97 per share, in the first quarter of 2019. Results for 2020 include an after-tax charge
of $3.5 million, or $0.01 per share, associated with Eversource’s pending acquisition of the assets of Columbia Gas of Massachusetts.
Absent that charge, Eversource Energy earned $338.3 million1, or $1.02 per share1, in the first quarter of
2020.
Also today, the Eversource Energy Board of Trustees declared
a regular quarterly dividend of $0.5675 per share, payable June 30, 2020 to shareholders of record as of May 20, 2020. Additionally,
the company today reaffirmed its 2020 earnings per share (EPS) guidance of $3.60 to $3.70 and its projected 5 to 7 percent long-term
EPS growth rate.
“Our 8,300 employees do an outstanding job delivering
safe and reliable service to our 4 million customers, despite the extreme challenges posed by the COVID-19 crisis,” said
Jim Judge, Eversource chairman, president and chief executive officer. “Even when challenged by a late winter snowstorm in
New Hampshire in March and an unusual coastal storm in Connecticut and Massachusetts in April, we safely and efficiently restored
power to customers who are more dependent than ever on our critical service.”
Electric Distribution
Eversource Energy’s electric distribution segment earned
$130.1 million in the first quarter of 2020, compared with earnings of $120.1 million in the first quarter of 2019. Improved results
were due primarily to higher distribution revenues and lower storm restoration costs, partially offset by higher depreciation,
interest and property tax expense.
Electric Transmission
Eversource Energy’s transmission segment earned
$126.8 million in the first quarter of 2020, compared with earnings of $118.2 million in the first quarter of 2019. Higher transmission
earnings were primarily due to additional electric transmission system investment.
Natural Gas Distribution
Eversource Energy’s natural gas distribution segment
earned $84.4 million in the first quarter of 2020, compared with earnings of $76.5 million in the first quarter of 2019. Improved
results were due primarily to higher revenues, partially offset by higher operation, maintenance and depreciation expense.
Water Distribution
Eversource Energy’s water distribution segment earned
$2.1 million in the first quarter of 2020, compared with $0.9 million in the first quarter of 2019. The increase was due primarily
to higher revenues.
Parent and other companies
Parent and other companies had a net loss of $5.1
million in the first quarter of 2020, compared with a loss of $7 million in the first quarter of 2019. The reduced loss was due
in part to lower interest expense.
The following table reconciles consolidated earnings
per share for the first quarters of 2020 and 2019:
| | |
| |
First Quarter | |
| 2019 | |
Reported EPS | |
$ | 0.97 | |
| | |
Higher electric and natural gas distribution revenues in 2020 offset by higher depreciation and property tax expense and $0.01/share dilution | |
| 0.02 | |
| | |
Higher level of electric and natural gas distribution investment trackers in 2020 offset by $0.01/share dilution | |
| 0.02 | |
| | |
Higher transmission earnings offset by $0.02/share dilution | |
| 0.01 | |
| | |
Columbia Gas of MA acquisition charge | |
| (0.01 | ) |
| 2020 | |
Reported EPS | |
$ | 1.01 | |
Financial results for the first quarters of 2020 and 2019 for
Eversource Energy’s business segments and parent and other companies are noted below:
Three months ended:
| (in millions, except EPS) | |
March 31, 2020 | | |
March 31, 2019 | | |
Increase/
(Decrease) | | |
2020 EPS1 | |
| Electric Distribution | |
$ | 130.1 | | |
$ | 120.1 | | |
$ | 10.0 | | |
$ | 0.39 | |
| Electric Transmission | |
| 126.8 | | |
| 118.2 | | |
| 8.6 | | |
| 0.38 | |
| Natural Gas Distribution | |
| 84.4 | | |
| 76.5 | | |
| 7.9 | | |
| 0.25 | |
| Water Distribution | |
| 2.1 | | |
| 0.9 | | |
| 1.2 | | |
| 0.01 | |
| Parent and Other Companies | |
| (5.1 | ) | |
| (7.0 | ) | |
| 1.9 | | |
| (0.01 | ) |
| Columbia Gas of MA acquisition charge | |
| (3.5 | ) | |
| --- | | |
| (3.5 | ) | |
| (0.01 | ) |
| Reported Earnings | |
$ | 334.8 | | |
$ | 308.7 | | |
$ | 26.1 | | |
$ | 1.01 | |
Eversource Energy has approximately 336 million common
shares outstanding. It operates New England’s largest energy delivery system and serves approximately 4 million electric,
natural gas and water utility customers in Connecticut, Massachusetts and New Hampshire.
CONTACT:
Jeffrey R. Kotkin
(860) 665-5154
| Note: Eversource Energy will webcast a conference call with senior management on May 7, 2020, beginning at 9 a.m. Eastern Time. The webcast and associated slides can be accessed through Eversource’s website at www.eversource.com. |
1 All per-share amounts in this presentation
are reported on a diluted basis. The only common equity securities that are publicly traded are common shares of Eversource Energy.
The earnings and EPS of each business do not represent a direct legal interest in the assets and liabilities allocated to such
business, but rather represent a direct interest in Eversource Energy's assets and liabilities as a whole. EPS by business is a
non-GAAP (not determined using generally accepted accounting principles) measure that is calculated by dividing the net income
or loss attributable to common shareholders of each business by the weighted average diluted Eversource Energy common shares outstanding
for the period. Earnings discussions also include non-GAAP financial measures referencing 2020 earnings and EPS excluding certain
acquisition costs and Q2 2019 earnings and EPS excluding the NPT impairment charge. Eversource Energy uses these non-GAAP financial
measures to evaluate and provide details of earnings results by business and to more fully compare and explain 2020 and 2019 results
without including these items. Management believes the acquisition costs and the NPT impairment charge are not indicative of Eversource
Energy’s ongoing costs and performance. Due to the nature and significance of these items on net income attributable
to common shareholders, management believes that the non-GAAP presentation is a more meaningful representation of Eversource Energy’s
financial performance and provides additional and useful information to readers in analyzing historical and future performance
of the business. Non-GAAP financial measures should not be considered as alternatives to Eversource Energy’s consolidated
net income attributable to common shareholders or EPS determined in accordance with GAAP as indicators of Eversource Energy’s
operating performance.
This document includes statements concerning Eversource
Energy’s expectations, beliefs, plans, objectives, goals, strategies, assumptions of future events, future financial performance
or growth and other statements that are not historical facts. These statements are “forward-looking statements” within
the meaning of the Private Securities Litigation Reform Act of 1995. Generally, readers can identify these forward-looking
statements through the use of words or phrases such as “estimate,” “expect,” “anticipate,”
“intend,” “plan,” “project,” “believe,” “forecast,” “should,”
“could” and other similar expressions. Forward-looking statements involve risks and uncertainties that may cause
actual results or outcomes to differ materially from those included in the forward-looking statements. Factors that may
cause actual results to differ materially from those included in the forward-looking statements include, but are not limited to:
cyberattacks or breaches, including those resulting in the compromise of the confidentiality of our proprietary information and
the personal information of our customers; disruptions in the capital markets or other events that make our access to necessary
capital more difficult or costly; the negative impacts of the novel coronavirus (COVID-19) pandemic on our customers, vendors,
employees, regulators, and operations; changes in economic conditions, including impact on interest rates, tax policies, and customer
demand and payment ability; ability or inability to commence and complete our major strategic development projects and opportunities,
acts of war or terrorism, physical attacks or grid disturbances that may damage and disrupt our electric transmission and electric,
natural gas, and water distribution systems; actions or inaction of local, state and federal regulatory, public policy and taxing
bodies, substandard performance of third-party suppliers and service providers; fluctuations in weather patterns, including extreme
weather due to climate change; changes in business conditions, which could include disruptive technology or development of alternative
energy sources related to our current or future business model; contamination of, or disruption in, our water supplies; changes
in levels or timing of capital expenditures, including the Columbia Gas of Massachusetts asset acquisition; changes in laws, regulations
or regulatory policy, including compliance with environmental laws and regulations; changes in accounting standards and financial
reporting regulations; actions of rating agencies; and other presently unknown or unforeseen factors.
Other risk factors are detailed in Eversource Energy’s
reports filed with the Securities and Exchange Commission (SEC). They are updated as necessary and available on Eversource Energy’s
website at www.eversource.com and on the SEC’s website at www.sec.gov. All such factors are difficult to predict and contain
uncertainties that may materially affect Eversource Energy’s actual results, many of which are beyond our control. You should
not place undue reliance on the forward-looking statements, as each speaks only as of the date on which such statement is made,
and, except as required by federal securities laws, Eversource Energy undertakes no obligation to update any forward-looking statement
or statements to reflect events or circumstances after the date on which such statement is made or to reflect the occurrence of
unanticipated events.
# # #
Exhibit 99.2
EVERSOURCE ENERGY AND SUBSIDIARIES
CONDENSED CONSOLIDATED BALANCE SHEETS
(Unaudited)
| (Thousands of Dollars) | |
As of March
31, 2020 | | |
As of December
31, 2019 | |
| ASSETS | |
| | | |
| | |
| Current Assets: | |
| | | |
| | |
| Cash | |
$ | 47,425 | | |
$ | 15,432 | |
| Receivables, Net (net of allowance for uncollectible accounts of $262,078 and $224,821 as of March 31, 2020 and December 31, 2019, respectively) | |
| 1,018,941 | | |
| 989,383 | |
| Unbilled Revenues | |
| 155,224 | | |
| 181,006 | |
| Fuel, Materials, Supplies and REC Inventory | |
| 286,498 | | |
| 235,471 | |
| Regulatory Assets | |
| 785,125 | | |
| 651,112 | |
| Prepayments and Other Current Assets | |
| 269,457 | | |
| 342,135 | |
| Total Current Assets | |
| 2,562,670 | | |
| 2,414,539 | |
| Property, Plant and Equipment, Net | |
| 28,041,356 | | |
| 27,585,470 | |
| Deferred Debits and Other Assets: | |
| | | |
| | |
| Regulatory Assets | |
| 4,778,321 | | |
| 4,863,639 | |
| Goodwill | |
| 4,427,266 | | |
| 4,427,266 | |
| Investments in Unconsolidated Affiliates | |
| 876,328 | | |
| 871,633 | |
| Marketable Securities | |
| 418,715 | | |
| 449,130 | |
| Other Long-Term Assets | |
| 544,330 | | |
| 512,238 | |
| Total Deferred Debits and Other Assets | |
| 11,044,960 | | |
| 11,123,906 | |
| Total Assets | |
$ | 41,648,986 | | |
$ | 41,123,915 | |
| | |
| | | |
| | |
| LIABILITIES AND CAPITALIZATION | |
| | | |
| | |
| Current Liabilities: | |
| | | |
| | |
| Notes Payable | |
$ | 661,420 | | |
$ | 889,084 | |
| Long-Term Debt – Current Portion | |
| 532,440 | | |
| 327,411 | |
| Rate Reduction Bonds – Current Portion | |
| 43,210 | | |
| 43,210 | |
| Accounts Payable | |
| 914,333 | | |
| 1,147,872 | |
| Renewable Portfolio Standards Compliance Obligations | |
| 192,660 | | |
| 160,149 | |
| Regulatory Liabilities | |
| 439,859 | | |
| 361,152 | |
| Other Current Liabilities | |
| 611,706 | | |
| 676,685 | |
| Total Current Liabilities | |
| 3,395,628 | | |
| 3,605,563 | |
| Deferred Credits and Other Liabilities: | |
| | | |
| | |
| Accumulated Deferred Income Taxes | |
| 3,816,988 | | |
| 3,755,777 | |
| Regulatory Liabilities | |
| 3,668,158 | | |
| 3,658,042 | |
| Derivative Liabilities | |
| 342,990 | | |
| 338,710 | |
| Asset Retirement Obligations | |
| 489,519 | | |
| 488,511 | |
| Accrued Pension, SERP and PBOP | |
| 1,331,884 | | |
| 1,370,245 | |
| Other Long-Term Liabilities | |
| 821,195 | | |
| 810,553 | |
| Total Deferred Credits and Other Liabilities | |
| 10,470,734 | | |
| 10,421,838 | |
| Long-Term Debt | |
| 13,898,581 | | |
| 13,770,828 | |
| Rate Reduction Bonds | |
| 518,517 | | |
| 540,122 | |
| Noncontrolling Interest – Preferred Stock of Subsidiaries | |
| 155,570 | | |
| 155,570 | |
| Common Shareholders' Equity: | |
| | | |
| | |
| Common Shares | |
| 1,759,092 | | |
| 1,729,292 | |
| Capital Surplus, Paid In | |
| 7,479,689 | | |
| 7,087,768 | |
| Retained Earnings | |
| 4,322,825 | | |
| 4,177,048 | |
| Accumulated Other Comprehensive Loss | |
| (63,111 | ) | |
| (65,059 | ) |
| Treasury Stock | |
| (288,539 | ) | |
| (299,055 | ) |
| Common Shareholders' Equity | |
| 13,209,956 | | |
| 12,629,994 | |
| Total Liabilities and Capitalization | |
$ | 41,648,986 | | |
$ | 41,123,915 | |
The data contained in
this report is preliminary and is unaudited. This report is being submitted for the sole purpose of providing information to shareholders
about Eversource Energy and Subsidiaries and is not a representation, prospectus, or intended for use in connection with any purchase
or sale of securities.
EVERSOURCE ENERGY AND SUBSIDIARIES
CONDENSED CONSOLIDATED STATEMENTS OF INCOME
(Unaudited)
| | |
For the Three Months Ended March 31, | |
| (Thousands of Dollars, Except Share Information) | |
2020 | | |
2019 | |
| Operating Revenues | |
$ | 2,373,726 | | |
$ | 2,415,792 | |
| | |
| | | |
| | |
| Operating Expenses: | |
| | | |
| | |
| Purchased Power, Fuel and Transmission | |
| 876,570 | | |
| 974,882 | |
| Operations and Maintenance | |
| 342,062 | | |
| 335,597 | |
| Depreciation | |
| 236,211 | | |
| 214,948 | |
| Amortization | |
| 49,776 | | |
| 70,961 | |
| Energy Efficiency Programs | |
| 148,393 | | |
| 140,116 | |
| Taxes Other Than Income Taxes | |
| 181,594 | | |
| 184,588 | |
| Total Operating Expenses | |
| 1,834,606 | | |
| 1,921,092 | |
| Operating Income | |
| 539,120 | | |
| 494,700 | |
| Interest Expense | |
| 134,715 | | |
| 131,734 | |
| Other Income, Net | |
| 24,104 | | |
| 30,985 | |
| Income Before Income Tax Expense | |
| 428,509 | | |
| 393,951 | |
| Income Tax Expense | |
| 91,876 | | |
| 83,393 | |
| Net Income | |
| 336,633 | | |
| 310,558 | |
| Net Income Attributable to Noncontrolling Interests | |
| 1,880 | | |
| 1,880 | |
| Net Income Attributable to Common Shareholders | |
$ | 334,753 | | |
$ | 308,678 | |
| | |
| | | |
| | |
| Basic and Diluted Earnings Per Common Share | |
$ | 1.01 | | |
$ | 0.97 | |
| | |
| | | |
| | |
| Weighted Average Common Shares Outstanding: | |
| | | |
| | |
| Basic | |
| 331,102,237 | | |
| 317,624,593 | |
| Diluted | |
| 332,937,153 | | |
| 318,316,082 | |
The data contained in
this report is preliminary and is unaudited. This report is being submitted for the sole purpose of providing information to shareholders
about Eversource Energy and Subsidiaries and is not a representation, prospectus, or intended for use in connection with any purchase
or sale of securities.
Exhibit 99.3
2020 First Quarter Results
Safe Harbor Statement 1 All per - share amounts in this presentation are reported on a diluted basis. The only common equity securities that are publicly traded are common shares of Eversource Energy. The earnings and EPS of each business do not represent a direct legal interest in the assets and liabilities allocat ed to such business, but rather represent a direct interest in Eversource Energy's assets and liabilities as a whole. EPS by business is a non - GAAP (not determined using generall y accepted accounting principles) measure that is calculated by dividing the net income or loss attributable to common shareholders of each business by the wei ght ed average diluted Eversource Energy common shares outstanding for the period. Earnings discussions also include non - GAAP financial measures referencing 2020 earnin gs and EPS excluding certain acquisition costs and Q2 2019 earnings and EPS excluding the Northern Pass Transmission (NPT) impairment charge. Eversource Ene rgy uses these non - GAAP financial measures to evaluate and provide details of earnings results by business and to more fully compare and explain 2020 an d 2019 results without including these items. Management believes the acquisition costs and the NPT impairment charge are not indicative of Eversource Energy’s ong oin g costs and performance. Due to the nature and significance of these items on net income attributable to common shareholders, management believes that the non - GAAP presentation is a more meaningful representation of Eversource Energy’s financial performance and provides additional and useful information to readers in anal yzi ng historical and future performance of the business. Non - GAAP financial measures should not be considered as alternatives to Eversource Energy’s consolidated net income a ttributable to common shareholders or EPS determined in accordance with GAAP as indicators of Eversource Energy’s operating performance. This document includes statements concerning Eversource Energy’s expectations, beliefs, plans, objectives, goals, strategies, as sumptions of future events, future financial performance or growth and other statements that are not historical facts. These statements are “forward - looking statem ents” within the meaning of the Private Securities Litigation Reform Act of 1995. Generally, readers can identify these forward - looking statements through the use of w ords or phrases such as “estimate,” “expect,” “anticipate,” “intend,” “plan,” “project,” “believe,” “forecast,” “should,” “could” and other similar expressions. Fo rward - looking statements involve risks and uncertainties that may cause actual results or outcomes to differ materially from those included in the forward - looking statemen ts. Factors that may cause actual results to differ materially from those included in the forward - looking statements include, but are not limited to: cyberattacks or breache s, including those resulting in the compromise of the confidentiality of our proprietary information and the personal information of our customers; disruptions in the capit al markets or other events that make our access to necessary capital more difficult or costly; the negative impacts of the novel coronavirus (COVID - 19) pandemic on our customers, vendors, employees, regulators, and operations; changes in economic conditions, including impact on interest rates, tax policies, and customer demand and payment ab ility; ability or inability to commence and complete our major strategic development projects and opportunities, acts of war or terrorism, physical attacks or grid distu rba nces that may damage and disrupt our electric transmission and electric, natural gas, and water distribution systems; actions or inaction of local, state and fede ral regulatory, public policy and taxing bodies, substandard performance of third - party suppliers and service providers; fluctuations in weather patterns, including extreme weat her due to climate change; changes in business conditions, which could include disruptive technology or development of alternative energy sources related to our cu rre nt or future business model; contamination of, or disruption in, our water supplies; changes in levels or timing of capital expenditures, including the Columbia Gas of Mas sachusetts asset acquisition; changes in laws, regulations or regulatory policy, including compliance with environmental laws and regulations; changes in accounting standar ds and financial reporting regulations; actions of rating agencies; and other presently unknown or unforeseen factors. Other risk factors are detailed in Eversource Energy’s reports filed with the Securities and Exchange Commission (SEC). They ar e updated as necessary and available on Eversource Energy’s website at www.eversource.com and on the SEC’s website at www.sec.gov. All such factors are difficult to pr edict and contain uncertainties that may materially affect Eversource Energy’s actual results, many of which are beyond our control. You should not place undue relia nce on the forward - looking statements, as each speaks only as of the date on which such statement is made, and, except as required by federal securities laws, Eversour ce Energy undertakes no obligation to update any forward - looking statement or statements to reflect events or circumstances after the date on which such statement is made or to reflect the occurrence of unanticipated events.
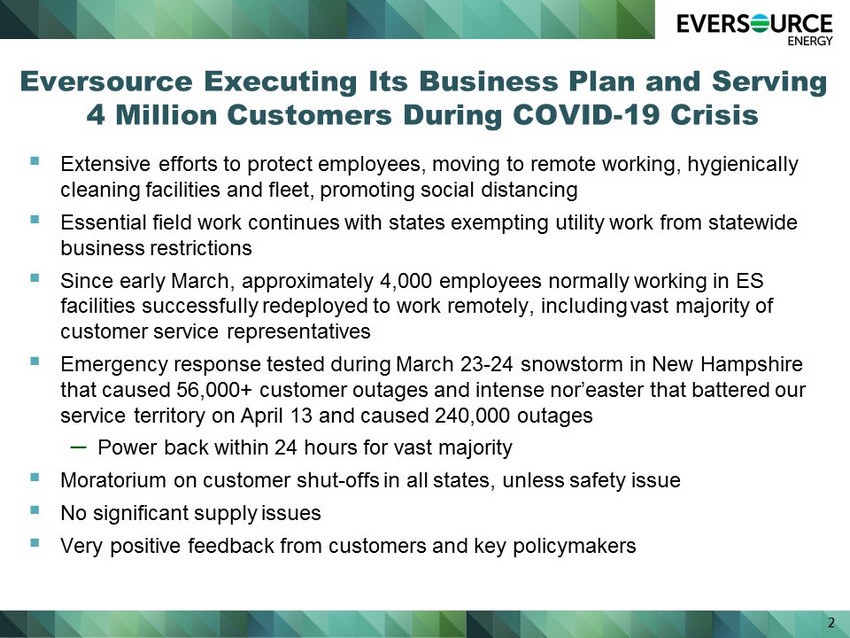
Eversource Executing Its Business Plan and Serving 4 Million Customers During COVID - 19 Crisis ▪ Extensive efforts to protect employees, moving to remote working, hygienically cleaning facilities and fleet, promoting social distancing ▪ Essential field work continues with states exempting utility work from statewide business restrictions ▪ Since early March, approximately 4,000 employees normally working in ES facilities successfully redeployed to work remotely, including vast majority of customer service representatives ▪ Emergency response tested during March 23 - 24 snowstorm in New Hampshire that caused 56,000+ customer outages and intense nor’easter that battered our service territory on April 13 and caused 240,000 outages – Power back within 24 hours for vast majority ▪ Moratorium on customer shut - offs in all states, unless safety issue ▪ No significant supply issues ▪ Very positive feedback from customers and key policymakers 2
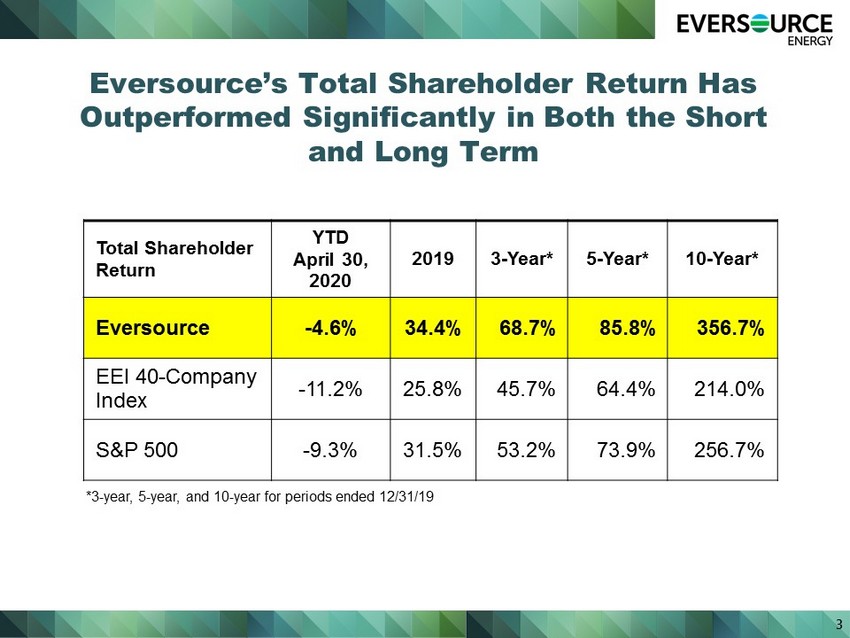
Eversource’s Total Shareholder Return Has Outperformed Significantly in Both the Short and Long Term 3 Total Shareholder Return YTD April 30, 2020 2019 3 - Year* 5 - Year* 10 - Year* Eversource - 4.6% 34.4% 68.7% 85.8% 356.7% EEI 40 - Company Index - 11.2% 25.8% 45.7% 64.4% 214.0% S&P 500 - 9.3% 31.5% 53.2% 73.9% 256.7% *3 - year, 5 - year, and 10 - year for periods ended 12/31/19
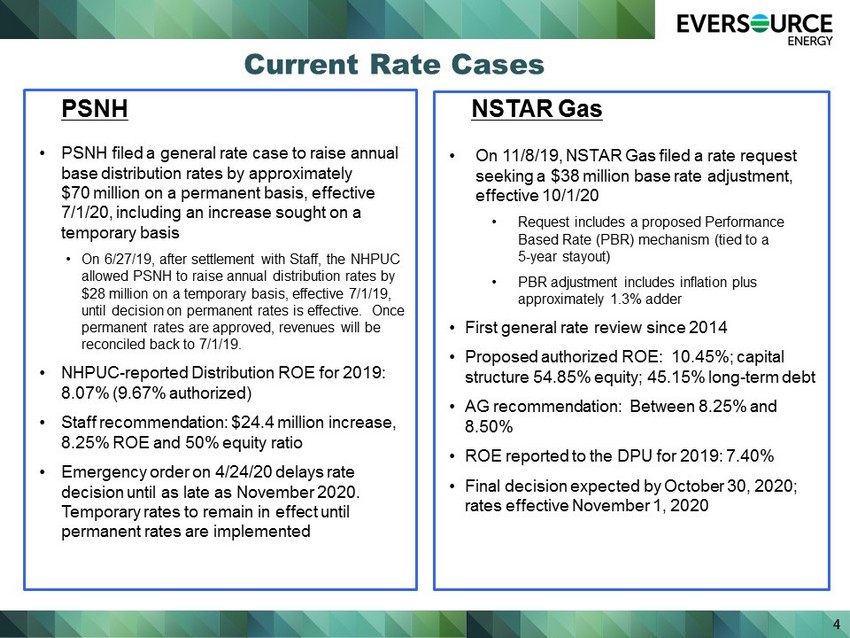
4 Current Rate Cases • PSNH filed a general rate case to raise annual base distribution rates by approximately $70 million on a permanent basis, effective 7/1/20, including an increase sought on a temporary basis • On 6/27/19, after settlement with Staff, the NHPUC allowed PSNH to raise annual distribution rates by $28 million on a temporary basis, effective 7/1/19, until decision on permanent rates is effective. Once permanent rates are approved, revenues will be reconciled back to 7/1/19. • NHPUC - reported Distribution ROE for 2019: 8.07% (9.67% authorized) • Staff recommendation: $24.4 million increase, 8.25% ROE and 50% equity ratio • Emergency order on 4/24/20 delays rate decision until as late as November 2020. Temporary rates to remain in effect until permanent rates are implemented PSNH • On 11/8/19, NSTAR Gas filed a rate request seeking a $38 million base rate adjustment, effective 10/1/20 • Request includes a proposed Performance Based Rate (PBR) mechanism (tied to a 5 - year stayout ) • PBR adjustment includes inflation plus approximately 1.3% adder • First general rate review since 2014 • Proposed authorized ROE: 10.45%; capital structure 54.85% equity; 45.15% long - term debt • AG recommendation: Between 8.25% and 8.50% • ROE reported to the DPU for 2019: 7.40% • Final decision expected by October 30, 2020; rates effective November 1, 2020 NSTAR Gas
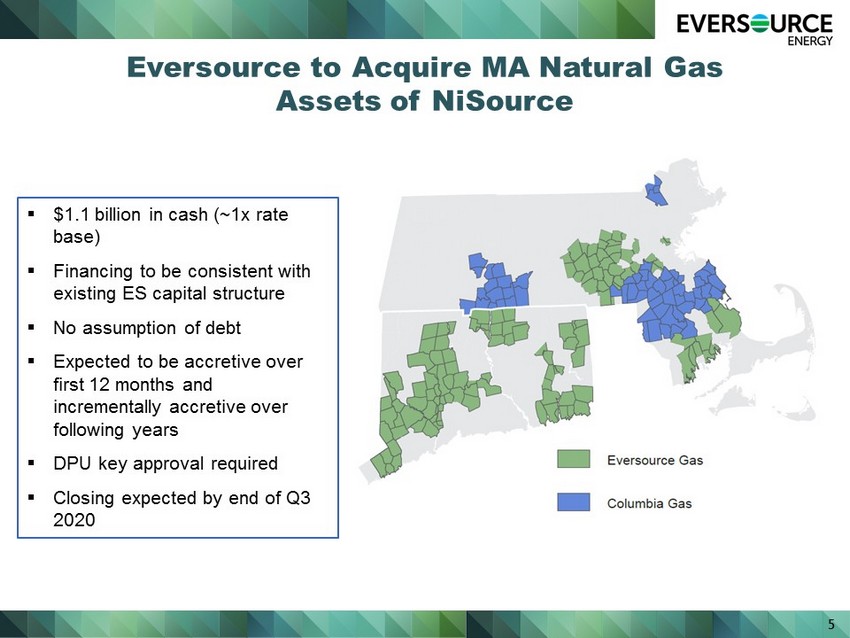
5 Eversource to Acquire MA Natural Gas Assets of NiSource ▪ $1.1 billion in cash (~1x rate base) ▪ Financing to be consistent with existing ES capital structure ▪ No assumption of debt ▪ Expected to be accretive over first 12 months and incrementally accretive over following years ▪ DPU key approval required ▪ Closing expected by end of Q3 2020
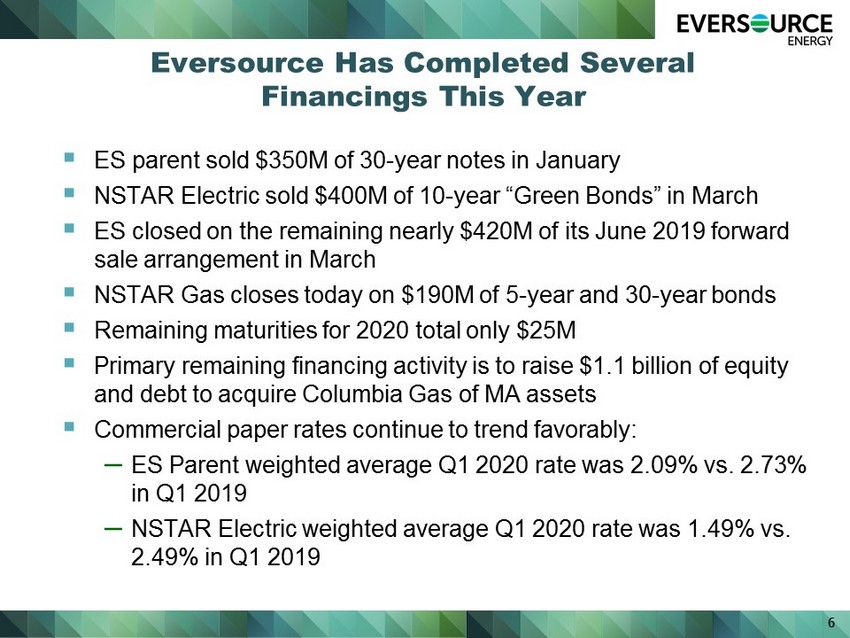
Eversource Has Completed Several Financings This Year ▪ ES parent sold $350M of 30 - year notes in January ▪ NSTAR Electric sold $400M of 10 - year “Green Bonds” in March ▪ ES closed on the remaining nearly $420M of its June 2019 forward sale arrangement in March ▪ NSTAR Gas closes today on $190M of 5 - year and 30 - year bonds ▪ Remaining maturities for 2020 total only $25M ▪ Primary remaining financing activity is to raise $1.1 billion of equity and debt to acquire Columbia Gas of MA assets ▪ Commercial paper rates continue to trend favorably: – ES Parent weighted average Q1 2020 rate was 2.09% vs. 2.73% in Q1 2019 – NSTAR Electric weighted average Q1 2020 rate was 1.49% vs. 2.49% in Q1 2019 6
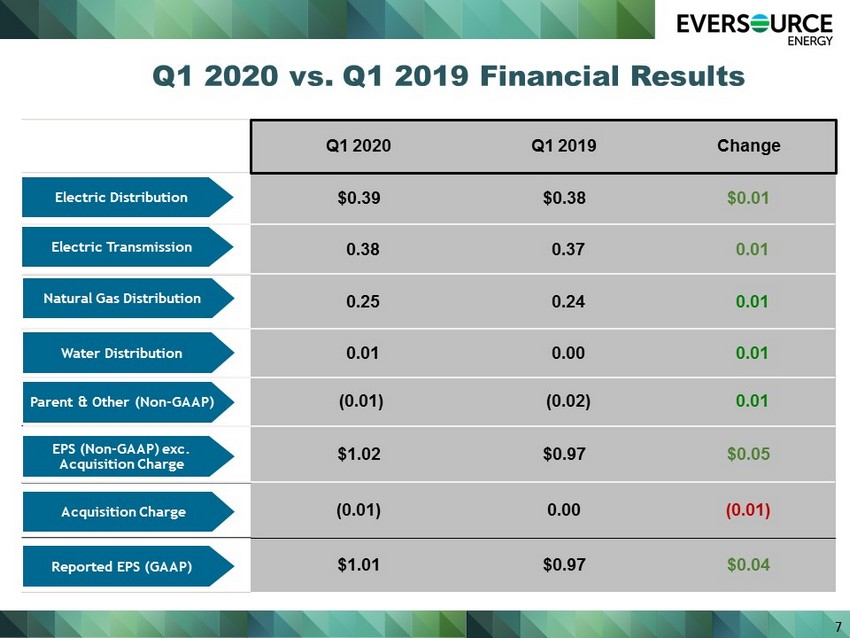
Q1 2020 Q1 2019 Change $0.39 $0.38 $0.01 0.38 0.37 0.01 0.25 0.24 0.01 0.01 0.00 0.01 (0.01) (0.02) 0.01 $1.02 $0.97 $0.05 (0.01) 0.00 (0.01) $1.01 $0.97 $0.04 Natural Gas Distribution Electric Transmission Electric Distribution Water Distribution Reported EPS (GAAP) 7 Q1 2020 vs. Q1 2019 Financial Results Parent & Other (Non - GAAP) EPS (Non - GAAP) exc. Acquisition Charge Acquisition Charge
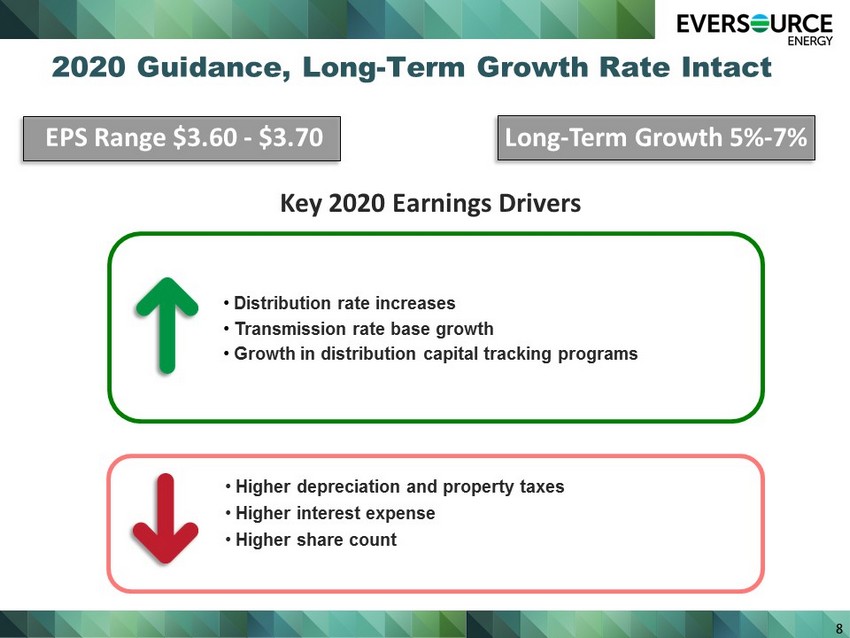
2020 Guidance, Long - Term Growth Rate Intact Key 2020 Earnings Drivers EPS Range $3.60 - $3.70 • Distribution rate increases • Transmission rate base growth • Growth in distribution capital tracking programs • Higher depreciation and property taxes • Higher interest expense • Higher share count 8 Long - Term Growth 5% - 7%
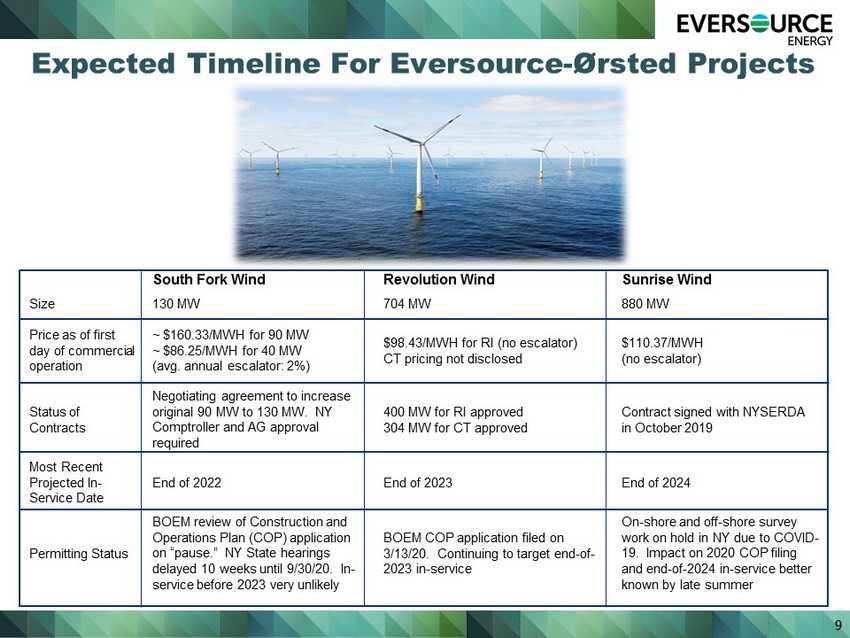
South Fork Wind Revolution Wind Sunrise Wind Size 130 MW 704 MW 880 MW Price as of first day of commercial operation ~ $160.33/MWH for 90 MW ~ $86.25/MWH for 40 MW (avg. annual escalator: 2%) $98.43/MWH for RI (no escalator) CT pricing not disclosed $110.37/MWH (no escalator) Status of Contracts Negotiating agreement to increase original 90 MW to 130 MW. NY Comptroller and AG approval required 400 MW for RI approved 304 MW for CT approved Contract signed with NYSERDA in October 2019 Most Recent Projected In - Service Date End of 2022 End of 2023 End of 2024 Permitting Status BOEM review of Construction and Operations Plan (COP) application on “pause.” NY State hearings delayed 10 weeks until 9/30/20. In - service before 2023 very unlikely BOEM COP application filed on 3/13/20. Continuing to target end - of - 2023 in - service On - shore and off - shore survey work on hold in NY due to COVID - 19. Impact on 2020 COP filing and end - of - 2024 in - service better known by late summer 9 Expected Timeline For Eversource - Ørsted Projects

10 APPENDIX
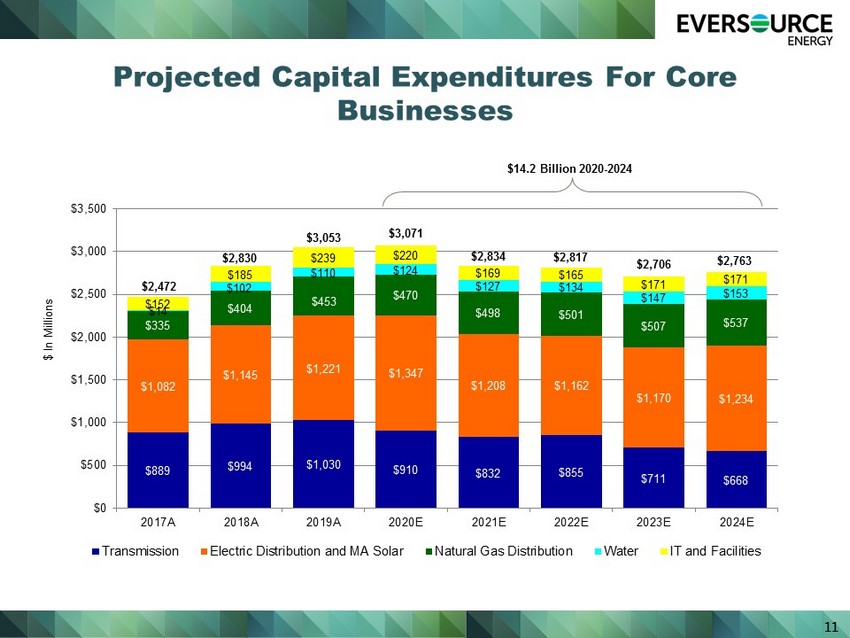
11 $889 $994 $1,030 $910 $832 $855 $711 $668 $1,082 $1,145 $1,221 $1,347 $1,208 $1,162 $1,170 $1,234 $335 $404 $453 $470 $498 $501 $507 $537 $14 $102 $110 $124 $127 $134 $147 $153 $152 $185 $239 $220 $169 $165 $171 $171 $0 $500 $1,000 $1,500 $2,000 $2,500 $3,000 $3,500 2017A 2018A 2019A 2020E 2021E 2022E 2023E 2024E Transmission Electric Distribution and MA Solar Natural Gas Distribution Water IT and Facilities $2,817 $2,834 $ In Millions Projected Capital Expenditures For Core Businesses $3,053 $2,830 $2,472 $14.2 Billion 2020 - 2024 $3,071 $2,706 $2,763
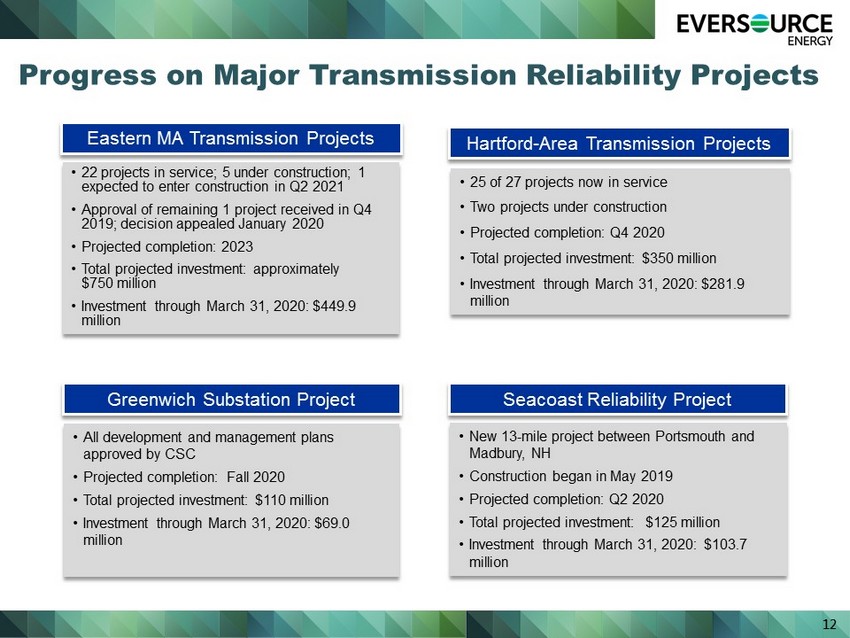
12 • New 13 - mile project between Portsmouth and Madbury , NH • Construction began in May 2019 • Projected completion: Q2 2020 • Total projected investment: $125 million • Investment through March 31, 2020: $103.7 million Seacoast Reliability Project • 25 of 27 projects now in service • Two projects under construction • Projected completion: Q4 2020 • Total projected investment: $350 million • Investment through March 31, 2020: $281.9 million Hartford - Area Transmission Projects Progress on Major Transmission Reliability Projects • All development and management plans approved by CSC • Projected completion: Fall 2020 • Total projected investment: $110 million • Investment through March 31, 2020: $69.0 million Greenwich Substation Project Eastern MA Transmission Projects • 22 projects in service; 5 under construction; 1 expected to enter construction in Q2 2021 • Approval of remaining 1 project received in Q4 2019; decision appealed January 2020 • Projected completion: 2023 • Total projected investment: approximately $750 million • Investment through March 31, 2020: $449.9 million
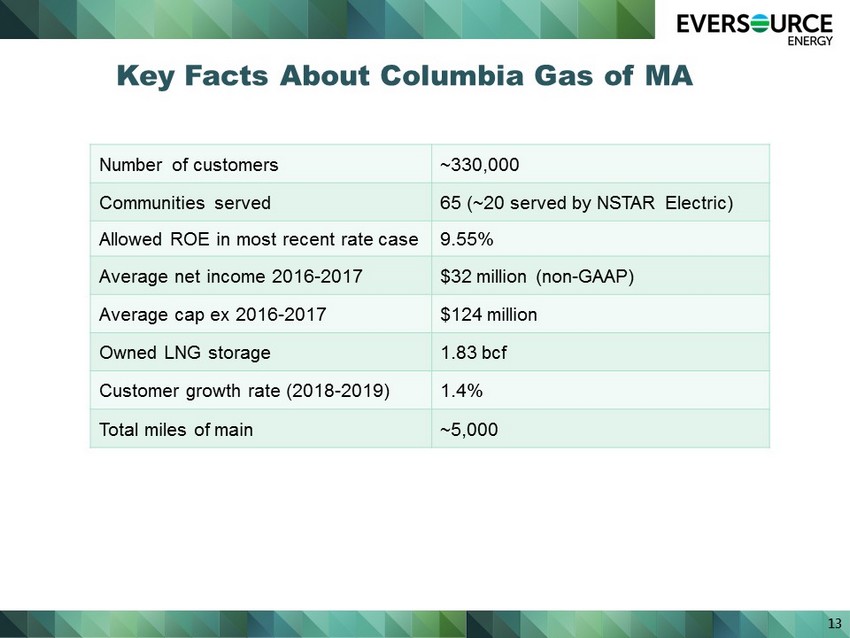
13 Key Facts About Columbia Gas of MA Number of customers ~330,000 Communities served 65 (~20 served by NSTAR Electric) Allowed ROE in most recent rate case 9.55% Average net income 2016 - 2017 $32 million (non - GAAP) Average cap ex 2016 - 2017 $124 million Owned LNG storage 1.83 bcf Customer growth rate (2018 - 2019) 1.4% Total miles of main ~5,000