8-K
false 0001640428 0001640428 2021-11-01 2021-11-01


UNITED STATES

SECURITIES AND EXCHANGE COMMISSION

WASHINGTON, D.C. 20549


FORM 8-K


CURRENT REPORT

Pursuant to Section 13 or 15(d)

of the Securities Exchange Act of 1934

Date of Report (Date of earliest event reported): November 1, 2021


EverQuote, Inc.

(Exact Name of Registrant as Specified in its Charter)


Delaware   001-38549   26-3101161

(State or Other Jurisdiction

of Incorporation)


(Commission

File Number)


(IRS Employer

Identification No.)


210 Broadway

Cambridge, Massachusetts

  02139
(Address of Principal Executive Offices)   (Zip Code)

Registrant’s telephone number, including area code: (855) 522-3444


(Former Name or Former Address, if Changed Since Last Report)


Check the appropriate box below if the Form 8-K filing is intended to simultaneously satisfy the filing obligation of the registrant under any of the following provisions (see General Instruction A.2. below):


Written communications pursuant to Rule 425 under the Securities Act (17 CFR 230.425)


Soliciting material pursuant to Rule 14a-12 under the Exchange Act (17 CFR 240.14a-12)


Pre-commencement communications pursuant to Rule 14d-2(b) under the Exchange Act (17 CFR 240.14d-2(b))


Pre-commencement communications pursuant to Rule 13e-4(c) under the Exchange Act (17 CFR 240.13e-4(c))

Securities registered pursuant to Section 12(b) of the Act:


Title of each class


Trading

Symbol(s)


Name of each exchange

on which registered

Class A Common Stock, $0.001 par value per share   EVER   The Nasdaq Stock Market LLC

Indicate by check mark whether the registrant is an emerging growth company as defined in Rule 405 of the Securities Act of 1933 (§230.405 of this chapter) or Rule 12b-2 of the Securities Exchange Act of 1934 (§240.12b-2 of this chapter).

Emerging growth company  

If an emerging growth company, indicate by check mark if the registrant has elected not to use the extended transition period for complying with any new or revised financial accounting standards provided pursuant to Section 13(a) of the Exchange Act.  ☐


Item 2.02

Results of Operations and Financial Condition.

On November 1, 2021, EverQuote, Inc. (the “Company”) issued a press release reporting financial results for the fiscal quarter ended September 30, 2021. The full text of the press release is furnished as Exhibit 99.1 to this Current Report on Form 8-K.

The information contained in Item 2.02 in this Current Report on Form 8-K (including Exhibit 99.1) shall not be deemed “filed” for purposes of Section 18 of the Securities Exchange Act of 1934, as amended (the “Exchange Act”), or otherwise subject to the liabilities of that section, nor shall it be deemed incorporated by reference in any filing under the Securities Act of 1933, as amended (the “Securities Act”), or the Exchange Act, except as expressly set forth by specific reference in such a filing.


Item 7.01

Regulation FD Disclosure.

On November 1, 2021, the Company posted an investor presentation to its website (www.everquote.com). A copy of the investor presentation is furnished as Exhibit 99.2 to this Current Report on Form 8-K.

The information contained in Item 7.01 in this Current Report on Form 8-K (including Exhibit 99.2) shall not be deemed to be “filed” for purposes of Section 18 of the Exchange Act or otherwise subject to the liability of that section, and shall not be incorporated by reference into any registration statement or other document filed under the Securities Act or the Exchange Act, except as shall be expressly set forth by specific reference in such filing.


Item 9.01

Financial Statements and Exhibits.

(d) Exhibits

EXHIBIT INDEX


Exhibit
No.


Description

99.1    Press release dated November 1, 2021
99.2    Investor Presentation dated November 2021
104    Cover Page Interactive Data File (embedded within the Inline XBRL document)


SIGNATURES

Pursuant to the requirements of the Securities Exchange Act of 1934, as amended, the registrant has duly caused this report to be signed on its behalf by the undersigned hereunto duly authorized.


    EVERQUOTE, INC.
Date: November 1, 2021     By:  

/s/ David Mason

      David Mason
      Secretary and General Counsel

Exhibit 99.1

EverQuote Announces Third Quarter 2021 Financial Results


Revenue Increased 20% Year-Over-Year to $107.6 Million


Recent Acquisition of PolicyFuel Closed and Successfully Integrated into DTC Agency Operations

CAMBRIDGE, Mass., November 1, 2021 — EverQuote, Inc. (Nasdaq: EVER), a leading online insurance marketplace, today announced financial results for the third quarter ended September 30, 2021.

“Third quarter revenue increased 20% and Variable Marketing Margin, or VMM, grew 10% year-over-year. We believe the challenges in the auto insurance market will correct as carriers adjust their pricing strategies to a new underwriting environment. Importantly, we expect our non-auto insurance verticals to be unaffected by these challenges, and we remain confident that our health insurance vertical will have a successful fourth quarter,” said Jayme Mendal, CEO of EverQuote. “In an effort to align our cost structure to the current auto insurance environment, we implemented an approximate 10% structural reduction in non-marketing operating expenses (excluding non-cash items). In addition, we are proactively shifting to a new organizational operating model that we believe will enable us to make faster progress towards our long-term vision. With these advantages and an organizational model that enables better, faster execution, EverQuote will be better positioned than ever before to emerge as a powerful player in the $150 billion insurance distribution market.”

Third Quarter 2021 Financial Highlights:

(All comparisons are relative to the third quarter of 2020):


Total revenue of $107.6 million, an increase of 20%.


Automotive insurance vertical revenue of $89.7 million, an increase of 20%.


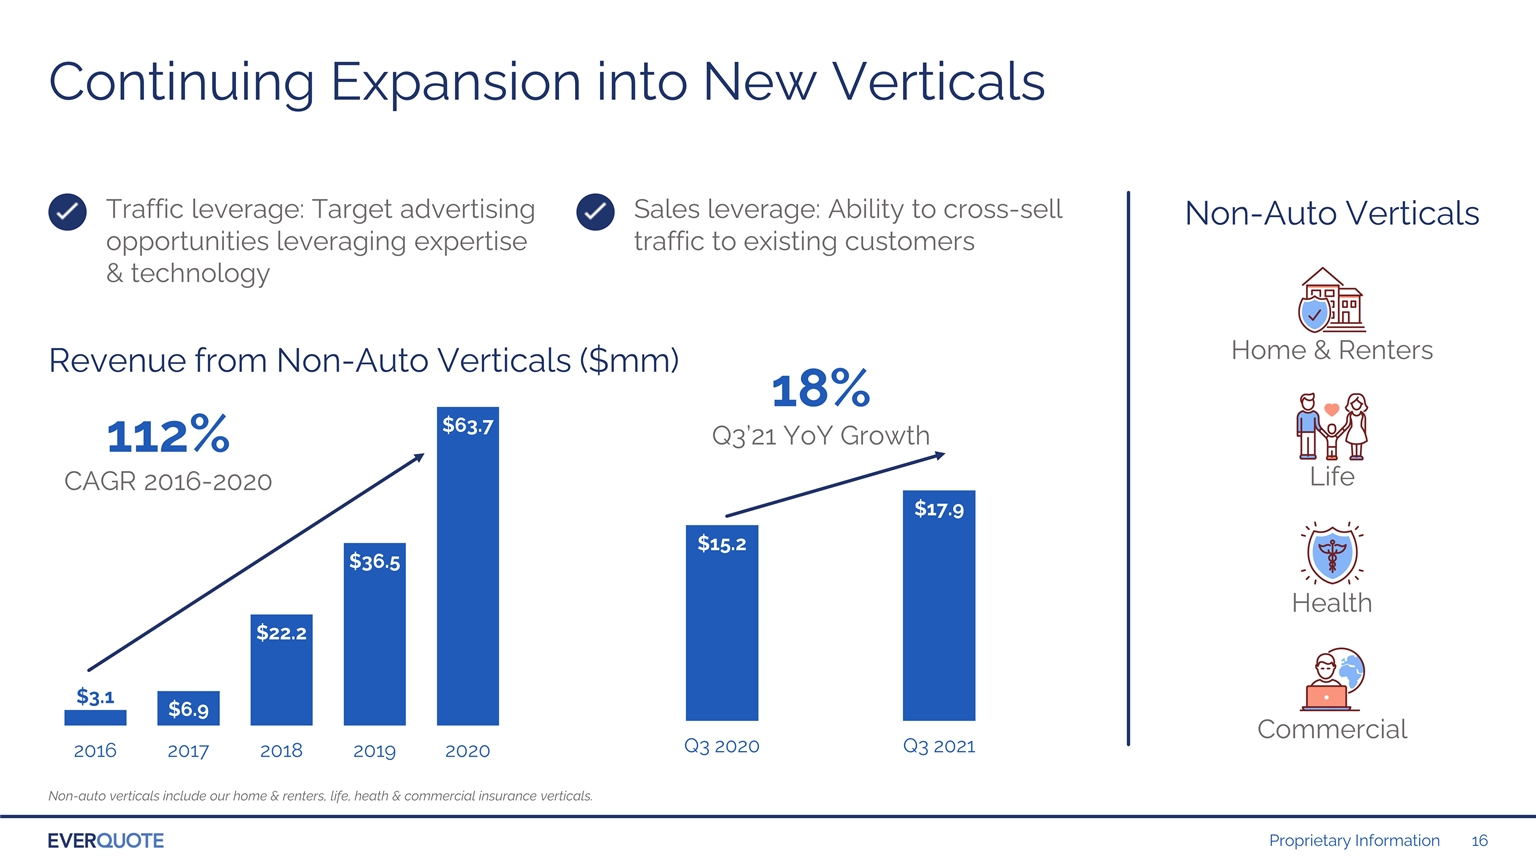
Revenue from our other insurance verticals, which includes home and renters, life, health and commercial insurance, increased 18% to $17.9 million.


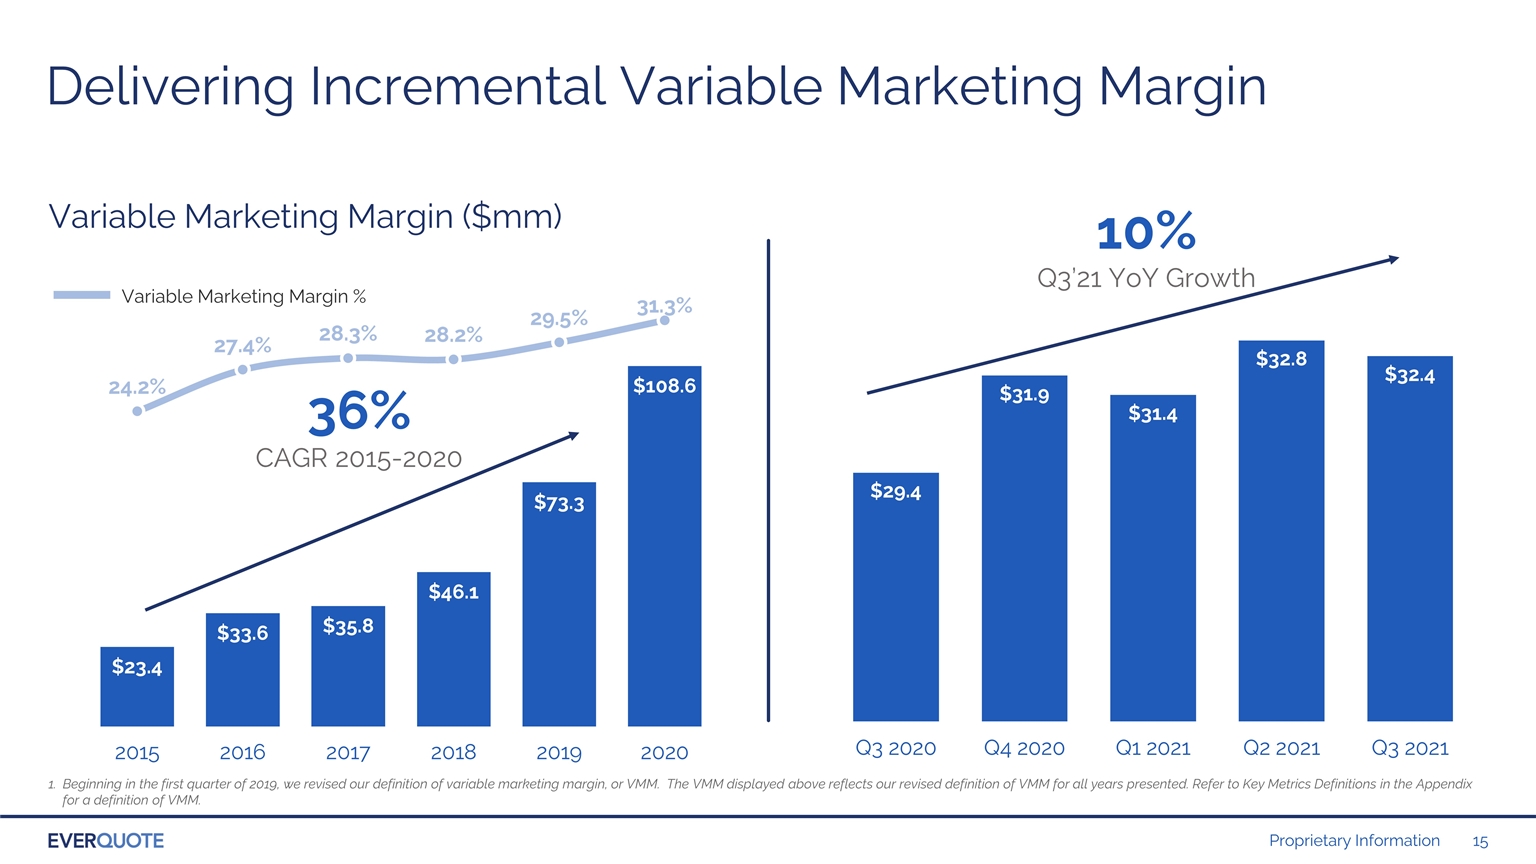
Variable Marketing Margin of $32.4 million, an increase of 10%.


GAAP net loss increased to $5.3 million, compared to GAAP net loss of $3.2 million.


Adjusted EBITDA decreased to $2.7 million, compared to Adjusted EBITDA of $5.2 million.

Third Quarter 2021 Business Highlights:


Quote request growth of 21% driven by the strength of our traffic operations.


EverQuote closed its previously announced acquisition of PolicyFuel, expanding its Direct-To-Consumer (DTC) Agency offerings into its auto insurance verticals.


Fourth Quarter and Updated Full-Year 2021 Guidance:

EverQuote anticipates Revenue, Variable Marketing Margin and Adjusted EBITDA to be in the following ranges:

Fourth quarter 2021:


Revenue of $93.5 - $98.5 million.


Variable Marketing Margin of $30.5 - $33.5 million.


Adjusted EBITDA of ($1.5) - $1.5 million.

Full year 2021:


Revenue of $410 - $415 million, a year-over-year increase of 19% at the mid-point and a decrease from our previous guidance of $440 - $446 million.


Variable Marketing Margin of $127 - $130 million, a year-over-year increase of 18% at the mid-point and a decrease from our previous guidance of $138 - $141 million.


Adjusted EBITDA of $12.5 - $15.5 million, a year-over-year decrease of 24% at the mid-point and a decrease from our previous guidance of $23 - $26 million.

With respect to the Company’s expectations under “Fourth Quarter and Updated Full Year 2021 Guidance” above, the Company has not reconciled the non-GAAP measure Adjusted EBITDA to the GAAP measure net income (loss) in this press release because the Company does not provide guidance for stock-based compensation expense, depreciation and amortization expense, acquisition-related costs, interest income, and income taxes on a consistent basis as the Company is unable to quantify these amounts without unreasonable efforts, which would be required to include a reconciliation of Adjusted EBITDA to GAAP net income (loss). In addition, the Company believes such a reconciliation would imply a degree of precision that could be confusing or misleading to investors.

Conference Call and Webcast Information

EverQuote will host a conference call and live webcast to discuss its third quarter 2021 financial results at 4:30 p.m. Eastern Time today, November 1, 2021. To access the conference call, dial (877) 273-5005 for the U.S. or Canada, or (647) 689-5410 for international callers and provide conference ID 9566654. The webcast will be available live on the Investors section of the Company’s website at https://investors.everquote.com.

An audio replay of the call will also be available to investors beginning at approximately 6:30 p.m. Eastern Time on November 1, 2021, until 11:59 p.m. Eastern Time on November 8, 2021, by dialing (800) 585-8367 for the U.S. or Canada, or (416) 621-4642 for international callers, and entering passcode 9566654. In addition, an archived webcast will be available on the Investors section of the Company’s website at: https://investors.everquote.com.


Safe Harbor Statement

Any statements in this press release about future expectations, plans and prospects for EverQuote, Inc. (“EverQuote” or the “Company”), including statements about future results of operations or the future financial position of the Company, including financial targets, business strategy, plans and objectives for future operations and other statements containing the words “anticipates,” “believes,” “expects,” “plans,” and similar expressions, constitute forward-looking statements within the meaning of The Private Securities Litigation Reform Act of 1995. Actual results may differ materially from those indicated by such forward-looking statements as a result of various important factors, including: (1) the Company’s ability to attract and retain consumers and insurance providers using the Company’s marketplace; (2) the Company’s ability to maintain or increase the amount providers spend per quote request; (3) the impact on the Company and the insurance industry of the COVID-19 pandemic; (4) the effectiveness of the Company’s growth strategies and its ability to effectively manage growth; (5) the Company’s ability to maintain and build its brand; (6) the Company’s reliance on its third-party service providers; (7) the Company’s ability to develop new and enhanced products and services to attract and retain consumers and insurance providers, and the Company’s ability to successfully monetize them; (8) the impact of competition in the Company’s industry and innovation by the Company’s competitors; (9) the Company’s expected use of proceeds from its initial public offering (10) developments regarding the insurance industry and the transition to online marketing; (11) the Company’s ability to successfully operate PolicyFuel; (12) the Company’s ability to successfully remediate the material weaknesses identified in the Company’s internal controls over financial reporting and (13) other factors discussed in the “Risk Factors” section of the Company’s most recent Quarterly Report on Form 10-Q, which is on file with the Securities and Exchange Commission. In addition, the forward-looking statements included in this press release represent the Company’s views as of the date of this press release. The Company anticipates that subsequent events and developments will cause the Company’s views to change. However, while the Company may elect to update these forward-looking statements at some point in the future, the Company specifically disclaims any obligation to do so. These forward-looking statements should not be relied upon as representing the Company’s views as of any date subsequent to the date of this press release.

About EverQuote

EverQuote operates a leading online insurance marketplace, connecting consumers with insurance providers. The company’s mission is to empower insurance shoppers to better protect life’s most important assets—their family, property, and future. Our vision is to become the largest online source of insurance policies by using data and technology to make insurance simpler, more affordable and personalized, ultimately reducing cost and risk.

For more information, visit everquote.com and follow on Twitter @everquotelife, Instagram @everquotepics, and LinkedIn https://www.linkedin.com/company/everquote/.

Investor Relations Contact:

Brinlea Johnson

The Blueshirt Group

212-331-8424

[email protected]


EVERQUOTE, INC.

CONSOLIDATED STATEMENTS OF OPERATIONS


     Three Months Ended     Nine Months Ended  
     September 30,     September 30,  
     2021     2020     2021     2020  
     (in thousands except per share)  

Revenue

   $ 107,563     $ 89,977     $ 316,448     $ 249,643  


Cost and operating expenses(1):


Cost of revenue

     5,994       5,378       17,758       15,690  

Sales and marketing

     92,545       73,598       265,724       204,663  

Research and development

     9,259       8,149       26,885       21,574  

General and administrative

     6,731       5,661       18,527       15,134  

Acquisition-related

     819       480       1,005       480  


Total cost and operating expenses

     115,348       93,266       329,899       257,541  


Loss from operations

     (7,785     (3,289     (13,451     (7,898


Other income (expense):


Interest income

     9       18       33       176  

Other income (expense), net

     (6     87       (46     288  


Total other income (expense), net

     3       105       (13     464  


Loss before income taxes

     (7,782     (3,184     (13,464     (7,434

Benefit from income taxes

     2,510       —         2,510       —    


Net loss

   $ (5,272   $ (3,184   $ (10,954   $ (7,434


Net loss per share, basic and diluted

   $ (0.18   $ (0.12   $ (0.38   $ (0.27


Weighted average common shares outstanding, basic and diluted

     29,277       27,526       28,871       27,102  


(1)

Amounts include stock-based compensation expense, as follows:


     Three Months Ended
September 30,
     Nine Months Ended
September 30,
 
     2021      2020      2021      2020  
            (in thousands)         

Cost of revenue

   $ 108      $ 111      $ 282      $ 253  

Sales and marketing

     3,366        3,080        9,216        7,322  

Research and development

     2,692        2,228        7,340        5,366  

General and administrative

     2,182        1,781        6,119        5,049  


   $ 8,348      $ 7,200      $ 22,957      $ 17,990  


EVERQUOTE, INC.

CONSOLIDATED BALANCE SHEET DATA


     September
30, 2021
     December
31, 2020
 
     (in thousands)  

Cash and cash equivalents

   $ 41,773      $ 42,870  

Working capital

     47,853        50,554  

Total assets

     148,547        129,050  

Total liabilities

     62,499        58,068  

Total stockholders’ equity

     86,048        70,982  


EVERQUOTE, INC.

CONSOLIDATED STATEMENTS OF CASH FLOWS


     Three Months Ended     Nine Months Ended  
     September 30,     September 30,  
     2021     2020     2021     2020  
           (in thousands)        

Cash flows from operating activities:


Net loss

   $ (5,272   $ (3,184   $ (10,954   $ (7,434

Adjustments to reconcile net loss to net cash provided by operating activities:


Depreciation and amortization

     1,298       731       3,608       2,174  

Stock-based compensation expense

     8,348       7,200       22,957       17,990  

Change in fair value of contingent consideration

     425       —         136       —    

Deferred taxes

     (2,510     —         (2,510     —    

Provision for (recovery of) bad debt

     —         (2     (50     15  

Unrealized foreign currency transaction (gains) losses

     (8     —         15       —    

Changes in operating assets and liabilities, net of effects from acquisitions:


Accounts receivable

     1,365       (5,036     1,662       (9,328

Prepaid expenses and other current assets

     (849     (1,588     (941     2,048  

Operating lease right-of-use assets

     636       —         2,036       —    

Other assets

     (749     (165     (1,089     (222

Accounts payable

     (1,499     6,737       (8,622     10,030  

Accrued expenses and other current liabilities

     2,277       925       9,815       (2,325

Deferred revenue

     56       59       23       191  

Operating lease liabilities

     (731     —         (2,068     —    

Other long-term liabilities

     26       318       30       764  


Net cash provided by operating activities

     2,813       5,995       14,048       13,903  


Cash flows from investing activities:


Acquisition of property and equipment, including costs capitalized for development of internal-use software

     (965     (837     (2,275     (2,708

Acquisition of business

     (15,955     (14,930     (15,955     (14,930


Net cash used in investing activities

     (16,920     (15,767     (18,230     (17,638


Cash flows from financing activities:


Proceeds from exercise of stock options

     1,367       1,244       3,091       3,562  


Net cash provided by financing activities

     1,367       1,244       3,091       3,562  


Effect of exchange rate changes on cash, cash equivalents and restricted cash

     (7     —         (6     —    


Net decrease in cash, cash equivalents and restricted cash

     (12,747     (8,528     (1,097     (173

Cash, cash equivalents and restricted cash at beginning of period

     54,770       54,659       43,120       46,304  


Cash, cash equivalents and restricted cash at end of period

   $ 42,023     $ 46,131     $ 42,023     $ 46,131  


EVERQUOTE, INC.

FINANCIAL AND OPERATING METRICS

Revenue by vertical:


     Three Months Ended September 30,      Change  
     2021      2020      %  
     (in thousands)         

Automotive

   $ 89,666      $ 74,779        19.9

Other

     17,897        15,198        17.8


Total Revenue

   $ 107,563      $ 89,977        19.5


     Nine Months Ended September 30,      Change  
     2021      2020      %  
     (in thousands)         

Automotive

   $ 260,505      $ 207,014        25.8

Other

     55,943        42,629        31.2


Total Revenue

   $ 316,448      $ 249,643        26.8


Other financial and non-financial metrics:


     Three Months Ended September 30,     Change  
     2021     2020     %  
     (in thousands)        

Loss from operations

   $ (7,785   $ (3,289     136.7

Net loss

   $ (5,272   $ (3,184     65.6

Quote requests

     7,613       6,291       21.0

Variable Marketing Margin

   $ 32,401     $ 29,428       10.1

Adjusted EBITDA(1)

   $ 2,674     $ 5,209       -48.7
     Nine Months Ended September 30,     Change  
     2021     2020     %  
     (in thousands)        

Loss from operations

   $ (13,451   $ (7,898     70.3

Net loss

   $ (10,954   $ (7,434     47.4

Quote requests

     22,114       20,460       8.1

Variable Marketing Margin

   $ 96,669     $ 76,721       26.0

Adjusted EBITDA(1)

   $ 14,073     $ 13,034       8.0


(1)

Adjusted EBITDA is a non-GAAP measure. Please see “EverQuote, Inc. Reconciliation of Non-GAAP Measures to GAAP” below for more information.

EVERQUOTE, INC.

NON-GAAP FINANCIAL MEASURES

To supplement the Company’s financial statements presented in accordance with GAAP and to provide investors with additional information regarding EverQuote’s financial results, the Company has presented Adjusted EBITDA as a non-GAAP financial measure. This non-GAAP financial measure is not based on any standardized methodology prescribed by GAAP and is not necessarily comparable to similarly titled measures presented by other companies.


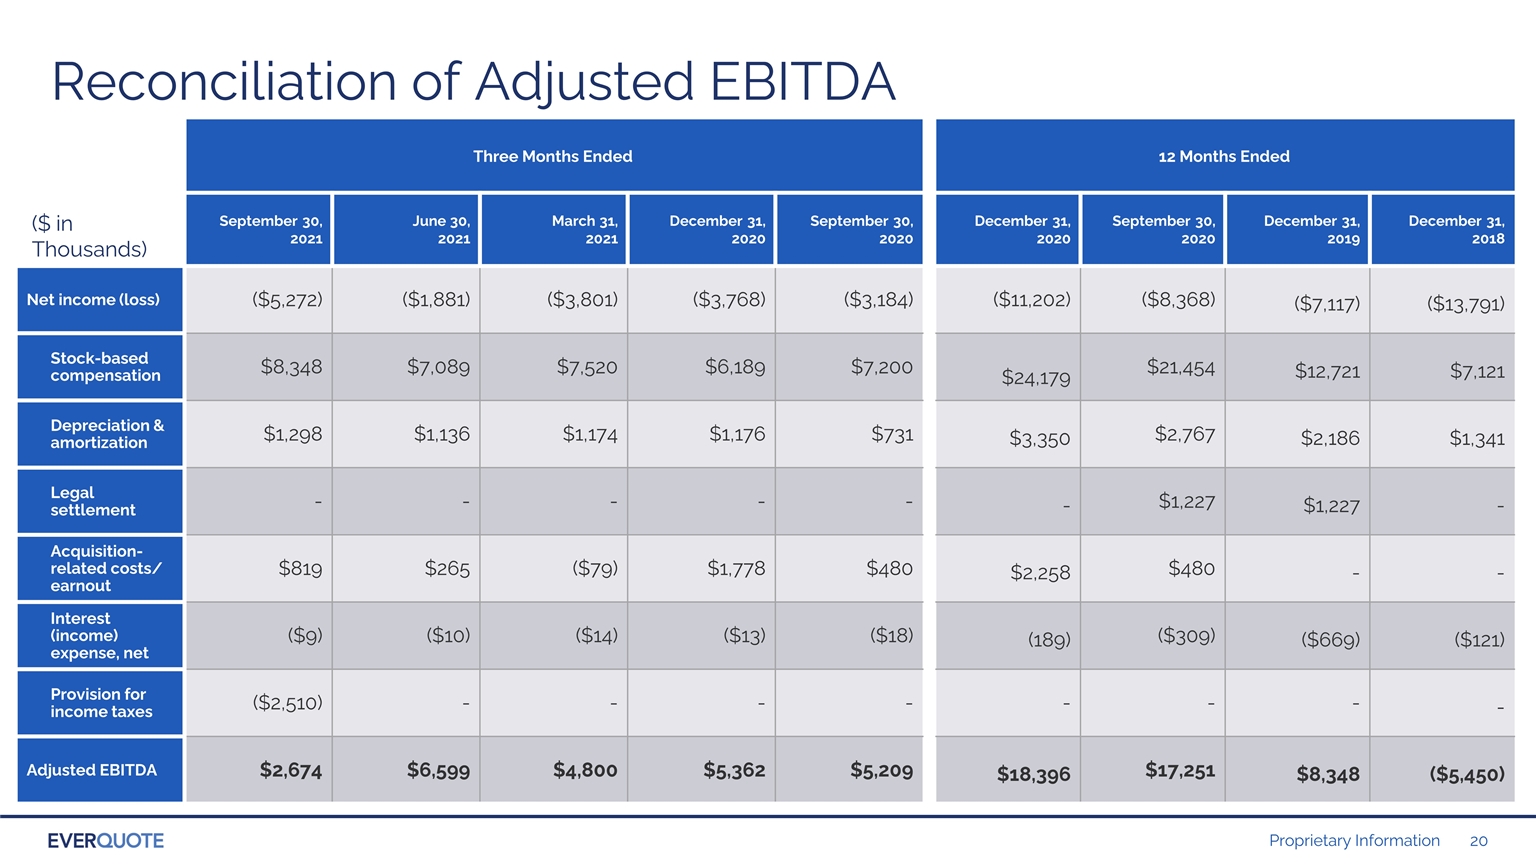
The Company defines adjusted EBITDA as net income (loss), excluding the impact of stock-based compensation expense; depreciation and amortization expense; acquisition-related costs; interest income; and income taxes. The most directly comparable GAAP measure is net income (loss). The Company monitors and presents adjusted EBITDA because it is a key measure used by management and the board of directors to understand and evaluate operating performance, to establish budgets and to develop operational goals for managing EverQuote’s business. In particular, the Company believes that excluding the impact of these items in calculating adjusted EBITDA can provide a useful measure for period-to-period comparisons of EverQuote’s core operating performance.

The Company uses adjusted EBITDA to evaluate EverQuote’s operating performance and trends and make planning decisions. The Company believes that this non-GAAP financial measure helps identify underlying trends in EverQuote’s business that could otherwise be masked by the effect of the items that the Company excludes in the calculations of adjusted EBITDA. Accordingly, the Company believes that this financial measure provides useful information to investors and others in understanding and evaluating EverQuote’s operating results, enhancing the overall understanding of the Company’s past performance and future prospects.

The Company’s non-GAAP financial measures are not prepared in accordance with GAAP and should not be considered in isolation of, or as an alternative to, measures prepared in accordance with GAAP. There are a number of limitations related to the use of adjusted EBITDA rather than net income (loss), which is the most directly comparable financial measure calculated and presented in accordance with GAAP. In addition, other companies may use other measures to evaluate their performance, which could reduce the usefulness of the Company’s non-GAAP financial measures as tools for comparison.

The following table reconciles adjusted EBITDA to net income (loss), the most directly comparable financial measure calculated and presented in accordance with GAAP.

EVERQUOTE, INC.

RECONCILIATION OF NON-GAAP MEASURES TO GAAP


     Three Months Ended     Nine Months Ended  
     September 30,     September 30,  
     2021     2020     2021     2020  
           (in thousands)        

Net loss

   $ (5,272   $ (3,184   $ (10,954   $ (7,434

Stock-based compensation

     8,348       7,200       22,957       17,990  

Depreciation and amortization

     1,298       731       3,608       2,174  

Acquisition-related

     819       480       1,005       480  

Interest income

     (9     (18     (33     (176

Benefit from income taxes

     (2,510     —         (2,510     —    


Adjusted EBITDA

   $ 2,674     $ 5,209     $ 14,073     $ 13,034  


Slide 1

Investor Presentation November 2021 Exhibit 99.2

Slide 2

Disclaimer This presentation contains forward-looking statements. All statements other than statements of historical facts contained in this presentation, including statements regarding possible or assumed future results of operations, business strategies, development plans, regulatory activities, competitive position, potential growth opportunities, & the effects of competition are forward-looking statements. These statements involve known & unknown risks, uncertainties & other important factors that may cause actual results, performance or achievements of EverQuote, Inc. (“the Company”) to be materially different from any future results, performance or achievements expressed or implied by the forward-looking statements. In some cases, you can identify forward-looking statements by terms such as “may,” “should,” “expect,” “plan,” “project,” “estimate,” “guidance,” or “potential” or the negative of these terms or other similar expressions. The forward-looking statements in this presentation are only predictions. The Company has based these forward-looking statements largely on its current expectations & projections about future events & financial trends that it believes may affect the Company’s business, financial condition & results of operations. These forward-looking statements speak only as of the date of this presentation & are subject to a number of risks, uncertainties & assumptions, some of which cannot be predicted or quantified & some of which are beyond the Company’s control. The events & circumstances reflected in the Company’s forward-looking statements may not be achieved or occur, & actual results could differ materially from those projected in the forward-looking statements, including as a result of: (1) the Company’s ability to attract and retain consumers and insurance providers using the Company’s marketplace; (2) the Company’s ability to maintain or increase the amount providers spend per quote request; (3) the impact on the Company and the insurance industry of the COVID-19 pandemic; (4) the effectiveness of the Company’s growth strategies and its ability to effectively manage growth; (5) the Company’s ability to maintain and build its brand; (6) the Company’s reliance on its third-party service providers; (7) the Company’s ability to develop new and enhanced products and services to attract and retain consumers and insurance providers, and the Company’s ability to successfully monetize them; (8) the impact of competition in the Company’s industry and innovation by the Company’s competitors; (9) the Company’s expected use of proceeds from its initial public offering (10) developments regarding the insurance industry and the transition to online marketing; (11) the Company’s ability to successfully operate PolicyFuel; (12) the Company’s ability to successfully remediate the material weaknesses identified in the Company’s internal controls over financial reporting; and (13)  as a result of the risks described in the “Risk Factors” section of the Company’s most recent Annual Report on Form 10-K, Quarterly Report on Form 10-Q & the other filings that the Company makes with the Securities & Exchange Commission from time to time. Moreover, new risk factors & uncertainties may emerge from time to time, & it is not possible for management to predict all risk factors & uncertainties that the Company may face. Except as required by applicable law, the Company does not plan to publicly update or revise any forward-looking statements contained herein, whether as a result of any new information, future events, changed circumstances or otherwise. The Company’s presentation also contains estimates, projections, & other information concerning the Company’s industry, the Company’s business & the markets for certain of the Company’s products & services, including data regarding the estimated size of those markets. Information that is based on estimates, forecasts, projections, market research, or similar methodologies is inherently subject to uncertainties & actual events or circumstances may differ materially from events & circumstances reflected in this information. Unless otherwise expressly stated, the Company obtained this industry, business, market & other data from reports, research surveys, studies & similar data prepared by market research firms & other third parties, from industry, general publications, & from government data & similar sources. The Company presents Adjusted EBITDA as a non-GAAP measure, which is not a substitute for or superior to, other measures of financial performance prepared in accordance with U.S. GAAP. A reconciliation of Adjusted EBITDA to the most directly comparable GAAP measure is included in the Appendix to these slides.

Slide 3

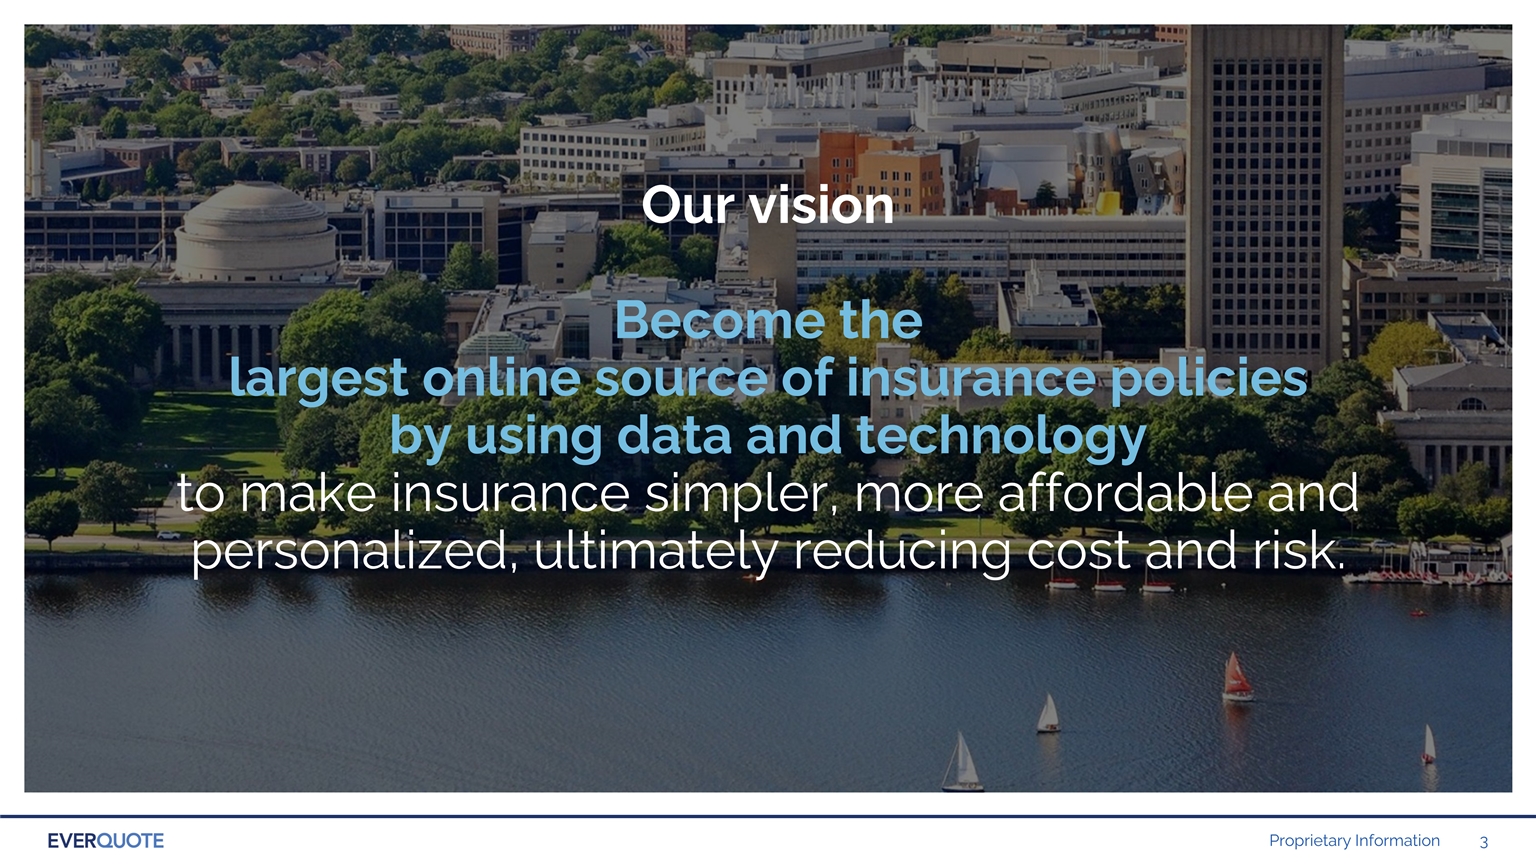
Our vision Become the largest online source of insurance policies by using data and technology to make insurance simpler, more affordable and personalized, ultimately reducing cost and risk.

Slide 4

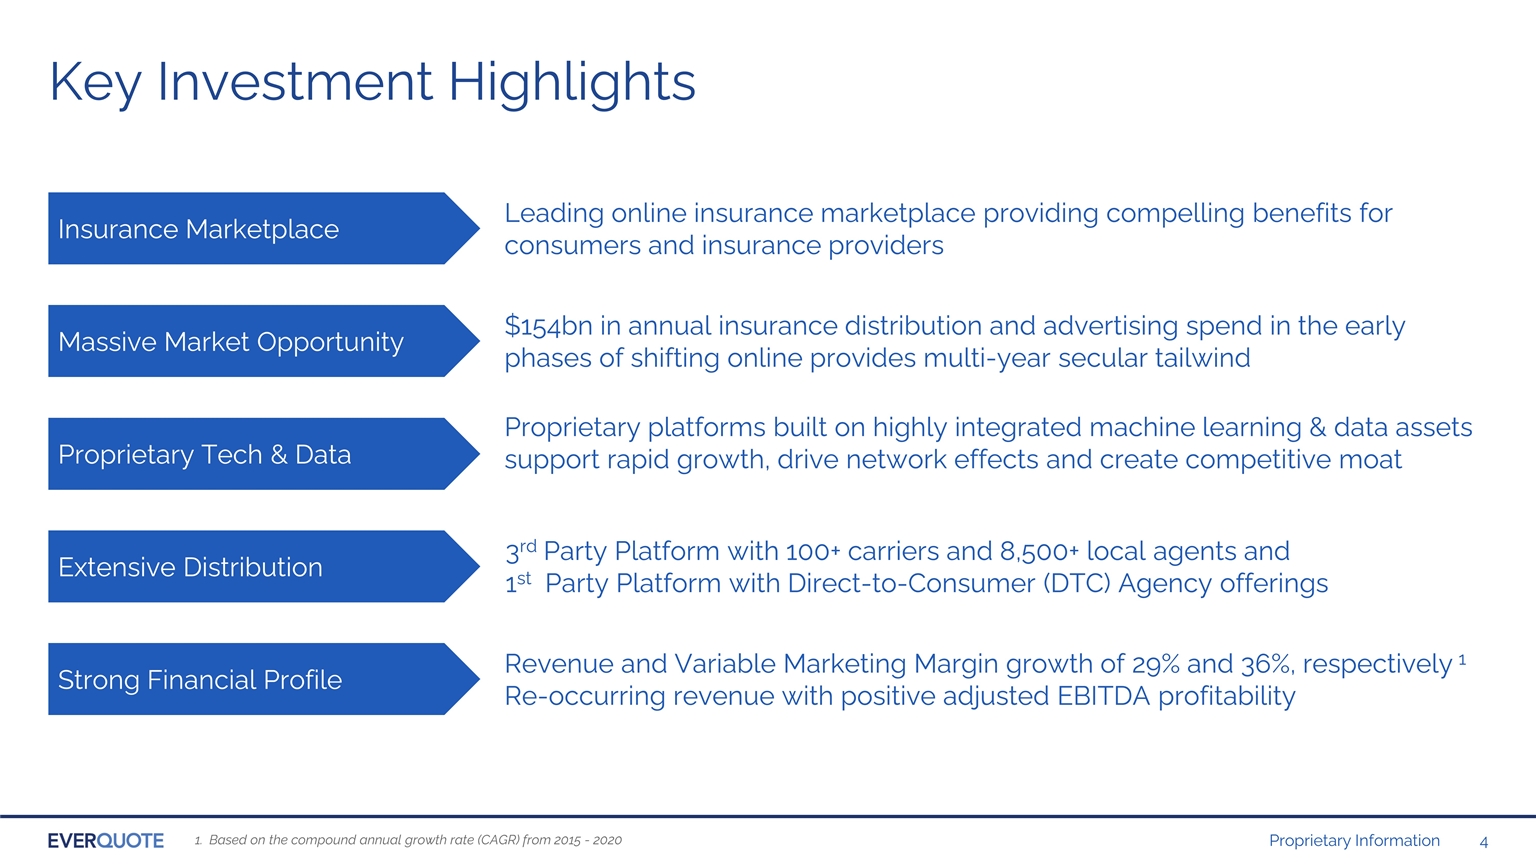
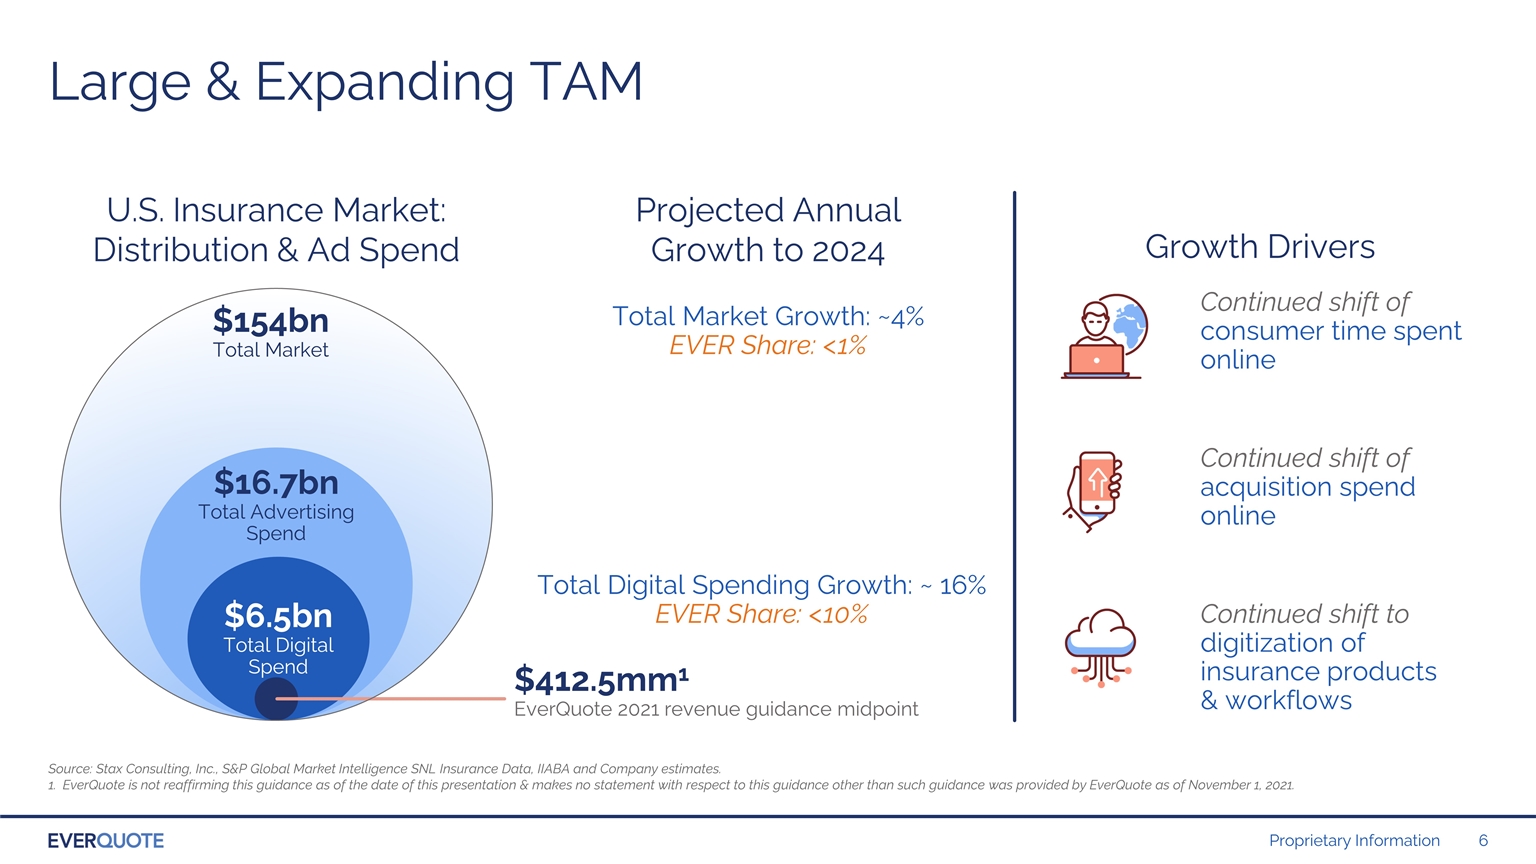
Key Investment Highlights Leading online insurance marketplace providing compelling benefits for consumers and insurance providers Revenue and Variable Marketing Margin growth of 29% and 36%, respectively 1 Re-occurring revenue with positive adjusted EBITDA profitability Insurance Marketplace $154bn in annual insurance distribution and advertising spend in the early phases of shifting online provides multi-year secular tailwind Massive Market Opportunity Proprietary platforms built on highly integrated machine learning & data assets support rapid growth, drive network effects and create competitive moat Proprietary Tech & Data 3rd Party Platform with 100+ carriers and 8,500+ local agents and 1st Party Platform with Direct-to-Consumer (DTC) Agency offerings Extensive Distribution Strong Financial Profile Based on the compound annual growth rate (CAGR) from 2015 - 2020

Slide 5

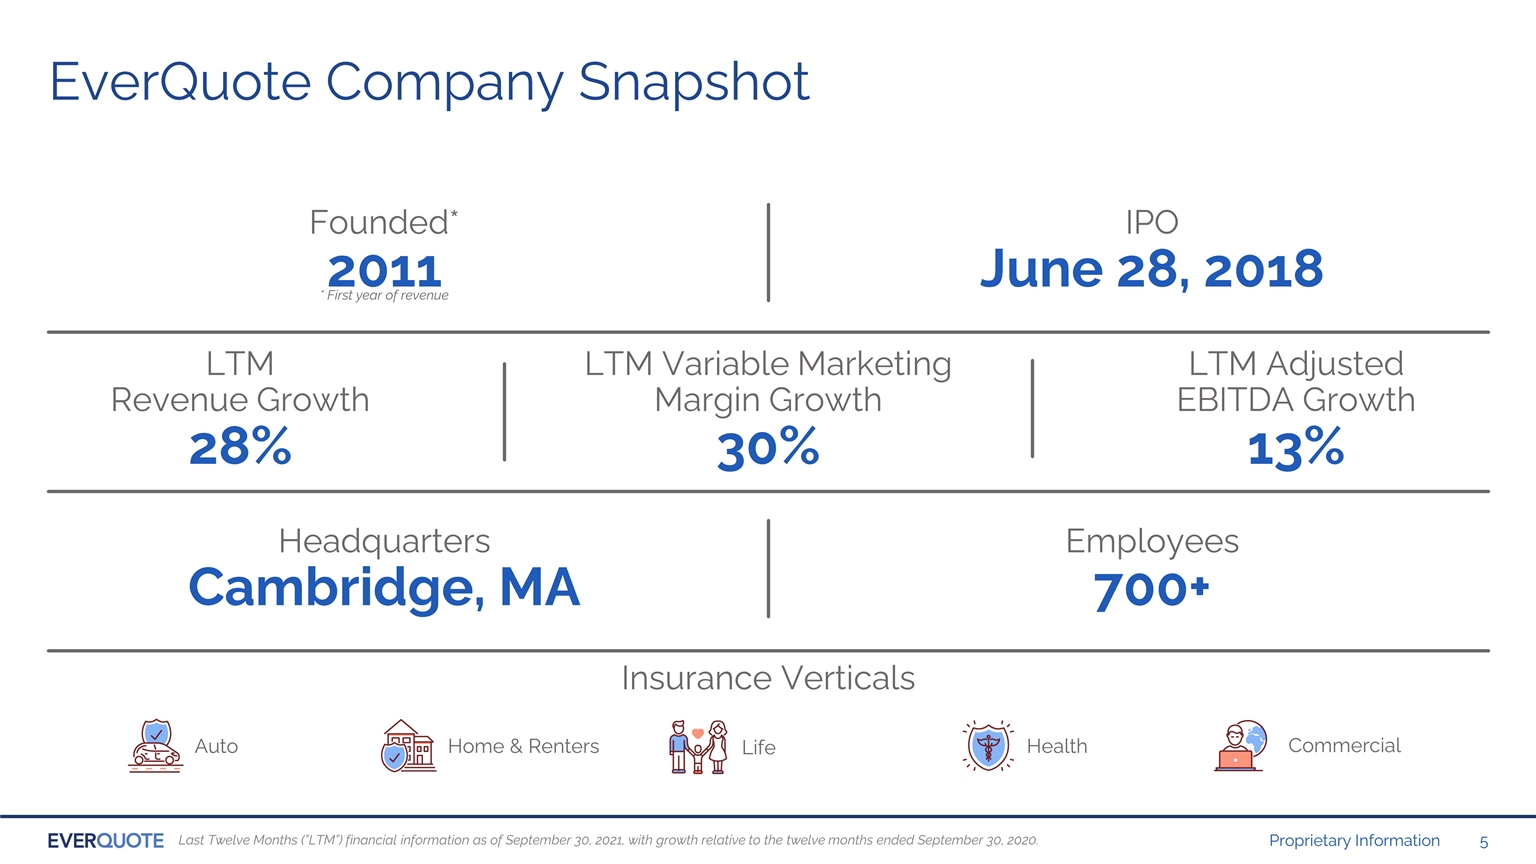
* First year of revenue Founded* 2011 IPO June 28, 2018 EverQuote Company Snapshot LTM Revenue Growth 28% LTM Adjusted EBITDA Growth 13% Employees 700+ LTM Variable Marketing Margin Growth 30% Headquarters Cambridge, MA Auto Home & Renters Life Health Commercial Insurance Verticals Last Twelve Months (”LTM”) financial information as of September 30, 2021, with growth relative to the twelve months ended September 30, 2020.

Slide 6

Large & Expanding TAM Total Digital Spending Growth: ~ 16% EVER Share: <10% Projected Annual Growth to 2024 Continued shift of consumer time spent online Continued shift of acquisition spend online Continued shift to digitization of insurance products & workflows Growth Drivers U.S. Insurance Market: Distribution & Ad Spend Total Market Growth: ~4% EVER Share: <1% Source: Stax Consulting, Inc., S&P Global Market Intelligence SNL Insurance Data, IIABA and Company estimates. EverQuote is not reaffirming this guidance as of the date of this presentation & makes no statement with respect to this guidance other than such guidance was provided by EverQuote as of November 1, 2021. $412.5mm1 EverQuote 2021 revenue guidance midpoint $154bn Total Market $16.7bn Total Advertising Spend $6.5bn Total Digital Spend

Slide 7

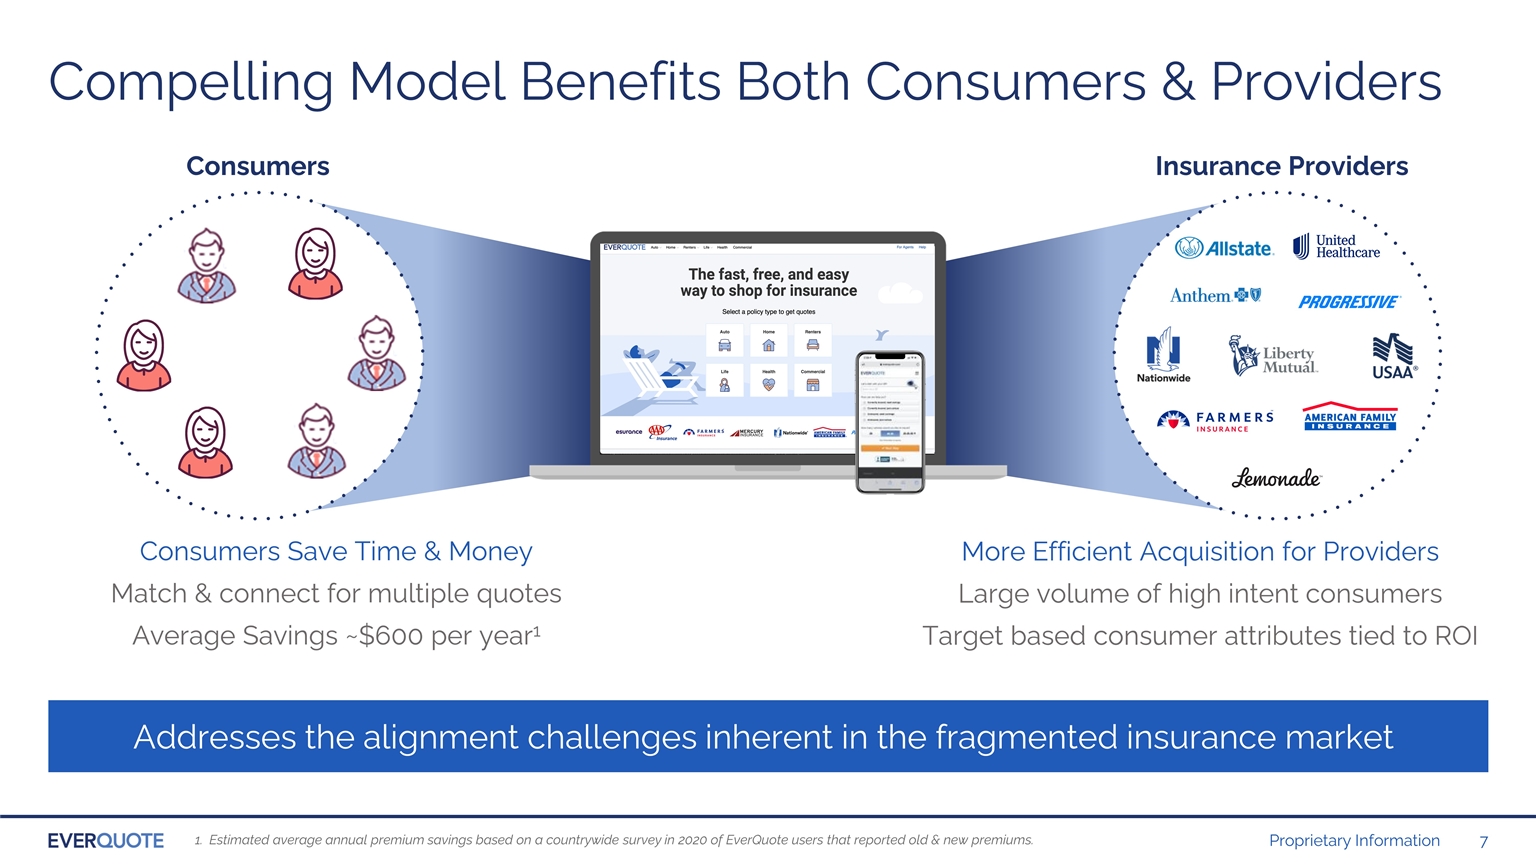
Compelling Model Benefits Both Consumers & Providers More Efficient Acquisition for Providers Large volume of high intent consumers Target based consumer attributes tied to ROI Consumers Save Time & Money Match & connect for multiple quotes Average Savings ~$600 per year1 Addresses the alignment challenges inherent in the fragmented insurance market Estimated average annual premium savings based on a countrywide survey in 2020 of EverQuote users that reported old & new premiums. Consumers Insurance Providers

Slide 8

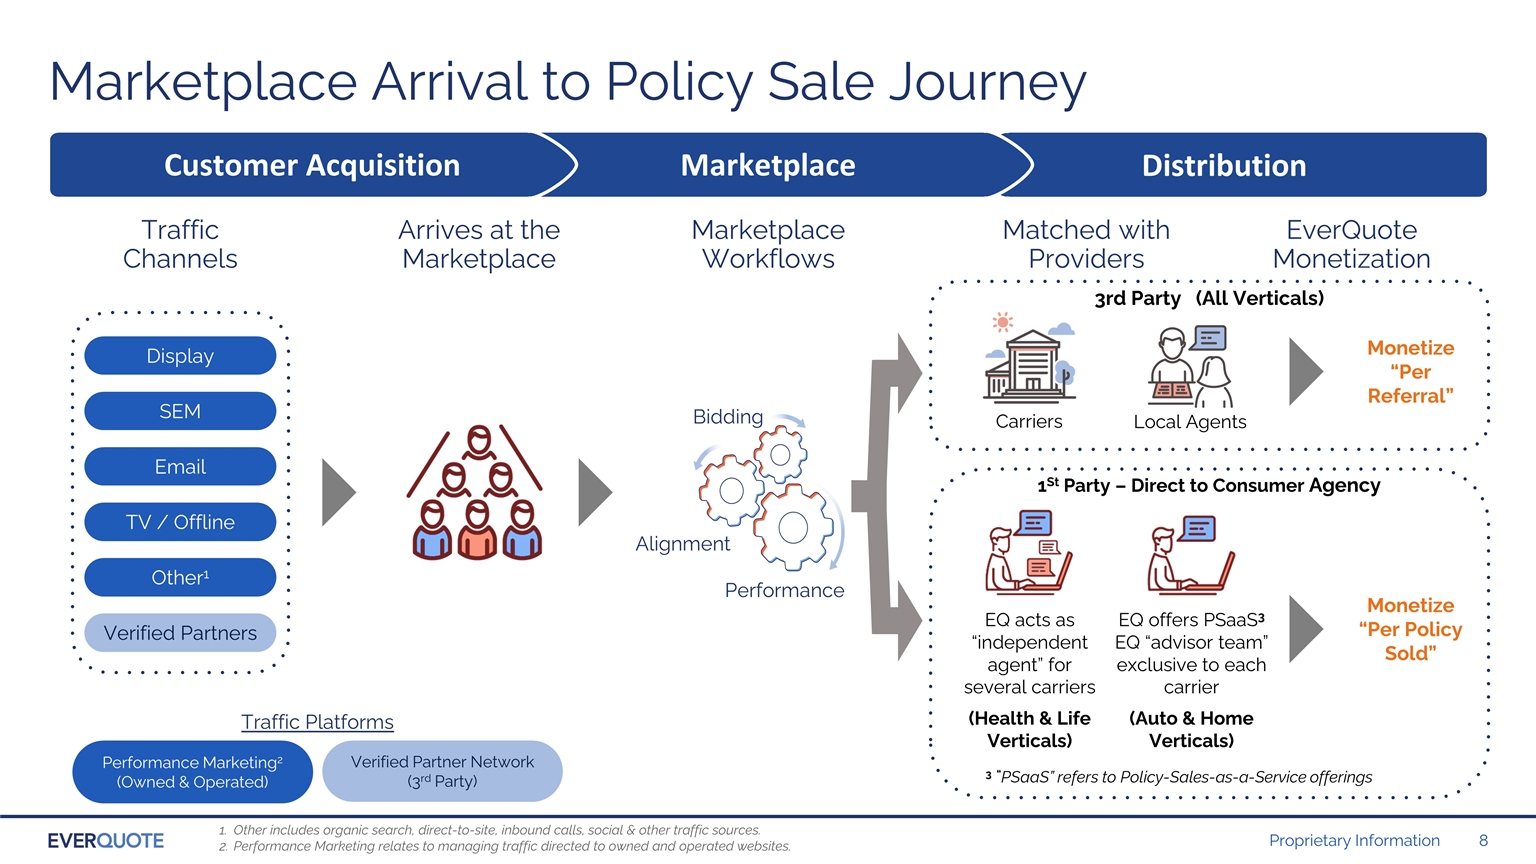
Marketplace Arrival to Policy Sale Journey Traffic Channels Matched with Providers Arrives at the Marketplace Marketplace Workflows Other includes organic search, direct-to-site, inbound calls, social & other traffic sources. Performance Marketing relates to managing traffic directed to owned and operated websites. Display Email TV / Offline SEM Other1 Verified Partners Carriers Local Agents 1St Party – Direct to Consumer Agency 3rd Party (All Verticals) Customer Acquisition Marketplace Distribution Performance Alignment Bidding Performance Marketing2 (Owned & Operated) Verified Partner Network (3rd Party) Traffic Platforms Monetize “Per Referral” EverQuote Monetization EQ acts as “independent agent” for several carriers (Health & Life Verticals) Monetize “Per Policy Sold” EQ offers PSaaS3 EQ “advisor team” exclusive to each carrier (Auto & Home Verticals) 3 “PSaaS” refers to Policy-Sales-as-a-Service offerings

Slide 9

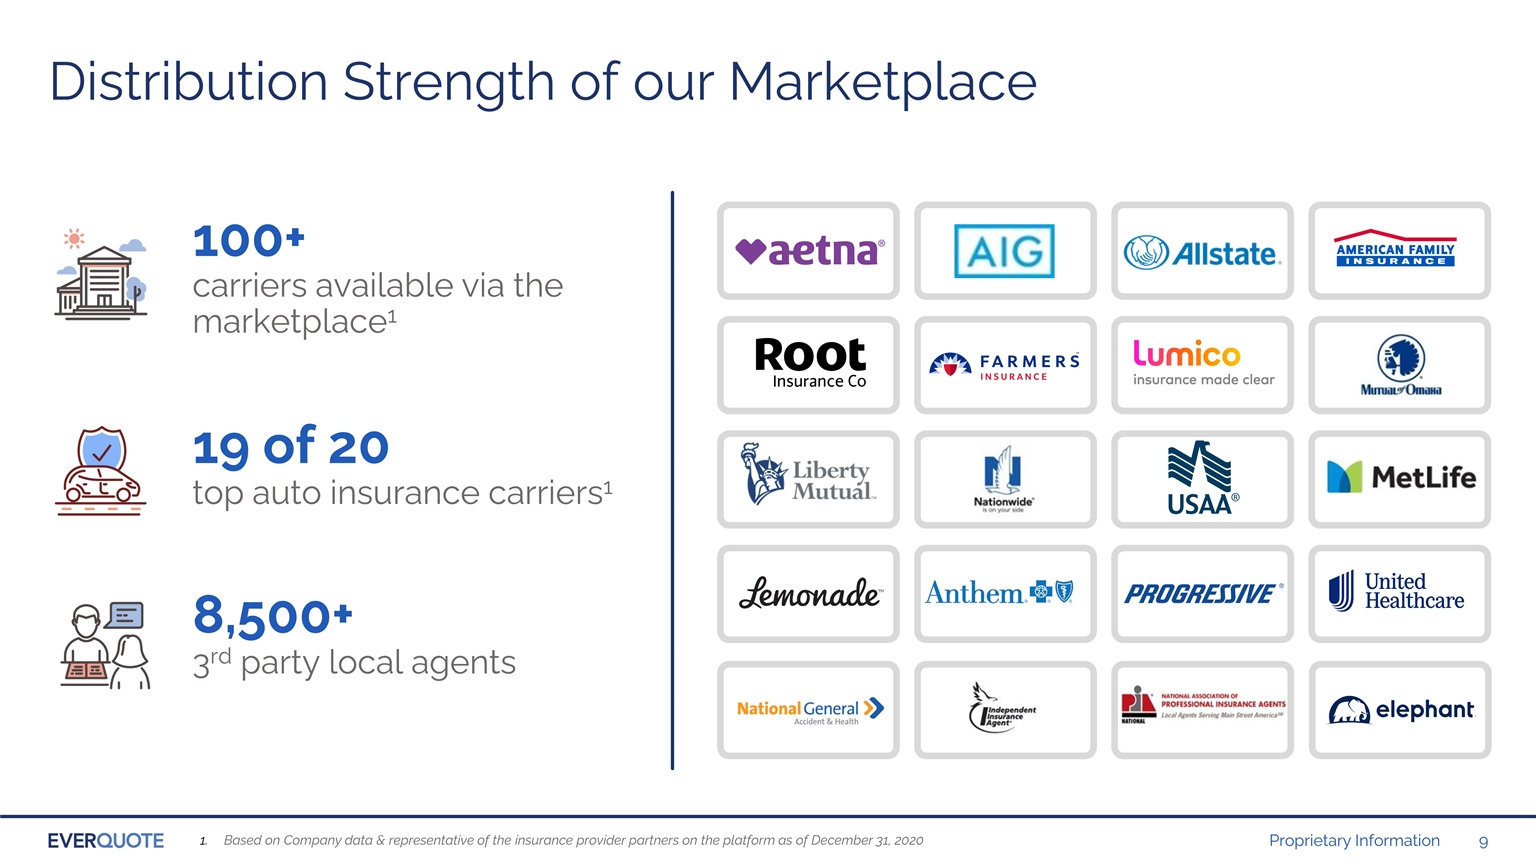
100+ carriers available via the marketplace1 19 of 20 top auto insurance carriers1 8,500+ 3rd party local agents Distribution Strength of our Marketplace Based on Company data & representative of the insurance provider partners on the platform as of December 31, 2020

Slide 10

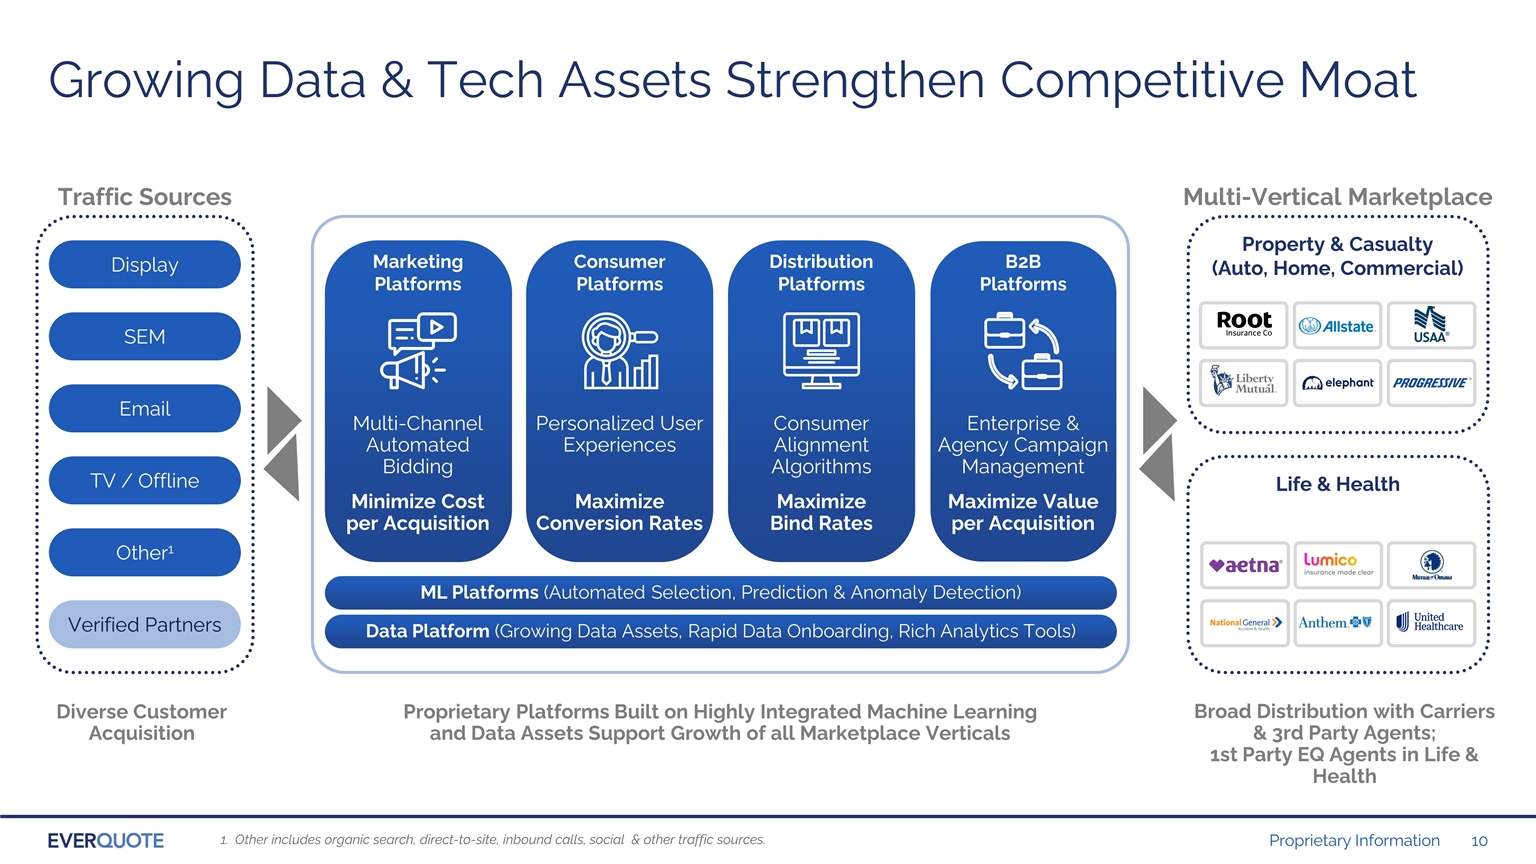
Multi-Vertical Marketplace Data Platform (Growing Data Assets, Rapid Data Onboarding, Rich Analytics Tools) Growing Data & Tech Assets Strengthen Competitive Moat Diverse Customer Acquisition Broad Distribution with Carriers & 3rd Party Agents; 1st Party EQ Agents in Life & Health Proprietary Platforms Built on Highly Integrated Machine Learning and Data Assets Support Growth of all Marketplace Verticals Property & Casualty (Auto, Home, Commercial) Multi-Channel Automated Bidding Minimize Cost per Acquisition Marketing Platforms Personalized User Experiences Maximize Conversion Rates Consumer Platforms Consumer Alignment Algorithms Maximize Bind Rates Distribution Platforms Enterprise & Agency Campaign Management Maximize Value per Acquisition B2B Platforms ML Platforms (Automated Selection, Prediction & Anomaly Detection) Life & Health Traffic Sources Other includes organic search, direct-to-site, inbound calls, social & other traffic sources. Display Email TV / Offline SEM Other1 Verified Partners

Slide 11

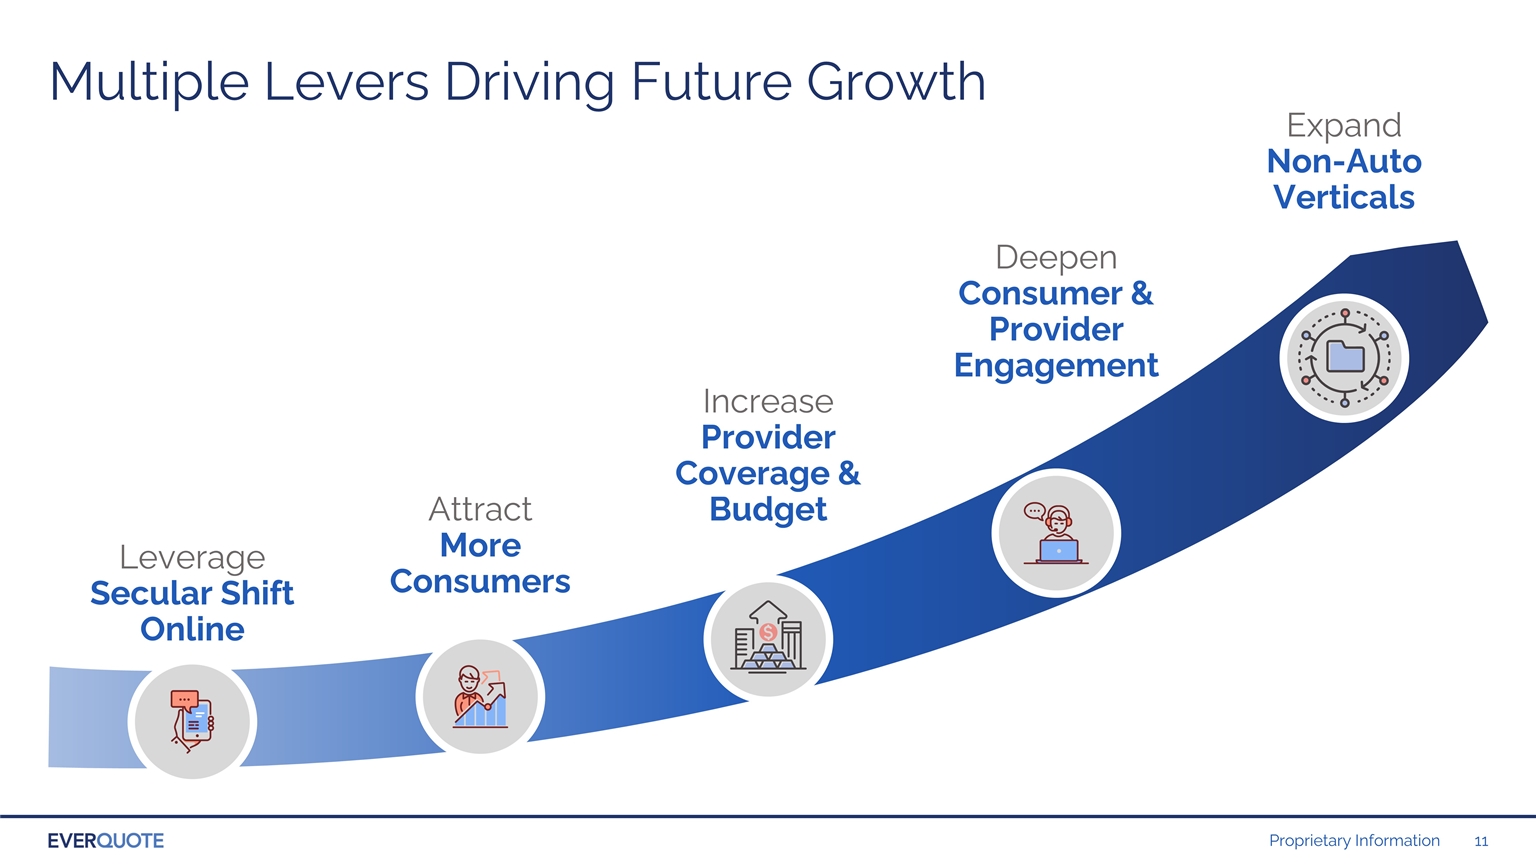
Multiple Levers Driving Future Growth Attract More Consumers Leverage Secular Shift Online Increase Provider Coverage & Budget Deepen Consumer & Provider Engagement Expand Non-Auto Verticals

Slide 12

Financial Overview


Slide 13

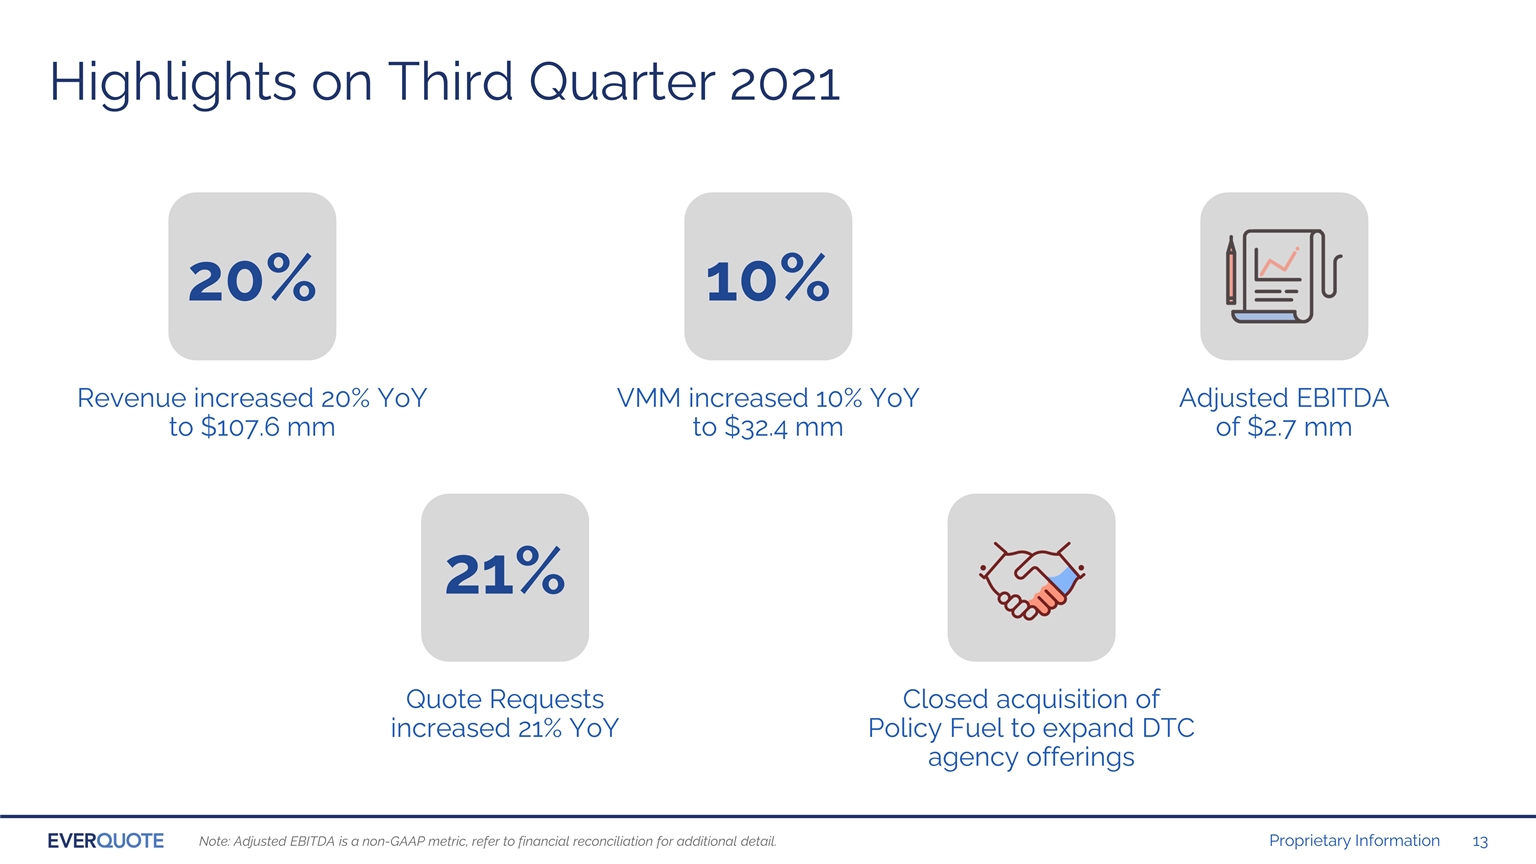
Note: Adjusted EBITDA is a non-GAAP metric, refer to financial reconciliation for additional detail. Highlights on Third Quarter 2021 Revenue increased 20% YoY to $107.6 mm 20% Adjusted EBITDA of $2.7 mm VMM increased 10% YoY to $32.4 mm 10% Closed acquisition of Policy Fuel to expand DTC agency offerings Quote Requests increased 21% YoY 21% Let'

Slide 14

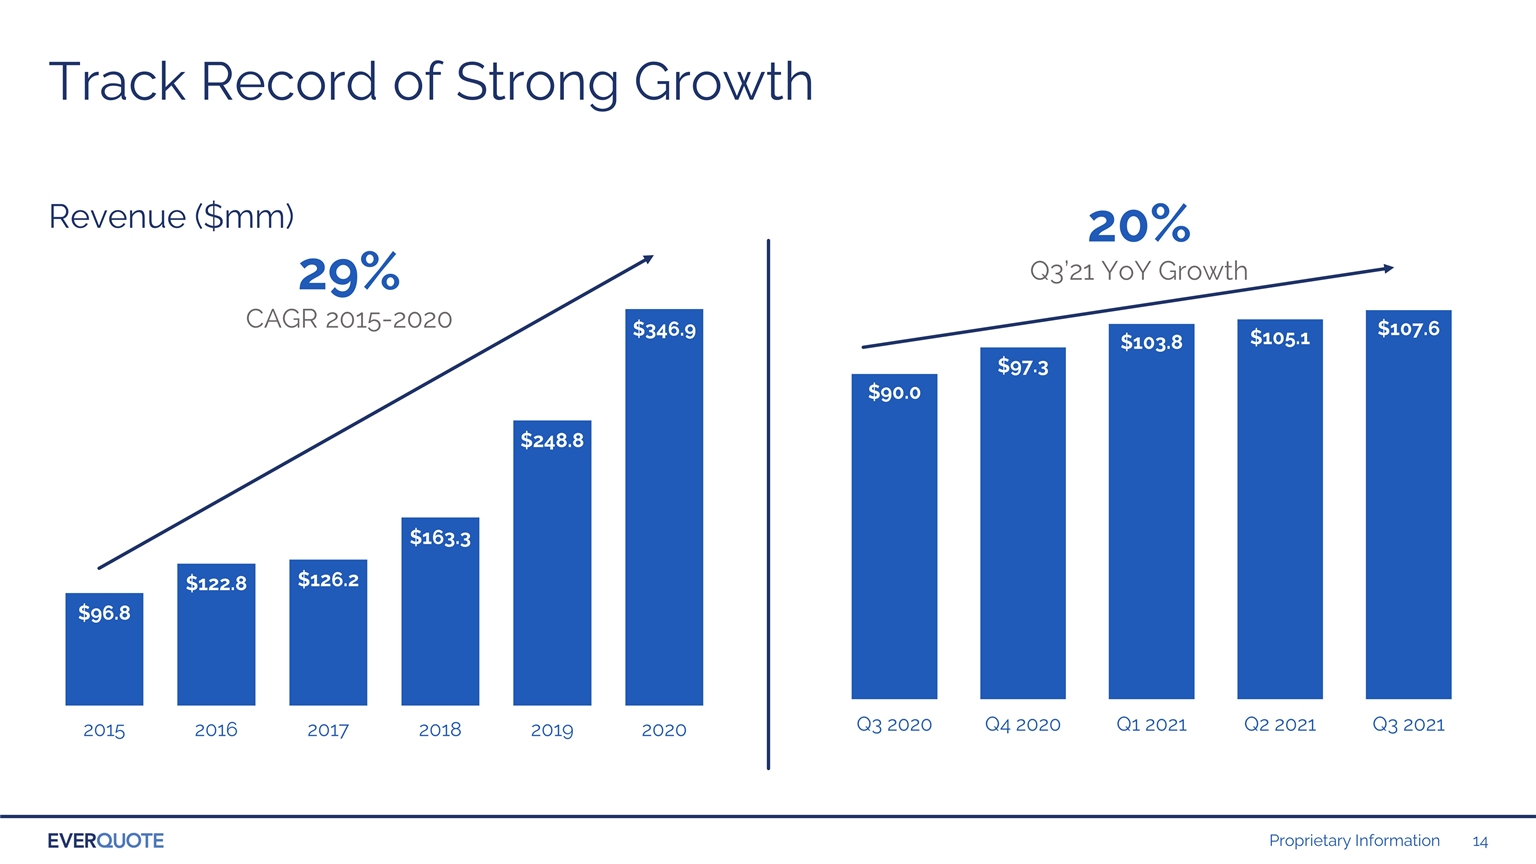
Revenue ($mm) 29% CAGR 2015-2020 Track Record of Strong Growth Track Record of Strong Growth 20% Q3’21 YoY Growth

Slide 15

Delivering Incremental Variable Marketing Margin 36% CAGR 2015-2020 Variable Marketing Margin ($mm) Beginning in the first quarter of 2019, we revised our definition of variable marketing margin, or VMM.  The VMM displayed above reflects our revised definition of VMM for all years presented. Refer to Key Metrics Definitions in the Appendix for a definition of VMM. 10% Q3’21 YoY Growth Variable Marketing Margin %

Slide 16

Non-auto verticals include our home & renters, life, heath & commercial insurance verticals. Continuing Expansion into New Verticals Revenue from Non-Auto Verticals ($mm) Traffic leverage: Target advertising opportunities leveraging expertise & technology Sales leverage: Ability to cross-sell traffic to existing customers 112% CAGR 2016-2020 Non-Auto Verticals Home & Renters Life Health Commercial 18% Q3’21 YoY Growth

Slide 17

NASDAQ: EVER


Slide 18

Appendix


Slide 19

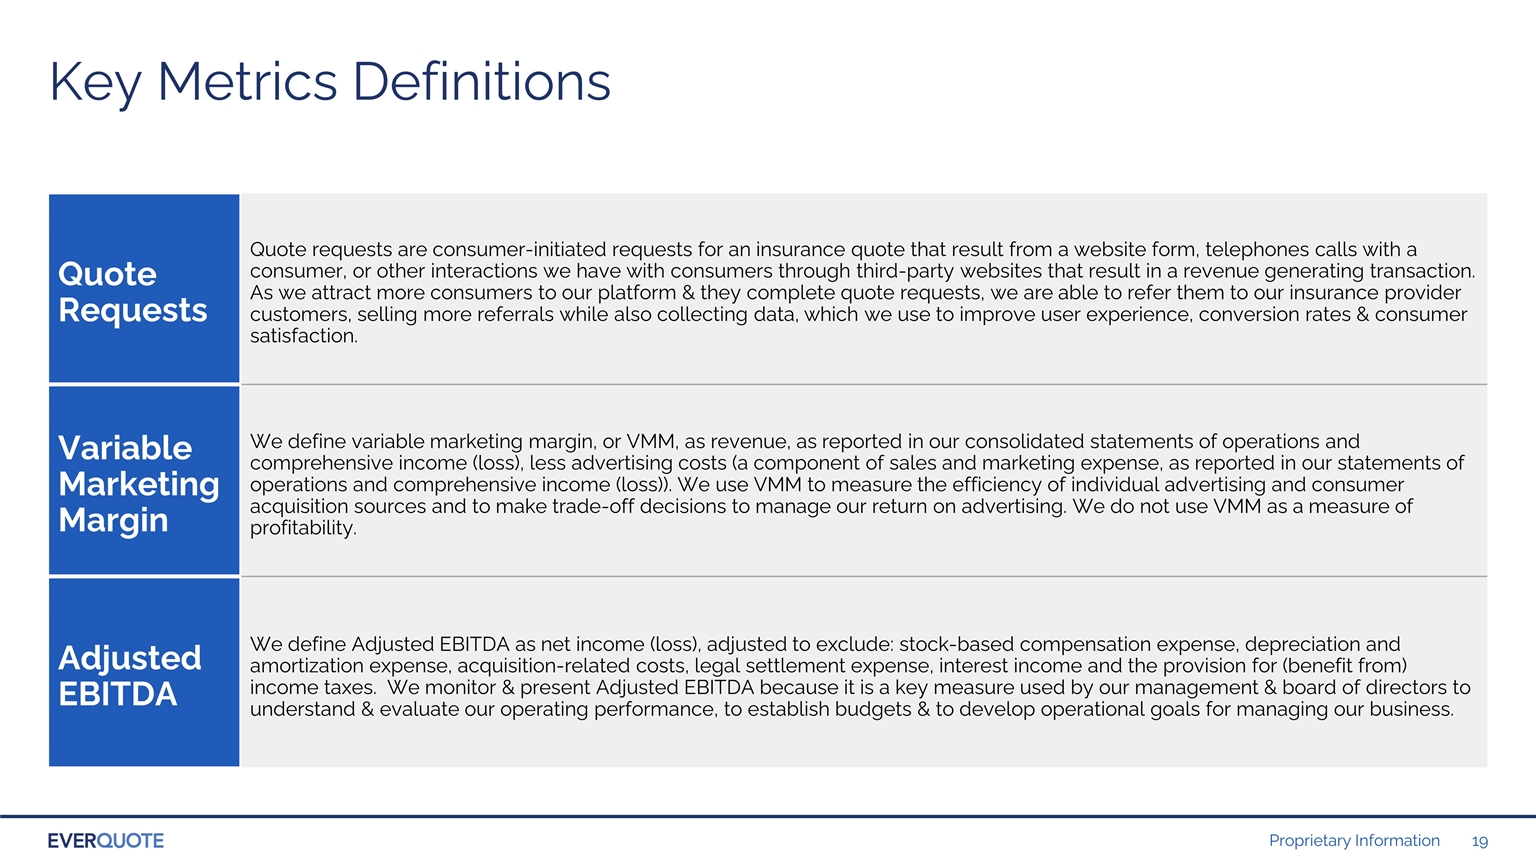
Key Metrics Definitions Quote Requests Quote requests are consumer-initiated requests for an insurance quote that result from a website form, telephones calls with a consumer, or other interactions we have with consumers through third-party websites that result in a revenue generating transaction. As we attract more consumers to our platform & they complete quote requests, we are able to refer them to our insurance provider customers, selling more referrals while also collecting data, which we use to improve user experience, conversion rates & consumer satisfaction. Variable Marketing Margin We define variable marketing margin, or VMM, as revenue, as reported in our consolidated statements of operations and comprehensive income (loss), less advertising costs (a component of sales and marketing expense, as reported in our statements of operations and comprehensive income (loss)). We use VMM to measure the efficiency of individual advertising and consumer acquisition sources and to make trade-off decisions to manage our return on advertising. We do not use VMM as a measure of profitability. Adjusted EBITDA We define Adjusted EBITDA as net income (loss), adjusted to exclude: stock-based compensation expense, depreciation and amortization expense, acquisition-related costs, legal settlement expense, interest income and the provision for (benefit from) income taxes. We monitor & present Adjusted EBITDA because it is a key measure used by our management & board of directors to understand & evaluate our operating performance, to establish budgets & to develop operational goals for managing our business.

Slide 20

Reconciliation of Adjusted EBITDA Three Months Ended 12 Months Ended September 30, 2021 June 30, 2021 March 31, 2021 December 31, 2020 September 30, 2020 December 31, 2020 September 30, 2020 December 31, 2019 December 31, 2018 Net income (loss) ($5,272) ($1,881) ($3,801) ($3,768) ($3,184) ($11,202) ($8,368) ($7,117) ($13,791) Stock-based compensation $8,348 $7,089 $7,520 $6,189 $7,200 $24,179 $21,454 $12,721 $7,121 Depreciation & amortization $1,298 $1,136 $1,174 $1,176 $731 $3,350 $2,767 $2,186 $1,341 Legal settlement - - - - - - $1,227 $1,227 - Acquisition-related costs/ earnout $819 $265 ($79) $1,778 $480 $2,258 $480 - - Interest (income) expense, net ($9) ($10) ($14) ($13) ($18) (189) ($309) ($669) ($121) Provision for income taxes ($2,510) - - - - - - - - Adjusted EBITDA $2,674 $6,599 $4,800 $5,362 $5,209 $18,396 $17,251 $8,348 ($5,450) ($ in Thousands)